Embed Size (px)
Citation preview

Republika e KosovësRepublika Kosova - Republic of Kosovo
Qeveria - Vlada - Government
MINISTRIA E TREGTISË DHE INDUSTRISËMINISTARSTVO ZA TRGOVINU I INDUSTRIJU
MINISTRY OF TRADE AND INDUSTRY
MINISTRY OF TRADE AND INDUSTRYwww.mti-ks.org
March 2014
SECTOR PROFILE OF METAL PROCESSING INDUSTRY


SECTOR PROFILE OF METAL PROCESSING
INDUSTRY
March 2014

4 | SECTOR PROFILE OF METAL PROCESSING INDUSTRY
Acknowledgements
This report is financed by the Ministry for Foreign affairs of Finland, in the framework of the “Aid for Trade” project, implemented by the United Nations Development Programme (UNDP).
Special contributions to writing this report have been provided by:
Ministry of Trade and Industry:The Cabinet of the MinisterDepartment of IndustryDepartment for European Integration and Policy Coordination Kosovo Investment and Enterprise Support Agency
Field work conducted by TNS Index Kosova, a social research, media and marketing agency
Quality Assurance:
United Nations Development Programme (UNDP) KosovoPolicy, Research, Gender and Communications UnitInclusive Growth Unit“Aid for Trade” ProjectPetrit Gashi, Phd – External Consultant
AuthorAgon Maliqi
Design: “XHAD Studio”, PristinaPrinting: “Grafika Rezniqi“ Pristina
A special gratitude goes also to all the respondents of the survey.
The views expressed in this report are those of the authors and do not represent the official position of the Ministry of Trade and Industry, United Nations Development Programme (UNDP) and the Ministry for Foreign Affairs of Finland.
Copyright © 2014. All rights reserved.

SECTOR PROFILE OF METAL PROCESSING INDUSTRY | 5
ContentsAcknowledgements .............................................................................................................................................. 2
List of abbreviations .............................................................................................................................................. 4
1. Introduction ............................................................................................................................5
2. Basic firm data .........................................................................................................................8Box 1: Profile of a successful business operating in Kosovo .................................................................12
3. Firm and industry input and output .............................................................................. 13
4. Markets ..................................................................................................................................... 18Box 2: Kosovo’s trade regimes in a nutshell ...............................................................................................23
5. Employment and Human capacities ............................................................................. 24Box 3: Kosovo’s labour market legislation in a nutshell..........................................................................28
6. Assets and investments ...................................................................................................... 29
7. Business Environment ........................................................................................................ 33Box 4: Taxes pertaining to the sector ............................................................................................................35
Box 5: Key institutions relevant to the sector............................................................................................35
Box 6: Licenses and permits directly related to the sector ...................................................................36
Box 7: Relevant legislation ...............................................................................................................................36
8. Conclusion .............................................................................................................................. 39

6 | SECTOR PROFILE OF METAL PROCESSING INDUSTRY
List of abbreviations
SME Small and Medium Enterprise
TAK Tax Administration of Kosovo
KBRA Kosovo Business Registration Agency
NACE Nomenclature des Activités Économiques dans la Communauté Européenne/ Statistical Classification of Economic Activities in the European Community
L.L.C Limited Liability Company
J.S.C Joint-Stock Company

SECTOR PROFILE OF METAL PROCESSING INDUSTRY | 7
1. Introduction
The purpose of this sector profile is to provide an overview of the key features of the metal processing sector in Kosovo. By using both official data sources (where available) as well as data generated from a specially designed survey, this sector pro-file provides information on: a) the basic characteristics of the firms operating in the sector; b) the structure of inputs and outputs; c) firm and sector turnover, markets and types of buyers; d) firm and sector assets, technology and investments; e) human resource capacities and; f ) firm perceptions on the business environment. The infor-mation on these themes is presented in separate chapters.
The survey for this sector profile was conducted with a representative sample of 144 active metal processing firms. The sample frame was established by using data on firm characteristics (i.e type of economic activity and number of workers) from the Tax Administration of Kosovo (TAK)*1. By narrowing down the metal processing sector as consisted of an estimated 216 active companies, the results from this sample of 144 companies - using randomized sampling for micro firms and targeted sampling for larger firms - have a 95% confidence level and a 5% confidence interval. Due to the fact that for some questions the response rate was low (especially some questions that firms perceived as being more sensitive), this sector profile does not present all the information that might be relevant and important for the sector, but only the in-formation that is deemed more reliable.
Official data and survey findings suggest that the metal processing sector is char-acterized by a small group of large firms (traditional industries developed when Koso-vo was part of the former Yugoslavia, most of which now privatized) which capture the largest share of output, exports and employment (3/4th of the latter). These are either firms which use Kosovo’s rich metal ore resources (e.g. nickel) to produce base metals that are usually exported, or producers of end-use products (steel tubes, steel pipes, heating radiators, galvanized steel products, etc.) Kosovo also has a vibrant segment of micro and small firms which developed largely in response to the post-1999 construction boom and which, as the survey suggests, are striving to upgrade and expand regardless of several (mostly inner-firm) barriers.
1 *Methodological note: The metal processing sector was defined as consisting of companies (with exceptions) which listed the following two activities (using two digit European Industry Activity Classification NACE Rev.1 codes) as their main activity: 27 - Manufacture of Base Metals and; 28 – Manufacture of Fabricated Metal Products. The sample frame also includes firms which listed activities 1310 (Mining of iron ores) and 1320 (Mining of non-ferrous metal ores) as their main activity and had manufacturing as secondary. In addition, due to: a) the vast number of firms; b) overpopulation by self-employed workers engaged in low-level repair works or non-metal processing related activities (ex. car mechanic) ; c) low value of activities within total sector - all micro companies (<9 workers) listing the following activities as their main ones were removed: 2811 (Manufacture of metal structures and parts); 2812 (Manufacture of builders’ carpentry of metal) and 2852 (General mechani-cal engineering). This led to a sample frame of 216 companies.

8 | SECTOR PROFILE OF METAL PROCESSING INDUSTRY
Metal processing firms are almost all privately owned and they are dispersed throughout Kosovo, with the largest number of them located in and around the Prishtinë/Priština region. These firms employ about 1.5% of the total employed popu-lation in Kosovo. Sector firms are dominantly owned by men, as only 5% of the work-force is women and only 7% of firms have women shareholders. In 2012, the sector’s exported goods (base metals and metal products, excluding scrap) captured 36.5% of the total value of all exports from Kosovo.
On average, metal processing firms reported to have operated at 63% of their production capacity in 2012. The range of goods that they manufacture is wide. The largest number of registered firms – predominantly micro and small ones - are pri-marily involved with the manufacturing of metal constructs and products used in the construction industry. The other most frequent primary activity is the production of metal components through processing activities such as powder metallurgy and the treatment and coating of metals, as well as the manufacturing of precious metal products, wires and aluminum. Nonetheless, in terms of the market value of output produced, by far the most important activity is the processing of ferronickel, followed by end-use iron and steel products.
Based on a mixture of survey data and secondary sources, the turnover of the metal processing sector in Kosovo in 2012 is estimated to have been ≈ €114 million. Nevertheless, taking into account the fact that 2012 was an extraordinarily bad year for ferronickel exports and that survey responses on turnover suffer from a substan-tial degree of underreporting, there are strong reasons to believe that in a good year for nickel exports, the value of the sector’s turnover could be closer to the €200 mil-lion figure.
Seventeen percent of all metal processing firms are currently engaged in some degree of exporting. Nonetheless, only the medium and large firms are primarily ex-port oriented and sell most of their goods abroad. The structure of metal exports is overwhelmingly dominated by ferronickel, which captured 90.8% of the total value of metal exports between the years of 2010-2012. The largest remaining share of ex-ports (6.6%) is captured by iron and steel products – mostly line pipes, tubes and hollow profiles. Micro and small metal processing firms sell almost all of their goods in the domestic market – about 90% of their output value is sold domestically.
The survey finds that many metal processing firms – especially small-sized ones - are looking for ways to expand their operations and become exporters. Most of them see inner-firm factors as the biggest obstacle and many are taking steps to enhance their competitiveness. To this end, 19.7% of all firms, and 28.6% of small firms, report-ed to have made capital investments in 2012. Almost all of them say that they had invested to upgrade the technology of their production process by purchasing ma-chinery or tools. The average value of small-firm’s investment in 2012 was €72,500. As a result, the total value of the technology possessed by the total population of sector SMEs witnessed a 10% year-on-year increase.
SECTOR PROFILE OF METAL PROCESSING INDUSTRY | 9
Nonetheless, despite firms’ efforts to expand and increase their competitiveness, the survey finds that many challenges lie ahead. Further investments in technology are being impeded by the high cost of finance, which metal processing firms consider as being either very high (24.6%) or high (21.4%). As of October 2013, the effective interest rate on investment loans up to five years stood at 10.2%. Nevertheless, a cer-tain degree of leeway and stimulus towards investments is currently being created by a set of government incentive schemes – such as the removal of customs duties and tax deductions for capital investments.
Technology aside, another important challenge is presented by workforce skills. 46% of the sector’s small firms think that there is a shortage of qualified workers in the labour market. The types of qualified professionals that are most frequently men-tioned as being difficult to find in the labour market are plant operators – namely furnace operators, melters, heat treating operators and drawers – followed by sheet metal workers, machine tool operators, metal wheel grinders, etc. 20.1% of all sector firms (including most of the larger ones) report that they do provide on-the-job train-ings for their workers.
Asked to rate the barriers of their business environment on a scale, metal pro-cessing firms also highlighted the burdensome effects of corruption and competition from the informal economy. But the barrier which received the highest average score on the scale was the low purchasing power in the domestic market. Having in mind that metal imports have been steadily increasing over the years and that economic growth has been positive, this concern expressed by firms might be a sign that the domestic market is saturated for the current structure of output, with too many firms selling the same goods and services, and that firm growth is not possible without diversification of products / services tailored towards the domestic market and/or expansion towards foreign markets. This makes the current drive towards firm inno-vation, enhanced competitiveness and export-orientation a matter of even greater urgency.
10 | SECTOR PROFILE OF METAL PROCESSING INDUSTRY
2. Basic firm data
As of November 2013, there were an estimated 216 metal processing firms operat-ing in Kosovo. The number has been estimated based on data from the Tax Administra-tion of Kosovo (TAK) and on the basis of the economic activities which companies have listed as being their primary one (see methodological note in the Introduction section of this report for further elaboration on the methodology). The database of the Kosovo Business Registration Agency (KBRA) has many more companies listed as engaged in metal processing activities, but it is generally assumed that, due to large number of inactive firms, the TAK database comes closer to representing the true level of activity.
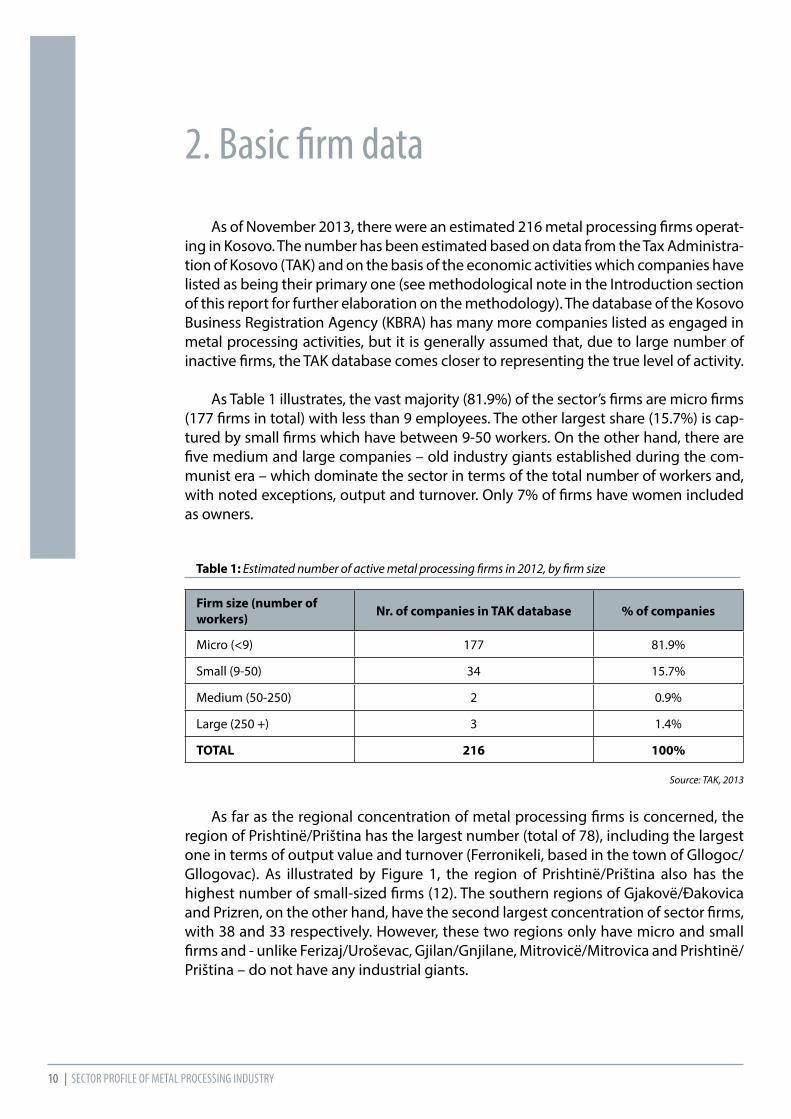
As Table 1 illustrates, the vast majority (81.9%) of the sector’s firms are micro firms (177 firms in total) with less than 9 employees. The other largest share (15.7%) is cap-tured by small firms which have between 9-50 workers. On the other hand, there are five medium and large companies – old industry giants established during the com-munist era – which dominate the sector in terms of the total number of workers and, with noted exceptions, output and turnover. Only 7% of firms have women included as owners.
Table 1: Estimated number of active metal processing firms in 2012, by firm size
Firm size (number of workers) Nr. of companies in TAK database % of companies
Micro (<9) 177 81.9%
Small (9-50) 34 15.7%
Medium (50-250) 2 0.9%
Large (250 +) 3 1.4%
TOTAL 216 100%
Source: TAK, 2013
As far as the regional concentration of metal processing firms is concerned, the region of Prishtinë/Priština has the largest number (total of 78), including the largest one in terms of output value and turnover (Ferronikeli, based in the town of Gllogoc/Gllogovac). As illustrated by Figure 1, the region of Prishtinë/Priština also has the highest number of small-sized firms (12). The southern regions of Gjakovë/Đakovica and Prizren, on the other hand, have the second largest concentration of sector firms, with 38 and 33 respectively. However, these two regions only have micro and small firms and - unlike Ferizaj/Uroševac, Gjilan/Gnjilane, Mitrovicë/Mitrovica and Prishtinë/ Priština – do not have any industrial giants.

SECTOR PROFILE OF METAL PROCESSING INDUSTRY | 11
Figure 1: Total number of sector firms, by region and size
Source: TAK, 2013
Sector companies may be grouped in a couple of main processing categories, based on NACE Rev. 1 classifications of activities. As illustrated by Figure 2, the largest number of companies (33) list an undefined category – namely, the production of “other metal products” – as most representative of their main line of work. These firms are most likely involved in the production of metal constructs used by the construc-tion industry. The second largest group of companies (32) are primarily involved in powder metallurgy – namely, in the forging, pressing stamping and roll forming of metals (i.e heating metal powders close to their melting point) to produce various metal parts and components which are in turn used by other manufacturing indus-tries, such as the automotive industry, or in the production of household appliances, tools and equipment, etc.
The third largest group (26) is involved with the coating and treatment of metals, whereas the remaining largest groups of companies are involved with the manufac-ture of precious metals (17), wire products (16) and aluminum (16). As illustrated by the chart (Figure 2), micro firms represent the highest share within these activity groups. As such, these top ranking groups do not represent the true weight of sector activities in terms of value of output and turnover. As illustrated by the following Ta-ble 2, the main processing activities of the five largest firms are different from the top list of activities in the SME sector.
Table 2: Main and secondary activities of the five largest firms
Newco Ferronikeli 1320: Mining of non-ferrous metal ores; Secondary: Processing nickel ores.
Trepça/ Trepča 1320: Mining of non-ferrous metal ores; Secondary: Processing zinc, tin & lead ores.
NewCo Llamkos – Galvasteel
2710: Manufacture of basic iron & steel & of ferro-alloys;Secondary: Flat and finished steel products.
NewCo IMK Pipe Factory 2811: Manufacture of metal parts and structures;
NewCo Jugoterm 2822: Manufacture of central heating radiators and boilers;
Source: KBRA, 2013
0 10 20 30
55
33 30 24 18 9 8
12
5 3 4
4 4 2
0
1
1 0 0
1
0 0
02
0
20
40
60
80
5
16
17
25
29
31
16
16
17
26
32
33
2873
2742
2741
2851
2840
2875
18.75%
29.90%
31.20%
20.10%
0.00% 5.00% 10.00% 15.00% 20.00% 25.00% 30.00% 35.00%
fig.21
fig.15
fig.16
fig.2
fig.3
fig.4
fig.5
fig.6
fig.7
fig.8
fig.9
fig.10
fig.10
9.5%
17.1%
19.7%
20.3%
33.3%
0.0% 10.0% 20.0% 30.0% 40.0%
8%
9%
9%
12%
26%
35%
0% 10% 20% 30% 40%
2731
2875
2745
2811
2722
0
59%
64%
75%
60%
62%
62%
80%
87%
0% 20% 40% 60% 80% 100%
2012
2011
6%
41%
100%
100%
35%
31%
65%
95%
0% 20% 40% 60% 80% 100%
330 392
433
295 319 276
148 145 101 0
100
200
300
400
500
2010 2011 2012
32.1%
47.4%
22.6%
31.5%
0.0% 5.0% 10.0% 15.0% 20.0% 25.0% 30.0% 35.0% 40.0% 45.0% 50.0%
302,844
4,494
0
50,000
100,000
150,000
200,000
250,000
300,000
350,000
13.8%
13.8%
10.7%
61.6%
95%
79%
5%
21%
0% 20% 40% 60% 80% 100%
26%
57%
17%
14%
72%
14%
0% 10% 20% 30% 40% 50% 60% 70% 80%
24%
41%
65%
46%
39%
86%
0% 20% 40% 60% 80% 100%
59.1%
57.3%
97.3%
79.2%
75.0%
100.0%
0.0% 20.0% 40.0% 60.0% 80.0% 100.0% 120.0%
17.1%
28.6%
50.0%
0.0% 20.0% 40.0% 60.0%
6.3
6.5
6.8
7.4
7.5
7.7
8.4
8.7
8.8
8.9
9.2
9.3
9.4
9.7
9.9
10.9
11
0 2 4 6 8 10 12
21%
29%
17%
21%
0% 5% 10% 15% 20% 25% 30% 35%
3.6%
2.9%
40.6%
38.4%
14.5%
0.0% 10.0% 20.0% 30.0% 40.0% 50.0%
3.0%
15.2%
53.8%
24.2%
3.3%
4.9%
17.6%
45.1%
26.5%
5.9%
149 145
100 89
141 136
85 76
7 8 10 10 0
100
200
2010 2011 2012
Large
Medium
Small
Micro
Prishtinë Gjakovë Prizren Ferizaj Gjilan Pejë MitrovicëPriština Đakovica Prizren Uroševac Gnjilane Peć Mitrovica

12 | SECTOR PROFILE OF METAL PROCESSING INDUSTRY
Figure 2: Most frequent main activity for sector firms (NACE Rev.1 codes)
2875: Other metal products; 2840: Powder metallurgy; 2851: Treatment & coating of metals; 2741: Preciousmetals products; 2873: Wire products; 2742: Aluminum;
Source: TAK, 2013
Table 3 illustrates that the vast majority of sector companies (89.6%) are regis-tered as individual businesses, whereas the second largest share (6.3%) have the legal status of Limited Liability Companies (6.3%). This ownership structure is a reflection of the fact that most sector companies are micro companies (81.9%). The relationship between firm size and ownership is confirmed by the fact, among small-sized firms, the share of individual businesses is lower (75%), and the share of L.L.C.s is higher (17.8%) than in the total population of firms. Only two of the surveyed companies were public enterprises, and an additional two were registered as foreign companies. Figure 3 shows that the largest share of companies are owned by entrepreneurs aged between 45-55 (31.2% of firms) and 35-45 (29.9%).
Table 3: Sector companies by type of legal status
Type of company % of all sector firms % of small firms
Individual business 89.6 % 75 %
General partnership 0.7 % 3.5 %
Limited Liability Company (L.L.C) 6.3 % 17.85%
Joint-Stock Company (J.S.C) 0.7 % -
Foreign Company 1.4% 3.5 %
Public Enterprise 1.4% -
Source: UNDP Survey, 2013
0 10 20 30
55
33 30 24 18 9 8
12
5 3 4
4 4 2
0
1
1 0 0
1
0 0
02
0
20
40
60
80
5
16
17
25
29
31
16
16
17
26
32
33
2873
2742
2741
2851
2840
2875
18.75%
29.90%
31.20%
20.10%
0.00% 5.00% 10.00% 15.00% 20.00% 25.00% 30.00% 35.00%
fig.21
fig.15
fig.16
fig.2
fig.3
fig.4
fig.5
fig.6
fig.7
fig.8
fig.9
fig.10
fig.10
9.5%
17.1%
19.7%
20.3%
33.3%
0.0% 10.0% 20.0% 30.0% 40.0%
8%
9%
9%
12%
26%
35%
0% 10% 20% 30% 40%
2731
2875
2745
2811
2722
0
59%
64%
75%
60%
62%
62%
80%
87%
0% 20% 40% 60% 80% 100%
2012
2011
6%
41%
100%
100%
35%
31%
65%
95%
0% 20% 40% 60% 80% 100%
330 392
433
295 319 276
148 145 101 0
100
200
300
400
500
2010 2011 2012
32.1%
47.4%
22.6%
31.5%
0.0% 5.0% 10.0% 15.0% 20.0% 25.0% 30.0% 35.0% 40.0% 45.0% 50.0%
302,844
4,494
0
50,000
100,000
150,000
200,000
250,000
300,000
350,000
13.8%
13.8%
10.7%
61.6%
95%
79%
5%
21%
0% 20% 40% 60% 80% 100%
26%
57%
17%
14%
72%
14%
0% 10% 20% 30% 40% 50% 60% 70% 80%
24%
41%
65%
46%
39%
86%
0% 20% 40% 60% 80% 100%
59.1%
57.3%
97.3%
79.2%
75.0%
100.0%
0.0% 20.0% 40.0% 60.0% 80.0% 100.0% 120.0%
17.1%
28.6%
50.0%
0.0% 20.0% 40.0% 60.0%
6.3
6.5
6.8
7.4
7.5
7.7
8.4
8.7
8.8
8.9
9.2
9.3
9.4
9.7
9.9
10.9
11
0 2 4 6 8 10 12
21%
29%
17%
21%
0% 5% 10% 15% 20% 25% 30% 35%
3.6%
2.9%
40.6%
38.4%
14.5%
0.0% 10.0% 20.0% 30.0% 40.0% 50.0%
3.0%
15.2%
53.8%
24.2%
3.3%
4.9%
17.6%
45.1%
26.5%
5.9%
149 145
100 89
141 136
85 76
7 8 10 10 0
100
200
2010 2011 2012
Total
Micro firms

SECTOR PROFILE OF METAL PROCESSING INDUSTRY | 13
Figure 3: Sector firm ownership by age groups
Source: UNDP Survey, 2013
0 10 20 30
55
33 30 24 18 9 8
12
5 3 4
4 4 2
0
1
1 0 0
1
0 0
02
0
20
40
60
80
5
16
17
25
29
31
16
16
17
26
32
33
2873
2742
2741
2851
2840
2875
18.75%
29.90%
31.20%
20.10%
0.00% 5.00% 10.00% 15.00% 20.00% 25.00% 30.00% 35.00%
fig.21
fig.15
fig.16
fig.2
fig.3
fig.4
fig.5
fig.6
fig.7
fig.8
fig.9
fig.10
fig.10
9.5%
17.1%
19.7%
20.3%
33.3%
0.0% 10.0% 20.0% 30.0% 40.0%
8%
9%
9%
12%
26%
35%
0% 10% 20% 30% 40%
2731
2875
2745
2811
2722
0
59%
64%
75%
60%
62%
62%
80%
87%
0% 20% 40% 60% 80% 100%
2012
2011
6%
41%
100%
100%
35%
31%
65%
95%
0% 20% 40% 60% 80% 100%
330 392
433
295 319 276
148 145 101 0
100
200
300
400
500
2010 2011 2012
32.1%
47.4%
22.6%
31.5%
0.0% 5.0% 10.0% 15.0% 20.0% 25.0% 30.0% 35.0% 40.0% 45.0% 50.0%
302,844
4,494
0
50,000
100,000
150,000
200,000
250,000
300,000
350,000
13.8%
13.8%
10.7%
61.6%
95%
79%
5%
21%
0% 20% 40% 60% 80% 100%
26%
57%
17%
14%
72%
14%
0% 10% 20% 30% 40% 50% 60% 70% 80%
24%
41%
65%
46%
39%
86%
0% 20% 40% 60% 80% 100%
59.1%
57.3%
97.3%
79.2%
75.0%
100.0%
0.0% 20.0% 40.0% 60.0% 80.0% 100.0% 120.0%
17.1%
28.6%
50.0%
0.0% 20.0% 40.0% 60.0%
6.3
6.5
6.8
7.4
7.5
7.7
8.4
8.7
8.8
8.9
9.2
9.3
9.4
9.7
9.9
10.9
11
0 2 4 6 8 10 12
21%
29%
17%
21%
0% 5% 10% 15% 20% 25% 30% 35%
3.6%
2.9%
40.6%
38.4%
14.5%
0.0% 10.0% 20.0% 30.0% 40.0% 50.0%
3.0%
15.2%
53.8%
24.2%
3.3%
4.9%
17.6%
45.1%
26.5%
5.9%
149 145
100 89
141 136
85 76
7 8 10 10 0
100
200
2010 2011 2012
>55 years
45-55 years
35-45 years
24-35years

14 | SECTOR PROFILE OF METAL PROCESSING INDUSTRY
Box 1: Profile of a successful business operating in Kosovo
Based in the city of Ferizaj/Uroševac, Elsam is a manufacturer of a diverse range of metal constructions, heat exchangers and storage tanks - one of the main suppliers of such products in the domestic market. Although there are other larger, more successful, metal processing companies that are already exporting their goods and could be considered as better success stories, the story of Elsam is important because it is representative of a group of relative-ly sizable and experienced metal manufacturers that could potentially join the pool of exporters in the future. Established in 1984 as a socially owned enterprise and privatized in 2006, Elsam currently has the status of an L.L.C and is owned by local entrepreneurs. It employs around 45 workers and has a sizable facility.
Elsam’s products and/or services tailor to a wide range of buyers and types of construction projects: from public infrastructure projects to private resi-dential or industrial facilities. Elsam produces tailor-made end-use products, such as steel based skeleton constructions (bars, beams and columns) or heat exchangers most commonly used in thermal plants, chemical industry res-idential buildings. Its other area of expertise is the construction of a diverse range of storage tanks, used by residential or industrial facilities to store fuels or other liquids.
Elsam currently sells all of its goods in the domestic market, where public in-frastructure investments and real-estate projects are keeping demand for its products relatively high. But just like several other firms of its size, drawing on the strength of its qualified workforce (well-educated lead engineers) and its extensive project management experience, Elsam has the potential, the inter-est – and quite possibly in the future, the commercial need – to diversify sales and expand into export markets. This potential expansion would however be dependent on several firm-level quality and cost competitiveness factors that the survey found were most problematic for ambitious small firms like Elsam that are attempting to scale-up. One particular challenge is the high cost of financing investments in new machinery and the limited pool of quali-fied workers to operate sophisticated plants. The business-to-business nature of its sales also highlights the critical role of networking in obtaining export market information and gaining access to potential clients.

SECTOR PROFILE OF METAL PROCESSING INDUSTRY | 15
3. Firm and industry input and outputThe survey that was conducted for the purposes of this sector profile asked firms
about the structure of their inputs – namely, the amount of money that they spend per month on raw materials and intermediary goods, wages, oil, electricity, water, etc. The monthly monetary values were in turn calculated to get the average yearly costs per type of input, the average and total yearly cost for all inputs, as well as the share of the value that each input type captures within the sector as a whole. The respective shares are presented in Table 4.
It must be noted that the firms’ response rate on questions related to input costs was satisfactory, with the exception of the three large firms which did not provide any information on their input costs. This is the reason why the data on inputs and out-puts are limited only to the SME section of the sector. In total, 69% of surveyed SMEs (98 out of 141) responded to questions on the monthly cost of raw materials and intermediaries. The response rate for other input costs was much higher - electricity (97%), labour (90%), oil (90%) and water (87%).
As illustrated in Table 4, raw materials and intermediary goods capture the over-whelmingly largest share of input costs for sector firms – namely, 76.9% of the sector’s total value of inputs. The second largest input cost is labor (13.8%), followed by oil (3.4%) and electricity (1.9%). The cost of water is very marginal (0.1%). Nevertheless, as the table shows, the share that certain inputs take within the total value of inputs differs depending on company size. Medium-sized companies, for example, spend a lower share on raw materials and a higher share on wages than micro and small firms. The share of electricity costs within the input structure increases consistently with firm size, reflecting higher degrees of mechanization and thus of electricity demand.
Extrapolating average amounts for the 213 SME firms operating in the sector, the estimation is that these firms have spent about €57.8 million on inputs in 2012, the largest share of which – €44,5 million – was spent on raw materials and intermediar-ies.

16 | SECTOR PROFILE OF METAL PROCESSING INDUSTRY
Table 4: Shares of SME input costs within total inputs, by company size
Share of input costs with-in total inputs by firm size
Input type
Average yearly expenditure
(€)
Estimated total expenditure by
sector SME’s (213 firms) (€))
Share of input cost
within total inputs (in%)
Micro Small Medium
Raw mate-rials & inter-mediaries
208,902 44,496,230 76.9 75.4 78.2 67.2
Labour 37,499 7,987,300 13.8 14.5 11.1 25.5
Other 10,545 2,245,981 3.9 5.4 4.9 0.2
Oil 9,251 1,970,516 3.4 3.6 4.1 1.3
Electricity5,082 1,082,382 1.9 0.9 1.5 5.8
Water 293 62,498 0.1 0.1 0.1 0.1
All inputs 271,572 57,844,909 100 100 100 100
Source: UNDP Survey, 2013
Another added value of the survey is that it provided a rare opportunity to cap-ture the sources of raw materials and intermediaries, by identifying the main actors in the industry’s supply chain. To this end, companies were asked to disaggregate the total value of raw materials and intermediaries that they used by the type of supplier that provided them. More specifically, they had the option of stating what percent of their raw materials and intermediaries were domestic goods (produced “in-house” or by “other domestic producers”) and what percent were foreign goods (supplied by “domestic traders”, “foreign traders” or “directly by foreign producers”).
As illustrated by Figure 4, a substantial share of the total value of raw materials and intermediaries (36.8%) are produced in the domestic market, either in-house (17.1%) or by other domestic producers (19.7%). Nevertheless, most of the raw ma-terials and intermediaries are imported, with domestic traders playing an important role in the value-chain (33.3%). An additional 20.3% of the total value of raw materials is supplied directly from foreign producers, whereas only 9.5% are procured from for-eign traders.

SECTOR PROFILE OF METAL PROCESSING INDUSTRY | 17
Figure 4: Share of the total value of raw materials and intermediaries used by sector SME’s (in %), by type of supplier
Source: UNDP Survey, 2013
The total value of output produced by the metal processing industry in Kosovo is difficult to ascertain due to underreporting by the sector firms that were surveyed. A substantial number of sector SME’s did respond to the questions related to the value of their output (91 out of 141), but the resulting output averages and totals derived from their answers are much lower – less then half – than the value of reported inputs. Furthermore, none of the large firms (which capture the overwhelming share of out-put in the industry) provided information on their outputs, thus making the exercise of deriving a total value of output for the industry extremely difficult.
Nevertheless, even if output was underreported, there is no reason to believe that there is any strong bias in the nature of the underreporting – namely, firms under-reported their output regardless of size or type of processing activity. That is why the survey data on SME output does provide an opportunity to determine at least the output shares that different metal processing activities take up within the sec-tor, regardless of their total monetary values. As illustrated by Figure 5, the largest share of the output value (regardless of total amount) in the SME section is captured by companies listing the manufacture of steel tubes (35%) as their main processing activity. The second largest share is captured by the manufacture of metal structures and parts (12%), followed by non-ferrous metal production (9%), the manufacture of “other metal products” (9%) and casting of iron and steel (8%).
As far as the five largest and dominant firms in the industry are concerned, the output structure is different and, due to insufficient responses to survey questions, has to be derived using combined survey and secondary sources. Export data (to be discussed later) confirm that the production of ferro-nickel (at the Ferronikeli plant in Gllogoc/Gllogovac) captures the overwhelming share of output not only among the large firms, but in the metal processing industry as a whole.
0 10 20 30
55
33 30 24 18 9 8
12
5 3 4
4 4 2
0
1
1 0 0
1
0 0
02
0
20
40
60
80
5
16
17
25
29
31
16
16
17
26
32
33
2873
2742
2741
2851
2840
2875
18.75%
29.90%
31.20%
20.10%
0.00% 5.00% 10.00% 15.00% 20.00% 25.00% 30.00% 35.00%
fig.21
fig.15
fig.16
fig.2
fig.3
fig.4
fig.5
fig.6
fig.7
fig.8
fig.9
fig.10
fig.10
9.5%
17.1%
19.7%
20.3%
33.3%
0.0% 10.0% 20.0% 30.0% 40.0%
8%
9%
9%
12%
26%
35%
0% 10% 20% 30% 40%
2731
2875
2745
2811
2722
0
59%
64%
75%
60%
62%
62%
80%
87%
0% 20% 40% 60% 80% 100%
2012
2011
6%
41%
100%
100%
35%
31%
65%
95%
0% 20% 40% 60% 80% 100%
330 392
433
295 319 276
148 145 101 0
100
200
300
400
500
2010 2011 2012
32.1%
47.4%
22.6%
31.5%
0.0% 5.0% 10.0% 15.0% 20.0% 25.0% 30.0% 35.0% 40.0% 45.0% 50.0%
302,844
4,494
0
50,000
100,000
150,000
200,000
250,000
300,000
350,000
13.8%
13.8%
10.7%
61.6%
95%
79%
5%
21%
0% 20% 40% 60% 80% 100%
26%
57%
17%
14%
72%
14%
0% 10% 20% 30% 40% 50% 60% 70% 80%
24%
41%
65%
46%
39%
86%
0% 20% 40% 60% 80% 100%
59.1%
57.3%
97.3%
79.2%
75.0%
100.0%
0.0% 20.0% 40.0% 60.0% 80.0% 100.0% 120.0%
17.1%
28.6%
50.0%
0.0% 20.0% 40.0% 60.0%
6.3
6.5
6.8
7.4
7.5
7.7
8.4
8.7
8.8
8.9
9.2
9.3
9.4
9.7
9.9
10.9
11
0 2 4 6 8 10 12
21%
29%
17%
21%
0% 5% 10% 15% 20% 25% 30% 35%
3.6%
2.9%
40.6%
38.4%
14.5%
0.0% 10.0% 20.0% 30.0% 40.0% 50.0%
3.0%
15.2%
53.8%
24.2%
3.3%
4.9%
17.6%
45.1%
26.5%
5.9%
149 145
100 89
141 136
85 76
7 8 10 10 0
100
200
2010 2011 2012
Domestic trader
Foreign producer
Domestic producer
In-house
Foreign trader

18 | SECTOR PROFILE OF METAL PROCESSING INDUSTRY
One of the other largest producers in Kosovo, Llamkos-Galvasteel produces a wide range of galvanized steel products – starting with flat products (galvanized sheets and coils), to end-use products such as ventilation systems, waste containers, gutters, profiled sheets, etc. Due to a complex bundle of political and legal disputes, as well as decades of underinvestment and neglect, the Trepça/Trepča industrial complex, once Kosovo’s industry champion, is currently reduced to the mere mining of zinc and lead ores. NewCo IMK Pipe Factory based in Ferizaj/Uroševac specializes in the production of steel pipes used for various supply systems (water, gas and oil), whereas Jugoterm in Gjilan/Gnjilane focuses on the production of heating radiators.
Figure 5: Share of SME output value by main processing activity
2722 – Manufacture of steel tubes; 2811 – Manufacture of metal structures & parts; 2745 – Non-ferrous metal production (ex. aluminum); 2875 – Manufacture of other metal products;
2731 – Casting of iron and steel.
Source: UNDP Survey, 2013
The survey also questioned sector firms on their levels of production capacity utilization in the last two years (2011 and 2012) and received a 95% response rate. On average, sector firms report to have utilized 62.9% of their production capacity in 2012. This marks a sector-wide increase of 2.4% compared to the reported capacity utilization in the previous year (2011), when it stood at 60.6%. Nonetheless, as Figure 6 illustrates, the increase in capacity utilization was much higher for large firms (27%) and medium ones (5%), than for micro firms (3%) or small-firms, which witnessed a mild drop (2%). Although turnover experienced a large drop for larger firms in 2012 (to be discussed in the next chapter), increased capacity utilization in the same year could be related to an expected increase in sales in 2013, which is confirmed by pre-liminary 2013 export data (all large firms are overwhelmingly export oriented).
0 10 20 30
55
33 30 24 18 9 8
12
5 3 4
4 4 2
0
1
1 0 0
1
0 0
02
0
20
40
60
80
5
16
17
25
29
31
16
16
17
26
32
33
2873
2742
2741
2851
2840
2875
18.75%
29.90%
31.20%
20.10%
0.00% 5.00% 10.00% 15.00% 20.00% 25.00% 30.00% 35.00%
�g.21
�g.15
�g.16
�g.2
�g.3
�g.4
�g.5
�g.6
�g.7
�g.8
�g.9
�g.10
�g.10
9.5%
17.1%
19.7%
20.3%
33.3%
0.0% 10.0% 20.0% 30.0% 40.0%
8%
9%
9%
12%
26%
35%
0% 20%10% 40% 50% 60%30%
2731
2875
2745
2781
2722
59%
64%
75%
60%
62%
62%
80%
87%
0% 20% 40% 60% 80% 100%
2012
2011
6%
41%
100%
100%
35%
31%
65%
95%
0% 20% 40% 60% 80% 100%
330 392
433
295 319 276
148 145 101 0
100
200
300
400
500
2010 2011 2012
32.1%
47.4%
22.6%
31.5%
0.0% 5.0% 10.0% 15.0% 20.0% 25.0% 30.0% 35.0% 40.0% 45.0% 50.0%
302,844
4,494
0
50,000
100,000
150,000
200,000
250,000
300,000
350,000
13.8%
13.8%
10.7%
61.6%
95%
79%
5%
21%
0% 20% 40% 60% 80% 100%
26%
57%
17%
14%
72%
14%
0% 10% 20% 30% 40% 50% 60% 70% 80%
24%
41%
65%
46%
39%
86%
0% 20% 40% 60% 80% 100%
59.1%
57.3%
97.3%
79.2%
75.0%
100.0%
0.0% 20.0% 40.0% 60.0% 80.0% 100.0% 120.0%
17.1%
28.6%
50.0%
6.3
6.5
6.8
7.4
7.5
7.7
8.4
8.7
8.8
8.9
9.2
9.3
9.4
9.7
9.9
10.9
11
0 2 4 6 8 10 12
21%
29%
17%
21%
0% 5% 10% 15% 20% 25% 30% 35%
3.6%
2.9%
40.6%
38.4%
14.5%
0.0% 10.0% 20.0% 30.0% 40.0% 50.0%
3.0%
15.2%
53.8%
24.2%
3.3%
4.9%
17.6%
45.1%
26.5%
5.9%
149 145
100 89
141 136
85 76
7 8 10 10 0
100
200
2010 2011 2012
0% 20%10% 40% 50% 60%30%
Other

SECTOR PROFILE OF METAL PROCESSING INDUSTRY | 19
Figure 6: Production capacity utilization (in %), in years and by firm size
Source: UNDP Survey, 2013
0 10 20 30
55
33 30 24 18 9 8
12
5 3 4
4 4 2
0
1
1 0 0
1
0 0
02
0
20
40
60
80
5
16
17
25
29
31
16
16
17
26
32
33
2873
2742
2741
2851
2840
2875
18.75%
29.90%
31.20%
20.10%
0.00% 5.00% 10.00% 15.00% 20.00% 25.00% 30.00% 35.00%
fig.21
fig.15
fig.16
fig.2
fig.3
fig.4
fig.5
fig.6
fig.7
fig.8
fig.9
fig.10
fig.10
9.5%
17.1%
19.7%
20.3%
33.3%
0.0% 10.0% 20.0% 30.0% 40.0%
8%
9%
9%
12%
26%
35%
0% 10% 20% 30% 40%
2731
2875
2745
2811
2722
0
59%
64%
75%
60%
62%
62%
80%
87%
0% 20% 40% 60% 80% 100%
2012
2011
6%
41%
100%
100%
35%
31%
65%
95%
0% 20% 40% 60% 80% 100%
330 392
433
295 319 276
148 145 101 0
100
200
300
400
500
2010 2011 2012
32.1%
47.4%
22.6%
31.5%
0.0% 5.0% 10.0% 15.0% 20.0% 25.0% 30.0% 35.0% 40.0% 45.0% 50.0%
302,844
4,494
0
50,000
100,000
150,000
200,000
250,000
300,000
350,000
13.8%
13.8%
10.7%
61.6%
95%
79%
5%
21%
0% 20% 40% 60% 80% 100%
26%
57%
17%
14%
72%
14%
0% 10% 20% 30% 40% 50% 60% 70% 80%
24%
41%
65%
46%
39%
86%
0% 20% 40% 60% 80% 100%
59.1%
57.3%
97.3%
79.2%
75.0%
100.0%
0.0% 20.0% 40.0% 60.0% 80.0% 100.0% 120.0%
17.1%
28.6%
50.0%
0.0% 20.0% 40.0% 60.0%
6.3
6.5
6.8
7.4
7.5
7.7
8.4
8.7
8.8
8.9
9.2
9.3
9.4
9.7
9.9
10.9
11
0 2 4 6 8 10 12
21%
29%
17%
21%
0% 5% 10% 15% 20% 25% 30% 35%
3.6%
2.9%
40.6%
38.4%
14.5%
0.0% 10.0% 20.0% 30.0% 40.0% 50.0%
3.0%
15.2%
53.8%
24.2%
3.3%
4.9%
17.6%
45.1%
26.5%
5.9%
149 145
100 89
141 136
85 76
7 8 10 10 0
100
200
2010 2011 2012
Large
Medium
Small
Micro

20 | SECTOR PROFILE OF METAL PROCESSING INDUSTRY
4. MarketsThe data generated from the survey make it difficult to come up with accurate
figures on the total value of sales that metal processing firms, or the sector as a whole, have made over the last two years. There are two main reasons for this. The first one is that there is obvious underreporting of turnover by those firms that did respond to the question on sales (a total of 61% surveyed micro and small firms agreed to answer the question). The average turnover that micro and small companies report to have made in 2012 are about half the size of the inputs they report to have used in their production process. Another difficulty in estimating the total turnover level for the sector as a whole is the fact most medium and large firms did not provide turnover figures at all. Nonetheless, a mixture of survey data and other secondary sources does at least create an opportunity to notice some important year-on-year trends with-in the sector, or to come up with some indicative total figures for the sector which should be taken with some degree of reservation.
As Table 5 illustrates, micro and small firms reported an increase in sales between the years of 2011 and 2012. More precisely, 13 out of the 87 micro and small firms (15%) that responded to the question on turnover reported a year-on-year increase in sales, whereas none of the surveyed companies reported a decrease in sales. The yearly up-tick in sales for this segment of the sector is marked at 4.8%. The accuracy of this reported increase in sales is supported by the fact that (as the survey confirms) micro and small firms sell almost all of their goods in the domestic market (see Table 6) where, as import data confirm, the level of demand for metal products remains strong and witnessed an increase in 2012.
Table 5: Sector firm turnover in 2011 and 2012, averages and totals
Firm size
Average reported
turnover in 2011 (€) *
Average reported
turnover in 2012 *
%change
Total estimated
turnover in 2011
Total estimat-ed turnover in
2012
Micro & Small 116,293 121,839 + 4.8% 19,940,996 20,894,886
Micro 50,758 53,220 + 4.8 % 8,984,091 9,419,886
Small 322,262 337,500 + 4.7% 10,956,905 11,475,000
Medium & Large N/A N/A - 36.8 % ≈ 145,000,000 ** ≈ 93,000,000 **
Total Sector N/A N/A ≈ - 31% ≈ 165,000,000 ** ≈ 114,000,000 **
* Source: The average rates were derived from the survey.** Source: Due to low response rate, the total for the five medium and large companies was estimated using combined sources:
the survey, for those firms that responded; b) Kosovo Customs export data, for those firms that are sole exporters of particular goods and (according to survey answers) export 100% of their output; c) other secondary sources.

SECTOR PROFILE OF METAL PROCESSING INDUSTRY | 21
On the other hand, another clearly noticeable fact is that the total level of turno-ver for the sector is extremely dependent on the sales of the five medium and large companies – especially Ferronikeli - which sell most of their goods in foreign markets (see Table 6). A sharp drop in nickel exports between 2011 and 2012 (from €136,4 million to €83,6 million) led to an approximate 31% decrease in turnover for the sec-tor as a whole, despite the positive trend in the micro and small section of the sector. Preliminary trade data for 2013 indicate that ferro-nickel exports have reversed the trend, almost reaching the total value of ferro-nickel exports in 2012 only in the first two quarters of 2013.
Extrapolating average sales that micro and small firms reported in the survey for
the total estimated population of such firms, and using a mixture of survey data and secondary sources to approximate the sales by the five medium and large firms, the total turnover for the sector is estimated to have been about ≈ €165 million in 2011 and ≈ €114 million in 2012. Nonetheless, it must be noted that these numbers should be higher due to underreported sales by micro and small firms. Taking into account this fact, in years when ferro-nickel sales have a good year (€120- €140 million per year), total turnover for the sector realistically might be closer to the €200 million figure.
As illustrated by Table 6, the survey indicates that micro and small firms in Kosovo sell most of their goods in the domestic market and export only a small amount. The average micro firm sells 98.4% of its goods in the domestic market and only 2.6% abroad. Table 6 shows how the ratio between domestic and foreign sales continuous-ly decreases with firm size – the larger the firm, the larger the share of goods that are exported.
Table 6: Average share of firms’ domestic and foreign sales, by firm size
Firm size Domestic sales as % of total sales (average per firm)
Foreign sales as % of total sales(average per firm)
Micro 98.4 % 2.6 %
Small 74.1 % 25.9%
Medium 35 % 65 %
Large 5 % 95 %
Source: UNDP Survey, 2013
Due to the fact that not all firms have the same level of turnover, and that av-erage sales per firm might be misleading because they discount for this variance in turnover, Table 7 presents the shares of the turnover value generated by domestic and foreign sales in 2012. Micro firms generated 94.3% of their turnover domestically, whereas for small firms – despite the fact that, on average, they sell 74% domestical-ly - domestic sales constituted 89.4% of the total value of goods sold. Medium firms generated slightly more than half of their turnover from exports (56.5%), while large firms generated almost all of it from abroad (99.6%).

22 | SECTOR PROFILE OF METAL PROCESSING INDUSTRY
Table 7: Share of the value of domestic and foreign sales in 2012, by firm size
Firm size Value of domestic sales as % of total sales
Value of foreign sales as % of total sales
Micro 94.3 % 5.4 %
Small 89.4 % 10.6%
Medium 43.5% 56.5 %
Large 0.4 % 99.6 %
Source: UNDP Survey, 2013
The types of goods that micro and small firms sell in the domestic market cor-respond to the top processing activities of such firms (see Figures 2 and 5) – mostly metal constructs and structures used by the construction industry or parts used by other manufacturers. Table 8 illustrates the types of buyers that micro and small firms sell to in the domestic market, and the respective shares of output value sold to them.
There are significant differences between micro and small firms in terms of who buys their goods, reflecting the different scales, types and degrees of sophistication that are often found between the two types of firms. Usually arranged as family busi-nesses with limited output capacity and/or processing sophistication, and operating mainly as repair shops or service providers, micro firms sell the largest share of their output value directly to end-users (36.4%) and small shops (34.3%), and a very small share (3.4%) to other companies for further processing. Small firms, on the other hand, also sell a large share to small shops (36.4%). But unlike micro firms, and due to their higher output scale and mechanization, an important part in the small firms’ val-ue chain is also played by distributors / wholesalers (34.3%). Sales to other processors are also higher for small firms (7%).
Table 8: Domestic sales of micro and small firms in 2012, by type of buyer
Type of buyer% of total output value sold to buyer
Micro Small
Other company / further processing 3.4% 7.0%
Distributor / Wholesaler 9.9% 34.3%
Small shop 34.3% 36.4%
End user 36.4% 22.1%
Source: UNDP Survey, 2013

SECTOR PROFILE OF METAL PROCESSING INDUSTRY | 23
According to the survey, 17.4% of metal processing firms are exporters. The num-ber of exporting firms, as well as the export share of their output, increases with firm size (see Figure 7 below).
Figure 7: Share of sector firms that export and their average export shares in 2012, by firm size
Source: UNDP Survey, 2013
The average yearly value of base metal and metal products (excluding scrap) ex-ported from Kosovo between the years of 2010-2012 was €132 million. On the other hand, in 2012, the trade deficit in the sector was €151 million. A persistent increase in domestic demand to feed construction projects and the sharp drop in ferro-nickel exports due to the global economic crisis has widened the deficit over the last years (see Figure 8). Between 2011 and 2012, exports dropped from €148million to €101 million, whereas imports increased from €194 million to €252 million.
Regardless of such cyclical factors, the metal sector remains the top export sector in Kosovo. The export of base metals and metal products represented 36.5% of the value of total exported goods from Kosovo in 2012. The noted increase in ferro-nickel exports in 2013 seems likely to return metal exports closer to the 50% share of total exports, where they were in 2010.
Figure 8: Metal exports, metal imports and total export of goods from Kosovo (2010-2012), in millions €
0 10 20 30
55
33 30 24 18 9 8
12
5 3 4
4 4 2
0
1
1 0 0
1
0 0
02
0
20
40
60
80
5
16
17
25
29
31
16
16
17
26
32
33
2873
2742
2741
2851
2840
2875
18.75%
29.90%
31.20%
20.10%
0.00% 5.00% 10.00% 15.00% 20.00% 25.00% 30.00% 35.00%
fig.21
fig.15
fig.16
fig.2
fig.3
fig.4
fig.5
fig.6
fig.7
fig.8
fig.9
fig.10
fig.10
9.5%
17.1%
19.7%
20.3%
33.3%
0.0% 10.0% 20.0% 30.0% 40.0%
8%
9%
9%
12%
26%
35%
0% 10% 20% 30% 40%
2731
2875
2745
2811
2722
0
59%
64%
75%
60%
62%
62%
80%
87%
0% 20% 40% 60% 80% 100%
2012
2011
6%
41%
100%
100%
35%
31%
65%
95%
0% 20% 40% 60% 80% 100%
330 392
433
295 319 276
148 145 101 0
100
200
300
400
500
2010 2011 2012
32.1%
47.4%
22.6%
31.5%
0.0% 5.0% 10.0% 15.0% 20.0% 25.0% 30.0% 35.0% 40.0% 45.0% 50.0%
302,844
4,494
0
50,000
100,000
150,000
200,000
250,000
300,000
350,000
13.8%
13.8%
10.7%
61.6%
95%
79%
5%
21%
0% 20% 40% 60% 80% 100%
26%
57%
17%
14%
72%
14%
0% 10% 20% 30% 40% 50% 60% 70% 80%
24%
41%
65%
46%
39%
86%
0% 20% 40% 60% 80% 100%
59.1%
57.3%
97.3%
79.2%
75.0%
100.0%
0.0% 20.0% 40.0% 60.0% 80.0% 100.0% 120.0%
17.1%
28.6%
50.0%
0.0% 20.0% 40.0% 60.0%
6.3
6.5
6.8
7.4
7.5
7.7
8.4
8.7
8.8
8.9
9.2
9.3
9.4
9.7
9.9
10.9
11
0 2 4 6 8 10 12
21%
29%
17%
21%
0% 5% 10% 15% 20% 25% 30% 35%
3.6%
2.9%
40.6%
38.4%
14.5%
0.0% 10.0% 20.0% 30.0% 40.0% 50.0%
3.0%
15.2%
53.8%
24.2%
3.3%
4.9%
17.6%
45.1%
26.5%
5.9%
149 145
100 89
141 136
85 76
7 8 10 10 0
100
200
2010 2011 2012
Large
Medium
Small
Micro
% of output exported % of firms exporting
Total Metal Imports Total Export of Goods Total Metal Exports
Source: Kosovo Customs, 2013
0 10 20 30
55
33 30 24 18 9 8
12
5 3 4
4 4 2
0
1
1 0 0
1
0 0
02
0
20
40
60
80
5
16
17
25
29
31
16
16
17
26
32
33
2873
2742
2741
2851
2840
2875
18.75%
29.90%
31.20%
20.10%
0.00% 5.00% 10.00% 15.00% 20.00% 25.00% 30.00% 35.00%
�g.21
�g.15
�g.16
�g.2
�g.3
�g.4
�g.5
�g.6
�g.7
�g.8
�g.9
�g.10
�g.10
9.5%
17.1%
19.7%
20.3%
33.3%
0.0% 10.0% 20.0% 30.0% 40.0%
8%
9%
9%
12%
26%
35%
0% 10% 20% 30% 40%
2731
2875
2745
2811
2722
0
59%
64%
75%
60%
62%
62%
80%
87%
0% 20% 40% 60% 80% 100%
2012
2011
6%
41%
100%
100%
35%
31%
65%
95%
0% 20% 40% 60% 80% 100%
32.1%
47.4%
22.6%
31.5%
0.0% 5.0% 10.0% 15.0% 20.0% 25.0% 30.0% 35.0% 40.0% 45.0% 50.0%
302,844
4,494
0
50,000
100,000
150,000
200,000
250,000
300,000
350,000
13.8%
13.8%
10.7%
61.6%
95%
79%
5%
21%
0% 20% 40% 60% 80% 100%
26%
57%
17%
14%
72%
14%
0% 10% 20% 30% 40% 50% 60% 70% 80%
24%
41%
65%
46%
39%
86%
0% 20% 40% 60% 80% 100%
59.1%
57.3%
97.3%
79.2%
75.0%
100.0%
0.0% 20.0% 40.0% 60.0% 80.0% 100.0% 120.0%
17.1%
28.6%
50.0%
0.0% 20.0% 40.0% 60.0%
6.3
6.5
6.8
7.4
7.5
7.7
8.4
8.7
8.8
8.9
9.2
9.3
9.4
9.7
9.9
10.9
11
0 2 4 6 8 10 12
21%
29%
17%
21%
0% 5% 10% 15% 20% 25% 30% 35%
3.6%
2.9%
40.6%
38.4%
14.5%
0.0% 10.0% 20.0% 30.0% 40.0% 50.0%
3.0%
15.2%
53.8%
24.2%
3.3%
4.9%
17.6%
45.1%
26.5%
5.9%
149 145
100 89
141 136
85 76
7 8 10 10 0
100
200
2010 2011 2012
194
233 252
295 319 276
148 145
101
0
50
100
150
200
250
300
350
2010 2011 2012

24 | SECTOR PROFILE OF METAL PROCESSING INDUSTRY
The structure of the sector’s exports is overwhelmingly dominated by the export of processed ferronickel produced in the Ferronikeli plant in Drenas/Glogovac (see Figure 9). Ferro-nickel exports captured 90.8% of the total value of metal exports be-tween the years of 2010 and 2012. The largest remaining share of exports (6.6%) is captured by iron and steel products – mostly line pipes, tubes and hollow profiles.
Figure 9: Metal exports, ferro-nickel exports and iron and steel product exports (2010-2013), in millions €
Source: Kosovo Customs, 2013
The main export markets for Kosovo’s base metals and metal products by output value are Italy, India, Germany, Macedonia, Albania, Portugal and Switzerland. The industrial giants and main exporters by turnover value are concentrated in a couple of main export markets. The ferronickel produced at Ferronikeli is exported to Italy, India and Germany, whereas Llamkos-Galvasteel exported its galvanized steel prod-ucts to Portugal and FYROM. Trepça/ Trepča exported all of its zinc and lead to Swit-zerland. The two medium-sized companies, IMK Pipe Factory and Jugoterm, export their goods only to regional markets: Albania, Greece, FYROM, Serbia and Bosnia and Herzegovina.
Survey data created an opportunity to map the share of exported goods by the types of buyers (see Table 9). Unsurprisingly, almost all of the exported value from the large firms (97.2%) is sold directly to other companies for further processing. This is because two of the large firms (Ferronikeli and Trepça/Trepča) export processed ferronickel and zinc/lead ores, which are raw materials and intermediaries for other goods (for example: 2/3 of the global supply of nickel is used for the production of stainless steel). Small and medium companies, on the other hand, export almost all of their goods through distributors (93.8% and 100% respectively). The small number of micro firms that export do so directly to small-shops (58.9%) or distributors (40.7%).
0 10 20 30
55
33 30 24 18 9 8
12
5 3 4
4 4 2
0
1
1 0 0
1
0 0
02
0
20
40
60
80
5
16
17
25
29
31
16
16
17
26
32
33
2873
2742
2741
2851
2840
2875
18.75%
29.90%
31.20%
20.10%
0.00% 5.00% 10.00% 15.00% 20.00% 25.00% 30.00% 35.00%
fig.21
fig.15
fig.16
fig.2
fig.3
fig.4
fig.5
fig.6
fig.7
fig.8
fig.9
fig.10
fig.10
9.5%
17.1%
19.7%
20.3%
33.3%
0.0% 10.0% 20.0% 30.0% 40.0%
8%
9%
9%
12%
26%
35%
0% 10% 20% 30% 40%
2731
2875
2745
2811
2722
0
59%
64%
75%
60%
62%
62%
80%
87%
0% 20% 40% 60% 80% 100%
2012
2011
6%
41%
100%
100%
35%
31%
65%
95%
0% 20% 40% 60% 80% 100%
330 392
433
295 319 276
148 145 101 0
100
200
300
400
500
2010 2011 2012
32.1%
47.4%
22.6%
31.5%
0.0% 5.0% 10.0% 15.0% 20.0% 25.0% 30.0% 35.0% 40.0% 45.0% 50.0%
302,844
4,494
0
50,000
100,000
150,000
200,000
250,000
300,000
350,000
13.8%
13.8%
10.7%
61.6%
95%
79%
5%
21%
0% 20% 40% 60% 80% 100%
26%
57%
17%
14%
72%
14%
0% 10% 20% 30% 40% 50% 60% 70% 80%
24%
41%
65%
46%
39%
86%
0% 20% 40% 60% 80% 100%
59.1%
57.3%
97.3%
79.2%
75.0%
100.0%
0.0% 20.0% 40.0% 60.0% 80.0% 100.0% 120.0%
17.1%
28.6%
50.0%
0.0% 20.0% 40.0% 60.0%
6.3
6.5
6.8
7.4
7.5
7.7
8.4
8.7
8.8
8.9
9.2
9.3
9.4
9.7
9.9
10.9
11
0 2 4 6 8 10 12
21%
29%
17%
21%
0% 5% 10% 15% 20% 25% 30% 35%
3.6%
2.9%
40.6%
38.4%
14.5%
0.0% 10.0% 20.0% 30.0% 40.0% 50.0%
3.0%
15.2%
53.8%
24.2%
3.3%
4.9%
17.6%
45.1%
26.5%
5.9%
149 145
100 89
141 136
85 76
7 8 10 10 0
100
200
2010 2011 2012
Total metal exports (excluding scrap)
Ferro-nickel exports
Iron and steel products exports
Jan-Jun 2013

SECTOR PROFILE OF METAL PROCESSING INDUSTRY | 25
Table 9: Share of the total value of exported goods in 2012, by type of buyer
Type of buyer% of export value
Micro Small Medium Large Total Sector
Other company / further processing 0% 3.8% 0% 97.2% 93.4%
Distributor / Wholesaler 40.7% 93.8% 100% 0.3% 4.2%
Small shop 58.9% 1.2% 0% 0.3% 0.4%
End user 0.4% 1.2% 0% 2.2% 2%
Source: UNDP Survey, 2013
Micro and small firms currently export smaller shares of their goods, but many of them say that they intend to do so in the future. As illustrated by Figure 10, export intent is expectedly correlated with firm size. A larger share of small firms (78.9%) say that they intend to export sometime in the future compared to micro firms (54.7%). The constraints that firms face when it comes to exporting are more inner-firm than external. As illustrated in the chart, a larger share of both micro and small firms think that their firms are not ready yet to export (32.1% and 47.4% respectively), whereas a smaller share think that there are many obstacles to do so (22.6% and 31.5%).
Figure 10: Share of micro and small firms with intentions to export in 2012
Box 2: Kosovo’s trade regimes in a nutshell
As a member of CEFTA, Kosovo has a free trade regime with a 24 million strong market. A free trade agreement with Turkey came into force on January 1st 2014 and negotiations are underway for an SAA with the EU. Kosovo firms also have customs-free access to the US market.
0 10 20 30
55
33 30 24 18 9 8
12
5 3 4
4 4 2
0
1
1 0 0
1
0 0
02
0
20
40
60
80
5
16
17
25
29
31
16
16
17
26
32
33
2873
2742
2741
2851
2840
2875
18.75%
29.90%
31.20%
20.10%
0.00% 5.00% 10.00% 15.00% 20.00% 25.00% 30.00% 35.00%
fig.21
fig.15
fig.16
fig.2
fig.3
fig.4
fig.5
fig.6
fig.7
fig.8
fig.9
fig.10
fig.10
9.5%
17.1%
19.7%
20.3%
33.3%
0.0% 10.0% 20.0% 30.0% 40.0%
8%
9%
9%
12%
26%
35%
0% 10% 20% 30% 40%
2731
2875
2745
2811
2722
0
59%
64%
75%
60%
62%
62%
80%
87%
0% 20% 40% 60% 80% 100%
2012
2011
6%
41%
100%
100%
35%
31%
65%
95%
0% 20% 40% 60% 80% 100%
330 392
433
295 319 276
148 145 101 0
100
200
300
400
500
2010 2011 2012
32.1%
47.4%
22.6%
31.5%
0.0% 5.0% 10.0% 15.0% 20.0% 25.0% 30.0% 35.0% 40.0% 45.0% 50.0%
302,844
4,494
0
50,000
100,000
150,000
200,000
250,000
300,000
350,000
13.8%
13.8%
10.7%
61.6%
95%
79%
5%
21%
0% 20% 40% 60% 80% 100%
26%
57%
17%
14%
72%
14%
0% 10% 20% 30% 40% 50% 60% 70% 80%
24%
41%
65%
46%
39%
86%
0% 20% 40% 60% 80% 100%
59.1%
57.3%
97.3%
79.2%
75.0%
100.0%
0.0% 20.0% 40.0% 60.0% 80.0% 100.0% 120.0%
17.1%
28.6%
50.0%
0.0% 20.0% 40.0% 60.0%
6.3
6.5
6.8
7.4
7.5
7.7
8.4
8.7
8.8
8.9
9.2
9.3
9.4
9.7
9.9
10.9
11
0 2 4 6 8 10 12
21%
29%
17%
21%
0% 5% 10% 15% 20% 25% 30% 35%
3.6%
2.9%
40.6%
38.4%
14.5%
0.0% 10.0% 20.0% 30.0% 40.0% 50.0%
3.0%
15.2%
53.8%
24.2%
3.3%
4.9%
17.6%
45.1%
26.5%
5.9%
149 145
100 89
141 136
85 76
7 8 10 10 0
100
200
2010 2011 2012
Small
Micro
"Intend to export, but there are too many barriers"
"Intend to export, but the firm is not ready yet"
Source: UNDP Survey, 2013

26 | SECTOR PROFILE OF METAL PROCESSING INDUSTRY
5. Employment and Human capacitiesMetal processing operations are generally very capital-intensive, but they none-
theless do require substantial numbers of workers, including those with specific skills to operate a wide range of machinery and tools. The estimated number of people who work for the 216 companies in the metal processing sector is 4496. As illustrat-ed in Figure 11, employment in the metal processing sector takes up 1.5% of total employment in Kosovo which, according to the latest Labour Force Survey, stands at 302,844 persons.
Table 10: Number of firm and sector workers in 2012, employment (averages and totals, by firm size)
Firm size Average number of workers Estimated total number of workers
Micro 4 622
Small 18 622
Medium 240 480
Large 923 2,771
TOTAL / 4,496
Source: UNDP Survey, 2013
Figure 11: Total employment and in the metal sector in 2012
Sources: UNDP Survey, 2013 Kosovo Labour Market Survey, 2012
0 10 20 30
55
33 30 24 18 9 8
12
5 3 4
4 4 2
0
1
1 0 0
1
0 0
02
0
20
40
60
80
5
16
17
25
29
31
16
16
17
26
32
33
2873
2742
2741
2851
2840
2875
18.75%
29.90%
31.20%
20.10%
0.00% 5.00% 10.00% 15.00% 20.00% 25.00% 30.00% 35.00%
fig.21
fig.15
fig.16
fig.2
fig.3
fig.4
fig.5
fig.6
fig.7
fig.8
fig.9
fig.10
fig.10
9.5%
17.1%
19.7%
20.3%
33.3%
0.0% 10.0% 20.0% 30.0% 40.0%
8%
9%
9%
12%
26%
35%
0% 10% 20% 30% 40%
2731
2875
2745
2811
2722
0
59%
64%
75%
60%
62%
62%
80%
87%
0% 20% 40% 60% 80% 100%
2012
2011
6%
41%
100%
100%
35%
31%
65%
95%
0% 20% 40% 60% 80% 100%
330 392
433
295 319 276
148 145 101 0
100
200
300
400
500
2010 2011 2012
32.1%
47.4%
22.6%
31.5%
0.0% 5.0% 10.0% 15.0% 20.0% 25.0% 30.0% 35.0% 40.0% 45.0% 50.0%
302,844
4,494
0
50,000
100,000
150,000
200,000
250,000
300,000
350,000
13.8%
13.8%
10.7%
61.6%
95%
79%
5%
21%
0% 20% 40% 60% 80% 100%
26%
57%
17%
14%
72%
14%
0% 10% 20% 30% 40% 50% 60% 70% 80%
24%
41%
65%
46%
39%
86%
0% 20% 40% 60% 80% 100%
59.1%
57.3%
97.3%
79.2%
75.0%
100.0%
0.0% 20.0% 40.0% 60.0% 80.0% 100.0% 120.0%
17.1%
28.6%
50.0%
0.0% 20.0% 40.0% 60.0%
6.3
6.5
6.8
7.4
7.5
7.7
8.4
8.7
8.8
8.9
9.2
9.3
9.4
9.7
9.9
10.9
11
0 2 4 6 8 10 12
21%
29%
17%
21%
0% 5% 10% 15% 20% 25% 30% 35%
3.6%
2.9%
40.6%
38.4%
14.5%
0.0% 10.0% 20.0% 30.0% 40.0% 50.0%
3.0%
15.2%
53.8%
24.2%
3.3%
4.9%
17.6%
45.1%
26.5%
5.9%
149 145
100 89
141 136
85 76
7 8 10 10 0
100
200
2010 2011 2012
Total employed population Employed in metal sector

SECTOR PROFILE OF METAL PROCESSING INDUSTRY | 27
The vast majority of sector workers are employed by the five biggest firms in the industry. As illustrated by Figure 12, 61.6% of those who are employed in the sector work for the three large companies, whereas a much smaller share work for the re-maining medium (10.7%), small (13.8%) or micro firms (13.8%). Micro firms on aver-age employ between 3-4 workers, whereas small firms have about 18.
Figure 12: Share of sector employment by firm size, 2012
Surveyed companies were asked to state the amount of financial resources that they spend per month on wages. When divided by the number of workers that they report to have employed, the average salary for micro and small firms in 2012 is esti-mated to have been €296 per month (see Table 11). Although the firms’ response rate on questions related to salaries and number of workers was very high, the accuracy of this number should be viewed with some skepticism, having in mind the likelihood of firms underreporting either the number of their workers or their expenditures on wages. Nonetheless, one conclusion which can be drawn with a much higher degree of confidence is that wages are much higher for the workers of small firms than those of micro firms - a logical reflection of wider operational scales, technological sophisti-cation, turnover and workforce skills.
Table 11: Average monthly salary in 2012, by firm size
Company size Average monthly salary (€)
Micro 282
Small 338
Total (Micro and small) 296
Source: UNDP Survey, 2013
Perhaps unsurprisingly, due to the physical nature of the industry’s processing tasks, the sector’s workforce is overwhelmingly dominated by men. As illustrated by Figure 13, 95% of the sector’s workforce are men and only 5% are women. The gender imbalance in the sector’s workforce is substantially higher than the gender imbalance of the total employed population in Kosovo, where 79% of those who are employed are men and 21% are women.
0 10 20 30
55
33 30 24 18 9 8
12
5 3 4
4 4 2
0
1
1 0 0
1
0 0
02
0
20
40
60
80
5
16
17
25
29
31
16
16
17
26
32
33
2873
2742
2741
2851
2840
2875
18.75%
29.90%
31.20%
20.10%
0.00% 5.00% 10.00% 15.00% 20.00% 25.00% 30.00% 35.00%
fig.21
fig.15
fig.16
fig.2
fig.3
fig.4
fig.5
fig.6
fig.7
fig.8
fig.9
fig.10
fig.10
9.5%
17.1%
19.7%
20.3%
33.3%
0.0% 10.0% 20.0% 30.0% 40.0%
8%
9%
9%
12%
26%
35%
0% 10% 20% 30% 40%
2731
2875
2745
2811
2722
0
59%
64%
75%
60%
62%
62%
80%
87%
0% 20% 40% 60% 80% 100%
2012
2011
6%
41%
100%
100%
35%
31%
65%
95%
0% 20% 40% 60% 80% 100%
330 392
433
295 319 276
148 145 101 0
100
200
300
400
500
2010 2011 2012
32.1%
47.4%
22.6%
31.5%
0.0% 5.0% 10.0% 15.0% 20.0% 25.0% 30.0% 35.0% 40.0% 45.0% 50.0%
302,844
4,494
0
50,000
100,000
150,000
200,000
250,000
300,000
350,000
13.8%
13.8%
10.7%
61.6%
95%
79%
5%
21%
0% 20% 40% 60% 80% 100%
26%
57%
17%
14%
72%
14%
0% 10% 20% 30% 40% 50% 60% 70% 80%
24%
41%
65%
46%
39%
86%
0% 20% 40% 60% 80% 100%
59.1%
57.3%
97.3%
79.2%
75.0%
100.0%
0.0% 20.0% 40.0% 60.0% 80.0% 100.0% 120.0%
17.1%
28.6%
50.0%
0.0% 20.0% 40.0% 60.0%
6.3
6.5
6.8
7.4
7.5
7.7
8.4
8.7
8.8
8.9
9.2
9.3
9.4
9.7
9.9
10.9
11
0 2 4 6 8 10 12
21%
29%
17%
21%
0% 5% 10% 15% 20% 25% 30% 35%
3.6%
2.9%
40.6%
38.4%
14.5%
0.0% 10.0% 20.0% 30.0% 40.0% 50.0%
3.0%
15.2%
53.8%
24.2%
3.3%
4.9%
17.6%
45.1%
26.5%
5.9%
149 145
100 89
141 136
85 76
7 8 10 10 0
100
200
2010 2011 2012
Micro
Small
Medium
Large
Source: UNDP Survey, 2013

28 | SECTOR PROFILE OF METAL PROCESSING INDUSTRY
Figure 13: Employment by gender in the metal sector SME’s and all sectors in 2012
Sources: Metal sector SME’s (Survey)All sectors: (Kosovo Labor Force Survey 2012)
Those who are employed in Kosovo’s metal processing industry also differ from the total employed population in terms of the level of educational attainment. Com-pared to the total employed population, the metal sector workforce has a substantial-ly higher share of those who have completed secondary education (see Figure 14) and a much lower share of those who have completed tertiary or elementary education. This is once again unsurprising, as most metal workers usually do not require highly sophisticated or detailed theoretical knowledge taught at the tertiary level (with the exception perhaps of lead engineers), but merely a fair amount of technical, practical and logical skills for which high school may often be sufficient (and vocational school optimal).
Figure 14: Level of educational attainment among metal sector workers and the total employed population in 2012
Sources: Metal sector SME’s: UNDP Survey, 2013Total employed population: Kosovo Labor Force Survey, 2012
0 10 20 30
55
33 30 24 18 9 8
12
5 3 4
4 4 2
0
1
1 0 0
1
0 0
02
0
20
40
60
80
5
16
17
25
29
31
16
16
17
26
32
33
2873
2742
2741
2851
2840
2875
18.75%
29.90%
31.20%
20.10%
0.00% 5.00% 10.00% 15.00% 20.00% 25.00% 30.00% 35.00%
fig.21
fig.15
fig.16
fig.2
fig.3
fig.4
fig.5
fig.6
fig.7
fig.8
fig.9
fig.10
fig.10
9.5%
17.1%
19.7%
20.3%
33.3%
0.0% 10.0% 20.0% 30.0% 40.0%
8%
9%
9%
12%
26%
35%
0% 10% 20% 30% 40%
2731
2875
2745
2811
2722
0
59%
64%
75%
60%
62%
62%
80%
87%
0% 20% 40% 60% 80% 100%
2012
2011
6%
41%
100%
100%
35%
31%
65%
95%
0% 20% 40% 60% 80% 100%
330 392
433
295 319 276
148 145 101 0
100
200
300
400
500
2010 2011 2012
32.1%
47.4%
22.6%
31.5%
0.0% 5.0% 10.0% 15.0% 20.0% 25.0% 30.0% 35.0% 40.0% 45.0% 50.0%
302,844
4,494
0
50,000
100,000
150,000
200,000
250,000
300,000
350,000
13.8%
13.8%
10.7%
61.6%
95%
79%
5%
21%
0% 20% 40% 60% 80% 100%
26%
57%
17%
14%
72%
14%
0% 10% 20% 30% 40% 50% 60% 70% 80%
24%
41%
65%
46%
39%
86%
0% 20% 40% 60% 80% 100%
59.1%
57.3%
97.3%
79.2%
75.0%
100.0%
0.0% 20.0% 40.0% 60.0% 80.0% 100.0% 120.0%
17.1%
28.6%
50.0%
0.0% 20.0% 40.0% 60.0%
6.3
6.5
6.8
7.4
7.5
7.7
8.4
8.7
8.8
8.9
9.2
9.3
9.4
9.7
9.9
10.9
11
0 2 4 6 8 10 12
21%
29%
17%
21%
0% 5% 10% 15% 20% 25% 30% 35%
3.6%
2.9%
40.6%
38.4%
14.5%
0.0% 10.0% 20.0% 30.0% 40.0% 50.0%
3.0%
15.2%
53.8%
24.2%
3.3%
4.9%
17.6%
45.1%
26.5%
5.9%
149 145
100 89
141 136
85 76
7 8 10 10 0
100
200
2010 2011 2012
All sectors
Metal sector
Elementary education
Secondary education
Tertiary education
Women Men
Metal sector (SMEs) Total employed population

SECTOR PROFILE OF METAL PROCESSING INDUSTRY | 29
Due to the fact that metal processing has a considerable history in Kosovo, the pool and range of sector-relevant workforce skills are considerable. Nonetheless, the survey finds that 29.5% of sector firms say that the industry does have a shortage of qualified workers. While experienced medium and large firms report little or no diffi-culties with workforce skills, the latter are particularly problematic for small firms (see Figure 15). This may be seen as an indication of the challenge facing ambitious firms that are striving to scale-up and become competitive while overcoming the tradition-al family business model.
Among those firms that say that qualified workers are an issue, 73.2% think that vocational schools do not produce a sufficient number of graduates, whereas 64.9% think that sector workers are expensive. On the other hand, a total of 20.1% of all sec-tor firms (including three out of the five medium and large companies) reported that they do provide at least some degree of training for their workers. The most frequent type of trainings provided are on-the-job trainings.
Figure 15: Share of micro and small firms answering positively (“yes” and “somewhat”) to the fol-lowing question: “Does your industry have a shortage of skilled / qualified workers?”
Source: UNDP Survey, 2013
The survey asked sector firms to name the types of workers that they consider to be lacking in the labor market, based on the International Standard Classification of Occupations. Based on respondent answers, the types of workers that were most frequently mentioned as lacking were plant operators – namely, furnace operators, melters, heat treating operators and drawers. Other most frequently mentioned types of workers are sheet metal workers and machine tool operators. A more extensive list of deficient skills is presented in Table 12.
0 10 20 30
55
33 30 24 18 9 8
12
5 3 4
4 4 2
0
1
1 0 0
1
0 0
02
0
20
40
60
80
5
16
17
25
29
31
16
16
17
26
32
33
2873
2742
2741
2851
2840
2875
18.75%
29.90%
31.20%
20.10%
0.00% 5.00% 10.00% 15.00% 20.00% 25.00% 30.00% 35.00%
fig.21
fig.15
fig.16
fig.2
fig.3
fig.4
fig.5
fig.6
fig.7
fig.8
fig.9
fig.10
fig.10
9.5%
17.1%
19.7%
20.3%
33.3%
0.0% 10.0% 20.0% 30.0% 40.0%
8%
9%
9%
12%
26%
35%
0% 10% 20% 30% 40%
2731
2875
2745
2811
2722
0
59%
64%
75%
60%
62%
62%
80%
87%
0% 20% 40% 60% 80% 100%
2012
2011
6%
41%
100%
100%
35%
31%
65%
95%
0% 20% 40% 60% 80% 100%
330 392
433
295 319 276
148 145 101 0
100
200
300
400
500
2010 2011 2012
32.1%
47.4%
22.6%
31.5%
0.0% 5.0% 10.0% 15.0% 20.0% 25.0% 30.0% 35.0% 40.0% 45.0% 50.0%
302,844
4,494
0
50,000
100,000
150,000
200,000
250,000
300,000
350,000
13.8%
13.8%
10.7%
61.6%
95%
79%
5%
21%
0% 20% 40% 60% 80% 100%
26%
57%
17%
14%
72%
14%
0% 10% 20% 30% 40% 50% 60% 70% 80%
24%
41%
65%
46%
39%
86%
0% 20% 40% 60% 80% 100%
59.1%
57.3%
97.3%
79.2%
75.0%
100.0%
0.0% 20.0% 40.0% 60.0% 80.0% 100.0% 120.0%
17.1%
28.6%
50.0%
0.0% 20.0% 40.0% 60.0%
6.3
6.5
6.8
7.4
7.5
7.7
8.4
8.7
8.8
8.9
9.2
9.3
9.4
9.7
9.9
10.9
11
0 2 4 6 8 10 12
21%
29%
17%
21%
0% 5% 10% 15% 20% 25% 30% 35%
3.6%
2.9%
40.6%
38.4%
14.5%
0.0% 10.0% 20.0% 30.0% 40.0% 50.0%
3.0%
15.2%
53.8%
24.2%
3.3%
4.9%
17.6%
45.1%
26.5%
5.9%
149 145
100 89
141 136
85 76
7 8 10 10 0
100
200
2010 2011 2012
Small Micro
Yes + Somewhat
Somewhat
Yes

30 | SECTOR PROFILE OF METAL PROCESSING INDUSTRY
Table 12: Professionals that were most frequently mentioned as lacking in the labor market (in order of frequency mentioned, according to the International Standard Classification of Occupations)
Metal processing plant operator
Sheet metal worker
Machine tool operator
Metal wheel grinder
Polishers and tool sharpeners
Riggers and cable splicers
Structural Metal Prepares
Welders and Flamecutters
Source: UNDP Survey, 2013
Box 3: Kosovo’s labour market legislation in a nutshell
Highly flexible. Progressive income tax rate: 0-10%. Employer contributes 5% of total wage to employee pension. Minimum wage is €170 for those over 35 years and €130 for those aged under 35. Key legislation: Law on Labour (No. 03/L-212) and Law on Occupational Health and Safety (No. 04/L-161)

SECTOR PROFILE OF METAL PROCESSING INDUSTRY | 31
6. Assets and investmentsThe survey data create a valuable opportunity to asses the value of assets (land,
buildings and technology) possessed by micro and small firms in the industry as well as to identify relevant investment trends in 2012. Data on assets and investment activity for the five medium and large firms was not made available. As illustrated by Figure 16, the majority of micro and small firms said that they did own land and buildings, and almost all companies (100% of small firms) stated that they did pos-sess some technology in their asset pool. Unsurprisingly, both the share of asset own-ership and the average value of assets owned are higher among smaller firms than micro ones. For example, 79.2% of small firms report that they own land, compared to 59.1% of micro firms. The average value of land owned by small firms stands at €436,542, whereas for micro ones it is €137,888 (see Table 12).
Figure 16: Share of micro and small firms owning assets in 2012
Source: UNDP Survey, 2013
Based on firm self-reporting in the survey, the total value of all assets (land, build-ings and technology) owned by micro and small firms in 2012 is estimated to have been €70,6 million (see Table 12). The biggest share in the value of the total estimated assets owned is captured by land (€ 26,2 million), followed by technology (€ 24,3 mil-lion) and buildings (€20,1 million). These numbers were derived by multiplying the average value of assets owned per firm with the estimated total population of firms which own such assets.
0 10 20 30
55
33 30 24 18 9 8
12
5 3 4
4 4 2
0
1
1 0 0
1
0 0
02
0
20
40
60
80
5
16
17
25
29
31
16
16
17
26
32
33
2873
2742
2741
2851
2840
2875
18.75%
29.90%
31.20%
20.10%
0.00% 5.00% 10.00% 15.00% 20.00% 25.00% 30.00% 35.00%
fig.21
fig.15
fig.16
fig.2
fig.3
fig.4
fig.5
fig.6
fig.7
fig.8
fig.9
fig.10
fig.10
9.5%
17.1%
19.7%
20.3%
33.3%
0.0% 10.0% 20.0% 30.0% 40.0%
8%
9%
9%
12%
26%
35%
0% 10% 20% 30% 40%
2731
2875
2745
2811
2722
0
59%
64%
75%
60%
62%
62%
80%
87%
0% 20% 40% 60% 80% 100%
2012
2011
6%
41%
100%
100%
35%
31%
65%
95%
0% 20% 40% 60% 80% 100%
330 392
433
295 319 276
148 145 101 0
100
200
300
400
500
2010 2011 2012
32.1%
47.4%
22.6%
31.5%
0.0% 5.0% 10.0% 15.0% 20.0% 25.0% 30.0% 35.0% 40.0% 45.0% 50.0%
302,844
4,494
0
50,000
100,000
150,000
200,000
250,000
300,000
350,000
13.8%
13.8%
10.7%
61.6%
95%
79%
5%
21%
0% 20% 40% 60% 80% 100%
26%
57%
17%
14%
72%
14%
0% 10% 20% 30% 40% 50% 60% 70% 80%
24%
41%
65%
46%
39%
86%
0% 20% 40% 60% 80% 100%
59.1%
57.3%
97.3%
79.2%
75.0%
100.0%
0.0% 20.0% 40.0% 60.0% 80.0% 100.0% 120.0%
17.1%
28.6%
50.0%
0.0% 20.0% 40.0% 60.0%
6.3
6.5
6.8
7.4
7.5
7.7
8.4
8.7
8.8
8.9
9.2
9.3
9.4
9.7
9.9
10.9
11
0 2 4 6 8 10 12
21%
29%
17%
21%
0% 5% 10% 15% 20% 25% 30% 35%
3.6%
2.9%
40.6%
38.4%
14.5%
0.0% 10.0% 20.0% 30.0% 40.0% 50.0%
3.0%
15.2%
53.8%
24.2%
3.3%
4.9%
17.6%
45.1%
26.5%
5.9%
149 145
100 89
141 136
85 76
7 8 10 10 0
100
200
2010 2011 2012
Small Micro
% own technology
% own buildings
% own land

32 | SECTOR PROFILE OF METAL PROCESSING INDUSTRY
Table 13: Estimated total value of assets owned in 2012 by all micro and small firms
Firm sizeEstimated total
value of land owned (€)
Estimated total value of buildings
owned (€)
Estimated total value of technolo-
gy owned (€)
Estimated total value of assets owned
(€)
Micro 14,399,644 8,635,803 8,575,576 31,611,023
Small 11,786,634 11,471,325 15,717,928 38,975,887
Micro + Small 26,186, 278 20,107,128 24,293,504 70,586,910
Source: UNDP Survey, 2013
The total sector-wide values of assets owned might not give much insight on the level of the firms’ technological advancement. Since the key ingredient in metal pro-cessing operations is the possession of technology (i.e machinery, tools, etc), a better way to understand the level of firm sophistication might be to estimate the ratio be-tween the average value of real-estate owned (land and buildings) and the average value of technology possessed per firm (see Table 13). For micro firms which stated that they owned real-estate (land and buildings), their value is much higher than the value of the technology possessed by a ratio of 4.5 to 1. For small firms, on the other hand, the most valuable asset in their pool is technology. The average value of tech-nology owned per small firm estimated at €462,292 whereas the real-estate to tech-nology ratio is 2:1. These ratios illustrate small firms’ higher degree of mechanization and technological sophistication.
Table 14: Micro and small firm assets in 2012 (average and ratio)
Firm sizeAverage value of land owned
(€)
Average value of buildings owned
(€)
Average value of technology
owned (€)
Real-estate (land + buildings) to
technology ratio
Micro 137,888 87,137 49,858 4.5 : 1
Small 436,542 458,853 462,292 2 : 1
Source: UNDP Survey, 2013
There are positive trends in the sector as far as investment in assets is concerned, particularly investments in technology. Survey data indicate that between the years of 2011 and 2012, the total value of all assets in the micro and small section of the sector increased by 3.9% (see Table 15). Most importantly, the largest increase, 10.3%, was witnessed in the value of technology possessed. It is also interesting to note that ownership of buildings decreased by 4.3%. A closer look at the data shows that this decrease was largely caused by the sale of valuable buildings by a couple of small firms, some of which at the same time also report to have increased their investments in technology.

SECTOR PROFILE OF METAL PROCESSING INDUSTRY | 33
Table 15: Year-on-year change in the total value of assets owned by micro and small firms, by type of asset
Type of asset Year-on-year % change in value owned (2011 to 2012)
Land 5.3 %
Building - 4.3 %
Technology 10.3 %
All assets 3.9%
Source: UNDP Survey, 2013
In total, 19.7% of sector firms report to have made capital investments in 2012. The increase in the total value of assets was largely driven by the investments of small firms. As illustrated by Figure 17, 28.6% of small firms report to have made invest-ments in 2012 that were worth, on average, €72,500. On the other hand, 17.1% of micro firms also invested an average amount of €9,016. One medium-sized firm re-ported to have invested €150,000. Almost all of the firms that invested said that they had upgraded their technology, by purchasing new machinery and assembly lines.
Figure 17: Share of firms that invested in 2012; Average value of investment
Source: UNDP Survey, 2013
Survey data confirm that metal mining and processing operations are generally capital-intensive due to the high costs of purchasing and maintaining machinery and, depending on scale, the physical space required for operations. For example, small firms which own assets in Kosovo report that, in 2012, they owned on average land worth €437,000, buildings worth €459,000, and technology worth €462,000. On the other hand, yearly labor costs and turnover were estimated at €74,000 and €338,000 respectively. The turnover figure should be taken as merely indicative due to likely underreporting. Nevertheless, even with a high degree of underreporting (say, 30%), it is clear that the capital intensity of operations would still be very high.
0 10 20 30
55
33 30 24 18 9 8
12
5 3 4
4 4 2
0
1
1 0 0
1
0 0
02
0
20
40
60
80
5
16
17
25
29
31
16
16
17
26
32
33
2873
2742
2741
2851
2840
2875
18.75%
29.90%
31.20%
20.10%
0.00% 5.00% 10.00% 15.00% 20.00% 25.00% 30.00% 35.00%
�g.21
�g.15
�g.16
�g.2
�g.3
�g.4
�g.5
�g.6
�g.7
�g.8
�g.9
�g.10
�g.10
9.5%
17.1%
19.7%
20.3%
33.3%
0.0% 10.0% 20.0% 30.0% 40.0%
8%
9%
9%
12%
26%
35%
0% 20%10% 40% 50% 60%30%
2731
2875
2745
2781
2722
59%
64%
75%
60%
62%
62%
80%
87%
0% 20% 40% 60% 80% 100%
2012
2011
6%
41%
100%
100%
35%
31%
65%
95%
0% 20% 40% 60% 80% 100%
330 392
433
295 319 276
148 145 101 0
100
200
300
400
500
2010 2011 2012
32.1%
47.4%
22.6%
31.5%
0.0% 5.0% 10.0% 15.0% 20.0% 25.0% 30.0% 35.0% 40.0% 45.0% 50.0%
302,844
4,494
0
50,000
100,000
150,000
200,000
250,000
300,000
350,000
13.8%
13.8%
10.7%
61.6%
95%
79%
5%
21%
0% 20% 40% 60% 80% 100%
26%
57%
17%
14%
72%
14%
0% 10% 20% 30% 40% 50% 60% 70% 80%
24%
41%
65%
46%
39%
86%
0% 20% 40% 60% 80% 100%
59.1%
57.3%
97.3%
79.2%
75.0%
100.0%
0.0% 20.0% 40.0% 60.0% 80.0% 100.0% 120.0%
17.1%
28.6%
50.0%
6.3
6.5
6.8
7.4
7.5
7.7
8.4
8.7
8.8
8.9
9.2
9.3
9.4
9.7
9.9
10.9
11
0 2 4 6 8 10 12
21%
29%
17%
21%
0% 5% 10% 15% 20% 25% 30% 35%
3.6%
2.9%
40.6%
38.4%
14.5%
0.0% 10.0% 20.0% 30.0% 40.0% 50.0%
3.0%
15.2%
53.8%
24.2%
3.3%
4.9%
17.6%
45.1%
26.5%
5.9%
149 145
100 89
141 136
85 76
7 8 10 10 0
100
200
2010 2011 2012
0% 20%10% 40% 50% 60%30%
Medium
Small
Micro
---> € 150,000
---> € 72,500
---> € 9,016

34 | SECTOR PROFILE OF METAL PROCESSING INDUSTRY
Table 16: Average value of firm assets, labor costs and turnover in 2012
Firm size
Land owned(average of those that
own, €)
Buildings owned (aver-age of those that own, €)
Technology owned
(average of those that
own, €)
Yearly labor costs (aver-
age)
Yearly turnover(average)
Micro 137,888 87,137 49,858 16,764 53,220
Small 436,542 458,853 462,292 73,750 337,803
Source: UNDP Survey, 2013
An important component in the technological advancement of sector firms are innovations in the production process, marketing and management, as well as po-tential investments in R&D. The surveyed companies do not report to have made any substantial changes with regard to organizational structures and marketing efforts, while only a small share report to have made changes to their production processes.

SECTOR PROFILE OF METAL PROCESSING INDUSTRY | 35
7. Business EnvironmentThe survey assessed the metal processing firms’ degree of satisfaction and dis-
satisfaction with the business environment in Kosovo. Surveyed firms were asked to assess, on a scale from 0 to 17 - with 0 representing the minimal value and 17 the maximal value – whether a particular issue or institution represented an impediment or barrier to their business operations. The average scores for each of the issues are presented in graphical form in Figure 18.
Metal processing firms in Kosovo seem to be generally satisfied with business registration procedures, local infrastructure and access to land. The average score for these issues is around 6 points on the scale – sufficiently below the median value of 8.5. This is perhaps not that surprising taking into account the successful implemen-tation of reforms on business registration procedures during the last couple of years, as well as the large amount of public or donor funds that were spent on local public infrastructure projects since 1999. Other issues that score lower than the median val-ue in the scale are the cost and quality of labor (a bigger problem only for small firms), and the efficiency of the judicial system.
Figure 18: Business barriers (average scores, on a scale from 0-17 – 0 minimal, 17 maximal)
Source: UNDP Survey, 2013
0 10 20 30
55
33 30 24 18 9 8
12
5 3 4
4 4 2
0
1
1 0 0
1
0 0
02
0
20
40
60
80
5
16
17
25
29
31
16
16
17
26
32
33
2873
2742
2741
2851
2840
2875
18.75%
29.90%
31.20%
20.10%
0.00% 5.00% 10.00% 15.00% 20.00% 25.00% 30.00% 35.00%
fig.21
fig.15
fig.16
fig.2
fig.3
fig.4
fig.5
fig.6
fig.7
fig.8
fig.9
fig.10
fig.10
9.5%
17.1%
19.7%
20.3%
33.3%
0.0% 10.0% 20.0% 30.0% 40.0%
8%
9%
9%
12%
26%
35%
0% 10% 20% 30% 40%
2731
2875
2745
2811
2722
0
59%
64%
75%
60%
62%
62%
80%
87%
0% 20% 40% 60% 80% 100%
2012
2011
6%
41%
100%
100%
35%
31%
65%
95%
0% 20% 40% 60% 80% 100%
330 392
433
295 319 276
148 145 101 0
100
200
300
400
500
2010 2011 2012
32.1%
47.4%
22.6%
31.5%
0.0% 5.0% 10.0% 15.0% 20.0% 25.0% 30.0% 35.0% 40.0% 45.0% 50.0%
302,844
4,494
0
50,000
100,000
150,000
200,000
250,000
300,000
350,000
13.8%
13.8%
10.7%
61.6%
95%
79%
5%
21%
0% 20% 40% 60% 80% 100%
26%
57%
17%
14%
72%
14%
0% 10% 20% 30% 40% 50% 60% 70% 80%
24%
41%
65%
46%
39%
86%
0% 20% 40% 60% 80% 100%
59.1%
57.3%
97.3%
79.2%
75.0%
100.0%
0.0% 20.0% 40.0% 60.0% 80.0% 100.0% 120.0%
17.1%
28.6%
50.0%
0.0% 20.0% 40.0% 60.0%
6.3
6.5
6.8
7.4
7.5
7.7
8.4
8.7
8.8
8.9
9.2
9.3
9.4
9.7
9.9
10.9
11
0 2 4 6 8 10 12
21%
29%
17%
21%
0% 5% 10% 15% 20% 25% 30% 35%
3.6%
2.9%
40.6%
38.4%
14.5%
0.0% 10.0% 20.0% 30.0% 40.0% 50.0%
3.0%
15.2%
53.8%
24.2%
3.3%
4.9%
17.6%
45.1%
26.5%
5.9%
149 145
100 89
141 136
85 76
7 8 10 10 0
100
200
2010 2011 2012
Low purchasing power in the domestic market
Competition from the informal sector
Access to credit
High taxes
High level of corruption
Electricity (cost and supply)
Cost of raw materials and intermediaries
Access to technology / equipment
Inneficiency of Customs
Inneficency of Tax Administration
Quality of raw materials and intermediaries
Judicial System
Workforce Skills
Cost of labour
Local Infrastructure
Access to Land
Difficulty in registering business

36 | SECTOR PROFILE OF METAL PROCESSING INDUSTRY
As the chart illustrates, the biggest challenge that firms reported to be facing is the low demand for their products in the domestic market. The low purchasing power in the domestic market has an average score of 11 points on the scale. Having in mind that metal imports have been steadily increasing over the years and that economic growth has been positive, this concern expressed by firms might be a sign that the domestic market is saturated for the current structure of domestic output, with too many firms selling the same goods and services, and that firm growth may not be possible without diversification of products / services tailored towards the domestic market and/or expansion towards foreign markets. The other top barrier mentioned by surveyed firms is competition from the informal sector. The average score for this issue was 10.9.
One matter of concern, particularly impeding needed investments in technology,
is the cost of financing. This issue received an average score of 9.9 in the survey. The high cost of financing in Kosovo across all sectors is a well-known fact and is con-firmed by other sources. As of October 2013, the Central Bank of Kosovo reported that average effective interest rate on new loans was 11.72%.2 On the other hand, the effective interest rate on investment loans up to five years was lower, at 10.21%. Most metal processing firms generally consider the cost of financing to be either very high (24.6%) or high (21.4%), with small firms leading the way in terms of dissatisfaction.
Figure 19: “How would you best describe the cost of financing for your sector?” (Micro and small firms)
Source: UNDP Survey, 2013
Another issue for which firm dissatisfaction is quite high is the level of taxation. It received an average score of 9.7. A list of generic taxes, which are also relevant to the metal processing sector, are listed in the box below. A more sector-specific tax – roy-alty fees for mining - is also included. A majority of the sector’s micro and small firms view the level of taxation as being either very high (14.5%) or high (38.4%). A very small share think that taxes are low (2.9%) or very low (3.6%).
2 Central Bank of Kosovo. “Monthly Statistics Bulletin (No. 146)”, October 2013.
0 10 20 30
55
33 30 24 18 9 8
12
5 3 4
4 4 2
0
1
1 0 0
1
0 0
02
0
20
40
60
80
5
16
17
25
29
31
16
16
17
26
32
33
2873
2742
2741
2851
2840
2875
18.75%
29.90%
31.20%
20.10%
0.00% 5.00% 10.00% 15.00% 20.00% 25.00% 30.00% 35.00%
fig.21
fig.15
fig.16
fig.2
fig.3
fig.4
fig.5
fig.6
fig.7
fig.8
fig.9
fig.10
fig.10
9.5%
17.1%
19.7%
20.3%
33.3%
0.0% 10.0% 20.0% 30.0% 40.0%
8%
9%
9%
12%
26%
35%
0% 10% 20% 30% 40%
2731
2875
2745
2811
2722
0
59%
64%
75%
60%
62%
62%
80%
87%
0% 20% 40% 60% 80% 100%
2012
2011
6%
41%
100%
100%
35%
31%
65%
95%
0% 20% 40% 60% 80% 100%
330 392
433
295 319 276
148 145 101 0
100
200
300
400
500
2010 2011 2012
32.1%
47.4%
22.6%
31.5%
0.0% 5.0% 10.0% 15.0% 20.0% 25.0% 30.0% 35.0% 40.0% 45.0% 50.0%
302,844
4,494
0
50,000
100,000
150,000
200,000
250,000
300,000
350,000
13.8%
13.8%
10.7%
61.6%
95%
79%
5%
21%
0% 20% 40% 60% 80% 100%
26%
57%
17%
14%
72%
14%
0% 10% 20% 30% 40% 50% 60% 70% 80%
24%
41%
65%
46%
39%
86%
0% 20% 40% 60% 80% 100%
59.1%
57.3%
97.3%
79.2%
75.0%
100.0%
0.0% 20.0% 40.0% 60.0% 80.0% 100.0% 120.0%
17.1%
28.6%
50.0%
0.0% 20.0% 40.0% 60.0%
6.3
6.5
6.8
7.4
7.5
7.7
8.4
8.7
8.8
8.9
9.2
9.3
9.4
9.7
9.9
10.9
11
0 2 4 6 8 10 12
21%
29%
17%
21%
0% 5% 10% 15% 20% 25% 30% 35%
3.6%
2.9%
40.6%
38.4%
14.5%
0.0% 10.0% 20.0% 30.0% 40.0% 50.0%
3.0%
15.2%
53.8%
24.2%
3.3%
4.9%
17.6%
45.1%
26.5%
5.9%
149 145
100 89
141 136
85 76
7 8 10 10 0
100
200
2010 2011 2012
High Very High
Small
Micro

SECTOR PROFILE OF METAL PROCESSING INDUSTRY | 37
Figure 20: “How would you best describe the level of taxes?” (Micro and small firms)
Source: UNDP Survey, 2013
Just like many businesses from other sectors, metal processing firms have a high degree of interaction with government bodies, either as subjects of their regulatory or revenue collecting functions, or as suppliers of goods and services through public procurement contracts. The box below presents a brief list of some of the institutions, laws and regulations as well licenses and permits that are more directly related to the metal processing sector, without those that are generic and relevant across all economic sectors.
Box 4: Taxes pertaining to the sector
Royalties for mining of metallic minerals: 5% for kg of mined silver, gold, plati-noid minerals and platinum ores; 4.5% for kg of other metallic ores.
Corporate tax: 3-10% on income between €5,000 – €50,000; 10% on income higher than €50,000
Value Added Tax: 16% on all goods and services
Personal income tax (progressive): 0-10 %
0 10 20 30
55
33 30 24 18 9 8
12
5 3 4
4 4 2
0
1
1 0 0
1
0 0
02
0
20
40
60
80
5
16
17
25
29
31
16
16
17
26
32
33
2873
2742
2741
2851
2840
2875
18.75%
29.90%
31.20%
20.10%
0.00% 5.00% 10.00% 15.00% 20.00% 25.00% 30.00% 35.00%
fig.21
fig.15
fig.16
fig.2
fig.3
fig.4
fig.5
fig.6
fig.7
fig.8
fig.9
fig.10
fig.10
9.5%
17.1%
19.7%
20.3%
33.3%
0.0% 10.0% 20.0% 30.0% 40.0%
8%
9%
9%
12%
26%
35%
0% 10% 20% 30% 40%
2731
2875
2745
2811
2722
0
59%
64%
75%
60%
62%
62%
80%
87%
0% 20% 40% 60% 80% 100%
2012
2011
6%
41%
100%
100%
35%
31%
65%
95%
0% 20% 40% 60% 80% 100%
330 392
433
295 319 276
148 145 101 0
100
200
300
400
500
2010 2011 2012
32.1%
47.4%
22.6%
31.5%
0.0% 5.0% 10.0% 15.0% 20.0% 25.0% 30.0% 35.0% 40.0% 45.0% 50.0%
302,844
4,494
0
50,000
100,000
150,000
200,000
250,000
300,000
350,000
13.8%
13.8%
10.7%
61.6%
95%
79%
5%
21%
0% 20% 40% 60% 80% 100%
26%
57%
17%
14%
72%
14%
0% 10% 20% 30% 40% 50% 60% 70% 80%
24%
41%
65%
46%
39%
86%
0% 20% 40% 60% 80% 100%
59.1%
57.3%
97.3%
79.2%
75.0%
100.0%
0.0% 20.0% 40.0% 60.0% 80.0% 100.0% 120.0%
17.1%
28.6%
50.0%
0.0% 20.0% 40.0% 60.0%
6.3
6.5
6.8
7.4
7.5
7.7
8.4
8.7
8.8
8.9
9.2
9.3
9.4
9.7
9.9
10.9
11
0 2 4 6 8 10 12
21%
29%
17%
21%
0% 5% 10% 15% 20% 25% 30% 35%
3.6%
2.9%
40.6%
38.4%
14.5%
0.0% 10.0% 20.0% 30.0% 40.0% 50.0%
3.0%
15.2%
53.8%
24.2%
3.3%
4.9%
17.6%
45.1%
26.5%
5.9%
149 145
100 89
141 136
85 76
7 8 10 10 0
100
200
2010 2011 2012
Box 5: Key institutions relevant to the sector
Ministry of Economic Development
Independent Commission for Mines and Minerals
Ministry of Trade and Industry
Ministry of Finance
Association of Metal Processors
Very High
High
Neutral
Low
Very Low

38 | SECTOR PROFILE OF METAL PROCESSING INDUSTRY
The Ministry of Economic Development is the primary governmental actor in-volved in drafting policy and legislation related to mining, including here (together with the Ministry of Finance) a key role in establishing and reviewing royalties sched-ules. The Independent Commission on Mines and Minerals is the main regulatory agency, issuing and inspecting mining and exploration licenses (see full list of licens-es in the box below). An important role in policy-making, provision of various forms of support and market surveillance is played by the Ministry of Trade and Industry.
The main pieces of legislation regulating the mining component of the sector are the Law on Mining and Minerals, and the Law on the Establishment of the Inde-pendent Commission on Mines and Minerals. Besides other generic legislation rele-vant across economic sectors, other more specific laws that directly affect the metal processing sector are the Laws on Precious Metal Works, Precious Metal Products and Construction Products. One particularly important government decision, approved by Parliament in May 2012, is the List of Mining Royalties.
Box 6: Licenses and permits directly related to the sector
As stipulated in the Law on Mines and Minerals:Exploration License,Retention License,Mining License,Artisanal Mining License.
Box 7: Relevant legislation
� Law on Mines and Minerals (Law No. 03/L – 163) � Law 2005/2 on the Establishment of the Independent Commission for
Mines and Minerals � Law on Amending UNMIK Regulation No. 2005/2 on the Establishment
of the Independent Commission for Mines and Minerals � Law on Construction Products (Law No. 04-L181) � Law on Precious Metal Products (2004/28) � Law on Precious metal works (Law No. 04-L-154) � List of Mining Royalties (approved by Kosovo Parliament on May 12 2012) � Law on Goods Exempt From Custom Tax and Goods with Zero Rate of
the Custom Tax (No. 04/L-163)

SECTOR PROFILE OF METAL PROCESSING INDUSTRY | 39
As Figure 18 illustrates, sector firms seem to be quite dissatisfied with the level of corruption in governing institutions, as this issue received an average score of 9.4 (significantly above the median value of 8.5). Dissatisfaction is also just above the median value on questions related to the efficiency of revenue collecting agencies, namely the Kosovo Customs (average score of 8.8) and the Kosovo Tax Administration (average score 8.7). As Figure 21 illustrates, the largest share of firms evaluate the ef-ficiency of these two institutions as being average (53.8% for Tax Administration and 45.1% for the Kosovo Customs). Dissatisfaction with the efficacy of the judicial system in ensuring rule of law (see Figure 18) is somewhat lower than with other institutions - receiving an average score of 7.7 on the 17 point scale, but nonetheless remains high.
Figure 21: “How would you rate the efficiency of the Tax Administration and Kosovo Customs
Source: UNDP Survey, 2013
So far there have been no government measures or incentives directly targeting the metal processing sector. Nonetheless, there are several incentives in place whose aim is to support local manufacturers in general and which are relevant for metal processing companies as well. They have recently been bundled into one single law – namely the Law on Goods Except from Custom Tax and Goods with Zero Rate of the Custom Tax. The most important incentive in this direction is the 0% customs duty for the import of machinery and raw materials that are destined for further processing by manufacturing firms. Another incentive in place is a special tax deduction allowance which reduces by 10% of the cost of acquisition of heavy equipment (production lines for plant & machinery) and heavy transport vehicles.
0 10 20 30
55
33 30 24 18 9 8
12
5 3 4
4 4 2
0
1
1 0 0
1
0 0
02
0
20
40
60
80
5
16
17
25
29
31
16
16
17
26
32
33
2873
2742
2741
2851
2840
2875
18.75%
29.90%
31.20%
20.10%
0.00% 5.00% 10.00% 15.00% 20.00% 25.00% 30.00% 35.00%
fig.21
fig.15
fig.16
fig.2
fig.3
fig.4
fig.5
fig.6
fig.7
fig.8
fig.9
fig.10
fig.10
9.5%
17.1%
19.7%
20.3%
33.3%
0.0% 10.0% 20.0% 30.0% 40.0%
8%
9%
9%
12%
26%
35%
0% 10% 20% 30% 40%
2731
2875
2745
2811
2722
0
59%
64%
75%
60%
62%
62%
80%
87%
0% 20% 40% 60% 80% 100%
2012
2011
6%
41%
100%
100%
35%
31%
65%
95%
0% 20% 40% 60% 80% 100%
330 392
433
295 319 276
148 145 101 0
100
200
300
400
500
2010 2011 2012
32.1%
47.4%
22.6%
31.5%
0.0% 5.0% 10.0% 15.0% 20.0% 25.0% 30.0% 35.0% 40.0% 45.0% 50.0%
302,844
4,494
0
50,000
100,000
150,000
200,000
250,000
300,000
350,000
13.8%
13.8%
10.7%
61.6%
95%
79%
5%
21%
0% 20% 40% 60% 80% 100%
26%
57%
17%
14%
72%
14%
0% 10% 20% 30% 40% 50% 60% 70% 80%
24%
41%
65%
46%
39%
86%
0% 20% 40% 60% 80% 100%
59.1%
57.3%
97.3%
79.2%
75.0%
100.0%
0.0% 20.0% 40.0% 60.0% 80.0% 100.0% 120.0%
17.1%
28.6%
50.0%
0.0% 20.0% 40.0% 60.0%
6.3
6.5
6.8
7.4
7.5
7.7
8.4
8.7
8.8
8.9
9.2
9.3
9.4
9.7
9.9
10.9
11
0 2 4 6 8 10 12
21%
29%
17%
21%
0% 5% 10% 15% 20% 25% 30% 35%
3.6%
2.9%
40.6%
38.4%
14.5%
0.0% 10.0% 20.0% 30.0% 40.0% 50.0%
3.0%
15.2%
53.8%
24.2%
3.3%
4.9%
17.6%
45.1%
26.5%
5.9%
149 145
100 89
141 136
85 76
7 8 10 10 0
100
200
2010 2011 2012
Very efficient
Efficient
Average
Inefficient
Very inefficient
Very efficient
Efficient
Average
Inefficient
Very inefficient
Tax Administration
Kosovo Customs

40 | SECTOR PROFILE OF METAL PROCESSING INDUSTRY
Manufacturers also have the possibility of deferring the payment of the Value Added Tax on imported plants and machinery for up to six months, in order to allow the plants to become operational before the tax is paid.
An important component of the business environment is the legislative frame-work regarding industrial property, which is generic and relevant across business sec-tors and as such impacts the metal processing sector as well. To this end, Industrial Property Rights are administered and registered at the Industrial Property Agency within the Ministry of Trade and Industry.
Trademarks: are regulated by the Law on Trademarks (Law No. 04/L-026). The right holder of a registered trademark will, after registration, have exclusive rights in rela-tion to the goods and services covered by the registration. The holder of trademark shall be entitled to prevent third parties to use without his permission. In particular, these rights are: to use the trademark, to authorize another to use the trademark or to obtain legal remedy for a violation of the trademark. Trademark is registered for a period of 10 years and can be renewed for an unlimited time.
Industrial design: is regulated by the Law on Industrial Design (Law No.04/L – 028). By industrial design right is protected the design to the extent that is new and has individual character. Protection of industrial design lasts 5 years and can be ex-tended to a maximum of 25 years.
Patents: are regulated by the Law on Patents (Law No. 04/L-029). A patent shall be granted for any invention, in any field of technology that is new, involves an inventive step and is susceptible in the industry. A patent right is granted for the duration of 20 years.

SECTOR PROFILE OF METAL PROCESSING INDUSTRY | 41
8. ConclusionThe metal processing industry is an industry with a considerable history and tra-
dition in Kosovo, especially in the mining and basic processing of Kosovo’s main metal ore reserves, as well as the production of end-use products such as tubes or radiators. While the traditional industrial giants have gone through a restructuring and privat-ization process (with the noted exception of Trepça/Trepča, many new companies have emerged and grown in the post-1999 period in response to growing demand from the booming construction sector.
The data generated from the survey indicate that the sector has reached a sat-uration point with the current structure of output and that it might expand only if this structure is diversified and sees improvements in quality. This would enable the substitution of a share of the high amount of metal imports or the higher penetration into export markets. There are positive signs that some sector firms are investing in new machinery and making use of fiscal incentives that are in place, which should improve efficiency and product quality. But there are several important barriers still ahead.
From a policy perspective, the types of companies that would need greater atten-tion are the group of 34 small sized firms which are trying to make the jump from the traditional family businesses model and into large-scale and efficiency-based opera-tions. These companies already have substantial production experience, scale and an interest to become exporters. As such they could not only drive the sector’s growth in the future, but could also potentially become significant job-creators in an otherwise capital-intensive sector.
Nonetheless, these companies face several difficulties that impede investment, especially high interest rates and the rule of law. Ensuring higher product quality and entry into higher value added production also requires more sophisticated and niche labour force skills, and survey data confirms that the latter are especially problemat-ic for small firms. Networking and quality standards are other areas where support might be needed due to the high degree of business-to-business sales and high reg-ulatory standards in EU markets (e.g. for construction products).

www.mti-ks.orgMarch 2014
MINISTARSTVO ZA TRGOVINU I INDUSTRIJU
METAL PROCESSING INDUSTRYSECTOR PROFILE OF