Embed Size (px)
Citation preview

SECTIONSEVEN Flood Risk Analysis
Y:\DRMS\PUBLIC DRAFT\RISK ANALYSIS REPORT\SECTION 7\SECTION 7 DRAFT 2 (06-25-07).DOC 7-1
7. Section 7 SEVEN Flood Risk Analysis
This section presents a framework for the flood risk analysis and also presents a brief discussion on flood vulnerability analysis and results. The flood vulnerability of the Delta and Suisun Marsh levees were assessed for a series of flood scenarios. More detailed information on levee vulnerability analysis is presented in the Levee Vulnerability Technical Memorandum. For each flood scenario, the corresponding flood stage was computed using the hydrological model developed for the site. Each flood scenario was defined using a parameter, daily Total Delta Inflow (TDI), in cfs. The frequency of major flood inflows, the patterns of inflows from the various rivers, and Delta water surface elevations associated with these flows are all critical in determining flood risk.
7.1 DELTA INFLOW Average daily inflows into the Delta are available from the DWR website for the 50 water years (WYs) from October 1, 1955, through September 30, 2005 (WYs 1956 through 2005). These data include average daily inflows for all major streams entering the Delta and the total inflow into the Delta (DWR 2006). The major streams or stream groups included in the dataset are Sacramento River, Yolo Bypass, Cosumnes River, Mokelumne River, San Joaquin River, and miscellaneous streams. Flows in miscellaneous streams are primarily Calaveras River flows. The locations of the stations used in the analysis are shown on Figure 7-1. Measured average daily inflows into the Delta are summarized graphically on Figure 7-2. Figure 7-2a presents total inflows into the Delta for the period of record. Figure 7-2b presents inflows from Sacramento River and Yolo Bypass, the major contributors to total inflow (>80 percent). Figure 7-2c presents inflows from San Joaquin River, the third-largest contributor to total inflow (~10 percent).
One of the objectives of these studies is to develop estimates of hydrologic characteristics of the Delta under current conditions in the tributary watersheds. Thus, it was necessary to examine the available Delta inflow data to determine if these data adequately reflect current watershed conditions or if the statistical characteristics of the data have significantly changed during the period of recorded data due to new reservoirs in the watersheds, developments in the watershed, land use changes, and other factors.
As shown on Figure 7-2, the period from about 1987 to 1993 had relatively fewer large flood inflow events than before 1987. This 6-year period had below-average precipitation and is the longest period of below-average rainfall between 1955 and 2005. This pattern suggests that during the 50-year period of record, more drought years occurred in the recent period of record than in earlier years. It is therefore desirable to use the entire period of available inflow record to avoid or reduce any statistical bias caused by the recent drought years.
Several dams and reservoirs, developments, and other changes have been constructed in the watersheds tributary to the Delta, and the impacts of these changes on inflows into the Delta were reviewed in the DRMS studies. Construction of new dams and reservoirs in the tributary watersheds could be a large contributor to changes in characteristics of runoff to the Delta. However, as discussed in the following paragraphs, it is believed that changes related to reservoirs and watershed developments are associated with water supply and environmental flow releases from the reservoirs and have minimal impact on flood inflows into the Delta.
Table 7-1 is a partial list of dams and reservoirs that have been constructed in the tributary watersheds. As shown in Table 7-1, the reservoirs behind Oroville and New Melones dams are two of the largest reservoirs constructed during the period of available inflow measurements.

SECTIONSEVEN Flood Risk Analysis
Y:\DRMS\PUBLIC DRAFT\RISK ANALYSIS REPORT\SECTION 7\SECTION 7 DRAFT 2 (06-25-07).DOC 7-2
Analyses were made to determine if Oroville Dam and other watershed changes since construction of the dam had a significant impact on Delta inflows from Sacramento River and Yolo Bypass. Similar analyses were made with regard to San Joaquin River since construction of New Melones Dam.
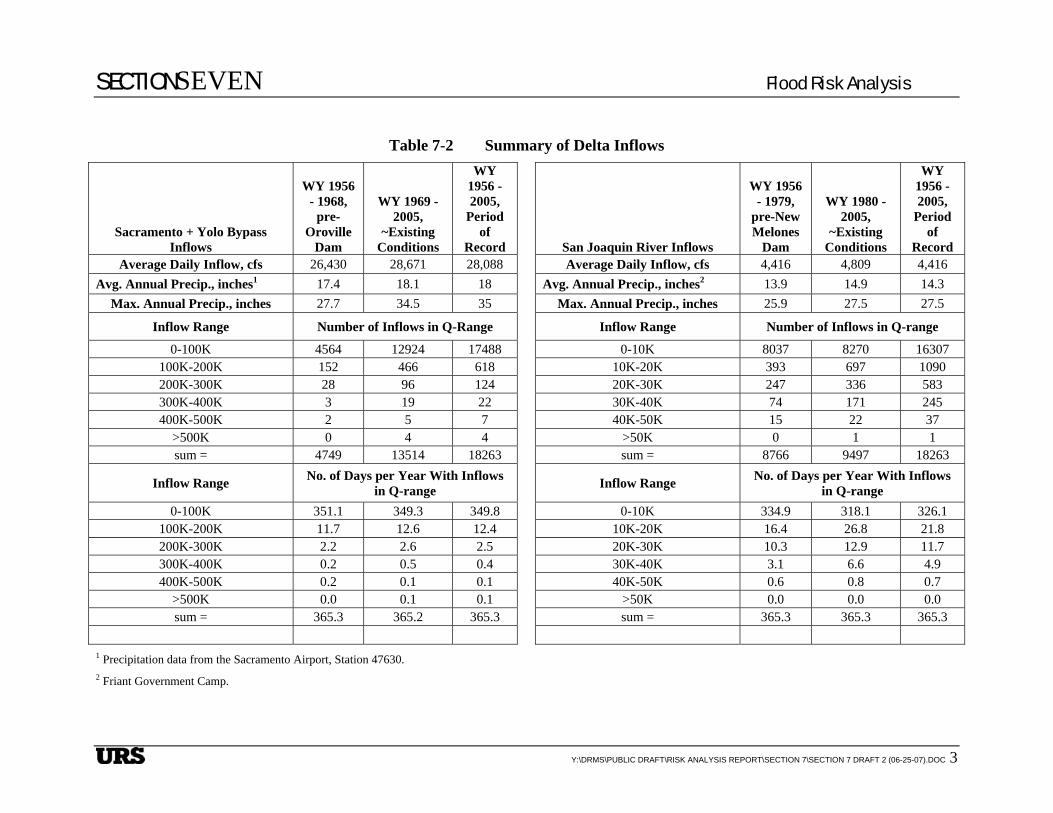
Table 7-2 summarizes the measured Delta inflows for three periods. For the Sacramento watershed, the periods are the pre-Oroville Dam period (1956–1968), the post-Oroville Dam period (1969–2005), and the entire period of record. For the San Joaquin River watershed, the periods are the pre- and post-New Melones Dam periods (1956–1979 and 1980–2005, respectively), and the entire period of record. Since no major storage projects have been developed on the Delta tributaries since construction of New Melones Dam, the post-New Melones Dam period is considered to represent current conditions. As shown in Table 7-2, the average number of days per year with high Delta inflows (>100,000 cfs) from San Joaquin River is greater during current conditions in the watershed than before New Melones Dam was constructed, and the average number of days per year of low Delta inflows (<100,000 cfs) is less. This situation is contrary to what would be expected if New Melones Dam and reservoir had a significant impact on flood inflows. Similarly, Table 7-2 shows more high (>100,000 cfs) and fewer low (<100,000 cfs) total inflows into the Delta from the Sacramento River watershed since the construction of Oroville Dam.
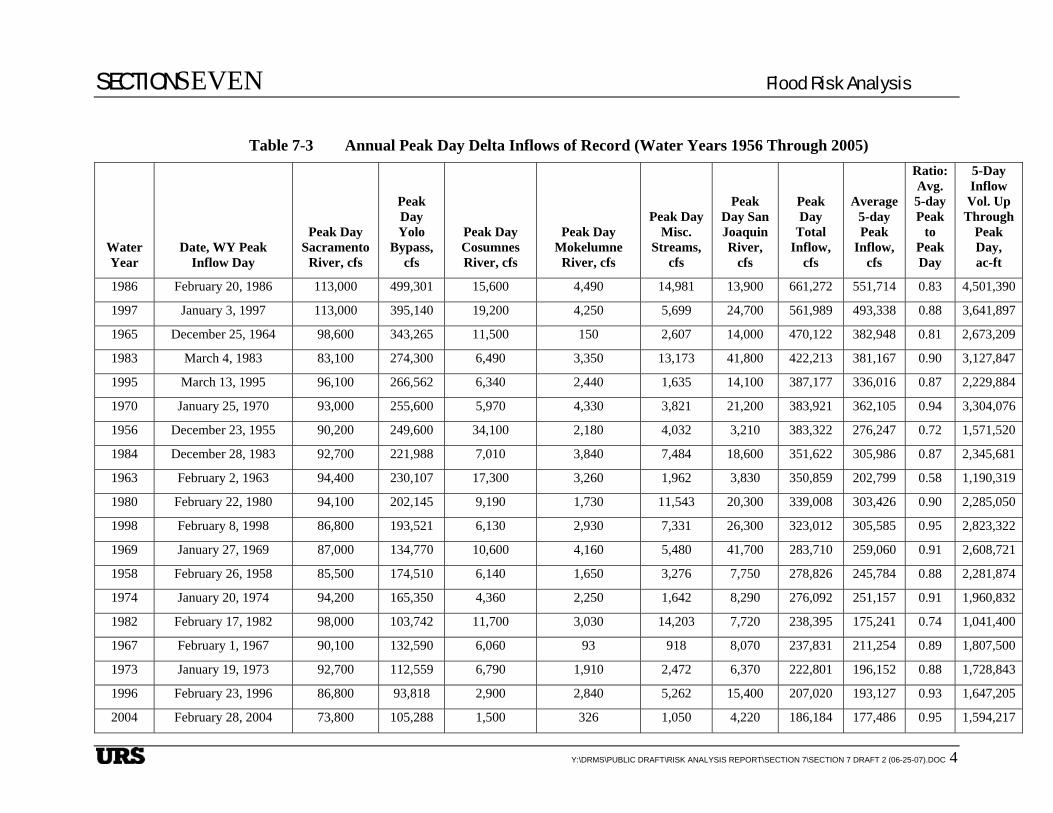
Table 7-3 lists, in descending order, the maximum daily TDI for each WY of the period of record. Examination of the flood inflow dates presented in Table 7-3 show that 4 out of the 5 largest inflow days and 7 out of the 12 largest inflow days occurred after 1979, after construction of Oroville and New Melones dams. A review of the maximum daily inflow data for San Joaquin River shows similar results: three of the five largest single-day inflows have occurred since 1979, and 7 of the 10 largest have occurred since 1979. The data in Table 7-3 also show no general trends in increasing or decreasing runoff to the Delta. Of the largest 25 inflows, 12 occurred during the most recent 25-year period, and 13 occurred during the first half of the 50-year period of record, thereby suggesting a somewhat stationary 50-year record. Smaller peak daily inflows would be expected after the addition of reservoirs in the watersheds if the reservoirs were reducing large flows, thereby suggesting that the additional dams may not significantly reduce TDIs during major flood events. Also shown in Table 7-3 is the total volume of inflow that occurred during the peak inflow day and the 4 previous days. Although the total volume of available flood control storage in the watersheds during the flood events is not known, it is possible that runoff preceding the peak day filled whatever flood control storage was available and inflow into the reservoirs was not significantly greater than outflow on the peak day.
Another possibility is that the flood control storage provided by a new reservoir only replaces a portion of the natural floodplain storage located downstream from the dam site. This possibility could occur if under pre-dam conditions, large flood flows would overtop the channel banks and be temporarily stored on the floodplain, thereby attenuating peak inflows into the Delta. After construction of the dam, the flood flows would be temporarily stored in the reservoir, thereby attenuating the outflows and reducing or eliminating overtopping of the downstream channel banks and floodplain storage. Whether watershed storage is provided by reservoirs or the floodplain, inflows into the Delta are controlled, to some extent, by the capacity of the channels conveying runoff to the Delta.
SECTIONSEVEN Flood Risk Analysis
Y:\DRMS\PUBLIC DRAFT\RISK ANALYSIS REPORT\SECTION 7\SECTION 7 DRAFT 2 (06-25-07).DOC 7-3
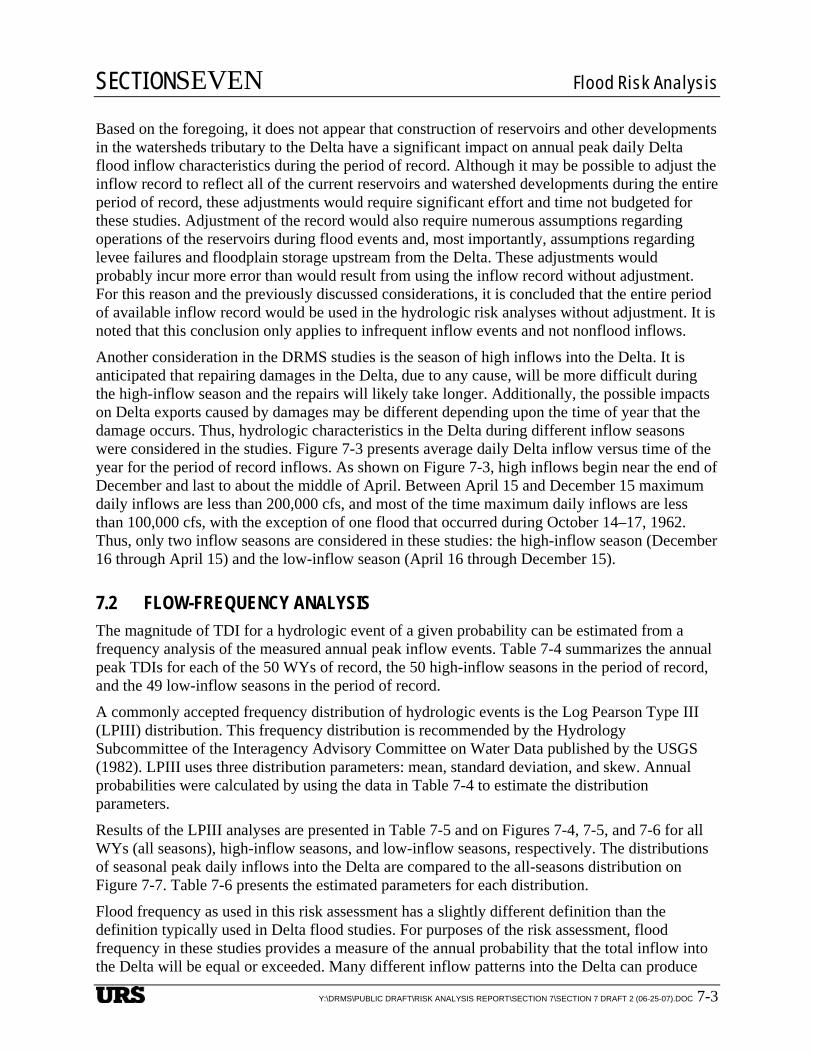
Based on the foregoing, it does not appear that construction of reservoirs and other developments in the watersheds tributary to the Delta have a significant impact on annual peak daily Delta flood inflow characteristics during the period of record. Although it may be possible to adjust the inflow record to reflect all of the current reservoirs and watershed developments during the entire period of record, these adjustments would require significant effort and time not budgeted for these studies. Adjustment of the record would also require numerous assumptions regarding operations of the reservoirs during flood events and, most importantly, assumptions regarding levee failures and floodplain storage upstream from the Delta. These adjustments would probably incur more error than would result from using the inflow record without adjustment. For this reason and the previously discussed considerations, it is concluded that the entire period of available inflow record would be used in the hydrologic risk analyses without adjustment. It is noted that this conclusion only applies to infrequent inflow events and not nonflood inflows.
Another consideration in the DRMS studies is the season of high inflows into the Delta. It is anticipated that repairing damages in the Delta, due to any cause, will be more difficult during the high-inflow season and the repairs will likely take longer. Additionally, the possible impacts on Delta exports caused by damages may be different depending upon the time of year that the damage occurs. Thus, hydrologic characteristics in the Delta during different inflow seasons were considered in the studies. Figure 7-3 presents average daily Delta inflow versus time of the year for the period of record inflows. As shown on Figure 7-3, high inflows begin near the end of December and last to about the middle of April. Between April 15 and December 15 maximum daily inflows are less than 200,000 cfs, and most of the time maximum daily inflows are less than 100,000 cfs, with the exception of one flood that occurred during October 14–17, 1962. Thus, only two inflow seasons are considered in these studies: the high-inflow season (December 16 through April 15) and the low-inflow season (April 16 through December 15).
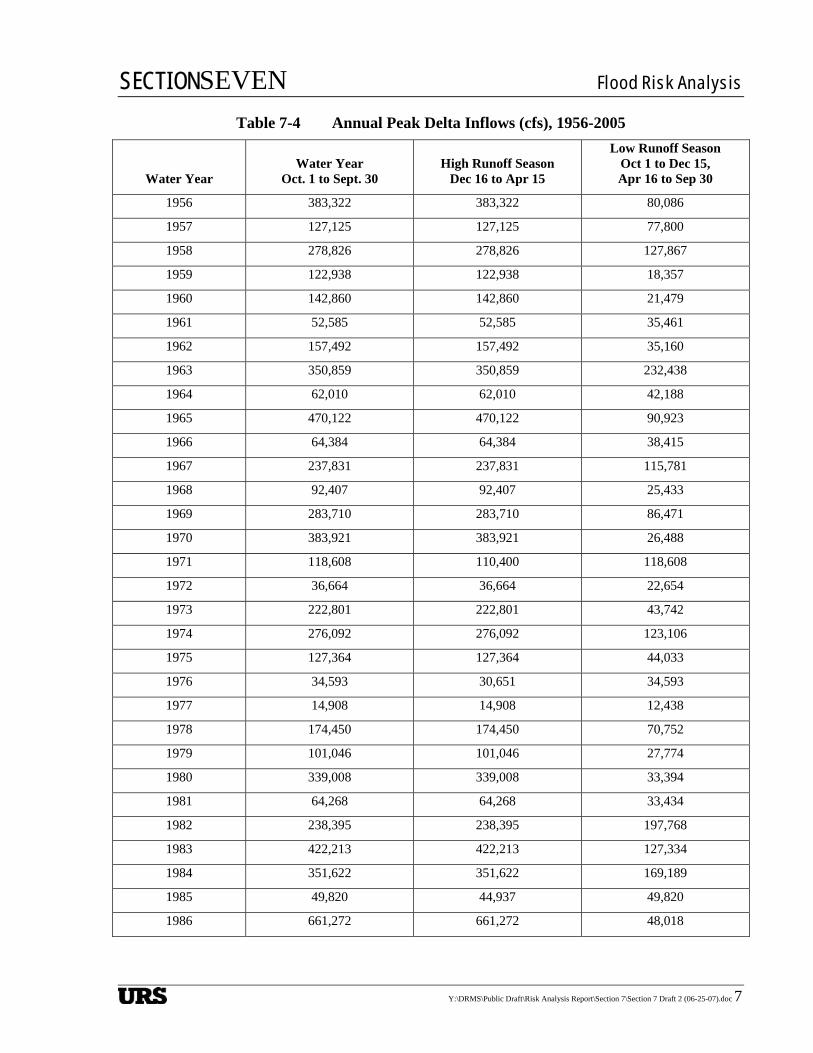
7.2 FLOW-FREQUENCY ANALYSIS The magnitude of TDI for a hydrologic event of a given probability can be estimated from a frequency analysis of the measured annual peak inflow events. Table 7-4 summarizes the annual peak TDIs for each of the 50 WYs of record, the 50 high-inflow seasons in the period of record, and the 49 low-inflow seasons in the period of record.
A commonly accepted frequency distribution of hydrologic events is the Log Pearson Type III (LPIII) distribution. This frequency distribution is recommended by the Hydrology Subcommittee of the Interagency Advisory Committee on Water Data published by the USGS (1982). LPIII uses three distribution parameters: mean, standard deviation, and skew. Annual probabilities were calculated by using the data in Table 7-4 to estimate the distribution parameters.
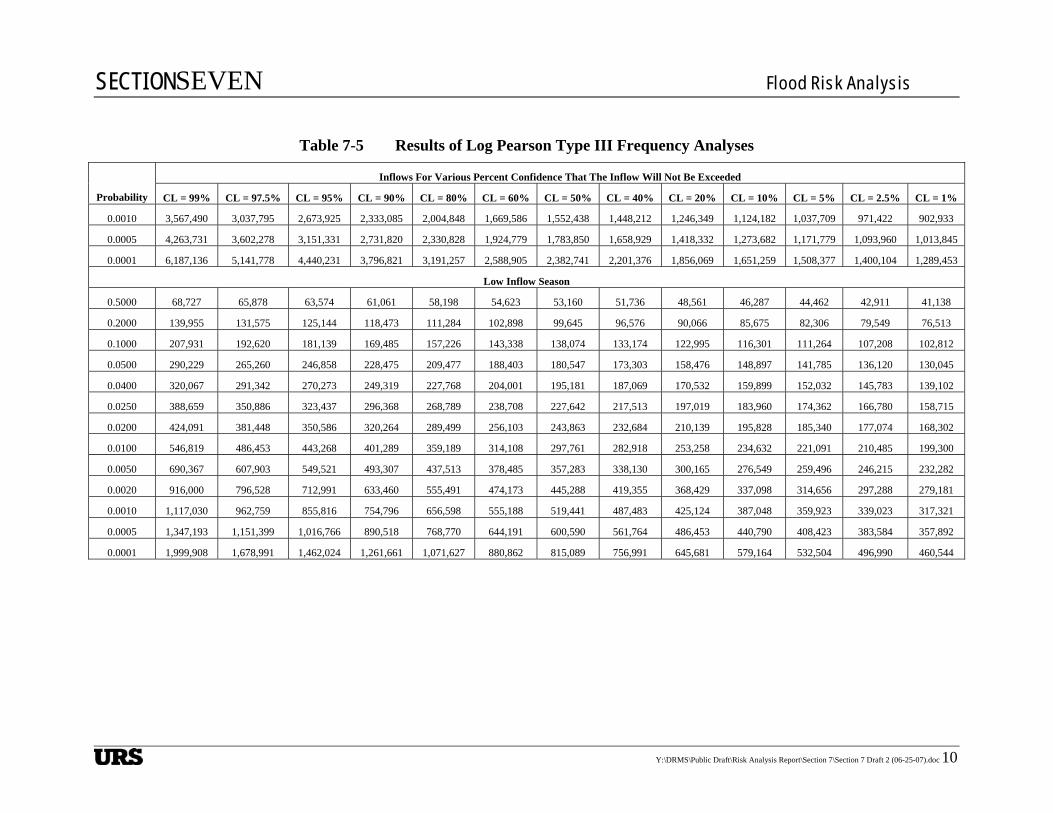
Results of the LPIII analyses are presented in Table 7-5 and on Figures 7-4, 7-5, and 7-6 for all WYs (all seasons), high-inflow seasons, and low-inflow seasons, respectively. The distributions of seasonal peak daily inflows into the Delta are compared to the all-seasons distribution on Figure 7-7. Table 7-6 presents the estimated parameters for each distribution.
Flood frequency as used in this risk assessment has a slightly different definition than the definition typically used in Delta flood studies. For purposes of the risk assessment, flood frequency in these studies provides a measure of the annual probability that the total inflow into the Delta will be equal or exceeded. Many different inflow patterns into the Delta can produce
SECTIONSEVEN Flood Risk Analysis
Y:\DRMS\PUBLIC DRAFT\RISK ANALYSIS REPORT\SECTION 7\SECTION 7 DRAFT 2 (06-25-07).DOC 7-4
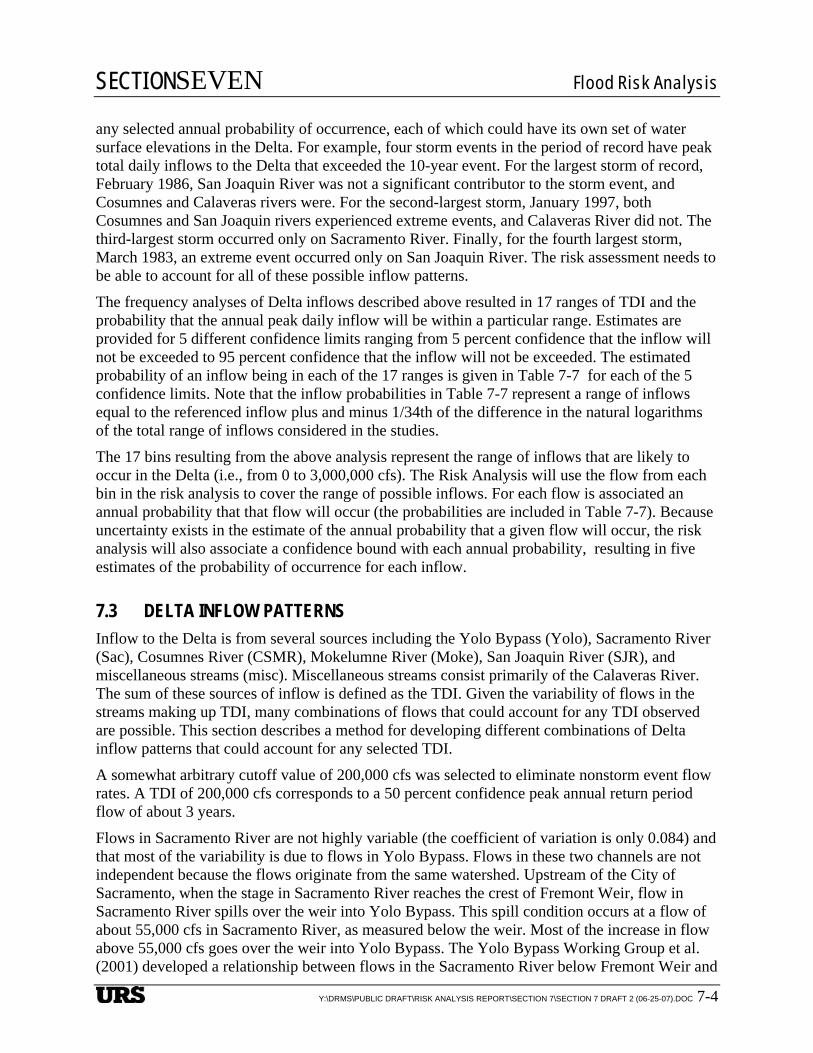
any selected annual probability of occurrence, each of which could have its own set of water surface elevations in the Delta. For example, four storm events in the period of record have peak total daily inflows to the Delta that exceeded the 10-year event. For the largest storm of record, February 1986, San Joaquin River was not a significant contributor to the storm event, and Cosumnes and Calaveras rivers were. For the second-largest storm, January 1997, both Cosumnes and San Joaquin rivers experienced extreme events, and Calaveras River did not. The third-largest storm occurred only on Sacramento River. Finally, for the fourth largest storm, March 1983, an extreme event occurred only on San Joaquin River. The risk assessment needs to be able to account for all of these possible inflow patterns.
The frequency analyses of Delta inflows described above resulted in 17 ranges of TDI and the probability that the annual peak daily inflow will be within a particular range. Estimates are provided for 5 different confidence limits ranging from 5 percent confidence that the inflow will not be exceeded to 95 percent confidence that the inflow will not be exceeded. The estimated probability of an inflow being in each of the 17 ranges is given in Table 7-7 for each of the 5 confidence limits. Note that the inflow probabilities in Table 7-7 represent a range of inflows equal to the referenced inflow plus and minus 1/34th of the difference in the natural logarithms of the total range of inflows considered in the studies.
The 17 bins resulting from the above analysis represent the range of inflows that are likely to occur in the Delta (i.e., from 0 to 3,000,000 cfs). The Risk Analysis will use the flow from each bin in the risk analysis to cover the range of possible inflows. For each flow is associated an annual probability that that flow will occur (the probabilities are included in Table 7-7). Because uncertainty exists in the estimate of the annual probability that a given flow will occur, the risk analysis will also associate a confidence bound with each annual probability, resulting in five estimates of the probability of occurrence for each inflow.
7.3 DELTA INFLOW PATTERNS Inflow to the Delta is from several sources including the Yolo Bypass (Yolo), Sacramento River (Sac), Cosumnes River (CSMR), Mokelumne River (Moke), San Joaquin River (SJR), and miscellaneous streams (misc). Miscellaneous streams consist primarily of the Calaveras River. The sum of these sources of inflow is defined as the TDI. Given the variability of flows in the streams making up TDI, many combinations of flows that could account for any TDI observed are possible. This section describes a method for developing different combinations of Delta inflow patterns that could account for any selected TDI.
A somewhat arbitrary cutoff value of 200,000 cfs was selected to eliminate nonstorm event flow rates. A TDI of 200,000 cfs corresponds to a 50 percent confidence peak annual return period flow of about 3 years.
Flows in Sacramento River are not highly variable (the coefficient of variation is only 0.084) and that most of the variability is due to flows in Yolo Bypass. Flows in these two channels are not independent because the flows originate from the same watershed. Upstream of the City of Sacramento, when the stage in Sacramento River reaches the crest of Fremont Weir, flow in Sacramento River spills over the weir into Yolo Bypass. This spill condition occurs at a flow of about 55,000 cfs in Sacramento River, as measured below the weir. Most of the increase in flow above 55,000 cfs goes over the weir into Yolo Bypass. The Yolo Bypass Working Group et al. (2001) developed a relationship between flows in the Sacramento River below Fremont Weir and

SECTIONSEVEN Flood Risk Analysis
Y:\DRMS\PUBLIC DRAFT\RISK ANALYSIS REPORT\SECTION 7\SECTION 7 DRAFT 2 (06-25-07).DOC 7-5
spills over the weir. The relationship indicates that it is only necessary to be able to predict one of the stream flows (Sacramento River or Yolo Bypass), and the other stream flow can be estimated. For this reason, the method presented below is used to predict the sum of flow in Sacramento River and Yolo Bypass.
The methodology for estimating flow in any of the contributing tributaries to the Delta given a specified TDI is to use regression relationships for each contributing inflow. A constraint on the choice of the relationship is that for any TDI (even TDIs beyond what have been observed) the sum of the flows developed from the relationships must add up to the TDI. Therefore, the relationships cannot be independent of each other. The dependence between relationships was maintained by only applying the relationship to that portion of the flow not yet explained by any previously used relationship.
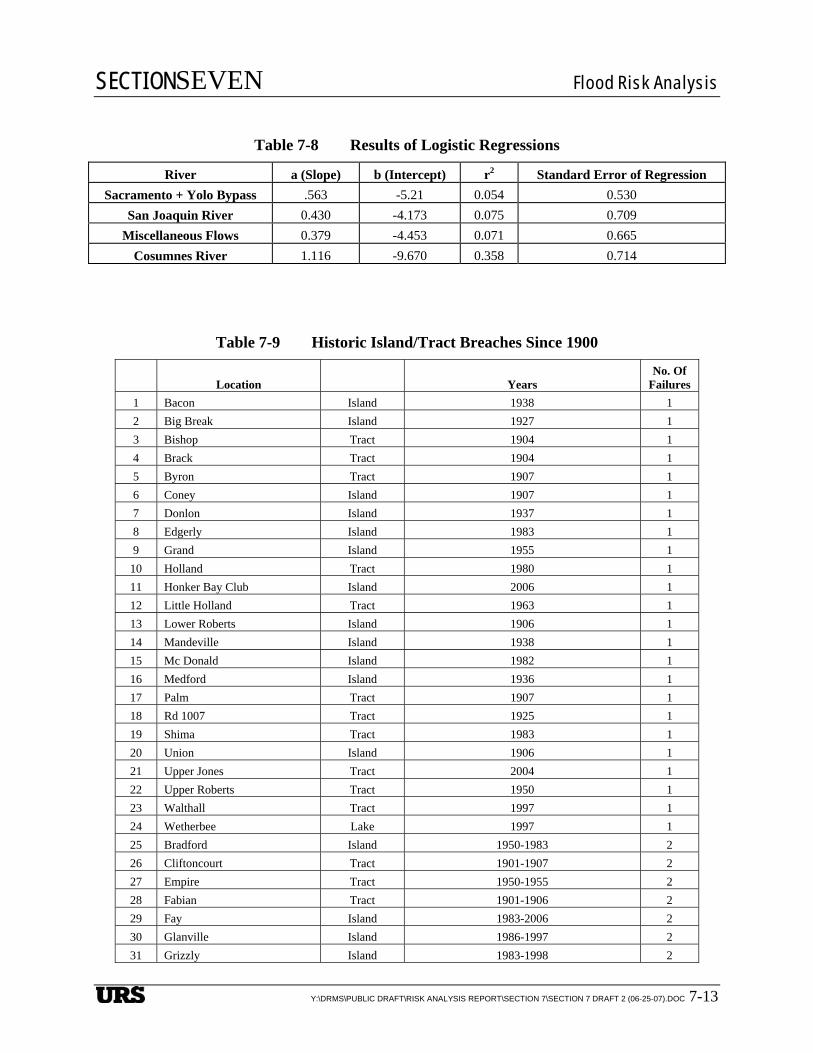
Table 7-8 lists the results of the logistic regression. The low r2 values result from the large variability in the data. However, even with these small correlations, the equations reproduce the mean values for the flow distributions.
Figure 7-8 shows the results for the Sacramento River plus Yolo Bypass Delta inflow. The correlation coefficient for the fit is 0.94.
In addition to the above results, a relationship between the flow in Sacramento River and Yolo Bypass is needed to separate these two flows from the total. The correlation coefficient for the fit is 0.65. Figure 7-9 shows the relationship.
Figure 7-10 presents the results for San Joaquin River. The regression equations provide a reasonable fit, thought it slightly underpredicts the main body of the data due to the small number of cases where the remaining flow is large and the fraction of flow in San Joaquin River is small (~10 percent of values). These events represent cases where a storm occurred on the Cosumnes River, but not the San Joaquin River.
Figure 7-11 presents the results for the miscellaneous inflows. The fit has an r2 value of 0.94.
Figure 7-12 shows the results for the Cosumnes River. The r2 value for the fit is 0.96, though it underestimates the peak annual flows.
The regression relationships reproduce the mean and median of the data well except for the median of Cosumnes River inflows. For most of the rivers, the mean flow is centered within the bulk of the observed flows (e.g., halfway between the 25th and 75th percentiles), whereas for Cosumnes River the mean is almost at the 75th percentile. This percentile implies that the distribution of inflows from Cosumnes River is more skewed than the inflows from other rivers and, therefore, the regression will not reproduce the median values as well. Figures 7-13 through 7-16 compare measured to predicted flow for the Sacramento River plus Yolo Bypass, San Joaquin River, miscellaneous inflows, and Cosumnes River, respectively. All of the figures show a very good fit between the measured and predicted flows except for the San Joaquin River cases in which the flows in other streams exceeded the flow in San Joaquin River. These values do not fit the relationship and need to be captured as part of the uncertainty analysis.
7.4 DELTA WATER SURFACE ELEVATIONS Water surface elevations throughout the Delta that are associated with various flood magnitudes and inflow patterns are needed to estimate risks of levee failure due to overtopping and/or high

SECTIONSEVEN Flood Risk Analysis
Y:\DRMS\PUBLIC DRAFT\RISK ANALYSIS REPORT\SECTION 7\SECTION 7 DRAFT 2 (06-25-07).DOC 7-6
water. Water surface elevations in the Delta were estimated from data on historic water levels measured at selected Delta gauging stations. Water levels, or stages, at the selected gauging stations were then used to interpolate stages at intermediate locations in the Delta.
7.4.1 Data Tide data used in these analyses are tide elevations measured at the Golden Gate Bridge (NOAA 2005). The Golden Gate Bridge tide station was chosen for its long record of unbroken tide data dating back about 150 years. Tide levels at the Golden Gate station are independent of inflows into the Delta while providing a geographically relevant measure of tailwater conditions that influence water levels in the Delta.
The California Data Exchange Center (CDEC) provides information on an extensive hydrologic data collection network, including automatic river stage sensors in the Delta. River stage data are provided primarily from the stations maintained by the DWR and USGS. The stage data can be downloaded from the CDEC’s website (no date).
Stage data are provided on an hourly basis since 1984. For some gauging stations, 15-minute stage levels have been recorded for some inflow events since 1995. Figure 7-17 shows the locations of the stage gauging stations selected for use in these studies and presents the period of record for hourly and event data for each station. Gauging stations were selected based on station location and length and reliability of available record.
7.4.2 Data Review and Adjustments Stage records for the selected gauging stations contained some inconsistent data that are significant enough to have an impact on the results of the analyses. To assist in evaluation of the stage data, plots of daily stage versus time were created for each of the measuring stations. These plots provide a picture of the normal stage range and also show apparent inconsistencies in the data. The data records were evaluated and, when possible, adjusted to eliminate apparent invalid data. The data records were reviewed to adjust or eliminate the following inconsistent data:
• Changes in Station Datum
• Measured Stages Greater Than Flood Stage
• Missing and Known Invalid Data
• Constant Stage Measurements
• Invalid Recording Intervals
• Incomplete Daily Records
• Conversion of Data to Common Datum
7.4.3 Regression Analysis of Water Surface Elevations Once maximum daily stage data were reviewed, invalid records removed, and conversion to North American Vertical Datum 88 datum estimated for each station, the daily stage data for flood inflows were matched to the corresponding maximum daily tide data and the mean daily inflow data. The resulting data set is a daily record of maximum daily stage (North American

SECTIONSEVEN Flood Risk Analysis
Y:\DRMS\PUBLIC DRAFT\RISK ANALYSIS REPORT\SECTION 7\SECTION 7 DRAFT 2 (06-25-07).DOC 7-7
Vertical Datum 88 datum), maximum daily tide, and mean daily inflow from each of the six tributary inflows into the Delta.
This study focuses on the threat from high stages that occur during flood events. Most of the inflow data in the data sets represent low-inflow nonflood events. To minimize bias in the statistical analyses of water surface elevations, the inflow data sets were reduced to only include high inflow events. Based on review of the data it was judged that only TDI magnitudes greater than 57,000 cfs should be included in the regression analyses.
Using the data on maximum daily tide, mean daily inflow, and measured adjusted stages at the gauging stations, multiple regression analyses were made for each of the stage measuring stations. The regression analyses were made to determine best fit coefficients. To check that the local datums had been adjusted globally and to verify the equations, the calculated average stage elevations for historical total storm flows over 200,000 cfs were determined for each station and compared along the main Delta channels. Intermediate stage elevations between the selected gauging stations can be interpolated along the channel given the distance between the intermediate point and any two gauging stations and the predicted stage at the two gauging stations.
A map of water surface elevations for a 100-year event was developed for this project (DRMS 100-year map). These results were compared with 100-year flood results available in the literature, such as Federal Emergency Management Agency’s (FEMA’s) 100-year flood results. Figure 7-18 shows the comparison between DRMS and FEMA’s 100-year flood levels for the Delta and Suisun Marsh area.
7.5 LEVEE FLOOD VULNERABILITY This section addresses methods used to assess the vulnerability of levees and their foundations due to flood-induced risks.
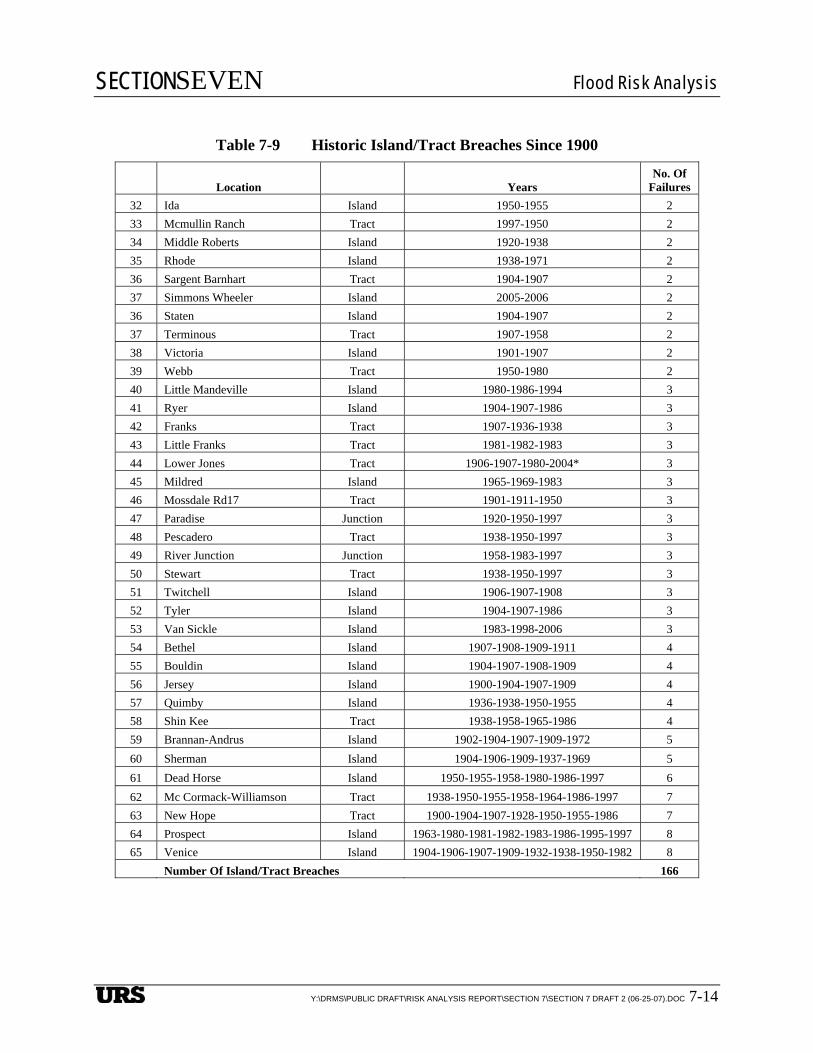
7.5.1 Historic Failures Since 1900, 166 islands have been flooded as a result of levee breaches in the Delta and Suisun Marsh. However, records on Suisun Marsh levee failures are incomplete. Table 7-9 summarizes the number of island/tract breaches and their corresponding years. Figure 7-19 illustrates the number of times islands or tracts breached since 1900. Figure 7-20 identifies the locations (when available) of the levee breaches that resulted in island/tract flooding. Most breach locations have been mapped except in the case of a few flood events for which the breach locations were not available.
A plot of island cumulative breach trend is presented on Figure 7-21. This plot should be viewed in the context of the historic changes the levee system has undergone in the last century. In recent years the levees have been built up to contain larger floods and have been upgraded/maintained to meet some engineering standards (freeboard, and attend to maintain stability). Part of the recent changes include (a) raising levees to meet higher flood protection level, (b) raising levees to compensate for foundation consolidation and settlement, (c) raising levees to mitigate for the continued subsidence (peat and organic marsh deposits) as a result of farming practices, and (d) improving/increasing maintenance to mitigate/contain the higher stresses on the levee system due to higher hydrostatic heads. Figure 7-21 should be considered an

SECTIONSEVEN Flood Risk Analysis
Y:\DRMS\PUBLIC DRAFT\RISK ANALYSIS REPORT\SECTION 7\SECTION 7 DRAFT 2 (06-25-07).DOC 7-8
overview of the historic evolution of the levee system performance. During the period since 1900, the average annual frequency of island flooding corresponds to about 1.57 expected flooded islands per year including all events exclusive of earthquakes (since earthquakes have not resulted in levee failures or damage). The trend of levee failure seems to indicate a slight improvement (1.32 average annual island flooding) for the period from 1951 to 2006 compared to 1.86 average annual island flooding for the period from 1900 to 1950. It is interesting to note that if the 11 flooded islands in 1950 are included in the last period (1950–2006), the trends for the two historic periods, 1900–1949 and 1950–2006, will be similar with 1.54 and 1.59 annual failure frequencies, respectively.
Figure 7-22(a) shows the cumulative number of levee breaches resulting in island flooding since 1950. The “sunny weather” island flooding events are excluded from these data. The data cutoff at 1950 was intentionally selected to remove the older historic events during which the levee configurations were dissimilar to the current levee conditions. These recent years represent a better data set to use for comparison with the results of the predictive levee analysis numerical models. One should recognize that since 1950, the levee geometry and crest elevation kept changing through time.
A further examination of the failure trends (Figure 7-22(a)) indicates an average annual frequency of flooded islands of 1.62 for the period between 1981 and 2006 compared to 0.87 for the period between 1951 and 1980. These trends indicate that during the recent 26 years, the Delta and Suisun Marsh have experienced a higher number of flooded islands and tracts than the period between 1951 and 1980 (30 years) despite the increasing maintenance efforts and subvention programs. Figure 7-22(b) shows the Delta levees program funding since 1982. To better understand the higher occurrence of island flooding events in the last 26 years, a flow hydrograph (since 1955, available records) is presented on Figure 7-22(c). The total in-flow hydrograph shows that the storm events recorded since 1980 are more potent and characterized by higher magnitudes than the storms recorded in the 25 years prior to 1980. Furthermore, the higher magnitude storm events, since 1980, correlate with higher number of flooded islands/tracts. These particular events include the 1980 (5 islands flooded), 1983 (11 islands flooded), 1986 (9 islands flooded), and 1997 (11 islands flooded). The higher frequency of island flooding in the last 26 years seems to have a strong correlation with the larger storms events compared to the 1951–1980 period of storm records.
7.5.2 Flood Failure Modes Three main modes of failures, through-seepage, underseepage, and overtopping, were considered to estimate the risk associated with flooding for this project. The erosion and slope instability were not considered as one of the main modes of failures but they were considered as fraction of total mode of failures. For example, the through-seepage emanating from landside slope of the levee could lead to slope instability.
Current practice is to separate levee seepage into two general categories: underseepage and through-seepage. Underseepage refers to water flowing under the levee in the underlying foundation materials, often emanating from the bottom of the landside slope and ground surface extending landward from the landside toe of the levee. Through-seepage refers to water flowing through the levee prism directly, often emanating from the landside slope of the levee. Both conditions can lead to failures by several mechanisms, including excessive water pressures

SECTIONSEVEN Flood Risk Analysis
Y:\DRMS\PUBLIC DRAFT\RISK ANALYSIS REPORT\SECTION 7\SECTION 7 DRAFT 2 (06-25-07).DOC 7-9
causing foundation heave and slope instabilities, and immediate and progressive internal erosion, often referred to as piping.
Under- and through-seepage are both manifestations of essentially the same mechanism; seepage-induced water pressures are high enough to internally erode materials and/or cause soil instabilities. Each can progress to complete failure of the levee. Combined with knowledge about the levee and foundation materials and their variability, both under- and through-seepage can be evaluated qualitatively and/or quantitatively using standard principles of soils and hydraulic engineering.
Our review of past failures included review of reports and interviewing local and state employees. For most of the past failures, information regarding mode of failure, time and date of failure, and water level in the slough are either not available at all or very limited. Therefore, the allocation of number of failures to different mode of failure was based on engineering judgment and experience of Vulnerability team members. No supporting documents are available to verify our assumption regarding the mode of failure. The Vulnerability team believes 80 percent of the past failures can be attributed to seepage-induced failures. The team also believes that both through- and underseepage-induced failures occurred in equal numbers. The remaining 20 percent of past failures can be attributed to overtopping.
7.5.2.1 Underseepage
Excessive underseepage is often accompanied by the formation of sand boils. Boils often look like miniature volcanoes, ejecting water and sediments, usually due to high underseepage pressures. These boils can lead to progressive internal erosion, undermining, and levee failure. Boils have been widely observed in all of the historic floods and are believed to have caused significant failures in 1986 and 1997.
7.5.2.2 Through-Seepage
Excessive through-seepage often leads to levee landside slope stability problems. At almost all locations, Delta levees are comprised of either dredged, clean, highly permeable river sands, or interbedded layers of organic and mineral soils with contrasting permeabilities. During high water conditions, because of their high permeability and layering, these materials will allow large volumes of water to flow through the levee, at rates high enough to cause internal erosion and slope instability. Often, water is seen exiting the landside slope of the levee, above the landside toe. As this increases, slumping of the levee slopes is often seen progressing from surficial slumps to complete rotation and/or translation of the levee prism and eventual breach of the levee.
The majorities of the Delta and Suisun Marsh levees have some pervious materials within the embankments and can therefore transmit water. It is believed that developing a failure model for predicting through-seepage induced failures considering the record of past failures is much more reliable than performing a series of seepage model analyses. The accuracy and usefulness of the failure model can be improved by checking it against a record of actual recorded events and adjusting it if necessary.

SECTIONSEVEN Flood Risk Analysis
Y:\DRMS\PUBLIC DRAFT\RISK ANALYSIS REPORT\SECTION 7\SECTION 7 DRAFT 2 (06-25-07).DOC 7-10
7.5.2.3 Overtopping
The overtopping failure occurs when the floodwater level rises above the crest of a levee. The main factors required for assessment of the probability of overtopping are levee crest elevation and the probability of floodwater levels exceeding this elevation. Note that, in some locations some amount of overflow can occur without complete failure of the levee. The human intervention can also result in preventing the overtopping failure by raising the crests with sandbags during high water periods. Computations of the probability of failure in overtopping were conducted by evaluating the probability of a given flood and the corresponding water level in excess of the measured crown elevations of levees. The probability of failure in overtopping was estimated using the fragility curve, which was developed using experts’ elicitation (Figure 7-23). The flood levels for current and future years (50, 100, and 200 years from now) were developed by the Flood Hazard Team. The probability of overtopping during current and future years was assessed using the fragility curve for overtopping, levee crest elevations, and flood frequency and stage values provided by the Flood Hazard Team.
7.5.2.4 Erosion
The mode of failure associated with streamflow erosion and wind-wave induced erosion is addressed in Chapters 8 and 10.
7.5.3 Flood Vulnerability Approach Underseepage analyses were conducted using steady-state analysis procedures of the finite element program Seep/W (Geo-Slope International Ltd. 2004). Models in this program were developed using two-dimensional, planar and isoparametric and higher-order finite elements models. The program can model multiple soil types, each having different anisotropic hydraulic conductivity characteristics to model the behavior of essentially all soil-types encountered in the Delta.
Boundary conditions in the steady-state analyses were modeled as a variety of conditions, including constant head, no-flow, constant flow or variable, based on in-situ conditions expected for each model. Infinite elements can also be included in the model section to model and infinite half-space at the edge of the model.
Water levels in the low-lying Delta islands are maintained 2 to 5 feet below land surface by an extensive network of drainage ditches, and accumulated agricultural drainage is pumped through or over the levees into stream channels. Therefore, it is reasonable to assume that steady-state seepage conditions exist in the tidal Delta and Suisun Marsh for the purpose of calibrating models and developing fragility curves. In the northern Delta and in the Delta fringes, floodwaters may rise and then drop fast enough that full steady state conditions may not always develop in every area, especially if the foundation materials are of low permeability. In these locations, steady-state analyses may slightly overestimate seepage conditions, but because of the low permeability, these areas will likely not be vulnerable to significant underseepage problems. Conversely, based on observations from past floods, most, if not all of the levees that have underseepage problems are founded on materials that are relatively permeable, where steady-state seepage analyses are appropriate.
SECTIONSEVEN Flood Risk Analysis
Y:\DRMS\PUBLIC DRAFT\RISK ANALYSIS REPORT\SECTION 7\SECTION 7 DRAFT 2 (06-25-07).DOC 7-11
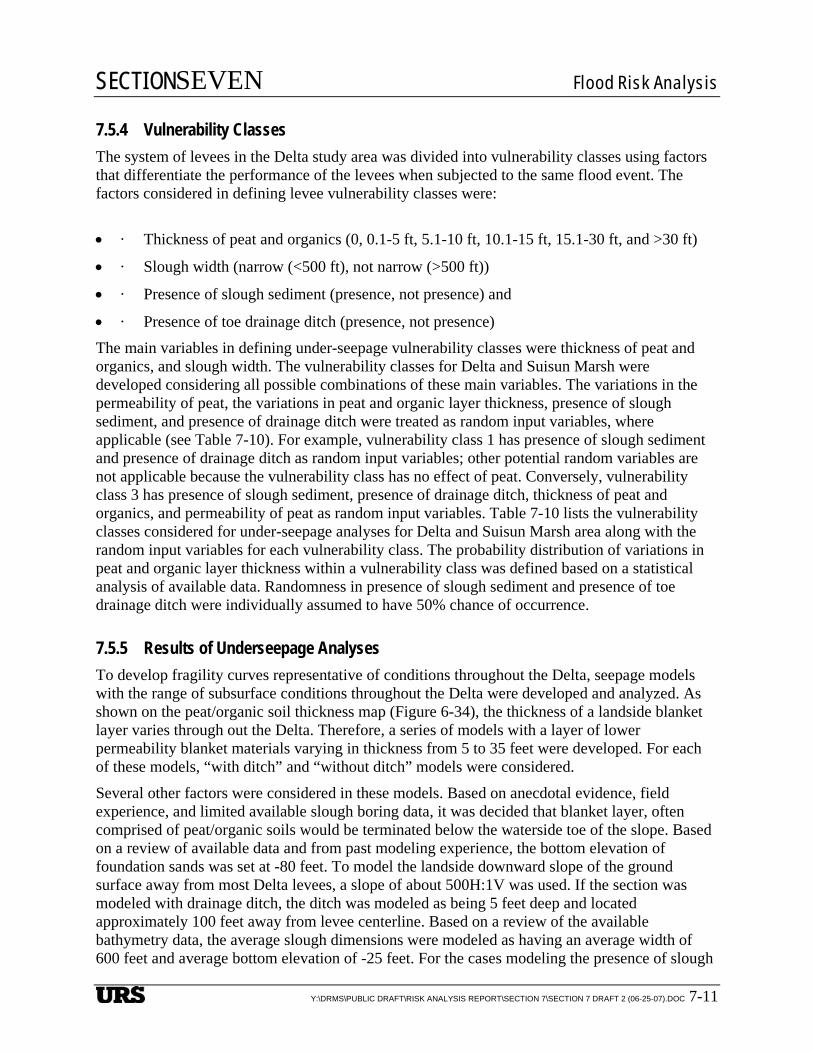
7.5.4 Vulnerability Classes The system of levees in the Delta study area was divided into vulnerability classes using factors that differentiate the performance of the levees when subjected to the same flood event. The factors considered in defining levee vulnerability classes were:
• · Thickness of peat and organics (0, 0.1-5 ft, 5.1-10 ft, 10.1-15 ft, 15.1-30 ft, and >30 ft)
• · Slough width (narrow (<500 ft), not narrow (>500 ft))
• · Presence of slough sediment (presence, not presence) and
• · Presence of toe drainage ditch (presence, not presence)
The main variables in defining under-seepage vulnerability classes were thickness of peat and organics, and slough width. The vulnerability classes for Delta and Suisun Marsh were developed considering all possible combinations of these main variables. The variations in the permeability of peat, the variations in peat and organic layer thickness, presence of slough sediment, and presence of drainage ditch were treated as random input variables, where applicable (see Table 7-10). For example, vulnerability class 1 has presence of slough sediment and presence of drainage ditch as random input variables; other potential random variables are not applicable because the vulnerability class has no effect of peat. Conversely, vulnerability class 3 has presence of slough sediment, presence of drainage ditch, thickness of peat and organics, and permeability of peat as random input variables. Table 7-10 lists the vulnerability classes considered for under-seepage analyses for Delta and Suisun Marsh area along with the random input variables for each vulnerability class. The probability distribution of variations in peat and organic layer thickness within a vulnerability class was defined based on a statistical analysis of available data. Randomness in presence of slough sediment and presence of toe drainage ditch were individually assumed to have 50% chance of occurrence.
7.5.5 Results of Underseepage Analyses To develop fragility curves representative of conditions throughout the Delta, seepage models with the range of subsurface conditions throughout the Delta were developed and analyzed. As shown on the peat/organic soil thickness map (Figure 6-34), the thickness of a landside blanket layer varies through out the Delta. Therefore, a series of models with a layer of lower permeability blanket materials varying in thickness from 5 to 35 feet were developed. For each of these models, “with ditch” and “without ditch” models were considered.
Several other factors were considered in these models. Based on anecdotal evidence, field experience, and limited available slough boring data, it was decided that blanket layer, often comprised of peat/organic soils would be terminated below the waterside toe of the slope. Based on a review of available data and from past modeling experience, the bottom elevation of foundation sands was set at -80 feet. To model the landside downward slope of the ground surface away from most Delta levees, a slope of about 500H:1V was used. If the section was modeled with drainage ditch, the ditch was modeled as being 5 feet deep and located approximately 100 feet away from levee centerline. Based on a review of the available bathymetry data, the average slough dimensions were modeled as having an average width of 600 feet and average bottom elevation of -25 feet. For the cases modeling the presence of slough

SECTIONSEVEN Flood Risk Analysis
Y:\DRMS\PUBLIC DRAFT\RISK ANALYSIS REPORT\SECTION 7\SECTION 7 DRAFT 2 (06-25-07).DOC 7-12
bottom sediments, a 2-foot-thick lower permeability fine-grained soil was included in the models.
Figures 7-24 (a) to (d) present the computed vertical gradients for a 15-foot-thick blanket layer as a function of river/slough water levels for “with” and “without” ditch, respectively. Review of these results indicates that the vertical gradient under the ditch increase to values ranging from 0.8 to 1.6 as a function of higher water levels (Figure 7-24(a)) effectively representing the average gradient through a 10-foot-thick blanket. On the other hand, the vertical gradients calculated for the case without the ditch are smaller and range from 0.4 to 0.9 near the toe (Figure 7-24(c)) and 0.3 to 0.8 away the toe (Figure 7-24(d)).
Multiple regression equations were developed (mean value and distribution around the mean) to represent the seepage gradient as a function of crest elevation minus water surface elevation for various confidence levels (called levee “response” curves).
Members of the Levee Vulnerability Team and the DRMS Technical Advisory Committee were given summary presentations regarding the above data compilations, model development, model results, and final developed relationships between computed gradients as a function of water levels and blanket permeability. In addition, this group of experts was asked to make the following assumptions:
1. The intention behind the development of this relationship is to characterize the likelihood that erosion and piping will progress to the point of full “failure” (breaching).
2. High water persists for one to several days (or so) with tides causing some fluctuation, but the principal source of high water risk is high flood levels.
3. In some cases, but not all cases, pre-existing partial erosion degradation may already be present from previous events.
With the model results and above assumptions as a uniform basis for evaluation, this group of experts was then asked to independently develop estimates of the probability of failure as a function of vertical gradient. Each separately submitted a spreadsheet showing their estimated probability of failure as a function of vertical gradient. They were then asked to estimate the probability of failure for the same situation, but with human intervention initiated at an appropriate level at that location. These curves were compiled and statistically analyzed.
Figure 7-25 presents a summary of the results of this exercise, assuming no human intervention. As shown, the mean value of the probability of failure is less than 50 percent for computed vertical gradients of less than 0.8. Probabilities of failure are expected to be greater than 80 percent when the vertical gradient is greater than about 1.1. This value is in general agreement with values suggested by the US Army Corps of Engineers (USACE 1999).
Figure 7-26 presents a summary of the results of this exercise, assuming human intervention. Comparison of Figure 7-25 with Figure 7-26 indicates that the expert panel believes that human intervention, unimpeded by resource constraints, can significantly reduce the probability of failure for a levee, as indicated by the significant shift of the mean value curves to the right on the graphs.
The seepage gradient versus crest elevation minus water surface elevation curves are combined with the probability of failure versus gradient curves to produce the probability of failure versus crest elevation minus water surface elevation (flood stage) for the entire Delta and Suisun Marsh

SECTIONSEVEN Flood Risk Analysis
Y:\DRMS\PUBLIC DRAFT\RISK ANALYSIS REPORT\SECTION 7\SECTION 7 DRAFT 2 (06-25-07).DOC 7-13
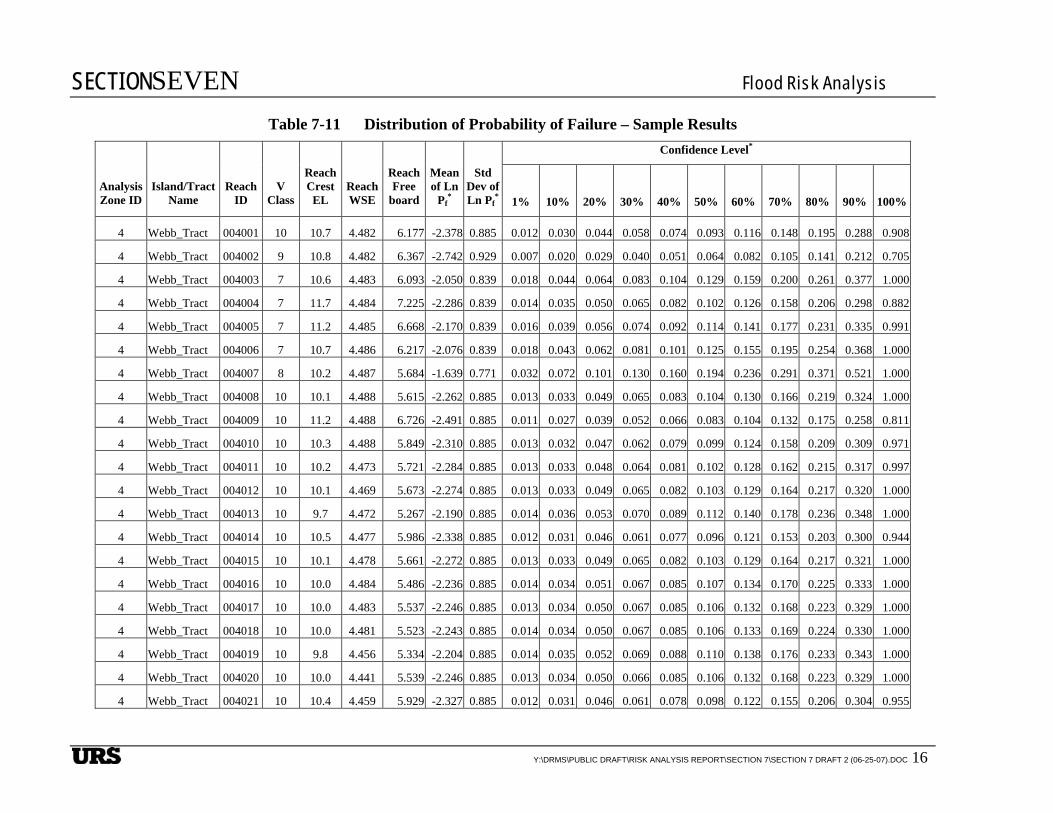
for each vulnerability class, as illustrated on Figure 7-27. The Levee Vulnerability Team believes these curves represent a reasonable numerical model to assess flood induced underseepage fragility of levees in both the Delta and Suisun Marsh. The resulting curves represented by Figure 7-27 (also presented in Table 7-11) are the basic input to the risk model.
7.6 FLOOD SYSTEMS MODEL
7.6.1 Spatial Modeling of Physical Response of Levees to Flood Events Section 7.5 described the geotechnical model used to assess seepage gradients of individual levees in different vulnerability classes subjected to a given flood scenario and the probability model to assess the probability of a breach of a levee reach given the estimated seepage gradient. To assess the risk of simultaneous, multiple levee failures under a given flood, the simultaneous physical behavior of all levees in the study area subjected to a specified flood event also needs modeling. Such a model needs to account for the spatial continuity of levees and define how levees within and across levee reaches are likely to behave in a given flood event.
This section first provides an overview of the spatial physical model of representing levees around different islands and describes the key assumptions made in modeling the spatial behavior of levees during a flood event.
The geotechnical fragility model described in Section 7.6.1 provides a procedure to estimate the probability of underseepage failure on individual reaches of an island. This procedure needs to be extended for estimating the probability of underseepage failure of an island. The approach is based on the concept of the “weakest” link; that is, the first failure of a system would occur at the weakest link. This assumption is appropriate for a linear system such as levees. It would not be known with certainty which levee reach is the weakest link. It is reasonable to assume that each reach has some probability of being the weakest link and that probability is proportional to the vulnerability of the reach as reflected in its conditional failure probability. That is, a reach with a higher failure probability would be more vulnerable to a failure, and would have a greater chance of being the weakest link and failing first. Using this assumption, the probability that each reach on an island is the weakest link is first estimated by making this probability proportional to the reach failure probability. This estimation can then be used to calculate the joint probability that a given reach would be the weakest link and would fail. This joint probability is summed over all reaches to estimate the probability of failure of the island.
This approach will honor three essential criteria. One, it will be invariant with regard to the reach length. That is, one would get the same answer whether an island is divided into 10 reaches or 100 reaches. Second, it will preserve the concept of the weakest link. That is, the probability of island failure would not be simply an average value over all reaches. Third, each reach will contribute to the overall probability of island failure. That is, the probability of island failure will not be controlled by a single reach that has the maximum failure probability. This approach simply reflects the fact that it is not know with certainty which reach is the weakest link; each reach could be the weakest link, with some probability, and could fail first.
Let,
fijk = conditional underseepage failure probability of j-th reach on i-th island for k- th flood event
SECTIONSEVEN Flood Risk Analysis
Y:\DRMS\PUBLIC DRAFT\RISK ANALYSIS REPORT\SECTION 7\SECTION 7 DRAFT 2 (06-25-07).DOC 7-14
fi.k = conditional underseepage failure probability of i-th island for k-th flood event
wijk = probability that j-th reach on i-th island is the “weakest” link for k-th event (that is, the link that would fail first under the given event)
wijk is calculated as follows:
wijk = fijk /Σ(fijk) (1)
The conditional underseepage failure probability of the i-th island for k-th event is calculated taking into account the probability that each reach could be the weakest link and the conditional underseepage failure probability of that reach for k-th event. Thus, fi.k is calculated from:
fi.k = Σj (wijk fijk) (2)
7.6.2 Island Failure Probability Under Multiple Failure Modes The previous section was used to estimate the probability of an island failure in underseepage for a given flood event. The probability of an island failure in through-seepage was assumed to be equal to the probability of failure in underseepage as discussed in Section 7.5.1. The probability of an island failure in overtopping was estimated using the procedure described in Section 7.5.1 (i.e., using the fragility curve for overtopping). Overall probability of an island failure due to any of these three failure modes was calculated as follows:
Pf (island) = 1- ((1-PfUS) x (1-PfTS) x (1-PfOT)) (3)
Where,
Pf (island) = Probability of an island failure
PfUS = Probability of an island failure in underseepage
PfTS = Probability of an island failure in through-seepage
PfTS = Probability of an island failure in overtopping
7.6.3 Probability of Damaged Levees A damaged levee section due to underseepage during a flood event is likely to show such signs as sand boils and scour holes. Experience with inspection and repairs of such damaged levees suggests that the average contiguous levee length with intermittent signs of damage is of the order of 5,000 feet. Furthermore, for each breach, 5 to 10 miles of levees, on the average, show signs of damage. Assuming a midpoint of 8 miles for the average miles of damaged levees for each breach, a typical length 5,000 feet of each contiguous damaged levee, and a typical length of 20,000 feet for a contiguous spatial zone, one would get, on the average, about 4 levee sections with damage potential per contiguous spatial zone. The average number of levee sections that are damaged would be about 8 per breach. If the breach rate is say m/n, the damaged levee rate would be 8m/4n = 2 (m/n). Thus, the probability of damaged levee section would be about twice that of a breach in a given contiguous spatial zone.
SECTIONSEVEN Flood Risk Analysis
Y:\DRMS\PUBLIC DRAFT\RISK ANALYSIS REPORT\SECTION 7\SECTION 7 DRAFT 2 (06-25-07).DOC 7-15
7.6.4 Length Effects on Probability Assessment The procedure presented above for the estimation of an island failure probability does not account for the effect of length of levees within each island. A simplified procedure was developed using empirical observations to adjust the probability of failure considering the length of each island under consideration. To develop this simplified procedure, first islands that have breached multiple times in the past were looked for (e.g., Venice Island breached 8 times in the past 100 years). This island can be considered as the reference case where all contributing effects (including length) are included. Hence, the length effect is developed as simple hyperbolic scaling function as described in Equation (4). This factor (SF) is used to adjust the probability of failure of any given island.
Scaling Factor (SF) = 1+ (Li-Lr)/Ln (4)
Where,
Li = length of an island under consideration
Lr = length of a referenced island
Ln = length of the longest island in the study area

Tables

SECTIONSEVEN Flood Risk Analysis
Y:\DRMS\PUBLIC DRAFT\RISK ANALYSIS REPORT\SECTION 7\SECTION 7 DRAFT 2 (06-25-07).DOC 1
Table 7-1 Partial List of Major Dams and Reservoirs in Tributary Watersheds to the San Francisco Bay-Delta
Dam Name Watercourse Tributary of Reservoir
Year Original Construction Completed
Reservoir Capacity
(acre-feet)
East Park Little Stony Creek Sacramento River East Park 1910
Daguerre Point Yuba River Sacramento River 1910
Cache Creek Cache Creek Sacramento River Clear Lake 1914
Capay Diversion Dam Cache Creek Sacramento River 1914
Stony Gorge Stony Creek Sacramento River Stony Gorge 1928
Pardee Mokelumne River San Joaquin River Pardee 1929 210,000
Englebright Yuba River Sacramento River 1941
Friant San Joaquin River San Joaquin River Millerton Lake 1942 520,000
Shasta Sacramento River Sacramento River Shasta Lake 1945 4,552,000
Martinez off-stream storage Martinez 1947
Keswick Sacramento River Sacramento River Keswick 1950
Sly Park Sly Park Creek American / Sacramento River Jenkinson Lake 1955
Mormon Island Auxiliary Dam Blue Ravine American / Sacramento River Folsom Lake 1956
Folsom American River Sacramento River Folsom Lake 1956 1,010,000
Tulloch Stanislaus River San Joaquin River Tulloch 1957 68,000
Monticello Putah Creek Sacramento River Lake Berryessa 1957
Comanche Mokelumne River San Joaquin River Comanche 1963 431,000
Whiskeytown Clear Creek Sacramento River Whiskeytown Lake 1963
Spring Creek Debris Dam Spring Creek Sacramento River Spring Creek 1963
Red Bluff (Diversion) Sacramento River Sacramento River Lake Red Bluff 1964
New Hogan Calaveras River San Joaquin River New Hogan 1931, 1964 325,000
Los Banos (Detention) Los Banos Creek San Joaquin River Los Banos 1965

SECTIONSEVEN Flood Risk Analysis
Y:\DRMS\PUBLIC DRAFT\RISK ANALYSIS REPORT\SECTION 7\SECTION 7 DRAFT 2 (06-25-07).DOC 2
Table 7-1 Partial List of Major Dams and Reservoirs in Tributary Watersheds to the San Francisco Bay-Delta
Dam Name Watercourse Tributary of Reservoir
Year Original Construction Completed
Reservoir Capacity
(acre-feet)
Little Panoche (Detention) Little Panoche Creek San Joaquin River Little Panoche 1966
San Luis San Luis Creek Delta - Mendota Canal San Luis 1967
O’Neill San Luis Creek Delta - Mendota Canal O’Neill Forebay 1967
Contra Loma off-stream storage Contra Loma 1967
Oroville Feather River Sacramento River Lake Oroville 1968 3,537,580
New Exchequer Merced River San Joaquin River Lake McClure 1926, 1968 1,026,000
New Bullards Bar Yuba River Sacramento River New Bullards Bar 1969
New Don Pedro Tuolumne River San Joaquin River New Don Pedro 1923, 1971 2,030,000
Buchanan Chowchilla River San Joaquin River Eastman Lake 1975 150,000
Indian Valley N Fork Cache Creek Sacramento River Indian Valley 1976 300,600
New Melones Stanislaus River San Joaquin River New Melones 1979 2,400,000
Sugar Pine N Shirttail Creek American / Sacramento River Sugar Pine 1981
Hidden Fresno River San Joaquin River Hensley Lake 90,000
Almanor N Fork Feather River Sacramento River
SECTIONSEVEN Flood Risk Analysis
Y:\DRMS\PUBLIC DRAFT\RISK ANALYSIS REPORT\SECTION 7\SECTION 7 DRAFT 2 (06-25-07).DOC 3
Table 7-2 Summary of Delta Inflows
Sacramento + Yolo Bypass Inflows
WY 1956 - 1968,
pre-Oroville
Dam
WY 1969 - 2005,
~Existing Conditions
WY 1956 - 2005,
Period of
Record San Joaquin River Inflows
WY 1956 - 1979,
pre-New Melones
Dam
WY 1980 - 2005,
~Existing Conditions
WY 1956 - 2005,
Period of
Record Average Daily Inflow, cfs 26,430 28,671 28,088 Average Daily Inflow, cfs 4,416 4,809 4,416
Avg. Annual Precip., inches1 17.4 18.1 18 Avg. Annual Precip., inches2 13.9 14.9 14.3 Max. Annual Precip., inches 27.7 34.5 35 Max. Annual Precip., inches 25.9 27.5 27.5
Inflow Range Number of Inflows in Q-Range Inflow Range Number of Inflows in Q-range
0-100K 4564 12924 17488 0-10K 8037 8270 16307 100K-200K 152 466 618 10K-20K 393 697 1090 200K-300K 28 96 124 20K-30K 247 336 583 300K-400K 3 19 22 30K-40K 74 171 245 400K-500K 2 5 7 40K-50K 15 22 37
>500K 0 4 4 >50K 0 1 1 sum = 4749 13514 18263 sum = 8766 9497 18263
Inflow Range No. of Days per Year With Inflows in Q-range Inflow Range No. of Days per Year With Inflows
in Q-range 0-100K 351.1 349.3 349.8 0-10K 334.9 318.1 326.1
100K-200K 11.7 12.6 12.4 10K-20K 16.4 26.8 21.8 200K-300K 2.2 2.6 2.5 20K-30K 10.3 12.9 11.7 300K-400K 0.2 0.5 0.4 30K-40K 3.1 6.6 4.9 400K-500K 0.2 0.1 0.1 40K-50K 0.6 0.8 0.7
>500K 0.0 0.1 0.1 >50K 0.0 0.0 0.0 sum = 365.3 365.2 365.3 sum = 365.3 365.3 365.3
1 Precipitation data from the Sacramento Airport, Station 47630. 2 Friant Government Camp.
SECTIONSEVEN Flood Risk Analysis
Y:\DRMS\PUBLIC DRAFT\RISK ANALYSIS REPORT\SECTION 7\SECTION 7 DRAFT 2 (06-25-07).DOC 4
Table 7-3 Annual Peak Day Delta Inflows of Record (Water Years 1956 Through 2005)
Water Year
Date, WY Peak Inflow Day
Peak Day Sacramento
River, cfs
Peak Day Yolo
Bypass, cfs
Peak Day Cosumnes River, cfs
Peak Day Mokelumne
River, cfs
Peak Day Misc.
Streams, cfs
Peak Day San Joaquin River,
cfs
Peak Day
Total Inflow,
cfs
Average 5-day Peak
Inflow, cfs
Ratio: Avg. 5-day Peak
to Peak Day
5-Day Inflow Vol. Up
Through Peak Day, ac-ft
1986 February 20, 1986 113,000 499,301 15,600 4,490 14,981 13,900 661,272 551,714 0.83 4,501,390
1997 January 3, 1997 113,000 395,140 19,200 4,250 5,699 24,700 561,989 493,338 0.88 3,641,897
1965 December 25, 1964 98,600 343,265 11,500 150 2,607 14,000 470,122 382,948 0.81 2,673,209
1983 March 4, 1983 83,100 274,300 6,490 3,350 13,173 41,800 422,213 381,167 0.90 3,127,847
1995 March 13, 1995 96,100 266,562 6,340 2,440 1,635 14,100 387,177 336,016 0.87 2,229,884
1970 January 25, 1970 93,000 255,600 5,970 4,330 3,821 21,200 383,921 362,105 0.94 3,304,076
1956 December 23, 1955 90,200 249,600 34,100 2,180 4,032 3,210 383,322 276,247 0.72 1,571,520
1984 December 28, 1983 92,700 221,988 7,010 3,840 7,484 18,600 351,622 305,986 0.87 2,345,681
1963 February 2, 1963 94,400 230,107 17,300 3,260 1,962 3,830 350,859 202,799 0.58 1,190,319
1980 February 22, 1980 94,100 202,145 9,190 1,730 11,543 20,300 339,008 303,426 0.90 2,285,050
1998 February 8, 1998 86,800 193,521 6,130 2,930 7,331 26,300 323,012 305,585 0.95 2,823,322
1969 January 27, 1969 87,000 134,770 10,600 4,160 5,480 41,700 283,710 259,060 0.91 2,608,721
1958 February 26, 1958 85,500 174,510 6,140 1,650 3,276 7,750 278,826 245,784 0.88 2,281,874
1974 January 20, 1974 94,200 165,350 4,360 2,250 1,642 8,290 276,092 251,157 0.91 1,960,832
1982 February 17, 1982 98,000 103,742 11,700 3,030 14,203 7,720 238,395 175,241 0.74 1,041,400
1967 February 1, 1967 90,100 132,590 6,060 93 918 8,070 237,831 211,254 0.89 1,807,500
1973 January 19, 1973 92,700 112,559 6,790 1,910 2,472 6,370 222,801 196,152 0.88 1,728,843
1996 February 23, 1996 86,800 93,818 2,900 2,840 5,262 15,400 207,020 193,127 0.93 1,647,205
2004 February 28, 2004 73,800 105,288 1,500 326 1,050 4,220 186,184 177,486 0.95 1,594,217

SECTIONSEVEN Flood Risk Analysis
Y:\DRMS\PUBLIC DRAFT\RISK ANALYSIS REPORT\SECTION 7\SECTION 7 DRAFT 2 (06-25-07).DOC 5
Table 7-3 Annual Peak Day Delta Inflows of Record (Water Years 1956 Through 2005)
Water Year
Date, WY Peak Inflow Day
Peak Day Sacramento
River, cfs
Peak Day Yolo
Bypass, cfs
Peak Day Cosumnes River, cfs
Peak Day Mokelumne
River, cfs
Peak Day Misc.
Streams, cfs
Peak Day San Joaquin River,
cfs
Peak Day
Total Inflow,
cfs
Average 5-day Peak
Inflow, cfs
Ratio: Avg. 5-day Peak
to Peak Day
5-Day Inflow Vol. Up
Through Peak Day, ac-ft
1978 January 18, 1978 75,000 85,024 5,100 114 5,062 4,150 174,450 158,930 0.91 1,310,340
2000 February 28, 2000 81,700 63,375 5,010 2,010 3,071 13,600 168,766 156,851 0.93 1,446,424
1962 February 16, 1962 70,100 68,679 7,520 547 2,826 7,820 157,492 137,722 0.87 1,131,743
1993 March 28, 1993 82,300 53,026 3,280 431 662 3,950 143,649 136,829 0.95 1,300,621
1960 February 10, 1960 69,100 67,482 3,280 156 712 2,130 142,860 108,434 0.76 741,241
1999 February 11, 1999 85,400 31,150 3,630 2,770 6,568 11,900 141,418 124,608 0.88 991,787
1975 March 26, 1975 73,800 36,228 6,340 895 3,171 6,930 127,364 118,869 0.93 1,126,078
1957 March 7, 1957 79,200 36,361 4,050 1,800 1,024 4,690 127,125 112,424 0.88 959,768
1959 February 20, 1959 67,300 46,902 1,830 662 1,404 4,840 122,938 105,502 0.86 797,068
1971 December 5, 1970 73,200 32,983 5,880 1,230 1,675 3,640 118,608 108,748 0.92 923,631
2002 January 6, 2002 65,567 34,528 725 194 3,097 4,224 108,335 91,437 0.84 802,132
1979 February 24, 1979 71,300 5,170 2,660 1,260 7,856 12,800 101,046 95,445 0.94 838,080
2005 May 22, 2005 74,100 6,668 1,590 2,090 151 12,100 96,699 90,974 0.94 769,349
2003 January 3, 2003 65,300 25,560 261 211 154 2,280 93,766 83,057 0.89 751,934
1968 February 25, 1968 66,200 18,648 1,350 838 1,251 4,120 92,407 88,976 0.96 798,413
1989 March 27, 1989 73,500 26 1,820 7 11 2,020 77,384 68,450 0.88 578,604
1966 January 10, 1966 53,600 4,085 377 436 536 5,350 64,384 61,741 0.96 596,854
1981 January 31, 1981 51,900 5,096 759 72 741 5,700 64,268 60,686 0.94 525,396
1964 January 23, 1964 52,200 2,841 2,780 624 455 3,110 62,010 54,099 0.87 399,078

SECTIONSEVEN Flood Risk Analysis
Y:\DRMS\PUBLIC DRAFT\RISK ANALYSIS REPORT\SECTION 7\SECTION 7 DRAFT 2 (06-25-07).DOC 6
Table 7-3 Annual Peak Day Delta Inflows of Record (Water Years 1956 Through 2005)
Water Year
Date, WY Peak Inflow Day
Peak Day Sacramento
River, cfs
Peak Day Yolo
Bypass, cfs
Peak Day Cosumnes River, cfs
Peak Day Mokelumne
River, cfs
Peak Day Misc.
Streams, cfs
Peak Day San Joaquin River,
cfs
Peak Day
Total Inflow,
cfs
Average 5-day Peak
Inflow, cfs
Ratio: Avg. 5-day Peak
to Peak Day
5-Day Inflow Vol. Up
Through Peak Day, ac-ft
2001 March 9, 2001 46,200 4,425 483 289 627 5,660 57,684 53,441 0.93 505,557
1992 February 17, 1992 46,800 2,456 1,290 177 1,516 5,110 57,349 53,943 0.94 495,923
1991 March 27, 1991 46,900 3,260 1,310 119 2,027 3,310 56,926 49,859 0.88 398,339
1961 February 14, 1961 49,500 1,750 228 111 36 960 52,585 51,222 0.97 455,516
1985 November 30, 1984 41,200 3,408 511 762 439 3,500 49,820 47,470 0.95 461,516
1987 March 16, 1987 38,000 1,686 840 91 443 3,000 44,060 40,764 0.93 331,279
1988 January 7, 1988 37,200 3,245 203 46 49 1,280 42,023 39,287 0.93 291,814
1990 January 16, 1990 36,900 25 284 45 30 1,370 38,654 33,325 0.86 293,407
1972 December 28, 1971 31,100 192 1,440 96 406 3,430 36,664 35,424 0.97 337,839
1994 February 10, 1994 29,900 1,686 190 150 64 2,780 34,770 29,317 0.84 237,051
1976 December 8, 1975 30,600 48 53 297 15 3,580 34,593 33,457 0.97 325,369
1977 January 5, 1977 13,700 3 76 37 12 1,080 14,908 13,128 0.88 122,450
SECTIONSEVEN Flood Risk Analysis
Y:\DRMS\Public Draft\Risk Analysis Report\Section 7\Section 7 Draft 2 (06-25-07).doc 7
Table 7-4 Annual Peak Delta Inflows (cfs), 1956-2005
Water Year Water Year
Oct. 1 to Sept. 30 High Runoff Season
Dec 16 to Apr 15
Low Runoff Season Oct 1 to Dec 15, Apr 16 to Sep 30
1956 383,322 383,322 80,086
1957 127,125 127,125 77,800
1958 278,826 278,826 127,867
1959 122,938 122,938 18,357
1960 142,860 142,860 21,479
1961 52,585 52,585 35,461
1962 157,492 157,492 35,160
1963 350,859 350,859 232,438
1964 62,010 62,010 42,188
1965 470,122 470,122 90,923
1966 64,384 64,384 38,415
1967 237,831 237,831 115,781
1968 92,407 92,407 25,433
1969 283,710 283,710 86,471
1970 383,921 383,921 26,488
1971 118,608 110,400 118,608
1972 36,664 36,664 22,654
1973 222,801 222,801 43,742
1974 276,092 276,092 123,106
1975 127,364 127,364 44,033
1976 34,593 30,651 34,593
1977 14,908 14,908 12,438
1978 174,450 174,450 70,752
1979 101,046 101,046 27,774
1980 339,008 339,008 33,394
1981 64,268 64,268 33,434
1982 238,395 238,395 197,768
1983 422,213 422,213 127,334
1984 351,622 351,622 169,189
1985 49,820 44,937 49,820
1986 661,272 661,272 48,018

SECTIONSEVEN Flood Risk Analysis
Y:\DRMS\Public Draft\Risk Analysis Report\Section 7\Section 7 Draft 2 (06-25-07).doc 8
Table 7-4 Annual Peak Delta Inflows (cfs), 1956-2005
Water Year Water Year
Oct. 1 to Sept. 30 High Runoff Season
Dec 16 to Apr 15
Low Runoff Season Oct 1 to Dec 15, Apr 16 to Sep 30
1987 44,060 44,060 26,604
1988 42,023 42,023 28,941
1989 77,384 77,384 30,508
1990 38,654 38,654 23,052
1991 56,926 56,926 13,399
1992 57,349 57,349 13,870
1993 143,649 143,649 54,362
1994 34,770 34,770 29,893
1995 387,177 387,177 176,174
1996 207,020 207,020 98,021
1997 561,989 561,989 130,890
1998 323,012 323,012 112,420
1999 141,418 141,418 69,997
2000 168,766 168,766 43,293
2001 57,684 57,684 18,567
2002 108,335 108,335 39,772
2003 93,766 93,766 71,627
2004 186,184 186,184 34,270
2005 96,699 73,956 96,699

SECTIONSEVEN Flood Risk Analysis
Y:\DRMS\Public Draft\Risk Analysis Report\Section 7\Section 7 Draft 2 (06-25-07).doc 9
Table 7-5 Results of Log Pearson Type III Frequency Analyses
Inflows For Various Percent Confidence That The Inflow Will Not Be Exceeded
Probability CL = 99% CL = 97.5% CL = 95% CL = 90% CL = 80% CL = 60% CL = 50% CL = 40% CL = 20% CL = 10% CL = 5% CL = 2.5% CL = 1%
All Seasons Inflow
0.5000 183,628 174,123 167,003 159,301 150,600 139,862 135,551 131,292 121,982 115,391 110,149 105,728 100,438
0.2000 417,743 384,177 362,404 340,001 316,076 288,481 280,047 267,913 246,965 232,973 222,322 213,661 205,125
0.1000 646,984 583,006 543,290 503,306 461,634 414,947 402,011 381,158 347,674 325,861 309,564 296,514 284,711
0.0500 925,781 819,574 755,468 691,963 626,943 555,619 536,997 505,080 455,965 424,523 401,337 382,966 367,245
0.0400 1,026,698 904,163 830,738 758,322 684,543 604,074 583,366 547,383 492,578 457,658 431,996 411,722 394,606
0.0250 1,257,855 1,096,264 1,000,731 907,312 813,021 711,305 685,788 640,424 572,582 529,736 498,454 473,871 453,614
0.0200 1,376,716 1,194,262 1,087,010 982,520 877,483 764,716 736,715 686,503 611,966 565,071 530,929 504,158 482,312
0.0100 1,784,960 1,527,536 1,378,571 1,234,957 1,092,240 941,059 904,505 837,586 740,151 679,497 635,677 601,532 574,362
0.0050 2,255,260 1,906,317 1,707,080 1,516,767 1,329,544 1,133,535 1,087,120 1,000,928 877,353 801,129 746,428 704,032 670,944
0.0020 2,978,735 2,480,798 2,200,802 1,936,227 1,679,002 1,413,366 1,351,820 1,236,059 1,072,812 973,177 902,221 847,564 805,745
0.0010 3,607,958 2,974,111 2,621,311 2,290,391 1,971,236 1,644,691 1,570,048 1,428,709 1,231,467 1,111,939 1,027,254 962,289 913,176
0.0005 4,312,097 3,520,576 3,084,102 2,677,476 2,288,198 1,893,304 1,804,086 1,634,300 1,399,532 1,258,192 1,158,523 1,082,350 1,025,346
0.0001 6,257,320 5,006,780 4,330,189 3,708,698 3,122,771 2,538,809 2,409,770 2,162,386 1,826,400 1,626,823 1,487,440 1,381,729 1,304,080
High Inflow Season
0.5000 181,568 172,677 165,544 157,831 149,124 138,385 134,031 129,820 120,522 113,944 108,714 104,307 99,311
0.2000 413,058 384,136 362,145 339,533 315,401 287,591 276,906 266,882 245,805 231,739 221,037 212,338 202,824
0.1000 639,727 585,479 545,194 504,669 462,468 415,235 397,502 381,085 347,276 325,268 308,836 295,684 281,518
0.0500 915,397 825,972 760,721 696,137 630,079 557,696 530,974 506,465 456,730 424,919 401,476 382,913 363,125
0.0400 1,015,182 912,153 837,341 763,625 688,596 606,861 576,822 549,344 493,801 458,443 432,477 411,975 390,180
0.0250 1,243,746 1,108,170 1,010,641 915,363 819,299 715,802 678,096 643,769 574,902 531,453 499,753 474,855 448,526
0.0200 1,361,275 1,208,309 1,098,719 992,060 884,962 770,130 728,451 690,588 614,872 567,283 532,662 505,531 476,903
0.0100 1,764,939 1,549,465 1,396,870 1,249,918 1,104,061 949,770 894,360 844,316 745,139 683,467 638,948 604,280 567,919
0.0050 2,229,964 1,938,146 1,733,590 1,538,429 1,346,685 1,146,245 1,074,926 1,010,841 884,829 807,192 751,524 708,407 663,418
0.0020 2,945,324 2,529,142 2,240,895 1,968,875 1,704,783 1,432,499 1,336,657 1,251,046 1,084,220 982,528 910,174 854,479 796,708
SECTIONSEVEN Flood Risk Analysis
Y:\DRMS\Public Draft\Risk Analysis Report\Section 7\Section 7 Draft 2 (06-25-07).doc 10
Table 7-5 Results of Log Pearson Type III Frequency Analyses
Inflows For Various Percent Confidence That The Inflow Will Not Be Exceeded
Probability CL = 99% CL = 97.5% CL = 95% CL = 90% CL = 80% CL = 60% CL = 50% CL = 40% CL = 20% CL = 10% CL = 5% CL = 2.5% CL = 1%
0.0010 3,567,490 3,037,795 2,673,925 2,333,085 2,004,848 1,669,586 1,552,438 1,448,212 1,246,349 1,124,182 1,037,709 971,422 902,933
0.0005 4,263,731 3,602,278 3,151,331 2,731,820 2,330,828 1,924,779 1,783,850 1,658,929 1,418,332 1,273,682 1,171,779 1,093,960 1,013,845
0.0001 6,187,136 5,141,778 4,440,231 3,796,821 3,191,257 2,588,905 2,382,741 2,201,376 1,856,069 1,651,259 1,508,377 1,400,104 1,289,453
Low Inflow Season
0.5000 68,727 65,878 63,574 61,061 58,198 54,623 53,160 51,736 48,561 46,287 44,462 42,911 41,138
0.2000 139,955 131,575 125,144 118,473 111,284 102,898 99,645 96,576 90,066 85,675 82,306 79,549 76,513
0.1000 207,931 192,620 181,139 169,485 157,226 143,338 138,074 133,174 122,995 116,301 111,264 107,208 102,812
0.0500 290,229 265,260 246,858 228,475 209,477 188,403 180,547 173,303 158,476 148,897 141,785 136,120 130,045
0.0400 320,067 291,342 270,273 249,319 227,768 204,001 195,181 187,069 170,532 159,899 152,032 145,783 139,102
0.0250 388,659 350,886 323,437 296,368 268,789 238,708 227,642 217,513 197,019 183,960 174,362 166,780 158,715
0.0200 424,091 381,448 350,586 320,264 289,499 256,103 243,863 232,684 210,139 195,828 185,340 177,074 168,302
0.0100 546,819 486,453 443,268 401,289 359,189 314,108 297,761 282,918 253,258 234,632 221,091 210,485 199,300
0.0050 690,367 607,903 549,521 493,307 437,513 378,485 357,283 338,130 300,165 276,549 259,496 246,215 232,282
0.0020 916,000 796,528 712,991 633,460 555,491 474,173 445,288 419,355 368,429 337,098 314,656 297,288 279,181
0.0010 1,117,030 962,759 855,816 754,796 656,598 555,188 519,441 487,483 425,124 387,048 359,923 339,023 317,321
0.0005 1,347,193 1,151,399 1,016,766 890,518 768,770 644,191 600,590 561,764 486,453 440,790 408,423 383,584 357,892
0.0001 1,999,908 1,678,991 1,462,024 1,261,661 1,071,627 880,862 815,089 756,991 645,681 579,164 532,504 496,990 460,544

SECTIONSEVEN Flood Risk Analysis
Y:\DRMS\Public Draft\Risk Analysis Report\Section 7\Section 7 Draft 2 (06-25-07).doc 11
Table 7-6 Parameters Used in Log Pearson Type III Distribution
Season Mean Standard Deviation Skew
Weighted Slew
All 5.12 0.383 -0.194 0.223
High 5.11 0.387 -0.184 -0.216
Low 4.72 0.325 0.0645 -0.0323
Weighted skew is a function of the generalized skew (-0.3000) and Mean Square Error of Generalized Skew (see p. 13, of Bulletin 17B)

SECTIONSEVEN Flood Risk Analysis
Y:\DRMS\PUBLIC DRAFT\RISK ANALYSIS REPORT\SECTION 7\SECTION 7 DRAFT 2 (06-25-07).DOC 12
Table 7-7 Inflow Ranges (Bins) and Confidence Limit Probabilities for the High Inflow Season - Year 2000
50% Confidence Limit 80% Confidence Limit 20% Confidence Limit 95% Confidence Limit 5% Confidence Limit
Bin # LN (Lower
Value) LN (Upper
Value) Lower Value Upper Value Designated Bin Value(1)
Proabability of Exceedence
Probability of Being in Bin
Proabability of Exceedence
Probability of Being in Bin
Proabability of Exceedence
Probability of Being in Bin
Proabability of Exceedence
Probability of Being in Bin
Proabability of Exceedence
Probability of Being in Bin
0 30,045 1.000 1.000 1.000 1.000 1.000
1 10.310438 10.581243 30,045 39,389 34,717 0.940 0.060 1.000 0.000 1.000 0.000 1.000 0.000 1.000 0.000
2 10.581243 10.852048 39,389 51,640 45,514 0.865 0.072 0.970 0.030 1.000 0.010 1.000 0.000 0.970 0.030
3 10.852048 11.122853 51,640 67,701 59,670 0.780 0.084 0.911 0.059 1.000 0.025 1.000 0.000 0.920 0.050
4 11.122853 11.393658 67,701 88,757 78,229 0.685 0.095 0.817 0.094 0.900 0.060 0.830 0.100 0.840 0.080
5 11.393658 11.664463 88,757 116,362 102,560 0.565 0.105 0.673 0.144 0.800 0.100 0.680 0.150 0.735 0.105
6 11.664463 11.935268 116,362 152,553 134,458 0.445 0.113 0.498 0.175 0.650 0.154 0.530 0.220 0.617 0.118
7 11.935268 12.206073 152,553 200000 176,277 0.353 0.121 0.299 0.190 0.402 0.174 0.248 0.220 0.490 0.127
8 12.206073 12.476878 200,000 262,204 231,102 0.225 0.120 0.174 0.125 0.284 0.180 0.138 0.150 0.360 0.130
9 12.476878 12.747683 262,204 343,754 302,979 0.130 0.095 0.103 0.080 0.168 0.116 0.078 0.082 0.235 0.125
10 12.747683 13.018488 343,754 450,669 397,212 0.076 0.060 0.053 0.051 0.106 0.075 0.036 0.042 0.145 0.090
11 13.018488 13.289293 450,669 590,835 520,752 0.038 0.038 0.023 0.030 0.060 0.046 0.014 0.022 0.085 0.060
12 13.289293 13.560098 590,835 774,597 682,716 0.017 0.021 0.009 0.014 0.030 0.030 0.004 0.010 0.047 0.038
13 13.560098 13.830903 774,597 1,015,511 895,054 0.006 0.011 0.003 0.006 0.014 0.016 0.001 0.003 0.025 0.023
14 13.830903 14.101708 1,015,511 1,331,355 1,173,433 0.002 0.004 0.001 0.002 0.005 0.008 0.0002460 0.001 0.012 0.013
15 14.101708 14.372513 1,331,355 1,745,432 1,538,394 0.001 0.002 0.000 0.001 0.002 0.003 0.0000415 0.000 0.005 0.007
16 14.372513 14.643318 1,745,432 2,288,296 2,016,864 0.000 0.000 0.000 0.000 0.001 0.001 0.0000044 0.000 0.002 0.003
17 14.643318 14.914123 2,288,296 3,000,000 2,644,148 0.000 0.000 0.000 0.000 0.000 0.000 0.0000005 0.000 0.001 0.001 (1) Designated Bin Value is average of Lower & Upper Value. Totals = 1.000 1.000 0.9994 0.9998 0.9994
SECTIONSEVEN Flood Risk Analysis
Y:\DRMS\PUBLIC DRAFT\RISK ANALYSIS REPORT\SECTION 7\SECTION 7 DRAFT 2 (06-25-07).DOC 7-13
Table 7-8 Results of Logistic Regressions
River a (Slope) b (Intercept) r2 Standard Error of Regression Sacramento + Yolo Bypass .563 -5.21 0.054 0.530
San Joaquin River 0.430 -4.173 0.075 0.709 Miscellaneous Flows 0.379 -4.453 0.071 0.665
Cosumnes River 1.116 -9.670 0.358 0.714
Table 7-9 Historic Island/Tract Breaches Since 1900
Location Years No. Of
Failures 1 Bacon Island 1938 1 2 Big Break Island 1927 1 3 Bishop Tract 1904 1 4 Brack Tract 1904 1 5 Byron Tract 1907 1 6 Coney Island 1907 1 7 Donlon Island 1937 1 8 Edgerly Island 1983 1 9 Grand Island 1955 1
10 Holland Tract 1980 1 11 Honker Bay Club Island 2006 1 12 Little Holland Tract 1963 1 13 Lower Roberts Island 1906 1 14 Mandeville Island 1938 1 15 Mc Donald Island 1982 1 16 Medford Island 1936 1 17 Palm Tract 1907 1 18 Rd 1007 Tract 1925 1 19 Shima Tract 1983 1 20 Union Island 1906 1 21 Upper Jones Tract 2004 1 22 Upper Roberts Tract 1950 1 23 Walthall Tract 1997 1 24 Wetherbee Lake 1997 1 25 Bradford Island 1950-1983 2 26 Cliftoncourt Tract 1901-1907 2 27 Empire Tract 1950-1955 2 28 Fabian Tract 1901-1906 2 29 Fay Island 1983-2006 2 30 Glanville Island 1986-1997 2 31 Grizzly Island 1983-1998 2
SECTIONSEVEN Flood Risk Analysis
Y:\DRMS\PUBLIC DRAFT\RISK ANALYSIS REPORT\SECTION 7\SECTION 7 DRAFT 2 (06-25-07).DOC 7-14
Table 7-9 Historic Island/Tract Breaches Since 1900
Location Years No. Of
Failures 32 Ida Island 1950-1955 2 33 Mcmullin Ranch Tract 1997-1950 2 34 Middle Roberts Island 1920-1938 2 35 Rhode Island 1938-1971 2 36 Sargent Barnhart Tract 1904-1907 2 37 Simmons Wheeler Island 2005-2006 2 36 Staten Island 1904-1907 2 37 Terminous Tract 1907-1958 2 38 Victoria Island 1901-1907 2 39 Webb Tract 1950-1980 2 40 Little Mandeville Island 1980-1986-1994 3 41 Ryer Island 1904-1907-1986 3 42 Franks Tract 1907-1936-1938 3 43 Little Franks Tract 1981-1982-1983 3 44 Lower Jones Tract 1906-1907-1980-2004* 3 45 Mildred Island 1965-1969-1983 3 46 Mossdale Rd17 Tract 1901-1911-1950 3 47 Paradise Junction 1920-1950-1997 3 48 Pescadero Tract 1938-1950-1997 3 49 River Junction Junction 1958-1983-1997 3 50 Stewart Tract 1938-1950-1997 3 51 Twitchell Island 1906-1907-1908 3 52 Tyler Island 1904-1907-1986 3 53 Van Sickle Island 1983-1998-2006 3 54 Bethel Island 1907-1908-1909-1911 4 55 Bouldin Island 1904-1907-1908-1909 4 56 Jersey Island 1900-1904-1907-1909 4 57 Quimby Island 1936-1938-1950-1955 4 58 Shin Kee Tract 1938-1958-1965-1986 4 59 Brannan-Andrus Island 1902-1904-1907-1909-1972 5 60 Sherman Island 1904-1906-1909-1937-1969 5 61 Dead Horse Island 1950-1955-1958-1980-1986-1997 6 62 Mc Cormack-Williamson Tract 1938-1950-1955-1958-1964-1986-1997 7 63 New Hope Tract 1900-1904-1907-1928-1950-1955-1986 7 64 Prospect Island 1963-1980-1981-1982-1983-1986-1995-1997 8 65 Venice Island 1904-1906-1907-1909-1932-1938-1950-1982 8
Number Of Island/Tract Breaches 166

SECTIONSEVEN Flood Risk Analysis
Y:\DRMS\PUBLIC DRAFT\RISK ANALYSIS REPORT\SECTION 7\SECTION 7 DRAFT 2 (06-25-07).DOC 7-15
Table 7-10 Vulnerability Classes Considered for Underseepage Analyses
Geographic Region
Vulnerability Class Index
Peat Thickness (ft) Slough Width Random Input Variables
Delta 1 0 Narrow Ditch, Sediment
2 0 Not Narrow Ditch, Sediment
3 0.1-5 Narrow Ditch, Sediment, Peat Thickness, Peat Permeability
4 0.1-5 Not Narrow Ditch, Sediment, Peat Thickness, Peat Permeability
5 5.1-10 Narrow Ditch, Sediment, Peat Thickness, Peat Permeability
6 5.1-10 Not Narrow Ditch, Sediment, Peat Thickness, Peat Permeability
7 10.1-15 Narrow Ditch, Sediment, Peat Thickness, Peat Permeability
8 10.1-15 Not Narrow Ditch, Sediment, Peat Thickness, Peat Permeability
9 15.1-30 Narrow Ditch, Sediment, Peat Thickness, Peat Permeability
10 15.1-30 Not Narrow Ditch, Sediment, Peat Thickness, Peat Permeability
11 >30 Narrow Ditch, Sediment, Peat Thickness, Peat Permeability
12 >30 Not Narrow Ditch, Sediment, Peat Thickness, Peat Permeability
Suisan Marsh 13 0 Narrow Sediment
14 0 Not Narrow Sediment
15 0.1-5 Narrow Sediment, Peat Thickness, Peat Permeability
16 0.1-5 Not Narrow Sediment, Peat Thickness, Peat Permeability
17 5.1-10 Narrow Sediment, Peat Thickness, Peat Permeability
18 5.1-10 Not Narrow Sediment, Peat Thickness, Peat Permeability
19 10.1-15 Narrow Sediment, Peat Thickness, Peat Permeability
20 10.1-15 Not Narrow Sediment, Peat Thickness, Peat Permeability
21 15.1-30 Narrow Sediment, Peat Thickness, Peat Permeability
22 15.1-30 Not Narrow Sediment, Peat Thickness, Peat Permeability
23 >30 Narrow Sediment, Peat Thickness, Peat Permeability
24 >30 Not Narrow Sediment, Peat Thickness, Peat Permeability
SECTIONSEVEN Flood Risk Analysis
Y:\DRMS\PUBLIC DRAFT\RISK ANALYSIS REPORT\SECTION 7\SECTION 7 DRAFT 2 (06-25-07).DOC 16
Table 7-11 Distribution of Probability of Failure – Sample Results Confidence Level*
Analysis Zone ID
Island/Tract Name
Reach ID
V Class
Reach Crest EL
Reach WSE
Reach Free
board
Mean of Ln
Pf*
Std Dev of Ln Pf
* 1% 10% 20% 30% 40% 50% 60% 70% 80% 90% 100%
4 Webb_Tract 004001 10 10.7 4.482 6.177 -2.378 0.885 0.012 0.030 0.044 0.058 0.074 0.093 0.116 0.148 0.195 0.288 0.908
4 Webb_Tract 004002 9 10.8 4.482 6.367 -2.742 0.929 0.007 0.020 0.029 0.040 0.051 0.064 0.082 0.105 0.141 0.212 0.705
4 Webb_Tract 004003 7 10.6 4.483 6.093 -2.050 0.839 0.018 0.044 0.064 0.083 0.104 0.129 0.159 0.200 0.261 0.377 1.000
4 Webb_Tract 004004 7 11.7 4.484 7.225 -2.286 0.839 0.014 0.035 0.050 0.065 0.082 0.102 0.126 0.158 0.206 0.298 0.882
4 Webb_Tract 004005 7 11.2 4.485 6.668 -2.170 0.839 0.016 0.039 0.056 0.074 0.092 0.114 0.141 0.177 0.231 0.335 0.991
4 Webb_Tract 004006 7 10.7 4.486 6.217 -2.076 0.839 0.018 0.043 0.062 0.081 0.101 0.125 0.155 0.195 0.254 0.368 1.000
4 Webb_Tract 004007 8 10.2 4.487 5.684 -1.639 0.771 0.032 0.072 0.101 0.130 0.160 0.194 0.236 0.291 0.371 0.521 1.000
4 Webb_Tract 004008 10 10.1 4.488 5.615 -2.262 0.885 0.013 0.033 0.049 0.065 0.083 0.104 0.130 0.166 0.219 0.324 1.000
4 Webb_Tract 004009 10 11.2 4.488 6.726 -2.491 0.885 0.011 0.027 0.039 0.052 0.066 0.083 0.104 0.132 0.175 0.258 0.811
4 Webb_Tract 004010 10 10.3 4.488 5.849 -2.310 0.885 0.013 0.032 0.047 0.062 0.079 0.099 0.124 0.158 0.209 0.309 0.971
4 Webb_Tract 004011 10 10.2 4.473 5.721 -2.284 0.885 0.013 0.033 0.048 0.064 0.081 0.102 0.128 0.162 0.215 0.317 0.997
4 Webb_Tract 004012 10 10.1 4.469 5.673 -2.274 0.885 0.013 0.033 0.049 0.065 0.082 0.103 0.129 0.164 0.217 0.320 1.000
4 Webb_Tract 004013 10 9.7 4.472 5.267 -2.190 0.885 0.014 0.036 0.053 0.070 0.089 0.112 0.140 0.178 0.236 0.348 1.000
4 Webb_Tract 004014 10 10.5 4.477 5.986 -2.338 0.885 0.012 0.031 0.046 0.061 0.077 0.096 0.121 0.153 0.203 0.300 0.944
4 Webb_Tract 004015 10 10.1 4.478 5.661 -2.272 0.885 0.013 0.033 0.049 0.065 0.082 0.103 0.129 0.164 0.217 0.321 1.000
4 Webb_Tract 004016 10 10.0 4.484 5.486 -2.236 0.885 0.014 0.034 0.051 0.067 0.085 0.107 0.134 0.170 0.225 0.333 1.000
4 Webb_Tract 004017 10 10.0 4.483 5.537 -2.246 0.885 0.013 0.034 0.050 0.067 0.085 0.106 0.132 0.168 0.223 0.329 1.000
4 Webb_Tract 004018 10 10.0 4.481 5.523 -2.243 0.885 0.014 0.034 0.050 0.067 0.085 0.106 0.133 0.169 0.224 0.330 1.000
4 Webb_Tract 004019 10 9.8 4.456 5.334 -2.204 0.885 0.014 0.035 0.052 0.069 0.088 0.110 0.138 0.176 0.233 0.343 1.000
4 Webb_Tract 004020 10 10.0 4.441 5.539 -2.246 0.885 0.013 0.034 0.050 0.066 0.085 0.106 0.132 0.168 0.223 0.329 1.000
4 Webb_Tract 004021 10 10.4 4.459 5.929 -2.327 0.885 0.012 0.031 0.046 0.061 0.078 0.098 0.122 0.155 0.206 0.304 0.955
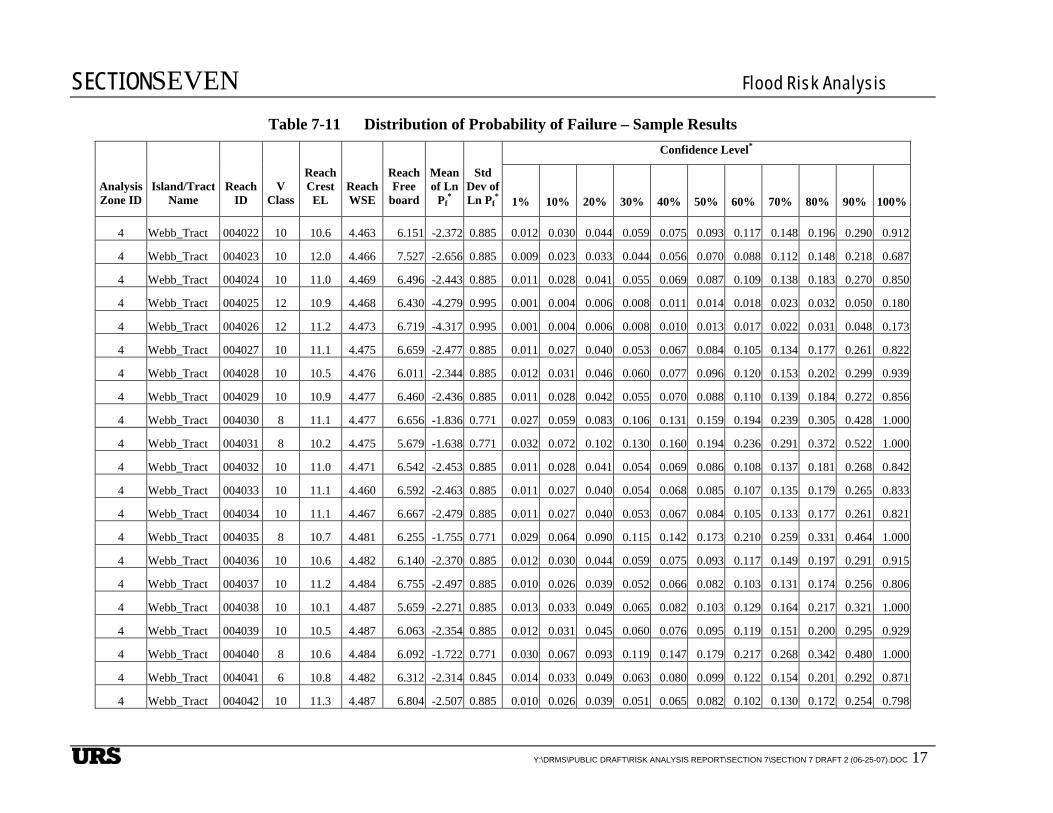
SECTIONSEVEN Flood Risk Analysis
Y:\DRMS\PUBLIC DRAFT\RISK ANALYSIS REPORT\SECTION 7\SECTION 7 DRAFT 2 (06-25-07).DOC 17
Table 7-11 Distribution of Probability of Failure – Sample Results Confidence Level*
Analysis Zone ID
Island/Tract Name
Reach ID
V Class
Reach Crest EL
Reach WSE
Reach Free
board
Mean of Ln
Pf*
Std Dev of Ln Pf
* 1% 10% 20% 30% 40% 50% 60% 70% 80% 90% 100%
4 Webb_Tract 004022 10 10.6 4.463 6.151 -2.372 0.885 0.012 0.030 0.044 0.059 0.075 0.093 0.117 0.148 0.196 0.290 0.912
4 Webb_Tract 004023 10 12.0 4.466 7.527 -2.656 0.885 0.009 0.023 0.033 0.044 0.056 0.070 0.088 0.112 0.148 0.218 0.687
4 Webb_Tract 004024 10 11.0 4.469 6.496 -2.443 0.885 0.011 0.028 0.041 0.055 0.069 0.087 0.109 0.138 0.183 0.270 0.850
4 Webb_Tract 004025 12 10.9 4.468 6.430 -4.279 0.995 0.001 0.004 0.006 0.008 0.011 0.014 0.018 0.023 0.032 0.050 0.180
4 Webb_Tract 004026 12 11.2 4.473 6.719 -4.317 0.995 0.001 0.004 0.006 0.008 0.010 0.013 0.017 0.022 0.031 0.048 0.173
4 Webb_Tract 004027 10 11.1 4.475 6.659 -2.477 0.885 0.011 0.027 0.040 0.053 0.067 0.084 0.105 0.134 0.177 0.261 0.822
4 Webb_Tract 004028 10 10.5 4.476 6.011 -2.344 0.885 0.012 0.031 0.046 0.060 0.077 0.096 0.120 0.153 0.202 0.299 0.939
4 Webb_Tract 004029 10 10.9 4.477 6.460 -2.436 0.885 0.011 0.028 0.042 0.055 0.070 0.088 0.110 0.139 0.184 0.272 0.856
4 Webb_Tract 004030 8 11.1 4.477 6.656 -1.836 0.771 0.027 0.059 0.083 0.106 0.131 0.159 0.194 0.239 0.305 0.428 1.000
4 Webb_Tract 004031 8 10.2 4.475 5.679 -1.638 0.771 0.032 0.072 0.102 0.130 0.160 0.194 0.236 0.291 0.372 0.522 1.000
4 Webb_Tract 004032 10 11.0 4.471 6.542 -2.453 0.885 0.011 0.028 0.041 0.054 0.069 0.086 0.108 0.137 0.181 0.268 0.842
4 Webb_Tract 004033 10 11.1 4.460 6.592 -2.463 0.885 0.011 0.027 0.040 0.054 0.068 0.085 0.107 0.135 0.179 0.265 0.833
4 Webb_Tract 004034 10 11.1 4.467 6.667 -2.479 0.885 0.011 0.027 0.040 0.053 0.067 0.084 0.105 0.133 0.177 0.261 0.821
4 Webb_Tract 004035 8 10.7 4.481 6.255 -1.755 0.771 0.029 0.064 0.090 0.115 0.142 0.173 0.210 0.259 0.331 0.464 1.000
4 Webb_Tract 004036 10 10.6 4.482 6.140 -2.370 0.885 0.012 0.030 0.044 0.059 0.075 0.093 0.117 0.149 0.197 0.291 0.915
4 Webb_Tract 004037 10 11.2 4.484 6.755 -2.497 0.885 0.010 0.026 0.039 0.052 0.066 0.082 0.103 0.131 0.174 0.256 0.806
4 Webb_Tract 004038 10 10.1 4.487 5.659 -2.271 0.885 0.013 0.033 0.049 0.065 0.082 0.103 0.129 0.164 0.217 0.321 1.000
4 Webb_Tract 004039 10 10.5 4.487 6.063 -2.354 0.885 0.012 0.031 0.045 0.060 0.076 0.095 0.119 0.151 0.200 0.295 0.929
4 Webb_Tract 004040 8 10.6 4.484 6.092 -1.722 0.771 0.030 0.067 0.093 0.119 0.147 0.179 0.217 0.268 0.342 0.480 1.000
4 Webb_Tract 004041 6 10.8 4.482 6.312 -2.314 0.845 0.014 0.033 0.049 0.063 0.080 0.099 0.122 0.154 0.201 0.292 0.871
4 Webb_Tract 004042 10 11.3 4.487 6.804 -2.507 0.885 0.010 0.026 0.039 0.051 0.065 0.082 0.102 0.130 0.172 0.254 0.798
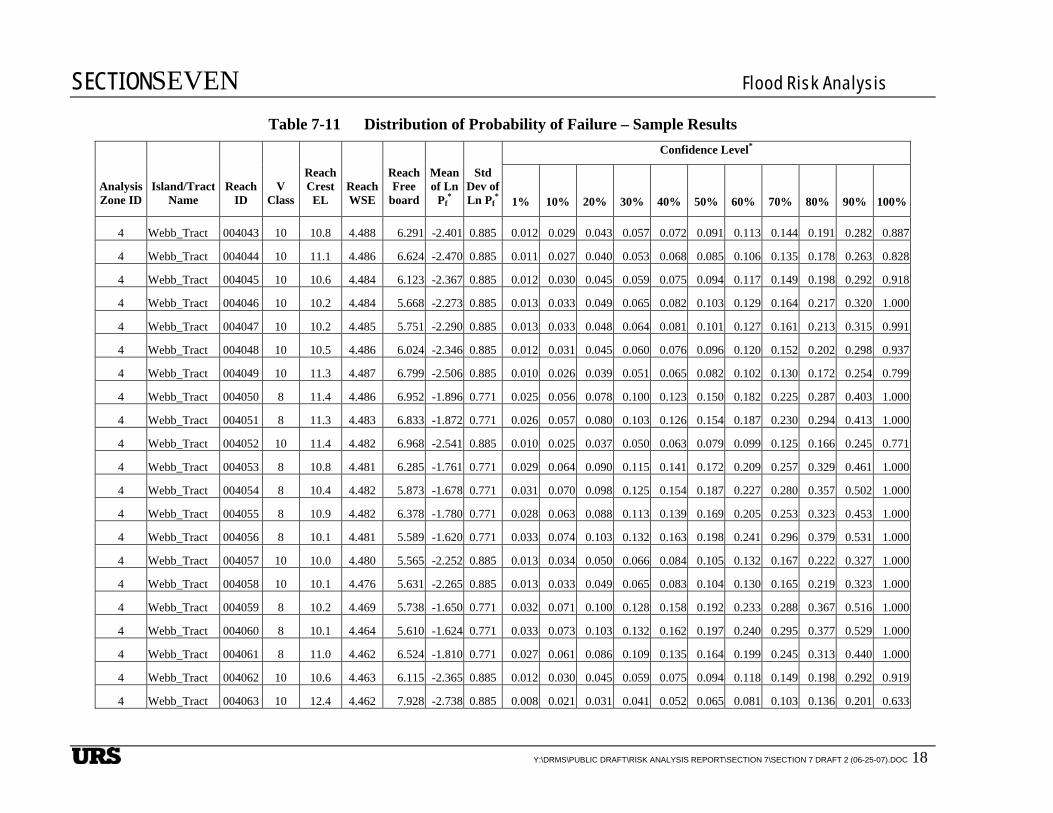
SECTIONSEVEN Flood Risk Analysis
Y:\DRMS\PUBLIC DRAFT\RISK ANALYSIS REPORT\SECTION 7\SECTION 7 DRAFT 2 (06-25-07).DOC 18
Table 7-11 Distribution of Probability of Failure – Sample Results Confidence Level*
Analysis Zone ID
Island/Tract Name
Reach ID
V Class
Reach Crest EL
Reach WSE
Reach Free
board
Mean of Ln
Pf*
Std Dev of Ln Pf
* 1% 10% 20% 30% 40% 50% 60% 70% 80% 90% 100%
4 Webb_Tract 004043 10 10.8 4.488 6.291 -2.401 0.885 0.012 0.029 0.043 0.057 0.072 0.091 0.113 0.144 0.191 0.282 0.887
4 Webb_Tract 004044 10 11.1 4.486 6.624 -2.470 0.885 0.011 0.027 0.040 0.053 0.068 0.085 0.106 0.135 0.178 0.263 0.828
4 Webb_Tract 004045 10 10.6 4.484 6.123 -2.367 0.885 0.012 0.030 0.045 0.059 0.075 0.094 0.117 0.149 0.198 0.292 0.918
4 Webb_Tract 004046 10 10.2 4.484 5.668 -2.273 0.885 0.013 0.033 0.049 0.065 0.082 0.103 0.129 0.164 0.217 0.320 1.000
4 Webb_Tract 004047 10 10.2 4.485 5.751 -2.290 0.885 0.013 0.033 0.048 0.064 0.081 0.101 0.127 0.161 0.213 0.315 0.991
4 Webb_Tract 004048 10 10.5 4.486 6.024 -2.346 0.885 0.012 0.031 0.045 0.060 0.076 0.096 0.120 0.152 0.202 0.298 0.937
4 Webb_Tract 004049 10 11.3 4.487 6.799 -2.506 0.885 0.010 0.026 0.039 0.051 0.065 0.082 0.102 0.130 0.172 0.254 0.799
4 Webb_Tract 004050 8 11.4 4.486 6.952 -1.896 0.771 0.025 0.056 0.078 0.100 0.123 0.150 0.182 0.225 0.287 0.403 1.000
4 Webb_Tract 004051 8 11.3 4.483 6.833 -1.872 0.771 0.026 0.057 0.080 0.103 0.126 0.154 0.187 0.230 0.294 0.413 1.000
4 Webb_Tract 004052 10 11.4 4.482 6.968 -2.541 0.885 0.010 0.025 0.037 0.050 0.063 0.079 0.099 0.125 0.166 0.245 0.771
4 Webb_Tract 004053 8 10.8 4.481 6.285 -1.761 0.771 0.029 0.064 0.090 0.115 0.141 0.172 0.209 0.257 0.329 0.461 1.000
4 Webb_Tract 004054 8 10.4 4.482 5.873 -1.678 0.771 0.031 0.070 0.098 0.125 0.154 0.187 0.227 0.280 0.357 0.502 1.000
4 Webb_Tract 004055 8 10.9 4.482 6.378 -1.780 0.771 0.028 0.063 0.088 0.113 0.139 0.169 0.205 0.253 0.323 0.453 1.000
4 Webb_Tract 004056 8 10.1 4.481 5.589 -1.620 0.771 0.033 0.074 0.103 0.132 0.163 0.198 0.241 0.296 0.379 0.531 1.000
4 Webb_Tract 004057 10 10.0 4.480 5.565 -2.252 0.885 0.013 0.034 0.050 0.066 0.084 0.105 0.132 0.167 0.222 0.327 1.000
4 Webb_Tract 004058 10 10.1 4.476 5.631 -2.265 0.885 0.013 0.033 0.049 0.065 0.083 0.104 0.130 0.165 0.219 0.323 1.000
4 Webb_Tract 004059 8 10.2 4.469 5.738 -1.650 0.771 0.032 0.071 0.100 0.128 0.158 0.192 0.233 0.288 0.367 0.516 1.000
4 Webb_Tract 004060 8 10.1 4.464 5.610 -1.624 0.771 0.033 0.073 0.103 0.132 0.162 0.197 0.240 0.295 0.377 0.529 1.000
4 Webb_Tract 004061 8 11.0 4.462 6.524 -1.810 0.771 0.027 0.061 0.086 0.109 0.135 0.164 0.199 0.245 0.313 0.440 1.000
4 Webb_Tract 004062 10 10.6 4.463 6.115 -2.365 0.885 0.012 0.030 0.045 0.059 0.075 0.094 0.118 0.149 0.198 0.292 0.919
4 Webb_Tract 004063 10 12.4 4.462 7.928 -2.738 0.885 0.008 0.021 0.031 0.041 0.052 0.065 0.081 0.103 0.136 0.201 0.633
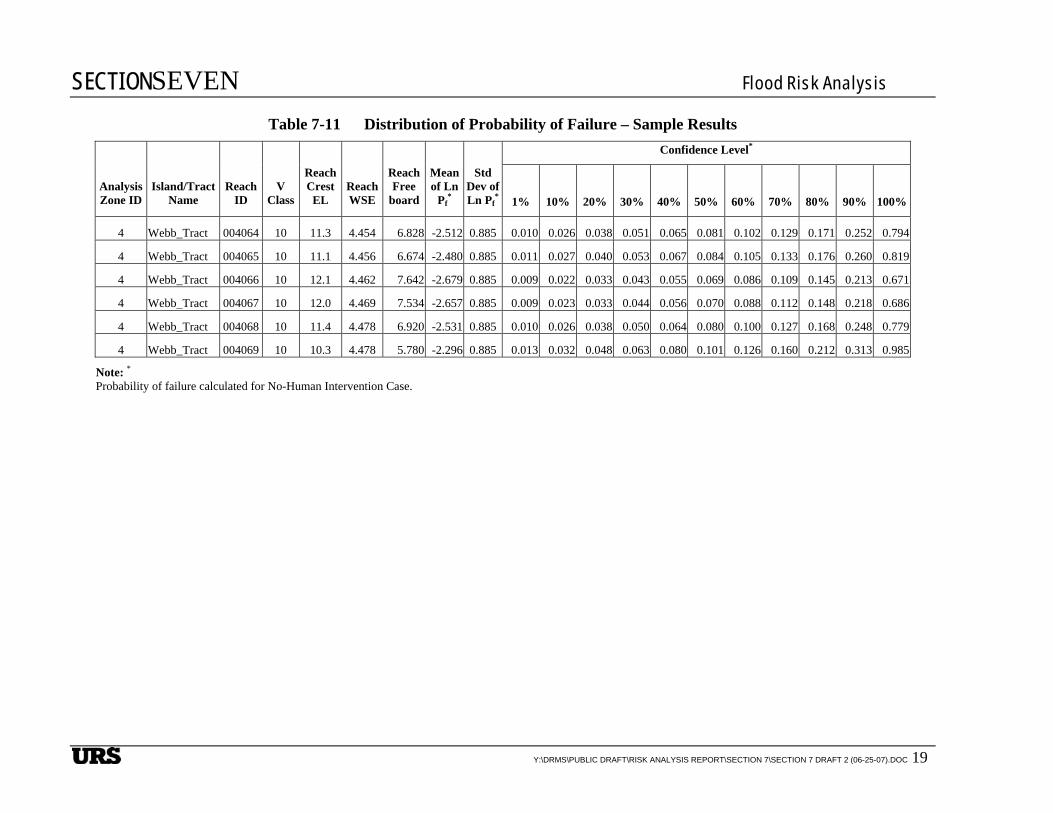
SECTIONSEVEN Flood Risk Analysis
Y:\DRMS\PUBLIC DRAFT\RISK ANALYSIS REPORT\SECTION 7\SECTION 7 DRAFT 2 (06-25-07).DOC 19
Table 7-11 Distribution of Probability of Failure – Sample Results Confidence Level*
Analysis Zone ID
Island/Tract Name
Reach ID
V Class
Reach Crest EL
Reach WSE
Reach Free
board
Mean of Ln
Pf*
Std Dev of Ln Pf
* 1% 10% 20% 30% 40% 50% 60% 70% 80% 90% 100%
4 Webb_Tract 004064 10 11.3 4.454 6.828 -2.512 0.885 0.010 0.026 0.038 0.051 0.065 0.081 0.102 0.129 0.171 0.252 0.794
4 Webb_Tract 004065 10 11.1 4.456 6.674 -2.480 0.885 0.011 0.027 0.040 0.053 0.067 0.084 0.105 0.133 0.176 0.260 0.819
4 Webb_Tract 004066 10 12.1 4.462 7.642 -2.679 0.885 0.009 0.022 0.033 0.043 0.055 0.069 0.086 0.109 0.145 0.213 0.671
4 Webb_Tract 004067 10 12.0 4.469 7.534 -2.657 0.885 0.009 0.023 0.033 0.044 0.056 0.070 0.088 0.112 0.148 0.218 0.686
4 Webb_Tract 004068 10 11.4 4.478 6.920 -2.531 0.885 0.010 0.026 0.038 0.050 0.064 0.080 0.100 0.127 0.168 0.248 0.779
4 Webb_Tract 004069 10 10.3 4.478 5.780 -2.296 0.885 0.013 0.032 0.048 0.063 0.080 0.101 0.126 0.160 0.212 0.313 0.985
Note: * Probability of failure calculated for No-Human Intervention Case.
Figures
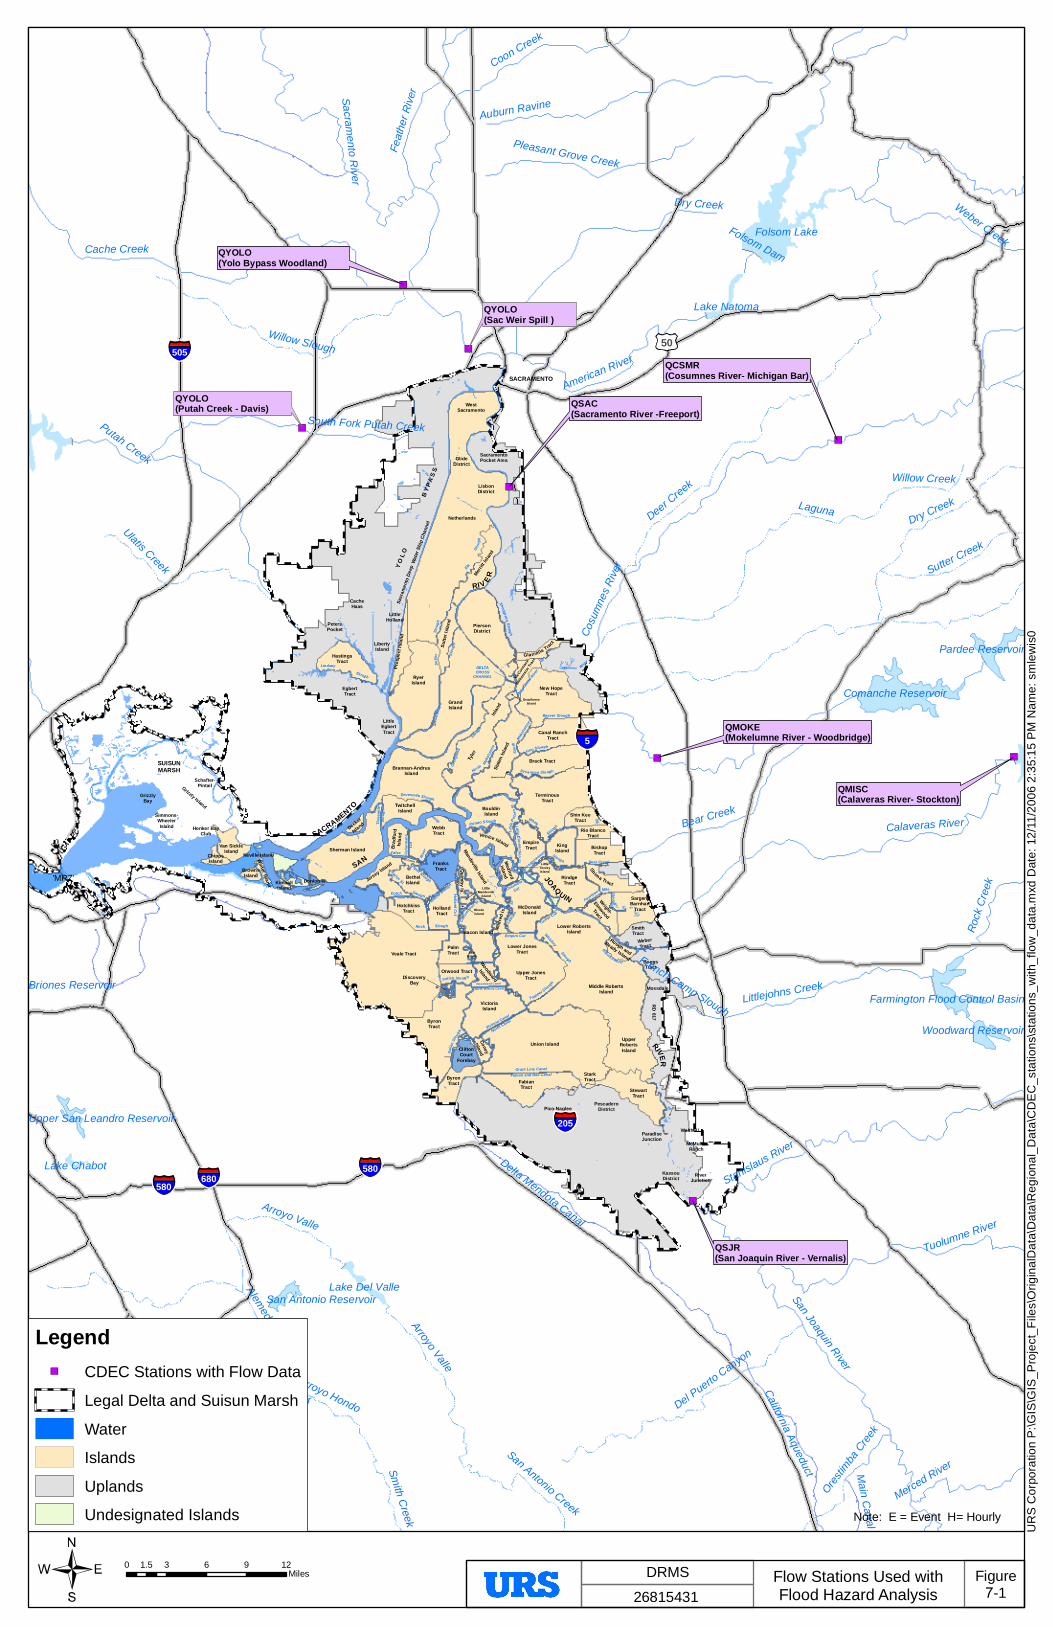
FranksTract
Sevenmile Slough
DELTACROSS
CHANNEL
Islan
d
Lindsey
Slough
Victoria Canal
North Canal
Trapper Slough
North Victoria CanalWoodward Canal
Whiskey Slough
Empire Cut
Indian Slough
Grant Line CanalFabian and Bell Canal
Italia
n Sl
ough
SloughRock
Dutch Slough
Taylor Sl.
Piper Slough
Conn
ectio
n Sl.
Columbia
Cut
Mound Slough
Holland Cut
Lath
amSl
.
Turner Cut
L it t le Co n n ection S
l.
Dissapointm
entSlough
White
SloughPotato Slough
Lit t
le P
ota
to S
l.
Burns Cutoff
Fourteen- Mile Slough
Fish
erm
ans
Cut
False
Rive
r
Thre
emile
Slou
gh
Hog Slough
Beaver Slough
SACRAMENTO
YO
LO
BY
PA
SS
RI V ER
SACRAMENTO
Wat
er S
hip
Chan
nel
Sacr
amen
to D
eep
LittleTinsleyIsland
RhodeIsland
LittleMandeville
Island
Little Franks Tract
Lower RobertsIsland
UpperRobertsIsland
Netherlands
Veale Tract
Middle RobertsIsland
Union Island
GrandIsland
RyerIsland
Upper JonesTract
ByronTract
Lower JonesTract
DiscoveryBay
RIVER
JOAQUIN
Tyle
r
TerminousTract
Stat
en Is
land
Brannan-AndrusIsland
PiersonDistrict
Sherman Island
New HopeTract
FabianTract
Brack Tract
RindgeTract
Canal RanchTract
VictoriaIsland
WebbTract
StewartTract
Bacon Island
BouldinIsland
McDonaldIsland
Merrit
t Isl
and
HastingsTract
HollandTract
BishopTract
Mandeville Island
ByronTract
BethelIsland
EmpireTract King
Island
Jersey Island
Venice Island
PalmTract
Sh ima Tract
TwitchellIsland
Sutte
r Isl
and
HotchkissTract
SargentBarnhart
Tract
Orwood Tract
Shin KeeTract
Van SickleIsland
Brad
ford
Isla
nd
Wright-
Elmwood
Tract
Woodward
Island
Glanvil le Trac
t
CliftonCourt
Forebay
Rio BlancoTract
ChippsIsland
BrownsIsland
Pros
pect
Isla
nd
Medford
Island
Coney
Island
Mild
red
Is.
McCor
mac
k
Willi
amso
n Tr
act
Rough and
Ready Island
Quim
by Is.
Decker
Island
Winter Island Kimball
Island
DeadhorseIsland
FayIsland
Neville Island
Sycamore Island
SAN
SUISUNMARSH Sycamore Slough
Stea
mbo
at
S lo u
ghG
eorg
iana
Slough
Sutt e
rSl
ough
Elk
Slou
gh
S nodgrass Slough
Honker BayClub
Simmons-WheelerIsland
Weth erbeeLake
WestSacramento
LisbonDistrict
GlideDistrict
LibertyIsland
CacheHaas
PetersPocket
GrizzlyBay
Grizzly Island
McMullinRanch
RiverJunction
KassouDistrict
ParadiseJunction
PescaderoDistrictPico-Naglee
Walthall
StarkTract
SmithTract
BoggsTract
WeberTract
Mossdale
Schafter-Pintail
EgbertTract
RD 017
Bear Creek
Mokel
umne
Rive
r
Cosumnes River
North
Mok
elum
ne
Sout
h
Mok
elum
ne
SacramentoPocket Area
Donlon Is.
LittleEgbertTract
LittleHolland
QSJR(San Joaquin River - Vernalis)
QCSMR(Cosumnes River- Michigan Bar)
QSAC(Sacramento River -Freeport)
QMOKE(Mokelumne River - Woodbridge)
QYOLO(Putah Creek - Davis)
QYOLO(Sac Weir Spill )
QYOLO(Yolo Bypass Woodland)
QMISC(Calaveras River- Stockton)
'MRZ'
Dry Creek
San Joaquin River
Sacramento River
LagunaDeer Creek
Cosu
mnes
Rive
r
Cache Creek
California Aqueduct
Delta Mendota Canal
Calaveras RiverBear Creek
Coon Creek
Stanislaus River
Auburn Ravine
Putah Creek
Willow Slough
Tuolumne River
Alemeda Creek
Arroyo Valle
Ulatis Creek
American River
Weber Creek
Littlejohns Creek
Feath
er Riv
er
Sutter Creek
Coyote Creek
Del Puerto Canyon
Willow Creek
Pleasant Grove Creek
Merced River
Arroyo Hondo
Rock
Cree
k
Orestim
ba Cree
k
San Antonio Creek
South Fork Putah Creek
Smith Creek
Main Canal
French Camp Slough
Folsom Dam
Arroyo Valle
Dry Creek
Folsom Lake
Comanche Reservoir
Pardee Reservoir
Farmington Flood Control Basin
Woodward Reservoir
Lake Del Valle
Lake Natoma
Calaveras Reservoir
San Antonio Reservoir
Lake Chabot
Upper San Leandro Reservoir
Briones Reservoir
50
101
5
505
880
680580
205
280
580
Note: E = Event H= Hourly
LegendCDEC Stations with Flow Data
Legal Delta and Suisun Marsh
Water
Islands
Uplands
Undesignated Islands
0 3 6 9 121.5Miles
UR
S C
orpo
ratio
n P
:\GIS
\GIS
_Pro
ject
_File
s\O
rigin
alD
ata\
Dat
a\R
egio
nal_
Dat
a\C
DE
C_s
tatio
ns\s
tatio
ns_w
ith_f
low
_dat
a.m
xd D
ate:
12/
11/2
006
2:35
:15
PM
Nam
e: s
mle
wis
0
DRMS
26815431Figure
7-1Flow Stations Used withFlood Hazard Analysis

SECTIONSEVEN Flood Risk Analysis
Y:\DRMS\Public Draft\Risk Analysis Report\Section 7\Section 7 Draft 2 (06-25-07).doc 2
Figure 7-2 Historical Delta Inflows
Figure 2-2a: Total Delta Inflow - WY 1956 Through WY 2005
0
100,000
200,000
300,000
400,000
500,000
600,000
700,000
1-O
ct-5
5
1-O
ct-5
9
1-O
ct-6
3
1-O
ct-6
7
1-O
ct-7
1
1-O
ct-7
5
1-O
ct-7
9
1-O
ct-8
3
1-O
ct-8
7
1-O
ct-9
1
1-O
ct-9
5
1-O
ct-9
9
1-O
ct-0
3
1-O
ct-0
7
Date
Inflo
w, c
fs
0
100,000,000
200,000,000
300,000,000
400,000,000
500,000,000
600,000,000
700,000,000
Cum
ulat
ive
Tota
l Inf
low
, cfs
-day
s
TOT Cum. Total Figure 2-2b: Sac+Yolo Inflows - WY 1956 Through WY 2005
0
100,000
200,000
300,000
400,000
500,000
600,000
700,000
1-O
ct-5
5
1-O
ct-5
9
1-O
ct-6
3
1-O
ct-6
7
1-O
ct-7
1
1-O
ct-7
5
1-O
ct-7
9
1-O
ct-8
3
1-O
ct-8
7
1-O
ct-9
1
1-O
ct-9
5
1-O
ct-9
9
1-O
ct-0
3
1-O
ct-0
7
Date
Inflo
w, c
fs
0
100,000,000
200,000,000
300,000,000
400,000,000
500,000,000
600,000,000
700,000,000
Cum
ulat
ive
Sac
+Yol
o In
flow
, cfs
-day
s
Sac+Yolo Cum(Sac+Yolo) Figure 2-2c: SJR Inflow - WY 1956 Through WY 2005
0
10,000
20,000
30,000
40,000
50,000
60,000
70,000
80,000
90,000
1-O
ct-5
5
1-O
ct-5
9
1-O
ct-6
3
1-O
ct-6
7
1-O
ct-7
1
1-O
ct-7
5
1-O
ct-7
9
1-O
ct-8
3
1-O
ct-8
7
1-O
ct-9
1
1-O
ct-9
5
1-O
ct-9
9
1-O
ct-0
3
1-O
ct-0
7
Date
Inflo
w, c
fs
0
10,000,000
20,000,000
30,000,000
40,000,000
50,000,000
60,000,000
70,000,000
80,000,000
90,000,000
Cum
ulat
ive
SJR
Inflo
w, c
fs-d
ays
SJR Cum. SJR

SECTIONSEVEN Flood Risk Analysis
Y:\DRMS\PUBLIC DRAFT\RISK ANALYSIS REPORT\SECTION 7\SECTION 7 DRAFT 2 (06-25-07).DOC 1
15-Oct-62
14-Oct-6216-Oct-62
17-Oct-62
0
100,000
200,000
300,000
400,000
500,000
600,000
700,000
1-Ja
n
2-A
pr
2-Ju
l
1-O
ct
31-D
ec
Time of Year
Peak
Del
ta In
flow
Flows >200,000 150,000<Flows<200,000 100,000<Flows<150,000 Flows<100,000
Figure 7-3 Temporal Distribution of Peak Delta Inflows

Figure 7-4: ALL SEASONS FLOW FREQUENCY(CL = Confidence Limit %)
0
1,000,000
2,000,000
3,000,000
4,000,000
5,000,000
6,000,000
7,000,000
0.0001 0.0010 0.0100 0.1000 1.0000
Annual Probability of Exceedence
Del
ta In
flow
, cfs
CL = 99% CL = 97.5% CL = 95% CL = 90% CL = 80% CL = 60% CL = 50%CL = 40% CL = 20% CL = 10% CL = 5% CL = 2.5% CL = 1%

tabFig 3-2 High Season Chart 6ig,vol4-freq anal 11-17-06.xls-Fig 3-2 High Season Chart 6
Figure 7-5: HIGH RUNOFF SEASON - INFLOW FREQUENCY(CL = Confidence Limit %)
0
1,000,000
2,000,000
3,000,000
4,000,000
5,000,000
6,000,000
7,000,000
0.0001 0.0010 0.0100 0.1000 1.0000
Annual Probability of Exceedence
Del
ta In
flow
, cfs
CL = 99% CL = 97.5% CL = 95% CL = 90% CL = 80% CL = 60% CL = 50%CL = 40% CL = 20% CL = 10% CL = 5% CL = 2.5% CL = 1%
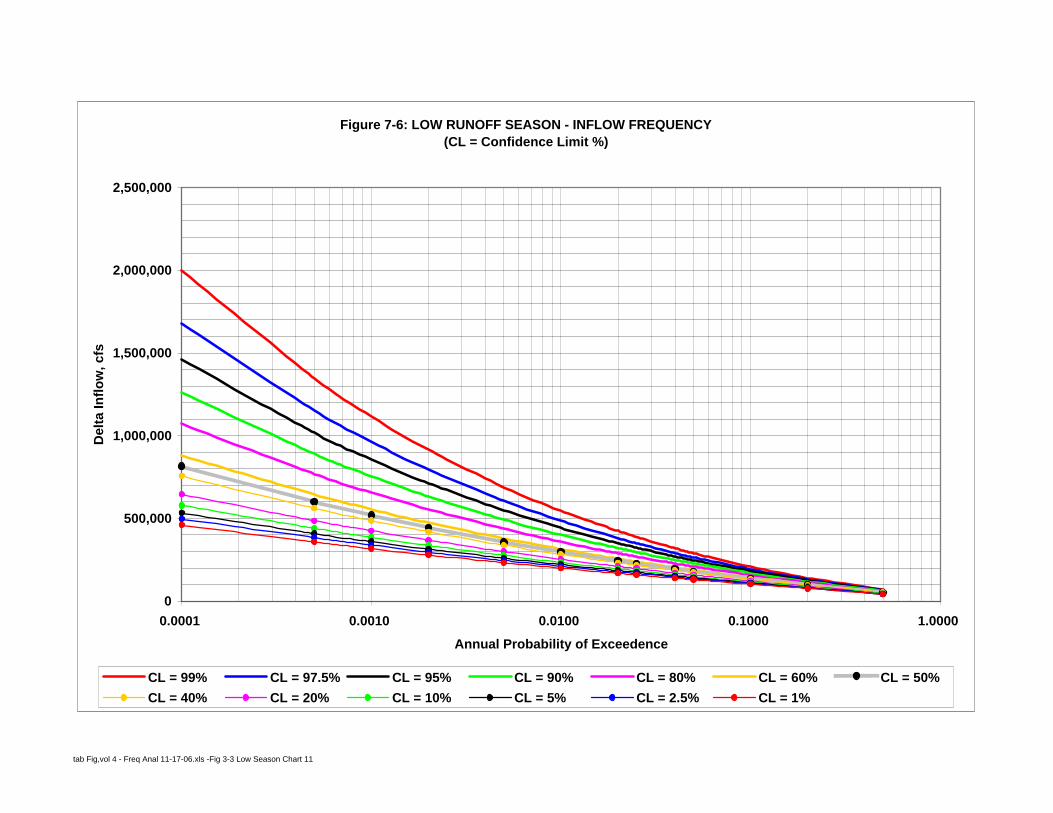
tab Fig,vol 4 - Freq Anal 11-17-06.xls -Fig 3-3 Low Season Chart 11
Figure 7-6: LOW RUNOFF SEASON - INFLOW FREQUENCY(CL = Confidence Limit %)
0
500,000
1,000,000
1,500,000
2,000,000
2,500,000
0.0001 0.0010 0.0100 0.1000 1.0000
Annual Probability of Exceedence
Del
ta In
flow
, cfs
CL = 99% CL = 97.5% CL = 95% CL = 90% CL = 80% CL = 60% CL = 50%CL = 40% CL = 20% CL = 10% CL = 5% CL = 2.5% CL = 1%

tAB fIG, VOL 4 - fREQ aNAL 11-17-06.XLS
Figure 7-7: COMPARISON BETWEEN INFLOW-FREQUENCY CURVES, CL = 50%(CL = Confidence Limit %)
0
500,000
1,000,000
1,500,000
2,000,000
2,500,000
3,000,000
0.0001 0.001 0.01 0.1 1
Annual Probability of Exceedence
Del
ta In
flow
, cfs
High Inflow Season Low Inflow SeasonAll Seasons Weibull Plotting Position - High Inflow SeasonWeibull Plotting Position - Low Inflow Season

SECTIONSEVEN Flood Risk Analysis
Y:\DRMS\PUBLIC DRAFT\RISK ANALYSIS REPORT\SECTION 7\SECTION 7 DRAFT 2 (06-25-07).DOC 6
Figure 7-8 Flow in Sacramento River Plus Yolo Bypass Versus Total Delta Inflow
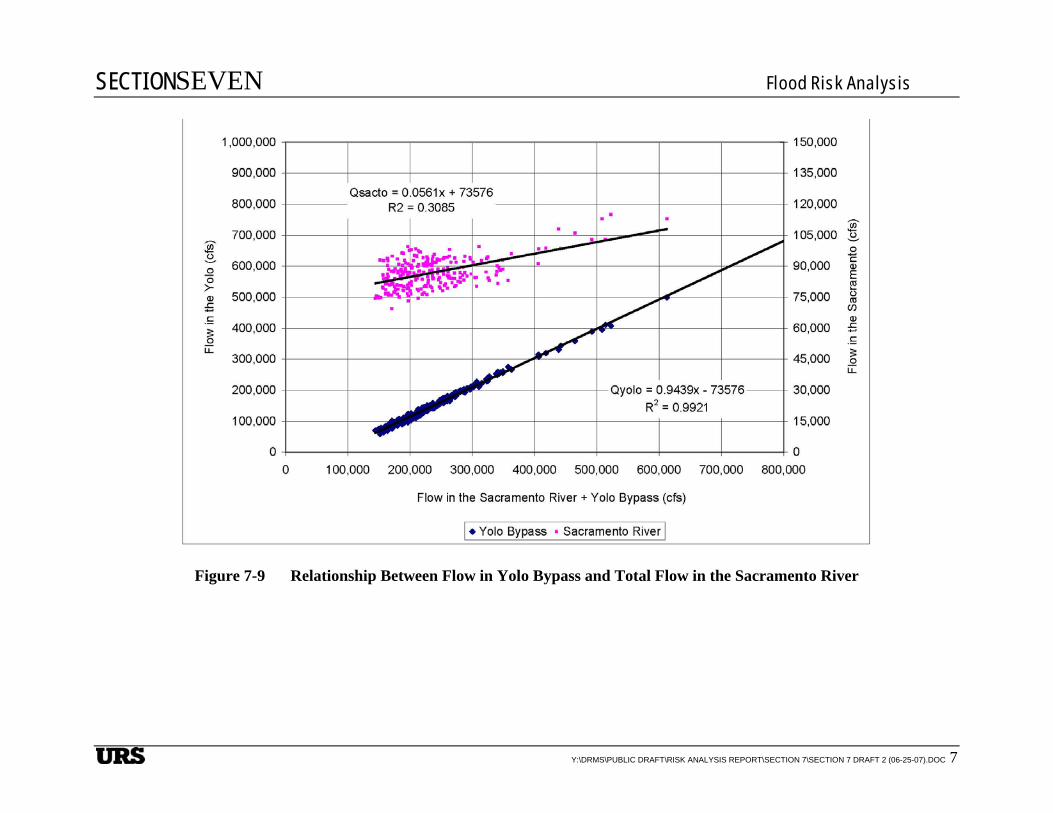
SECTIONSEVEN Flood Risk Analysis
Y:\DRMS\PUBLIC DRAFT\RISK ANALYSIS REPORT\SECTION 7\SECTION 7 DRAFT 2 (06-25-07).DOC 7
Figure 7-9 Relationship Between Flow in Yolo Bypass and Total Flow in the Sacramento River
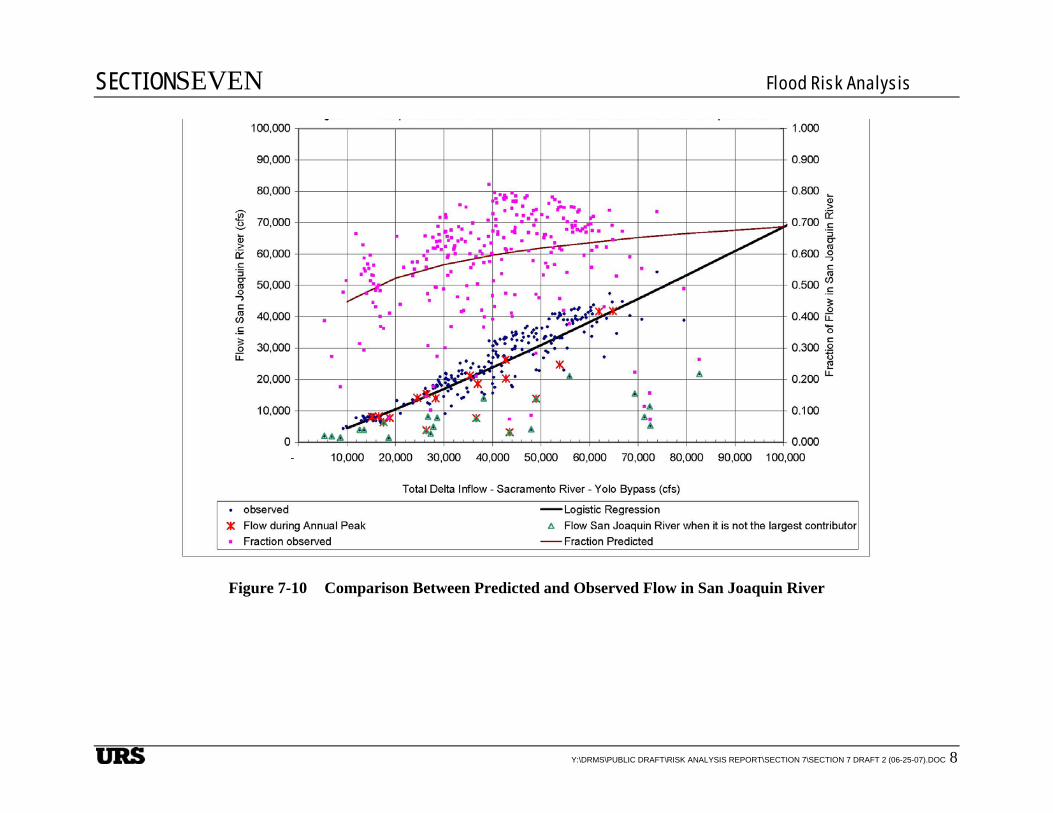
SECTIONSEVEN Flood Risk Analysis
Y:\DRMS\PUBLIC DRAFT\RISK ANALYSIS REPORT\SECTION 7\SECTION 7 DRAFT 2 (06-25-07).DOC 8
Figure 7-10 Comparison Between Predicted and Observed Flow in San Joaquin River

SECTIONSEVEN Flood Risk Analysis
Y:\DRMS\PUBLIC DRAFT\RISK ANALYSIS REPORT\SECTION 7\SECTION 7 DRAFT 2 (06-25-07).DOC 9
Figure 7-11 Comparison Between Predicted and Observed Flows in MISC Inflow
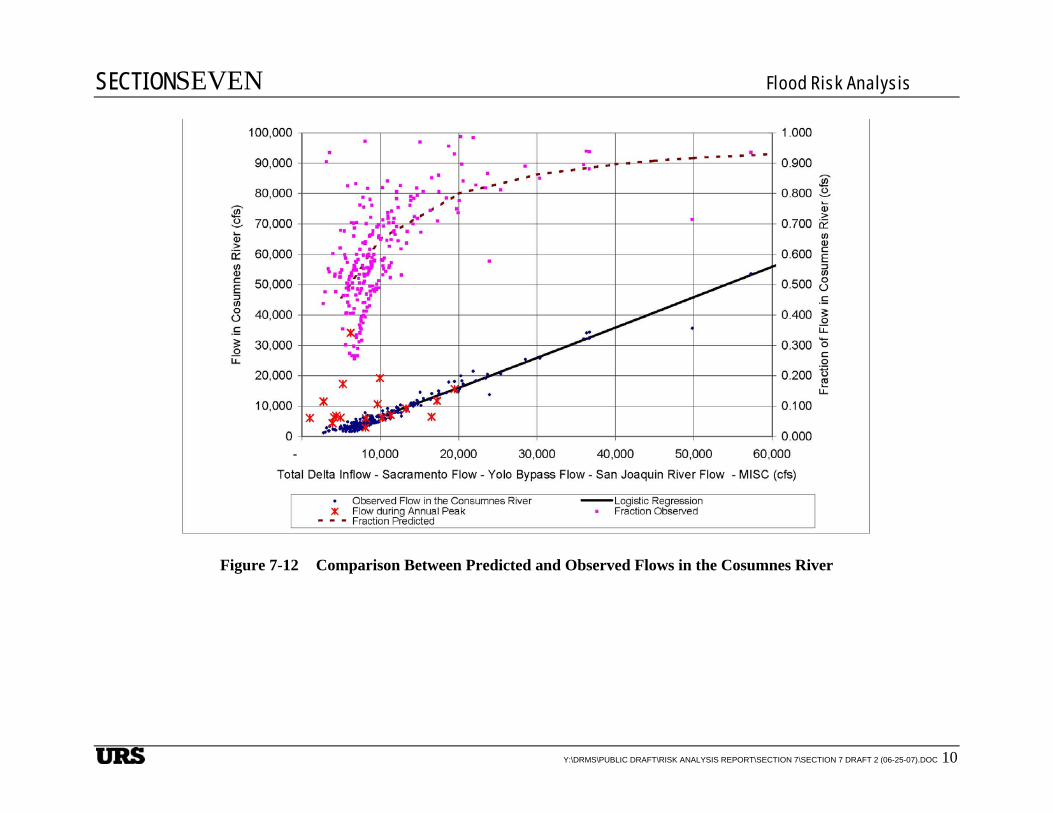
SECTIONSEVEN Flood Risk Analysis
Y:\DRMS\PUBLIC DRAFT\RISK ANALYSIS REPORT\SECTION 7\SECTION 7 DRAFT 2 (06-25-07).DOC 10
Figure 7-12 Comparison Between Predicted and Observed Flows in the Cosumnes River

SECTIONSEVEN Flood Risk Analysis
Y:\DRMS\PUBLIC DRAFT\RISK ANALYSIS REPORT\SECTION 7\SECTION 7 DRAFT 2 (06-25-07).DOC 11
Figure 7-13 Comparison Between Measured and Predicted Flows in the Sacramento River and Yolo Bypass
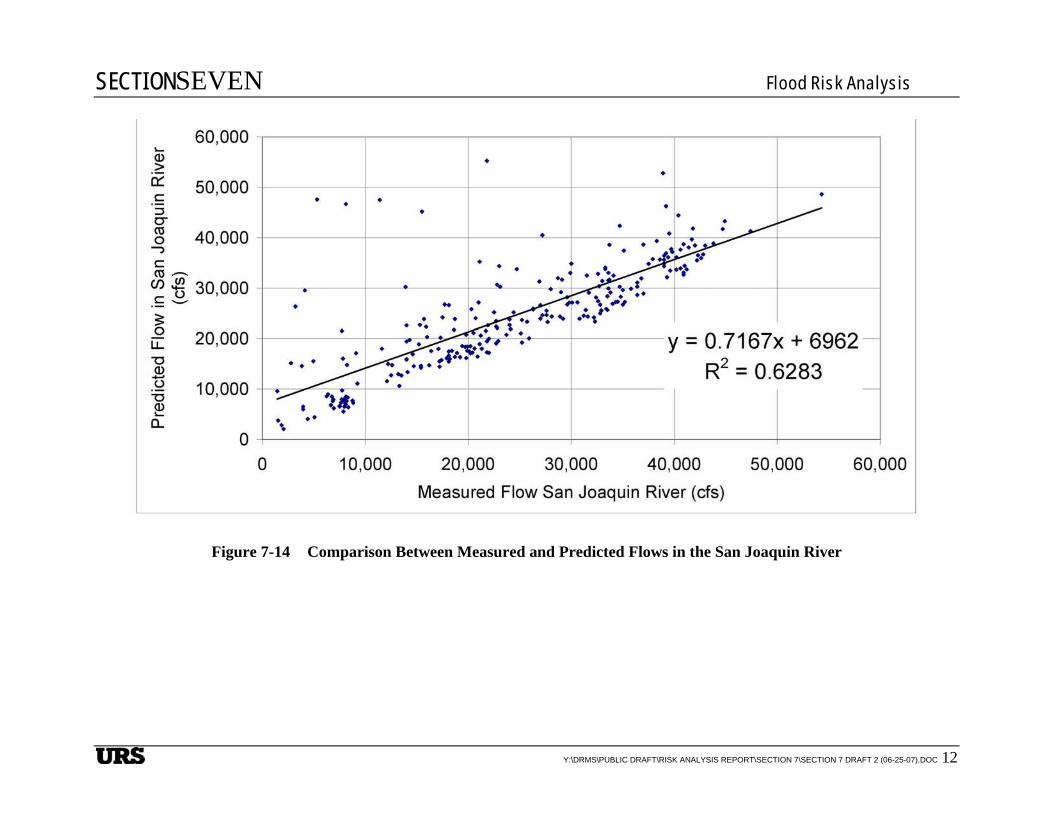
SECTIONSEVEN Flood Risk Analysis
Y:\DRMS\PUBLIC DRAFT\RISK ANALYSIS REPORT\SECTION 7\SECTION 7 DRAFT 2 (06-25-07).DOC 12
Figure 7-14 Comparison Between Measured and Predicted Flows in the San Joaquin River

SECTIONSEVEN Flood Risk Analysis
Y:\DRMS\PUBLIC DRAFT\RISK ANALYSIS REPORT\SECTION 7\SECTION 7 DRAFT 2 (06-25-07).DOC 13
Figure 7-15 Comparison Between Predicted and Measured Flows in the Miscellaneous Inflows
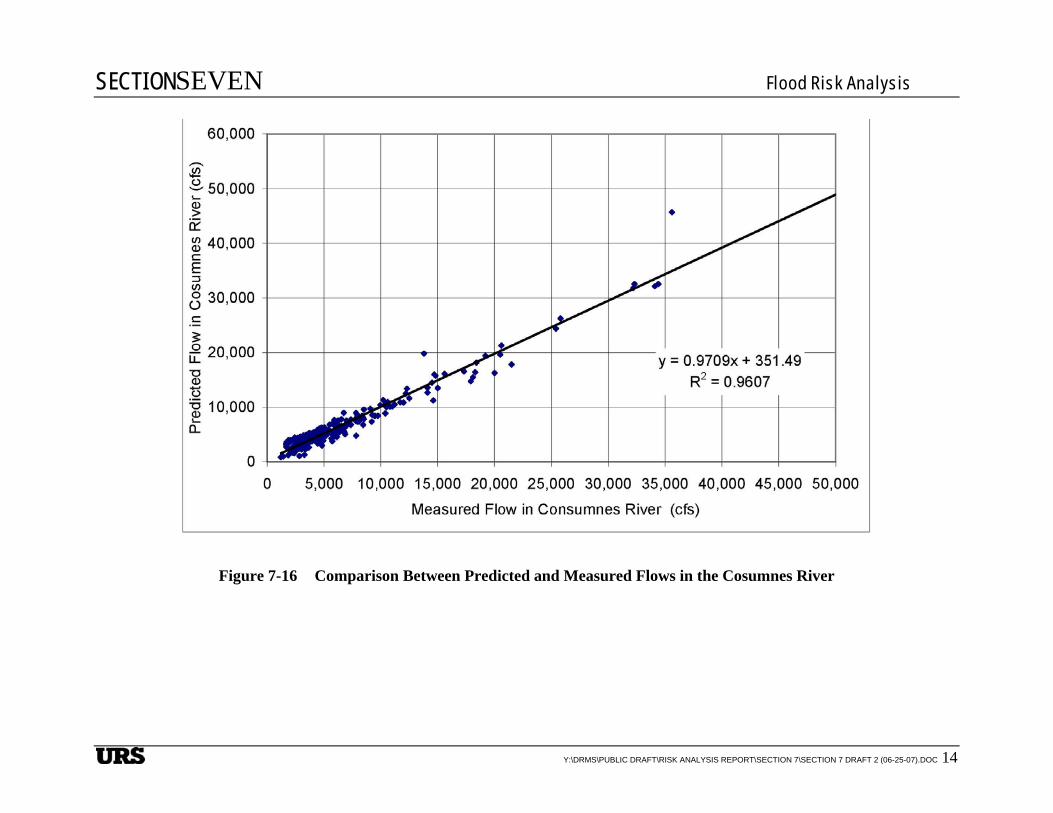
SECTIONSEVEN Flood Risk Analysis
Y:\DRMS\PUBLIC DRAFT\RISK ANALYSIS REPORT\SECTION 7\SECTION 7 DRAFT 2 (06-25-07).DOC 14
Figure 7-16 Comparison Between Predicted and Measured Flows in the Cosumnes River

MHR E: 04/24/2001 to present
MTB E: 10/30/2002 to presentH: 10/07/1999 to 10/31/2002
BAC E: 03/08/2000 to presentH: 03/08/2000 to present
VNI H: 01/02/1985 to present
GSS E: 09/25/2003 to present
BEN E: 02/24/1995 to presentH: 01/01/1984 to present
SSS E: 09/25/2003 to present
FPTH: 01/01/1984 to presentLIS
E: 02/24/1995 to presentH: 01/01/1984 to present
SJL E: 02/27/2002 to present
OLD E: 04/06/2005 to presentH: 03/29/1985 to present
MALH: 10/01/1987 to present
BDLH: 09/22/1988 to present
RORH: 01/01/1987 to present
QSJR(San Joaquin River - Vernalis)
QCSMR(Cosumnes River- Michigan Bar)
QSAC(Sacramento River -Freeport)
QMOKE(Mokelumne River - Woodbridge)
QYOLO(Putah Creek - Davis)
QYOLO(Sac Weir Spill )
QYOLO(Yolo Bypass Woodland)
QMISC(Calaveras River- Stockton)
ORB E: 08/28/2000 to present
'ORB'
'VNI'
'SSS'
'ROR'
'MTB''MHR'
'MAL'
'LIS'
'GSS'
'FPT'
'BDL'
'BAC'
'SJR'
'SJL''OLD'
'BEN'
50
101
5
80
505
880
680580
205
280
580
Folsom Lake
Sacramento River
San Joaquin River
Comanche Reservoir
Big Break
Lake Berryessa
Pardee Reservoir
Carquinez Strait Sherman Lake
Farmington Flood Control Basin
Woodward Reservoir
Lake Del Valle
Lake Natoma
Broad SloughMiddle River
Calaveras Reservoir
San Antonio Reservoir
Montezuma Slough
Lake Chabot
Upper San Leandro Reservoir
Horseshoe Bend
Disappointment SloughNew York Slough
Briones Reservoir
Dry Creek
San Joaquin River
Sacramento River
LagunaDeer Creek
Cosumnes RiverOld
River
Cache Creek
California Aqueduct
Delta Mendota Canal
Calaveras RiverBear Creek
Coon Creek
Stanislaus River
Auburn Ravine
Willow Slough
Tuolumne River
Alemeda Creek
Arroyo Valle
Ulatis Creek
American River
Weber Creek
Littlejohns Creek
Feath
er Riv
er
Sutter Creek
Coyote Creek
Del Puerto Canyon
Willow Creek
Pleasant Grove Creek
Merced River
Cache Slough
Arroyo Hondo
Rock
Cree
k
Orestim
ba Cree
k
Steam
boat
Sloug
h
San Antonio Creek
South Fork Putah Creek
Smith Creek
Main Canal
Arroyo Valle
Dry Cree
k
Note: E = Event H= Hourly
LegendCDEC Stations with Flow DataCDEC Delta Stations with Stage DataLegal Delta and Suisun MarshWaterIslandsUplandsUndesignated Islands
0 3 6 9 121.5Miles
URS C
orpora
tion P
:\GIS
\GIS
_Proj
ect_F
iles\O
rigina
lData\
Data\
Regio
nal_D
ata\C
DEC_
statio
ns\S
tation
s_us
ed_fo
r_reg
ressio
n_an
alyse
s.mxd
Date
: 12/1
4/200
6 2:20
:39 PM
Nam
e: sm
lewis0
DRMS26815431
Figure7-171
Stations Used forRegression Analyses

Figure7-18
DRMS26815431
100-year Flood Elevationsin the Delta
Martinez Antioch
Fairfield
Tracy
Stockton
Sacramento
0 2010Miles
FEMA 100-yearwater surface elevations
Median water surface elevationsfor median 100-year total Delta inflow
Median water surface elevationsfor median 100-year total Delta inflow,
10% confidence level for Sacramento River inflow,90% confidence level for San Joaquin River inflow
MartinezAntioch
Fairfield
Tracy
Stockton
Sacramento
Martinez Antioch
Fairfield
Tracy
Stockton
Sacramento
Water surface elevationin feet (NAVD88)
0 - 1010 - 1515 - 2020 - 2525 - 3030 - 3535 - 4040 - 4545 - 5050 - 5555 - 60

FranksTract
Sevenmile Slough
DELTACROSS
CHANNEL
Islan
d
LindseySlough
Victoria Canal
North Canal
Tra pper SloughNorth Victor ia CanalWoodward Canal
Whiskey Slough
Empire Cut
Indian Sloug h
Grant Line CanalFabian and Bell Canal
Italia
n Slou
gh
SloughRock
Dutch Slough
Taylor Sl.
Piper Slough
Conn
ecti on Sl.
ColumbiaCut
Mound Slough
Holland Cut
Latha
mSl.
Turner Cut
Li tt le C o nn ection Sl.
DissapointmentSlough
White
SloughPotato Slough
Lit t l
e Pot
ato S
l.
Bur ns Cutoff
Fourteen- Mile Slough
Fishe
rman
sCu
t
False
River
Thre
emile
Sloug
h
Hog Slough
Beaver Slough
SACRAMENTO
YOL O
B YPA
S S
RI V E R
SACRAMENTO
Water
Ship
Chan
nel
Sacr
amen
to De
ep
LittleTin sleyIslan d
Rho deIslan d
LittleMandeville
Islan d
Litt le Franks Tract
Lower RobertsIsland
UpperRobertsIsland
Netherlands
Veale Tract
Middle RobertsIsland
Union Island
GrandIsland
RyerIsland
Upper JonesTract
ByronTract
Lower JonesTract
DiscoveryBay
RIVER
JOAQUIN
Tyler
TerminousTract
Staten
Islan
dBrannan-Andrus
Island
PiersonDistrict
Sherman Island
New HopeTract
FabianTract
Brack Tract
RindgeTract
Canal RanchTract
VictoriaIsland
WebbTract
StewartTract
Bacon Island
BouldinIsland
McDonaldIsland
Merritt
Islan
d
HastingsTract
HollandTract
BishopTract
Mandeville Island
ByronTract
BethelIsland
EmpireTract King
Island
Jersey Island
Venice Island
PalmTract
Sh ima Tract
TwitchellIsland
Sutte
r Isla
nd
HotchkissTract
SargentBarnhart
Tract
Orwood Tract
Shin KeeTract
Van SickleIsland Br
adfo
rdIsl
and
Wright-
Elmwood
Tract
Woodward
Island
Glanvil le Trac
t
CliftonCourt
Forebay
Rio BlancoTract
ChippsIsland
BrownsIsland
Pros
pect
Islan
d
MedfordIsland
ConeyIsland
Mildr
ed Is
.
McCorm
ack
William
son T
ract
Rough andReady Is land
Quimby Is.
Decker
Island
Winter Island KimballIsland
Deadho rseIslan d
FayIslan d
Neville Is land
Syc am o re I sla n d
SA N
SUISUNMARSH
Sycamore Slough
Stea
mboa
t
S lou
ghGe
orgian
a
Slough
Sutt e
rSlo
ugh
Elk
Slou g
h
Sn odgr ass Slough
Honker BayClub
Simmons-WheelerIsland
Wet h e rb e eLa k e
WestSacramento
LisbonDistrict
GlideDistrict
LibertyIsland
CacheHaas
PetersPocket
GrizzlyBay
Grizzly Island
McMullinRanch
RiverJunction
KassouDistrict
ParadiseJunction
PescaderoDistrictPico-Naglee
Walthall
StarkTract
SmithTract
BoggsTract
WeberTract
Mossdale
Schafter-Pintail
EgbertTract
RD 017
Bear Creek
Mokelumne R
iver Cosumnes River
NorthMok
elumne
Sout
h
Moke
lumne
SacramentoPocket Area
Donlon Is.
LittleEgbertTract
LittleHolland
0 5 102.5 Miles Figure7-191
DRMS26815431 UR
S Co
rpora
tion P
:\GIS
\GIS
_Pro
ject_F
iles\M
XD\A
nalys
is\Le
vee F
ailur
e Pote
ntial\
Prob
lem A
reas
, Fail
ure A
reas\H
istori
cal In
unda
tion.m
xd D
ate: 1
/26/20
07 8:
03:43
AM
Name
: sml
ewis0
Historic Island Breachesin the Delta and Suisun Marsh
Since 1900
Historic Inundation0
1
2
3
4
5
6
7
8
Number of Occurrences

FranksTract
Sevenmile Slough
DELTACROSS
CHANNEL
Island
LindseySlough
Victoria Canal
North Canal
Trapper Slough
North Victoria CanalWoodward Canal
Whiskey Slough
Empire Cut
Indian Slough
Grant Line CanalFabian and Bell Canal
Italia
n Slou
gh
SloughRock
Dutch Slough
Taylor Sl.
Piper Slough
Conn
ection Sl.
ColumbiaCut
Mound Slough
Holland Cut
Latham
Sl.
Turner Cut
Little Connection Sl.
DissapointmentSlough
White
SloughPotato Slough
Little
Pot a
to Sl.
Burns Cutoff
Fourteen- Mile Slough
Fishe
rman
sCu
t
False
River
Three
mile
Sloug
h
Hog Slough
Beaver Slough
SACRAMENTO
YOL O
B YPA
S S
RI V E R
SACRAMENTO
Water
Ship
Chan
nel
Sacra
mento
Deep
LittleTinsleyIsland
RhodeIsland
LittleMandeville
Island
Little Franks Tract
Lower RobertsIsland
UpperRobertsIsland
Netherlands
Veale Tract
Middle RobertsIsland
Union Island
GrandIsland
RyerIsland
Upper JonesTract
ByronTract
Lower JonesTract
DiscoveryBay
RIVER
JOAQUIN
Tyler
TerminousTract
Staten
Islan
d
Brannan-AndrusIsland
PiersonDistrict
Sherman Island
New HopeTract
FabianTract
Brack Tract
RindgeTract
Canal RanchTract
VictoriaIsland
WebbTract
StewartTract
Bacon Island
BouldinIsland
McDonaldIsland
Merritt
Island
HastingsTract
HollandTract
BishopTract
Mandeville Island
ByronTract
BethelIsland
EmpireTract King
Island
Jersey Island
Venice Island
PalmTract
Sh ima Tract
TwitchellIsland
Sutte
r Islan
d
HotchkissTract
SargentBarnhart
Tract
Orwood Tract
Shin KeeTract
Van SickleIsland Br
adfor
dIsl
and
Wright-
Elmwood
Tract
Woodward
Island
Glanvil le Trac
t
CliftonCourt
Forebay
Rio BlancoTract
ChippsIsland
BrownsIsland
Pros
pect
Islan
d
MedfordIsland
ConeyIsland
Mildr
ed Is
.
McCorm
ack
Williamson
Tract
Rough andReady Island
Quimby Is.
Decker
Island
Winter Island KimballIsland
DeadhorseIsland
FayIsland
Neville Island
Sycamore Is land
SAN
SUISUNMARSH
Sycamore Slough
Stea
mboa
t
Sloug
hGe
orgian
a
Slough
Sutte
rSlo
ugh
Elk
Sloug
h
Snodgrass Slough
Honker BayClub
Simmons-WheelerIsland
WetherbeeLake
WestSacramento
LisbonDistrict
GlideDistrict
LibertyIsland
CacheHaas
PetersPocket
GrizzlyBay
Grizzly Island
McMullinRanch
RiverJunction
KassouDistrict
ParadiseJunction
PescaderoDistrictPico-Naglee
Walthall
StarkTract
SmithTract
BoggsTract
WeberTract
Mossdale
Schafter-Pintail
EgbertTract
RD 017
Bear Creek
Mokelum
ne Rive
r Cosumnes River
North
Mokelu
mne
South
Mokel
umne
SacramentoPocket Area
Donlon Is.
LittleEgbertTract
LittleHolland
'04
'05'06
'86
'97
'97 '97'97
'97'97'97
'97
'97'97'97
'56'83
'86
'82'83
'83'80
'04
'86'86'86
'86'86
'86
'86
'83
'06
'98
'37 '69'27
'04
'69
'83'07
'80
'38'80
'07'36
'38
'83
'50
'82
'38
'38'80
'50 '72
'86'86
'80'86
'86
'86 '86
'86 OT
'83 (twice)
'83 (twice)
'86
'07
'82
'55
'82 OT
'86 OT'94
0 5 102.5 Miles Locations of Levee Failures Figure7-202
DRMS26815431 UR
S Co
rporat
ion P:
\GIS\
GIS_
Proje
ct_Fil
es\M
XD\A
nalys
is\Le
vee F
ailure
Poten
tial\P
roblem
Area
s, Fa
ilure
Area
s\Fail
ure Ar
eas.m
xd D
ate: 1
1/28/2
006 2
:44:25
PM
Name
: dhw
righ0
LegendLevee FailuresSummer Failures
Year
Year

Figure 7-21
Project No. 26815621
Cumulative Number of Island BreachesSince 1900
Delta Risk Management Strategy (DRMS)Levee Fragility
0
20
40
60
80
100
120
140
160
180
1900 1910 1920 1930 1940 1950 1960 1970 1980 1990 2000
Years
No.
of I
slan
d B
reac
hes
Average Annual Failures 1.32/yr 1.84/yr

Program Funding Level
0
5
10
15
20
25
30
35
1940 1950 1960 1970 1980 1990 2000 2010
Year
Prog
ram
Fun
ding
Lev
el
(Mill
ions
of D
olla
rs)
T o ta l In f lo w s (c fs )
0
1 0 0 0 0 0
2 0 0 0 0 0
3 0 0 0 0 0
4 0 0 0 0 0
5 0 0 0 0 0
6 0 0 0 0 0
7 0 0 0 0 0
1/1/
194
0
1/1/
194
5
1/1/
1950
1/1/
1955
1/1
/196
0
1/1/
196
5
1/1/
1970
1/1
/197
5
1/1/
1980
1/1/
198
5
1/1
/199
0
1/1/
199
5
1/1/
200
0
1/1/
2005
1/1/
201
0
T i m e
Infl
ow
(cf
s
Figure 7-22
Project No. 26815621
Cumulative Number of Island Breaches Since 1950, Funding Level,
and Total Inflows Since 1955
Delta Risk Management Strategy (DRMS)Levee Fragility
Cumulative Number of Flooded Islands
0 10 20 30 40 50 60 70 80 90
1940 1950 1960 1970 1980 1990 2000 2010 Year
es
No.
of I
slan
d B
reac
hes
7-22(a)
7-22(b)
Inflo
w (c
fs)
Annual Frequency 1951-1980 = 0.871981-2006 = 1.62
7-22(c)
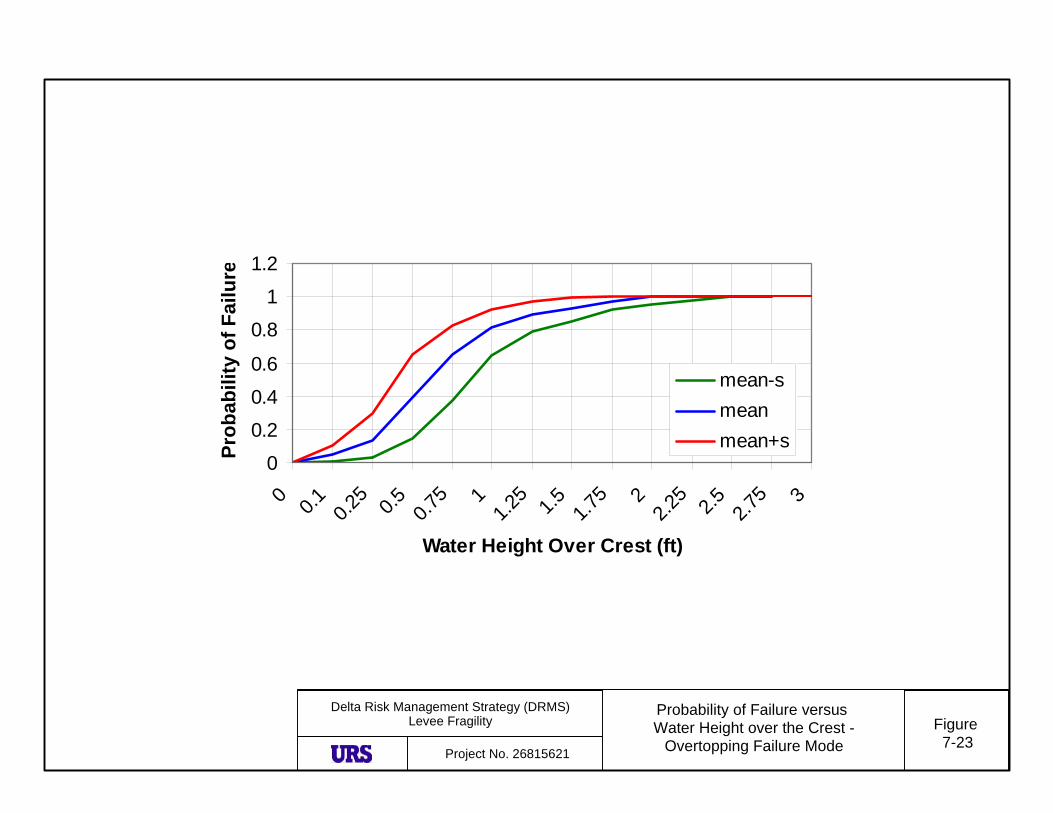
Figure 7-23
Project No. 26815621
Probability of Failure versus Water Height over the Crest -
Overtopping Failure Mode
Delta Risk Management Strategy (DRMS)Levee Fragility
0
0.2
0.4
0.6
0.8
1
1.2
0 0.1 0.25 0.5 0.75 1
1.25 1.5 1.75 2
2.25 2.5 2.75 3
Water Height Over Crest (ft)
Prob
abili
ty o
f Fai
lure
mean-smeanmean+s
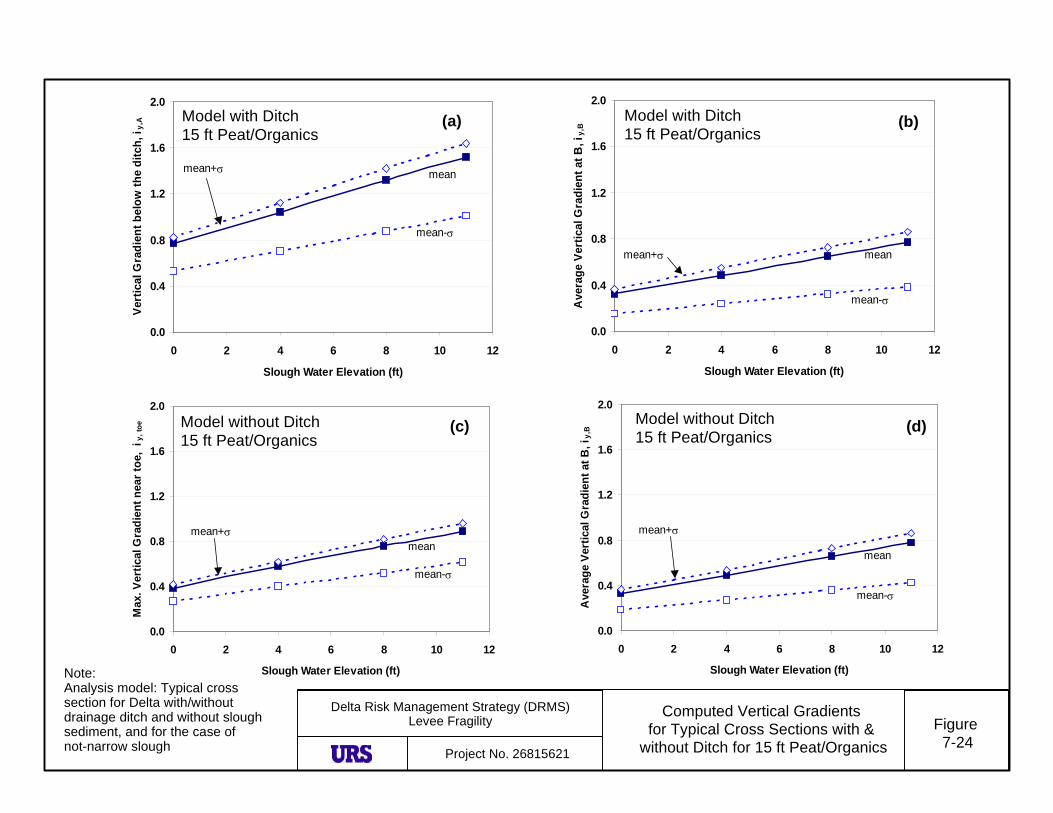
0.0
0.4
0.8
1.2
1.6
2.0
0 2 4 6 8 10 12
Slough Water Elevation (ft)
Max
. Ver
tical
Gra
dien
t nea
r toe
, i y
, toe
mean-σ
meanmean+σ
0.0
0.4
0.8
1.2
1.6
2.0
0 2 4 6 8 10 12
Slough Water Elevation (ft)
Ave
rage
Ver
tical
Gra
dien
t at B
, iy,
Bmean-σ
mean
mean+σ
Figure 7-24
Project No. 26815621
Computed Vertical Gradients for Typical Cross Sections with &
without Ditch for 15 ft Peat/Organics
Delta Risk Management Strategy (DRMS)Levee Fragility
Note:Analysis model: Typical cross section for Delta with/without drainage ditch and without sloughsediment, and for the case of not-narrow slough
0.0
0.4
0.8
1.2
1.6
2.0
0 2 4 6 8 10 12
Slough Water Elevation (ft)
Vert
ical
Gra
dien
t bel
ow th
e di
tch,
i y,A
mean-σ
mean mean+σ
0.0
0.4
0.8
1.2
1.6
2.0
0 2 4 6 8 10 12
Slough Water Elevation (ft)
Ave
rage
Ver
tical
Gra
dien
t at B
, iy,
B
mean-σ
mean mean+σ
Model with Ditch15 ft Peat/Organics
Model with Ditch15 ft Peat/Organics
Model without Ditch15 ft Peat/Organics
Model without Ditch15 ft Peat/Organics
(a) (b)
(c) (d)
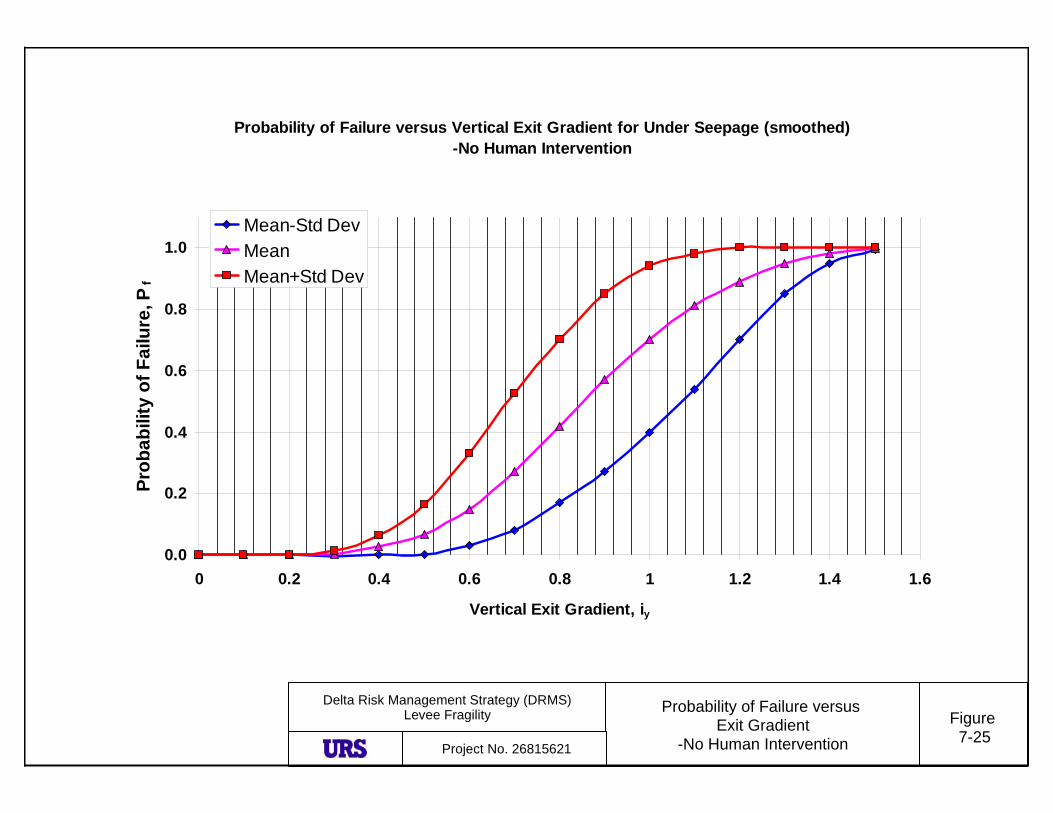
Figure 7-25
Project No. 26815621
Probability of Failure versus Exit Gradient
-No Human Intervention
Delta Risk Management Strategy (DRMS)Levee Fragility
Probability of Failure versus Vertical Exit Gradient for Under Seepage (smoothed)-No Human Intervention
0.0
0.2
0.4
0.6
0.8
1.0
0 0.2 0.4 0.6 0.8 1 1.2 1.4 1.6
Vertical Exit Gradient, iy
Prob
abili
ty o
f Fai
lure
, Pf
Mean-Std DevMeanMean+Std Dev

Figure 7-26
Project No. 26815621
Probability of Failure versus Exit Gradient
- With Human Intervention
Delta Risk Management Strategy (DRMS)Levee Fragility
Probability of Failure versus Vertical Exit Gradient for Under-seepage (Smoothed) - With Human Intervention
0.0
0.2
0.4
0.6
0.8
1.0
0 0.2 0.4 0.6 0.8 1 1.2 1.4 1.6
Vertical Exit Gradient, iy
Prob
abili
ty o
f Fai
lure
, Pf
Mean-Std DevMeanMean+Std Dev

Figure 7-27
Project No. 26815621
Probability of Failure versusFlood Stage
Delta Risk Management Strategy (DRMS)Levee Fragility
See
page
gra
dien
t
Flood Stage Seepage Gradient
Flood Stage
Pro
babi
lity
of F
ailu
re (%
)
Pro
babi
lity
of F
ailu
re (%
)
For Vulnerability Class i,