Embed Size (px)
Citation preview

Hydrogen, Fuel Cells, and Infrastructure Technologies FY 2002 Progress Report
Section V. Integrated Hydrogen and Fuel Cell Demonstration/Analysis
535

Hydrogen, Fuel Cells, and Infrastructure Technologies FY 2002 Progress Report
536
Hydrogen, Fuel Cells, and Infrastructure Technologies FY 2002 Progress Report
V.A System Analysis
V.A.1 Analysis of Hydrogen Production Using Ammonia and Ammonia-Borane Complex for Fuel Cell Applications
Ali T-Raissi (Primary Contact)University of Central FloridaFlorida Solar Energy CenterCocoa, FL 32922-5703(321) 638-1446, fax: (321) 638-1010, e-mail: [email protected]
DOE Technology Development Manager: Roxanne Danz (202) 586-7260, fax: (202) 586-4753, e-mail: [email protected]
Objectives• Analyze the viability (i.e. cost, safety, and performance) of ammonia-based chemical hydrides as
hydrogen (H2) storage compounds for fuel cell applications.• Identify the pros and cons of using ammonia (NH3) as a chemical carrier for H2.• Evaluate the viability of autothermal NH3 reformation on-board fuel cell vehicles.• Analyze the viability (cost and performance) of using ammonia-borane complex (H3BNH3) as a
chemical hydrogen storage medium on-board fuel cell vehicles.• Identify technoeconomic barriers to the implementation and use of amine borane complexes, in
general, and H3BNH3, in particular, as prospective chemical hydrogen storage media on-board fuel cell vehicles.
Approach• Review all published papers, reports, patents, etc. in the past 50 years related to the development of
ammonia-based chemical hydrides as H2 storage compounds.• Develop contacts with and inquire about information from the researchers and/or companies involved
with the development of ammonia-based chemical hydrides.• Use FactSage Program to calculate and optimize the performance parameters for the autothermal
reformation of ammonia to hydrogen gas.• Compile information on the physiochemical properties and synthesis of ammonia-borane complex.• Compare the characteristics and costs of H3BNH3 as a hydrogen storage media to that of sodium
borohydride (NaBH4) and ionic hydrides such as lithium hydride (LiH) and calcium hydride (CaH2).• Identify possible approaches that have potential to significantly reduce the cost of ammonia-borane
synthesis.
Accomplishments• Reviewed and evaluated more than 120 published papers, reports, patents and other archival records
related to ammonia-based chemical hydrides, including amine borane complexes, as prospective chemical hydrogen storage compounds.
• Completed an assessment of the pros and cons of ammonia-based hydrogen storage compounds for vehicular fuel cell power applications.
537

Hydrogen, Fuel Cells, and Infrastructure Technologies FY 2002 Progress Report
• Used FactSage 5.1 Program for Computational Thermochemistry to determine the performance parameters for the autothermal reformation of NH3 gas to hydrogen.
• Evaluated a number of ammonia adducts, including H3BNH3, as non-toxic, non-cryogenic alternatives to ammonia for use in vehicular fuel cell applications.
• Completed a tentative evaluation of the production costs of ammonia- and amine borane-based hydrogen storage compounds.
• Identified the current high costs of ammonia-borane complex production as the main drawback to the successful implementation of H3BNH3 as a H2 storage compound for the vehicular fuel cell applications.
Future Directions• Complete technoeconomic analysis of ammonia-borane complex as a hydrogen storage compound for
fuel cell applications.• Conduct a thorough literature search to identify and evaluate new, more advanced and potentially
lower cost chemical processes for the synthesis of H3BNH3.
Introduction
The aim of this project is to assess the issues of cost, safety, performance, and environmental impact associated with the production of hydrogen (H2) by several methods, not presently funded by the U.S. DOE Hydrogen, Fuel Cell and Infrastructure Program. Three technology areas being evaluated are: 1) thermochemical reformation of methane (CH4) and hydrogen sulfide (H2S) gas with and without using solar energy; 2) ammonia (NH3) and ammonia adducts as hydrogen storing chemical hydrides for fuel cell applications; and 3) thermochemical water-splitting cycles suitable for solar power interface.
A report on the first topic involving an assessment of the thermochemical reformation of CH4/H2S has been submitted previously. This second report is concerned with the prospects of NH3 and ammonia-borane as hydrogen storage media for fuel cell applications.
Advantages and Drawbacks to Ammonia Use
Ammonia is the second largest synthetic commodity product of the chemical industry, with world production capacity exceeding 140 million metric tons. In 2000, the U.S. consumed in excess of 20 million metric tons of NH3. Anhydrous ammonia costs about $150 per short ton (f.o.b. U.S. Gulf Coast) or less than $6.25 per million BTU of H2
contained. Besides the large volume of production and use, and relatively low cost, NH3 has the following advantages as a hydrogen-rich fuel for fuel cell applications:
• Energy density - contains 17.8 weight % hydrogen (liquid ammonia stores 30% more energy per unit volume than liquid hydrogen).
• Infrastructure for NH3 transportation, distribution, storage and use already exists.
• Simplicity - its use requires no shift converter, selective oxidizer or co-reactants.
• No purification is needed for NH3 use with alkaline fuel cells (AFCs).
• Only 16% of the energy stored in NH3 is needed for its conversion to N2 and H2.
• There are good NH3 decomposition catalysts such as: ICI-47-1 (10 weight % nickel on alumina); Haldor Topsøe DNK-2R (triply promoted iron-cobalt); SÜD-Chemie 27-2 (nickel oxide on alumina); various supported nitrided catalysts (e.g. molybdenum nitride and nickel molybdenum nitride on - α
alumina); and ruthenium modified nickel oxide on alumina.
• Flammability range for ammonia -air (at 0°C and 1 atm) is much narrower than that for hydrogen-air mixtures (i.e. 16-27 volume % NH3 vs. 18.3-59 volume % H2).
538

Hydrogen, Fuel Cells, and Infrastructure Technologies FY 2002 Progress Report
• Using ammonia in fuel cell power plants does not generate carbon dioxide (CO2) or nitrogen oxides (NO2) emissions.
There are several drawbacks to ammonia as a fuel and chemical carrier for H2, especially in vehicular applications, including safety concerns with the widespread transportation, utilization and use of ammonia as a transportation fuel; storage requirements for sub-ambient temperatures and/or elevated pressures; and requirements for on-board reformation to liberate H2. These limitations make the widespread ammonia use as a transportation fuel problematic. Furthermore, cost and energy efficiency considerations dictate that any chemical hydride employed as a vehicular hydrogen storage medium, including ammonia, not require complicated on-board reformation in order to generate hydrogen.
To mitigate ammonia's shortcomings, our approach involved complexing NH3 with other hydrides to form compounds that are stable but not toxic or cryogenic. In particular, our approach considered a class of compounds (with generalized formula amine boranes [BxNxHy]) known as amine-boranes that contain H2 at gravimetric and volumetric densities comparable to that of anhydrous ammonia. The simplest known stable compound in this class is ammonia-borane, H3BNH3 (or borazane). Borazane is a white crystalline solid that when heated releases hydrogen in a sequence of reactions that occur at distinct temperature ranges. H3BNH3 contains about 20 weight % hydrogen and is stable in water and ambient air.
Physiochemical Properties and Synthesis of Ammonia-Borane Complex
Pyrolysis of ammonia-borane is a complex process, and the products of the decomposition reaction markedly depend on the conditions employed. Furthermore, the initial process is a solid-state reaction for which the onset of decomposition is a function of heating rate of the substrate (β). In thermogravimetric analyzer-Fourier transform infrared (TGA-FTIR) and thermogravimetric analyzer-differential scanning (TGA-DSC) analysis, heating a borazane sample to 90°C at a rate of 0.5°C/min and then holding it at that temperature for 200 min resulted in a loss of about 10.2% of initial
sample mass. FTIR analysis of the evolved gases has shown approximately one mol of H2 forming per mol of BH3NH3 reacted. Reaction products, in addition to hydrogen, have included monomeric aminoborane (BH2NH2) and a small amount of volatile borazine (B3N3H6). The monomeric aminoborane is unstable at room temperature, oligomerizing to form a non-volatile white solid residue of poly (aminoboranes) (BH2NH2)x. The inorganic analog of polyethylene, polymeric (NH2BH2)x, is still not fully characterized. Crystalline cyclic oligomers, (NH2BH2)n (where, n = 2, 3, 4, 5) have been prepared, and an amorphous (NH2BH2)x consisting of solvated linear chains with x= 3-5 has also been produced by gas-phase pyrolysis of ammonia-borane.
Unlike aminoborane oligomers, borazine (isoelectronic with benzene) is a volatile colorless liquid that boils at 55°C. Based on the TGA and DSC analysis, pyrolysis of ammonia-borane begins with a sharp endothermic peak that appears just above the melting point of BH3NH3 (112-114°C depending on the sample heating rate). Near 117°C, a steep exothermic peak occurs, reaching a maximum at about 130°C with rapid evolution of gas. A final broad exotherm appears near 150°C. Although processes other than step-wise decomposition and hydrogen loss are involved to some extent in H3BNH3 and its intermediate compounds, nonetheless the following sequence of events occur (BN = boron nitride, g = gas phase, [HBNH]x = polyborazine, [HBNH]3 = borazine, H2BNHx = monomeric aminoborane, [H2BNHx)x = polymeric aminoborane, kJ/mol = kilo Joule per mole, s = solid phase, ∆Hr = heat of reaction, β = heating rate):
H3BNH3 (l) → H2BNH2 (s) + H2 (g) ~137°C, β= 5-10°C/min, ∆Hr = – (21.7 ± 1.2) kJ/molx (H2BNH2) (s) → (H2BNH2)x (s) at ~125°C
(H2BNH2)x (s) → (HBNH)x (s) + x H2 (g) at ~155°C(HBNH)x (s) → borazine + other products(HBNH)3 → 3 BN + 3 H2 at above 500°C
(H2BNH2)x (s) → (BN)x (s) + 2x H2 (g) at ~ 450°C, β= 10°C/min
Due to the large amount of evolved H2 and the exothermicity of the process, ammonia-borane appears to be a more effective chemical carrier for H2 than anhydrous NH3. Other physicochemical
539

Hydrogen, Fuel Cells, and Infrastructure Technologies FY 2002 Progress Report
properties of ammonia-borane complex are given in Table 1 below.
Table 1. Selected Physiochemical Properties of Ammonia-Borane Complex
Another important factor is interaction with water and other solvents. Unlike ionic hydrides, NH3BH3 does not react violently with water. Table 2 depicts the solubilities of borazane in water and a number of organic solvents.
Borazane can be prepared through several indirect procedures including the reaction with lithium borohydride, LiBH4, in diethyl ether by either of the following two methods ( LiCl = lithium chloride, Li2SO4 = lithium sulfate, NH4Cl = ammonium chloride, [NH4]2SO4 = ammonium sulfate :
LiBH4 + NH4Cl – in diethyl ether → LiCl + H3BNH3 + H2
2 LiBH4 + (NH4)2SO4 – in diethyl ether → Li2SO4 +
2 H3BNH3 + 2 H2
Alternatively, H3BNH3 is prepared directly from the gases by reacting diborane with ammonia in polar organic solvents (e.g. ether and dioxan) and in aqueous media:
(diborane) B2H6 + 2 NH3 – in ether or dioxan → 2 H3BNH3
Table 2. Solubilities of Ammonia-Borane Complex in Various Solvents
For vehicular fuel cell applications, the main drawback to the use of amine-boranes, in general, and H3BNH3, in particular, is the present high cost of these compounds and lack of a suitable reformer design for the on demand generation of hydrogen. No data could be found for the large-scale production costs of ammonia-borane. However, the Callery Chemical Co manufactures large quantities of dimethylamine borane (DMAB), which has significant use in the electroless plating industry. Depending on the volume, the price of DMAB is in the range of about $75-100/lb. It can be expected that the large volume price of ammonia-borane would also be in this range. The issue of the cost of ammonia-borane can be highlighted by comparing its price to the bulk material prices for other chemical hydrides under consideration as hydrogen storage compounds. The feasibility of using various ionic hydrides as potential H2 storage compounds for AFC applications has been analyzed. This application requires a hydrogen storage system capable of supplying H2 to an AFC producing 1 kW of electrical power for 8 h. The fuel cell is assumed to operate at 57% efficiency (at 0.7 volt), requiring 231 mol of H2
Property Description
Formula NH3BH3
Molecular weight
30.86
X-ray structure
C4V symmetry; unit cell is tetragonal
Odor Ammonia-like
Density, kg/L 0.74
Melting point 112-114°C, slow decomposition at approx. 70°C
Heat of formation
∆Hf°= -178 ± 6 kJ/mol
Heat of combustion
∆Hc°= -1350 ± 3 kJ/mol
Water stability 10% solution stored at ambient temperatures:Dormancy % hydrogen loss4 days 1.811 days 3.61 month 4.82.5 months 9.318 months 45.0
Solvent Weight %
Temper-ature,
°C
Density of saturated
solution, kg/L
Water 26 23 0.89
Methanol 23 23 0.78
Ethyl Ether 0.80 24 0.71
Hexane 0.003 25 0.56
Benzene 0.03 25 0.87
Methylene Chloride
0.08 21 1.32
540
Hydrogen, Fuel Cells, and Infrastructure Technologies FY 2002 Progress Report
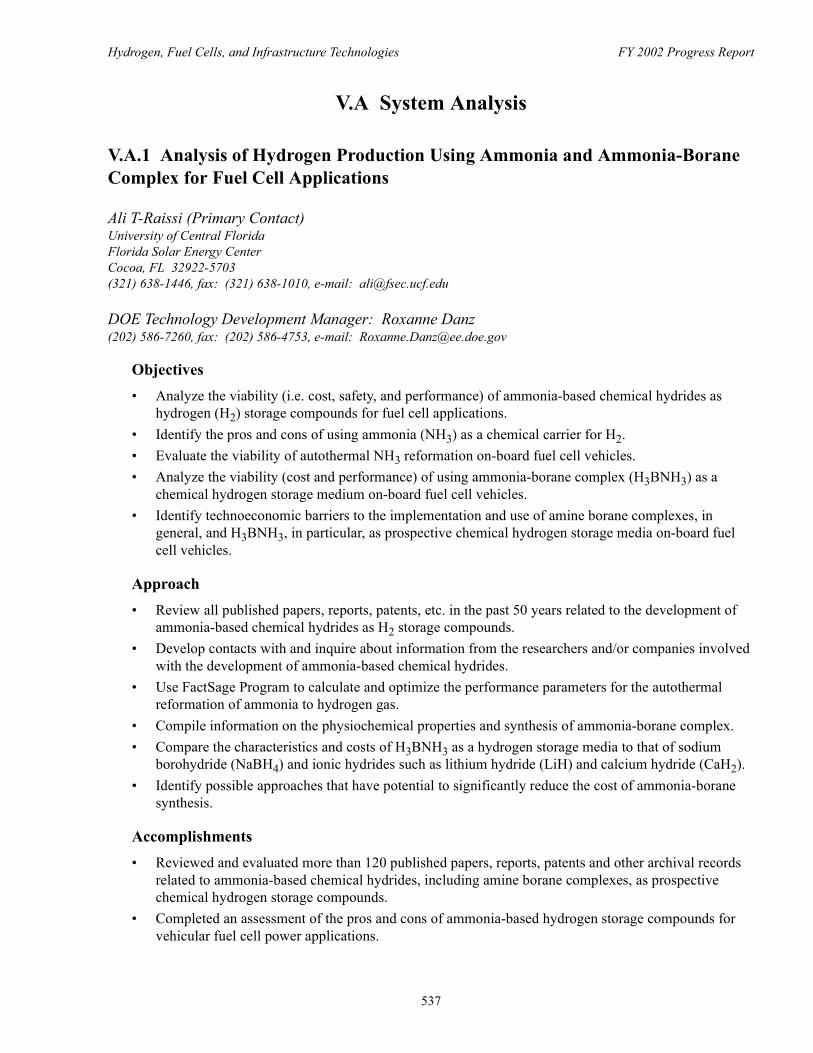
(assuming 100% utilization). Table 3 depicts the cost of several H2 storage media including H3BNH3.
Table 3. Required Mass, Volume and Cost of Chemical Hydrides for 8 hours/1 kW Duty
New chemical synthesis techniques and/or processes are needed to reduce the H3BNH3 production costs. In addition to the cost issues, new processes must be developed to allow recycling of the by-products of ammonia-borane decomposition on-board fuel cell powered vehicles. For example, if an on-board ammonia-borane based hydrogen storage system is to be developed for maximum H2 delivery, then it will be desirable, if not necessary, to be able to retrieve and recycle the boron nitride residue. Here, the challenge is to develop a chemical route for activating the boron-nitrogen bond in a manner analogous to dinitrogen bond activation in the Haber-Bosch process for ammonia synthesis. In a modern ammonia plant, steam reformation of natural gas is used as the primary source of hydrogen. A simple stoichiometric equation for ammonia production by steam methane reformation (SMR) is as follows:
CH4 + 0.3035 O2 + 1.131 N2 + 1.393 H2O → CO2 + 2.262 NH3
1.4345 AIR
In practical processes, a high degree of irreversibility exists, and a considerable amount of energy is needed to produce ammonia from methane, air and water. The stoichiometric quantity of methane required in the equation above is about 583 m3 per ton of NH3 produced. Energetically, this corresponds to approximately 20.9 giga-joule (GJ) per ton of NH3 (lower heating value). This is the minimum amount of energy needed per ton of ammonia produced using the SMR process. It is interesting to note that the best
energy figure reported for commercial ammonia production is about 27 giga Joule per metric ton (GJ/t) NH3. This figure corresponds to a rather high efficiency of around 75% with respect to the theoretical minimum of 20.9 GJ/t NH3, calculated as stoichiometric methane demand discussed above.
In a like manner, an idealized process for ammonia-borane synthesis from recycled BN (or borazine) may be written as:
CH4 + 1.33 BN + 2 H2O → CO2 + 1.33 H3BNH3
Or,
CH4 + 0.667 (HBNH)3 + 2 H2O → CO2 + 2 H3BNH3
If similar processes could be developed at energy conversion efficiency levels that are comparable to the present day SMR-based NH3 synthesis plants, then it would be possible to realize a major reduction in the production costs of ammonia-borane complex. We note that a concept similar to that discussed above has already been developed for nitric acid synthesis process based on boron nitride analogous to the Haber-Bosch route for nitric acid production from NH3. Finally, recent results have shown that unusual parallel behavior exists between hydrocarbons and their corresponding B-N analogues. Thus, hydrogenation of benzene to cyclohexane may also provide a model for the reformation of borazine to other amine-boranes.
Conclusions
There are many advantages to the use of NH3 as hydrogen source for vehicular fuel cell vehicle applications. However, a major drawback is ammonia's extreme toxicity and adverse health effects. By complexing NH3 with diborane, a stable, non-toxic and non-cryogenic material (H3BNH3) can be prepared. This ammonia-borane complex is stable in water and ambient air and when heated liberates H2 in a sequence of reactions between 137°C and 400°C that reaches about 20% of the initial mass of H3BNH3. Successful implementation of ammonia-borane as a potential future transportation fuel, however, requires new chemical techniques and/or processes for its synthesis that promise substantial reduction in its production costs.
Storer Mass, kg
Volume, Liters
Cost, US$
LiH 1.7 3.7 109
CaH2 4.5 4.0 104
NaBH4 (35 Weight % aqueous)
6.21 6.21 102
H3BNH3 2.38 3.21 390-525
541
Hydrogen, Fuel Cells, and Infrastructure Technologies FY 2002 Progress Report
FY 2002 Publications/Presentations
1. A. T-Raissi, "Ammonia and Ammonia Adducts as Hydrogen Energy Storers for Fuel Cell Applications," Proceedings of the 14th WHEC, Montreal, Canada, June 9-13 (2002).
2. C.A. Linkous, C. Huang, J. Fowler, G. Scott, A. T-Raissi, and N.Z. Muradov, "Closed Cycle Photochemical Methods for Deriving Hydrogen from Hydrogen Sulfide," Proceedings of the 14th WHEC, Montreal, Canada, June 9-13 (2002).
3. A. T-Raissi, "Technoeconomic Analysis of Area II Hydrogen Production, Part II - Hydrogen from Ammonia and Ammonia-Borane Complex for Fuel Cell Applications," Proceedings of the U.S. DOE Hydrogen Program Annual Review, Golden, CO, May 7 (2002), URL: http://erendev.nrel.gov/hydrogen/pdfs/ 32405b15.pdf.
4. A. T-Raissi, "Ammonia and Ammonia-Borane Complexes as Hydrogen Energy Storers for Fuel Cell Applications," at Session A2.8: Hydrides II, 14th WHEC, Montreal, Canada, June 10 (2002).
5. A. T-Raissi, "Technical Analysis of Hydrogen Production," Hydrogen Program Annual Review, Session B: Storage, Utilization, Analysis, Golden, CO, May 7 (2002).
Patent Applications
1. A. T-Raissi, N.Z. Muradov and E.D. Martin, "Method and Apparatus for Low Flux Photocatalytic Pollution Control," Serial No. 09/782,427, Feb. 12 (2001).
2. A. T-Raissi, N.Z. Muradov and E.D. Martin, "Apparatus and Method for Decoupled Thermo-Photocatalytic Pollution Control," U.S. Pat. No. 6,342,128 B1, Jan. 29 (2002).
3. A. T-Raissi, N.Z. Muradov and E.D. Martin, "Apparatus and Method for Decoupled Thermocatalytic Pollution Control," U.S. Pat. No. 6,334,936 B1, Jan. 1 (2002).
4. A. T-Raissi, N.Z. Muradov and E.D. Martin, "Method for High Flux Photocatalytic Pollution Control," U.S. Pat. No. 6,315,870 B1, Nov. 13 (2001).
5. A. T-Raissi, N.Z. Muradov and E.D. Martin, "Apparatus for Low Flux Photocatalytic Pollution Control," U.S. Pat. No. 6,309,611 B1, October 30 (2001).
542

Hydrogen, Fuel Cells, and Infrastructure Technologies FY 2002 Progress Report
V.A.2 Well-to-Wheels Analysis of Energy and Emission Impacts of Fuel Cell Vehicle Fuels
Michael WangArgonne National LaboratoryESD362/B2159700 S. Cass AvenueArgonne, IL 60439(630) 252-2819, fax: (630) 252-3443, e-mail: [email protected]
DOE Technology Development Manager: Peter Devlin(202) 586-4905, fax: (202) 586-9811, e-mail: [email protected]
Objectives• Evaluate well-to-wheels (WTW) energy and emission impacts of various potential fuels for fuel-cell
vehicles.• Update and upgrade Argonne’s GREET (Greenhouse gasses, Regulated Emissions, and Energy use in
Transportation) model to analyze new fuels and new fuel production pathways for fuel-cell vehicle applications.
• Characterize production pathways of various fuel-cell fuels, such as gaseous hydrogen, liquid hydrogen, methanol, gasoline, ethanol, and Fischer-Tropsch (FT) naphtha.
• Analyze key issues in production and distribution of fuel-cell fuels and evaluate their impacts on WTW energy use and emissions.
Approach• Revise Argonne’s GREET model to accommodate fuel-cell fuels for WTW analyses.• Estimate emissions of greenhouse gases (CO2, CH4, and N2O) and criteria pollutants [VOCs, CO,
NOx, PM10 (particulate matter with diameter less than 10 microns), and SOx] and energy use for all energy sources, fossil fuels (petroleum, natural gas, and coal), and petroleum.
• Specify production and distribution pathways for individual fuel-cell fuels.• Obtain data on new technologies, energy efficiencies, and emissions associated with key WTW
activities (e.g., fuel production and fuel-cell vehicle operations).• Evaluate and process the data obtained for application to the GREET model.• Conduct GREET simulations to generate WTW energy and emission results for various fuel-cell fuels.
Accomplishments• Evaluated energy use and greenhouse gas (GHG) emissions impacts of central gaseous hydrogen
(GH2) from natural gas (NG), central liquid hydrogen (LH2) from NG, station GH2 from NG, station LH2 from NG, solar photovoltaic (PV) GH2, solar PV LH2, station GH2 via electrolysis, station LH2 from electrolysis, gasoline, methanol, cellulosic ethanol, and naphtha from both crude and NG.
• Specified production and distribution pathways for each of the above fuels and fuel production pathways.
• Revised GREET 1.6. The version is posted at the GREET website for download and evaluations (http://greet.anl.gov).
• Reviewed completed studies on energy and emission impacts of fuel-cell vehicle fuels.
543

Hydrogen, Fuel Cells, and Infrastructure Technologies FY 2002 Progress Report
Future Directions• Continue to revise key assumptions in GREET l.6 to reflect technology developments related to
hydrogen production, distribution, and storage.• Review completed studies on the topic of fuel-cell fuel energy and emission impacts and summarize
differences and similarities among the reviewed studies.• Add additional hydrogen production pathways as needed.• Seek feedbacks from GREET users to further improve the functionality of the GREET model.• Continue to evaluate WTW energy and emission impacts of fuel-cell fuels.
Introduction
Fuel-cell vehicles (FCVs) are being promoted for their energy efficiency gains and zero or near-zero emissions. Although experts agree that hydrogen is the ultimate fuel-cell fuel in the long term, it may not be available on a large scale for FCV applications in the foreseeable future, mainly because of hydrogen production and distribution infrastructure constraints. Intensive R&D efforts are being focused on hydrocarbon fuels, besides hydrogen, for FCV applications. Because production and distribution of various fuel-cell fuels are subject to different energy efficiencies and emissions, WTW analysis is necessary to obtain impartial evaluations of fuel-cell vehicle/fuel systems.
Approach
For a given vehicle technology/transportation fuel combination, the GREET model separately calculates the following items on the WTW basis:1. Energy consumption for three energy categories
(total energy, fossil fuels, and petroleum)2. Emissions of three greenhouse gases (CO2, CH4,
N2O)3. Emissions of five criteria pollutants (total and
urban emissions, VOCs, CO, NOx, PM10, and SOx)
Figure 1 shows the stages covered in GREET simulations. A WTW analysis includes the feedstock, fuel, and vehicle operation stages. The feedstock and fuel stages together are called well-to-pump stages, and the vehicle operation stage is called the pump-to-wheels stage. In GREET, WTW energy and emission results are presented separately for each of the three stages.
GREET includes a variety of vehicle propulsion technologies and transportation fuels, of which fuel-cell vehicle technologies and fuel-cell fuels are a sub-set. Table 1 lists the fuel-cell fuels included in the GREET model. GREET can simulate multiple options for a given pathway. For example, GREET 1.6 includes 48 options for GH2 and LH2 pathways.
Results and Conclusions
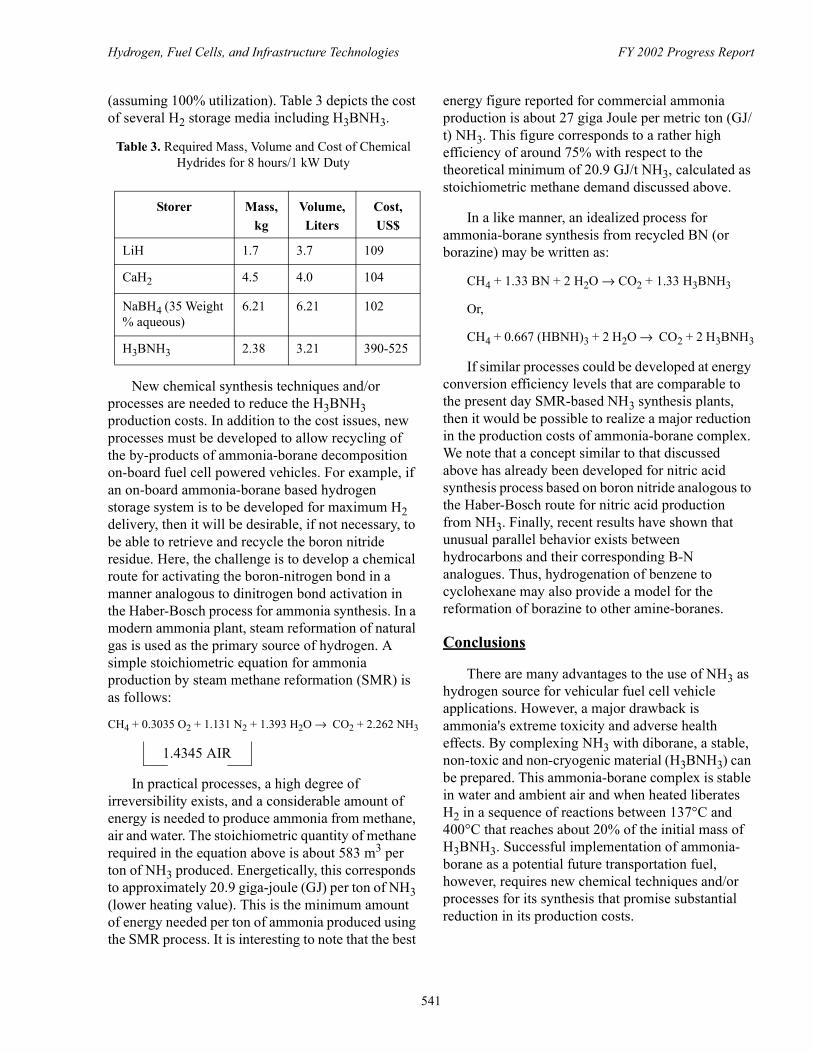
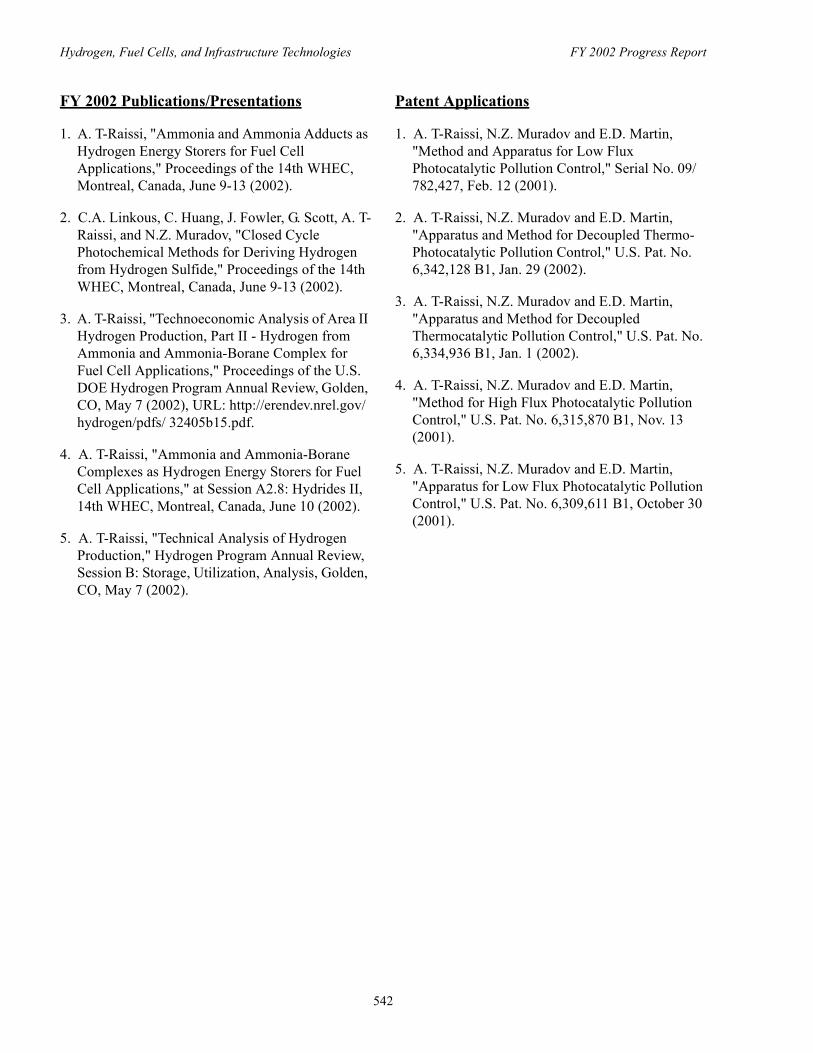
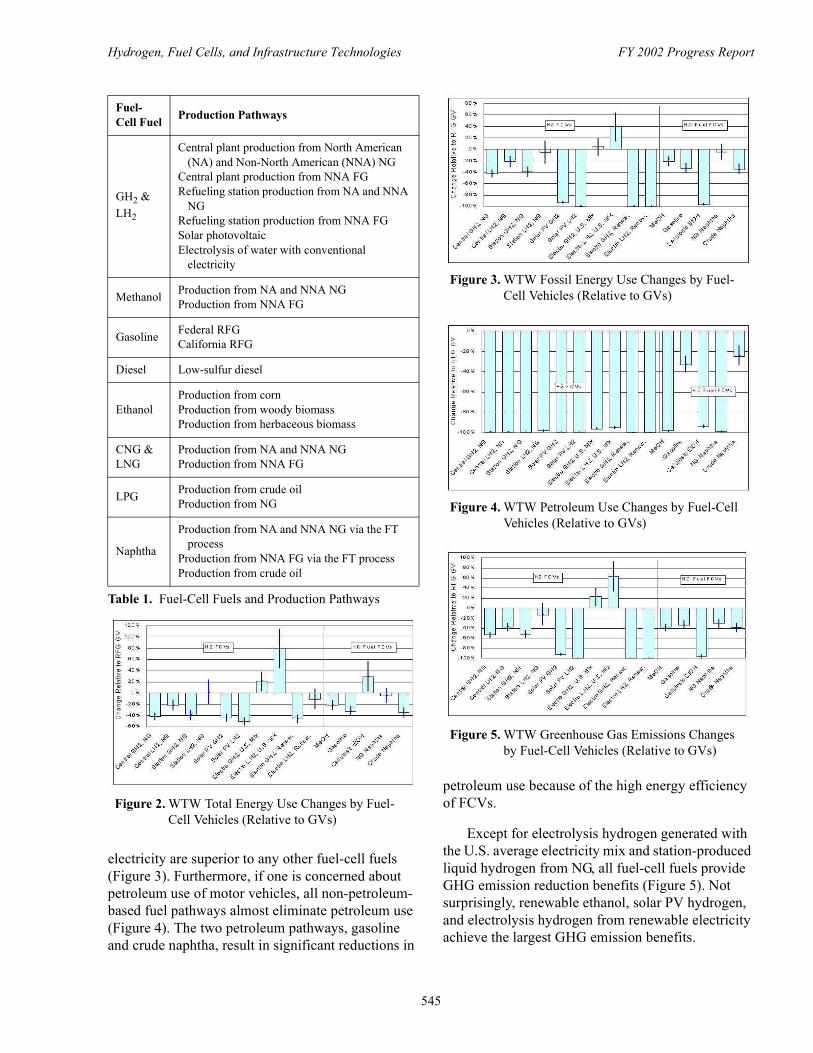
Argonne applied GREET 1.6 to estimate WTW energy and emission impacts of various fuel-cell fuels. We cannot include all the results here, but Figures 2-5 provide a snapshot of WTW total energy use, fossil energy use, petroleum use, and CO2-equivalent GHG emission impacts of some key fuel-cell fuels. (For each figure, the bars represent average values while the lines superimposed on the bars represent uncertainty ranges.)
For total energy use (including both nonrenewable and renewable energy sources), use of electrolysis hydrogen, liquid hydrogen from NG, and cellulosic ethanol may increase total energy use, relative to baseline gasoline internal combustion engine vehicles (GVs) (Figure 2). However, when one considers fossil energy use (petroleum, natural gas, and coal), cellulosic ethanol, solar PV hydrogen, and station electrolysis hydrogen from renewable
Figure 1. Stages Covered in GREET Well-to-Wheels Analysis
544
Hydrogen, Fuel Cells, and Infrastructure Technologies FY 2002 Progress Report
electricity are superior to any other fuel-cell fuels (Figure 3). Furthermore, if one is concerned about petroleum use of motor vehicles, all non-petroleum-based fuel pathways almost eliminate petroleum use (Figure 4). The two petroleum pathways, gasoline and crude naphtha, result in significant reductions in
petroleum use because of the high energy efficiency of FCVs.
Except for electrolysis hydrogen generated with the U.S. average electricity mix and station-produced liquid hydrogen from NG, all fuel-cell fuels provide GHG emission reduction benefits (Figure 5). Not surprisingly, renewable ethanol, solar PV hydrogen, and electrolysis hydrogen from renewable electricity achieve the largest GHG emission benefits.
Fuel-Cell Fuel Production Pathways
GH2 & LH2
Central plant production from North American (NA) and Non-North American (NNA) NG
Central plant production from NNA FGRefueling station production from NA and NNA
NGRefueling station production from NNA FGSolar photovoltaicElectrolysis of water with conventional
electricity
Methanol Production from NA and NNA NGProduction from NNA FG
Gasoline Federal RFGCalifornia RFG
Diesel Low-sulfur diesel
EthanolProduction from cornProduction from woody biomassProduction from herbaceous biomass
CNG & LNG
Production from NA and NNA NGProduction from NNA FG
LPG Production from crude oilProduction from NG
Naphtha
Production from NA and NNA NG via the FT process
Production from NNA FG via the FT processProduction from crude oil
Table 1. Fuel-Cell Fuels and Production Pathways
Figure 2. WTW Total Energy Use Changes by Fuel-Cell Vehicles (Relative to GVs)
Figure 3. WTW Fossil Energy Use Changes by Fuel-Cell Vehicles (Relative to GVs)
Figure 4. WTW Petroleum Use Changes by Fuel-Cell Vehicles (Relative to GVs)
Figure 5. WTW Greenhouse Gas Emissions Changes by Fuel-Cell Vehicles (Relative to GVs)
545

Hydrogen, Fuel Cells, and Infrastructure Technologies FY 2002 Progress Report
Notes for Table 1 and Figures 2-5:
WTW results depend heavily on the assumptions regarding fuel production efficiencies and fuel-cell vehicle fuel economy. The GREET model can readily test alternative assumptions and provide WTW energy and emission results.
Reference
1. Wang, M., 2001, Development and Use of GREET 1.6 Fuel-Cycle Model for Transportation Fuels and Vehicle Technologies, ANL/ESD/TM-163, Center for Transportation Research, Argonne National Laboratory, Argonne, Ill., June.
Central GH2, NG gaseous hydrogen produced in centralized plants with NA NGCentral LH2, NG liquid hydrogen produced in centralized plants with NA NGStation GH2, NG gaseous hydrogen produced in refueling stations with NA NGStation LH2, NG liquid hydrogen produced in refueling stations with NA NGSolar PV GH2 gaseous hydrogen produced in central locations from solar photovoltaic via electrolysisSolar PV LH2 liquid hydrogen produced in central locations from solar photovoltaic via electrolysisElectro GH2, U.S. Mix gaseous hydrogen produced in refueling stations via electrolysis with U.S. average
electricityElectro L.H2, U.S. Mix liquid hydrogen produced in refueling stations via electrolysis with U.S. average electricityElectro GH2, Renew. gaseous hydrogen produced in refueling stations via electrolysis with renewable electricityElectro L.H2, Renew. liquid hydrogen produced in refueling stations via electrolysis with renewable electricityMeOH methanol produced from NA NGNG naphtha naphtha produced from NNA NG via the FT processCrude naphtha naphtha produced from crude oil in petroleum refineriesHC hydrocarbonRFG reformulated gasolineNA North AmericanNNA non-North AmericanFG flared gasCNG compressed natural gasLNG liquefied natural gasLPG liquefied petroleum gas (propane)EtOH ethanol
546

Hydrogen, Fuel Cells, and Infrastructure Technologies FY 2002 Progress Report
V.A.3 Hydrogen and Fuel Cell Vehicle Evaluation
Richard Parish (Primary Contact), Leslie Eudy, and Ken ProcNational Renewable Energy Laboratory1617 Cole Blvd.Golden, CO 80401(303) 275-4453, fax: (303) 275-4415, e-mail: [email protected]
DOE Technology Development Manager: John Garbak(202) 586-1723, fax: (202) 586-9811, e-mail: [email protected]
Objectives• Gather performance information on hydrogen fuel cell vehicles to establish their operating
characteristics and applicability to fleet service and the general transportation marketplace.• Gather and evaluate information on establishing a hydrogen fueling and maintenance infrastructure.
Approach• Continue working with SunLine Transit Agency and Alameda-Contra Costa Transit District (AC
Transit) to define the hydrogen fuel cell bus evaluation process and required fueling infrastructure at the AC Transit site.
• Evaluate the performance and operational characteristics of a hydrogen fuel cell bus in revenue service at SunLine Transit Agency.
• Establish an effective relationship with the California Fuel Cell Partnership (CaFCP) and define the value added tasks that the National Renewable Energy Laboratory (NREL) can provide to their fuel cell vehicle testing and evaluation program.
Accomplishments• Contract with AC Transit and ISE Research-Thunderbolt to provide fuel cell buses for AC Transit in
Oakland, California was approved, with delivery of the first bus scheduled for June 2004.• NREL, AC Transit, and University of California-Davis have completed a preliminary vehicle
evaluation plan for the AC Transit fuel cell bus demonstration.• Identified products that NREL could provide as a partner in the California Fuel Cell Partnership
(CaFCP), e.g., status reports on partnership activities and fueling technologies, and a web-based “suggestion box”.
Future Directions• Continue evaluation of ISE/UTC Fuel Cells fuel cell bus operation at SunLine Transit Agency.• Define AC Transit hydrogen fueling infrastructure.• Develop hydrogen reference guide documents: (1) Hydrogen Fuel Systems for Vehicles, and (2)
Hydrogen Fueling Systems.• In cooperation with CaFCP, characterize existing hydrogen fueling stations and define critical
elements for designing and implementing new stations.
547

Hydrogen, Fuel Cells, and Infrastructure Technologies FY 2002 Progress Report
Introduction
Government- and industry-sponsored research regarding hydrogen as a transportation fuel—particularly in mobile fuel cells—is growing rapidly. One of the first fuel cell applications in the transportation arena will be powering transit buses. This is due to their capacity for handling the extra volume currently required for the fuel cell and the associated hydrogen fuel storage tanks. The NREL Fleet Test & Evaluation (FT&E) team in Golden, Colorado, is dedicated to evaluating and documenting the performance and operational characteristics of advanced vehicle technologies that use alternative fuels or other concepts that reduce dependency on conventional petroleum fuels. The NREL FT&E team is investigating the status of fuel cell technology and hydrogen as key elements in a future transportation scenario. Specifically, FT&E is developing plans for evaluating prototype fuel cell buses; near-production light-, medium-, and heavy-duty fuel cell vehicles; and the hydrogen fueling and maintenance infrastructure required to make the vehicles fully operational.
Approach
The California Fuel Cell Partnership (CaFCP) is a focal point for fuel cell development and demonstration activity, and one of its tasks will be to evaluate fuel cells used in transit bus applications. The CaFCP is also evaluating fuel cells in light-duty vehicles and looking at a variety of feedstock fuels for the hydrogen required for the fuel cells. Based on past experience of developing and evaluating alternative fuel and hybrid electric vehicles, NREL has taken the initiative to establish a relationship with the CaFCP to determine how it could assist the partnership with its fuel cell vehicle and hydrogen infrastructure development and evaluation. To gain experience and knowledge with fuel cell performance and operation characteristics, SunLine Transit Agency and the Alameda-Contra Costa Transit District (AC Transit), both associate members of the CaFCP, will acquire fuel cell buses for evaluation in normal operation. NREL will assist these agencies in acquiring data to evaluate the bus performance and prepare the transit agency for its fully commercial fuel cell buses. The XCELLSIS
fuel cell bus shown in Figure 1 was demonstrated at SunLine Transit Agency in 2001.
Results
In April 2002, AC Transit announced the purchase of four fuel cell buses using compressed hydrogen. The 40-foot buses will be built on a Van Hool (from Belgium) bus platform in a hybrid electric configuration using fuel cells from UTC Fuel Cells, and will be integrated by ISE Research. The buses will not be delivered until mid-2004. In the interim, a prototype fuel cell bus from ISE Research will be operated by SunLine to evaluate the bus performance and prepare the transit agency for its fully commercial fuel cell buses. Evaluation of the ISE prototype fuel cell bus performance is expected to occur during FY 2003. The design and construction of a hydrogen fueling station and necessary maintenance facility modifications is on hold until a contract can be placed. The FT&E team produced a preliminary vehicle evaluation plan. NREL will conduct the evaluation with AC Transit and University of California, Davis (UC Davis). Finalization of the evaluation plan will occur as the delivery date of the fuel cell buses approaches.
NREL met with the CaFCP Light-Duty Vehicle (Vehicle Operation or VeOps) and Fuels Teams to define activities in which NREL/DOE could become involved to increase the amount of information available. NREL has developed a web-based “suggestion box” for the VeOps Team to identify problems, issues, and development needs they might be reluctant to identify in a meeting with other manufacturers or fuel providers. NREL is also developing a web-based fleet information database to gather information on California fleets to identify
Figure 1. The XCELLSIS Bus being Fueled at SunLine Transit Agency in 2001
548

Hydrogen, Fuel Cells, and Infrastructure Technologies FY 2002 Progress Report
good candidates for evaluation and testing of light-duty fuel cell vehicles. For the Fuels Team, NREL will develop fact sheets on existing hydrogen fueling stations that could be used by partnership auto manufacturers, and on the process of hydrogen fueling station siting and implementation. The existing hydrogen fueling station at the California Fuel Cell Partnership’s facility in Sacramento, California is shown in Figure 2.
Conclusions• NREL’s FT&E Team is working to develop
a strong role in the CaFCP, providing creative options for gathering and disseminating information about hydrogen fuel cell vehicles and associated hydrogen infrastructure, without revealing prototypic and proprietary information about the vehicle technology.
• In collaboration with the CaFCP, once the fuel cell buses are delivered and the hydrogen fueling and vehicle maintenance facilities are completed, NREL will begin collecting and evaluating data that will help to demonstrate that fuel cell buses can be fueled and maintained efficiently and perform consistently.
FY 2002 Publications/Presentations
1. Levin, J., Miller, M., and Eudy, L. “Fuel Cells for the Transportation Industry: Developing a Credible Demonstration Program on the Path to Commercialization,” Presented to the 14th World Hydrogen Energy Conference held June 9-13, 2002 in Montreal, Quebec, Canada.
Figure 2. A Fueling Demonstration of the Nissan Xterra Fuel Cell Vehicle at the California Fuel Cell Partnership’s Hydrogen Fueling Station
549

Hydrogen, Fuel Cells, and Infrastructure Technologies FY 2002 Progress Report
V.A.4 Power Parks System Simulation
Andrew Lutz (Primary Contact)Sandia National LaboratoriesMS 9053Livermore, CA 94551-0969(925) 294-2761, fax: (925) 294-1004, e-mail: [email protected]
DOE Technology Development Manager: Sigmund Gronich(202) 586-1623, fax: (202) 586-5860, e-mail: [email protected]
Objectives • Develop a system model to simulate distributed power generation in power parks.• Demonstrate the potential of hydrogen technologies for power generation. • Analyze the dynamic performance of the system to examine the thermal efficiency, power availability,
and cost.
Approach• Develop a library of Simulink modules for the various components being proposed for power parks. • Assemble the components into a sample power park to demonstrate the model’s ability to analyze
thermal efficiency and supply an electric load.
Accomplishments • The library of components includes a fuel cell stack, a steam-methane reformer, a multi-stage
compressor, and hydrogen storage in a high-pressure vessel.• In the initial power park, a reformer operates at a steady rate to produce hydrogen, which feeds a fuel
cell to provide an electric load. When excess hydrogen is available, it is compressed and stored.• The model evaluates the combined efficiency of the power system.
Future Directions • Continue to develop additional modules in the Simulink library, including a photovoltaic array, an
electrolyzer, a battery, a wind turbine, and an autothermal reformer.• Implement a control strategy to direct the power within the park to meet the internal load while
optimizing the energy efficiency and cost.• Develop a layer of analysis to compute the cost of the power and hydrogen generated, including the
initial capital costs of the components and the continuous operation costs during the life of the simulation.
• Compare the simulations of dynamic performance with data collected from demonstration sites.
Introduction
Power parks are distributed energy sites where power generation is co-located with businesses or industrial energy consumers. Proposed power parks use combinations of technologies. A local power
source is often combined with a storage technology to adapt the dynamic nature of the source to the load. In some cases, the system operates completely separate from the utility grid. Alternatively, the power park may use the utility grid as a storage device, selling power to the utility when there is
550

Hydrogen, Fuel Cells, and Infrastructure Technologies FY 2002 Progress Report
excess and drawing power when the local source cannot meet the load.
Often, power parks are sited in order to take advantage of a renewable energy source. Generation by photovoltaic collectors or wind turbines can be combined with energy storage technologies. Power parks provide an excellent opportunity for using hydrogen technologies. Electricity from the renewable source can be used to generate hydrogen by electrolysis, which is stored for use in fuel cells or to refuel vehicles. Similarly, heat from a renewable source can be used to reform hydrocarbon fuels into hydrogen.
The variety of technologies and their combinations that are being proposed for power parks suggests that each system will be novel, at least in some aspect of its design. Consequently, a simulation tool will be very useful in evaluating the various systems and optimizing their performance with respect to efficiency and cost.
Approach
The deliverable of this project will be a tool for simulation of the local power generation system, constructed in the language of the Simulink software [1]. Simulink provides a graphical workspace for block diagram construction. The workspace provides the flexibility to quickly assemble components into a system. Simulink performs dynamic simulation by integrating the system in time using a collection of ordinary differential equation solvers. After the simulation is completed, the solution can be examined by plotting variables at various states in the system. Simulink also contains modules for dynamic control and solution of iterative loops within the system.
The system design begins with development of a library of Simulink modules that represent components in the power system. The component models are based on fundamental physics to the extent practical. These models are generic in that they are not customized to represent a specific brand or manufacturer’s features for the component. However, the generic components from the library can be tied to a specific unit by relying on performance data. The library components can be
quickly modified to represent new or specialized components, thereby expanding the library’s collection.
Many of the basic modules that represent hydrogen and other gas mixtures use the Chemkin [2] software package to provide thermodynamic properties of the species and mixtures. For example, the mixer component accepts two gas streams and adiabatically mixes them to yield an output stream. The temperature of the new stream depends on the temperatures, compositions, and relative flow rates of the two inlet streams. Solution for the outlet temperature uses Newton iteration over Chemkin calls, which returns the updated enthalpy of the mixture. Another example is the Equil module, which computes the equilibrium composition at a given temperature and pressure. This module is coupled to a Chemkin-implementation of the Stanjan [3] equilibrium solver. The Equil module is used to represent chemical reactions in either a reformer or a combustor component. These modules are combined in a sub-system to form a module for the steam-methane reformer.
Results
We have developed a library of Simulink modules for some of the various components being proposed for power parks. Existing components include a fuel cell stack, a steam-methane reformer, a multi-stage compressor, a high-pressure storage vessel, and an internal electric load. The load versus time is read from a file, so it can be changed quickly.
The reformer takes an input flow rate of methane and computes the hydrogen output. The reformer module balances energy by combusting the reformate stream with air and exchanging the heat released to the catalyst reactor. Parameters on the reformer are the steam-to-carbon ratio and the outlet temperature of the exhaust products from the internal burner. The temperature at which the equilibrium reforming occurs depends on these parameters. Figure 1 shows the variation in thermal efficiency of the reformer with temperature and steam-to-carbon ratio. The minimum steam-to-carbon ratio is 2; however, reformers are often operated with excess steam to improve the efficiency and prevent coking problems.
551

Hydrogen, Fuel Cells, and Infrastructure Technologies FY 2002 Progress Report
More detailed analysis of the reformer sub-system is presented in reference [4].
The fuel cell module takes a hydrogen inlet flow rate and a requested power, then determines if sufficient power can be supplied. The stack model uses a simple map of efficiency versus power. This data is read from an input file to allow the fuel cell to be calibrated to real performance data. If sufficient
power can be provided, the excess hydrogen flow is returned for compression and storage. A compressor module represents an ideal two-stage compressor that assumes isentropic compression in each stage. The power required by the compressor is included in the analysis of the overall thermal efficiency of the system.
The simulation in this example runs over a daily load cycle. The power output by the fuel cell, which in this case matches the demand, is shown by the solid line in Figure 2. The power consumed by the hydrogen compressor is shown by the dotted line in Figure 2. During the night, when the load is low, the compressor load is large because most of the hydrogen produced by the reformer is being compressed for storage. During the peak daytime loads, the compressor is not operating because there is no excess hydrogen.
The model evaluates the overall thermal efficiency of the power system, as shown in Figure 3. The system efficiency is the hydrogen stored and electric power supplied to the load, divided by the methane input to the reformer and the power consumed by the compressor. The system efficiency is highest when the reformer is producing hydrogen to be stored during the low-load periods. In contrast, the system efficiency drops when the combined reformer and fuel cell are working at capacity to supply the peak load.
Figure 1. Thermal Efficiency of the Steam-Methane Reformer Module Versus the Temperature and Steam-to-Carbon Ratio, Computed at Chemical Equilibrium
Figure 2. Power Output of the Fuel Cell (solid line) and Power Consumed by the Compressor (dashed line) for a Sample Simulation over a Daily Cycle
Figure 3. Thermal Efficiency of the Power System for a Sample Simulation over a Daily Cycle
552

Hydrogen, Fuel Cells, and Infrastructure Technologies FY 2002 Progress Report
Conclusions and Future Directions
The demonstration of the sample power park shows the usefulness of system simulations in evaluating the overall performance. The flexibility provided by the block diagram structure will allow for rapid construction of various system configurations.
Future efforts will continue to develop modules for the Simulink library, adding modules for electricity generation by a photovoltaic array, temporary electricity storage in batteries, and hydrogen generation by an electrolyzer and an autothermal reformer. The final stages of the work will implement a control strategy to direct the power within the park to balance meeting internal load with supplying external power to the grid. We will also include a layer of analysis to compute the cost of the power and hydrogen generated. The cost analysis will accept input of the initial capital costs of the components, as well as the continuous operation costs during the life of the simulation, and add the costs using time-value adjustments. We expect the simulation tool will provide valuable assistance in the planning and design of hydrogen technologies in distributed power systems. In addition, the simulations of dynamic performance can be compared with data collected from demonstration sites.
References
1. Simulink. The MathWorks, Inc, MA (www.mathworks.com) 2002.
2. The CHEMKIN program and subroutine library are part of the Chemkin Collection. R. J. Kee, F. M. Rupley, J. A. Miller, M. E. Coltrin, J. F. Grcar, E Meeks, H. K. Moffat, A. E. Lutz, G. Dixon-Lewis, M. D. Smooke, J. Warnatz, G. H. Evans, R. S. Larson, R. E. Mitchell, L. R. Petzold, W. C. Reynolds, Caracotsios, M., Stewart, W. E. and Glarborg, P., Chemkin Collection, Release 3.5, Reaction Design, Inc., San Diego, CA (1999).
3. “Stanjan: Interactive Computer Programs for Chemkin Equilibrium Analysis", W C Reynolds, Stanford University report, January (1981).
4. Lutz, A. E., Bradshaw, R. W., Keller, J. O., and Witmer, D. E., “Thermodynamic Analysis of Hydrogen Production by Steam Reforming,” accepted for publication in the International Journal of Hydrogen Energy, 2002.
FY 2002 Publications/Presentations
1. Lutz, A. E., Bradshaw, R. W., Keller, J. O., and Witmer, D. E., “Thermodynamic Analysis of Hydrogen Production by Steam Reforming,” Int. J. of Hydrogen Engy, accepted for publication, 2002.
2. Lutz, A. E., Larson, R. S., and Keller, J. O., “Thermodynamic Comparison of Fuel Cells to the Carnot Cycle,” Int. J. of Hydrogen Engy, 27 (10), (2002) pp. 1103-1111.
553

Hydrogen, Fuel Cells, and Infrastructure Technologies FY 2002 Progress Report
V.A.5 Process Analysis Work for the DOE Hydrogen Program - 2001
Pamela L. Spath, Wade A. Amos, and Margaret K. Mann (Primary Contact)National Renewable Energy Laboratory1617 Cole Blvd.Golden, CO 80401(303) 275-2921, fax: (303) 275-2905, e-mail: [email protected]
DOE Technology Development Manager: Matthew Kauffman(202) 586-5824, fax: (202) 586-5860, e-mail: [email protected]
Objectives• Add to the suite of technoeconomic analyses (TEAs) performed on hydrogen research projects.• Update previous analyses using recent experimental results.• Determine delivered hydrogen costs by incorporating storage and transportation costs into previous
analyses.• Provide information to DOE and task researchers, to guide ongoing and proposed research projects.
Approach• Identify the hydrogen production, storage, and utilization projects and processes to be analyzed.• Using available data (technical literature, laboratory data, pilot-scale data, etc.), generate process flow
sheets, material and energy balances, and equipment capital costs using ASPEN Plus process simulation computer software.
• Determine hydrogen selling price and conduct sensitivity analyses to determine the largest cost drivers and areas for continued cost reduction.
• Use the results of these analyses to guide ongoing and proposed research projects.
Accomplishments• Completed analyses and produced reports in the following areas:
- Technoeconomic Analysis of the Thermocatalytic Decomposition of Natural Gas, May 2001.- Assessment of the Mass Production of Nanotubes, August 2001.- Economic Analysis of the Biological Water Gas Shift Process for the Production of Hydrogen from
Synthesis Gas, October 2001.- Assessment of Hydrogen from Small-Scale Reformers-Available Technologies and Costs, October
2001. - Assessment of Natural Gas Splitting with a Concentrating Solar Reactor for Hydrogen Production,
April 2002.• Drafted analysis plan at DOE workshop held in March 2002.
Future Directions• Evaluate water requirements for large-scale hydrogen use.• Complete a Monte Carlo sensitivity analysis of hydrogen storage and transportation costs.• Evaluate the market potential of coproducts from biomass pyrolysis oil reforming.
554
Hydrogen, Fuel Cells, and Infrastructure Technologies FY 2002 Progress Report
• Integrate various renewable forms of hydrogen production to supply future transportation needs into TEA models.
• Continue to coordinate analysis work for the DOE Hydrogen, Fuel Cells, and Infrastructure Technologies Program.
Introduction
The goal of the process analysis work conducted at the National Renewable Energy Laboratory (NREL) for the DOE's Hydrogen, Fuel Cells, and Infrastructure Technologies Program is to provide direction, focus, and support to the development of renewable hydrogen through evaluation of technical, economic, and environmental aspects of hydrogen production and storage technologies. The primary purpose of this work is to identify those areas of research in which improvements will result in the largest reductions in system costs. This helps to define research goals and moves novel technologies more quickly to commercialization. Additionally, this project provides information to DOE on the long-term technical and economic feasibility of ongoing and proposed research projects.
This year, areas of analysis included (1) hydrogen production via natural gas splitting with a solar reactor, (2) biological water gas shift for hydrogen production from synthesis gas, and (3) assessment of the mass production of carbon nanotubes for hydrogen storage.
Approach
Technoeconomic analyses are performed to determine the potential economic viability of a research process. The selection of projects to be analyzed is made in conjuction with DOE program management. Detailed TEAs begin with discussions between researchers and analysts, to obtain experimental data and a common understanding of project goals. Experimental results are used to develop material and energy balances in ASPEN Plus, a chemical engineering process simulator that contains extensive thermodynamic data. The material and energy balance results are used to determine the size, and subsequently, the capital cost, of major pieces of process equipment. Along with operating costs, these are used in a cash flow spreadsheet to
determine the necessary hydrogen selling price to obtain a 15% after-tax internal rate of return. Storage and transportation costs are integrated with process costs to obtain a delivered hydrogen selling price. Monte Carlo sensitivity analyses are used to determine the largest cost drivers and areas for continued cost reduction. These results are used to make focused recommendations to the researchers and to DOE.
Results
Hydrogen Production via Natural Gas Splitting with a Solar Reactor
This study analyzed hydrogen production via thermal decomposition of methane using a solar reactor for two different applications: (1) a fueling station and (2) power production. The analysis shows that for either application, the production of carbon black plays a key role in the economics of the process. In addition, the net greenhouse gas emissions and overall fossil energy consumption are lower for the solar processes than for the conventional fossil system.
In the stand-alone fueling station application, there are many times when the storage capacity is reached and the hydrogen production system must be shut down. For this reason, only 54%-66% of the total possible hydrogen production can actually be realized. Increasing the size of the hydrogen storage results in a small increase in useable hydrogen, which does not outweigh the large cost associated with storing the hydrogen. Supplying hydrogen directly to a pipeline network was examined as one option to overcome these physical and economic limitations. The reduction in the hydrogen selling price is 68% from the stand-alone base case ($18/giga-Joule [GJ] compared to $57/GJ). Another option that was examined to improve the productivity of the solar process was adding a small electric heater that can be turned on when the hydrogen supply gets
555
Hydrogen, Fuel Cells, and Infrastructure Technologies FY 2002 Progress Report
low to provide heat to the solar reactor. The hydrogen selling price with the supplemental heater is considerably less than the stand-alone base case at $42-$46/GJ, compared to $57/GJ.
For the power production scenario, the hydrogen is co-fired in a turbine at a natural gas combined-cycle (NGCC) plant. Two options were examined: (1) selling the carbon black and (2) burning the carbon to produce more power. Because of its value, it is more profitable to sell the carbon instead of burning it. In order for the electricity produced from the hydrogen to be less than the base electricity production cost of the NGCC plant, the price of the carbon must be greater than $0.80/kilogram (kg). However, even if the power produced from hydrogen is more that the base power production price, overall it would not significantly increase the price of power from the NGCC power plant. This is because the fraction of electricity generated from the solar process is small compared to the total (0.2%-1.1% of the total output of a 500-MW NGCC plant).
Biological Water-Gas Shift for Hydrogen Production
The biological water-gas shift (WGS) reaction uses photosynthetic bacteria to convert CO into CO2 and H2. After successful proof-of-concept tests showed that high CO to H2 rates were possible, researchers focused on collecting reliable kinetic data for the biological WGS process. Based on this laboratory kinetic data, a preliminary process design was proposed for shifting the CO from a biomass gasification process into hydrogen. The capital and operating costs were estimated for such a system and showed that the WGS reactor was a significant cost, nearly $3 million for a small facility (2.5 million standard cubic feet per day [scf/d]) and over $10 million for a larger facility (10.0 million scf/d). The projected costs were cut nearly in half by redesigning the system. Two important conclusions came out of the economic analysis:
• Pressurizing the system reduces the size of the WGS reactor, thereby reducing the capital cost of the system.
• An increase in shift rate by a factor of 2 decreases the reactor size enough that the reactor then becomes a relatively small cost compared to the balance of plant costs.
Increasing the shift rate beyond this point has diminishing returns.
These two results have shifted the course of the laboratory research. Rather than concentrating on getting large improvements in the shift rate, the researchers have designed a high-pressure reactor for testing the biological WGS reaction at pressures up to 400 pounds per square inch gauge (2,900 kilopascal).
Assessment of the Mass Production of Carbon Nanotubes
Neoterics International was contracted by NREL to assess the mass production of carbon nanotubes for hydrogen storage applications. The technology base for this analysis is the single-wall nanotubes extrusion concept being developed at NREL, in which carbon nanotubes are produced using methane decomposition chemistry. The design basis is a grassroots facility producing 75,000 metric tons per year of active material. Hydrogen is also produced as a coproduct from this manufacturing facility.
Four scenarios were evaluated. The high and low conversion cases assumed a per-pass conversion of 44.48% (corresponds to thermodynamic equilibrium at the reactor outlet) and 30% (accounts for the possibility that mass transfer or other mechanisms could limit the reaction), respectively. Lab experiments to date have only been able to demonstrate 7% per pass conversion, but these experiments were designed to demonstrate catalyst activity rather than high per pass conversion. The high and low levels assumed for selectivity were 100% and 80%, respectively, reflecting the fact that very high selectivity has already been demonstrated in the lab.
Fixed capital ranged from $164.1 million to $208.2 million for the four cases considered. This translates into $2.2 to $2.8 per annual kg of capacity. Natural gas is the dominant component of the cash operating costs. The hydrogen coproduct is a significant source of revenue, contributing approximately one-third of the revenue for all cases considered. The selling price for the carbon nanotubes varied from $0.8 to $1.1 per kg.
556

Hydrogen, Fuel Cells, and Infrastructure Technologies FY 2002 Progress Report
Conclusions
Hydrogen Production via Natural Gas Splitting with a Solar Reactor
• Hydrogen storage is costly. If the hydrogen can be consumed directly or used in another application where storage is eliminated and compression is moderate, then the hydrogen selling price decreases significantly.
• The price of carbon black has the greatest effect on the economics of hydrogen production from a solar reactor, regardless of application. Thus, higher value carbon markets should be pursued as a way to improve the process economics.
• There is a significant environmental benefit from carbon black production via the solar route compared to the conventional route.
Biological Water-Gas Shift for Hydrogen Production• The WGS system must be operated under
pressure to be economical. If the process cannot be operated at high pressures, an incremental improvement in shift rate alone will not significantly reduce hydrogen production costs.
Assessment of the Mass Production of Carbon Nanotubes
• The concept of using carbon nanotubes for hydrogen storage is still at relatively early stage of development. Further fundamental studies on the mechanism of hydrogen adsorption are needed to assess whether carbon nanotubes are capable of meeting DOE's technical storage goals (greater than 5.5 weight % and 50 kg/m3).
• The current analysis shows that the hydrogen coproduct is a significant source of revenue in the large-scale nanotube production process.
557

Hydrogen, Fuel Cells, and Infrastructure Technologies FY 2002 Progress Report
V.B Integrated Hydrogen and Fuel Cell Demonstration
V.B.1 Real-World Demonstration of Fuel Cell Vehicles and Refueling Technology
Joseph J. IrvinCalifornia Fuel Cell Partnership3300 Industrial Boulevard, Suite 1000West Sacramento, CA 95691(916) 371-2870, fax: (916) 375-2008, e-mail: [email protected]
DOE Technology Development Manager: Christopher Bordeaux(202) 586-3070, fax: (202) 586-5860, e-mail: [email protected]
Objectives• Demonstrate fuel cell technology by operating and testing vehicles on California’s roads.• Demonstrate alternative fuel infrastructure technology.• Explore the path to commercialization for fuel cell-powered vehicles.• Increase public awareness through a coordinated outreach plan.
Approach• Adopt a California Fuel Cell Partnership (CaFCP) organizational structure consisting of an Executive
Committee, Working Group and Communications Team to provide and implement a decision-making structure for developing a workplan, budget, headquarters facility, and outreach strategy under the following timetable:- Phase I — through 1999, project development and planning, adding new partners, and preparing
vehicle and refueling facilities;- Phase II — 2000-2001, demonstrate cars and buses using hydrogen fuel;- Phase III — 2002-2003, demonstrate more cars and buses using hydrogen, methanol, gasoline or
other fuels as determined by the Partnership.
Accomplishments• Established and opened the West Sacramento headquarters facility as an operations base for on-road
vehicle usage and fueling.• Established a “safety first” policy and culture at the facility.• Dedicated 16 vehicles to the project by the end of the year – together these vehicles accumulated over
34,000 miles, conducted 754 refueling events, and totaled 1,880 persons who rode or drove in the vehicles.
• Conducted 25 public outreach events to increase awareness among media, stakeholder groups, educators, and the general public – together, these events directly reached more than 176,000 people.
• Accommodated more than 80 headquarters tours, tallying more than 1,500 headquarters visitors.• Staged a Technology Forum at the headquarters facility, bringing fuel cell industry suppliers and
consultants together with CaFCP members for business-to-business discussions – the 2001 event featured more than 30 exhibitors and 300 attendees.
558

Hydrogen, Fuel Cells, and Infrastructure Technologies FY 2002 Progress Report
• Released a “Fuel Scenarios Study” examining four potential fuel sources for fuel cells and the challenges to their commercialization.
• Established strong ties with the environmental and legislative communities through the Environmental Team and stakeholder outreach activities.
• Tested one fuel cell bus, the Ballard/XCELLSiS ZEbus, in the Palm Springs area.• Participated as a team entry in the third annual Michelin Bibendum Challenge, and drove from Los
Angeles to Las Vegas in relay fashion.• Hosted the Electric Vehicle Association of the Americas’ “Electric Transportation Industry
Conference” for a daylong tour and Ride ‘n’ Drive event at CaFCP’s demonstration center.
Future Directions• Operate twenty (20) CaFCP vehicles, together accumulating 60,000 miles in calendar year 2002.• Install a methanol fueling station at the West Sacramento headquarters.• Install a satellite hydrogen fuel station in Richmond, California, as well as two additional hydrogen
stations at appropriate locations.• Commence a second joint study that examines hydrogen vehicle facility construction and use issues.• Educate two regional emergency response agencies about how to address potential health and safety
issues in the event of vehicle/fuel station accidents.• Determine and announce the membership’s plans for beyond 2003 [current CaFCP plans have been
announced through 2003].• Through multiple public outreach events, familiarize 250,000 people with fuel cell technology.• Distribute 1,000 Teacher Learning Kits to middle and high school science teachers.
Introduction
California is the home to the California Fuel Cell Partnership (CaFCP), a unique collaboration between auto manufacturers, energy companies, fuel cell technology companies, and government agencies. This partnership is advancing a new vehicle technology that could move the world toward practical and affordable environmental solutions. For the first time ever, automobile companies and fuel suppliers have joined together to demonstrate fuel cell vehicles under real day-to-day driving conditions.
The California Fuel Cell Partnership expects to place up to 60 fuel cell passenger cars and fuel cell buses on the road by 2003. In addition to testing the fuel cell vehicles, the partnership is examining fuel infrastructure issues and beginning to prepare the California market for this new technology.
The members include companies and organizations from around the world: DaimlerChrysler, Ford, General Motors, Honda, Hyundai, Nissan, Toyota, and Volkswagen; Ballard Power Systems, UTC Fuel Cells; BP, ExxonMobil, Shell Hydrogen, and ChevronTexaco; and the California Air Resources Board, the California Energy Commission, the United States Department of Energy, the United States Department of Transportation and the South Coast Air Quality Management District.
Additionally, there are nine Associate Partners who assist with specific areas of expertise to help meet the CaFCP’s goals: hydrogen gas suppliers (Air Products and Chemicals, Inc. and Praxair); hydrogen fueling stations (Pacific Gas & Electric, Proton Energy Systems, Inc., and Stuart Energy Systems); a methanol fuel supplier (Methanex); and bus transit agencies (AC Transit and Santa Clara Valley Transportation Authority which operate in the
559

Hydrogen, Fuel Cells, and Infrastructure Technologies FY 2002 Progress Report
Greater San Francisco Bay area, and SunLine Transit Agency in the Palm Springs area).
Approach
The CaFCP is testing and demonstrating fuel cell electric vehicles in California through 2003 under day-to-day driving conditions; demonstrating alternative fuel infrastructure technology; exploring the path to commercializing fuel cell electric vehicles by examining such issues as fuel infrastructure requirements, vehicle and fuel safety, market incentives, and consumer acceptance; and working to increase public awareness of fuel cell vehicle technology and the benefits it can offer.
Results
For the California Fuel Cell Partnership, the past year could be summarized as a year of “taking it to the streets” -- that is, driving fuel cell-powered electric vehicles on California’s roadways in real-world conditions. Together, members worked hard in many ways to raise public awareness; gain experience with fuel cell technology, vehicles and fuels; and evaluate the commercialization of fuel cell vehicle technology for the 21st Century.
A functional headquarters facility in West Sacramento, California serves as an operations base for demonstrating and housing vehicles and their fuel supplies. Automotive partners are test-driving full scale fuel cell-powered vehicles on California roadways in real-world conditions -- in traffic, up and down hills, and in wide-ranging weather conditions. A few years ago, there wasn’t a single running fuel cell vehicle on the road; today, there are eighteen operating in the Partnership.
Energy providers are working through the challenges of developing fuel infrastructure for fuel cell vehicles. They are providing the fuel needed for the partnership’s demonstration program. During this early stage, all of the vehicles have been powered by hydrogen stored and dispensed onsite at the facility. CaFCP will also test liquid fuels rich in hydrogen – methanol and a cleaner form of gasoline – in order to learn more and determine what will best serve a successful commercial launch. (A methanol fueling station was installed in April 2002.)
Fuel cell makers have achieved remarkable success developing smaller, better and more powerful fuel cell systems. Their progress has stimulated an entirely new fuel cell supply industry – and prompted the Partnership’s formation of a Technology Forum to provide an opportunity for non-member companies to meet the partners in a business-to-business environment.
Because success will require the active cooperation and assistance of the public sector, CaFCP’s state and federal government partners are helping to build awareness and support among key stakeholders and the public, as well as identify
Photo 1. FCVs and Staff Next to the Hydrogen Fueling Station at the CaFCP Headquarters Facility in West Sacramento, California
Photo 2. The Methanol Fueling Station – West Sacramento, California
560

Hydrogen, Fuel Cells, and Infrastructure Technologies FY 2002 Progress Report
possible roles for government participation in the promotion of fuel cell technology.
One of the remaining challenges to commercialization is fuel choice. On one hand, fuel cells are ideal because they can be operated on a number of fuels; on the other, there are serious
factors to be considered with each fuel – infrastructure cost, environmental tradeoffs, technological readiness, and, perhaps most importantly, consumer comfort and acceptance.
To help address these issues, the CaFCP commissioned a consultant-prepared study to examine how to bring fuel cell vehicles to actual showrooms as quickly as possible, taking into account the challenges and potential solutions in using several fuel options, including hydrogen, methanol, gasoline, and ethanol. The “Fuel Scenarios Study” can be found on the partnership’s website at
http://fuelcellpartnership.org/event_roundtable.html.
The members have also formalized safety standards for headquarters vehicle and fueling operations, including the safe management of thousands of visitors.
Photo 3. CaFCP Participated in the Michelin Bibendum Challenge
Photo 4. CaFCP Takes Vehicles and Displays into Local Communities to Increase Awareness
Photo 5. A Hands-on Fueling Demonstration Exhibit Was Created to Familiarize People with Hydrogen Fueling and Fuel Choice Issues
561

Hydrogen, Fuel Cells, and Infrastructure Technologies FY 2002 Progress Report
Dozens of public outreach events featuring vehicle, fuel, and fuel cell displays were conducted to increase awareness. Highlights included participation in the Michelin Bibendum Challenge by six of the CaFCP’s automotive companies and the Ballard ZEbus. This alternative fuel vehicle event included a road rally drive from Los Angeles to Las Vegas. The Partnership also developed a unique, portable exhibit that simulates refueling with hydrogen and presents fuel choice issues in DVD format.
The ZEbus was the first Partnership fuel cell-powered bus to be demonstrated in real-world conditions. The successful year-long test was conducted through the work of SunLine Transit Agency, located in the Palm Springs area.
Conclusion
The third year of the project featured new, measurable achievements in vehicle and fuel demonstrations. The construction of a headquarters facility has boosted the effort to provide hands-on, visible evidence of the fuel cell in operation – a necessary step on the road to commercialization.
CaFCP members continue to gain real-world experience driving vehicle miles, refueling with hydrogen and now methanol, and participating in public outreach events. There is a very unique strength within the California Fuel Cell Partnership, as members work cooperatively and competitively at the same time in a stimulating environment, exchanging experiences, learning from each other and exploring the pathways to commercialization.
The world is watching what happens with fuel cell transportation technology in the Sacramento area. The work of the California Fuel Cell Partnership has the potential to bring about revolutionary change to transportation systems worldwide – change that is beneficial for the environment, for the economy, and for future generations.
FY 2002 Publications/Presentations
1. Bringing Fuel Cell Vehicles to Market: Scenarios and Challenges with Fuel Alternatives (Oct. 2001)
2. EVS-18: Driving for the Future: An Update on the California Fuel Cell Partnership Experience
562

Hydrogen, Fuel Cells, and Infrastructure Technologies FY 2002 Progress Report
V.B.2 Filling Up With Hydrogen 2000
Matthew Fairlie (Primary Contact), Paul Scott, Alex LambertStuart Energy USA7949 Woodley Ave.Van Nuys, CA 91406(818) 375-5052, fax: (818) 780-0515, e-mail: [email protected]
DOE Technology Development Manager: Sigmund Gronich (202) 586-1623, fax: (202) 586-5860, e-mail: [email protected]
Objectives • Design and build fuel appliances based on new low-cost electrolyser technology.• Demonstrate hydrogen vehicle re-fueling using fuel appliance systems.• Obtain ‘third party operating experience feedback’ in refueling applications. • Establish precedents for development of codes and standards.• Determine cost effectiveness of fuel supply pathway.
Approach• Conduct prototype development project involving building eight different appliances; each appliance
project has five phases:- Design - Build- Test - Customer Evaluation- Tear-down and post mortem
Accomplishments • Seven fleet fuel appliance prototypes have been constructed, featuring different technical advances.
Three units have been placed in the field at the following sites: SunLine Transit, Powertech, and Southwest Research Institute; two units are built and being tested prior to delivery to the Fuel Cell Propulsion Institute and Alemeda County Transit; one additional unit is in testing un-deployed at this time. In addition, two smaller fueling systems called personal fuel appliances were built under this project, one of which is under evaluation with Ford Motor Company, supporting their fuel cell car program.
Future Directions • Complete prototype deployment. P4-1B unit will be moved from Southwest Research Institute, where
it is supplying fuel to a hydrogen motor generator set (joint development with Ford Power Products), to Wind Site at South Coast Air Quality District.
• Analyze performance of systems in the field; determine operating and manufacturing costs. • Commercialize systems within market potential; establish market and product support systems. • Project scheduled to be complete by March 31, 2003. Report results and recommend improvements for
next cycle of fuel appliance development.
563

Hydrogen, Fuel Cells, and Infrastructure Technologies FY 2002 Progress Report
Introduction
“Filling Up with Hydrogen 2000” is a prototyping development project intended to validate the Stuart Fuel Appliance Model for hydrogen vehicle fuel supply infrastructure. Stuart fuel appliances are on-site electrolytic hydrogen generators for refueling gaseous hydrogen vehicles. Using only electricity and water and having no emissions beyond oxygen, electrolytic fuel appliances can be readily deployed to create a highly distributed fuel supply network.
The objective of the Stuart/DOE project is to design, build and deploy a variety of fuel appliances. Two types of appliance are being built under this project: Fleet Fuel Appliances and Personal Fuel Appliances, both of which target the needs of nascent hydrogen vehicle commercialization. The Fleet Fuel Appliance targets buses, trucks and other centrally fuelled fleet vehicles, where fuel production rates in excess of 400 standard cubic feet per hour (scfh) are required. The Personal Fuel Appliance is geared towards consumers’ vehicles at the home or office, and can be powered by the utilities found in the typical North American home. The production rate of these units is in the range of 50 scfh. Both types of appliances are capable of delivering gaseous hydrogen at high pressure (up to 5000 pounds per square inch gauge [psig]) to the vehicle.
Approach
The successful development and demonstration of fuel appliance technology will enable a cost effective pathway for building a hydrogen fuel supply infrastructure to support hydrogen vehicles in their early commercialization. The fuel appliance addresses the issue of fuel delivery by providing point of use fuel generation using existing energy utilities. Using the existing electricity grid, a full service infrastructure can be built up as a distributed network of small electricity-to-hydrogen fuel converters.
Key to meeting the market requirements is reducing the cost of electrolysis. Stuart’s patented alkaline water electrolysis cell technology is designed to achieve the cost targets demanded by transportation fuels. The Double Electrode Plate
(DEP) technology uses low-cost polymer and metal sheets, which are easily assembled in a stack. The DEP electrolyser can be configured either as a single stack or multi-stack electrolyser. The multi-stack electrolyser, having multiple cells in parallel, can run cell currents up to 30,000 amps and is suitable for large fueler applications. All the prototypes built under “Filling Up With Hydrogen 2000” use DEP technology. The electrolyser packaged with the power system, compressor, purification and controls needed in a refueling application make up the fuel appliance.
“Filling Up With Hydrogen 2000” will provide an experience base with the cell stack technology for later commercialization and is a cost effective approach for equipment testing in that the user/customer picks up operating costs for the benefit of the hydrogen produced. In addition to testing the cell technology, the prototype development plan provides public exposure to the fuel appliance concept,
Figure 1. P3-5 Bus Fueler Appliance Cell Stack
564
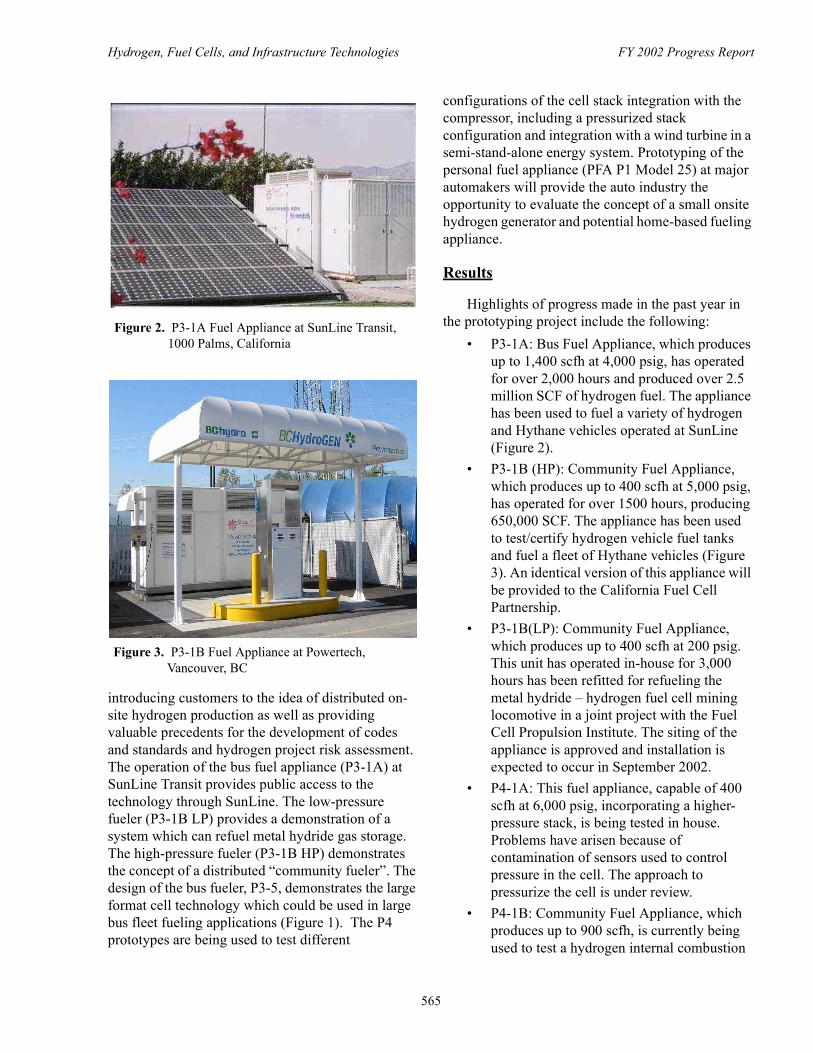
Hydrogen, Fuel Cells, and Infrastructure Technologies FY 2002 Progress Report
introducing customers to the idea of distributed on-site hydrogen production as well as providing valuable precedents for the development of codes and standards and hydrogen project risk assessment. The operation of the bus fuel appliance (P3-1A) at SunLine Transit provides public access to the technology through SunLine. The low-pressure fueler (P3-1B LP) provides a demonstration of a system which can refuel metal hydride gas storage. The high-pressure fueler (P3-1B HP) demonstrates the concept of a distributed “community fueler”. The design of the bus fueler, P3-5, demonstrates the large format cell technology which could be used in large bus fleet fueling applications (Figure 1). The P4 prototypes are being used to test different
configurations of the cell stack integration with the compressor, including a pressurized stack configuration and integration with a wind turbine in a semi-stand-alone energy system. Prototyping of the personal fuel appliance (PFA P1 Model 25) at major automakers will provide the auto industry the opportunity to evaluate the concept of a small onsite hydrogen generator and potential home-based fueling appliance.
Results
Highlights of progress made in the past year in the prototyping project include the following:
• P3-1A: Bus Fuel Appliance, which produces up to 1,400 scfh at 4,000 psig, has operated for over 2,000 hours and produced over 2.5 million SCF of hydrogen fuel. The appliance has been used to fuel a variety of hydrogen and Hythane vehicles operated at SunLine (Figure 2).
• P3-1B (HP): Community Fuel Appliance, which produces up to 400 scfh at 5,000 psig, has operated for over 1500 hours, producing 650,000 SCF. The appliance has been used to test/certify hydrogen vehicle fuel tanks and fuel a fleet of Hythane vehicles (Figure 3). An identical version of this appliance will be provided to the California Fuel Cell Partnership.
• P3-1B(LP): Community Fuel Appliance, which produces up to 400 scfh at 200 psig. This unit has operated in-house for 3,000 hours has been refitted for refueling the metal hydride – hydrogen fuel cell mining locomotive in a joint project with the Fuel Cell Propulsion Institute. The siting of the appliance is approved and installation is expected to occur in September 2002.
• P4-1A: This fuel appliance, capable of 400 scfh at 6,000 psig, incorporating a higher-pressure stack, is being tested in house. Problems have arisen because of contamination of sensors used to control pressure in the cell. The approach to pressurize the cell is under review.
• P4-1B: Community Fuel Appliance, which produces up to 900 scfh, is currently being used to test a hydrogen internal combustion
Figure 2. P3-1A Fuel Appliance at SunLine Transit, 1000 Palms, California
Figure 3. P3-1B Fuel Appliance at Powertech, Vancouver, BC
565
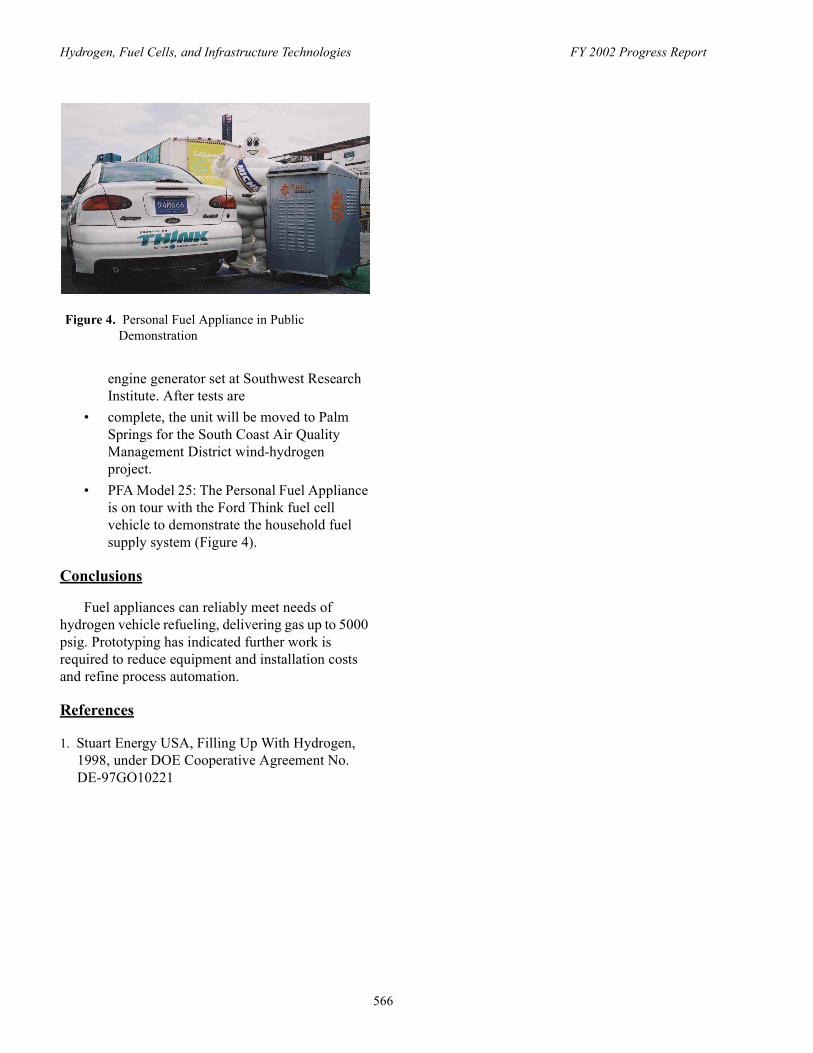
Hydrogen, Fuel Cells, and Infrastructure Technologies FY 2002 Progress Report
engine generator set at Southwest Research Institute. After tests are
• complete, the unit will be moved to Palm Springs for the South Coast Air Quality Management District wind-hydrogen project.
• PFA Model 25: The Personal Fuel Appliance is on tour with the Ford Think fuel cell vehicle to demonstrate the household fuel supply system (Figure 4).
Conclusions
Fuel appliances can reliably meet needs of hydrogen vehicle refueling, delivering gas up to 5000 psig. Prototyping has indicated further work is required to reduce equipment and installation costs and refine process automation.
References
1. Stuart Energy USA, Filling Up With Hydrogen, 1998, under DOE Cooperative Agreement No. DE-97GO10221
Figure 4. Personal Fuel Appliance in Public Demonstration
566

Hydrogen, Fuel Cells, and Infrastructure Technologies FY 2002 Progress Report
V.B.3 Hydrogen Reformer, Fuel Cell Power Plant, and Vehicle Refueling System
Venki Raman (Primary Contact)Air Products and Chemicals Inc.7201 Hamilton BoulevardAllentown, PA 18195(610) 481-8336, fax: (610) 706-7463, e-mail: [email protected]
DOE Technology Development Manager: Chris Bordeaux(202) 586-3070, fax: (202) 586-5860, e-mail: Chris.Bordeaux.ee.doe.gov
Main Subcontractors: Plug Power Inc., Latham, New York, City of Las Vegas, Las Vegas, Nevada
Objectives• Resolve design issues and demonstrate small, on-site hydrogen (H2) production for fuel cells and H2
fuel stations• Design, construct, and operate a multipurpose refueling station• Dispense compressed natural gas (CNG), H2/CNG blends, and pure H2 to up to 27 vehicles• Design, construct, and operate a stationary 50 kW fuel cell on pure H2• Evaluate operability, reliability, and economic feasibility of integrated power generation and vehicle
refueling designs• Maintain safety as a top priority in the refueling station and fuel cell design and operation• Obtain adequate operational data on the fuel station to provide a basis for future commercial fueling
station designs; develop appropriate “standard” designs for commercial applications• Expand the current facility to serve as the first commercial facility when sufficient hydrogen demand
develops. Ultimately serve as a link in a national H2 corridor
Approach• Further develop an existing small-scale (1,000 standard cubic feet per hour [scfh] H2) natural gas-
based autothermal reformer (ATR) prototype and test in conjunction with pressure swing adsorption (PSA) for on-site production of hydrogen
• Design and develop a scaled-up H2 generator (3,000 scfh H2)• Develop a 50 kW proton exchange membrane (PEM) fuel cell capable of operating on pure hydrogen,
based on 7 kW modules developed for a residential fuel cell product• Design and develop a multi-purpose fuel station capable of dispensing various blends of H2 and CNG
and pure H2 at pressures of 3,600 pounds per square inch (psi) and 5,000 psi for vehicle fueling• Achieve integrated operation of the complete system and conduct a nominal two-year test program to
determine reliability and maintainability• Operating modes for the integrated system will be developed for testing various operational scenarios
of the overall system
Accomplishments• The ATR prototype unit was fully characterized at the Air Products and Chemicals, Inc. (APCI) labs
after extensive changes necessitated by various operational issues
567

Hydrogen, Fuel Cells, and Infrastructure Technologies FY 2002 Progress Report
• Conclusions of economic analysis, which indicated that steam-methane reforming was the more appropriate choice for the scaled-up H2 generator, and recurring maintenance issues lead to decision not to install the prototype unit in Las Vegas in FY 02
• Constructed scaled-up H2 generator, and completed performance testing in the lab; shipped unit to Las Vegas (June 2002)
• Completed detailed design, fabrication, and testing on Plug Power’s first large scale stationary fuel cell system (50 kW); shipped 50 kW fuel cell systems to Las Vegas (October 2001)
• All subsystems (vehicle refueling system, hydrogen generator and fuel cell power generator) currently being installed (August 2002)
Introduction
A part of the strategy for implementing hydrogen infrastructure for fuel cells, particularly in the early years of fuel cell vehicle introduction, involves the development of very small reformers that can use natural gas to produce hydrogen on-site at the fuel station. These reformers will need to have about a ten-fold lower production capacity than current economically sized hydrogen plants. Furthermore, their utilization factors will be very poor due to the limited number of vehicles and their sporadic filling demands, in turn leading to poor economics. An approach to improving the economics of hydrogen fuel production at these scales may be to integrate a fuel cell power plant with the fuel station to produce power and sell it back to the electricity grid when there is low fuel demand by vehicles. This co-production of electric power and hydrogen fuel is referred to as the “Energy Station” concept.
This project involves the development and validation of small-scale hydrogen reformer technology, a 50 kW PEM fuel cell power plant, and a multipurpose vehicle fuel station capable of dispensing hydrogen; hydrogen enriched natural gas; and CNG.
Approach
The project is a combined effort of three organizations: Air Products (prime contractor) with responsibility for the overall project and specifically for the hydrogen reformer and the multipurpose fuel station; Plug Power Inc. with responsibility for the 50 kW PEM fuel cell development; and the City of Las Vegas with responsibility for providing the project site, for installing a CNG fuel station (outside the
scope of this project), for providing several vehicles operating on hydrogen/CNG blend fuels, and for facility operations support during the test period. Figure 1 shows a schematic of the overall integrated system configuration.
The project got started by testing an existing prototype small-scale (1,000 scfh) natural gas ATR previously under development by Air Products in conjunction with PSA for on-site production of hydrogen. Simultaneously, technical and economic studies of new small-scale reformer technologies were undertaken, outside the scope of this project, to select appropriate technology for a scaled-up hydrogen reformer (3,000 scfh) capable of meeting the hydrogen demands of up to 27 vehicles, and the 50 kW fuel cell.
The fuel station draws natural gas from a separate CNG fuel station installed by the City of Las Vegas. The multi-purpose fuel station was designed and developed by Air Products and utilized dynamic
Figure 1. Overall System Integration Configuration
568

Hydrogen, Fuel Cells, and Infrastructure Technologies FY 2002 Progress Report
blending of hydrogen and CNG to achieve various ratios and with the capability of dispensing the fuels at pressures of 3,600 psi and 5,000 psi.
Plug Power Inc. undertook the design and development of a 50 kW PEM fuel cell capable of operating on pure hydrogen, based on multiple 7 kW modules developed for a residential fuel cell product.
Results
Significant progress was made in the development of this project in the current year as described below.
H2 Generator
The fully integrated ATR prototype H2 generator that was completed last year and successfully tested at the Air Products laboratories in Allentown, PA, experienced ongoing operational issues requiring several changes. Major changes included replacement of the air blower to obtain additional capacity, steam generation coil and waste gas combustion chamber modifications due to failures, change of recycle water system to once-through due to solids build up, and PSA adsorbent change-out. Following these changes, a full characterization of the ATR was completed at the Air Products laboratories. However, based on an economic analysis that concluded that SMR technology was more economical than ATR technology to generate pure hydrogen at this size range (1000-3000 scfh H2), and the recurring maintenance issues, it was decided not to install it in Las Vegas in FY 02.
A SMR (3,000 scfh H2) based on technology from Harvest Energy Technologies was developed and tested at the Harvest facilities in California. Lessons learned in the previous ATR development were incorporated in the SMR development, including one button start capability, improved PSA recovery, and recycle of off-gas. The unit was moved to Las Vegas site.
Fuel Station
Air Products completed the fuel station design, and fabrication of all the equipment components such as the compressor, storage tubes, blender, and dispenser in November 2000. The integration of a
metal hydride “thermal” compressor to compress hydrogen for the fuel station was evaluated but dropped from the project since it was determined that there was insufficient waste heat from the reformer to provide the thermal energy required by the metal hydride compressor.
Installation of the fueling equipment at the project site was delayed by one year awaiting completion of the CLV CNG station, which was completed in March 2002. The required permits for installation of the hydrogen station were issued and site work initiated in late March 2002.
Fuel Cell
The 50 kW fuel cell stack system comprised of eight 7.5 kW stack modules was fully assembled and tested at Plug Power’s Latham, New York facility. This is Plug Power’s first large scale stationary system. Initial startup and qualification testing yielded a number of design changes related to component selection, control and electronic equipment, software algorithms, and gas delivery systems. Plug Power first qualified individual subsystems, followed by final system configuration testing. Test data provided an operational baseline and validation of the interface conditions to support integration into the refueling station.
The 50 kW fuel cell system was shipped to the Las Vegas site in October 2001. Figure 2 is a photograph of the complete 50 kW fuel cell power plant.
Figure 2. 50 kW Fuel Cell Power Plant
569

Hydrogen, Fuel Cells, and Infrastructure Technologies FY 2002 Progress Report
Conclusions• Studies indicated that SMR technology was
the more economical option than ATR technology for production of pure hydrogen in the size range of interest and was selected for the scale-up hydrogen generator.
• As of this writing (August 2002), all equipment items have been installed at the site and individual equipment checkout is underway.
• Current progress indicates that target start-up of fully integrated operations by September 1, 2002 will be met.
FY2002 Presentations
Presentations on the “Energy Station” concept and the Las Vegas project have been given to various audiences separately or in conjunction with a discussion of developing hydrogen infrastructure, including:
1. Merrill-Lynch Global Energy Technology Conference – New York City, May 2001
2. California Fuel Cell Partnership Steering Team – Diamond Bar, CA, October 2001
3. The EVAA Electric Transportation Industry Conference & Exposition – Sacramento, CA, December 2001
4. NRC Hydrogen Study Team Meeting - Washington D.C. CHALLENGES FOR THE CHEMICAL SCIENCES IN THE 21ST CENTURY – January 2002
5. Globe 2002 – Vancouver, Canada, March 2002
6. H2 Investor Forum – Washington, D.C., April 2002
Outreach efforts have been made to auto participants of the California Fuel Cell Partnership with a view to promote the Las Vegas site as a link in a California-Nevada hydrogen corridor.
570