Embed Size (px)
Citation preview

2016 Edition

Dairy Section,
Animal Industry Division
1341 Baseline Road, Tower 5, 4ndFloor
Ottawa, Ontario, K1A 0C5Fax: 613-773-0300Tel.: 613-773-0235E-mail: [email protected]
Dairy Farmers of Canada
Head Office21 Florence StreetOttawa, Ontario, K2P 0W6Fax: 613-236-0905Tel.: 613-236-9997E-mail: [email protected]
Dairy Processors Association of Canada
265 Carling Avenue, Suite 200Ottawa, Ontario, K1S 2E1Fax: 613-235-5866Tel.: 613-232-7242E-mail: [email protected]
Canadian Dairy Commission
Building 55, NCC DrivewayCentral Experimental Farm960 Carling AvenueOttawa, Ontario, K1A 0Z2Fax: 613-792-2009Tel.: 613-792-2040E-mail: [email protected]
Website: http://www.dairyinfo.gc.ca
Paru également en français sous le titre L'industrie laitière canadienne en chiffres – Édition 2016

FOREWORD Agriculture and Agri-Food Canada (AAFC), Dairy Farmers of Canada (DFC), Dairy Processors Association of Canada (DPAC) and the Canadian Dairy Commission (CDC) are pleased to present the Statistics of the Canadian Dairy Industry 2016 Edition which provides comprehensive information on the Canadian dairy industry. Reports in this 2016 Edition of the 'Statistics of the Canadian Dairy Industry' are included on our web site (http://www.dairyinfo.gc.ca) and may be subject to revision during the year.

DAIRY AT A GLANCE
Value of Manufactured Shipments 2
Dairy Cash Receipts 3
Dairy Establishments 4
THE FARM
Farms with Shipments of Milk 6
Dairy Cows by Province 7
Dairy Heifers by Province 8
---- Dairy Cattle Registrations
Dairy Cattle Registrations 10
Dairy Goat Registrations 11
---- Milk Recording
Herds Enrolled in Milk Recording Programs 12
Cows Enrolled in Milk Recording Programs 13
Percentage of Dairy Herds Enrolled in Milk Recording Programs 14
Percentage of Dairy Cows Enrolled in Milk Recording Programs 15
Average Production - All Breeds 16
Average Production by Province - All Breeds 17
Average Production by Breed 18
MILK SHIPMENTS
Milk Component Utilization and Volumes 26
Harmonized Milk Classification System 28
Production of Certified Organic Milk and Number of Producers (Farms) 29
THE PROCESSING SECTOR
Fluid Milk Sales 31
Cream Sales 35
Production of Dairy Products 39
THE CONSUMER
Per Capita Consumption of Milk & Cream 52
Per Capita Consumption of Dairy Products 53
BREED IMPROVEMENT AND GENETIC EVALUATION
TABLE OF CONTENTS

TABLE OF CONTENTSIMPORTS AND EXPORTS
Canadian Dairy Trade Balance 55
Share of Dairy Products in World Agri-Food Trade 56
Global Dairy Trade by Exporting Country 56
---- Exports
Canadian Exports of Dairy Products (Graph) 57
Canadian Exports of Dairy Products by Destination 58
Canadian Dairy Products Exports by Quantity and Value 59
Canadian Exports of All Cheeses by Country and Region 60
---- Imports
Canadian Imports of Dairy Products (Graph) 61
Canadian Imports of Dairy Products by Country of Origin 62
Canadian Dairy Products Imports by Quantity and Value 63
Canadian Imports of All Cheeses by Country and Region 64
Cheese Imports into Canada by Variety 65
Cheese Imports into Canada by Country of Origin 67
GENERAL INFORMATION
Canadian Population 69
Calcium Content of Dairy Products 70
Bioavailable Calcium Equivalents 71
Conversion Rates for Dairy Products 72
Weight Conversion Rates for Units of Volume 72
Contribution of Dairy Products to the Average Canadian Diet 73
Imperial-Metric Conversion Rates 74
Dairy Products Servings 75
Industry Related Websites 76

SYMBOLS
.. not available
... not applicable
- nil
-- amount too small to be expressed
p preliminary
x confidential
(+) indicates a % variation higher than 200
(-) indicates a % variation lower than -200
(i) incomplete total
GENERAL REMARKS
Calendar year: January 1st to December 31st
Dairy year: August 1st to July 31st
Due to rounding, totals may differ.
For confidentiality purposes, Newfoundland and Labrador is included in "Canada" unless otherwise specified.
Per capita calculations are based on the Canadian population as at July 1st (Statistics Canada, Table 051-0005).
PROVINCES AND TERRITORIES
AB Alberta
BC British Columbia
PE Prince Edward Island
MB Manitoba
NB New Brunswick
NS Nova Scotia
NU Nunavut
ON Ontario
QC Quebec
SK Saskatchewan
NL Newfoundland and Labrador
NT Northwest Territories
YT Yukon

DAIRY AT A GLANCE
1

2011 2012 2013 2014 2015
Dairy Products 13,816,535 14,153,512 15,860,358 17,082,248 16,999,329
Total Food and Beverages 93,955,113 94,571,141 96,561,681 103,366,097 106,515,904
Source: Statistics Canada
Calculations done by AAFC-AID, Dairy Section
CANADA 2015
Manufactured Shipments($'000)
Value of Manufactured Shipments
Dairy Products 16.0%
Beverages 10.2%
Meat 18.2%
Poultry 7.0%
Fruits & Vegetables 6.7%
Bakery 8.3%
Seafood Product Preparation
4.8%
Grains and Oilseeds 10.4%
Others 20.2%
Dairy Products Total: $17.0 billion
2

CANADA 2015
Dairy Cash Receipts1 by Province
AGR CGAR
2006 2010 2011 2012 2013 2014 2015 ('14-'15) ('06-'15)
NL 38,778 45,057 43,652 45,473 46,612 45,853 46,212 0.78 1.97
PE 63,087 71,267 73,945 75,862 76,007 75,845 75,149 (0.92) 1.96
NS 107,660 120,594 124,534 127,908 127,750 131,908 128,917 (2.27) 2.02
NB 84,365 93,868 98,953 101,299 102,415 101,353 100,650 (0.69) 1.98
QC 1,848,647 2,055,302 2,139,327 2,166,805 2,186,178 2,242,799 2,187,612 (2.46) 1.89
ON 1,590,920 1,780,374 1,895,327 1,908,433 1,895,134 1,955,734 1,943,336 (0.63) 2.25
MB 188,801 228,076 243,454 248,794 240,474 255,778 258,771 1.17 3.56
SK 133,433 157,270 169,039 170,283 174,441 178,901 178,658 (0.14) 3.30
AB 382,095 478,363 504,143 520,665 514,939 530,457 541,212 2.03 3.94
BC 405,445 494,018 522,772 530,255 527,658 554,732 562,625 1.42 3.71
Canada 4,843,231 5,524,189 5,815,146 5,895,777 5,891,608 6,073,360 6,023,142 (0.83) 2.45
1 After transportation and handling costs plus other fees
AGR: Annual growth rate
CGAR: Compound annual growthrate
Source: Statistics Canada
Calculations done by AAFC-AID, Market Information Section
Province($'000)
NL 0.8%
PE 1.2%
NS 2.1%
NB 1.7% QC
36.3%
ON 32.3%
MB 4.3% SK
3.0% AB 9.0%
BC 9.3%
Dairy Cash Receipts Total: $6.02 billion
3

THE FARM
4

YE
AR
BC
AB
SK
MB
ON
QC
NB
NS
PE
NL
CA
NA
DA
20
15
437
547
163
299
3,83
45,
766
206
225
174
321
1,6
83
20
14
455
566
166
308
3,92
65,
894
206
229
180
321
1,9
62
20
13
475
571
166
321
3,99
76,
038
211
235
187
331
2,2
34
20
12
491
585
172
332
4,08
36,
189
214
237
193
331
2,5
29
20
11
512
592
182
344
4,13
76,
281
219
245
200
341
2,7
46
20
10
529
598
190
356
4,19
16,
375
234
248
209
351
2,9
65
20
09
542
615
202
388
4,24
36,
492
231
253
213
351
3,2
14
20
08
556
638
226
410
4,35
26,
661
233
261
212
381
3,5
87
20
07
572
660
230
425
4,50
86,
869
240
272
222
381
4,0
36
20
06
615
692
243
455
4,68
87,
162
254
279
234
381
4,6
60
20
05
641
720
259
495
5,05
77,
508
258
297
246
411
5,5
22
20
04
667
749
278
530
5,34
67,
757
277
314
265
411
6,2
24
20
03
679
776
294
555
5,64
18,
054
285
344
301
411
6,9
70
20
02
691
820
318
583
6,01
38,
502
302
345
316
411
7,9
31
20
01
706
846
336
619
6,24
48,
891
309
360
314
481
8,6
73
20
00
718
894
373
649
6,46
89,
248
313
368
332
..1
9,3
63
19
99
752
953
399
698
6,91
89,
774
329
389
364
..2
0,5
76
19
98
782
1,00
742
274
57,
204
10,2
6634
240
738
6..
21
,56
1
19
97
808
1,08
248
482
57,
617
10,6
1437
343
041
0..
22
,64
3
19
70
1,79
215
,116
14,2
3110
,323
29,5
1544
,784
2,33
22,
257
2,56
4..
12
2,9
14
.. N
ot a
vaila
ble
Sou
rce:
Can
adia
n D
airy
Com
mis
sion
Cal
cula
tions
don
e by
AA
FC-A
ID, M
arke
t Inf
orm
atio
n S
ectio
n
NU
MB
ER
OF
FA
RM
S W
ITH
SH
IPM
EN
TS
OF
MIL
K O
R C
RE
AM
ON
AU
GU
ST
1s
t
5

('0
00
)
2016
75.1
77.9
27.1
44.7
318.7
354.1
18.5
23.2
14.3
6.0
959.6
2015
74.1
77.4
26.9
43.7
316.7
353.8
18.7
23.0
14.0
5.9
954.2
2014
72.6
80.7
27.4
43.2
318.8
354.8
18.9
23.0
13.9
6.0
959.3
2013
72.9
80.8
27.6
43.3
318.6
355.4
19.1
23.0
13.9
5.9
960.5
2012
72.2
80.9
28.0
42.8
317.7
356.1
19.0
22.3
13.5
5.9
958.4
2011
74.1
81.0
28.6
42.8
319.2
359.8
19.0
22.0
13.0
6.1
965.6
2010
73.9
81.1
28.7
43.3
319.6
359.2
19.7
21.1
13.2
6.4
966.2
2009
73.8
81.2
28.8
43.8
315.3
361.6
19.2
22.4
12.8
6.7
965.6
2008
73.6
81.3
28.9
44.2
322.6
372.9
18.9
22.5
13.0
6.8
984.7
2007
72.0
81.4
29.0
44.6
326.5
383.3
19.0
22.1
13.2
6.4
997.5
2006
75.0
85.5
29.0
45.0
334.0
390.0
18.9
22.3
13.2
6.2
1,0
19.1
2005
78.0
83.0
31.0
44.0
344.8
399.0
19.3
22.9
13.5
5.9
1,0
41.4
2004
80.0
86.5
31.5
42.0
355.5
397.0
19.2
24.0
14.0
5.2
1,0
54.9
2003
76.0
87.0
32.0
40.5
364.0
403.0
19.3
24.2
14.7
4.8
1,0
65.5
2002
74.5
92.0
28.0
42.0
367.0
418.0
19.2
24.0
14.5
4.7
1,0
83.9
2001
70.5
90.0
33.0
42.0
372.0
420.0
19.5
24.5
14.8
4.7
1,0
91.0
2000
71.0
87.0
31.0
41.5
380.0
427.0
20.5
25.8
15.0
4.6
1,1
03.4
1999
74.0
90.0
34.0
50.0
391.0
450.0
21.0
26.0
16.2
4.5
1,1
56.7
1998
78.0
94.0
35.0
53.0
400.0
456.0
21.2
26.2
16.2
4.4
1,1
84.0
1970
81.0
190.0
105.0
110.0
792.0
910.0
37.0
42.0
28.0
..2,2
95.0
.. N
ot
availa
ble
Sourc
e:
Sta
tistics C
anada
Calc
ula
tio
ns d
one b
y A
AF
C-A
ID,
Mark
et
Info
rmatio
n S
ectio
n
MB
ON
QC
DA
IRY
CO
WS
BY
PR
OV
INC
E O
N J
AN
UA
RY
1st
NB
NS
PE
NL
CA
NA
DA
YE
AR
BC
AB
SK
6

('0
00
)
2016
33.0
39.5
9.1
19.9
166.2
148.9
8.7
10.1
7.2
2.2
444.8
2015
35.0
38.5
9.0
19.1
164.2
150.9
8.6
10.0
7.1
2.2
444.6
2014
34.5
38.7
9.1
19.2
163.1
151.5
8.8
10.2
7.0
2.1
444.2
2013
35.3
38.6
9.3
20.9
169.6
149.0
9.0
10.1
7.2
2.2
451.2
2012
35.6
38.7
12.4
20.2
167.1
153.5
9.0
11.4
6.9
2.1
456.9
2011
34.9
38.4
11.4
19.9
169.2
162.1
9.8
11.6
6.7
2.3
466.3
2010
34.2
37.4
11.5
19.8
170.3
161.9
9.2
12.0
6.6
2.2
465.1
2009
32.7
36.7
11.6
19.6
171.5
161.5
9.4
12.5
7.1
2.1
464.7
2008
33.9
35.8
11.7
19.3
175.6
168.3
9.5
12.4
7.0
2.0
475.5
2007
33.4
35.9
11.9
19.2
177.2
177.3
9.5
12.0
7.3
1.9
485.6
2006
30.0
36.5
12.0
19.0
185.0
182.0
9.5
11.7
7.4
2.0
495.1
2005
36.0
36.0
14.0
18.0
205.0
178.0
10.0
11.4
7.4
2.0
517.8
2004
38.0
35.0
14.5
20.0
198.0
169.0
10.0
10.7
7.2
1.9
504.3
2003
38.0
35.0
15.0
18.0
205.0
172.0
9.8
10.9
7.0
1.6
512.3
2002
34.0
36.0
14.0
18.5
200.0
176.0
9.4
11.3
6.9
1.4
507.5
2001
38.0
35.0
14.0
17.0
191.0
174.0
9.0
11.2
6.9
1.4
497.5
2000
37.5
34.0
14.0
17.0
180.0
178.0
8.0
10.0
6.8
1.2
486.5
1999
32.0
35.0
15.0
16.0
184.0
186.0
8.2
10.0
6.9
1.0
494.1
1998
27.5
37.0
16.0
17.0
189.0
199.0
8.2
10.0
6.8
0.8
511.3
1970
23.0
32.0
19.0
24.0
233.0
181.0
8.2
10.0
6.2
..536.4
.. N
ot
availa
ble
Sourc
e:
Sta
tistics C
anada
Calc
ula
tio
ns d
one b
y A
AF
C-A
ID,
Mark
et
Info
rmatio
n S
ectio
n
DA
IRY
HE
IFE
RS
BY
PR
OV
INC
E O
N J
AN
UA
RY
1st
NB
NS
PE
NL
CA
NA
DA
YE
AR
BC
AB
SK
MB
ON
QC
7

BREED IMPROVEMENT AND GENETIC EVALUATION
Dairy Cattle Registrations
Milk Recording
8

2015 6,138 1,562 309 296 274,172 9,045 15 402 291,939
2014 6,419 1,254 275 226 268,205 8,816 17 252 285,464
2013 5,651 1,404 198 188 277,051 9,209 51 317 294,069
2012 5,781 1,474 336 220 271,580 8,997 11 353 288,752
2011 6,499 1,454 230 225 263,243 8,440 6 275 280,372
2010 6,382 1,720 251 257 271,280 7,634 9 275 287,808
2009 6,791 1,515 246 264 241,198 7,915 26 261 258,216
2008 6,489 1,523 223 221 236,435 7,305 10 284 252,490
2007 6,407 1,615 230 232 230,283 6,689 14 245 245,715
2006 6,799 1,710 275 257 232,767 6,165 8 243 248,224
2005 7,052 2,211 254 298 232,964 6,378 - 224 249,381
2004 7,217 1,450 198 292 232,754 6,235 3 210 248,359
2003 7,513 1,465 153 363 227,826 6,233 4 314 243,871
2002 7,973 1,471 184 460 228,275 7,192 8 291 245,854
2001 7,331 1,414 153 400 223,739 5,943 - 248 239,228
2000 8,212 1,421 206 464 214,244 6,513 3 310 231,373
1999 7,988 1,461 235 700 219,187 7,768 6 257 237,602
1998 8,218 1,441 144 753 223,593 6,748 20 265 241,182
1997 8,142 1,420 203 713 239,443 6,011 4 255 256,191
Calculations done by AAFC-AID, Market Information Section
DAIRY CATTLE REGISTRATIONS IN CANADA
HOLSTEIN JERSEY TOTAL1AYRSHIREYEAR
BROWN
SWISS
MILKING
SHORTHORNKERRY
Source: Breed associations and Canadian Livestock Records Corporation
1 Includes "percentage animals" (not 100% purebred)
CANADIENN
EGUERNSEY
256,191
291,939
0
50,000
100,000
150,000
200,000
250,000
300,000
1997 1999 2001 2003 2005 2007 2009 2011 2013 2015
Dairy Cattle Registrations in Canada
9

2015 1,335 261 276 623 26 806 181 3,508
2014 1,512 189 238 636 25 990 215 3,805
2013 1,583 171 196 663 15 887 177 3,692
2012 1,942 262 121 507 41 1,678 244 4,795
2011 2,226 196 84 509 13 1,217 134 4,379
2010 1,977 292 77 460 26 1,028 223 4,083
2009 1,530 250 97 583 4 1,016 182 3,662
2008 1,914 267 68 530 3 1,108 216 4,106
2007 1,576 397 58 662 8 995 187 3,883
2006 1,476 396 52 605 9 725 262 3,525
2005 1,336 276 53 548 10 672 221 3,116
2004 942 269 47 565 9 639 163 2,634
2003 1,001 271 47 728 11 690 226 2,974
2002 1,521 299 56 1,021 10 1,011 266 4,184
2001 1,651 368 51 1,043 13 886 332 4,344
2000 1,273 336 68 862 25 797 359 3,720
1999 1,234 264 68 826 16 635 363 3,406
1998 875 274 73 1,036 40 673 338 3,309
1997 902 225 77 1,068 53 611 395 3,331
Calculations done by AAFC-AID, Market Information Section
DAIRY GOAT REGISTRATIONS IN CANADA
OBERHSALI SAANEN TOTAL1ALPINEYEAR LA MANCHA TOGGENBURG
Source: Canadian Livestock Records Corporation
1 Includes "percentage animals" (not 100% purebred)
NIGERIAN
DWARFNUBIAN
3,331 3,508
0
1,000
2,000
3,000
4,000
5,000
6,000
1997 1999 2001 2003 2005 2007 2009 2011 2013 2015
Dairy Goat Registrations in Canada
10

HERDS ENROLLED IN MILK RECORDING PROGRAMS
2015 306 395 93 174 2,853 4,400 128 135 94 7 8,585
2014 302 418 104 191 2,948 4,696 134 137 103 6 9,039
2013 305 426 102 195 3,024 4,827 136 145 108 5 9,273
2012 304 449 105 199 3,091 4,955 138 147 118 5 9,511
2011 304 455 108 204 3,110 4,990 150 148 120 5 9,594
2010 310 455 115 208 3,112 5,083 154 155 124 5 9,721
2009 319 459 124 213 3,136 5,118 160 161 129 3 9,822
2008 326 466 139 222 3,177 5,231 162 166 132 4 10,025
2007 338 485 141 233 3,299 5,387 170 173 145 4 10,375
2006 344 495 154 237 3,346 5,492 177 182 151 3 10,581
2005 366 508 158 248 3,559 5,697 208 206 163 3 11,116
2004 378 534 169 260 3,821 6,003 200 205 164 2 11,736
2003 393 545 183 280 4,000 6,068 216 215 172 16 12,088
2002 427 605 205 326 4,199 6,332 230 226 181 17 12,748
2001 415 596 203 333 4,318 6,592 230 233 189 18 13,127
2000 428 620 223 362 4,323 6,796 237 239 192 15 13,435
1999 453 703 239 381 4,495 7,139 246 253 190 13 14,112
1998 495 707 264 450 4,634 7,319 242 265 204 17 14,597
1997 477 752 282 460 4,853 7,211 251 276 213 19 14,794
Calculations done by AAFC-AID, Market Information Section
PEON QC NB NS NL CANADA
Source: Agriculture and Agri-Food Canada
(OFFICIAL AND MANAGEMENT)
BC AB SK MBYEAR
6,633 4,715
8,161
3,870
22,643
11,683
0
5,000
10,000
15,000
20,000
25,000
0
5,000
10,000
15,000
20,000
25,000
30,000
1997 1999 2001 2003 2005 2007 2009 2011 2013 2015
Herds Enrolled on Milk Recording Programs (Official and Management)
Herds - Official Herds - Management Herds - Total Canada
11

COWS ENROLLED IN MILK RECORDING PROGRAMS
2015 52,049 56,803 17,027 26,978 231,652 277,352 11,582 11,397 8,169 1,256 694,265
2014 47,682 58,260 18,147 27,924 230,930 281,547 11,607 11,504 8,264 872 696,737
2013 45,000 57,027 17,000 27,136 232,212 287,577 11,536 11,921 8,566 711 698,686
2012 46,312 62,327 18,016 27,182 240,890 295,543 11,869 12,604 9,253 710 724,706
2011 45,165 61,531 17,587 27,694 237,698 292,198 11,076 12,458 9,012 773 715,192
2010 44,009 58,721 17,451 25,992 231,459 290,188 12,069 12,959 9,118 798 702,764
2009 43,302 58,437 17,985 25,478 234,373 296,345 12,188 13,263 9,677 762 711,810
2008 42,959 59,417 19,075 26,946 228,659 294,761 11,821 13,408 9,183 728 706,957
2007 43,334 58,414 18,057 25,496 236,766 299,044 12,214 14,159 9,842 692 718,018
2006 41,597 55,459 18,837 25,963 225,124 294,875 12,134 13,678 9,687 484 697,838
2005 43,989 58,046 18,296 26,827 231,400 301,905 13,153 14,110 9,973 413 718,112
2004 43,732 58,700 18,437 24,399 247,265 314,978 12,873 14,308 10,184 360 745,236
2003 43,958 56,357 19,267 24,499 252,276 311,333 13,057 14,502 10,251 1,141 746,641
2002 42,982 54,572 18,502 24,633 245,505 302,398 13,070 14,403 9,745 1,259 727,069
2001 43,806 56,436 18,182 24,664 245,471 305,240 13,045 14,591 9,664 1,162 732,261
2000 42,918 55,108 18,467 25,320 236,074 308,426 13,104 14,345 9,651 1,043 724,456
1999 44,205 60,217 18,347 24,627 243,708 311,209 13,787 14,564 9,067 920 740,651
1998 46,076 57,696 18,240 26,844 237,459 315,199 13,281 14,851 9,107 1,248 740,001
1997 48,774 60,533 18,733 26,096 246,273 307,519 13,472 15,351 9,688 1,510 747,949
Calculations done by AAFC-AID, Market Information Section
(OFFICIAL AND MANAGEMENT)
BC AB SK MB ON QC NBYEAR
Source: Agriculture and Agri-Food Canada
NS PE NL CANADA
383,037 409,742
364,912 284,523
1,231,100
954,200
0
200,000
400,000
600,000
800,000
1,000,000
1,200,000
1,400,000
0
200,000
400,000
600,000
800,000
1,000,000
1,200,000
1,400,000
1997 1999 2001 2003 2005 2007 2009 2011 2013 2015
Cows Enrolled on Milk Recording Programs (Official and Management)
Cows - Official Cows - Management Cows - Total Canada
12

PERCENTAGE OF DAIRY HERDS ENROLLED IN MILK RECORDING PROGRAMS
2015 70.0 72.2 57.1 58.2 74.4 76.3 62.1 60.0 54.0 21.9 73.5
2014 66.4 73.9 62.7 62.0 75.1 79.7 65.0 59.8 57.2 18.8 75.6
2013 64.2 74.6 61.4 60.7 75.7 79.9 64.5 61.7 57.8 15.2 75.9
2012 61.9 76.8 61.0 59.9 75.7 80.1 64.5 62.0 61.1 15.2 75.9
2011 59.4 76.9 59.3 59.3 75.2 79.4 68.5 60.4 60.0 14.7 75.3
2010 58.6 76.1 60.5 58.4 74.3 79.7 65.8 62.5 59.3 14.3 75.0
2009 58.9 74.6 61.4 54.9 73.9 78.8 69.3 63.6 60.6 8.6 74.3
2008 58.6 73.0 61.5 54.1 73.0 78.5 69.5 63.6 62.3 10.5 73.8
2007 59.1 73.5 61.3 54.8 73.2 78.4 70.8 63.6 65.3 10.5 73.9
2006 55.9 71.5 63.4 52.1 71.4 76.7 69.7 65.2 64.5 7.9 72.2
2005 57.1 70.6 61.0 50.1 70.4 75.9 80.6 69.4 66.3 7.3 71.6
2004 56.7 71.3 60.8 49.1 71.5 77.4 72.2 65.3 61.9 4.9 72.3
2003 57.9 70.2 62.2 50.5 70.9 75.3 75.8 62.5 57.1 39.0 71.2
2002 61.8 73.8 64.5 55.9 69.8 74.5 76.2 65.5 57.3 41.5 71.1
2001 58.8 70.4 60.4 53.8 69.2 74.1 74.4 64.7 60.2 37.5 70.3
2000 59.6 69.4 59.8 55.8 66.8 73.5 75.7 64.9 57.8 .. 69.4
1999 60.2 73.8 59.9 54.6 65.0 73.0 74.8 65.0 52.2 .. 68.6
1998 63.3 70.2 62.6 60.4 64.3 71.3 70.8 65.1 52.8 .. 67.7
1997 59.0 69.5 58.3 55.8 63.7 67.9 67.3 64.2 52.0 .. 65.3
..: Not available
Source: Agriculture and Agri-Food Canada
Calculations done by AAFC-AID, Market Information Section
(OFFICIAL AND MANAGEMENT)
BC AB SK MB ON QC NBYEAR NS PE NL CANADA
65.3%
73.5%
50%
55%
60%
65%
70%
75%
80%
1997 1999 2001 2003 2005 2007 2009 2011 2013 2015
Percentage of Dairy Herds Enrolled on Milk Recording Programs (Official and Management)
13

PERCENTAGE OF DAIRY COWS ENROLLED IN MILK RECORDING PROGRAMS
2015 69.3 72.9 62.8 60.4 72.7 78.3 62.6 49.1 57.1 20.9 72.3
2014 64.3 75.3 67.5 63.9 72.9 79.6 62.1 50.0 59.0 14.8 73.0
2013 62.0 70.7 62.0 62.8 72.8 81.1 61.0 51.8 61.6 11.9 72.8
2012 63.5 77.1 65.3 62.8 75.6 83.2 62.1 54.8 66.6 12.0 75.5
2011 62.6 76.1 62.8 64.7 74.8 82.1 58.3 55.9 66.8 13.1 74.6
2010 59.4 72.5 61.0 60.7 72.5 80.7 63.5 58.9 70.1 13.1 72.8
2009 58.6 72.1 62.7 58.8 73.3 82.5 61.9 62.9 73.3 11.9 73.7
2008 58.2 73.2 66.2 61.5 72.5 81.5 61.6 59.9 71.7 10.9 73.2
2007 58.9 71.8 62.5 57.7 73.4 80.2 64.6 62.9 75.7 10.2 72.9
2006 57.8 68.1 65.0 58.2 69.0 76.9 63.9 61.9 73.4 7.6 70.0
2005 58.7 67.9 63.1 59.6 69.3 77.4 69.6 63.3 75.6 6.7 70.5
2004 56.1 70.7 59.5 55.5 71.7 78.9 66.7 62.5 75.4 6.1 71.6
2003 54.9 65.2 61.2 58.3 71.0 78.4 68.0 60.4 73.2 21.9 70.8
2002 56.6 62.7 57.8 60.8 67.4 75.0 67.7 59.5 66.3 26.2 68.2
2001 58.8 61.3 64.9 58.7 66.9 73.0 67.9 60.8 66.6 24.7 67.6
2000 60.9 61.2 56.0 60.3 63.5 73.4 67.2 58.6 65.2 22.2 66.4
1999 62.3 69.2 59.2 59.3 64.1 72.9 67.3 56.4 60.4 20.0 67.1
1998 62.3 64.1 53.6 53.7 60.7 70.0 63.2 57.1 56.2 27.7 64.0
1997 62.5 64.4 53.5 49.2 61.6 67.4 63.5 58.6 59.8 34.3 63.2
ON QC NB NS PE NL CANADA
Source: Agriculture and Agri-Food Canada
Calculations done by AAFC-AID, Market Information Section
YEAR
(OFFICIAL AND MANAGEMENT)
BC AB SK MB
63.2%
72.3%
50%
55%
60%
65%
70%
75%
80%
1997 1999 2001 2003 2005 2007 2009 2011 2013 2015
Perrcentage of Dairy Cows Enrolled on Milk Recording Program (Official and Management)
14
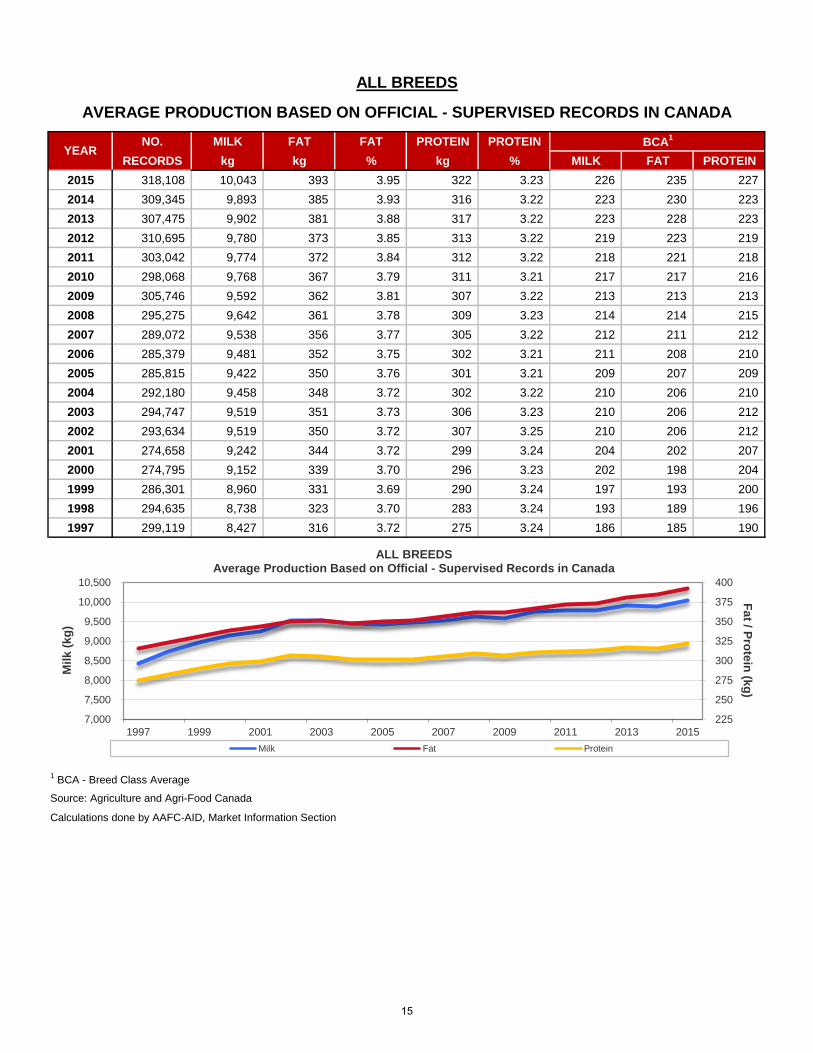
NO. MILK FAT FAT PROTEIN PROTEIN
RECORDS kg kg % kg % MILK FAT PROTEIN
2015 318,108 10,043 393 3.95 322 3.23 226 235 227
2014 309,345 9,893 385 3.93 316 3.22 223 230 223
2013 307,475 9,902 381 3.88 317 3.22 223 228 223
2012 310,695 9,780 373 3.85 313 3.22 219 223 219
2011 303,042 9,774 372 3.84 312 3.22 218 221 218
2010 298,068 9,768 367 3.79 311 3.21 217 217 216
2009 305,746 9,592 362 3.81 307 3.22 213 213 213
2008 295,275 9,642 361 3.78 309 3.23 214 214 215
2007 289,072 9,538 356 3.77 305 3.22 212 211 212
2006 285,379 9,481 352 3.75 302 3.21 211 208 210
2005 285,815 9,422 350 3.76 301 3.21 209 207 209
2004 292,180 9,458 348 3.72 302 3.22 210 206 210
2003 294,747 9,519 351 3.73 306 3.23 210 206 212
2002 293,634 9,519 350 3.72 307 3.25 210 206 212
2001 274,658 9,242 344 3.72 299 3.24 204 202 207
2000 274,795 9,152 339 3.70 296 3.23 202 198 204
1999 286,301 8,960 331 3.69 290 3.24 197 193 200
1998 294,635 8,738 323 3.70 283 3.24 193 189 196
1997 299,119 8,427 316 3.72 275 3.24 186 185 190
1 BCA - Breed Class Average
Source: Agriculture and Agri-Food Canada
Calculations done by AAFC-AID, Market Information Section
AVERAGE PRODUCTION BASED ON OFFICIAL - SUPERVISED RECORDS IN CANADA
YEARBCA
1
ALL BREEDS
225
250
275
300
325
350
375
400
7,000
7,500
8,000
8,500
9,000
9,500
10,000
10,500
1997 1999 2001 2003 2005 2007 2009 2011 2013 2015
Fa
t / Pro
tein
(kg
) M
ilk
(k
g)
ALL BREEDS Average Production Based on Official - Supervised Records in Canada
Milk Fat Protein
15

ALL BREEDS
AVERAGE PRODUCTION BY PROVINCE BASED ON OFFICIAL RECORDS IN CANADA
BCA1
BC 247 26,237 10,444 400 3.88 334 3.22 237 241 236
AB 253 28,758 10,428 402 3.89 331 3.19 234 242 232
SK 71 8,166 10,405 400 3.87 334 3.22 231 239 233
MB 135 13,347 10,125 382 3.80 319 3.17 227 229 224
ON 2,001 122,896 9,956 390 3.95 318 3.22 225 233 225
QC 2,020 98,540 9,936 395 4.01 324 3.28 224 236 228
NB 105 6,990 9,424 367 3.94 300 3.20 212 218 210
NS 108 7,145 10,163 395 3.91 324 3.21 224 233 225
PE 78 5,410 9,843 387 3.95 309 3.16 218 230 215
NL 5 619 10,385 413 4.01 329 3.18 225 241 224
CANADA 5,023 318,108 10,043 393 3.95 322 3.23 226 235 227
1 BCA - Breed Class Average
Source: Agriculture and Agri-Food Canada
Calculations done by AAFC-AID, Market Information Section
2015
PROVINCENO.
HERDS
NO.
RECORDS
MILK
kg
FAT
kg
FAT
%
PROTEIN
kg
PROTEIN
% MILK
kg
FAT
kg
PROTEIN
kg
16

NO. MILK FAT FAT PROTEIN PROTEIN
RECORDS kg kg % kg % MILK FAT PROTEIN
2015 8,196 7,842 323 4.13 263 3.36 226 226 230
2014 8,146 7,781 319 4.11 261 3.37 224 223 228
2013 8,484 7,775 315 4.07 261 3.36 225 221 229
2012 8,499 7,659 310 4.05 257 3.36 221 217 225
2011 8,694 7,717 310 4.03 258 3.35 221 216 224
2010 8,809 7,663 307 4.02 255 3.34 218 213 221
2009 9,205 7,468 301 4.04 250 3.35 214 209 217
2008 8,830 7,561 301 3.99 253 3.36 216 209 221
2007 9,244 7,422 294 3.97 247 3.34 213 204 216
2006 9,323 7,423 293 3.96 246 3.32 213 204 214
2005 9,828 7,354 292 3.98 244 3.32 211 203 213
2004 10,055 7,323 290 3.97 243 3.32 210 201 211
2003 10,337 7,386 292 3.97 245 3.33 210 202 212
2002 10,405 7,369 292 3.98 246 3.34 210 202 213
2001 10,019 7,214 288 4.00 242 3.35 205 199 209
2000 10,176 7,172 284 3.96 239 3.33 202 195 205
1999 10,814 7,027 276 3.93 233 3.32 199 190 201
1998 11,312 6,842 270 3.95 227 3.31 193 185 196
1997 11,881 6,664 266 3.99 223 3.35 188 182 192
1 BCA - Breed Class Average
Source: Agriculture and Agri-Food Canada
Calculations done by AAFC-AID, Market Information Section
AVERAGE PRODUCTION BASED ON OFFICIAL - SUPERVISED RECORDS IN CANADA
YEARBCA
1
AYRSHIRE
200
220
240
260
280
300
320
340
5,500
6,000
6,500
7,000
7,500
8,000
8,500
1997 1999 2001 2003 2005 2007 2009 2011 2013 2015
Fa
t / Pro
tein
(kg
) M
ilk
(k
g)
Average Production Based on Official - Supervised Records in Canada
Milk Fat Protein
AYRSHIRE
17

NO. MILK FAT FAT PROTEIN PROTEIN
RECORDS kg kg % kg % MILK FAT PROTEIN
2015 1,763 8,496 355 4.19 296 3.49 222 230 221
2014 1,731 8,401 351 4.20 293 3.49 218 227 217
2013 1,796 8,465 351 4.17 296 3.51 219 226 218
2012 1,883 8,258 340 4.14 289 3.51 213 218 213
2011 1,978 8,260 340 4.13 288 3.50 214 219 213
2010 1,933 8,340 338 4.07 288 3.47 215 217 213
2009 1,974 8,127 329 4.08 282 3.48 211 213 209
2008 1,661 8,366 337 4.04 290 3.48 217 217 215
2007 1,545 8,159 330 4.06 283 3.48 211 212 209
2006 1,528 8,064 326 4.06 278 3.46 208 209 205
2005 1,397 7,792 319 4.12 270 3.48 201 205 199
2004 1,398 8,048 326 4.07 279 3.47 206 208 204
2003 1,454 8,038 324 4.04 279 3.49 207 208 206
2002 1,458 8,215 329 4.03 287 3.50 207 207 206
2001 1,311 8,020 323 4.02 281 3.50 203 204 203
2000 1,550 7,920 314 3.96 276 3.48 201 198 200
1999 1,585 7,585 306 4.03 268 3.54 192 193 194
1998 1,678 7,105 287 4.04 249 3.50 179 180 179
1997 1,776 6,818 276 4.05 240 3.52 172 174 173
1 BCA - Breed Class Average
Source: Agriculture and Agri-Food Canada
Calculations done by AAFC-AID, Market Information Section
AVERAGE PRODUCTION BASED ON OFFICIAL - SUPERVISED RECORDS IN CANADA
YEARBCA
1
BROWN SWISS
220
240
260
280
300
320
340
360
5,500
6,000
6,500
7,000
7,500
8,000
8,500
9,000
1997 1999 2001 2003 2005 2007 2009 2011 2013 2015
Fa
t / Pro
tein
(kg
) M
ilk
(k
g)
Average Production Based on Official - Supervised Records in Canada
Milk Fat Protein
BROWN SWISS
18

NO. MILK FAT FAT PROTEIN PROTEIN
RECORDS kg kg % kg % MILK FAT PROTEIN
2015 206 5,998 258 4.32 212 3.56 212 202 218
2014 194 5,752 249 4.34 205 3.57 203 194 209
2013 168 5,921 251 4.28 209 3.56 211 199 217
2012 168 5,883 249 4.24 208 3.55 210 196 215
2011 178 6,107 263 4.31 216 3.56 217 206 223
2010 191 5,791 252 4.35 205 3.55 206 198 211
2009 187 5,761 249 4.32 204 3.56 203 194 209
2008 190 5,415 231 4.25 194 3.59 192 181 200
2007 180 5,353 227 4.25 192 3.61 190 179 198
2006 203 5,412 228 4.24 193 3.60 188 177 196
2005 216 5,377 225 4.21 191 3.57 190 177 196
2004 167 5,776 236 4.12 203 3.54 202 184 207
2003 159 5,671 233 4.15 201 3.57 196 179 202
2002 168 5,961 252 4.24 212 3.58 206 193 212
2001 154 6,089 259 4.25 224 3.68 216 202 230
2000 160 6,186 268 4.33 224 3.61 217 209 227
1999 163 5,818 249 4.28 211 3.63 201 191 212
1998 212 5,423 232 4.28 197 3.63 189 180 200
1997 231 5,285 226 4.28 193 3.65 185 175 196
1 BCA - Breed Class Average
Source: Agriculture and Agri-Food Canada
Calculations done by AAFC-AID, Market Information Section
AVERAGE PRODUCTION BASED ON OFFICIAL - SUPERVISED RECORDS IN CANADA
YEARBCA
1
CANADIENNE
150
175
200
225
250
275
300
4,000
4,500
5,000
5,500
6,000
6,500
1997 1999 2001 2003 2005 2007 2009 2011 2013 2015
Fa
t / Pro
tein
(kg
) M
ilk
(k
g)
Average Production Based on Official - Supervised Records in Canada
Milk Fat Protein
CANADIENNE
19

NO. MILK FAT FAT PROTEIN PROTEIN
RECORDS kg kg % kg % MILK FAT PROTEIN
2015 384 6,730 313 4.67 228 3.40 203 189 194
2014 370 6,759 315 4.69 231 3.43 205 191 197
2013 375 6,952 322 4.64 239 3.45 211 195 204
2012 374 6,831 313 4.60 234 3.44 207 190 200
2011 371 7,062 322 4.57 241 3.42 216 196 207
2010 357 6,891 310 4.51 235 3.43 208 187 200
2009 419 6,812 310 4.56 233 3.43 205 186 198
2008 415 6,820 305 4.51 234 3.45 208 186 200
2007 401 6,673 299 4.51 230 3.46 203 181 196
2006 422 6,540 296 4.55 224 3.43 198 179 190
2005 468 6,398 286 4.50 219 3.43 194 173 186
2004 503 6,435 290 4.54 221 3.45 195 176 189
2003 648 6,570 293 4.49 228 3.49 198 176 193
2002 777 6,347 279 4.44 222 3.51 192 168 188
2001 707 6,015 268 4.45 211 3.51 181 161 178
2000 921 5,949 265 4.45 207 3.48 179 159 176
1999 1,114 5,939 263 4.43 210 3.54 178 157 177
1998 1,369 5,991 268 4.48 212 3.55 181 162 180
1997 1,455 5,919 268 4.53 210 3.55 179 162 179
1 BCA - Breed Class Average
Source: Agriculture and Agri-Food Canada
Calculations done by AAFC-AID, Market Information Section
AVERAGE PRODUCTION BASED ON OFFICIAL - SUPERVISED RECORDS IN CANADA
YEARBCA
1
GUERNSEY
200
225
250
275
300
325
5,500
6,000
6,500
7,000
7,500
1997 1999 2001 2003 2005 2007 2009 2011 2013 2015
Fa
t / Pro
tein
(kg
) M
ilk
(k
g)
GUERNSEY Average Production Based on Official - Supervised Records in Canada
Milk Fat Protein
20

NO. MILK FAT FAT PROTEIN PROTEIN
RECORDS kg kg % kg % MILK FAT PROTEIN
2015 295,473 10,257 398 3.90 327 3.20 226 237 227
2014 287,223 10,102 389 3.87 321 3.19 223 232 223
2013 285,629 10,105 386 3.84 321 3.19 223 229 222
2012 288,712 9,979 378 3.80 317 3.19 219 224 219
2011 281,157 9,975 376 3.79 317 3.19 218 222 218
2010 276,544 9,970 371 3.75 315 3.18 217 218 216
2009 283,762 9,793 366 3.76 311 3.19 213 215 213
2008 274,687 9,835 366 3.74 313 3.20 214 215 215
2007 268,463 9,733 360 3.72 310 3.19 212 212 212
2006 264,903 9,677 357 3.71 307 3.18 211 209 210
2005 264,762 9,624 354 3.71 306 3.19 209 208 209
2004 271,036 9,658 352 3.67 307 3.19 210 206 210
2003 273,149 9,721 355 3.68 311 3.21 210 207 212
2002 271,531 9,717 354 3.67 312 3.22 210 206 212
2001 254,014 9,440 348 3.68 304 3.22 204 202 207
2000 253,561 9,350 343 3.67 300 3.21 202 199 204
1999 263,502 9,162 335 3.66 295 3.22 197 194 200
1998 270,009 8,946 327 3.65 288 3.22 193 190 196
1997 273,426 8,697 320 3.68 280 3.22 186 186 190
1 BCA - Breed Class Average
Source: Agriculture and Agri-Food Canada
Calculations done by AAFC-AID, Market Information Section
AVERAGE PRODUCTION BASED ON OFFICIAL - SUPERVISED RECORDS IN CANADA
YEARBCA
1
HOLSTEIN
250
275
300
325
350
375
400
7,500
8,000
8,500
9,000
9,500
10,000
10,500
1997 1999 2001 2003 2005 2007 2009 2011 2013 2015
Fa
t / Pro
tein
(kg
) M
ilk
(k
g)
HOLSTEIN Average Production Based on Official - Supervised Records in Canada
Milk Fat Protein
21

NO. MILK FAT FAT PROTEIN PROTEIN
RECORDS kg kg % kg % MILK FAT PROTEIN
2015 11,754 6,699 334 5.02 253 3.80 224 207 224
2014 11,334 6,610 329 5.00 250 3.80 221 204 221
2013 10,653 6,659 328 4.95 252 3.79 223 203 222
2012 10,726 6,607 323 4.91 250 3.79 220 199 220
2011 10,339 6,572 321 4.91 249 3.80 219 198 218
2010 9,884 6,559 317 4.86 248 3.80 218 195 217
2009 9,874 6,371 309 4.87 242 3.81 211 188 211
2008 9,302 6,435 309 4.84 244 3.81 214 190 214
2007 8,967 6,412 307 4.82 241 3.78 214 190 213
2006 8,809 6,331 304 4.83 238 3.77 211 187 209
2005 8,927 6,279 303 4.85 236 3.77 210 187 208
2004 8,804 6,291 303 4.85 236 3.77 210 188 208
2003 8,783 6,344 307 4.87 241 3.81 210 189 211
2002 9,036 6,407 310 4.86 245 3.84 212 190 213
2001 8,198 6,186 301 4.87 237 3.83 204 183 206
2000 8,208 6,203 304 4.90 238 3.83 203 183 204
1999 8,852 6,072 297 4.89 234 3.85 198 179 201
1998 9,773 6,002 293 4.88 231 3.84 198 178 201
1997 10,081 5,753 282 4.90 222 3.86 190 172 196
1 BCA - Breed Class Average
Source: Agriculture and Agri-Food Canada
Calculations done by AAFC-AID, Market Information Section
AVERAGE PRODUCTION BASED ON OFFICIAL - SUPERVISED RECORDS IN CANADA
YEARBCA
1
JERSEY
200
225
250
275
300
325
350
5,000
5,500
6,000
6,500
7,000
1997 1999 2001 2003 2005 2007 2009 2011 2013 2015
Fa
t / Pro
tein
(kg
) M
ilk
(k
g)
JERSEY Average Production Based on Official - Supervised Records in Canada
Milk Fat Protein
22

NO. MILK FAT FAT PROTEIN PROTEIN
RECORDS kg kg % kg % MILK FAT PROTEIN
2015 332 6,886 271 3.94 225 3.28 251 245 251
2014 347 6,806 268 3.94 222 3.28 247 242 248
2013 370 6,931 264 3.81 228 3.31 250 237 253
2012 333 7,061 263 3.73 231 3.28 252 234 254
2011 325 6,854 251 3.68 224 3.28 248 226 249
2010 350 6,827 250 3.67 225 3.31 247 225 250
2009 325 6,566 237 3.63 216 3.30 232 209 234
2008 297 6,656 240 3.62 220 3.32 238 214 242
2007 272 6,558 238 3.65 216 3.31 236 213 239
2006 230 6,552 238 3.65 214 3.29 236 213 236
2005 217 6,516 240 3.70 214 3.30 234 214 236
2004 217 6,595 242 3.69 213 3.25 240 218 238
2003 217 6,713 248 3.71 219 3.28 241 221 241
2002 259 6,844 248 3.65 224 3.29 242 219 244
2001 255 6,906 259 3.75 228 3.30 244 227 247
2000 219 6,566 242 3.68 217 3.30 235 214 238
1999 271 6,538 237 3.62 217 3.32 236 211 239
1998 282 6,150 225 3.66 206 3.34 221 201 228
1997 269 6,018 218 3.62 202 3.36 216 195 223
1 BCA - Breed Class Average
Source: Agriculture and Agri-Food Canada
Calculations done by AAFC-AID, Market Information Section
AVERAGE PRODUCTION BASED ON OFFICIAL - SUPERVISED RECORDS IN CANADA
YEARBCA
1
MILKING SHORTHORN
160
185
210
235
260
285
310
5,000
5,500
6,000
6,500
7,000
7,500
1997 1999 2001 2003 2005 2007 2009 2011 2013 2015
Fa
t / Pro
tein
(kg
) M
ilk
(k
g)
MILKING SHORTHORN Average Production Based on Official - Supervised Records in Canada
Milk Fat Protein
23

MILK SHIPMENTS
24

East West CANADA
Fluid Class 1 63,365,666 31,859,618 95,225,284
Class 2 18,775,711 6,761,476 25,537,187
Class 3 93,464,701 21,697,645 115,162,346
Class 4 45,825,768 13,831,637 59,657,405
Class 5 27,458,256 3,802,090 31,260,346
248,890,102 77,952,466 326,842,568
East West CANADA
Fluid Class 1 64,585,908 29,724,130 94,310,038
Class 2 15,667,400 2,070,841 17,738,241
Class 3 70,210,987 18,760,034 88,971,021
Class 4 29,722,160 11,462,018 41,184,178
Class 5 23,099,871 3,258,333 26,358,204
203,286,326 65,275,356 268,561,682
East West CANADA
Fluid Class 1 110,780,269 51,330,632 162,110,901
Class 2 26,590,898 3,660,717 30,251,615
Class 3 119,557,140 32,410,215 151,967,355
Class 4 50,934,044 19,761,388 70,695,432
Class 5 39,818,160 5,630,673 45,448,833
347,680,511 112,793,625 460,474,136
East West CANADA
17,601,574 8,849,894 26,451,46851,534,565 12,803,569 64,338,13469,136,139 21,653,463 90,789,602
East West CANADA
19,120,162 8,913,369 28,033,531
41,520,611 10,759,454 52,280,065
60,640,773 19,672,823 80,313,595
West : MB, SK, AB, BC
TotalIndustrial
Fluid
Total
Industrial
Total
Hectolitres (actual)
TotalIndustrial
Fluid
Industrial
Industrial
Calculations done by AAFC-AID, Market Information Section
East: NL, PE, NS, NB, QC, ON
Standard [email protected] kg B.F.
Source: Provincial Milk Boards and Agencies
Protein (kg)
Total
Other Solids (kg)
Butterfat (kg)
DAIRY YEAR 2014/2015
MILK COMPONENT UTILIZATION AND VOLUMES
25

HA
RM
ON
IZE
D M
ILK
CL
AS
SIF
ICA
TIO
N S
YS
TE
M
Cla
ss
Pro
du
cts
1(a)
M
ilk a
nd m
ilk b
ever
ages
, par
tly s
kim
med
or s
kim
med
, whe
ther
or n
ot tr
eate
d fo
r lac
tose
into
lera
nce,
whe
ther
flav
oure
d or
not
, with
or w
ithou
t vita
min
s or
min
eral
s ad
ded,
for
reta
il an
d fo
od s
ervi
ce (e
ggno
g, c
ordi
als,
cul
ture
d m
ilk, c
once
ntra
ted
milk
to b
e re
cons
titut
ed a
s flu
id m
ilk).
1(b
) A
ll ty
pes
of c
ream
with
a b
utte
rfat c
onte
nt n
ot le
ss th
an 5
% fo
r ret
ail a
nd fo
od s
ervi
ce.
1(b
)ii
Fres
h cr
eam
with
a b
utte
rfat c
onte
nt o
f 32%
and
hig
her u
sed
to m
ake
fresh
bak
ed g
oods
whi
ch a
re n
ot e
ligib
le fo
r a C
lass
5 p
erm
it. A
ny u
tiliz
atio
n of
this
cla
ss w
ould
re
quire
a C
lass
1(b
) per
mit.
1(c)
N
ew 1
(a) a
nd 1
(b) f
luid
pro
duct
s fo
r ret
ail a
nd fo
od s
ervi
ce a
s ap
prov
ed b
y th
e pr
ovin
cial
aut
horit
ies
durin
g an
intro
duct
ory
perio
d.
1(d
) 1(
a) a
nd 1
(b) f
luid
pro
duct
s m
arke
ted
outs
ide
the
ten
sign
ator
y pr
ovin
ces
but w
ithin
Can
adia
n bo
unda
ries
(e.g
. Yuk
on, N
WT,
Nun
avut
and
cru
ise
ship
s).
2(a)
A
ll ty
pes
of y
ogur
ts in
clud
ing
yogu
rt be
vera
ges,
Kef
ir an
d La
ssi,
excl
udin
g fro
zen
yogu
rts
2(b
) A
ll ty
pes
of ic
e cr
eam
and
ice
crea
m m
ix, w
heth
er fr
ozen
or n
ot, o
ther
froz
en d
airy
pro
duct
s in
clud
ing
froze
n yo
gurts
, all
type
s of
sou
r cre
am, a
ll ty
pes
of m
ilk s
hake
mix
es,
and
the
follo
win
g pr
oduc
ts: f
udge
, pud
ding
s, s
oup
mix
es, c
affe
inat
e an
d In
dian
sw
eets
.
3(a)
A
ll ch
eese
s ot
her t
han
thos
e id
entif
ied
in c
lass
3(b
) and
3(c
)
3(b
) A
ll ty
pes
of c
hedd
ar c
hees
e, s
tirre
d cu
rd, c
ream
che
ese,
cre
amy
chee
se b
ases
(che
ese
mix
es),
ched
dar,
and
ched
dar-
type
che
eses
sol
d fre
sh.
3(c)
A
ll ty
pes
of M
ozza
rella
, Asi
ago,
Bric
k, C
anad
ian
Styl
e M
unst
er (M
uens
ter),
Col
by, F
arm
er, F
eta,
Gou
da, H
avar
ti, J
ack,
Mon
tere
y Ja
ck, P
arm
esan
, Sw
iss
3(d
) S
tand
ardi
zed
Moz
zare
lla c
hees
es to
be
used
stri
ctly
on
fresh
piz
zas
by e
stab
lishm
ents
regi
ster
ed w
ith th
e C
DC
und
er te
rms
and
cond
ition
s ap
prov
ed b
y th
e C
MS
MC
.
4(a)
A
ll ty
pes
of b
utte
r and
but
tero
il, a
ll ty
pes
of p
owde
r, co
ncen
trate
d m
ilk a
s an
ingr
edie
nt in
the
food
indu
stry
, all
othe
r pro
duct
s no
t els
ewhe
re s
tate
d.
4(a)
1
Milk
com
pone
nts
for t
he m
anuf
actu
re o
f ren
net c
asei
n (d
ry o
r cur
d) o
r milk
pro
tein
con
cent
rate
(dry
or l
iqui
d) o
r ski
m m
ilk (d
ry o
r liq
uid)
to b
e us
ed in
the
man
ufac
ture
of
non-
stan
dard
ized
fina
l pro
duct
s in
the
proc
esse
d ch
eese
cat
egor
y.
4(b
) C
once
ntra
ted
milk
for r
etai
l sal
e w
heth
er s
wee
tene
d or
not
.
4(c)
N
ew in
dust
rial p
rodu
cts
as a
ppro
ved
by p
rovi
ncia
l aut
horit
ies
for a
n in
trodu
ctor
y pe
riod.
4(d
) In
vent
orie
s an
d lo
sses
4(m
) M
ilk c
ompo
nent
s fo
r mar
gina
l mar
kets
as
esta
blis
hed
from
tim
e to
tim
e by
the
CM
SM
C.
5(a)
C
hees
e us
ed a
s in
gred
ient
s fo
r fur
ther
pro
cess
ing
for t
he d
omes
tic a
nd e
xpor
t mar
kets
.
5(b
) A
ll ot
her d
airy
pro
duct
s us
ed a
s in
gred
ient
s fo
r fur
ther
pro
cess
ing
for t
he d
omes
tic a
nd e
xpor
t mar
kets
.
5(c)
D
airy
pro
duct
s us
ed a
s in
gred
ient
s fo
r the
con
fect
ione
ry s
ecto
r des
tined
for d
omes
tic a
nd e
xpor
t mar
kets
.
5(d
) P
lann
ed e
xpor
ts a
nd o
ther
exp
orts
app
rove
d by
the
CM
SM
C, t
he to
tal o
f whi
ch s
hall
not e
xcee
d C
anad
a’s
WTO
com
mitm
ents
.
Not
e: T
his
tabl
e is
for i
nfor
mat
ion
purp
oses
onl
y. T
he re
ader
sho
uld
refe
r to
the
offic
ial H
arm
oniz
ed M
ilk C
lass
ifica
tion
Sys
tem
on
the
Can
adia
n D
airy
Com
mis
sion
web
site
http
://w
ww
.cdc
-cc
l.gc.
ca/C
DC
/inde
x-en
g.ph
p?id
=381
1 fo
r com
preh
ensi
ve in
terp
reta
tion
and
defin
ition
of m
ilk c
lass
es.
26

2014
/15
271,
147
26
67,5
77
6
9,
349
2
267,
396
74
412,
349
10
9
5,59
8
1
1,
033,
416
21
8
2013
/14
245,
888
20
59,3
94
7
15
,174
3
260,
534
75
386,
666
10
8
6,64
7
2
97
4,30
2
21
5
2012
/13
204,
640
17
81,4
57
7
16
,807
4
263,
652
77
376,
743
10
2
7,18
7
2
95
0,48
6
20
9
2011
/12
195,
945
17
95,7
83
10
18,0
01
4
26
6,06
8
79
35
7,36
5
107
3,
976
2
937,
137
219
2010
/11
192,
922
14
86,0
19
10
20,0
31
5
25
4,55
4
77
33
9,41
8
98
4,
500
1
897,
445
205
2009
/10
183,
892
15
75,3
36
9
18
,348
4
255,
768
78
336,
482
10
0
....
869,
826
206
2008
/09
159,
057
15
10,9
28
3
12
,062
4
243,
415
75
308,
540
10
1
....
734,
002
198
2007
/08
116,
045
14
4,15
6
2
2,
099
1
203,
045
67
303,
842
90
....
629,
187
174
2006
/07
93,5
38
14
3,61
5
2
-
-
14
5,22
4
51
25
5,74
2
80
..
..49
8,11
9
14
7
2005
/06
81,1
64
11
2,79
1
2
-
-
11
6,00
0
44
21
1,29
5
68
..
..41
1,25
1
12
5
2004
/05
63,3
92
5
2,
594
2
-
-
103,
000
42
186,
435
63
....
355,
421
112
2003
/04
39,5
80
3
1,
560
2
-
-
98,9
38
43
164,
136
50
....
304,
213
98
2002
/03
31,9
89
3
86
9
1
-
-
96,0
00
43
143,
351
47
....
272,
209
94
2001
/02
15,7
49
2
-
-
-
-
95
,372
41
10
5,50
8
41
..
..21
6,62
8
84
2000
/01
7,98
4
2
-
-
-
-
45
,000
37
54
,315
26
..
..10
7,29
9
65
Not
e: A
mou
nts
for o
ther
pro
vinc
es -
nil o
r min
ute
.. N
ot a
vaila
ble
- N
il1 E
stim
ate
Cal
cula
tions
don
e by
AA
FC-A
ID, M
arke
t Inf
orm
atio
n S
ectio
n
Pro
du
ctio
n o
f C
erti
fied
Org
anic
Mil
k an
d N
um
ber
of
Pro
du
cers
(fa
rms)
Ye
ar
BC
AB
MB
hl1
Pro
du
cers
ON
QC
Ca
na
da
Sou
rce:
B.C
. Milk
Mar
ketin
g B
oard
, Dai
ry F
arm
ers
of M
anito
ba, D
airy
Far
mer
s of
Ont
ario
, Féd
érat
ion
des
prod
ucte
urs
de la
it du
Qué
bec,
Alb
erta
Milk
and
the
Nov
a S
cotia
Agr
icul
tura
l Col
lege
hl
Pro
du
cers
hl
Pro
du
cers
hl
Pro
du
cers
hl
NS
Pro
du
cers
hl
Pro
du
cers
hl
Pro
du
cers
050100
150
200
250
0200,
000
400,
000
600,
000
800,
000
1,00
0,00
0
1,20
0,00
0
2014
/15
2013
/14
2012
/13
2011
/12
2010
/11
2009
/10
2008
/09
2007
/08
2006
/07
2005
/06
2004
/05
2003
/04
2002
/03
2001
/02
2000
/01
Producers Hectolitres
CAN
ADA
Prod
uctio
n of
Cer
tifie
d O
rgan
ic M
ilk a
nd N
umbe
r of P
rodu
cers
Prod
uctio
n of
cer
tifie
d or
gani
c m
ilk in
hec
tolit
res
Num
ber o
f pro
duce
rs (f
arm
s)
27

THE PROCESSING SECTOR
28

FL
UID
MIL
K S
AL
ES
Ye
ar
3.2
5%
2%
1%
Sk
imB
utt
erm
ilk
Ch
oc
ola
te a
nd
oth
er
fla
vo
ure
d m
ilk
Eg
gn
og
To
tal
Sa
les
20
14
/20
15
36
3,8
16
1,2
34
,01
25
16
,89
32
11
,86
51
2,0
31
21
7,8
12
8,5
81
2,5
65
,01
0
20
13
/20
14
35
8,6
16
1,2
54
,32
45
51
,02
82
43
,58
11
2,3
09
21
7,0
10
8,4
35
2,6
45
,30
3
20
12
/20
13
36
3,0
86
1,2
58
,28
45
80
,64
22
62
,02
31
2,8
90
19
6,1
83
9,6
04
2,6
82
,71
2
20
11
/20
12
35
2,7
22
1,2
12
,42
25
85
,75
72
77
,28
11
1,3
51
20
5,7
52
9,1
42
2,6
54
,42
7
20
10
/20
11
36
3,6
70
1,2
29
,59
06
04
,29
32
85
,33
01
1,7
69
20
1,5
76
9,8
35
2,7
06
,06
3
20
09
/20
10
36
7,3
00
1,2
33
,10
65
93
,80
52
85
,07
51
1,9
59
19
5,5
45
9,3
96
2,6
96
,18
6
20
15
36
1,2
40
1,2
34
,82
95
01
,63
21
99
,90
91
1,6
71
22
3,3
31
8,5
50
2,5
41
,16
2
20
14
36
1,0
55
1,2
49
,29
45
37
,48
52
32
,71
61
2,2
28
21
2,8
58
8,5
61
2,6
14
,19
7
20
13
36
0,1
04
1,2
50
,96
85
67
,38
42
54
,16
71
2,9
67
20
4,0
15
8,3
80
2,6
57
,98
5
20
12
35
7,1
36
1,2
30
,69
35
86
,95
52
73
,30
11
1,7
23
20
3,6
05
9,5
62
2,6
72
,97
5
20
11
35
9,0
57
1,2
25
,38
45
96
,38
42
81
,80
81
1,5
87
20
4,0
39
9,2
03
2,6
87
,46
2
20
10
35
9,6
81
1,2
15
,33
75
91
,87
92
83
,17
51
1,3
08
19
6,9
64
9,7
57
2,6
68
,10
1
1 N
ew
foundla
nd a
nd L
abra
dor
not in
clu
ded
Sourc
e: S
tatistics C
anada
Calc
ula
tions d
one b
y A
AF
C-A
ID, M
ark
et In
form
ation S
ection
'0
00
litr
es
CA
NA
DA
1
DA
IRY
YE
AR
CA
LE
ND
AR
YE
AR
0
300,0
00
600,0
00
900,0
00
1,2
00,0
00
1,5
00
,00
0
2006
2007
2008
2009
2010
2011
2012
2013
2014
2015
'000 litres
CA
NA
DA
1
Flu
id M
ilk
Sale
s
3.2
5%
2%
1%
Skim
29

FL
UID
MIL
K S
AL
ES
Ye
ar
3.2
5%
2%
1%
Sk
imB
utt
erm
ilk
Ch
oc
ola
te a
nd
oth
er
fla
vo
ure
d m
ilk
Eg
gn
og
To
tal
Sa
les
20
14
/20
15
59
,90
1
13
0,1
64
64
,95
7
34
,16
8
1,5
69
12
,79
0
..3
03
,54
9
20
13
/20
14
49
,43
5
12
6,9
25
69
,00
5
39
,83
9
1,8
09
10
,76
7
..2
97
,78
0
20
12
/20
13
46
,99
3
12
4,4
69
73
,41
6
43
,65
9
1,7
86
11
,12
4
..3
01
,44
7
20
11
/20
12
47
,34
0
12
7,6
33
78
,09
1
47
,91
3
1,8
73
10
,91
2
..3
13
,76
2
20
10
/20
11
50
,95
9
13
2,4
09
82
,33
6
51
,15
3
2,3
46
11
,44
4
..3
30
,64
7
20
09
/20
10
53
,36
5
13
4,6
17
85
,39
7
53
,93
2
3,1
55
10
,49
8
..3
40
,96
4
20
15
62
,85
7
13
2,8
32
64
,03
5
32
,76
0
1,3
76
13
,59
5
..3
07
,45
5
20
14
50
,62
8
12
9,3
93
67
,88
6
37
,92
0
1,7
39
11
,10
2
..2
98
,66
8
20
13
47
,83
8
12
5,0
69
71
,43
8
42
,13
5
1,7
93
10
,95
0
..2
99
,22
3
20
12
46
,99
4
12
6,0
67
76
,44
6
46
,30
0
1,8
55
11
,03
1
..3
08
,69
3
20
11
48
,83
8
13
0,0
62
80
,06
2
49
,79
3
1,9
28
11
,31
2
..3
21
,99
5
20
10
52
,71
9
13
4,2
73
84
,79
8
53
,04
3
2,9
97
11
,18
5
..3
39
,01
5
20
14
/20
15
50
,10
8
14
2,4
91
74
,93
5
31
,90
1
3,3
54
29
,55
6
..3
32
,34
5
20
13
/20
14
47
,92
5
14
0,2
20
79
,81
3
36
,74
6
3,4
53
31
,51
3
..3
39
,67
0
20
12
/20
13
45
,23
9
13
7,6
75
82
,35
6
40
,45
3
3,4
95
30
,92
1
..3
40
,13
9
20
11
/20
12
44
,20
4
13
5,0
79
85
,13
1
43
,44
4
3,5
43
30
,13
8
..3
41
,53
9
20
10
/20
11
43
,10
5
13
1,5
80
86
,12
1
43
,70
0
3,1
58
27
,58
0
..3
35
,24
4
20
09
/20
10
42
,87
8
12
8,8
59
85
,97
7
44
,39
2
2,2
17
26
,30
4
..3
30
,62
7
20
15
51
,54
3
14
3,4
30
72
,82
9
30
,00
2
3,3
72
28
,57
1
..3
29
,74
7
20
14
48
,64
9
14
1,7
78
78
,10
7
34
,72
1
3,4
12
31
,37
2
..3
38
,03
9
20
13
46
,55
0
13
8,6
50
81
,09
8
39
,16
3
3,5
19
31
,50
6
..3
40
,48
6
20
12
44
,49
0
13
6,7
10
84
,07
4
42
,45
6
3,5
68
31
,00
9
..3
42
,30
7
20
11
43
,70
7
13
2,4
79
85
,97
5
43
,79
0
3,4
57
28
,53
8
..3
37
,94
6
20
10
42
,60
9
13
0,6
68
86
,57
0
44
,11
9
2,4
46
26
,59
4
..3
33
,00
6
.. N
ot A
vaila
ble
Sourc
e: S
tatistics C
anada
Calc
ula
tions d
one b
y A
AF
C-A
ID, M
ark
et In
form
ation S
ection
DA
IRY
YE
AR
CA
LE
ND
AR
YE
AR
'0
00
litr
es
BR
ITIS
H C
OL
UM
BIA
DA
IRY
YE
AR
CA
LE
ND
AR
YE
AR
AL
BE
RT
A
30

FL
UID
MIL
K S
AL
ES
Year
3.2
5%
2%
1%
Skim
Bu
tterm
ilk
Ch
oco
late
an
d o
ther
flav
ou
red
milk
Eg
gn
og
To
tal S
ale
s
20
14
/20
15
11
,97
84
6,2
95
26
,17
91
1,1
76
....
..9
5,6
28
20
13
/20
14
11
,64
64
5,8
00
27
,84
91
2,5
82
....
..9
7,8
77
20
12
/20
13
11
,84
64
5,9
59
30
,30
31
4,2
06
....
..1
02
,31
4
20
11
/20
12
10
,50
63
9,4
36
26
,51
71
3,9
37
....
..9
0,3
96
20
10
/20
11
10
,08
33
7,8
32
33
,51
01
3,2
03
....
..9
4,6
28
20
09
/20
10
9,2
01
33
,22
32
5,4
39
11
,74
9..
....
79
,61
2
20
15
12
,90
74
7,2
18
27
,01
01
1,2
10
....
..9
8,3
45
20
14
11
,51
14
5,0
99
26
,51
81
1,6
76
....
..9
4,8
04
20
13
11
,96
84
7,2
10
29
,92
01
3,9
80
....
..1
03
,07
8
20
12
11
,03
44
1,4
07
27
,94
11
3,4
69
....
..9
3,8
51
20
11
10
,47
93
8,7
40
27
,76
31
4,2
75
....
..9
1,2
57
20
10
9,4
61
35
,61
23
1,3
92
12
,39
2..
....
88
,85
7
20
14
/20
15
10
7,3
92
52
4,1
96
20
0,1
10
84
,19
64
,42
79
1,4
04
..1
,01
1,7
25
20
13
/20
14
11
5,9
98
54
3,8
60
21
9,6
87
98
,38
84
,71
29
9,5
74
..1
,08
2,2
19
20
12
/20
13
11
9,3
40
51
4,7
53
22
4,6
95
99
,45
45
,04
97
8,6
62
..1
,04
1,9
53
20
11
/20
12
11
9,7
59
49
2,4
87
23
2,8
40
10
7,4
52
3,6
27
91
,18
9..
1,0
47
,35
4
20
10
/20
11
12
3,0
59
50
1,7
08
23
7,3
19
11
2,5
05
4,1
58
94
,11
4..
1,0
72
,86
3
20
09
/20
10
12
4,1
48
50
4,6
72
22
9,4
52
10
9,0
57
4,6
85
90
,66
4..
1,0
62
,67
8
20
15
10
0,0
88
51
1,8
62
18
7,8
71
78
,00
94
,34
09
4,5
82
..9
76
,75
2
20
14
11
6,5
43
54
4,2
44
21
3,6
27
95
,13
04
,54
99
3,2
65
..1
,06
7,3
58
20
13
11
6,6
58
52
4,5
78
22
1,7
98
98
,25
35
,19
68
6,2
39
..1
,05
2,7
22
20
12
12
0,6
14
49
9,7
57
23
0,9
93
10
5,2
15
3,9
49
86
,21
4..
1,0
46
,74
2
20
11
12
1,1
54
50
1,9
13
23
9,0
83
10
9,5
72
3,9
58
95
,54
3..
1,0
71
,22
3
20
10
11
7,1
68
48
1,7
76
22
1,3
57
10
8,0
37
3,9
16
90
,39
1..
1,0
22
,64
5
.. N
ot
Availa
ble
Sourc
e:
Sta
tistics C
anada
Calc
ula
tio
ns d
one b
y A
AF
C-A
ID,
Mark
et
Info
rmatio
n S
ectio
n
DA
IRY
YE
AR
CA
LE
ND
AR
YE
AR
'0
00
li
tres
MA
NIT
OB
A
DA
IRY
YE
AR
CA
LE
ND
AR
YE
AR
ON
TA
RIO
31

FL
UID
MIL
K S
AL
ES
Year
3.2
5%
2%
1%
Skim
Bu
tterm
ilk
Ch
oco
late
an
d o
ther
flavo
ure
d m
ilk
Eg
gn
og
To
tal S
ale
s
2014/2
015
105,6
36
300,4
13
94,5
55
27,4
52
x44,0
90
..572,1
46
2013/2
014
105,8
34
311,4
60
96,4
12
30,5
37
x35,4
13
..579,6
56
2012/2
013
111,8
52
346,2
70
108,2
80
35,9
26
x38,8
20
..641,1
48
2011/2
012
103,4
61
326,5
45
98,4
13
32,8
86
x34,2
54
..595,5
59
2010/2
011
108,1
02
333,2
59
100,0
29
32,9
34
x30,1
01
..604,4
25
2009/2
010
108,8
72
337,3
21
101,2
51
33,5
63
x31,6
11
..612,6
18
2015
105,1
06
310,3
94
95,6
56
26,4
03
x46,4
18
..583,9
77
2014
105,7
47
302,1
71
94,0
85
28,8
47
x37,5
57
..568,4
07
2013
109,2
67
326,9
96
103,0
16
33,3
95
x37,2
79
..609,9
53
2012
106,4
04
335,5
97
103,3
16
35,0
16
x36,9
43
..617,2
76
2011
107,0
19
331,1
23
99,1
33
32,9
32
x30,6
51
..600,8
58
2010
108,8
80
338,3
83
101,4
22
33,2
65
x30,7
77
..612,7
27
2014/2
015
28,8
05
90,4
52
56,1
52
22,9
75
..39,9
76
..238,3
60
2013/2
014
27,7
77
86,0
56
58,2
56
25,4
89
..39,7
43
..237,3
21
2012/2
013
27,8
15
89,1
60
61,5
93
28,3
24
..36,6
59
..243,5
51
2011/2
012
27,4
53
91,2
46
64,7
64
31,6
45
..39,2
58
..254,3
66
2010/2
011
28,3
61
92,8
00
64,9
76
31,8
34
889
38,3
40
..257,2
00
2009/2
010
28,8
36
94,4
15
66,2
89
32,3
83
1,9
04
36,4
68
..260,2
95
2015
28,7
44
89,0
89
54,2
26
21,5
29
..40,1
67
..233,7
55
2014
27,9
76
86,6
10
57,2
56
24,4
21
..39,5
65
..235,8
28
2013
27,8
22
88,4
62
60,1
13
27,2
43
..38,0
44
..241,6
84
2012
27,6
00
91,1
58
64,1
84
30,8
42
..38,4
07
..252,1
91
2011
27,8
62
91,0
68
64,3
66
31,4
42
..37,9
97
..252,7
35
2010
28,8
44
94,6
24
66,3
40
32,3
18
1,9
51
38,0
18
..262,0
95
x
Co
nfid
en
tia
l
.. N
ot
Ava
ilab
le
1
Inclu
de
s S
K,
NB
, P
E,
NS
as w
ell
as n
on
-ava
ilab
le d
ata
re
po
rte
d b
y p
rovin
ce
s (
with
th
e e
xce
ptio
n o
f co
nfid
en
tia
l d
ata
)
So
urc
e:
Sta
tistics C
an
ad
a
Ca
lcu
latio
ns d
on
e b
y A
AF
C-A
ID,
Ma
rke
t In
form
atio
n S
ectio
n
DA
IRY
YE
AR
CA
LE
ND
AR
YE
AR
'000 litr
es
QU
EB
EC
DA
IRY
YE
AR
CA
LE
ND
AR
YE
AR
OT
HE
RS
1
32
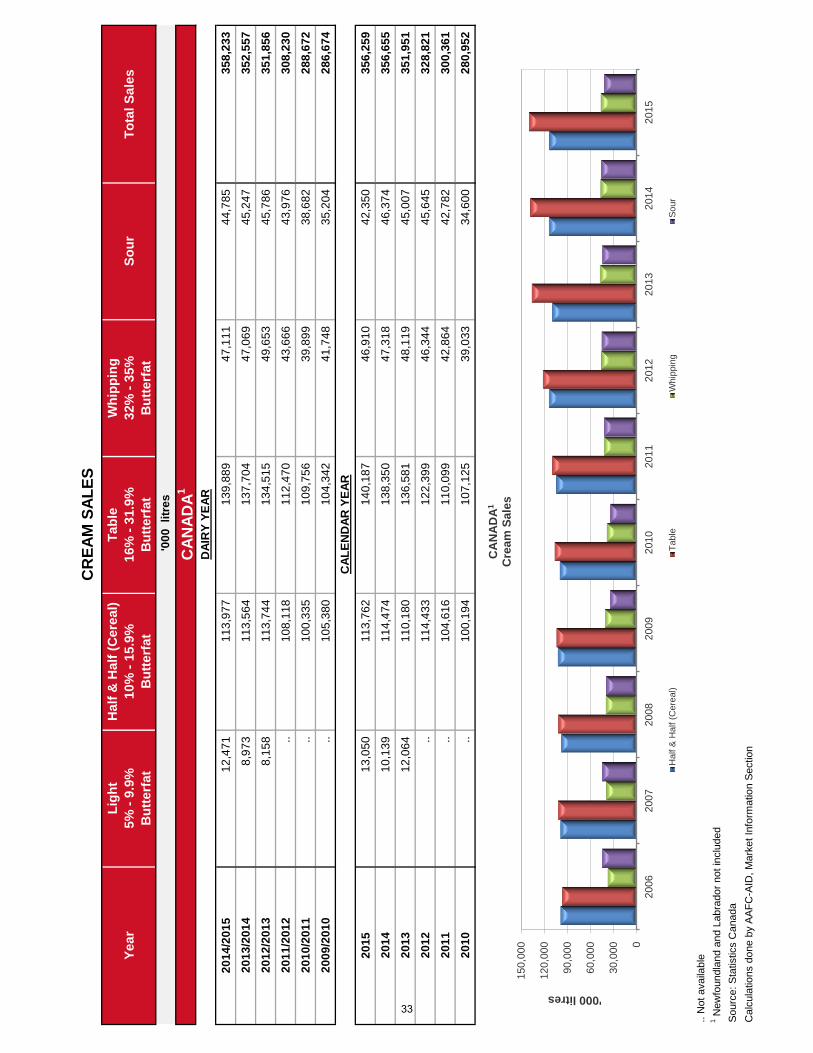
CR
EA
M S
AL
ES
Ye
ar
Lig
ht
5%
- 9
.9%
Bu
tte
rfa
t
Ha
lf &
Ha
lf (
Ce
rea
l)
10
% -
15
.9%
Bu
tte
rfa
t
Ta
ble
16
% -
31
.9%
Bu
tte
rfa
t
Wh
ipp
ing
32
% -
35
%
Bu
tte
rfa
t
So
ur
To
tal
Sa
les
20
14
/20
15
12
,47
1
11
3,9
77
13
9,8
89
47
,11
1
44
,78
5
35
8,2
33
20
13
/20
14
8,9
73
11
3,5
64
13
7,7
04
47
,06
9
45
,24
7
35
2,5
57
20
12
/20
13
8,1
58
11
3,7
44
13
4,5
15
49
,65
3
45
,78
6
35
1,8
56
20
11
/20
12
..1
08
,11
8
11
2,4
70
43
,66
6
43
,97
6
30
8,2
30
20
10
/20
11
..1
00
,33
5
10
9,7
56
39
,89
9
38
,68
2
28
8,6
72
20
09
/20
10
..1
05
,38
0
10
4,3
42
41
,74
8
35
,20
4
28
6,6
74
20
15
13
,05
0
11
3,7
62
14
0,1
87
46
,91
0
42
,35
0
35
6,2
59
20
14
10
,13
9
11
4,4
74
13
8,3
50
47
,31
8
46
,37
4
35
6,6
55
20
13
12
,06
4
11
0,1
80
13
6,5
81
48
,11
9
45
,00
7
35
1,9
51
20
12
..1
14
,43
3
12
2,3
99
46
,34
4
45
,64
5
32
8,8
21
20
11
..1
04
,61
6
11
0,0
99
42
,86
4
42
,78
2
30
0,3
61
20
10
..1
00
,19
4
10
7,1
25
39
,03
3
34
,60
0
28
0,9
52
.. N
ot availa
ble
1 N
ew
foundla
nd a
nd L
abra
dor
not in
clu
ded
Sourc
e: S
tatistics C
anada
Calc
ula
tions d
one b
y A
AF
C-A
ID, M
ark
et In
form
ation S
ection
'0
00
litr
es
CA
NA
DA
1
DA
IRY
YE
AR
CA
LE
ND
AR
YE
AR
0
30,0
00
60,0
00
90,0
00
120,0
00
150,0
00
2006
2007
2008
2009
2010
2011
2012
2013
2014
2015
'000 litres
CA
NA
DA
1
Cre
am
Sale
s
Half &
Half (
Cere
al)
Table
Whip
pin
gS
our
33

CR
EA
M S
AL
ES
Ye
ar
Lig
ht
5%
- 9
.9%
Bu
tte
rfa
t
Ha
lf &
Ha
lf (
Ce
rea
l)
10
% -
15
.9%
Bu
tte
rfa
t
Ta
ble
16
% -
31
.9%
Bu
tte
rfa
t
Wh
ipp
ing
32
% -
35
%
Bu
tte
rfa
t
So
ur
To
tal
Sa
les
20
14
/20
15
..1
7,4
07
..7
,73
9
2,0
56
27
,20
2
20
13
/20
14
..1
6,6
86
..8
,00
5
2,0
03
26
,69
4
20
12
/20
13
..1
5,8
55
..7
,82
2
2,0
59
25
,73
6
20
11
/20
12
..1
6,4
54
..7
,89
0
2,0
24
26
,36
8
20
10
/20
11
..1
6,6
44
..8
,05
2
1,9
56
26
,65
2
20
09
/20
10
..1
6,6
30
..7
,81
9
3,0
36
27
,48
5
20
15
..1
7,6
20
..8
,53
4
2,0
78
28
,23
2
20
14
..1
7,0
58
..7
,51
0
2,0
11
26
,57
9
20
13
..1
6,1
02
..7
,85
6
2,0
45
26
,00
3
20
12
..1
6,2
43
..7
,73
9
2,0
56
26
,03
8
20
11
..1
6,5
35
..8
,20
3
1,9
68
26
,70
6
20
10
..1
6,7
57
..7
,81
4
2,4
15
26
,98
6
20
14
/20
15
..1
2,5
96
..7
,49
6
8,3
17
28
,40
9
20
13
/20
14
..1
2,5
51
..7
,33
7
7,7
02
27
,59
0
20
12
/20
13
..1
2,0
52
..x
7,0
02
x
20
11
/20
12
..1
2,2
72
..x
7,0
88
x
20
10
/20
11
..1
1,9
59
..x
4,3
36
x
20
09
/20
10
..1
1,9
93
..x
91
5
x
20
15
..1
2,4
40
..7
,13
0
8,6
00
28
,17
0
20
14
..1
2,6
66
..7
,56
4
8,0
39
28
,26
9
20
13
..1
2,3
31
..x
7,3
64
x
20
12
..1
2,1
39
..x
6,8
91
x
20
11
..1
2,0
76
..x
7,0
53
x
20
10
..1
1,8
36
..x
85
5
x
.. N
ot A
vaila
ble
x C
onfidential
Sourc
e: S
tatistics C
anada
Calc
ula
tions d
one b
y A
AF
C-A
ID, M
ark
et In
form
ation S
ection
DA
IRY
YE
AR
CA
LE
ND
AR
YE
AR
'0
00
litr
es
BR
ITIS
H C
OL
UM
BIA
DA
IRY
YE
AR
CA
LE
ND
AR
YE
AR
AL
BE
RT
A
34

CR
EA
M S
AL
ES
Ye
ar
Lig
ht
5%
- 9
.9%
Bu
tte
rfa
t
Ha
lf &
Ha
lf (
Ce
rea
l)
10
% -
15
.9%
Bu
tte
rfa
t
Ta
ble
16
% -
31
.9%
Bu
tte
rfa
t
Wh
ipp
ing
32
% -
35
%
Bu
tte
rfa
t
So
ur
To
tal
Sa
les
20
14
/20
15
..3
,07
8
..1
,71
2
..4
,79
0
20
13
/20
14
..3
,16
6
..1
,57
0
..4
,73
6
20
12
/20
13
..3
,21
0
..x
..x
20
11
/20
12
..2
,66
2
..x
..x
20
10
/20
11
..2
,77
0
..x
..x
20
09
/20
10
..2
,60
7
..x
..x
20
15
..3
,13
4
..2
,11
8
..5
,25
2
20
14
..3
,08
7
..1
,54
5
..4
,63
2
20
13
..3
,24
3
..x
..x
20
12
..2
,85
0
..x
..x
20
11
..2
,80
6
..x
..x
20
10
..2
,62
6
..x
..x
20
14
/20
15
10
,81
3
49
,60
5
77
,05
6
16
,38
7
17
,70
8
17
1,5
69
20
13
/20
14
7,9
08
53
,58
5
78
,46
6
18
,11
8
18
,09
6
17
6,1
73
20
12
/20
13
7,3
59
53
,28
0
74
,87
8
19
,69
9
19
,01
2
17
4,2
28
20
11
/20
12
..4
7,0
16
56
,58
9
14
,12
6
17
,76
2
13
5,4
93
20
10
/20
11
..4
0,9
17
54
,92
2
10
,93
8
15
,56
8
12
2,3
45
20
09
/20
10
..4
7,7
39
51
,53
1
13
,58
9
15
,64
3
12
8,5
02
20
15
11
,57
5
50
,54
5
76
,81
6
15
,28
4
17
,57
2
17
1,7
92
20
14
8,7
63
52
,42
7
77
,84
0
17
,75
0
18
,05
5
17
4,8
35
20
13
10
,81
1
50
,07
0
76
,70
6
19
,26
5
18
,59
2
17
5,4
44
20
12
..5
2,7
40
64
,77
0
16
,09
0
18
,85
0
15
2,4
50
20
11
..4
3,6
01
55
,94
5
13
,40
4
16
,98
0
12
9,9
30
20
10
..4
2,5
47
51
,98
5
10
,61
6
15
,15
1
12
0,2
99
.. N
ot A
vaila
ble
x C
onfidential
E E
stim
ate
Sourc
e: S
tatistics C
anada
Calc
ula
tions d
one b
y A
AF
C-A
ID, M
ark
et In
form
ation S
ection
DA
IRY
YE
AR
CA
LE
ND
AR
YE
AR
'0
00
litr
es
MA
NIT
OB
A
DA
IRY
YE
AR
CA
LE
ND
AR
YE
AR
ON
TA
RIO
E E E E
E E
35

CR
EA
M S
AL
ES
Ye
ar
Lig
ht
5%
- 9
.9%
Bu
tte
rfa
t
Ha
lf &
Ha
lf (
Ce
rea
l)
10
% -
15
.9%
Bu
tte
rfa
t
Ta
ble
16
% -
31
.9%
Bu
tte
rfa
t
Wh
ipp
ing
32
% -
35
%
Bu
tte
rfa
t
So
ur
To
tal
Sa
les
20
14
/20
15
1,1
67
25
,48
7
11
,22
6
11
,09
1
4,7
71
53
,74
2
20
13
/20
14
90
1
22
,20
1
8,9
64
9,4
76
4,3
45
45
,88
7
20
12
/20
13
..2
4,2
32
11
,06
4
11
,01
3
5,1
58
51
,46
7
20
11
/20
12
..2
4,1
51
10
,00
5
11
,00
2
5,4
45
50
,60
3
20
10
/20
11
..2
2,8
70
11
,63
1
11
,06
6
5,2
54
50
,82
1
20
09
/20
10
..2
1,3
17
13
,58
7
10
,76
9
5,0
42
50
,71
5
20
15
1,0
35
24
,34
2
10
,77
2
11
,22
2
4,8
04
52
,17
5
20
14
1,1
71
23
,63
2
9,9
59
10
,24
8
4,6
52
49
,66
2
20
13
..2
3,4
88
10
,17
9
9,9
23
4,4
91
48
,08
1
20
12
..2
4,9
50
10
,79
6
11
,33
1
5,6
88
52
,76
5
20
11
..2
4,3
18
9,5
42
11
,18
4
5,1
75
50
,21
9
20
10
..2
1,2
91
14
,11
3
11
,01
5
5,1
05
51
,52
4
20
14
/20
15
2,9
96
5,8
06
51
,60
9
2,6
39
11
,93
2
74
,98
2
20
13
/20
14
1,8
85
5,3
74
50
,27
4
2,5
52
13
,10
0
73
,18
5
20
12
/20
13
..5
,11
5
48
,57
3
2,4
31
12
,55
7
68
,67
6
20
11
/20
12
..5
,56
5
45
,87
5
2,5
06
11
,64
9
65
,59
5
20
10
/20
11
..5
,17
4
43
,20
2
2,2
00
11
,56
5
62
,14
1
20
09
/20
10
..5
,09
2
39
,22
4
2,1
83
10
,56
6
57
,06
5
20
15
2,8
87
5,6
80
52
,59
9
2,6
22
9,2
98
73
,08
6
20
14
2,8
53
5,6
04
50
,55
2
2,6
42
13
,61
5
75
,26
6
20
13
..4
,94
5
49
,69
6
2,4
35
12
,51
7
69
,59
3
20
12
..5
,51
5
46
,83
2
2,6
15
12
,15
5
67
,11
7
20
11
..5
,28
0
44
,61
1
2,2
14
11
,60
1
63
,70
6
20
10
..5
,13
5
41
,02
7
2,1
98
11
,07
0
59
,43
0
1 In
clu
des S
K, N
B, P
E, N
S a
s w
ell
as n
on-a
vaila
ble
data
report
ed b
y p
rovin
ces (
with the e
xception o
f confidential data
)
.. N
ot availa
ble
E E
stim
ate
Sourc
e: S
tatistics C
anada
Calc
ula
tions d
one b
y A
AF
C-A
ID, M
ark
et In
form
ation S
ection
DA
IRY
YE
AR
CA
LE
ND
AR
YE
AR
'0
00
litr
es
QU
EB
EC
DA
IRY
YE
AR
CA
LE
ND
AR
YE
AR
OT
HE
RS
1
E E
36

PRODUCTION
CHEESE BY VARIETY
CANADA
Kilograms - '000
CHEDDAR 137,304 135,284 139,517 138,641 143,054 146,570
MOZZARELLA 115,129 115,249 115,639 114,859 116,131 128,587
CREAM 37,745 37,019 36,941 37,167 36,958 37,064
COTTAGE 26,019 25,644 26,063 25,195 24,094 21,363
SWISS & EMMENTAL 9,899 10,076 9,908 9,819 12,815 11,819
PARMESAN 6,669 8,964 10,550 9,030 9,049 9,799
RICOTTA 7,231 7,103 6,705 7,525 5,646 6,707
MONTEREY JACK 6,390 7,440 8,444 7,830 8,330 7,852
HAVARTI 2,627 4,301 7,695 6,536 9,866 7,382
FETA 3,372 4,729 6,135 5,830 4,604 7,035
GOUDA 3,967 4,575 4,634 4,450 3,258 4,822
BRICK 4,136 3,644 4,747 3,477 6,098 2,630
PROVOLONE 2,941 3,260 3,489 3,318 3,363 3,886
FRUILANO & CASATA 40 1,361 818 679 733 x
COLBY 503 398 525 337 569 x
OTHERS1 44,675 35,350 37,365 50,857 53,886 44,412
TOTAL 408,647 404,397 419,175 425,550 438,454 439,928
Kilograms - '000
SOFT CHEESE 73,745 70,292 75,058 75,376 67,714 73,033
SEMI-SOFT CHEESE 130,339 133,941 138,636 139,381 145,625 153,891
FIRM CHEESE 172,433 162,787 179,143 174,770 185,252 182,085
HARD CHEESE 7,016 9,540 10,926 9,397 9,848 10,835
BLUE-VEINED CHEESE 96 498 515 671 738 767
OTHERS1 25,019 27,338 14,898 25,954 29,278 19,318
TOTAL 408,647 404,397 419,175 425,550 438,454 439,928
1 Includes confidential data and cheeses not reported by category at the plant
x Confidential
E Estimate
Source: Statistics Canada
Calculations done by AAFC-AID, Market Information Section
2 Graphic excludes mozzarella, cheddar and cottage cheese
Varieties 2010 2011 2012 2013 2014 2015
Category 2010 2011 2012 2013 2014 2015
Cream 25.8%
Swiss-Emmental
8.2%
Parmesan 6.8%
Ricotta 4.7%
Monterey Jack 5.5%
Havarti 5.1%
Feta 4.9%
Gouda 3.4%
Brick 1.8%
Provolone 2.7%
Others 31.0%
Specialty Cheeses2
Soft Cheese 16.6%
Semi-soft Cheese 35.0%
Firm Cheese 41.4%
Hard Cheese 2.5%
Blue-veined Cheese
0.2%
Others 4.4%
Cheeses by category
1
1
2015 2015
E E
E
E
E
E E
E
37

PR
OD
UC
TIO
N
SP
EC
IAL
TY
CH
EE
SE
1
Yea
rO
NQ
CO
ther
sC
anad
a
Kil
og
ram
s -
'000
DA
IRY
YE
AR
20
14
/20
15
52,4
53
65
,983
26,6
34
1
45
,07
0
20
13
/20
14
52,7
51
78
,722
23,8
92
1
55
,36
5
20
12
/20
13
50,6
86
66
,721
23,5
35
1
40
,94
2
20
11
/20
12
51,9
68
56
,912
26,6
68
1
35
,54
8
20
10
/20
11
47,4
16
57
,428
23,9
68
1
28
,81
2
20
09
/20
10
45,2
21
57
,601
23,9
48
1
26
,77
0
CA
LE
ND
AR
YE
AR
20
15
57,1
60
60
,332
25,9
16
1
43
,40
8
20
14
50,0
75
79
,959
25,1
41
1
55
,17
5
20
13
52,2
93
70
,844
23,7
19
1
46
,85
5
20
12
51,4
10
59
,462
28,4
80
1
39
,35
2
20
11
51,6
36
54
,173
22,4
12
1
28
,22
0
20
10
44,6
97
60
,930
24,5
68
1
30
,19
5
1 Incl
udes
moz
zare
lla a
nd c
hees
e us
ed in
the
mak
ing
of p
roce
ssed
che
ese
(exc
lude
s ch
edda
r and
cot
tage
che
ese)
Sou
rce:
Sta
tistic
s C
anad
aC
alcu
latio
ns d
one
by A
AFC
-AID
, Mar
ket I
nfor
mat
ion
Sec
tion
91,
038
8
9,62
2
98,
883
9
8,92
6
102
,257
1
17,6
28
121
,652
1
23,6
51
130
,195
1
28,2
20
139
,352
1
46,8
55
155
,175
1
43,4
08
359
,351
439
,928
0100,
000
200,
000
300,
000
400,
000
500,
000
0
50,0
00
100,
000
150,
000
200,
000
250,
000
2002
2003
2004
2005
2006
2007
2008
2009
2010
2011
2012
2013
2014
2015
Total cheese production ('000 kg)
Specialty cheese ('000 kg)
CA
NA
DA
S
pec
ialt
y C
hee
se1
Spe
cial
ity C
hees
eTo
tal C
hees
e P
rodu
ctio
n
38

PR
OD
UC
TIO
N
CH
ED
DA
R1
Year
ON
QC
Oth
ers
Can
ad
a2
Kil
og
ram
s
- '0
00
DA
IRY
YE
AR
20
14
/20
15
43
,96
0
66
,68
1
36
,60
7
14
7,2
48
20
13
/20
14
37
,37
9
73
,47
3
28
,75
6
13
9,6
08
20
12
/20
13
45
,12
8
67
,04
0
30
,51
7
14
2,6
85
20
11
/20
12
44
,69
7
66
,15
3
24
,45
0
13
5,3
00
20
10
/20
11
44
,47
5
68
,40
7
23
,39
9
13
6,2
81
20
09
/20
10
47
,48
9
67
,65
5
22
,09
3
13
7,2
42
CA
LE
ND
AR
YE
AR
20
15
43
,54
6
65
,51
6
37
,50
8
14
6,5
70
20
14
40
,63
9
73
,07
6
29
,33
9
14
3,0
54
20
13
41
,50
4
67
,09
4
30
,04
3
13
8,6
41
20
12
46
,02
7
66
,05
3
27
,43
7
13
9,5
17
20
11
42
,52
2
69
,47
7
23
,28
5
13
5,2
84
20
10
46
,41
3
67
,93
3
22
,95
8
13
7,3
04
x C
onfid
entia
l1
Inclu
des c
heese u
sed in
the m
akin
g o
f pro
cessed c
heese
2
New
foundla
nd a
nd L
abra
dor
are
exclu
ded
Sourc
e:
Sta
tistics C
anada
Calc
ula
tio
ns d
one b
y A
AF
C-A
ID,
Mark
et
Info
rmatio
n S
ectio
n
123,0
37
132,3
37
126,4
13
131,8
08
139,3
25
130,1
53
128,7
95
136,0
80
137,3
04
135,2
84
139,5
17
138,6
41
143,0
54
146,5
70
35
9,3
51
43
9,9
28
0100
,000
200
,000
300
,000
400
,000
500
,000
0
50,0
00
100,0
00
150,0
00
200,0
00
250,0
00
2002
2003
2004
2005
2006
2007
2008
2009
2010
2011
2012
2013
2014
2015
Total cheese production ('000 kg)
Chaddar production ('000 kg)
CA
NA
DA
2
Ch
ed
da
r1
Ch
edd
ar
che
ese
Tota
l C
hee
se
Pro
du
ctio
n
39

PR
OD
UC
TIO
N
MO
ZZ
AR
EL
LA
CH
EE
SE
1
Year
ON
QC
Oth
ers
Can
ad
a
Kil
og
ram
s
- '0
00
DA
IRY
YE
AR
20
14
/20
15
17
,37
3
9
2,1
64
10
,49
0
1
20
,02
7
20
13
/20
14
18
,53
5
8
7,3
58
11
,03
4
1
16
,92
7
20
12
/20
13
16
,46
7
8
7,2
74
10
,50
2
1
14
,24
3
20
11
/20
12
18
,74
0
8
6,6
26
9,8
84
1
15
,25
0
20
10
/20
11
18
,44
8
8
6,2
84
9,9
74
1
14
,70
6
20
09
/20
10
20
,28
6
8
5,0
18
11
,61
3
1
16
,91
7
CA
LE
ND
AR
YE
AR
20
15
21
,35
5
9
6,2
22
11
,01
0
1
28
,58
7
20
14
16
,61
5
8
8,2
92
11
,22
4
1
16
,13
1
20
13
17
,99
5
8
6,3
95
10
,46
8
1
14
,85
9
20
12
17
,80
9
8
7,9
20
9,9
10
1
15
,63
9
20
11
18
,74
0
8
6,6
26
9,8
82
1
15
,24
9
20
10
17
,82
6
8
6,2
47
11
,05
6
1
15
,12
9
1 I
nclu
des p
izza c
heese a
nd c
heese u
sed in
the m
akin
g o
f pro
cessed c
heese
Sourc
e:
Sta
tistics C
anada
Calc
ula
tio
ns d
one b
y A
AF
C-A
ID,
Mark
et
Info
rmatio
n S
ectio
n
120,5
53
119,6
11
120,1
84
121,0
48
117,5
11
123,4
81
119,5
24
118,3
18
115,1
29
115,2
49
114,2
43
116,9
27
108,8
70
127,0
87
359,3
51
439,9
28
0100,0
00
200,0
00
300,0
00
400,0
00
500,0
00
0
50,0
00
100,0
00
150,0
00
200,0
00
250,0
00
2002
2003
2004
2005
2006
2007
2008
2009
2010
2011
2012
2013
2014
2015
Total cheese production ('000 kg)
Mozzarella cheese ('000 kg)
CA
NA
DA
M
ozzare
lla
Ch
ee
se
1
Mo
zza
rella
ch
eese
Tota
l C
hee
se
Pro
du
ctio
n
40

PR
OD
UC
TIO
N
OT
HE
R C
HE
ES
ES
Pro
cessed
Ch
eese
ON
Oth
ers
Can
ad
aC
an
ad
a
Kil
og
ram
s
- '0
00
DA
IRY
YE
AR
20
14
/20
15
xx
22
,71
9
5
7,2
46
20
13
/20
14
xx
24
,59
1
6
6,9
39
20
12
/20
13
xx
25
,68
3
6
6,2
87
20
11
/20
12
xx
25
,45
3
7
0,3
20
20
10
/20
11
xx
26
,40
7
6
8,9
18
20
09
/20
10
10
,37
8
1
5,0
46
25
,42
2
6
3,4
51
CA
LE
ND
AR
YE
AR
20
15
xx
21
,36
3
5
5,6
67
20
14
xx
24
,09
4
6
4,0
58
20
13
xx
25
,19
5
6
5,4
94
20
12
xx
26
,06
3
6
8,8
77
20
11
xx
25
,64
4
7
1,3
03
20
10
10
,96
0
1
5,0
59
26
,01
9
6
4,7
28
x C
onfid
entia
l1
Cott
age c
heese w
ith o
r w
ithout
cre
am
added
Sourc
e:
Sta
tistics C
anada
Calc
ula
tio
ns d
one b
y A
AF
C-A
ID,
Mark
et
Info
rmatio
n S
ectio
n
Year
Co
ttag
e C
heese
1
24
,72
3
24
,65
9
26
,32
5
27
,46
3
27
,84
4
29
,88
7
29
,79
1
26
,12
4
26
,01
9
25
,64
4
26
,06
3
25
,19
5
24
,09
4
21
,36
3
66
,74
3
63
,62
2
70
,76
2
69
,09
2
71
,22
5
69
,05
8
70
,66
9
67
,82
5
64
,72
8
71
,30
3
68
,87
7
65
,49
4
64
,05
8
55
,66
7
35
9,3
51
43
9,9
28
- 10
0,0
00
20
0,0
00
30
0,0
00
40
0,0
00
50
0,0
00
-
20
,00
0
40
,00
0
60
,00
0
80
,00
0
10
0,0
00
12
0,0
00
20
02
20
03
20
04
20
05
20
06
20
07
20
08
20
09
20
10
20
11
20
12
20
13
20
14
20
15
Total cheese production ('000 kg)
Cottage and processed cheese ('000 kg)
CA
NA
DA
C
ott
age
an
d p
roce
sse
d c
he
ese
Co
ttag
e c
hee
seP
roce
sse
d c
hee
seTo
tal C
hee
se P
rod
uct
ion
41

PR
OD
UC
TIO
N
Year
ON
Oth
ers
CA
NA
DA
'0
00 K
ilo
gra
ms
DA
IRY
YE
AR
20
14
/20
15
62
,70
93
14
,40
63
77
,11
5
20
13
/20
14
55
,94
12
96
,99
43
52
,93
5
20
12
/20
13
59
,88
93
06
,76
53
66
,65
4
20
11
/20
12
55
,48
72
82
,80
73
38
,29
4
20
10
/20
11
xx
31
3,9
08
20
09
/20
10
55
,24
32
35
,93
82
91
,18
1
CA
LE
ND
AR
YE
AR
20
15
66
,66
73
39
,03
74
05
,70
4
20
14
57
,02
63
01
,99
03
59
,01
6
20
13
58
,19
02
93
,17
63
51
,36
6
20
12
62
,38
73
01
,14
93
63
,53
6
20
11
xx
32
0,5
73
20
10
57
,53
52
43
,18
43
00
,71
9
1 S
ince J
anuary
2012 (
January
2011 f
or
Quebec),
data
does n
ot
inclu
de d
rin
kable
yogurt
.
x C
onfid
entia
l
Sourc
e:
Sta
tistics C
anada
Calc
ula
tio
ns d
one b
y A
AF
C-A
ID,
Mark
et
Info
rmatio
n S
ectio
n
YO
GU
RT
1
180,0
56
197,7
50
215,2
70
233,1
73
243,5
69
252,5
52
273,8
10
281,5
01
300,7
19
320,5
73
363,5
36
351,3
66
359,0
16
405,7
04
-
100,0
00
200,0
00
300,0
00
400,0
00
500,0
00
2002
2003
2004
2005
2006
2007
2008
2009
2010
2011
2012
2013
2014
2015
Yogurt ('000 kg)
CA
NA
DA
Y
og
urt
42

PR
OD
UC
TIO
N
BU
TT
ER
1
Year
ON
Oth
ers
Can
ad
a2
Wh
ey B
utt
er
Kil
og
ram
s
- '0
00
DA
IRY
YE
AR
20
14
/20
15
24
,01
1
6
5,8
00
89
,81
1
2
,50
5
20
13
/20
14
22
,98
1
6
5,5
38
88
,51
9
2
,54
6
20
12
/20
13
25
,53
2
6
8,2
78
93
,81
0
2
,73
1
20
11
/20
12
27
,20
4
6
7,6
45
94
,84
9
1
,87
5
20
10
/20
11
24
,11
7
6
0,9
14
85
,03
1
2
,90
2
20
09
/20
10
23
,27
3
5
8,7
78
82
,05
1
2
,78
3
CA
LE
ND
AR
YE
AR
20
15
23
,09
6
6
5,2
38
88
,33
4
1
,74
4
20
14
23
,15
7
6
4,0
75
87
,23
2
2
,94
0
20
13
24
,30
8
6
8,6
84
92
,99
2
2
,46
6
20
12
28
,52
5
6
9,1
04
97
,62
9
1
,98
3
20
11
24
,74
7
6
4,0
40
88
,78
7
2
,72
3
20
10
22
,92
0
5
7,1
20
80
,04
0
2
,89
0
1 N
ew
foundla
nd a
nd L
abra
dor
is e
xclu
ded
Sourc
e:
Sta
tistics C
anada
Calc
ula
tio
ns d
one b
y A
AF
C-A
ID,
Mark
et
Info
rmatio
n S
ectio
n
2 S
alted b
utt
er,
unsalted (
mild
, culture
d,
with f
lavour)
, w
hip
ped b
utt
er
and c
alo
rie
-reduced b
utt
er
75,8
31
83,6
39
84,3
75
83,5
19
75,4
12
78,4
40
84,6
54
85,9
04
80,0
40
88,7
87
97,6
29
92,9
92
87,2
32
88,3
34
0
25,0
00
50,0
00
75,0
00
100,0
00
125,0
00
2002
2003
2004
2005
2006
2007
2008
2009
2010
2011
2012
2013
2014
2015
Butter ('000 kg)
CA
NA
DA
1,2
Bu
tte
r
43

PR
OD
UC
TIO
N
HA
RD
IC
E C
RE
AM
1
Year
ON
Oth
ers
Can
ad
a
'00
0 lit
res
DA
IRY
YE
AR
201
4/2
01
51
14
,982
4
4,1
53
159
,135
201
3/2
01
41
18
,480
4
9,3
41
167
,821
201
2/2
01
31
01
,058
6
8,6
57
169
,715
201
1/2
01
21
14
,739
7
8,8
14
193
,553
201
0/2
01
11
32
,113
6
8,3
23
200
,436
200
9/2
01
01
06
,639
6
2,3
64
169
,003
CA
LE
ND
AR
YE
AR
2015
104
,600
4
4,1
22
148
,722
2014
127
,190
4
5,0
52
172
,242
2013
98,3
64
58,5
58
156
,922
2012
103
,636
8
2,7
10
186
,346
2011
119
,126
7
1,8
00
190
,926
2010
125
,216
6
4,1
22
189
,338
1 N
ew
fou
nd
lan
d a
nd
La
bra
do
r is
exclu
de
d
So
urc
e: S
tatistics C
an
ad
a
Ca
lcu
latio
ns d
on
e b
y A
AF
C-A
ID, M
ark
et In
form
atio
n S
ectio
n
292,0
90
282
,936
284,3
51
316,2
88
299,2
55
264,2
52
226,9
26
187,3
12
189,3
38
190,9
26
186,3
46
156,9
22
172,2
42
148,7
22
0
50,0
00
100,0
00
150,0
00
200,0
00
250,0
00
300,0
00
350,0
00
400,0
00
2002
2003
2004
2005
2006
2007
2008
2009
2010
2011
2012
2013
2014
2015
Hard ice cream ('000 litres)
CA
NA
DA
H
ard
Ice C
ream
1
44

PR
OD
UC
TIO
N
SO
FT
IC
E C
RE
AM
1
Year
ON
Oth
ers
Can
ad
a
'000 l
itre
s
DA
IRY
YE
AR
20
14
/20
15
3,8
53
x
x
20
13
/20
14
3,7
38
x
x
20
12
/20
13
4,5
83
1
8,3
53
22
,93
6
20
11
/20
12
4,6
88
1
4,9
48
19
,63
6
20
10
/20
11
4,8
54
1
4,8
91
19
,74
5
20
09
/20
10
4,3
02
1
7,1
90
21
,49
2
CA
LE
ND
AR
YE
AR
20
15
3,8
80
x
x
20
14
3,6
85
x
x
20
13
4,1
87
1
7,8
20
22
,00
7
20
12
4,1
94
1
6,6
01
20
,79
5
20
11
5,5
74
1
3,5
76
19
,15
0
20
10
4,3
66
1
7,6
03
21
,96
9
1 N
ew
foundla
nd a
nd L
abra
dor
is e
xclu
ded
x C
onfid
entia
l
Sourc
e:
Sta
tistics C
anada
Calc
ula
tio
ns d
one b
y A
AF
C-A
ID,
Mark
et
Info
rmatio
n S
ectio
n
17,7
15
18,0
33
16,8
11
17,5
16
19,9
57
20,2
56
22,3
46
21,6
29
21,9
69
19,1
50
20,7
95
22,0
07
0
5,0
00
10,0
00
15,0
00
20,0
00
25,0
00
2002
2003
2004
2005
2006
2007
2008
2009
2010
2011
2012
2013
Soft ice cream ('000 litres)
CA
NA
DA
S
oft
Ice C
ream
1
45
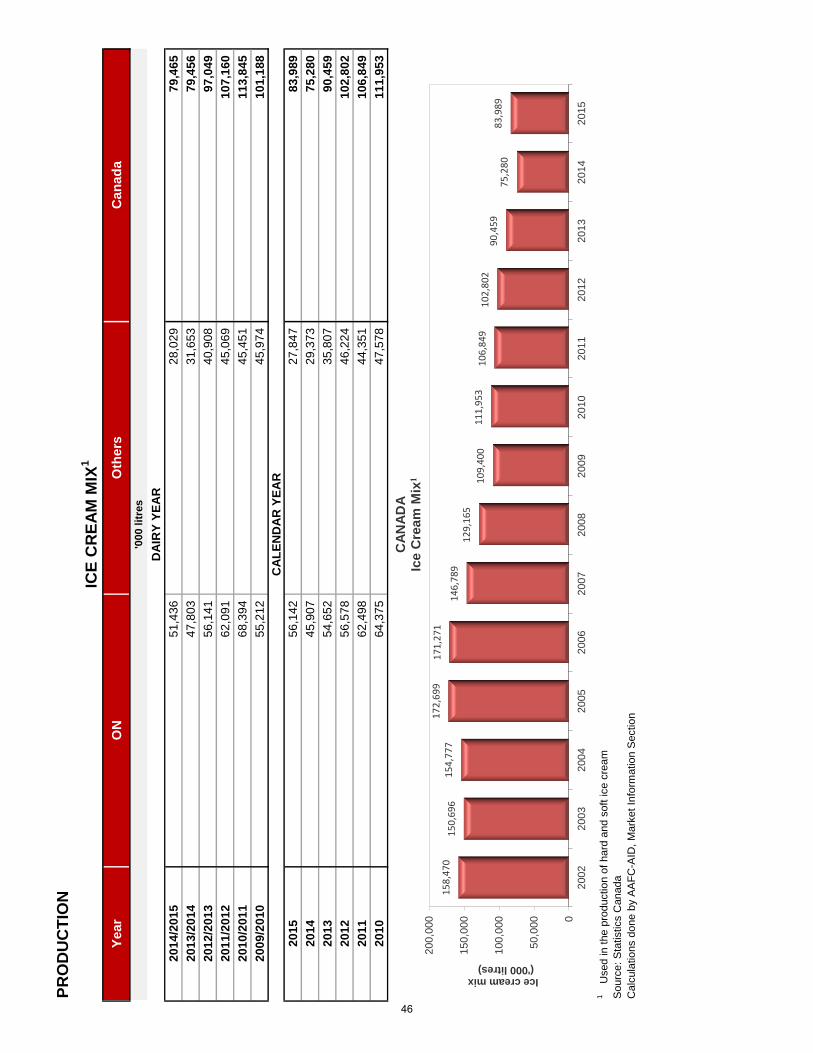
PR
OD
UC
TIO
N
ICE
CR
EA
M M
IX1
Year
ON
Oth
ers
Can
ad
a
'000 l
itre
s
DA
IRY
YE
AR
20
14
/20
15
51
,43
6
2
8,0
29
79
,46
5
20
13
/20
14
47
,80
3
3
1,6
53
79
,45
6
20
12
/20
13
56
,14
1
4
0,9
08
97
,04
9
20
11
/20
12
62
,09
1
4
5,0
69
10
7,1
60
20
10
/20
11
68
,39
4
4
5,4
51
11
3,8
45
20
09
/20
10
55
,21
2
4
5,9
74
10
1,1
88
CA
LE
ND
AR
YE
AR
20
15
56
,14
2
2
7,8
47
83
,98
9
20
14
45
,90
7
2
9,3
73
75
,28
0
20
13
54
,65
2
3
5,8
07
90
,45
9
20
12
56
,57
8
4
6,2
24
10
2,8
02
20
11
62
,49
8
4
4,3
51
10
6,8
49
20
10
64
,37
5
4
7,5
78
11
1,9
53
1
Used in
the p
roductio
n o
f hard
and s
oft
ice c
ream
Calc
ula
tio
ns d
one b
y A
AF
C-A
ID,
Mark
et
Info
rmatio
n S
ectio
n
Sourc
e:
Sta
tistics C
anada
15
8,4
70
1
50
,69
6
15
4,7
77
1
72
,69
9
17
1,2
71
14
6,7
89
1
29
,16
5
10
9,4
00
1
11
,95
3
10
6,8
49
1
02
,80
2
90
,45
9
75
,28
0
83
,98
9
0
50,0
00
100,0
00
150,0
00
200,0
00
2002
2003
2004
2005
2006
2007
2008
2009
2010
2011
2012
2013
2014
2015
Ice cream mix ('000 litres)
CA
NA
DA
Ic
e C
ream
Mix
1
46

PR
OD
UC
TIO
N
OT
HE
R I
CE
CR
EA
M P
RO
DU
CT
S
CA
NA
DA
Year
Sh
erb
ets
Wate
r Ic
es
Ice
Mil
k M
ixM
ilk
Sh
ak
e M
ix
'000 l
itre
s
DA
IRY
YE
AR
20
14
/20
15
1,8
18
1
1,0
44
54
,82
0
8
,06
5
20
13
/20
14
2,4
79
9
,64
0
50
,39
2
7
,82
8
20
12
/20
13
4,5
24
1
3,5
19
59
,26
9
8
,98
1
20
11
/20
12
5,2
33
2
0,6
71
45
,07
7
8
,17
2
20
10
/20
11
6,2
89
2
7,7
06
48
,42
7
7
,18
8
20
09
/20
10
4,6
38
1
9,4
01
35
,55
2
6
,09
1
CA
LE
ND
AR
YE
AR
20
15
1,2
51
1
2,1
37
56
,67
2
8
,01
4
20
14
2,4
25
9
,56
6
50
,50
7
7
,83
8
20
13
4,2
48
9
,06
8
51
,67
4
8
,21
4
20
12
4,9
58
2
1,7
61
51
,36
3
8
,94
4
20
11
5,4
47
2
4,3
03
51
,86
1
7
,85
9
20
10
5,9
63
2
1,1
25
40
,22
5
6
,36
9
E E
stim
ate
Sourc
e:
Sta
tistics C
anada
Calc
ula
tio
ns d
one b
y A
AF
C-A
ID,
Dairy S
ectio
n
0
10,0
00
20,0
00
30,0
00
40,0
00
50,0
00
60,0
00
2006
2007
2008
2009
2010
2011
2012
2013
2014
2015
('000 litres)
CA
NA
DA
Ic
e M
ilk
& M
ilk
sh
ak
e M
ixe
s
Milk
shake M
ixIc
e M
ilk M
ix
0
10,0
00
20,0
00
30,0
00
40,0
00
50,0
00
2006
2007
2008
2009
2010
2011
2012
2013
2014
2015
('000 litres)
CA
NA
DA
S
he
rbe
t a
nd
Wa
ter
Ice
Wate
r Ic
es
Sherb
ert
s
E E E
47

PR
OD
UC
TIO
N
MIL
K P
OW
DE
RS
CA
NA
DA
Year
Skim
med
Bu
tterm
ilk
Wh
ey
Kil
og
ram
s
- '0
00
DA
IRY
YE
AR
20
14
/20
15
91
,32
5
9,8
73
33
,47
6
20
13
/20
14
73
,65
0
10
,86
7
23
,83
6
20
12
/20
13
76
,83
9
12
,04
9
18
,67
9
20
11
/20
12
84
,49
9
4,7
10
25
,43
0
20
10
/20
11
75
,12
0
5,1
16
22
,20
0
20
09
/20
10
77
,20
7
2,4
24
23
,95
8
CA
LE
ND
AR
YE
AR
20
15
97
,82
3
x3
6,9
70
20
14
80
,98
4
10
,24
4
28
,97
8
20
13
73
,85
8
10
,46
6
17
,84
3
20
12
85
,52
7
8,3
19
24
,02
9
20
11
78
,48
0
6,6
12
23
,97
2
20
10
72
,45
6
2,5
26
22
,06
8
x C
onfid
entia
l
Sourc
e:
Sta
tistics C
anada
Calc
ula
tio
ns d
one b
y A
AF
C-A
ID,
Mark
et
Info
rmatio
n S
ectio
n
82,0
19
91,3
19
87,8
41
73,1
18
73,9
29
78,2
06
89,6
04
83,4
67
72,4
56
78,4
80
85,5
27
73,8
58
80,9
84
97,8
23
0
25,0
00
50,0
00
75,0
00
100,0
00
125,0
00
2002
2003
2004
2005
2006
2007
2008
2009
2010
2011
2012
2013
2014
2015
Skim milk powder ('000 kg)
CA
NA
DA
S
kim
Mil
k P
ow
de
r
48

THE CONSUMER
49

PE
R C
AP
ITA
CO
NS
UM
PT
ION
OF
MIL
K &
CR
EA
M
3.2
5%
2%
1%
Sk
imC
ho
co
late
mil
k a
nd
oth
er
flavo
red
mil
kB
utt
erm
ilk
TO
TA
L
Lig
ht
5%
- 9
.9%
Half
& H
alf
10%
- 1
5.9
%
Tab
le
16%
- 3
1.9
%
Wh
ipp
ing
32%
- 3
5%
So
ur
TO
TA
L
litr
es
20
15
10
.08
3
4.4
4
13
.99
5
.58
6.2
3
0.3
3
70
.64
0.3
6
3.1
7
3.9
1
1.3
1
1.1
8
9
.94
20
14
10
.16
3
5.1
5
15
.12
6
.55
5.9
9
0.3
4
73
.31
0.2
9
3.2
2
3.8
9
1.3
3
1.3
0
1
0.0
3
20
13
10
.24
3
5.5
8
16
.14
7
.23
5.8
0
0.3
7
75
.37
0.3
4
3.1
3
3.8
9
1.3
7
1.2
8
1
0.0
1
20
12
10
.28
3
5.4
1
16
.89
7
.86
5.8
6
0.3
4
76
.64
..3
.29
3
.52
1
.33
1
.31
9.4
6
20
11
10
.46
3
5.6
8
17
.37
8
.21
5.9
4
0.3
4
77
.99
..3
.05
3
.21
1
.25
1
.25
8.7
5
20
10
10
.58
3
5.7
4
17
.41
8
.33
5.7
9
0.3
3
78
.17
..2
.95
3
.15
1
.15
1
.02
8.2
6
20
09
11
.18
3
7.4
5
18
.16
8
.61
5.7
4
0.3
7
81
.51
..3
.05
3
.11
1
.24
1
.04
8.4
4
20
08
11
.34
3
7.3
9
18
.18
8
.69
6.0
7
0.4
4
82
.11
..2
.97
3
.08
1
.22
1
.20
8.4
7
20
07
11
.95
3
7.9
8
18
.20
8
.76
5.7
8
0.4
5
83
.13
..3
.03
3
.12
1
.21
1
.38
8.7
3
20
06
12
.36
3
8.4
4
18
.12
8
.71
5.5
1
0.4
2
83
.56
..3
.05
2
.98
1
.17
1
.39
8.6
0
20
05
12
.61
3
8.8
2
17
.88
8
.75
5.4
8
0.4
2
83
.97
..3
.11
2
.77
1
.16
1
.33
8.3
7
20
04
13
.09
4
0.1
2
17
.91
8
.64
5.4
0
0.4
4
85
.60
..3
.21
2
.57
1
.13
1
.35
8.2
6
20
03
13
.45
4
0.3
3
17
.46
8
.54
5.0
7
0.4
3
85
.28
..3
.04
2
.37
1
.19
1
.35
7.9
5
20
02
13
.55
4
0.5
8
17
.25
8
.83
4.9
4
0.4
2
85
.57
..2
.92
1
.96
1
.10
1
.29
7.2
7
20
01
14
.20
4
1.8
0
17
.21
8
.73
4.8
7
0.3
9
87
.20
..2
.95
1
.80
1
.03
1
.36
7.1
3
20
00
14
.20
4
3.2
4
17
.26
8
.59
4.5
4
0.3
9
88
.22
..2
.92
1
.57
1
.05
1
.28
6.8
3
19
99
14
.13
4
3.5
9
16
.56
8
.37
4.6
7
0.4
3
87
.73
..2
.88
1
.36
0
.92
1
.20
6.3
6
19
98
14
.78
4
4.6
9
16
.41
8
.22
4.2
5
0.4
3
88
.77
..2
.92
1
.11
0
.90
1
.11
6.0
4
19
97
15
.02
4
5.4
8
16
.19
8
.05
4.0
2
0.3
8
89
.14
..2
.86
0
.95
0
.85
0
.96
5.6
2
19
96
15
.40
4
7.0
9
15
.46
7
.76
3.9
5
0.4
0
90
.05
..2
.89
0
.79
0
.87
0
.94
5.4
8
.. N
ot
availa
ble
1 A
nnual flu
id m
ilk a
nd c
ream
sale
s d
ivid
ed b
y t
he C
anadia
n p
opula
tio
n
Note
: C
alc
ula
tio
ns d
o n
ot
take in
to a
ccount
cro
ss b
ord
er
shoppin
g
Sourc
e:
Sta
tistics C
anada
Calc
ula
tio
ns d
one b
y A
AF
C-A
ID,
Mark
et
Info
rmatio
n S
ectio
n
CA
NA
DA
Ye
ar
FL
UID
MIL
K1
CR
EA
M1
50

PE
R C
AP
ITA
CO
NS
UM
PT
ION
OF
DA
IRY
PR
OD
UC
TS
1
CH
EE
SE
Ch
ed
dar2
Sp
ecia
lty
3C
ott
ag
eT
OT
AL
PR
OC
ES
SE
D
li
tre
s
Cheddar
Specia
lty
Cott
age
Butt
er
Evapora
ted
Yogurt
Ice c
ream
20
15
3.9
3
7
.96
0.6
0
1
2.4
9
1.5
7
2
.82
x1
0.5
3
4
.79
20
14
3.9
8
7
.92
0.6
8
1
2.5
8
1.7
8
2
.86
x9
.33
5.5
1
20
13
4.0
1
7
.93
0.7
2
1
2.6
6
1.9
2
2
.73
0.5
5
9
.22
5.1
1
20
12
3.9
5
7
.60
0.7
5
1
2.3
0
1.9
9
2
.89
0.5
9
9
.69
5.5
5
20
11
4.0
5
7
.56
0.7
5
1
2.3
6
2.0
6
2
.88
0.7
5
8
.64
5.4
9
20
10
4.1
4
7
.69
0.7
7
1
2.5
9
1.8
5
2
.70
0.6
9
8
.31
5.5
3
20
09
4.0
5
7
.72
0.7
8
1
2.5
4
2.1
0
2
.80
0.7
9
7
.80
5.5
6
20
08
3.9
3
7
.76
0.9
0
1
2.5
8
2.1
3
2
.68
1.0
0
7
.69
6.9
2
20
07
3.7
5
7
.75
0.9
1
1
2.4
0
2.2
4
2
.72
1.0
6
7
.18
8.0
4
20
06
4.1
5
7
.22
0.8
5
1
2.2
2
2.3
0
2
.83
1.0
0
6
.99
9.2
3
20
05
3.9
8
7
.21
0.8
5
1
2.0
4
2.2
5
3
.15
1.0
3
6
.77
9.8
5
20
04
3.7
8
7
.35
0.8
2
1
1.9
6
2.3
5
3
.46
0.9
3
6
.32
9.1
5
20
03
3.8
8
6
.98
0.7
8
1
1.6
4
2.2
2
3
.23
0.6
4
5
.86
9.2
7
20
02
3.7
7
6
.98
0.7
9
1
1.5
4
2.2
4
3
.29
1.1
8
5
.39
9.5
0
20
01
3.8
4
6
.86
0.7
8
1
1.4
8
2.4
7
3
.36
1.0
2
4
.88
9.2
3
20
00
3.9
1
7
.15
0.7
9
1
1.8
5
2.3
5
2
.99
1.2
8
4
.59
8.6
3
19
99
4.0
0
6
.82
0.7
1
1
1.5
4
2.3
9
2
.85
1.3
1
4
.05
10
.03
19
98
3.8
5
6
.92
0.7
1
1
1.4
8
2.2
5
2
.89
1.1
5
3
.46
10
.19
19
97
3.9
7
7
.13
0.7
2
1
1.8
2
2.4
4
2
.63
1.7
6
3
.19
10
.35
19
96
3.7
6
6
.18
0.7
6
1
0.7
0
2.5
8
2
.87
1.8
1
3
.17
10
.88
x C
onfid
entia
l
1 C
onsum
ptio
n =
[B
egin
nin
g S
tocks +
Pro
ductio
n +
Im
port
s -
Export
s -
Endin
g S
tocks]
/ P
opula
tio
n.
Inclu
des q
uantitie
s im
port
ed u
nder
the I
mport
for
Re-e
xport
Pro
gra
m
2 I
nclu
des c
heese u
sed in
the m
akin
g o
f pro
cessed c
heese
3 E
xclu
des c
heddar
and c
ott
age c
heese
4 I
nclu
des h
ard
and s
oft
ice c
ream
Sourc
e:
Sta
tistics C
anada
Calc
ula
tio
ns d
one b
y A
AF
C-A
ID,
Mark
et
Info
matio
n S
ectio
n
CA
NA
DA
EV
AP
OR
AT
ED
WH
OL
E M
ILK
Y
ea
rB
UT
TE
RY
OG
UR
TIC
E C
RE
AM
4
kg
51

IMPORTS AND EXPORTS
52

Sou
rce:
Sta
tistic
s C
anad
aC
alcu
latio
ns d
one
by A
AFC
-AID
, Mar
ket I
nfor
mat
ion
Sec
tionC
an
ad
ian
Da
iry
Tra
de
Ba
lan
ce
20
06
- 2
01
5m
illi
on
s $
262
283
255
230
227
252
237
262
281
211
520
622
679
573
610
670
677
751
899
899
-258
-338
-4
24
-343
-3
83
-418
-4
40
-489
-6
18
-689
-8
00
-600
-400
-2000
200
400
600
800
100
0
200
62
007
200
82
009
201
02
011
201
22
013
201
42
015
Expo
rtsIm
ports
Trad
e Ba
lanc
e
53

Source: Global Trade Tracker
Calculations done by AAFC-AID, Market Information Section
Germany 13.2%
New Zealand 12.7% France
10.2%
Netherlands 10.0%
United States 6.4%
Belgium 4.7%
Italy 4.3%
Ireland 3.2%
Denmark 3.1%
Belarus 2.4%
Australia 2.5%
Poland 2.6%
United Kingdom 2.6%
Argentina 1.3%
Canada 0.3%
Other EU Countries 10.6%
Others 9.9%
2015 Global Dairy Trade by Exporting Countries
TOTAL: $91.9 billion
Other Agri-Food Products
94.4%
Dairy Products 5.6%
2015 Share of Dairy Products in World Agri-Food Trade
TOTAL: $1,648 billion
54

2015
Canadian Exports of Dairy Products
1 Skim milk powder and whole milk powder
Source: Statistics CanadaCalculations done by AAFC-AID, Market Information Section
2 Lactose and lactose syrup, milk albumin, casein, buttermilk, curdled milk and cream, kephir, etc.
Milk Powders 1 21.2%
Whey Products 22.4%
Milk & Cream 2.1%
Cheddar and Cheddar Types 7.3%
Butter and Other Fats & Oils
1.9%
Specialty Cheeses 13.0%
Processed and Fresh Cheeses
6.2% Ice Cream 0.8%
Yogurt 7.6%
Products Consisting of Natural Milk Constituents
10.7%
Dairy Spreads 0.8%
Others 2 6.0%
TOTAL : $211 Million
55

Canadian Exports of Dairy Products by Destination
CANADIAN EXPORTS BY COUNTRY
2013 2014 2015 2013 2014 2015
United States 105,208,570 119,099,332 104,190,298 37,265,884 43,035,927 39,716,691
Philippines 15,726,444 17,547,650 3,728,286 6,173,559 6,306,587 2,885,872
Thailand 4,511,452 8,166,175 5,636,565 2,420,597 5,798,878 5,294,750
Egypt 15,075,784 18,636,468 20,105,514 4,082,157 5,330,189 7,355,916
Jamaica 3,653,288 11,674,957 2,944,454 1,299,391 4,764,200 1,120,345
South Korea 6,478,501 5,293,749 6,151,847 3,439,212 3,866,452 4,306,806
Mexico 12,379,874 12,315,869 9,405,192 3,136,552 3,098,108 3,723,864
Cuba 13,532,542 12,350,843 4,448,029 3,527,662 2,517,942 1,619,114
Saudi Arabia 11,528,316 9,842,290 7,295,357 2,899,247 2,042,534 1,828,115
China, P. Rep. 928,780 4,903,405 9,885,094 270,631 1,930,196 2,960,945
Others 73,012,706 61,625,419 37,275,445 23,384,927 16,676,665 11,663,479
TOTAL 262,036,257 281,456,157 211,066,081 87,899,819 95,367,678 82,475,897
Source: Statistics Canada Calculations done by AAFC-AID, Market Information Section
2015
BY COUNTRYVALUE ($) QUANTITY (kg)
TOTAL: $211 million
Others17.7%
China, P. Rep.4.7%
Saudi Arabia3.5%
Cuba2.1%
Mexico4.5%
South Korea2.9%
Jamaica1.4%
Egypt9.5%
Thailand2.7%
Philippines1.8% United States
49.4%
56

Can
adia
n D
airy
Pro
du
cts
Exp
ort
s
CG
AR
CG
AR
20
10
20
14
20
15
20
10
-15
(%
)2
01
02
01
42
01
52
01
0-1
5 (
%)
20
12
20
13
20
14
20
15
Mil
k1,
810,
038
4,62
4,38
6
4,
507,
096
20.0
22,
004,
698
4,23
6,59
5
3,
852,
416
13.9
6
Cre
am4,
414,
703
48,3
87
13
,063
-68.
792,
324,
445
24,9
82
6,
783
-6
8.88
Ch
eese
Che
ddar
and
Che
ddar
Typ
es19
,836
,035
28,7
64,6
9815
,496
,416
-4.8
22,
970,
361
4,08
1,56
41,
891,
980
-8.6
3
Spe
cial
ty22
,842
,895
30,0
46,7
5427
,423
,185
3.72
4,42
0,48
84,
524,
642
3,88
7,83
3-2
.54
Pro
cess
ed19
9,77
163
2,33
81,
359,
129
46.7
448
,240
90,3
5015
9,17
026
.97
Fres
h 1
6,12
8,21
39,
817,
895
11,7
81,8
8913
.97
1,52
4,05
72,
361,
247
2,45
3,68
09.
99
To
tal
- C
hee
se49
,006
,914
69,2
61,6
8556
,060
,619
2.73
8,96
3,14
611
,057
,803
8,39
2,66
3-1
.31
Oth
er D
airy
Pro
du
cts
Ice
Cre
am &
Edi
ble
Ice
Pro
duct
s56
,953
,091
418,
460
1,66
0,96
3
-50.
6914
,375
,299
102,
308
360,
800
-52.
14
Yog
urt
10,9
17,3
26
25
,439
,893
15,9
98,3
53
7.
943,
019,
606
5,
762,
773
3,
705,
308
4.
18
But
ter a
nd O
ther
Fat
s an
d O
ils D
eriv
ed fr
om M
ilk3,
546,
191
2,
657,
411
3,
968,
233
2.
271,
055,
610
66
2,33
0
70
7,82
3
-7
.68
Eva
pora
ted
Milk
120,
443
114,
339
132,
995
2.00
152,
224
47,8
46
45
,437
-21.
48
Con
dens
ed M
ilk86
7,93
8
1,
568,
912
89
6,52
0
0.
6532
8,89
1
62
1,65
0
29
8,71
4
-1
.91
Ski
m M
ilk P
owde
r13
,800
,610
57,9
78,6
60
37
,130
,021
21.8
96,
100,
625
12
,701
,710
13,6
49,1
41
17
.48
Who
le M
ilk P
owde
r1,
397,
217
15
,064
,115
7,54
1,28
6
40.1
034
2,11
2
3,
607,
391
2,
461,
937
48
.40
Whe
y P
rodu
cts
37,4
69,4
09
68
,337
,934
47,2
75,3
31
4.
7631
,793
,652
48,9
71,6
85
40
,725
,705
5.08
Cas
ein
and
Cas
ein
Pro
duct
s34
,191
255,
804
228,
614
46.2
312
,830
91,7
20
79
,796
44.1
3
Dai
ry S
prea
ds11
,683
,146
938,
280
1,79
3,17
3
-31.
265,
836,
017
32
6,23
0
60
4,59
2
-3
6.46
Pro
duct
s C
onsi
stin
g of
Nat
ural
Milk
Con
stitu
ents
28,3
38,6
78
23
,571
,086
22,4
92,4
65
-4
.52
6,41
7,10
9
3,00
7,14
9
3,01
2,57
6
-14.
04
Oth
ers 2
6,86
8,17
8
11,1
76,8
05
11
,367
,349
10.6
04,
206,
728
4,
145,
506
4,
572,
206
1.
68
To
tal
- O
ther
Dai
ry P
rod
uct
s17
1,99
6,41
8
20
7,52
1,69
9
15
0,48
5,30
3
-2
.64
73,6
40,7
03
80,0
48,2
98
70,2
24,0
35
-0.9
5
TO
TA
L -
All
Dai
ry P
rod
uct
s22
7,22
8,07
3
28
1,45
6,15
7
21
1,06
6,08
1
-1
.46
86,9
32,9
92
95,3
67,6
78
82,4
75,8
97
-1.0
5
CG
AR
: Com
poun
d A
nnua
l Gro
wth
Rat
e1 M
ostly
cot
tage
che
ese
and
crea
m c
hees
e2 B
utte
rmilk
, Cur
dled
Milk
, Kep
hir,
Lact
ose
& L
acto
se S
yrup
, Milk
Alb
umin
etc
.S
ourc
e: S
tatis
tics
Can
ada
Cal
cula
tions
don
e by
AA
FC-A
ID, M
arke
t Inf
orm
atio
n S
ectio
n
PR
OD
UC
TV
AL
UE
($)
QU
AN
TIT
Y (
kg)
57

2013 2014 2015 2013 2014 2015
Africa 2,928,672 2,726,566 795,528 730,338 535,055 149,208 Asia 3,563,395 4,510,859 1,706,557 865,064 965,008 299,983 Central America & West Indies 1,158,824 1,691,418 2,879,939 266,542 336,082 535,339 European Union (28) 5,767,473 9,866,085 4,742,294 694,810 1,124,574 540,186 Middle East 13,694,483 12,143,383 9,054,880 3,372,198 2,471,390 2,110,522 North America 32,872,426 37,079,235 35,701,770 5,366,269 5,380,956 4,557,500 Oceania 633,009 1,235,995 1,179,151 131,189 244,001 199,868 Other European countries 6,891 7,644 - 4,565 680 - South America 559,490 500 500 145,309 57 57 TOTAL 61,184,663 69,261,685 56,060,619 11,576,284 11,057,803 8,392,663
2013 2014 2015 2013 2014 2015
United States 32,660,080 36,924,965 35,559,632 5,327,389 5,352,627 4,531,580 Saudi Arabia 10,669,145 9,807,679 6,992,346 2,689,272 2,015,924 1,683,645 United Kingdom 5,332,320 9,699,635 4,592,230 606,966 1,097,418 509,274 Bahamas 596,200 507,137 2,013,422 140,000 107,744 371,043 Australia 557,176 1,073,422 1,002,767 114,530 210,143 168,177 United Arab Emir. 533,595 970,419 966,738 101,234 177,719 175,325 Singapore 530,418 601,801 947,856 115,616 125,627 170,011 Jamaica 346,904 779,481 527,448 77,618 140,239 101,249 Japan 1,649,938 3,735,729 512,852 392,674 803,471 68,781 Jordan 783,003 233,493 428,838 191,978 47,996 119,988 Qatar 160,020 129,402 404,995 34,578 26,049 81,005 Mauritius 188,461 324,946 401,968 39,144 62,520 70,815 South Africa 104,003 189,093 288,072 23,327 38,589 49,830 Others 7,073,400 4,284,483 1,421,455 1,721,958 851,737 291,940
TOTAL 61,184,663 69,261,685 56,060,619 11,576,284 11,057,803 8,392,663
- NilSource: Statistics CanadaCalculations done by AAFC-AID, Market Information Section
BY COUNTRY
VALUE ($) QUANTITY (kg)
EXPORTS OF ALL CHEESES2015
TRADE PARTNERS
BY REGION
VALUE ($) QUANTITY (kg)
Others 12.7%
Australia 1.7%
Bahamas 3.5%
United Kingdom
8.0% Saudi Arabia 12.2%
United States 61.9%
40.7 45.8
61.2 69.3
56.1
2011 2012 2013 2014 2015
millions $
Value Destinations
56,060,619$
58

2 Skim milk powder and whole milk powderSource: Statistics CanadaCalculations done by AAFC-AID, Market Information Section
Canadian Imports of Dairy Products
2015
1 Lactose and lactose syrup, milk albumin, buttermilk, dairy spreads, curdled milk and cream, kephir, etc.
Milk Powders21.7%
Milk & Cream3.6%
Others1
11.2% Butter and Other Fats and Oils8.0%
Yogurt0.5%
Whey Products9.2%
Processed and Fresh Cheeses1.3%
Cheddar and Cheddar Types3.9%
Products Consisting of Natural Milk Constituents
3.0%Milk Protein Substances
20.5%
Specialty Cheeses29.3%
Casein and Casein Products7.8%
TOTAL : $899 Million
59

Canadian Imports of Dairy Products by Origin
CANADIAN IMPORTS BY COUNTRY
2013 2014 2015 2013 2014 2015
United States 376,119,120 465,808,149 474,552,409 173,878,485 132,604,060 156,568,257
New Zealand 49,938,200 93,096,805 83,557,515 26,446,243 7,496,023 13,590,718
Italy 58,750,106 57,672,864 56,341,229 23,789,569 4,557,059 4,233,942
France 62,269,182 57,630,755 62,277,501 20,678,178 5,066,054 4,270,424
Germany 37,795,821 47,937,968 25,053,411 4,951,440 4,116,032 4,785,871
Switzerland 34,950,731 47,907,458 46,181,624 11,240,494 3,147,009 3,788,044
Argentina 38,481,813 24,674,266 35,475,787 10,931,246 3,994,744 2,132,577
Netherlands 18,280,437 18,606,226 18,388,660 6,024,209 2,269,803 2,013,962
Norway 14,312,228 17,404,719 15,646,731 3,951,289 1,484,501 1,781,390
Denmark 14,770,941 17,241,648 18,844,027 6,638,520 1,390,868 1,520,408
Others 45,564,261 51,023,641 63,099,858 (115,518,402) 35,678,678 3,817,054
TOTAL 751,232,840 899,004,499 899,418,752 173,011,271 201,804,831 198,502,647
Source: Statistics Canada
Calculations done by AAFC-AID, Market Information Section
2015
BY COUNTRYVALUE ($) QUANTITY (kg)
Others 7.0%
United States 52.8%
New Zealand 9.3%
Italy 6.3%
France 6.9% Germany
2.8%
Switzerland 5.1%
Argentina 3.9%
Netherlands 2.0%
Norway 1.7%
Denmark 2.1%
TOTAL : $899 Million
60

Can
ad
ian
Da
iry P
rod
ucts
Im
po
rts
1
CG
AR
CG
AR
20
10
20
14
20
15
20
10
-15
(%
)2
01
02
01
42
01
52
01
0-1
5 (
%)
-3-2
-1-3
-2-1
Mil
k14,2
89,5
57
24,6
82,2
39
23,8
89,8
38
10.8
332,4
33,4
68
55,1
82,4
31
46,7
80,8
08
7.6
0
Cre
am
8,9
07,9
05
4,6
24,1
67
8,4
10,4
35
-1.1
45,6
38,9
39
1,5
21,6
84
3,1
72,5
50
-10.8
7
Ch
eese
Cheddar
and C
heddar
Types
17,8
13,3
90
30,1
51,0
07
35,0
35,1
64
14.4
92,5
98,0
85
3,0
98,4
18
3,1
02,8
82
3.6
1
Specia
lty
209,6
62,6
91
253,9
21,4
69
263,7
13,4
27
4.6
919,8
34,1
71
21,3
30,8
95
21,5
89,4
46
1.7
1
Pro
cessed
11,9
53,7
22
10,6
25,8
43
7,2
27,3
62
-9.5
71,2
34,4
03
1,0
60,5
93
711,4
98
-1
0.4
3
Fre
sh 2
7,1
37,8
08
4,0
54,2
49
4,7
57,7
44
-7.7
9959,3
36
519,3
46
584,2
78
-9
.44
To
tal
- C
he
ese
246,5
67,6
11
298,7
52,5
68
310,7
33,6
97
4.7
324,6
25,9
95
26,0
09,2
52
25,9
88,1
04
1.0
8
Oth
er
Dair
y P
rod
uc
ts
Ice C
ream
& E
dib
le I
ce P
roducts
2,0
19,9
53
3,0
12,6
45
2,4
42,4
38
3.8
7694,3
39
1,0
76,3
82
738,1
53
1.2
3
Yogurt
5,9
74,5
64
3,1
51,7
95
4,0
59,3
11
-7.4
43,8
49,7
68
801,3
56
986,9
90
-2
3.8
3
Butt
er
and O
ther
Fa
ts a
nd O
ils D
erived f
rom
Milk
28,8
85,7
23
48,6
07,8
85
72,2
81,2
74
20.1
37,4
44,5
19
10,7
70,0
08
15,7
36,6
78
16.1
5
Evapora
ted M
ilk34,3
94
1,8
26,1
97
1,3
04,2
76
106.9
121,1
90
1,1
98,5
10
1,1
11,8
89
120.7
9
Condensed M
ilk1,1
01,8
42
98,6
32
225,1
14
-2
7.2
1871,9
84
50,2
68
89,5
32
-36.5
7
Skim
Milk
Pow
der
8,8
28,5
04
14,1
70,7
46
7,9
43,7
98
-2.0
93,1
30,0
18
5,5
95,3
68
3,0
91,1
08
-0.2
5
Whole
Milk
Pow
der
8,6
63,9
82
6,1
86,3
90
7,2
00,1
08
-3.6
32,4
76,3
84
1,4
76,9
57
1,7
91,1
92
-6.2
7
Whey P
roducts
47,5
66,0
16
105,8
44,0
77
83,1
88,6
88
11.8
349,8
91,4
40
55,6
84,3
77
42,6
60,0
45
-3
.08
Casein
and C
asein
Pro
ducts
72,1
42,8
63
78,7
82,9
61
69,7
64,5
39
-0
.67
10,3
91,0
59
6,7
40,0
59
7,5
75,4
16
-6.1
3
Dairy S
pre
ads
527
5,0
88
1,2
62,4
25
374.1
1288
2,7
80
689,8
51
374.1
0
Pro
ducts
Consis
tin
g o
f N
atu
ral M
ilk C
onstitu
ents
26,9
88,7
22
37,1
65,6
70
27,0
78,1
41
0.0
75,3
07,5
82
5,4
04,8
92
4,5
83,9
86
-2.8
9
Milk
Pro
tein
Substa
nces
94,7
98,6
93
190,2
07,6
82
184,3
78,6
33
14.2
313,2
57,6
27
20,7
82,1
65
32,5
47,2
94
19.6
8
Oth
ers
343,5
96,5
97
81,8
85,7
57
95,2
56,0
37
16.9
28,3
27,4
91
9,5
08,3
42
10,9
59,0
51
5.6
5
To
tal
- O
the
r D
air
y P
rod
uc
ts340,6
02,3
80
570,9
45,5
25
556,3
84,7
82
10.3
1105,6
63,6
89
119,0
91,4
64
122,5
61,1
85
3.0
1
TO
TA
L -
All
Da
iry P
rod
uc
ts610,3
67,4
53
899,0
04,4
99
899,4
18,7
52
8.0
6168,3
62,0
91
201,8
04,8
31
198,5
02,6
47
3.3
5
1
Inclu
des q
uantitie
s im
port
ed u
nder
the I
mport
s f
or
Re-E
xport
Pro
gra
m2
Mostly c
ott
age c
heese a
nd c
ream
cheese
3
Butt
erm
ilk,
Curd
led M
ilk,
Kephir,
Lacto
se &
Lacto
se S
yru
p,
Milk
alb
um
in e
tc.
Sourc
e:
Sta
tistics C
anada
Calc
ula
tio
ns d
one b
y A
AF
C-A
ID,
Mark
et
Info
rmatio
n S
ectio
n
PR
OD
UC
TV
AL
UE
($
)Q
UA
NT
ITY
(k
g)
61

IMPORTS OF ALL CHEESES
2013 2014 2015 2013 2014 2015
Africa 51,965 34,204 23,533 10,705 9,707 5,609
Asia 1,393 1,951 3,819 449 143 168
Central America & West Indies 292,126 22,826 236,230 38,465 7,508 16,114
European Union (28) 164,068,740 174,520,116 172,672,932 13,855,969 13,753,843 13,784,821
Middle East 714,474 755,759 862,766 66,448 66,220 81,455
North America 71,221,836 77,390,312 87,493,737 8,489,052 8,395,575 8,448,482
Oceania 68,328 92,634 456,966 4,075 5,981 39,609
Other European countries 37,362,793 45,601,248 48,710,215 3,266,464 3,745,161 3,587,957
South America 227,586 333,518 273,499 38,524 25,114 23,889
TOTAL 274,009,241 298,752,568 310,733,697 25,770,151 26,009,252 25,988,104
2013 2014 2015 2013 2014 2015
United States 71,221,814 77,390,295 87,493,720 8,489,050 8,395,574 8,448,481
Italy 58,641,484 57,563,319 56,219,944 4,542,526 4,218,584 4,450,308
France 52,873,598 52,672,563 53,110,966 4,027,390 3,799,140 3,810,107
Switzerland 23,066,330 28,078,494 33,019,712 1,779,668 1,947,051 2,017,440
Denmark 13,183,199 15,653,830 16,413,663 1,170,968 1,292,258 1,309,513
Norway 14,158,732 17,404,719 15,646,622 1,467,859 1,781,390 1,564,887
Netherlands 13,905,421 16,261,783 15,493,112 1,642,988 1,656,543 1,567,610
United Kingdom 9,462,096 12,686,990 14,233,949 872,282 996,452 1,021,342
Greece 6,649,522 7,298,108 5,402,907 651,002 672,442 531,342
Germany 4,739,373 5,246,968 3,917,937 413,278 427,606 309,810
Ireland 351 1,575,583 2,363,266 59 153,650 227,723
Spain 1,441,527 2,163,697 2,294,853 112,760 147,911 158,494
Others 4,665,794 4,756,219 5,123,046 600,321 520,651 571,047
TOTAL 274,009,241 298,752,568 310,733,697 25,770,151 26,009,252 25,988,104
Source: Statistics Canada
Calculations done by AAFC-AID, Market Information Section
BY REGION
VALUE ($) QUANTITY (kg)
BY COUNTRY
VALUE ($) QUANTITY (kg)
2015
TRADE PARTNERS
Others 20.7%
United States 28.2%
Italy 18.1%
France 17.1%
Switzerland 10.6%
Denmark 5.3%
million
million
million
262.8 265.6 274.0
298.8
310.7
2011 2012 2013 2014 2015
millions $
million
Origin
million -
million
million million -
million
million
310,733,697$
Value
62

VARIETIES 2011 2012 2013 2014 2015
QUANTITY (kg)
NATURAL
FRESH
Cottage 32,390 26,565 26,470 25,216 22,751 Cream 187,506 141,794 140,259 154,392 159,623 Ricotta 21,833 8,002 15,742 6,990 3,998 Others 110,392 124,857 106,796 104,768 117,252
Total Fresh 352,121 301,218 289,267 291,366 303,624
BLUE-VEINED
Blue 802,298 832,283 798,611 913,278 953,293 Gorgonzola 82,955 101,757 79,852 88,379 90,177 Roquefort 159 64 73 602 1,972 Stilton 122,551 112,302 79,734 113,598 65,164 Others 8,330 11,305 5,278 866 7,334
Total Blue-veined 1,016,293 1,057,711 963,548 1,116,723 1,117,940
CHEDDAR TYPE
Asiago 555,777 656,186 647,512 774,806 632,349 Brick 73,137 164 9,653 2,242 452 Caerphilly 928 32 224 30 56 Cheddar 815,586 918,601 976,288 961,040 1,126,752 Cheshire 13,575 14,709 16,689 19,256 13,964 Colby 100,844 76,742 44,232 115,954 103,840 Farmers 8,192 25,992 21,325 19,061 13,322 Gloucester 12,613 15,273 17,108 29,612 33,615 Lancashire 6,250 2,135 1,904 2,523 423 Leicester 10,512 10,987 10,408 15,996 15,953 Others 255,868 257,847 297,976 320,964 398,808
Total Cheddar Type 1,853,282 1,978,668 2,043,319 2,261,484 2,339,534
SOFT
Banon 6,108 2,918 4,096 6,659 2,590 Brie 438,113 420,677 497,803 514,957 461,323 Camembert 322,924 316,174 293,928 293,307 255,302 Goat's 131,878 118,426 128,151 133,185 129,762 Gournay 25,730 - - - 18,347 Others 587,244 562,294 529,397 498,566 483,367
Total Soft 1,511,997 1,420,489 1,453,375 1,446,674 1,350,691
OTHER NATURALS
Ambrosia 425 2,053 17,054 19 - Bel Paese 11,997 13,193 699 1,940 212 Butter 31,242 33,869 47,014 41,260 42,877 Crontonese 71,519 42,761 66,033 55,933 46,161 Danbo 12,211 1,965 1,622 10,771 - Edam 199,448 183,982 201,182 189,865 195,346 Emmental 1,011,571 1,039,433 987,135 903,110 893,471 Esrom 15,962 16,596 14,980 11,721 5,039 Feta 763,176 863,449 790,529 900,815 817,727 Fontina 136,946 140,441 125,583 138,427 120,944 Fynbo - - - - - Gouda 993,375 932,711 975,134 1,014,413 976,816 Grana 1,025,508 1,036,751 1,238,235 1,146,643 1,163,847 Grieve - 3,888 327 - - Gruyere 694,473 704,684 668,123 729,648 876,984 Havarti 366,707 311,778 262,447 216,232 210,755 Jarlsberg 1,419,262 1,402,581 1,444,382 1,712,923 1,527,666 Kaskaval 35,346 44,117 49,285 45,198 33,959 Kasseri 29,976 3,875 19,507 5,145 11,502 Kefalotyri 46,380 53,300 50,938 48,637 36,359
CHEESE IMPORTS INTO CANADA BY VARIETY1
63

VARIETIES 2011 2012 2013 2014 2015
QUANTITY (kg)
CHEESE IMPORTS INTO CANADA BY VARIETY1
NATURAL
OTHER NATURALS (continued)
Lappi 55,117 29,601 14,426 24,026 27,085
Leyden 7,599 2,507 3,020 2,815 1,226 Mitzithra 18,164 - 14,773 11,755 9,187 Montasio 11,246 10,397 7,526 9,515 11,042 Mozzarella 472,065 487,728 830,950 672,215 585,541 Munster 87,882 56,409 117,887 174,099 79,328 Norvegia 22,282 29,578 16,632 17,334 13,460 Parmesan 1,747,474 1,743,496 1,977,305 1,988,282 2,360,071 Pecorino Romano 489,179 465,770 398,343 294,663 198,209 Provolone 118,371 81,694 121,734 141,625 133,013 Raclette 49,202 56,490 47,435 51,255 27,430 Rigatino 173 4,522 - 656 - Romano 34,766 10,326 61,567 108,466 102,289 Saint-Paulin 81,450 94,182 89,943 93,066 95,056 Samsoe 17,365 15,436 13,666 6,942 - Sardo 47,044 17,715 17,861 32,175 30,919 Sbrinz 7,470 4,718 7,027 9,819 2,297 St.Jorge 14,090 13,997 6,754 13,991 1,000 Tilsit 18,977 32,907 20,537 15,226 6,655 Trappist - 17 - - - Vize - - - - - Others 5,442,941 5,646,667 5,144,516 4,745,578 5,063,123
Total Other Naturals 15,608,381 15,635,584 15,872,111 15,586,203 15,706,596
TOTAL NATURAL 20,342,074 20,393,670 20,621,620 20,702,450 20,818,385
GRATED / POWDEREDCheddar 19,190 28,358 35,109 33,085 33,250 Mozzarella 86,103 74,515 85,005 88,200 73,672 Swiss - Emmental 109 - - 20 - Parmesan 594,513 627,461 280,528 171,800 284,080 Romano 10,147 12,155 16,618 18,570 29,357 Others 49,235 87,854 109,170 128,284 161,416
TOTAL GRATED / POWDERED 759,297 830,343 526,430 439,959 581,775
PROCESSED (NOT GRATED OR POWDERED)Blue - - - - - Cheddar 24,078 43,522 15,778 2,359 3,472 Spread 172,975 140,176 136,539 123,429 116,677 Edam 6,776 3,497 3,978 4,483 64,222 Gouda 23,922 44,434 83,414 116,627 53,059 Gruyere 105,601 127,908 65,538 89,014 48,985 Plain 94,830 56,795 97,291 126,171 75,271 Smoked 156,682 153,963 179,197 200,625 194,477 Swiss - Emmental 219,415 239,733 207,463 183,200 5,681 Other Processed 381,621 259,150 257,283 233,189 217,786
TOTAL PROCESSED 1,185,900 1,069,178 1,046,481 1,079,097 779,630
TOTAL IMPORTS 22,287,271 22,293,191 22,194,531 22,221,506 22,179,790
- Nil1
The total excludes cheese admitted under the Imports for Re-Export Program and for cruise ship markets.
Source: Global Affairs Canada
Calculations done by AAFC-AID, Market Information Section
64

2011 2012 2013 2014 2015QUANTITY (kg)
UNITED STATES 4,802,822 5,016,455 5,166,557 4,849,500 4,899,433 ITALY 4,150,584 4,392,623 4,405,703 4,203,971 4,391,082 FRANCE 4,369,291 3,828,057 3,925,615 3,752,261 3,751,122 SWITZERLAND 1,880,802 1,953,683 1,745,353 1,876,847 1,910,539 NETHERLANDS 1,776,635 1,642,272 1,650,985 1,632,130 1,612,352 NORWAY 1,450,198 1,430,715 1,467,832 1,751,488 1,533,360 DENMARK 1,177,807 1,252,306 1,164,105 1,295,445 1,308,405 UNITED KINGDOM 731,702 848,580 884,749 965,859 1,010,993 GREECE 654,015 585,153 653,248 677,341 521,822 GERMANY 398,496 488,466 485,624 439,137 355,220 IRELAND 1,549 1,457 2,597 154,845 226,342 BULGARIA 146,285 246,944 168,757 198,493 197,784 SPAIN 90,132 100,965 109,420 148,085 149,574 PORTUGAL 113,801 112,843 77,495 69,597 77,600 ISRAEL 71,929 66,716 63,035 62,504 64,877 CYPRUS 17,515 19,300 38,600 19,300 38,600 ARGENTINA 64,000 63,207 38,500 43,000 30,919 AUSTRIA 69,770 53,385 40,608 31,877 30,468 AUSTRALIA 3,963 3,040 3,133 8,037 16,707 LITHUANIA - - 26,915 13,345 16,164 JAMAICA 15,840 20,918 15,853 - 15,840 NEW ZEALAND 42,895 24,275 - - 6,576 MACEDONIA 21,000 - 18,907 16,720 5,630 BELGIUM 4,615 7,417 11,716 8,260 5,090 SWEDEN 3,357 6,521 3,349 3,338 3,221 HUNGARY 32,262 32,213 24,114 - - ICELAND 3,168 - - 126 - CROATIA 7 - - - - MEXICO 8 - - - - COLOMBIA 23 - - - - SYRIAN ARAB REPUBLIC 72,108 - - - - FINLAND 120,692 95,026 - - - JAPAN - 400 - - - OTHERS - 254 1,761 - 70 TOTAL 22,287,271 22,293,191 22,194,531 22,221,506 22,179,790- Nil
Source: Global Affairs CanadaCalculations done by AAFC-AID, Market Information Section
CHEESE IMPORTS INTO CANADA BY COUNTRY OF ORIGIN1
COUNTRY
1 The total excludes cheese admitted under the Imports for Re-Export Program and for cruise ship markets.
65

GENERAL INFORMATION66
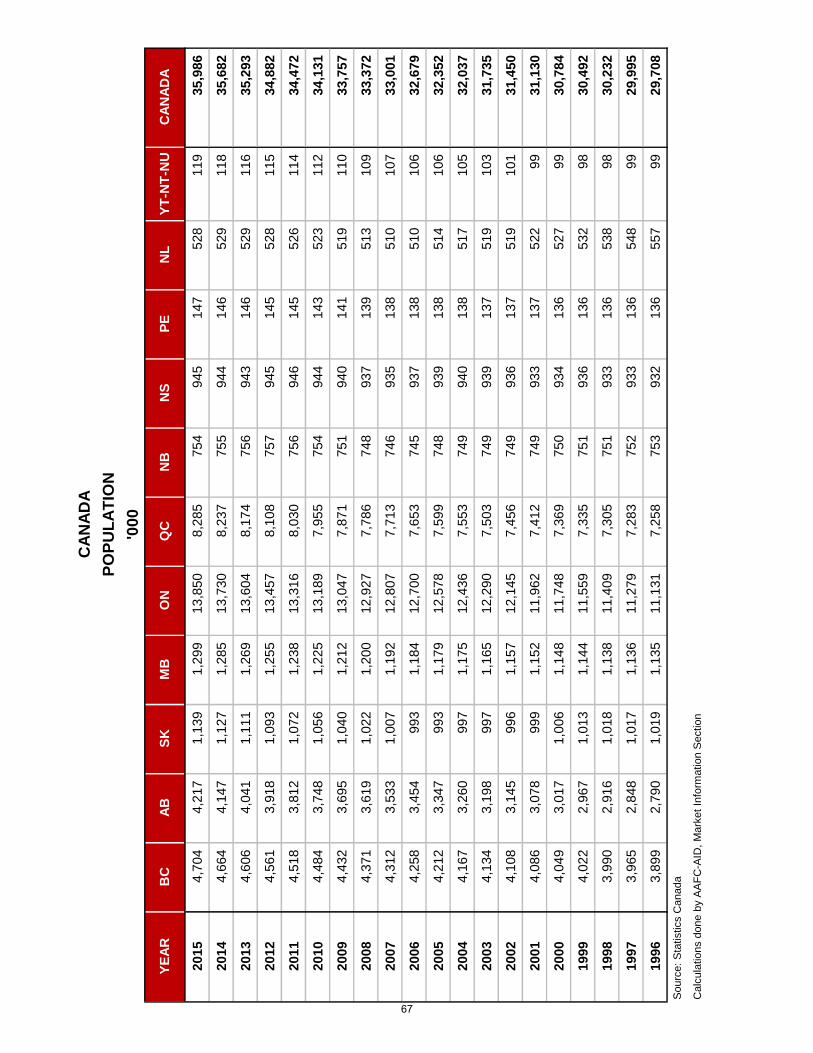
2015
4,7
04
4,2
17
1,1
39
1,2
99
13,8
50
8,2
85
754
945
147
528
119
35,9
86
2014
4,6
64
4,1
47
1,1
27
1,2
85
13,7
30
8,2
37
755
944
146
529
118
35,6
82
2013
4,6
06
4,0
41
1,1
11
1,2
69
13,6
04
8,1
74
756
943
146
529
116
35,2
93
2012
4,5
61
3,9
18
1,0
93
1,2
55
13,4
57
8,1
08
757
945
145
528
115
34,8
82
2011
4,5
18
3,8
12
1,0
72
1,2
38
13,3
16
8,0
30
756
946
145
526
114
34,4
72
2010
4,4
84
3,7
48
1,0
56
1,2
25
13,1
89
7,9
55
754
944
143
523
112
34,1
31
2009
4,4
32
3,6
95
1,0
40
1,2
12
13,0
47
7,8
71
751
940
141
519
110
33,7
57
2008
4,3
71
3,6
19
1,0
22
1,2
00
12,9
27
7,7
86
748
937
139
513
109
33,3
72
2007
4,3
12
3,5
33
1,0
07
1,1
92
12,8
07
7,7
13
746
935
138
510
107
33,0
01
2006
4,2
58
3,4
54
993
1,1
84
12,7
00
7,6
53
745
937
138
510
106
32,6
79
2005
4,2
12
3,3
47
993
1,1
79
12,5
78
7,5
99
748
939
138
514
106
32,3
52
2004
4,1
67
3,2
60
997
1,1
75
12,4
36
7,5
53
749
940
138
517
105
32,0
37
2003
4,1
34
3,1
98
997
1,1
65
12,2
90
7,5
03
749
939
137
519
103
31,7
35
2002
4,1
08
3,1
45
996
1,1
57
12,1
45
7,4
56
749
936
137
519
101
31,4
50
2001
4,0
86
3,0
78
999
1,1
52
11,9
62
7,4
12
749
933
137
522
99
31,1
30
2000
4,0
49
3,0
17
1,0
06
1,1
48
11,7
48
7,3
69
750
934
136
527
99
30,7
84
1999
4,0
22
2,9
67
1,0
13
1,1
44
11,5
59
7,3
35
751
936
136
532
98
30,4
92
1998
3,9
90
2,9
16
1,0
18
1,1
38
11,4
09
7,3
05
751
933
136
538
98
30,2
32
1997
3,9
65
2,8
48
1,0
17
1,1
36
11,2
79
7,2
83
752
933
136
548
99
29,9
95
1996
3,8
99
2,7
90
1,0
19
1,1
35
11,1
31
7,2
58
753
932
136
557
99
29,7
08
Sourc
e:
Sta
tistics C
anada
Calc
ula
tio
ns d
one b
y A
AF
C-A
ID,
Mark
et
Info
rmatio
n S
ectio
n
CA
NA
DA
PO
PU
LA
TIO
N
'00
0
BC
AB
SK
MB
ON
QC
NB
NS
PE
NL
YT
-NT
-NU
CA
NA
DA
YE
AR
67

Food ServingCalcium
(mg)Rating
MILK
Milk1 (whole, 2%, 1%, skim) 250 mL (1 cup) 315 +++
Buttermilk 250 mL (1 cup) 335 +++
Chocolate Milk 250 mL (1 cup) 297 +++
Powdered Skim Milk 24 g (3 Tbsp.) 299 +++
CHEESE
Brie 50 g (1 1/2 oz) 92 +
Camembert 50 g (1 1/2 oz) 194 ++
Feta 50 g (1 1/2 oz) 247 ++
Cottage Cheese, creamed, 2%, 1% 250 mL (1/2 cup) 224 ++
Mozzarella 50 g (1 1/2 oz) 288 +++
Mozzarella, partly skimmed 50 g (1 1/2 oz) 391 +++
Parmesan, grated 45 mL (3 Tbsp.) 210 ++
Processed Cheese, slices 2 thin (42 g) 222 ++
Processed Cheese, slices 2 regular (62 g) 342 +++
Processed Cheese, spread 45 mL (3 Tbsp.) 261 ++
Ricotta 60 mL (1/4 cup) 135 +
Ricotta, partly skimmed 60 mL (1/4 cup) 177 ++
Swiss cheese 50 g (1 1/2 oz) 395 +++
YOGURT
Plain 175 g (3/4 cup) 299 +++
Fruit-flavoured 175 g (3/4 cup) 237 ++
Frozen 125 mL (1/2 cup) 92 +
Yogurt Drink 200 mL (1 cup) 191 ++
ICE CREAM 125 mL (1/2 cup) 89 +
ICE MILK 125 mL (1/2 cup) 119 +1 Add about 100 mg of calcium for calcium-fortified milk.Rating:
+ Source of Calcium
++ Good Source of Calcium
+++ Excellent Source of Calcium
Source: Health Canada, Canadian Nutrient FileCompiled by AAFC-AID, Market Information Section
50 g (1 1/2 oz) 350 +++
CALCIUM CONTENT OF DAIRY PRODUCTS
Firm Cheese, such as Brick, Cheddar, Colby, Edam and Gouda
68
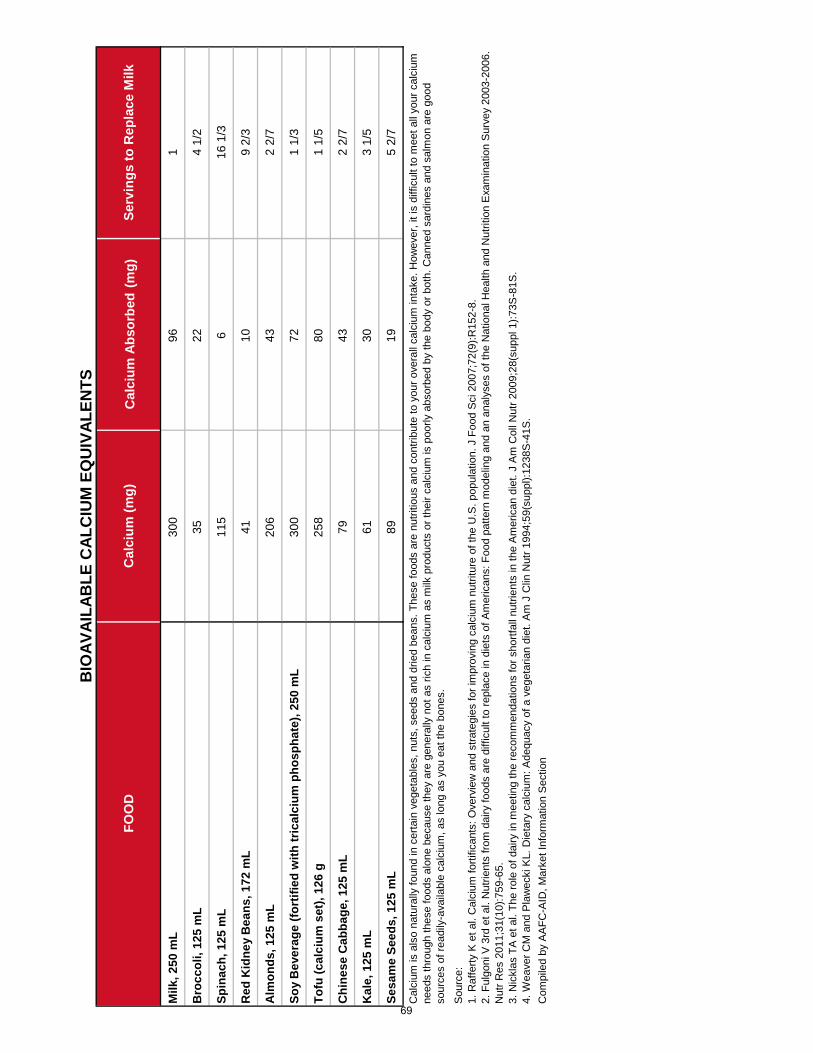
FO
OD
Cal
ciu
m (
mg
)C
alci
um
Ab
sorb
ed (m
g)
Ser
vin
gs
to R
epla
ce M
ilk
Mil
k,
25
0 m
L30
096
1
Bro
cc
oli
, 1
25
mL
3522
4 1/
2
Sp
ina
ch
, 1
25
mL
115
616
1/3
Re
d K
idn
ey
Be
an
s,
17
2 m
L41
109
2/3
Alm
on
ds
, 1
25
mL
206
432
2/7
So
y B
eve
rag
e (
fort
ifie
d w
ith
tri
ca
lciu
m p
ho
sp
ha
te),
25
0 m
L
300
721
1/3
To
fu (
ca
lciu
m s
et)
, 1
26
g25
880
1 1/
5
Ch
ine
se
Ca
bb
ag
e,
12
5 m
L79
432
2/7
Ka
le,
12
5 m
L61
303
1/5
Se
sa
me
Se
ed
s,
12
5 m
L89
195
2/7
Com
pile
d by
AA
FC-A
ID, M
arke
t Inf
orm
atio
n S
ectio
n
BIO
AV
AIL
AB
LE
CA
LC
IUM
EQ
UIV
AL
EN
TS
Cal
cium
is a
lso
natu
rally
foun
d in
cer
tain
veg
etab
les,
nut
s, s
eeds
and
drie
d be
ans.
The
se fo
ods
are
nutri
tious
and
con
tribu
te to
you
r ove
rall
calc
ium
inta
ke. H
owev
er, i
t is
diffi
cult
to m
eet a
ll yo
ur c
alci
um
need
s th
roug
h th
ese
food
s al
one
beca
use
they
are
gen
eral
ly n
ot a
s ric
h in
cal
cium
as
milk
pro
duct
s or
thei
r cal
cium
is p
oorly
abs
orbe
d by
the
body
or b
oth.
Can
ned
sard
ines
and
sal
mon
are
goo
d so
urce
s of
read
ily-a
vaila
ble
calc
ium
, as
long
as
you
eat t
he b
ones
.
Sou
rce:
1.
Raf
ferty
K e
t al.
Cal
cium
forti
fican
ts: O
verv
iew
and
stra
tegi
es fo
r im
prov
ing
calc
ium
nut
ritur
e of
the
U.S
. pop
ulat
ion.
J F
ood
Sci
200
7;72
(9):R
152-
8.2.
Ful
goni
V 3
rd e
t al.
Nut
rient
s fro
m d
airy
food
s ar
e di
fficu
lt to
repl
ace
in d
iets
of A
mer
ican
s: F
ood
patte
rn m
odel
ing
and
an a
naly
ses
of th
e N
atio
nal H
ealth
and
Nut
ritio
n E
xam
inat
ion
Sur
vey
2003
-200
6.
Nut
r Res
201
1;31
(10)
:759
-65.
3. N
ickl
as T
A e
t al.
The
role
of d
airy
in m
eetin
g th
e re
com
men
datio
ns fo
r sho
rtfal
l nut
rient
s in
the
Am
eric
an d
iet.
J A
m C
oll N
utr 2
009;
28(s
uppl
1):7
3S-8
1S.
4. W
eave
r CM
and
Pla
wec
ki K
L. D
ieta
ry c
alci
um: A
dequ
acy
of a
veg
etar
ian
diet
. Am
J C
lin N
utr 1
994;
59(s
uppl
):123
8S-4
1S.
69

Pro
du
ct
But
ter (
crea
mer
y an
d fa
rm)
Che
ddar
Che
ese1
Cre
am C
hees
eC
otta
ge C
hees
e (c
ream
y)C
onde
nsed
Milk
Eva
pora
ted
Milk
Par
tly S
kim
med
Eva
pora
ted
Milk
Who
le M
ilk P
owde
rC
ream
Pow
der
Ski
m M
ilk P
owde
rC
asei
nC
otta
ge C
hees
e (c
urd)
Lact
ose2
Whe
y P
owde
r2
1 And
oth
er fa
ctor
y ch
eese
mad
e fro
m w
hole
milk
.2 L
itres
of w
hey
requ
ired
Pro
du
ct
Un
itL
itre
s P
er
Un
itL
bs
. P
er
Un
itK
g P
er
Un
it
gallo
n4.
510
.30
4.67
quar
t1.
12.
581.
17pi
nt0.
51.
290.
58ga
llon
4.5
10.4
04.
71qu
art
1.1
2.59
1.17
pint
0.5
1.30
0.59
gallo
n4.
510
.00
4.53
quar
t1.
12.
501.
13pi
nt0.
51.
250.
57sh
ort t
on…
2,00
0.00
907.
18lo
ng to
n (U
K)
…2,
240.
001,
016.
05m
etric
tonn
e…
2,20
4.60
1,00
0.00
… N
ot a
pplic
able
1 he
ctol
itre
at 3
.6 k
g of
bf =
103
.2 k
ilogr
ams
9.7
hect
olitr
es a
t 3.6
kg
of b
f = 1
met
ric to
nC
ompi
led
by A
AFC
-AID
, Mar
ket I
nfor
mat
ion
Sec
tion
38.8
96.
8021
.39
19.4
2
2.23
2.23
1.07
7.78
20.4
210
.68
… … …
73.5
0
…
Lit
res
of
Milk
Req
uir
ed t
o P
rod
uce
1 k
g
22.7
310
.68
10.0
11.
004.
008.
008.
00
27.0
04.
00 …
CO
NV
ER
SIO
N R
AT
ES
FO
R D
AIR
Y P
RO
DU
CT
S
Who
le M
ilk
Ski
m M
ilk
Cre
am
Dai
ry P
rodu
cts
WE
IGH
T C
ON
VE
RS
ION
RA
TE
S F
OR
UN
ITS
OF
VO
LU
ME
% B
utt
erfa
t b
y W
eig
ht
81.0
034
.00
32.0
0
70

Nu
trie
nt
Flu
id M
ilk1
Ch
eese
2Y
og
urt
Fro
zen
Des
sert
s3
Oth
erT
ota
l
En
erg
y4.
80
3.92
0.
52
2.15
1.
54
12
.93
To
tal
Fa
t4.
06
7.32
0.
49
2.67
3.
24
17
.77
Sa
tura
ted
Fa
tty
Ac
ids
(S
FA
)7.
56
13.8
0
0.95
4.
98
6.00
3
3.2
9
Mo
no
un
sa
tura
ted
Fa
tty
Ac
ids
(M
UF
A)
2.53
5.
06
0.32
1.
86
2.24
1
2.0
1
Po
lyu
ns
atu
rate
d F
att
y A
cid
s (
PU
FA
)0.
76
1.27
0.
08
0.62
0.
71
3.4
3
Ch
ole
ste
rol
5.92
8.
44
0.61
3.
81
3.55
2
2.3
2
Pro
tein
9.57
6.
90
0.99
1.
09
0.94
1
9.5
0
Ca
lciu
m28
.27
15
.80
2.
73
3.07
2.
75
52
.63
Ph
os
ph
oru
s15
.27
8.
96
1.58
1.
77
1.58
2
9.1
6
Po
tas
siu
m11
.99
1.
05
1.28
1.
44
1.07
1
6.8
2
So
diu
m3.
30
5.67
0.
29
0.54
0.
32
10
.12
Ma
gn
es
ium
9.82
1.
83
0.84
1.
14
0.82
1
4.4
4
Zin
c8.
34
5.92
1.
20
1.55
0.
99
18
.00
Vit
am
in A
11.4
9
6.18
0.
30
2.30
2.
71
22
.98
Vit
am
in D
58.2
8
0.66
-
-
1.
38
60
.32
Rib
ofl
avi
n18
.61
4.
31
1.93
2.
93
1.87
2
9.6
6
Nia
cin
5.34
3.
58
0.24
0.
61
0.64
1
0.4
1
Vit
am
in B
66.
11
1.13
0.
59
0.73
0.
38
8.9
3
Vit
am
in B
12
20.0
1
4.96
2.
26
2.20
1.
44
30
.88
- N
il1 W
hole
, 2%
, 1%
and
ski
m m
ilk in
clud
ed2 A
ll va
rietie
s3
Ice
crea
m, i
ce m
ilk a
nd fr
ozen
yog
urt i
nclu
ded
Com
pile
d by
AA
FC-A
ID, M
arke
t Inf
orm
atio
n Se
ctio
n
CO
NT
RIB
UT
ION
OF
DA
IRY
PR
OD
UC
TS
TO
TH
E A
VE
RA
GE
CA
NA
DIA
N D
IET
, 2
00
1
per
cen
tag
e
Sou
rce:
Agr
icul
ture
and
Agr
i-Foo
d C
anad
a an
d H
ealth
Can
ada
calc
ulat
ions
bas
ed o
n da
ta
obta
ined
from
the
"Fam
ily F
ood
Exp
endi
ture
in C
anad
a, 2
001"
and
the
"Can
adia
n N
utrie
nt F
ile,
2001
".
71

IMPERIAL-METRIC CONVERSION RATES COMMON TO THE DAIRY INDUSTRY
Imperial Metric
1 pound 0.4536 kilogram
1 ton (2000 lb) 907.18 kilograms
2.2046 pounds 1 kilogram
2204.6 pounds 1 metric tonne (1,000 kg)
1 quart 1.136 litres
1 gallon 4.546 litres
0.8803 quart 1 litre
0.220 gallon 1 litre
22.0 gallons 1 hectolitre (100 litres)
1 quart 0.946 litre
1 gallon 3.785 litres
1.0571 quart 1 litre
0.2642 gallon 1 litre
26.42 gallons 1 hectolitre (100 litres)
Compiled by AAFC-AID, Market Information Section
=
Weight to Volume Conversion
1 hundredweight of milk at 3.5% butterfat (bf) = 0.441 hectolitre at 3.6 kg bf per hectolitre
2.26761 hundredweight at 3.5% bf = 1 hectolitre of milk at 3.6 kg bf per hectolitre
=
=
=
=
=
=
Weight
Volume
Volume (U.S.)
=
=
=
=
=
=
=
72

DA
IRY
PR
OD
UC
TS
SE
RV
ING
S
PR
OD
UC
TN
orm
al H
elp
ing
Ave
rag
e C
alci
um
Co
nte
nt
Ser
vin
g E
qu
ival
ent
Milk
(who
le, 2
%, 1
%, s
kim
, cho
cola
te)1
250
mL
(1 c
up)
315
mg
1
Milk
(eva
pora
ted,
can
ned,
und
ilute
d)12
5 m
L (1
/2 c
up)
367
mg
1
Milk
(pow
dere
d)75
mL
(1/3
cup
)29
9 m
g1
Milk
(pow
dere
d, re
cons
titut
ed)
250
mL
(1 c
up)
299
mg
1
Ch
eese
(Che
ddar
, Moz
zare
lla, S
wis
s, e
tc.)
50 g
(11/
2 oz
.)35
0 m
g1
Yo
gu
rt (p
lain
and
flav
oure
d)
175
g (3
/4 c
up)
275
mg
1
Yo
gu
rt D
rin
k20
0 m
L19
1 m
g1
Kef
ir17
5 m
L (3
/4 c
up)
187
mg
1
Pu
dd
ing
/Cu
star
d (m
ade
with
milk
)12
5 m
L (1
/2 c
up)
141
mg
1
Co
ttag
e C
hee
se25
0 m
L (1
cup
)22
4 m
g1
1 Add
abo
ut 1
00 m
g of
cal
cium
for c
alci
um fo
rtifie
d m
ilk.
Sou
rce:
Hea
lth C
anad
a, C
anad
ian
Nut
rient
File
, ver
sion
201
0C
ompi
led
by A
AFC
-AID
, Mar
ket I
nfor
mat
ion
Sec
tion
Wh
at's
a s
ervi
ng
?
One
ser
ving
of m
ilk p
rodu
cts,
as
defin
ed b
y "E
atin
g W
ell w
ith C
anad
a's
Food
Gui
de",
take
s in
to a
ccou
nt a
ll of
the
nutri
ents
foun
d in
milk
as
wel
l as
over
all c
alor
ic
cont
ribut
ion.
73
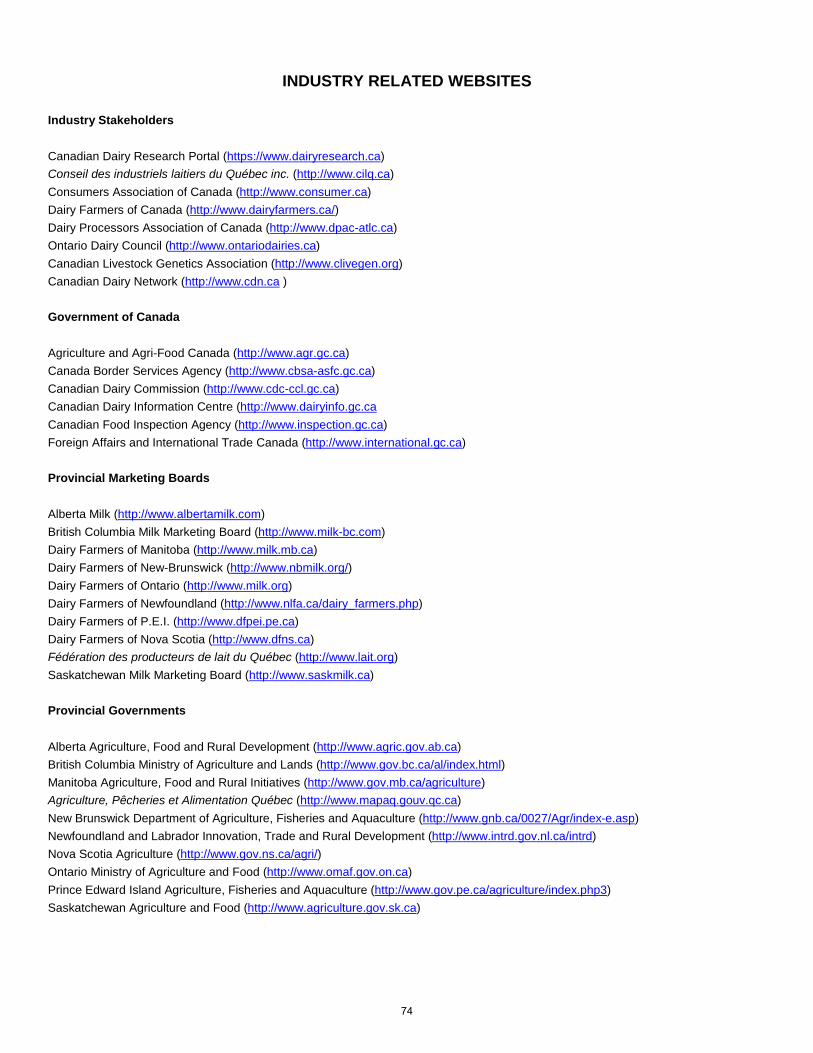
INDUSTRY RELATED WEBSITES
Industry Stakeholders
Canadian Dairy Research Portal (https://www.dairyresearch.ca) Conseil des industriels laitiers du Québec inc. (http://www.cilq.ca) Consumers Association of Canada (http://www.consumer.ca) Dairy Farmers of Canada (http://www.dairyfarmers.ca/) Dairy Processors Association of Canada (http://www.dpac-atlc.ca) Ontario Dairy Council (http://www.ontariodairies.ca) Canadian Livestock Genetics Association (http://www.clivegen.org) Canadian Dairy Network (http://www.cdn.ca )
Government of Canada
Agriculture and Agri-Food Canada (http://www.agr.gc.ca) Canada Border Services Agency (http://www.cbsa-asfc.gc.ca) Canadian Dairy Commission (http://www.cdc-ccl.gc.ca) Canadian Dairy Information Centre (http://www.dairyinfo.gc.ca Canadian Food Inspection Agency (http://www.inspection.gc.ca) Foreign Affairs and International Trade Canada (http://www.international.gc.ca) Provincial Marketing Boards
Alberta Milk (http://www.albertamilk.com) British Columbia Milk Marketing Board (http://www.milk-bc.com) Dairy Farmers of Manitoba (http://www.milk.mb.ca) Dairy Farmers of New-Brunswick (http://www.nbmilk.org/) Dairy Farmers of Ontario (http://www.milk.org) Dairy Farmers of Newfoundland (http://www.nlfa.ca/dairy_farmers.php) Dairy Farmers of P.E.I. (http://www.dfpei.pe.ca) Dairy Farmers of Nova Scotia (http://www.dfns.ca) Fédération des producteurs de lait du Québec (http://www.lait.org) Saskatchewan Milk Marketing Board (http://www.saskmilk.ca) Provincial Governments
Alberta Agriculture, Food and Rural Development (http://www.agric.gov.ab.ca) British Columbia Ministry of Agriculture and Lands (http://www.gov.bc.ca/al/index.html) Manitoba Agriculture, Food and Rural Initiatives (http://www.gov.mb.ca/agriculture) Agriculture, Pêcheries et Alimentation Québec (http://www.mapaq.gouv.qc.ca) New Brunswick Department of Agriculture, Fisheries and Aquaculture (http://www.gnb.ca/0027/Agr/index-e.asp) Newfoundland and Labrador Innovation, Trade and Rural Development (http://www.intrd.gov.nl.ca/intrd) Nova Scotia Agriculture (http://www.gov.ns.ca/agri/) Ontario Ministry of Agriculture and Food (http://www.omaf.gov.on.ca) Prince Edward Island Agriculture, Fisheries and Aquaculture (http://www.gov.pe.ca/agriculture/index.php3) Saskatchewan Agriculture and Food (http://www.agriculture.gov.sk.ca)
74