Embed Size (px)
Citation preview

SAC/361896/103560003 (CRC 2010 AMR REV 3-14-2011) iii
Contents
Section Page
1 Introduction ......................................................................................................................... 1-1 Program Administration .................................................................................................... 1-2 California Rice ...................................................................................................................... 1-2 Rice Farming’s Influence on Water Quality .................................................................... 1-3 History of Rice Water Quality Efforts .............................................................................. 1-3
RPP ........................................................................................................................... 1-3 Conditional Waiver of Waste Discharge Requirements for Rice ..................... 1-7
AMR Requirements ............................................................................................................. 1-7
2 Growing Season, Hydrology, and Applied Materials ................................................. 2-1 Rice Farming in the Sacramento Valley ........................................................................... 2-1 Hydrology ............................................................................................................................ 2-2 Applied Materials ................................................................................................................ 2-2
Pesticide Use ........................................................................................................... 2-3 Nutrient Use ............................................................................................................ 2-6
3 Management Practices ....................................................................................................... 3-1 Pesticide Use Calendar ....................................................................................................... 3-1 Role of Management Practices in Attaining Water Quality Protection ....................... 3-5
Water Holds ............................................................................................................ 3-5 Actions Taken to Address Identified Water Quality Impacts .......................... 3-5
4 Monitoring and Reporting Requirements ..................................................................... 4-1 Monitoring Purpose and Objectives ................................................................................. 4-1
CWFR ....................................................................................................................... 4-1 RPP ........................................................................................................................... 4-2
Overview of Requirements ................................................................................................ 4-2 CWFR ....................................................................................................................... 4-2 Core Monitoring ..................................................................................................... 4-4 Assessment Monitoring ......................................................................................... 4-5 Special Project Monitoring .................................................................................... 4-6 RPP ........................................................................................................................... 4-6
Monitoring Sites ................................................................................................................... 4-6 CWFR Sites .............................................................................................................. 4-7 RPP Sites .................................................................................................................. 4-7 CBD1 ...................................................................................................................... 4-11 CBD5 ...................................................................................................................... 4-11 BS1 .......................................................................................................................... 4-12 SSB .......................................................................................................................... 4-12 F ............................................................................................................................... 4-13 G .............................................................................................................................. 4-13

CONTENTS, CONTINUED
iv SAC/361896/103560003 (CRC 2010 AMR REV 3-14-2011)
H ............................................................................................................................. 4-14 SR1 .......................................................................................................................... 4-14
Schedule and Constituents .............................................................................................. 4-14 CWFR ..................................................................................................................... 4-15 RPP ......................................................................................................................... 4-16 2010 Monitoring Calendar .................................................................................. 4-16
Administration and Execution ........................................................................................ 4-17 Sampling Procedures ........................................................................................................ 4-17
Field Measurements ............................................................................................ 4-17 Grab Samples ........................................................................................................ 4-18 Sample Custody and Documentation ............................................................... 4-18 Sample Delivery and Analysis ........................................................................... 4-19
5 2010 Monitoring ................................................................................................................. 5-1 CWFR Monitoring ............................................................................................................... 5-1
Sampling Schedule ................................................................................................ 5-1 Field Parameter Results ........................................................................................ 5-1 Lab Parameter Results ......................................................................................... 5-19 2010 Flow Data ..................................................................................................... 5-23 Dissolved Copper and Hardness Analysis ....................................................... 5-23 Management Plans............................................................................................... 5-25
RPP Monitoring ................................................................................................................. 5-26 RPP Performance Goals ...................................................................................... 5-27 Water Holds .......................................................................................................... 5-27 Pesticides Monitored ........................................................................................... 5-28 Sampling Schedule .............................................................................................. 5-28 Sample Collection, Delivery, and Analysis ...................................................... 5-28 Results .................................................................................................................... 5-29
6 Review of Quality Assurance/Quality Control ............................................................ 6-1 Internal QC........................................................................................................................... 6-1
Field QA/QC Samples .......................................................................................... 6-2 Laboratory QA/QC Samples ............................................................................... 6-2
Quality Assurance Objectives ........................................................................................... 6-3 Precision .................................................................................................................. 6-3 Accuracy .................................................................................................................. 6-4 Representativeness ................................................................................................ 6-4 Comparability ......................................................................................................... 6-4 Completeness .......................................................................................................... 6-5
CWFR QA/QC Sample Results and Analysis ................................................................ 6-5 Field QA/QC Samples .......................................................................................... 6-6 Laboratory QA/QC Samples ............................................................................... 6-8 Analysis of Precision ........................................................................................... 6-10 Analysis of Accuracy ........................................................................................... 6-13 Analysis Summary ............................................................................................... 6-13
RPP QA/QC Sample Results and Analysis .................................................................. 6-13 Field QA/QC Samples ........................................................................................ 6-14 Laboratory QA/QC Samples ............................................................................. 6-16

CONTENTS, CONTINUED
SAC/361896/103560003 (CRC 2010 AMR REV 3-14-2011) v
Analysis of Precision ............................................................................................ 6-17 Analysis of Accuracy ........................................................................................... 6-18 Analysis Summary ............................................................................................... 6-18
Chains of Custody ............................................................................................................. 6-19
7 Summary and Recommendations ................................................................................... 7-1 CWFR .................................................................................................................................... 7-1
Assessment of the 2010 CWFR Program ............................................................. 7-2 CWFR Recommendations for 2011 ...................................................................... 7-4
RPP ........................................................................................................................................ 7-4 Assessment of the 2009 RPP Program ................................................................. 7-5 RPP Recommendations for 2010 .......................................................................... 7-6
8 References ............................................................................................................................ 8-1
Tables
1-1 Location of Required AMR Information in this Report ................................................. 1-8
2-1 Herbicides: Acres Treated, Sacramento Valley, 2010 ..................................................... 2-7 2-2 Herbicides: Pounds Applied, Sacramento Valley, 2010 ................................................. 2-7 2-3 Insecticides: Acres Treated, Sacramento Valley, 2010 .................................................... 2-9 2-4 Insecticides: Pounds Applied, Sacramento Valley, 2010................................................ 2-9 2-5 Fungicides: Acres Treated, Sacramento Valley, 2010 ................................................... 2-10 2-6 Fungicides: Pounds Applied, Sacramento Valley, 2010 ............................................... 2-10 2-7 Acres Treated with Molinate and Thiobencarb, 2006 through 2010 .......................... 2-11 2-8 Pounds of Molinate and Thiobencarb Applied, 2006 through 2010 ........................... 2-12 2-9 Range of Fertilizer Components Applied to Rice ......................................................... 2-13
3-1 Timing of Specific Rice Herbicide Applications ............................................................. 3-2 3-2 Examples of the Timing of Herbicide Tank Mix Combinations as Provided by
Dr. Albert Fischer, UC Davis ............................................................................................. 3-3 3-3 Timing of Specific Rice Insecticide Applications ............................................................ 3-3 3-4 Timing of Sequential Rice Herbicide Applications ......................................................... 3-4 3-5 Water Hold Requirements in Days for Thiobencarb ...................................................... 3-6 3-6 Hold Times for Insecticides, Fungicides, and Herbicides Not Covered by RPP ........ 3-7 3-7 Thiobencarb Water Seepage Inspections in 2010 .......................................................... 3-10 3-8 Thiobencarb Water Hold, Application, and Mix/Load Inspections in 2010 ............ 3-11
4-1 Assessment and Core Monitoring Cyclea......................................................................... 4-4 4-2 2010 CWFR and RPP Monitoring Sites ............................................................................. 4-6 4-3 CWFR Monitoring Requirements, 2010 ......................................................................... 4-15 4-4 RPP Monitoring and Reporting Requirements, 2010 ................................................... 4-16 4-5 Analytical Laboratories and Methods, 2010 .................................................................. 4-21

CONTENTS, CONTINUED
vi SAC/361896/103560003 (CRC 2010 AMR REV 3-14-2011)
Tables (continued)
5-1 2010 Sampling Calendar .................................................................................................... 5-2 5-2 Field Temperature Measurements—Tabulated Results, 2010 (RPP results
included to provide additional monitoring information) ............................................. 5-5 5-3 Dissolved Oxygen Field Measurements—Tabulated Results, 2010 (RPP results
included to provide additional monitoring information) ............................................... 5-7 5-4 pH Field Measurements—Tabulated Results, 2010 ..................................................... 5-11 5-5 Electrical Conductivity Field Measurements—Tabulated Results, 2010 .................. 5-15 5-6 Turbidity Field Results—Tabulated Results, 2010 ......................................................... 5-17 5-7 TDS Lab Results —Tabulated Results, 2010 .................................................................. 5-21 5-8 TOC Lab Results —Tabulated Results, 2010 ................................................................. 5-22 5-9 Flow Data for the 2010 Monitoring Season ................................................................... 5-23 5-10 2010 Copper and Hardness Results ................................................................................ 5-24 5-11 Hardness adjusted CTR Copper Water Quality Criteria (1h and 4 day maximum) 5-24 5-12 2010 Propanil Monitoring Results .................................................................................. 5-26 5-13 Basin Plan Performance Goals for the Five RPP Pesticides ........................................ 5-27 5-14 RPP Sampling Schedule, 2010 ......................................................................................... 5-28 5-15 Summary of Detections (RPP and City Monitoring), 2010 ......................................... 5-29 5-16 Thiobencarb Monitoring Results, RPP 2010 .................................................................. 5-31 5-17 Cities of Sacramento and West Sacramento Thiobencarb Results, 2010 ................... 5-33
6-1 CWFR Field QA/QC Samples, 2010................................................................................. 6-6 6-2 2010 CWFR Field Blank and Field Duplicate Results .................................................... 6-7 6-3 2010 CWFR Method Blank Results ................................................................................... 6-8 6-4 2010 Laboratory MS/MSD Samples ................................................................................. 6-9 6-5 2010 CWFR Lab Control Spikes (LCS) ........................................................................... 6-10 6-6 2010 CWFR Surrogate Standard Sample Results ......................................................... 6-11 6-7 QA/QC Samples, RPP 2010 ............................................................................................. 6-13 6-8 2010 RPP Comparison of Rinse Blank Samples to Primary Samples ........................ 6-14 6-9 2010 RPP Field Duplicate Results ................................................................................... 6-14 6-10 Matrix Spike Sample Results, RPP 2010 ........................................................................ 6-15 6-11 Method Blank Results (MAI and CLS), RPP 2010 ........................................................ 6-16 6-12 Surrogate Standard Results, RPP 2010 ........................................................................... 6-17 Figures
1-1 Sacramento Valley Rice Acres, 2010 ................................................................................. 1-5
2-1 Key Events in a Typical Rice Year .................................................................................... 2-2 2-2 2010 Flow and Precipitation Data ..................................................................................... 2-4 2-3 2010 Daily Maximum and Minimum Air Temperatures .............................................. 2-5
3-1 Rice Growth Stages ............................................................................................................. 3-1
4-1 2010 CWFR Assessment and Core Monitoring Sites and RPP Monitoring Sites ....... 4-9
CONTENTS, CONTINUED
SAC/361896/103560003 (CRC 2010 AMR REV 3-14-2011) vii
Figures (continued)
5-1 Field Temperature Measurements, 2010 .......................................................................... 5-3 5-2 Dissolved Oxygen Field Measurements, 2010 ................................................................. 5-4 5-3 Oxygen Solubility as a Function of Temperature ........................................................... 5-9 5-4 pH Field Measurements, 2010 ......................................................................................... 5-10 5-5 Electrical Conductivity Field Measurements, 2010....................................................... 5-13 5-6 Turbidity Field Measurements, 2010 .............................................................................. 5-14 5-7 TDS Results, 2010 .............................................................................................................. 5-19 5-8 TOC Results, 2010 .............................................................................................................. 5-20 5-9 Thiobencarb Results, RPP, 2010 ....................................................................................... 5-30
Photos
1 CBD1: Colusa Basin Drain #1 .......................................................................................... 4-11 2 CBD5: Colusa Basin Drain #5 .......................................................................................... 4-11 3 BS1: Butte Slough #1 ......................................................................................................... 4-12 4 SSB: Sacramento Slough Bridge....................................................................................... 4-12 5 F: Lurline Creek ................................................................................................................. 4-13 6 G: Cherokee Canal ............................................................................................................. 4-13 7 H: Obanion Outfall ............................................................................................................ 4-14 8 SR1: Sacramento River Village Marina ........................................................................... 4-14


SAC/361896/103560003 (CRC 2010 AMR REV 3-14-2011) 1-1
CHAPTER 1
Introduction
The California Rice Commission (CRC) is a statutory organization representing about 2,500 rice farmers who farm approximately 500,000 acres of California farmland. Rice is one of the top 20 crops produced in California, and adds nearly a half billion dollars in revenue and thousands of jobs vital to the state’s economy. The California rice industry contributes significantly to the foundation of many rural economies and the positive balance of international trade. Rice produced in the United States provides 1.5 to 2 percent of global production, competes in the global market, and constitutes a large proportion of internationally traded medium-grain (north Asian) rice.
The CRC implements water quality monitoring and reporting activities in compliance with the following two programs of the Central Valley Regional Water Quality Control Board (CVRWQCB):
Conditional Waiver for Rice (CWFR) monitoring and reporting, a rice-specific Monitoring and Reporting Program (MRP) under the CVRWQCB’s Conditional Waiver of Waste Discharge Requirements for Discharges from Irrigated Lands
Rice Pesticides Program (RPP) monitoring and reporting, pursuant to the Conditional Prohibition of Discharge requirements specified in the Water Quality Control Plan for the Sacramento and San Joaquin River Basins (Basin Plan).
This report serves as the 2010 Annual Monitoring Report (AMR) for both the CWFR and RPP efforts, and describes the CRC-conducted program activities for the calendar year 2010.
Key CWFR activities include the following:
Reporting of rice acreage information
Reporting of rice pesticide use information
Water quality monitoring
Toxicity testing
Laboratory coordination
Laboratory analysis and reporting
Data validation and review
Coordination of early-season data submittals between the County Agricultural Commissioners (CACs) and the California Department of Pesticide Regulation (DPR)
Interaction with pesticide registrants to support the development of reduced-risk pesticides
Annual reporting and review

CHAPTER 1: INTRODUCTION
1-2 SAC/361896/103560003 (CRC 2010 AMR REV 3-14-2011)
Key RPP activities include the following:
Reporting of rice acreage information
Reporting of rice pesticide use information
Water quality monitoring
Laboratory coordination
Laboratory analysis and reporting
Data validation and review
Coordination of early-season data submittals between the CACs and the DPR
Pesticide use compliance inspections and enforcement
Communications with the City of Sacramento and City of West Sacramento, enhanced through the activities of the Storm Event Work Group
Interaction with pesticide registrants to support the development of reduced-risk pesticides
Triennial reporting and review
Program Administration The CRC has long been recognized by the CVRWQCB as an entity with the authority and capacity to implement water quality program activities to achieve water quality protection. The CRC is a statutory organization with authorities and restrictions as established in the California Food and Agricultural Code. In July 2003, the CRC was issued a Notice of Applicability (NOA) as a watershed coalition under the CVRWQCB’s Conditional Waiver for Discharges from Irrigated Lands and has implemented rice-specific program activities since then.
Kleinfelder was contracted by the CRC to collect water samples at specified sites to obtain data to characterize water quality. CH2M HILL prepared this AMR under contract to the CRC.
California Rice Rice is grown in nine Sacramento Valley counties (Butte, Colusa, Glenn, Placer, Sacramento, Sutter, Tehama, Yolo, and Yuba). Rice is also farmed in counties outside the Sacramento Valley; however, the acreages are generally small and rice is not the dominant crop in these areas. For the purposes of the rice-specific MRP, the monitoring area is defined as the nine rice-producing counties in the Sacramento Valley.
Rice fields provide numerous environmental and commercial advantages that no alternative land use would, including a variety of upland and shallow aquatic habitat. In their efforts to reduce rice straw burning and to improve wildlife habitat, rice farmers routinely flood their

CHAPTER 1: INTRODUCTION
SAC/361896/103560003 (CRC 2010 AMR REV 3-14-2011) 1-3
fields in the winter (when no rice is present) to degrade the straw and reduce the need for rice straw burning.
Rice farming requires flooded field conditions that contribute to favorable habitat conditions. More than 230 species of wildlife and millions of migratory waterfowl thrive in California rice fields. In 2003, California rice lands were designated as shorebird habitat of international significance by the Manomet Center for Conservation Sciences in partnership with the Western Hemisphere Shorebird Reserve Network.
In 2010, an estimated 565,531 acres of rice (as reported by the CACs) were planted in the nine rice-growing counties of the Sacramento Valley.1 The CAC acreage numbers are usually higher than actual planted acres because of accounting through pesticide applications; multiple applications on single acres can result in double counting of acreage under the CAC method. Figure 1-1 shows the distribution of acreage within the Sacramento Valley (as reported by the CACs). The U.S. Department of Agriculture, National Agricultural Statistics Services no longer provides current year acreage estimates; they now produce an annual report that will be available in June 2011.
Rice Farming’s Influence on Water Quality Because rice is farmed in standing water, the importance of good farming practices to water quality is evident. However, water quality problems associated with other crops and locales (such as soil erosion and sediment transport, saline drainage waters, and high concentrations of trace elements in subsurface drainage) are typically not problems associated with rice drainage. The generally slow rate of flow through rice fields and the controlled rate of water release tend to minimize significant soil erosion. With regard to salinity, much of the water used to irrigate rice fields initially has a low salt concentration and there is little possibility for salt accumulation in a continuously flooded system, so salt concentration in return flows is usually relatively low.
History of Rice Water Quality Efforts The CRC has undertaken water quality management activities since the 1980s. The efforts began under the RPP and, beginning in 2004, included efforts under the CWFR. A description of the historical context of rice water quality management efforts in the Sacramento Valley follows.
RPP A rice pesticide regulatory program has been in place since the 1980s. Implementation of the program included a proactive, industry-led effort to meet water quality objectives. The rice industry not only met the challenge, but also created an example for other commodity groups and coalitions to follow.
In the early 1980s, fish losses occurred in Sacramento Valley agricultural drains dominated by rice drainage. Because of these losses, the California Department of Fish and Game
1 Figures from the National Agricultural Statistics Service (NASS) have been provided in previous years. NASS was contacted and it reported that county level figures will be available in June 2011.

CHAPTER 1: INTRODUCTION
1-4 SAC/361896/103560003 (CRC 2010 AMR REV 3-14-2011)
(DFG) conducted investigations that indicated molinate was responsible for some fish losses. In response, increased in-field holding times for irrigation waters containing molinate were implemented, and no additional fish losses have been documented since June 1983. At approximately the same time, monitoring studies found that thiobencarb concentrations as low as 1 microgram per liter (µg/L) at the city intakes resulted in increases in water taste complaints from people whose drinking water was supplied by the Sacramento River downstream of agricultural drain inputs.
CVRWQCB monitoring studies in the early 1980s determined that molinate, thiobencarb, carbofuran, malathion, and methyl parathion were present in agricultural drains dominated by rice drainage. As a result of studies and chemical monitoring in the early 1980s, the rice industry worked collaboratively with the registrants, CACs, Rice Research Board, University of California (UC) at Davis, UC Cooperative Extension, DFG, CVRWQCB, State Water Resources Control Board (SWRCB), and the California Department of Food and Agriculture (now DPR) initiated the Rice Pesticide Control program, the precursor to today’s RPP, in 1984 to manage and regulate the discharge of pesticides from rice fields.
Findings by DFG and the CVRWQCB further moved the SWRCB to contract for scientific studies to develop a toxicity database and to suggest limits for pesticide levels in the Sacramento Valley’s rivers and agricultural drains.
A review of information on the effects of molinate and thiobencarb was conducted by the SWRCB (1984). This review was used to develop specific water quality criteria and performance goals for those pesticides. In 1990, the CVRWQCB amended the Basin Plan for the Central Valley Region to include a conditional prohibition of discharge for irrigation return flows containing molinate and thiobencarb, and in 1991, carbofuran, malathion, and methyl parathion. The conditional prohibition of discharge required thata CVRWQCB-approved management practice be followed as a condition of pesticide discharge. Proposed management practices are intended to control pesticide concentrations in return flows from rice fields so that specific performance goals are met.
Environmental monitoring in the RPP was among the most intense ever undertaken by California’s agricultural producers and resulted in a substantial knowledge base regarding the movement of rice pesticides in the Sacramento Valley. Through the implementation of industry-wide Best Management Practices (BMPs), the rice industry has been successful in meeting water quality performance goals set by the CVRWQCB.
The RPP undergoes annual CVRWQCB review, at which time the CVRWQCB considers re-certifying the program through Board approval of management practices. Annual reports are due to the CVRWQCB each December.
It is noted that the 2010 RPP includes only thiobencarb, pursuant to CVRWQCB Resolution No. R5-2010-9001. Of the five rice pesticides originally specified in the Basin Plan performance goals, a review of water quality data and pesticide use trends indicates that only thiobencarb is still used on rice in quantities that could potentially result in exceedances of performance goals or water quality objectives, absent implementation of CVRWQCB-approved management practices.
This is the fourth year that the CRC has submitted a single report combining information for the CWFR and RPP programs.

SAC/361896/103560003 (CRC 2010 AMR REV 3-14-2011) 1-5
FIGURE 1-1 Sacramento Valley Rice Acres, 2010


CHAPTER 1: INTRODUCTION
SAC/361896/103560003 (CRC 2010 AMR REV 3-14-2011) 1-7
Conditional Waiver of Waste Discharge Requirements for Rice The CRC was granted an NOA to serve as a watershed coalition group under the CVRWQCB Resolution R5-2003-0105, Conditional Waiver of Waste Discharge Requirements for Discharges from Irrigated Lands within the Central Valley (Irrigated Lands Conditional Waiver) and Monitoring and Reporting Program Order No. R5-2003-0826 (MRP Order).
In October 2004, the CRC submitted a technical report entitled Basis for Water Quality Monitoring Program: Conditional Waiver of Waste Discharge Requirements for Discharges from Irrigated Lands for Rice (CWFR) to the CVRWQCB. The report served as the basis for the CVRWQCB’s rice-specific MRP. The report presented mapping information, including subwatersheds and drainages, rice acreage, and hydrography (lakes, reservoirs, rivers, creeks, canals, and drains); an overview of rice cultural practices; information on the usage and a review of historical data for pesticides and nutrients; a discussion of other potential constituents of concern; a proposed future rice-specific sampling program, including sample locations, sample parameters, and sample timing; and a discussion of the framework for future program review. The geographic and historical data were analyzed and employed to select appropriate water quality monitoring sites. Specifically, the report included information on the following subjects:
Study area Rice pesticide use and water quality data Nutrient use and water quality data Copper use and water quality data Proposed future sampling Framework for program review and update
AMR Requirements The AMR for the CWFR program is to be submitted by December 31 of each year. The AMR is to include the following components:
1. Title page
2. Table of contents
3. Description of the watershed
4. Monitoring objectives
5. Sample site descriptions
6. Location map of sampling sites and land use
7. Tabulated results of analyses
8. Sampling and analytical methods used
9. Copies of chains of custody
10. Associated laboratory and field quality control sample results

CHAPTER 1: INTRODUCTION
1-8 SAC/361896/103560003 (CRC 2010 AMR REV 3-14-2011)
11. Summary of precision and accuracy
12. Pesticide use information
13. Data interpretation, including an assessment of data quality objectives
14. Summary of management practices used
15. Actions taken to address water quality impacts identified, including but not limited to revised or additional management practices to be implemented
16. Communication reports
17. Conclusions and recommendations
Table 1-1 shows the location of each piece of the required above listed information within this report.
TABLE 1-1 Location of Required AMR Information in this Report
Required Information Location in this Report
Table of contents Page iii
Description of the watershed Chapter 2
Monitoring objectives Chapter 4
Sample site descriptions Chapter 4
Location map of sampling sites and land use Appendix A
Tabulated results of analyses Chapter 5
Sampling and analytical methods used Chapter 4
Copies of chains of custody Appendixes B and C
Associated laboratory and field quality control sample results Appendixes B and C
Summary of precision and accuracy Chapter 6
Pesticide use information Chapter 2
Data interpretation, including an assessment of data quality objectives Chapter 5
Summary of management practices used Chapter 3
Actions taken to address water quality impacts identified, including but not limited to revised or additional management practices to be implemented
Chapter 3
Communication reports The information herein supersedes the communication reports.
Conclusions and recommendations Chapter 7
Field documentation Appendixes B and C
Laboratory original data Appendixes B and C
Summary of field conditions, including a description of the weather, rainfall, stream flow, color of the water, odor, and other relevant information that can help in data interpretation
Chapter 2 and field sheets
SAC/361896/103560003 (CRC 2010 AMR REV 3-14-2011) 2-1
CHAPTER 2
Growing Season, Hydrology, and Applied Materials
The rice water quality monitoring programs are based on a thorough understanding of how rice is grown in the Sacramento Valley, including key events such as irrigation, drainage, and runoff, and an understanding of when and how products such as pesticides and nutrients are applied. Hydrologic conditions during the year can also influence the timing of key events. This chapter includes descriptions of the “typical” Sacramento Valley rice farming calendar and the 2010 rice growing season (including 2010 Sacramento River hydrology), and includes data on the materials applied to rice during the 2010 growing season.
Rice Farming in the Sacramento Valley Most California rice is produced by direct seeding into standing water, and a continuous flood is maintained for most of the season. Limited acreage is drill seeded (planted with ground equipment), which also uses permanent flood after stand establishment. Key events in the rice farming cycle are:
Field preparation Planting Fertilizer application Pesticide application Irrigation Drainage Harvest Winter flood-up Winter drainage
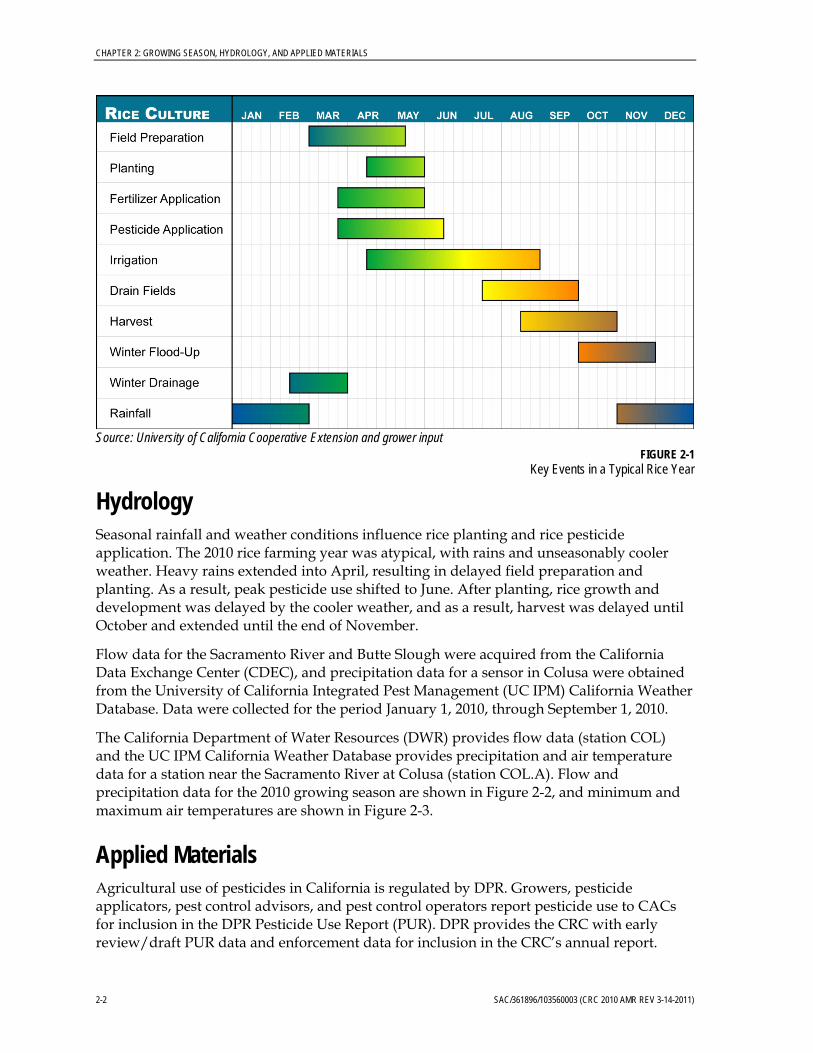
Figure 2-1 illustrates the timeline for these key events.
CHAPTER 2: GROWING SEASON, HYDROLOGY, AND APPLIED MATERIALS
2-2 SAC/361896/103560003 (CRC 2010 AMR REV 3-14-2011)
Source: University of California Cooperative Extension and grower input
FIGURE 2-1 Key Events in a Typical Rice Year
Hydrology Seasonal rainfall and weather conditions influence rice planting and rice pesticide application. The 2010 rice farming year was atypical, with rains and unseasonably cooler weather. Heavy rains extended into April, resulting in delayed field preparation and planting. As a result, peak pesticide use shifted to June. After planting, rice growth and development was delayed by the cooler weather, and as a result, harvest was delayed until October and extended until the end of November.
Flow data for the Sacramento River and Butte Slough were acquired from the California Data Exchange Center (CDEC), and precipitation data for a sensor in Colusa were obtained from the University of California Integrated Pest Management (UC IPM) California Weather Database. Data were collected for the period January 1, 2010, through September 1, 2010.
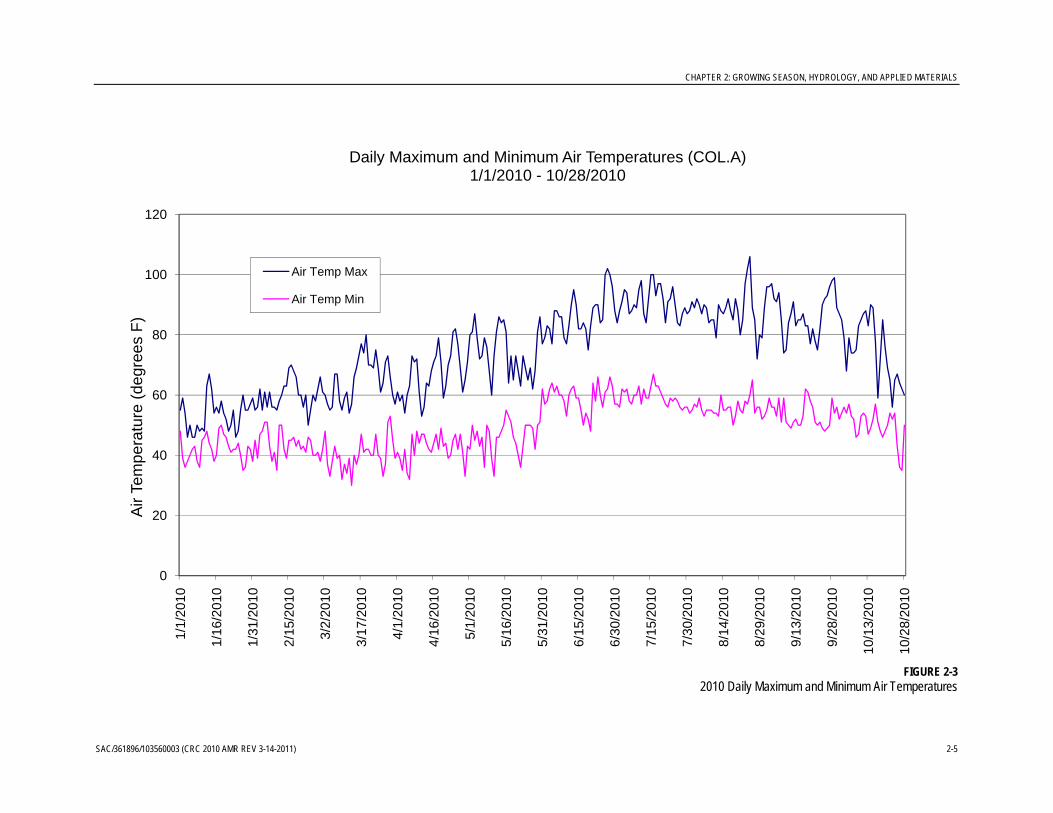
The California Department of Water Resources (DWR) provides flow data (station COL) and the UC IPM California Weather Database provides precipitation and air temperature data for a station near the Sacramento River at Colusa (station COL.A). Flow and precipitation data for the 2010 growing season are shown in Figure 2-2, and minimum and maximum air temperatures are shown in Figure 2-3.
Applied Materials Agricultural use of pesticides in California is regulated by DPR. Growers, pesticide applicators, pest control advisors, and pest control operators report pesticide use to CACs for inclusion in the DPR Pesticide Use Report (PUR). DPR provides the CRC with early review/draft PUR data and enforcement data for inclusion in the CRC’s annual report.

CHAPTER 2: GROWING SEASON, HYDROLOGY, AND APPLIED MATERIALS
SAC/361896/103560003 (CRC 2010 AMR REV 3-14-2011) 2-3
Data presented in the following discussions of pesticide use and nutrient application are usage data for the Sacramento Valley rice-growing counties.
Pesticide Use The pesticides with acreage increases in 2010 were bensulfuron-methyl (+22,878 ac), bispyribac-sodium (+15,861 ac), clomazone (+57,514 ac), cyhalofop-butyl (+10,387 ac), penoxsulam (+57,943 ac), propanil (+37,207 ac), thiobencarb (+11,505 ac), triclopyr TEA (+37,734 ac), diflubenzuron (+414 ac), and lambda cyhalothrin (+32,881 ac).
The pesticides with acreage decreases in 2010 were carfentrazone-ethyl (-1,583 ac), molinate (-824 ac), (s)-cypermethrin (-8,567 ac), malathion (-60 ac), azoxystrobin (-31,722 ac), propiconazile (-2,888 ac), and trifloxystrobin (-2,888 ac).
Treated acreage has a direct correlation to pounds of active ingredient applied. Planted acreage in 2010 (565,531 acres [CACs]) decreased by 3,789 acres, or approximately 0.7 percent, from 2009 (569,320 acres [CACs]).
Tables 2-1 and 2-2 show the Sacramento Valley rice acres treated and pounds applied, respectively, with herbicides. Tables 2-3 and 2-4 show the Sacramento Valley rice acres treated and pounds applied, respectively, with insecticides. Tables 2-5 and 2-6 show the Sacramento Valley rice acres treated and pounds applied, respectively, with fungicides. Sacramento Valley acres treated with thiobencarb for the time period 2006 through 2010 are listed in Table 2-7, and pounds of thiobencarb applied during this same time are listed in Table 2-8.

CHAPTER 2: GROWING SEASON, HYDROLOGY, AND APPLIED MATERIALS
2-4 SAC/361896/103560003 (CRC 2010 AMR REV 3-14-2011)
FIGURE 2-2
2010 Flow and Precipitation Data
0
0.2
0.4
0.6
0.8
1
1.2
1.4
1.6
0
5000
10000
15000
20000
25000
30000
35000
40000
45000
1/1/
2010
1/16
/201
0
1/31
/201
0
2/15
/201
0
3/2/
2010
3/17
/201
0
4/1/
2010
4/16
/201
0
5/1/
2010
5/16
/201
0
5/31
/201
0
6/15
/201
0
6/30
/201
0
7/15
/201
0
7/30
/201
0
8/14
/201
0
8/29
/201
0
9/13
/201
0
9/28
/201
0
10/1
3/20
10
10/2
8/20
10
Dai
ly P
reci
pita
tion
(inch
es)
Flo
w (
cubi
c fe
et p
er s
econ
d)Sacramento River Flow at Colusa (COL)
Precipitation at Colusa (COL.A) 1/1/2010 - 10/28/2010
Flow
Precip
CHAPTER 2: GROWING SEASON, HYDROLOGY, AND APPLIED MATERIALS
SAC/361896/103560003 (CRC 2010 AMR REV 3-14-2011) 2-5
FIGURE 2-3
2010 Daily Maximum and Minimum Air Temperatures
0
20
40
60
80
100
120
1/1/
2010
1/16
/201
0
1/31
/201
0
2/15
/201
0
3/2/
2010
3/17
/201
0
4/1/
2010
4/16
/201
0
5/1/
2010
5/16
/201
0
5/31
/201
0
6/15
/201
0
6/30
/201
0
7/15
/201
0
7/30
/201
0
8/14
/201
0
8/29
/201
0
9/13
/201
0
9/28
/201
0
10/1
3/20
10
10/2
8/20
10
Air
Tem
pera
ture
(de
gree
s F
)Daily Maximum and Minimum Air Temperatures (COL.A)
1/1/2010 - 10/28/2010
Air Temp Max
Air Temp Min

CHAPTER 2: GROWING SEASON, HYDROLOGY, AND APPLIED MATERIALS
2-6 SAC/361896/103560003 (CRC 2010 AMR REV 3-14-2011)
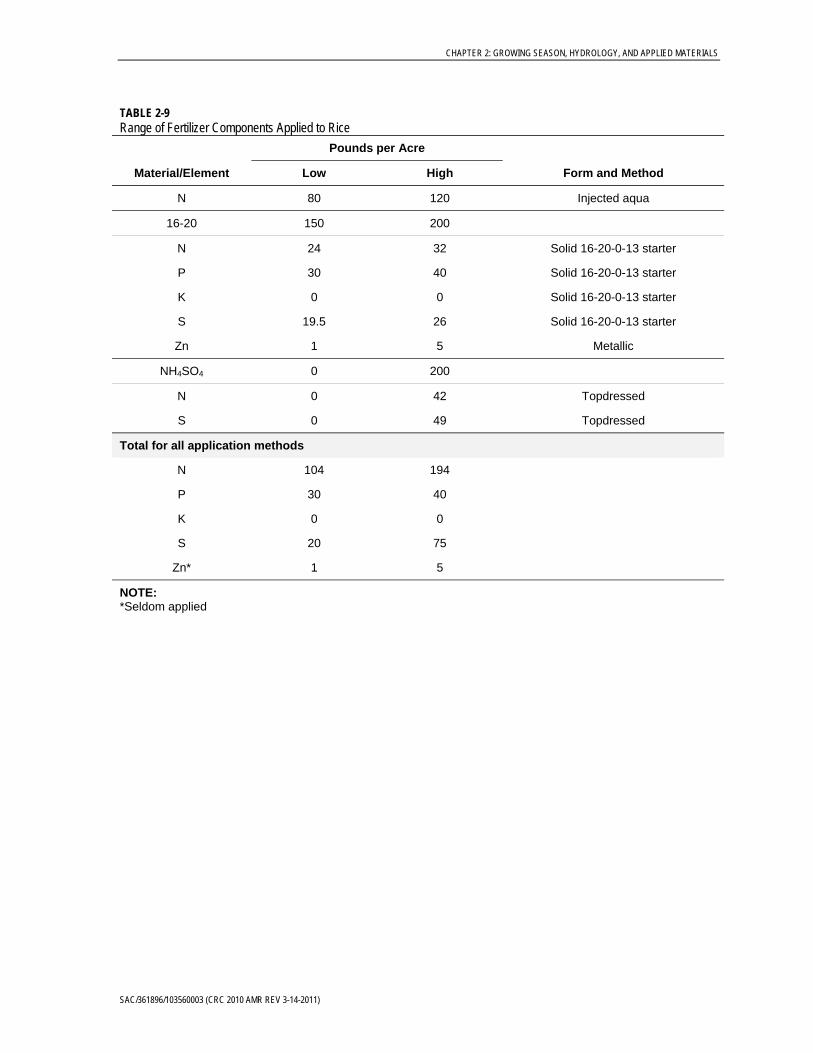
Nutrient Use Like most other farmland, rice acreage is fertilized annually. Fertilizer suppliers are the best source of information regarding the rates of fertilizer application. Suppliers were consulted to determine the range of fertilizer rates commonly applied to rice in the Sacramento Valley. The information obtained from the suppliers is summarized in Table 2-9. The table shows that fertilizer may be applied to rice before planting (granular starter, aqua ammonia, zinc) and later in the season (topdressing). The totals for the high and low ends of the reported range are shown for each element in the lower section of Table 2-9.
Nitrogen (N) is essential for all commercial rice production in California. The general rate is 120 to 150 pounds per acre. Specific N requirements vary with soil type, variety, cropping history, planting date, herbicide used, and the kind and amount of crop residue incorporated during seedbed preparation. Winter flooding for straw decomposition and waterfowl management has greatly reduced N use in some rice fields. Most N is applied preplant and either soil incorporated or injected 2 to 4 inches before flooding. Some N may be topdressed mid-season (panicle differentiation) to correct deficiencies and maintain plant growth and yield.
Phosphorus (P) is applied at a rate of 18 to 26 pounds per acre and is incorporated into the seedbed before flooding. Most rice fields are above a critical need for P and do not require repeated use of this fertilizer. Phosphate fertilizer also may be topdressed when a deficiency occurs, usually in the early seedling stage.
Potassium (K) is generally unnecessary in California.
Zinc (Zn) deficiency or “alkali disease” is common in alkaline soils and areas where topsoil has been removed. If Zn is used, the rate is 2 to 16 pounds per acre at preflood, and it is not incorporated into the soil. Zinc deficiencies most commonly occur in cool weather during stand establishment (early season).
Iron deficiency is rare in California and can usually be corrected by lowering the soil pH.

CHAPTER 2: GROWING SEASON, HYDROLOGY, AND APPLIED MATERIALS
SAC/361896/103560003 (CRC 2010 AMR REV 3-14-2011) 2-7
TABLE 2-1 Herbicides: Acres Treated, Sacramento Valley, 2010
County
Acres Treated
Bensulfuron-methyl
Bispyribac-sodium
Carfentrazone-ethyl Clomazone
Cyhalofop-butyl Molinate Penoxsulam Propanil Thiobencarb
Triclopyr TEA
Butte 17,080 18,893 2,241 16,085 5,677 0 16,932 54,464 9,624 43,126
Colusa 8,241 20,936 1,470 48,909 46,135 0 25,130 95,052 22,629 91,364
Glenn 6,538 14,714 797 45,481 8,324 0 12,153 70,757 4,089 51,035
Placer 422 0 0 1,859 0 0 0 0 0 0
Sacramento 0 0 134 299 0 0 99 0 99 0
Sutter 8,093 19,537 2,796 57,115 11,539 0 42,909 84,254 15,529 68,771
Tehama 0 0 0 0 0 0 0 0 0 0
Yolo 205 5,195 0 6,064 10,484 0 6,061 26,599 14,863 28,207
Yuba 5,041 5,208 2,540 22,058 1,564 0 15,697 16,645 5,105 7,926
Total acres 45,620 84,483 9,978 197,870 83,723 0 118,981 347,771 71,938 290,429
TABLE 2-2 Herbicides: Pounds Applied, Sacramento Valley, 2010
County
Pounds Applied
Bensulfuron-methyl
Bispyribac-sodium
Carfentrazone-ethyl Clomazone
Cyhalofop-butyl Molinate Penoxsulam Propanil Thiobencarb
Triclopyr TEA
Butte 898 563 365 6,720 1,833 0 609 254,080 32,642 8,466
Colusa 423 574 62 22,041 14,158 0 755 501,189 81,908 15,927
Glenn 358 510 109 22,402 2,766 0 435 382,492 14,148 7,684
Placer 1 0 0 648 0 0 0 0 0 0
Sacramento 0 0 2 135 0 0 4 0 297 0
Sutter 400 549 327 24,161 3,664 0 1,580 420,215 50,340 12,188
Tehama 0 0 0 0 0 0 0 0 0 0
Yolo 34 156 0 2,795 3,472 0 191 137,557 52,269 5,232
Yuba 354 137 384 8,779 500 0 570 77,988 16,302 1,494
Total pounds 2,468 2,489 1,249 87,681 26,393 0 4,144 1,773,521 247,906 50,991

CHAPTER 2: GROWING SEASON, HYDROLOGY, AND APPLIED MATERIALS
2-8 SAC/361896/103560003 (CRC 2010 AMR REV 3-14-2011)

CHAPTER 2: GROWING SEASON, HYDROLOGY, AND APPLIED MATERIALS
SAC/361896/103560003 (CRC 2010 AMR REV 3-14-2011) 2-9
TABLE 2-3 Insecticides: Acres Treated, Sacramento Valley, 2010
County
Acres Treated
Diflubenzuron (s)-Cypermethrin Lambda Cyhalothrin Malathion
Butte 132 637 11,857 0
Colusa 0 3,707 24,336 0
Glenn 86 11,130 8,283 0
Placer 0 0 1,258 0
Sacramento 0 0 0 0
Sutter 0 4,578 34,411 0
Tehama 0 0 0 0
Yolo 0 0 2,325 0
Yuba 1,067 3,133 11,115 0
Total acres 1,285 23,185 93,585 0
TABLE 2-4 Insecticides: Pounds Applied, Sacramento Valley, 2010
County
Pounds Applied
Diflubenzuron (s)-Cypermethrin Lambda Cyhalothrin Malathion
Butte 20 31 355 0
Colusa 0 162 740 0
Glenn 8 514 278 0
Placer 0 0 38 0
Sacramento 0 0 2 0
Sutter 0 190 1,198 0
Tehama 0 0 0 0
Yolo 0 0 75 0
Yuba 575 135 300 0
Total pounds 603 1,032 2,986 0

CHAPTER 2: GROWING SEASON, HYDROLOGY, AND APPLIED MATERIALS
2-10 SAC/361896/103560003 (CRC 2010 AMR REV 3-14-2011)
TABLE 2-5 Fungicides: Acres Treated, Sacramento Valley, 2010
County
Acres Treated
Azoxystrobin Propiconazole* Trifloxystrobin*
Butte 8,551 995 995
Colusa 64,929 0 0
Glenn 49,873 0 0
Placer 0 0 0
Sacramento 387 0 0
Sutter 34,987 8,208 8,208
Tehama 0 0 0
Yolo 10,648 683 683
Yuba 5,640 0 0
Total acres 175,015 9,886 9,886
NOTE: *Propiconazole and trifloxystrobin constitute the product Stratego
TABLE 2-6 Fungicides: Pounds Applied, Sacramento Valley, 2010
County
Pounds Applied
Azoxystrobin Propiconazole* Trifloxystrobin*
Butte 1,467 133 133
Colusa 10,600 0 0
Glenn 7,893 0 0
Placer 0 0 0
Sacramento 63 0 0
Sutter 6,247 1,218 1,218
Tehama 0 0 0
Yolo 1,933 92 92
Yuba 1,062 0 0
Total pounds 29,265 1,443 1,443
NOTE: *Propiconazole and trifloxystrobin constitute the product Stratego

CHAPTER 2: GROWING SEASON, HYDROLOGY, AND APPLIED MATERIALS
SAC/361896/103560003 (CRC 2010 AMR REV 3-14-2011) 2-11
TABLE 2-7 Acres Treated with Molinate and Thiobencarb, 2006 through 2010
County
Acres Treated
Molinate Thiobencarb
2006 2007 2008 2009 2010 2006 2007 2008 2009 2010
Butte 21,571 10,965 2,528 45 0 20,353 13,099 11,113 1,923 9,624
Colusa 880 340 0 40 0 24,384 24,094 22,714 35,201 22,629
Glenn 1,845 701 100 520 0 4,952 1,140 472 4,660 4,089
Placer 2,173 437 462 45 0 367 813 456 0 0
Sacramento 0 0 0 0 0 1,158 0 0 0 99
Sutter 4,675 2,036 506 174 0 17,359 13,018 18,544 859 15,529
Tehama 0 148 0 0 0 0 148 261 0 0
Yolo 414 666 0 0 0 6,200 8,321 7,518 14,698 14,863
Yuba 0 0 476 0 0 656 1,194 916 3,092 5,105
Total treated acres 31,588 15,293 4,072 824 0 75,429 61,827 61,994 60,433 71,938
Total planted acres 526,000 522,000 571,987 569,320 565,531 526,000 522,000 571,987 569,320 565,531

CHAPTER 2: GROWING SEASON, HYDROLOGY, AND APPLIED MATERIALS
2-12 SAC/361896/103560003 (CRC 2010 AMR REV 3-14-2011)
TABLE 2-8 Pounds of Molinate and Thiobencarb Applied, 2006 through 2010
County
Pounds Applied
Molinate Thiobencarb
2006 2007 2008 2009 2010 2006 2007 2008 2009 2010
Butte 92,930 47,730 11,527 180 0 81,722 51,149 43,655 7,265 32,642
Colusa 3,551 1,467 0 160 0 96,106 95,684 89,641 137,420 81,908
Glenn 7,631 2,839 405 1,563 0 18,611 4,201 1,866 17,806 14,148
Placer 9,978 1,690 1,727 180 0 1,114 2,694 1,664 0 0
Sacramento 0 0 0 0 0 4,243 0 0 0 297
Sutter 20,545 9,188 2,286 661 0 66,765 49,199 71,773 2,843 50,340
Tehama 0 525 0 0 0 0 450 783 0 0
Yolo 1,561 2,937 0 0 0 24,761 33,315 29,562 58,152 52,269
Yuba 0 0 2,148 0 0 2,480 4,483 2,853 9,868 16,302
Total pounds 136,196 66376 18,093 2,744 0 295,802 241,175 241,797 233,354 247,906
Total planted acres 526,000 522,000 571,987 569,320 565,531 526,000 522,000 571,987 569,320 565,531
CHAPTER 2: GROWING SEASON, HYDROLOGY, AND APPLIED MATERIALS
SAC/361896/103560003 (CRC 2010 AMR REV 3-14-2011)
TABLE 2-9 Range of Fertilizer Components Applied to Rice
Material/Element
Pounds per Acre
Form and Method Low High
N 80 120 Injected aqua
16-20 150 200
N 24 32 Solid 16-20-0-13 starter
P 30 40 Solid 16-20-0-13 starter
K 0 0 Solid 16-20-0-13 starter
S 19.5 26 Solid 16-20-0-13 starter
Zn 1 5 Metallic
NH4SO4 0 200
N 0 42 Topdressed
S 0 49 Topdressed
Total for all application methods
N 104 194
P 30 40
K 0 0
S 20 75
Zn* 1 5
NOTE: *Seldom applied


SAC/361896/103560003 (CRC 2010 AMR REV 3-14-2011) 3-1
CHAPTER 3
Management Practices
Management practices are a key component of the rice water quality programs. During the early phases of the RPP, management practices were developed to increase efficacy and ultimately to protect water quality. The cornerstone of rice management practices is a thorough understanding of the rice calendar, including the application methods and timing of pesticide use.
Management practices include field-level management of rice pesticides and discharges, CAC enforcement programs, grower education efforts, and communication programs. This chapter includes the pesticide use calendar, general information on rice water quality management practices, and specific 2010 enforcement data.
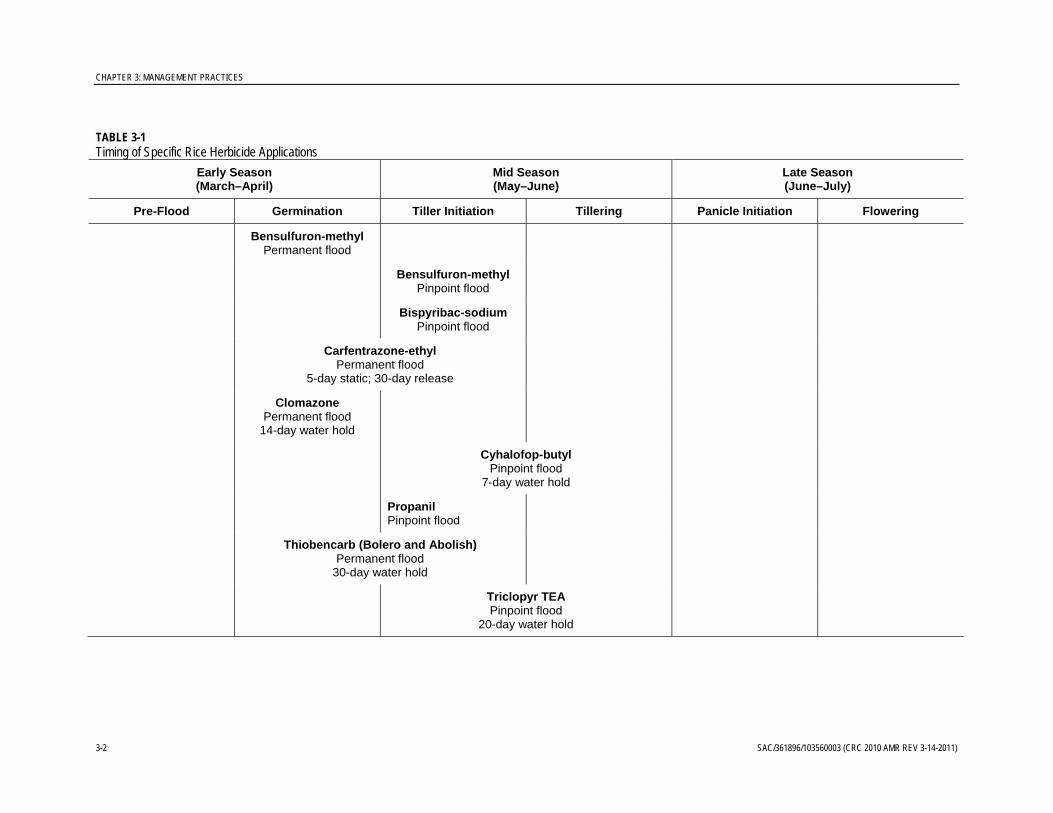
Pesticide Use Calendar The following tables depict the season or timing of pesticide applications to rice. Included are separate tables for herbicide applications (Table 3-1), tank mix combinations (Table 3-2), insecticide applications (Table 3-3), and sequential herbicide applications (Table 3-4). A “sequential” is the application of an herbicide followed by another herbicide with a different mode of action. Sequential applications are used to achieve better coverage and efficacy for weed control. The second application usually occurs in the next growth stage of the rice plant. For example, clomazone is applied at germination. A sequential application of bispyribac-sodium is applied at tiller initiation. Figure 3-1 provides illustrations of rice’s growth stages.
Rice pesticide applications are timed for specific growth stages of the rice plant. To simplify the rice growth schedule, the following tables group pre-flood and germination into early season; tiller initiation and tillering are mid-season, and panicle initiation and flower are late season.
This calendar of applications provides information that is useful for understanding potential water quality concerns relative to particular times during the year.
FIGURE 3-1
Rice Growth Stages
CHAPTER 3: MANAGEMENT PRACTICES
3-2 SAC/361896/103560003 (CRC 2010 AMR REV 3-14-2011)
TABLE 3-1 Timing of Specific Rice Herbicide Applications
Early Season (March–April)
Mid Season (May–June)
Late Season (June–July)
Pre-Flood Germination Tiller Initiation Tillering Panicle Initiation Flowering
Bensulfuron-methyl Permanent flood
Bensulfuron-methyl Pinpoint flood
Bispyribac-sodium Pinpoint flood
Carfentrazone-ethyl Permanent flood
5-day static; 30-day release
Clomazone Permanent flood
14-day water hold
Cyhalofop-butyl Pinpoint flood
7-day water hold
Propanil Pinpoint flood
Thiobencarb (Bolero and Abolish) Permanent flood
30-day water hold
Triclopyr TEA Pinpoint flood
20-day water hold

CHAPTER 3: MANAGEMENT PRACTICES
SAC/361896/103560003 (CRC 2010 AMR REV 3-14-2011) 3-3
TABLE 3-2 Examples of the Timing of Herbicide Tank Mix Combinations as Provided by Dr. Albert Fischer, UC Davis
Early Season (March–April)
Mid Season (May–June)
Late Season (June–July)
Pre-Flood Germination Tiller Initiation Tillering Panicle Initiation Flowering
Bispyribac-sodium/Thiobencarb
(Abolish) Pinpoint flood
30-day water hold
Propanil/Thiobencarb (Abolish)
Permanent flood 30-day water hold
TABLE 3-3 Timing of Specific Rice Insecticide Applications
Early Season (March–April)
Mid Season (May–June)
Late Season (June–July)
Pre-Flood Germination Tiller Initiation Tillering Panicle Initiation Flowering
Lambda cyhalothrin Border treatment 7-day water hold
Lambda cyhalothrin Border treatment 7-day water hold
(s)-cypermethrin Border treatment 7-day water hold
(s)-cypermethrin Border treatment 7-day water hold

CHAPTER 3: MANAGEMENT PRACTICES
3-4 SAC/361896/103560003 (CRC 2010 AMR REV 3-14-2011)
TABLE 3-4 Timing of Sequential Rice Herbicide Applications
Early Season (March–April)
Mid Season (May–June)
Late Season (June–July)
Pre-Flood Germination Tiller Initiation Tillering Panicle Initiation Flowering
Bispyribac-sodium, Thiobencarb (Bolero) 30-day water hold Permanent Flood
Bispyribac-sodium, Propanil Pinpoint flood
Clomazone, Bensulfuron-methyl 14-day water old Permanent flood
Clomazone, Bispyribac-sodium 14-day water hold Permanent flood
Clomazone, Carfentrazone-ethyl up to 30-day water hold
Permanent flood
Clomazone, Propanil 14-day water hold Permanent flood
Clomazone, Propanil/Triclopyr TEA 20-day water hold
Cyhalofop-butyl, Bensulfuron-methyl 7-day water hold
Pinpoint flood
Cyhalofop-butyl, Bispyribac-sodium 7-day water hold
Pinpoint flood
Cyhalofop-butyl, Propanil 7-day water hold
Pinpoint flood
Propanil, Cyhalofop-butyl 7-day water hold
Pinpoint flood
Carfentrazone-ethyl, Cyhalofop-butyl 30-day water hold, 7-day water hold
Pinpoint flood

CHAPTER 3: MANAGEMENT PRACTICES
SAC/361896/103560003 (CRC 2010 AMR REV 3-14-2011) 3-5
Role of Management Practices in Attaining Water Quality Protection Over the years, BMPs such as water hold requirements, grower information meetings, and inspection/enforcement were implemented to ensure compliance with performance goals and attainment of water quality objectives and maximum contaminant level (MCLs) for the RPP. The water holds, which are specified on pesticide use labels and through permit conditions, were developed to provide for in-field degradation of pesticides prior to the release of treated water to drains and other surface waters. For 2010, required water holds were the same as those required during the 2005 to 2009 growing seasons.
Water Holds The primary field-level water quality management practice is the water hold. The nature of rice farming, which requires standing water during the growing season, provides rice farmers with a unique opportunity to manage water flow. Water hold durations vary based on requirements that are adopted in consideration of the persistence of specific registered rice pesticides in the environment, and are used to provide time for the applied product to degrade in the field. The goal of this strategy is to discharge rice drainage water that meets Basin Plan Performance Goals or other benchmarks.
The management practices developed under the RPP have been the foundation for development and implementation of water hold requirements for other pesticides. Over the years, water holds have become industry standard practice to address aquatic toxicity, taste complaints, environmental fate, and product efficacy. Water holds were developed with input from technical resources such as the University of California Cooperative Extension (UCCE) and pesticide registrants. In the early 1980s, when the RPP began, water holds were generally not a pesticide-use label requirement. Over time, rice-specific registrations of pesticides were developed to require specified water holds as a condition of the permitted use of these products. Additionally, DPR and the CACs have the authority to impose additional water hold requirements necessary to protect water quality.
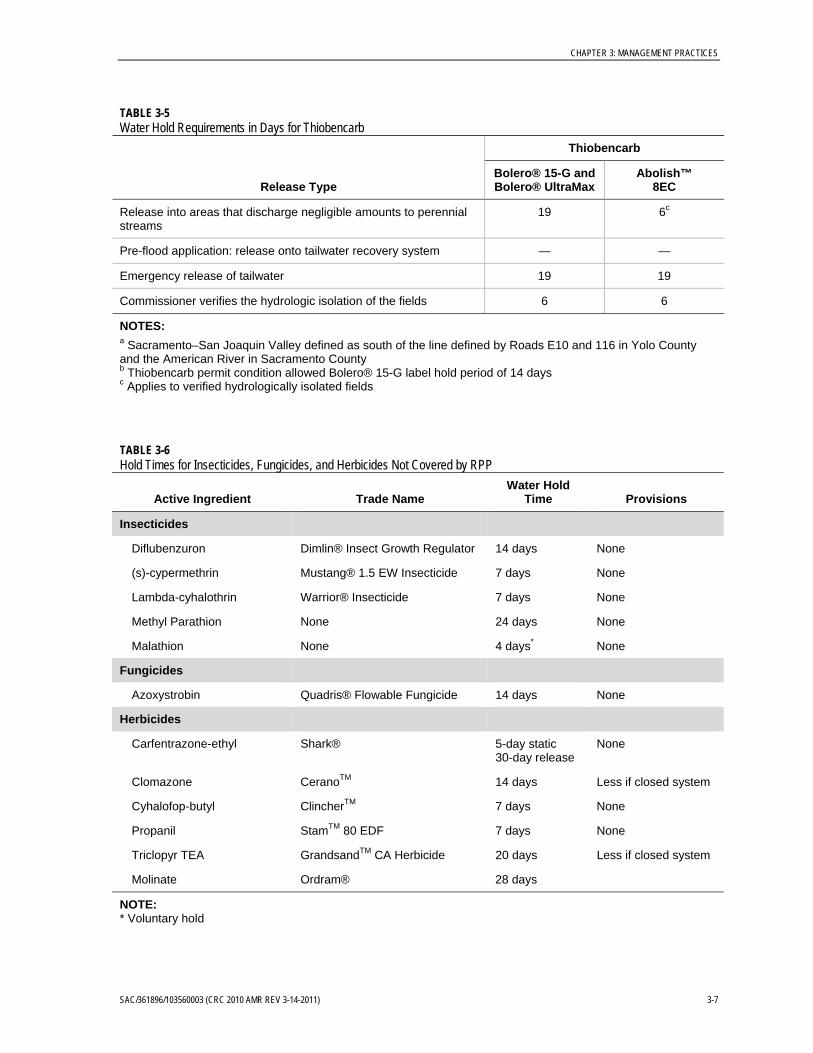
Water hold requirements for thiobencarb and molinate are pesticide-use permit conditions under the RPP. Table 3-5 specifies the water hold requirements for the four currently registered pesticides regulated under the CVRWQCB’s RPP Conditional Prohibition of Discharge. These water hold requirements are the same as those required during the 2005 to 2010 growing seasons. Table 3-6 lists the water holds for other products registered for use on rice.
Actions Taken to Address Identified Water Quality Impacts The CACs are the local enforcement agencies working with DPR to enforce the California Food and Agricultural Code and the California Code of Regulations pertinent to pesticide use. CACs issue restricted materials permits to growers purchasing and using California-restricted materials in their respective counties. Thiobencarb is a restricted material with additional use restrictions (permit conditions) not found on the registered product label. The most common permit conditions for thiobencarb are water holds. Since 2003, the CVRWQCB RPP authorizing resolutions have included permit conditions that

CHAPTER 3: MANAGEMENT PRACTICES
3-6 SAC/361896/103560003 (CRC 2010 AMR REV 3-14-2011)
required increased inspections for seepage control; buffer zones during application; a pre-season mandatory meeting for growers, pest control advisors, and applicators; and formation of a Storm Event Work Group. The resolution authorizing the 2010 RPP (R5-2010-9001) adopted additional conditions recommended by the CRC. The conditions included in the 2010 authorization of the program are summarized below:
Continuation of the management practices incorporated in the 2009 use permit conditions, including water-holding requirements for thiobencarb, drift minimization, mandatory preseason thiobencarb stewardship training, water management (including emergency releases), and seepage mitigation measures [R5-2010-9001 (1)(a)].
Additional outreach on results of the 2009 thiobencarb results and required management practices to applicators, including clarification of hold time requirements, application procedures, and notification requirements associated with elevated results near the Sacramento River drinking water intakes [R5-2010-9001 (1)(b)].
Consultation with the ten thiobencarb dealers and distributors in the Sacramento River Basin [R5-2010-9001 (1)(b)].
Funding of additional county surveillance at non-traditional hours to double the level of 2009 and extension of the program to counties not previously funded, resulting in surveillance inspections increase to approximately 1.5 times the 2009 level [R5-2010-9001 (1)(c)].
In the event of flooding from a storm event, the CRC would coordinate with the reclamation district previously operating as a closed system just north of Sacramento to collect and analyze samples [R5-2010-9001 (1)(d)].
If the performance goal or water quality objective for thiobencarb is not met or increasing thiobencarb concentrations are observed in waters designated for municipal or domestic water supply, the CRC, after consultation with DPR, will submit to the Executive Officer proposed actions to be implemented to achieve the performance goal or water quality objective. [R5-2010-9001 (1)(e)]
TABLE 3-5 Water Hold Requirements in Days for Thiobencarb
Release Type
Thiobencarb
Bolero® 15-G and Bolero® UltraMax
Abolish™ 8EC
Single field 30 19
Single field southern area onlya 19 —
Release into tailwater recovery system or pond onto fallow field (except southern area)b
14b 14b
Multi-growers and district release onto closed recirculating systems 6 6
Multi-growers and district release onto closed recirculating systems in southern area
6 —
CHAPTER 3: MANAGEMENT PRACTICES
SAC/361896/103560003 (CRC 2010 AMR REV 3-14-2011) 3-7
TABLE 3-5 Water Hold Requirements in Days for Thiobencarb
Release Type
Thiobencarb
Bolero® 15-G and Bolero® UltraMax
Abolish™ 8EC
Release into areas that discharge negligible amounts to perennial streams
19 6c
Pre-flood application: release onto tailwater recovery system — —
Emergency release of tailwater 19 19
Commissioner verifies the hydrologic isolation of the fields 6 6
NOTES: a Sacramento–San Joaquin Valley defined as south of the line defined by Roads E10 and 116 in Yolo County and the American River in Sacramento County b Thiobencarb permit condition allowed Bolero® 15-G label hold period of 14 days c Applies to verified hydrologically isolated fields
TABLE 3-6 Hold Times for Insecticides, Fungicides, and Herbicides Not Covered by RPP
Active Ingredient Trade Name Water Hold
Time Provisions
Insecticides
Diflubenzuron Dimlin® Insect Growth Regulator 14 days None
(s)-cypermethrin Mustang® 1.5 EW Insecticide 7 days None
Lambda-cyhalothrin Warrior® Insecticide 7 days None
Methyl Parathion None 24 days None
Malathion None 4 days* None
Fungicides
Azoxystrobin Quadris® Flowable Fungicide 14 days None
Herbicides
Carfentrazone-ethyl Shark® 5-day static 30-day release
None
Clomazone CeranoTM 14 days Less if closed system
Cyhalofop-butyl ClincherTM 7 days None
Propanil StamTM 80 EDF 7 days None
Triclopyr TEA GrandsandTM CA Herbicide 20 days Less if closed system
Molinate Ordram® 28 days
NOTE: * Voluntary hold

CHAPTER 3: MANAGEMENT PRACTICES
3-8 SAC/361896/103560003 (CRC 2010 AMR REV 3-14-2011)
The restricted materials permits require the CACs to keep records of pesticides applied to rice acreage, while full use reporting documents all agricultural use pesticides. The CACs meet the notification requirements by utilizing the Notice of Intent (NOI) and NOA process. Rice growers or pest control operators submit NOIs to the CACs at least 24 hours prior to application so that CAC staff can observe applications. NOAs are reported 24 hours after an application occurs so that water holding times can be recorded, inspected, and tracked.
Compliance with pesticide-use restrictions is a critical component of the RPP’s ability to achieve water quality protection. A range of label restrictions and permit conditions apply to the use of rice pesticides, including mix/load, application, and water hold requirements. CACs perform inspections to enhance compliance with each of the label restrictions and permit conditions. Mix/load inspections are performed primarily for worker protection and to evaluate whether proper handling and containment of pesticides is being implemented to prevent releases to the environment. Application inspections are performed to evaluate label and permit condition application restrictions such as buffer zones, adherence to rate and wind speed and other local requirements, and water management. Seepage inspections evaluate the efficacy of farm water management levees to hold water in-field throughout the duration of water holds.
Release Inquiries and Emergency Releases In 2010, there were two release inquiries and no reported emergency releases. Both release inquiries occurred in Colusa County.
Seepage Control and Inspections Seepage is a water quality concern because rice field water can move laterally through levees bordering rice fields, especially when levees are constructed in a manner that does not prevent water seepage. Often, levee borrow pits, commonly called “sweat ditches,” are used to contain this water. When water gets high enough, it can flow into local agricultural drainage conveyances. The CVRWQCB expressed concern that seepage was a contributing factor to increased thiobencarb concentrations in the Sacramento River in the past.
Current program recommendations require securing weir boxes in rice fields with a soil barrier to a depth higher than the water level. At rice pesticide permit issuance, the CACs provide rice growers with a handout entitled Closed Rice Water Management Systems, prepared by the U.S. Department of Agriculture (USDA) and the UCCE. In addition, the CACs provide the growers a brochure entitled Seepage Water Management—Voluntary Guidelines for Good Stewardship in Rice Production, cooperatively developed by the UC Davis Department of Agronomy and Range Science, DPR, and UCCE. The brochure is also distributed at the thiobencarb mandatory meetings. The brochure explains the causes of seepage and identifies voluntary management activities that growers should use to minimize and prevent seepage.
For several years, the CRC has contracted with three CACs to fund CAC “off duty” enforcement activity on weekends and holidays during RPP pesticide use season. In 2010, the CRC increased funding to double the level of 2009 and extended the program to counties not previously funded. Surveillance inspections increased to 1.5 times, to include seven of the nine counties in the RPP.

CHAPTER 3: MANAGEMENT PRACTICES
SAC/361896/103560003 (CRC 2010 AMR REV 3-14-2011) 3-9
In 1998, DPR and the CACs implemented a Prioritization Plan and a Negotiated Work Plan. One component of both plans was to negotiate a number of water hold inspections. The plans allow the counties to set priorities within the Pesticide Use Enforcement Program Standard Compendium under the Restricted Materials and Permitting manual. All rice pesticide water holding requirements are ranked as high-priority inspections when rice pesticides are used as restricted materials.
Some pre-flood inspections were per grower request, while most inspections were in response to an NOI filed at the CAC office. Some permits were denied due to seepage conditions upon inspection. Information was gathered from the CACs on number of inspections, types of inspections, violations, agricultural civil penalties (ACPs), and water seepage inspection activities in 2010. The CRC provided the CAC offices with weekly updates of the rice herbicide monitoring results in order to coordinate water quality protection activities.
CACs conducted seepage inspections, as summarized in Table 3-7. Based on the inspection data provided to the DPR by the CACs, 964 thiobencarb use sites were inspected for seepage. Of these inspected sites, 918 sites reported no discharge, 46 had reported discharges of less than 5 gallons per minute (gpm). In addition, four sites had reported discharges of greater than 5 gpm. Of these, two were issued enforcement issues. These four sites with flow greater than 5 gpm constitute 0.2 percent of inspected sites.
Water Hold Inspections CACs conducted water hold inspections of 1,036 thiobencarb use sites in 2010 (Table 3-8). Reporting was recorded for two formulations of thiobencarb (Bolero and Abolish). There were two release inquiries and no reported emergency releases. Of the 1,036 use sites inspected, three water hold violation county ACPs were issued, including one in Colusa County and two in Glenn County.
The Colusa County ACP was issued on June 10, 2010. The Colusa CAC assumes the grower was probably draining a few days before that date. The Abolish was applied on May 27, 2010, and therefore release on or prior to June 10 did not comply with water hold requirements. Additional detail regarding this ACP is included in Section 7. Two additional farmers called to request emergency releases on June 1 and June 4. No emergency releases were granted by Colusa County.
The two Glenn County ACPs were issued to a single grower. The application took place on April 26 and the inspection was on April 29. The Abolish was applied in a dry-seeded process. The farmer did not properly prepare the field to hold water, so water flowed over the check boards at two different sites at the time of the inspections.
Application and Mix/Load Inspections CACs conducted application and mix/load inspections, as summarized in Table 3-8. Based on the inspection data the CACs provided to the DPR, a total of 24 application inspections and 28 mix/load event inspections were performed. No enforcement actions were issued as a result of these inspections.

CHAPTER 3: MANAGEMENT PRACTICES
3-10 SAC/361896/103560003 (CRC 2010 AMR REV 3-14-2011)
TABLE 3-7 Thiobencarb Water Seepage Inspections in 2010
County Chemical
Number of Seepage
Inspections
Number of Sites with
No Seepage
Number of Sites w/
Less than 5 gpm
Seepage
Number of Sites w/
More than 5 gpm
Seepage Enforcement
Actions
Butte Bolero 0 0 0 0 0
Abolish 0 0 0 0 0
County Total 0 0 0 0 0
Colusa Bolero 203 202 0 0 0
Abolish 55 55 1 0 1
County Total 258 257 1 0 1
Glenn Bolero 135 113 19 3 0
Abolish 10 7 2 1 2
County Total 145 120 21 4 2
Placer Bolero 16 16 0 0 0
Abolish 0 0 0 0 0
County Total 16 16 0 0 0
Sacramento Bolero 18 18 0 0 0
Abolish 0 0 0 0 0
County Total 18 18 0 0 0
Sutter Bolero 189 189 5 0 0
Abolish 20 20 0 0 0
County Total 209 204 5 0 0
Tehama Bolero 1 1 0 0 0
Abolish 0 0 0 0 0
County Total 1 0 0 0 0
Yolo Bolero 99 97 2 0 0
Abolish 0 0 0 0 0
County Total 99 97 2 0 0
Yuba Bolero 25 25 0 0 0
Abolish 193 176 17 0 0
County Total 218 201 17 0 0
Total 964 918 46 4 3

CHAPTER 3: MANAGEMENT PRACTICES
SAC/361896/103560003 (CRC 2010 AMR REV 3-14-2011) 3-11
TABLE 3-8 Thiobencarb Water Hold, Application, and Mix/Load Inspections in 2010
County Chemical Water HoldInspections
Release Inquiries
Emergency Releases
Water Hold ACPs
Appl. Inspections
Mix-Load Inspections
ACPs
Butte Bolero 15G 220 0 0 0 9 9 0
Abolish EC 4 0 0 0 3 3 0
County Total 224 0 0 0 12 12 0
Colusa Bolero 15G 203 0 0 0 2 0 0
Abolish EC 55 2 0 1 4 2 0
County Total 258 2 0 1 6 2 0
Glenn Bolero 15G 135 0 0 0 0 0 0
Abolish EC 10 0 0 2 0 0 0
County Total 145 0 0 2 0 0 0
Placer Bolero 15G 16 0 0 0 0 0 0
Abolish EC 0 0 0 0 0 0 0
County Total 16 0 0 0 0 0 0
Sacramento Bolero 15G 18 0 0 0 0 0 0
Abolish EC 0 0 0 0 0 0 0
County Total 18 0 0 0 0 0 0
Sutter Bolero 15G 189 0 0 0 1 4 0
Abolish EC 20 0 0 0 3 0 0
County Total 209 0 0 0 4 4 0
Tehama Bolero 15G 0 0 0 0 1 0 0
Abolish EC 0 0 0 0 0 0 0
County Total 0 0 0 0 1 0 0
Yolo Bolero 15G 99 0 0 0 3 3 0
Abolish EC 12 0 0 0 2 2 0
County Total 111 0 0 0 5 5 0
Yuba Bolero 15G 25 0 0 0 1 1 0
Abolish EC 193 0 0 0 4 4 0
County Total 218 0 0 0 5 5 0
Total 1,036 2 0 3 24 28 0
NOTES:
ACP = Agricultural Civil Penalty Bolero includes Bolero 15G and Bolero UltraMax; the counties did not differentiate between the products.


SAC/361896/103560003 (CRC 2010 AMR REV 3-14-2011) 4-1
CHAPTER 4
Monitoring and Reporting Requirements
The monitoring and reporting requirements for the CWFR are specified in the MRP Order R5-2010-0805 (CRC MRP), under Resolution No. R5-2006-0053 as amended by R5-2006-0077. Monitoring and reporting requirements for the 2010 RPP are specified in CVRWQCB Resolution No. R5-2010-9001. This chapter provides an overview of the monitoring and reporting requirements of each program, including the overall purpose and objectives; monitoring periods, sites, and constituents; program administration; sampling procedures; and analytical labs and methods used to assess water quality.
Monitoring Purpose and Objectives Although similar, the CWFR and RPP programs each have different purposes and objectives for monitoring and reporting.
CWFR The purpose of the CRC MRP is to monitor the discharge of wastes in irrigation return flows and stormwater from irrigated rice lands. These objectives are consistent with the State’s Nonpoint Source (NPS) Policy and include the following:
1. Determine whether the discharge of waste from irrigated lands within the Coalition Group boundaries causes or contributes to exceedances of applicable water quality standards or causes nuisance.
2. Provide information about the Coalition Group area characteristics, including but not limited to land use, crops grown, and chemicals used.
3. Monitor the effectiveness of management practices implemented to address exceedances of applicable water quality standards.
4. Determine which management practices are most effective in reducing wastes discharged to surface waters from irrigated lands.
5. Specify details about monitoring periods, parameters, protocols, and quality assurance.
6. Support the development and implementation of the CWFR.
7. Verify the adequacy and effectiveness of the CWFR’s conditions.
8. Evaluate the Coalition Group’s compliance with the terms and conditions of the CWFR.

CHAPTER 4: MONITORING AND REPORTING REQUIREMENTS
4-2 SAC/361896/103560003 (CRC 2010 AMR REV 3-14-2011)
RPP The purpose of the RPP is to achieve compliance with Performance Goals and attainment of the thiobencarb water quality objective established in the Basin Plan. Monitoring is conducted under the RPP to determine attainment of Performance Goals and the water quality objective. Similar to the CWFR, though not specifically stated in regulatory documents, the purposes of the monitoring under the RPP are:
1. Assess the impacts of the rice pesticides regulated under the Basin Plan.
2. Determine the degree of implementation of rice pesticide management practices.
3. Monitor the effectives of management practices and strategies to attain Performance Goals.
4. Determine concentration of Basin Plan rice pesticides at specific sites.
5. Evaluate compliance with Performance Goals and attainment of the thiobencarb water quality objective to determine whether additional management practices are necessary to improve and/or protect water quality.
Overview of Requirements The monitoring requirements for both programs define the types of monitoring, monitoring schedule, sites, constituents, program administration, and quality control and quality assurance requirements. The details of each program are described below.
CWFR In January 2008, the CVRWQCB adopted Order No. R5-2008-0005 (2008 Coalition MRP), which required Coalition Groups to revise their MRP plans to incorporate refined approaches to implementation of the Irrigated Lands Program. The 2009 and 2010 CRC MRPs were developed to be functionally equivalent to the 2008 Coalition MRP.
Monitoring requirements defined by the 2008 Coalition MRP incorporate a 3-year cycle of assessment monitoring and core monitoring. Core monitoring is conducted at a subset of core sites considered representative of the Coalition Group’s area, and for a reduced set of parameters. Assessment monitoring is to include an expanded suite of parameters and may include an expanded list of sites, including assessment sites and core sites. The purposes of the expanded suite are to confirm that core monitoring continues to adequately characterize water quality conditions or identify changed conditions and to provide the technical basis for use of core sites.
CWFR assessment monitoring was conducted in 2009. The current CWFR requirements span a 3-year monitoring schedule, which includes 2 years of core monitoring (2010 and 2011), followed by a year of assessment monitoring (2012). Table 4-1 provides the sequential schedule for assessment and core monitoring.
Both core and assessment monitoring can include special project monitoring. Special project monitoring includes monitoring and reporting implemented pursuant to approved and

CHAPTER 4: MONITORING AND REPORTING REQUIREMENTS
SAC/361896/103560003 (CRC 2010 AMR REV 3-14-2011) 4-3
proposed management plans, as well as other focused investigations that may assist in addressing data gaps or other technical evaluations.

CHAPTER 4: MONITORING AND REPORTING REQUIREMENTS
4-4 SAC/361896/103560003 (CRC 2010 AMR REV 3-14-2011)
TABLE 4-1 Assessment and Core Monitoring Cyclea
Monitoring Type 2009 2010 2011 2012
Assessmentb c
Cored
NOTES: a Repeat cycle every 3 years, or as specified in an approved MRP plan. b Assessment monitoring is conducted at core sites and assessment sites. Site-specific monitoring requirements may be included.
c Assessment sites were monitored during the initial two events of 2010 to report dissolved copper (total copper was reported in 2009).
d Core monitoring is conducted only at core sites.
Consistent with the approach outlined in the MRP, the CRC’s approach for its monitoring program includes three types of monitoring:
Core monitoring to track trends Assessment monitoring to determine the condition of a water body Special project monitoring for source identification and other problem solving
Core Monitoring Core monitoring sites and constituents are to be used to measure trends at the selected representative sites over extended periods of time. The core monitoring component of the monitoring strategy will:
Focus on a diversity of monitoring sites across the Coalition Group’s area (hydrology, size, and flow).
Include sites that through assessment monitoring or other information have been shown to be characteristic of key crop types, topography, and hydrology within the Coalition Group’s boundaries.
Provide scientific rationale for the site selection process based on the assessment monitoring, existing monitoring projects, or historical information.
Discuss the criteria for the selection of each monitoring site.
Propose the approach, including schedule, to sampling core monitoring sites.
Include water bodies that carry agricultural drainage, are dominated by agricultural drainage, or are otherwise affected by other irrigated agriculture activities.
Have management practice information provided in order to establish relationships (status and trends) with water quality monitoring information.
In conjunction with assessment monitoring, demonstrate the effectiveness of management practices and implement new management practices as needed.
Use data generated from the core monitoring sites to establish trend information about the effectiveness of the Coalition Group’s efforts to reduce or eliminate the impact of irrigated agriculture on surface waters.

CHAPTER 4: MONITORING AND REPORTING REQUIREMENTS
SAC/361896/103560003 (CRC 2010 AMR REV 3-14-2011) 4-5
The 2010 MRP includes monitoring at the four core sites monitored in previous Irrigated Lands Program monitoring efforts.
Assessment Monitoring Assessment monitoring is to be used to provide supporting data for sites that a Coalition Group wishes to select as core monitoring sites for trends. Supporting data also may allow consideration for the use of some monitoring sites to be representative of other locations within the CRC study area.
The January 2008 Coalition MRP describes the technical requirements of the proposed assessment monitoring. These requirements include:
Focus on a diversity of monitoring sites across the Coalition Group’s area (hydrology, size, and flow).
Evaluate different types of water bodies for assessment.
Include a sufficient number of sampling sites to assess the entire Coalition Group area and all drainages.
Propose the approach, including schedule, to sampling assessment monitoring sites.
Include sampling sites in areas of known water quality impairments, even if they are not currently identified on the Clean Water Act (CWA) 303(d) listing.
Include sampling sites that are compliance monitoring sites for total maximum daily loads (TMDLs), where implementation is conducted by the Coalition Group.
Provide scientific rationale for the site selection process based on historical and/or ongoing monitoring, drainage size, crop types and distribution, and topography and land use.
Discuss the criteria for the selection of each monitoring site.
Conduct the initial focus of monitoring on water bodies that carry agricultural drainage or are dominated by agricultural drainage.
Identify priorities with respect to work on specific watersheds, subwatersheds, and water quality parameters.
In conjunction with core monitoring for trends and special projects focused on specific problems, demonstrate the effectiveness of management practices, and identify locations for implementation of new management practices, as needed.
Include the requirements provided in Parts I through III of the 2008 Coalition MRP.
Three assessment sites, shown in Table 4-2 and described in the following sections, were included in the 2010 MRP.
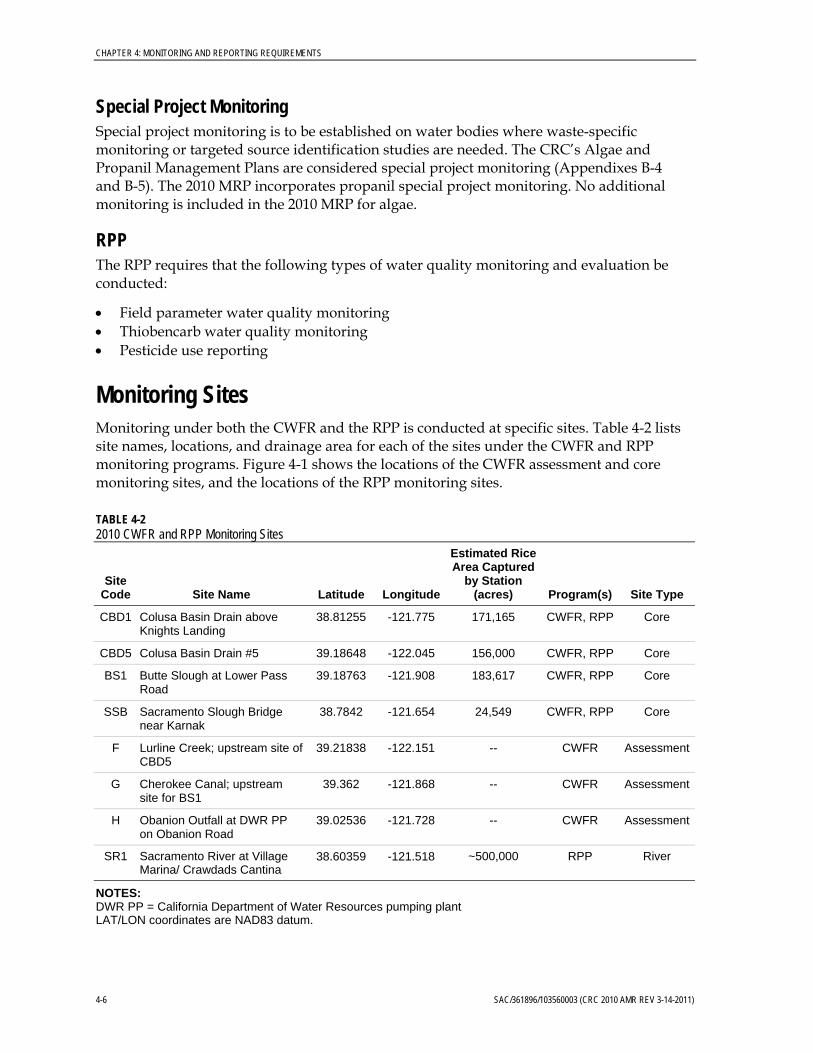
CHAPTER 4: MONITORING AND REPORTING REQUIREMENTS
4-6 SAC/361896/103560003 (CRC 2010 AMR REV 3-14-2011)
Special Project Monitoring Special project monitoring is to be established on water bodies where waste-specific monitoring or targeted source identification studies are needed. The CRC’s Algae and Propanil Management Plans are considered special project monitoring (Appendixes B-4 and B-5). The 2010 MRP incorporates propanil special project monitoring. No additional monitoring is included in the 2010 MRP for algae.
RPP The RPP requires that the following types of water quality monitoring and evaluation be conducted:
Field parameter water quality monitoring Thiobencarb water quality monitoring Pesticide use reporting
Monitoring Sites Monitoring under both the CWFR and the RPP is conducted at specific sites. Table 4-2 lists site names, locations, and drainage area for each of the sites under the CWFR and RPP monitoring programs. Figure 4-1 shows the locations of the CWFR assessment and core monitoring sites, and the locations of the RPP monitoring sites.
TABLE 4-2 2010 CWFR and RPP Monitoring Sites
Site Code Site Name Latitude Longitude
Estimated Rice Area Captured
by Station (acres) Program(s) Site Type
CBD1 Colusa Basin Drain above Knights Landing
38.81255 -121.775 171,165 CWFR, RPP Core
CBD5 Colusa Basin Drain #5 39.18648 -122.045 156,000 CWFR, RPP Core
BS1 Butte Slough at Lower Pass Road
39.18763 -121.908 183,617 CWFR, RPP Core
SSB Sacramento Slough Bridge near Karnak
38.7842 -121.654 24,549 CWFR, RPP Core
F Lurline Creek; upstream site of CBD5
39.21838 -122.151 -- CWFR Assessment
G Cherokee Canal; upstream site for BS1
39.362 -121.868 -- CWFR Assessment
H Obanion Outfall at DWR PP on Obanion Road
39.02536 -121.728 -- CWFR Assessment
SR1 Sacramento River at Village Marina/ Crawdads Cantina
38.60359 -121.518 ~500,000 RPP River
NOTES: DWR PP = California Department of Water Resources pumping plant LAT/LON coordinates are NAD83 datum.

CHAPTER 4: MONITORING AND REPORTING REQUIREMENTS
SAC/361896/103560003 (CRC 2010 AMR REV 3-14-2011) 4-7
CWFR Sites The 2010 monitoring season was a “core only” monitoring season (Table 4-1); however, the assessment sites were included in the first two monitoring events in order to gather dissolved copper data (not collected in 2009). Figure 4-1 shows the four CWFR core sites and three CWFR assessment sites.
RPP Sites Under the RPP, the CRC performs water quality and flow monitoring at five sites. Four of these sites (CBD1, CBD5, BS1, and SSB) are also monitored under the CWFR, while the fifth site (SR1) is monitored only under the RPP. Figure 4-1 shows the five RPP monitoring sites.

SAC/361896/103560003 (CRC 2010 AMR REV 3-14-2011) 4-9
FIGURE 4-1 2010 CWFR Assessment and Core Monitoring Sites and RPP Monitoring Sites

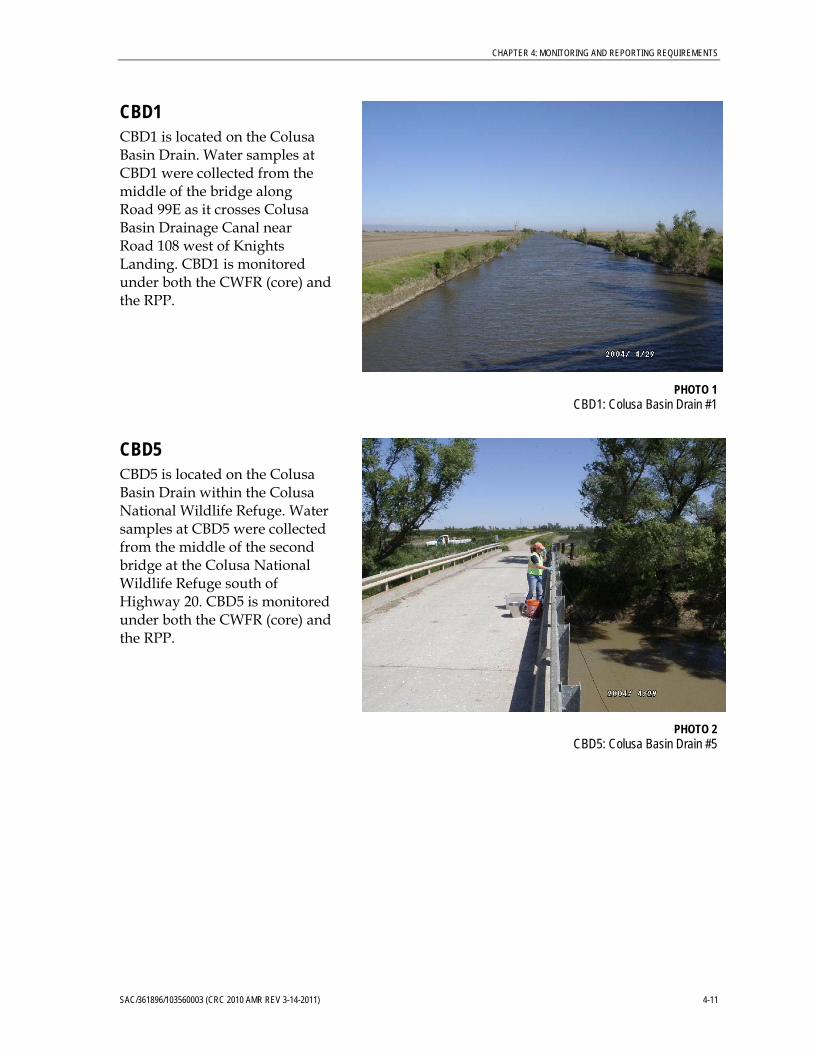
CHAPTER 4: MONITORING AND REPORTING REQUIREMENTS
SAC/361896/103560003 (CRC 2010 AMR REV 3-14-2011) 4-11
CBD1 CBD1 is located on the Colusa Basin Drain. Water samples at CBD1 were collected from the middle of the bridge along Road 99E as it crosses Colusa Basin Drainage Canal near Road 108 west of Knights Landing. CBD1 is monitored under both the CWFR (core) and the RPP.
PHOTO 1
CBD1: Colusa Basin Drain #1
CBD5 CBD5 is located on the Colusa Basin Drain within the Colusa National Wildlife Refuge. Water samples at CBD5 were collected from the middle of the second bridge at the Colusa National Wildlife Refuge south of Highway 20. CBD5 is monitored under both the CWFR (core) and the RPP.
PHOTO 2 CBD5: Colusa Basin Drain #5

CHAPTER 4: MONITORING AND REPORTING REQUIREMENTS
4-12 SAC/361896/103560003 (CRC 2010 AMR REV 3-14-2011)
BS1 BS1 is located on Butte Slough. Water samples at BS1 were collected from the middle of the bridge along Lower Pass Road, which crosses Butte Sough northeast of Meridian, California. In 1995 and 1996, samples were collected at the west end of the washed out bridge. Sampling at the new bridge site started in 1997. BS1 is monitored under both the CWFR (core) and the RPP.
PHOTO 3 BS1: Butte Slough #1
SSB The RPP historically monitored Sacramento Slough at a location known as Sacramento Slough 1 (SS1), which was located at the DWR gauging station downstream of the Karnak pumps. Beginning in 2006, the monitoring site for Sacramento Slough was moved slightly upstream to a location named Sacramento Slough Bridge (SSB) to provide improved safety for field technicians accessing the site. SSB is monitored under both the CWFR (core) and the RPP.
PHOTO 4 SSB: Sacramento Slough Bridge

CHAPTER 4: MONITORING AND REPORTING REQUIREMENTS
SAC/361896/103560003 (CRC 2010 AMR REV 3-14-2011) 4-13
F Site F is located on Lurline Creek. Water samples on Site F were collected from the middle of the bridge located along Lurline Avenue between San Jose Road and Two Mile Road, northwest of Colusa, east of Interstate 5. This site serves as the upstream assessment site for core site CBD5. Site F is monitored under the CWFR (assessment).
PHOTO 5
F: Lurline Creek
G Site G is located on Cherokee Canal. Water samples on Site G were collected from the middle of the bridge located along Colusa Highway, west of Hatch Road and east of Gridley Road and Butte Creek. This site serves as the upstream assessment site for ore site BS1. Site G is monitored under the CWFR (assessment).
PHOTO 6
G: Cherokee Canal

CHAPTER 4: MONITORING AND REPORTING REQUIREMENTS
4-14 SAC/361896/103560003 (CRC 2010 AMR REV 3-14-2011)
H Site H is located at the Obanion Outfall at DWR pumping plant (DWR PP) on Obanion Road. Water samples on Site H were collected from the middle of the bridge along Obanion Road west of Boulton Road and immediately east of the Sutter Bypass levee. Site H is monitored under the CWFR (assessment).
PHOTO 7 H: Obanion Outfall
SR1 SR1 is located on the Sacramento River. Water samples at SR1 were collected from the Sacramento River at the Village Marina along the Garden Highway in Sacramento. The SR1 water samples were collected from the edge of a floating dock near the entrance of a restaurant along the east bank of the Sacramento River. Kleinfelder noted the river level on a staff gauge located along a middle dock between the sampling point and the riverbank. SR1 is monitored under only the RPP.
PHOTO 8 SR1: Sacramento River Village Marina
Schedule and Constituents The monitoring schedules for CWFR and RPP sampling are based on the timing and frequency of discharge from rice fields that may contain constituents that affect water quality. The current monitoring periods for the CWFR were developed based on the

CHAPTER 4: MONITORING AND REPORTING REQUIREMENTS
SAC/361896/103560003 (CRC 2010 AMR REV 3-14-2011) 4-15
understanding of the rice growing season and analysis of historical data, including data collected since 2004 under the CWFR.
The period with the greatest risk to water quality occurs during the peak pesticide application period from April through June. During this period into July, water may be released from the field. From mid- July to mid-August, water is held on rice fields to protect grain development. A top-dressing of nutrients may be added during the water hold. Rice drainage season, when the rice fields are drained prior to harvest, typically occurs from mid-August through September. After harvest, rice fields are generally flooded to decompose rice straw and to provide waterfowl habitat. No application of fertilizers or pesticides occurs on rice fields during the winter until the fields are drained in mid-February or March. Field preparation for the next season may include applications of fertilizers.
Past monitoring has led to refinement in the monitoring calendar, with monitoring requirements focused on the periods of risk to water quality. Monitoring is scheduled to provide for water quality assessment during the peak application period. Factors, such as weather conditions, may affect planting and pesticide application. Timing of monitoring takes into account these factors and may vary from year to year, and 2010 weather conditions required adjustments to the calendar. CRC water quality monitoring for 2010 generally includes:
Monthly CWFR sampling of general parameters at core sites, April through August Monthly CWFR dissolved copper sampling at core and assessments sites, April and May Weekly CWFR special project monitoring for propanil, June to August RPP sampling for 9 weeks, with weekly samples during weeks 1, 2, 8, and 9, and more
intensive biweekly sampling conducted during weeks 3, 4, 5, 6, and 7, April through July
CWFR The MRP specifies the constituents for which field monitoring and laboratory analysis are to be conducted. Table 4-3 presents the constituents for which monitoring was required during 2010.
TABLE 4-3 CWFR Monitoring Requirements, 2010
Constituent Units Sample
Type Type of Monitoring
Irrigation Season Sampling Frequency
(April to August)
Flow cfs Fielda Core Monthly
pH pH units Field Core Monthly
Electrical conductivity µmhos/cm Field Core Monthly
Dissolved oxygen mg/L Field Core Monthly
Temperature degrees C Field Core Monthly
Turbidity NTUs Field Core Monthly
Total dissolved solids mg/L Field Core Monthly
Total organic carbon (TOC) mg/L Field Core Monthly

CHAPTER 4: MONITORING AND REPORTING REQUIREMENTS
4-16 SAC/361896/103560003 (CRC 2010 AMR REV 3-14-2011)
Hardness mg/L Grab Core and assessmentb Monthly
Dissolved copper µg/L Grab Core and assessmentb Monthly, April and May
Propanil management plan µg/L Grab Core + assessment site F Weekly, June15 – August 3
NOTES: a Flow also may be obtained from DWR monitoring stations, where available. b Only monitored during the first two events, as required in the MRP. µg/L = micrograms per liter µmhos/cm = micromhos per centimeter cfs = cubic feet per second mg/L = milligrams per liter NTU = nephelometric turbidity unit
RPP Monitoring for the RPP is conducted during the period of peak rice pesticide use. Monitoring is conducted once per week for the first 2 weeks, then is increased to twice per week for the following 5 weeks (corresponding with peak usage), and is then decreased to once per week for the final 2 weeks. Field parameters are recorded, and samples are taken for thiobencarb analysis. The constituents and their monitoring requirements are shown in Table 4-4.
TABLE 4-4 RPP Monitoring and Reporting Requirements, 2010
Constituent Units Sample
Type
Sampling Frequency
Weeks 1–2 Weeks 3–7 Weeks 8–9
pH pH units Field Weekly Biweekly Weekly
Electrical conductivity µmhos/cm Field Weekly Biweekly Weekly
Dissolved oxygen mg/L Field Weekly Biweekly Weekly
Temperature degrees C Field Weekly Biweekly Weekly
Turbidity NTUs Field Weekly Biweekly Weekly
Thiobencarb µg/L Grab Weekly Biweekly Weekly
2010 Monitoring Calendar Due to the atypical weather conditions in 2010, rice planting was delayed. As a result, the typical April start-date for monitoring would not have captured pesticide use. Therefore, the first week of monitoring was delayed to better coincide with the peak use season. This decision was made in consultation with the CACs and CVRWQCB staff.
CWFR CWFR monitoring was conducted May through August. The first sample data was May 11, and the sampling concluded on August 24. Dissolved copper, which is specified in the MRP for monitoring in April and May, was sampled in May and June to provide for sampling during the peak copper use period.
Propanil special project monitoring was conducted weekly for 8 weeks, from June 15 through August 3. This sampling duration exceeds the requirements of the MRP and was implemented at the CRC’s discretion due to the unusual weather and planting conditions.
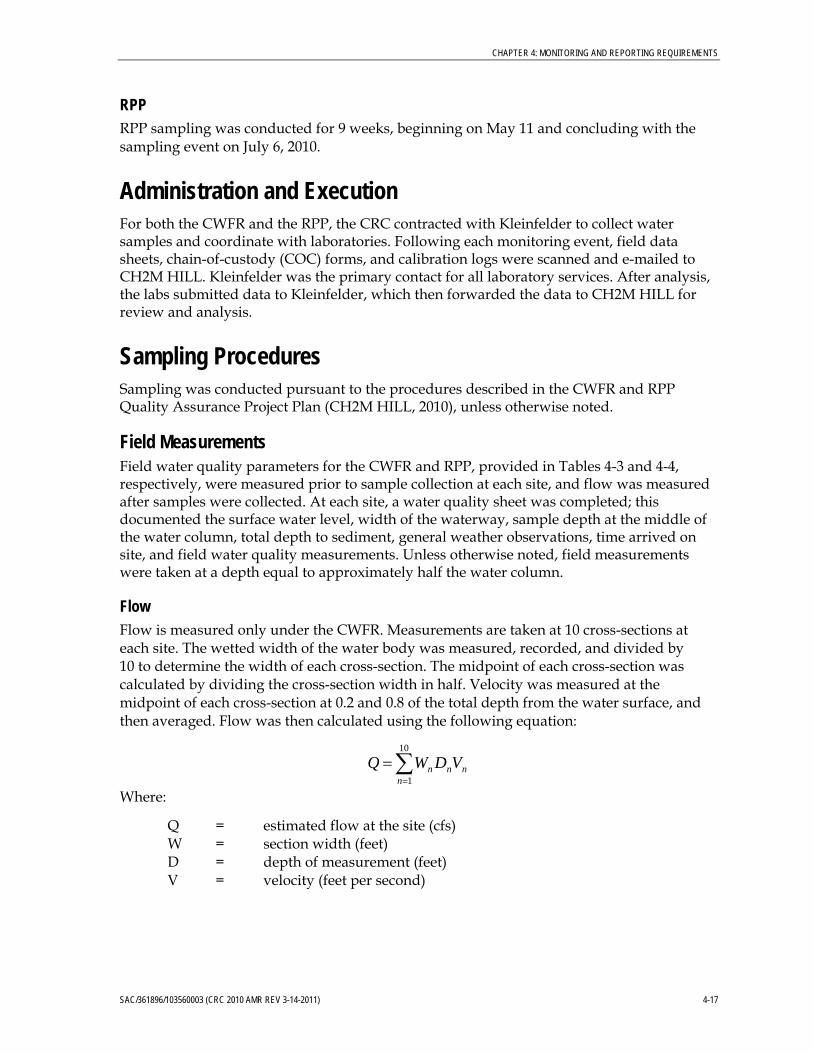
CHAPTER 4: MONITORING AND REPORTING REQUIREMENTS
SAC/361896/103560003 (CRC 2010 AMR REV 3-14-2011) 4-17
RPP RPP sampling was conducted for 9 weeks, beginning on May 11 and concluding with the sampling event on July 6, 2010.
Administration and Execution For both the CWFR and the RPP, the CRC contracted with Kleinfelder to collect water samples and coordinate with laboratories. Following each monitoring event, field data sheets, chain-of-custody (COC) forms, and calibration logs were scanned and e-mailed to CH2M HILL. Kleinfelder was the primary contact for all laboratory services. After analysis, the labs submitted data to Kleinfelder, which then forwarded the data to CH2M HILL for review and analysis.
Sampling Procedures Sampling was conducted pursuant to the procedures described in the CWFR and RPP Quality Assurance Project Plan (CH2M HILL, 2010), unless otherwise noted.
Field Measurements Field water quality parameters for the CWFR and RPP, provided in Tables 4-3 and 4-4, respectively, were measured prior to sample collection at each site, and flow was measured after samples were collected. At each site, a water quality sheet was completed; this documented the surface water level, width of the waterway, sample depth at the middle of the water column, total depth to sediment, general weather observations, time arrived on site, and field water quality measurements. Unless otherwise noted, field measurements were taken at a depth equal to approximately half the water column.
Flow Flow is measured only under the CWFR. Measurements are taken at 10 cross-sections at each site. The wetted width of the water body was measured, recorded, and divided by 10 to determine the width of each cross-section. The midpoint of each cross-section was calculated by dividing the cross-section width in half. Velocity was measured at the midpoint of each cross-section at 0.2 and 0.8 of the total depth from the water surface, and then averaged. Flow was then calculated using the following equation:
10
1nnnn VDWQ
Where:
Q = estimated flow at the site (cfs) W = section width (feet) D = depth of measurement (feet) V = velocity (feet per second)
CHAPTER 4: MONITORING AND REPORTING REQUIREMENTS
4-18 SAC/361896/103560003 (CRC 2010 AMR REV 3-14-2011)
Electrical Conductivity, Dissolved Oxygen, Temperature, and pH Electrical conductivity (EC), dissolved oxygen (DO), temperature, and pH measurements are taken for both the CWFR and RPP monitoring programs. These parameters were measured using a multiprobe instrument that was lowered directly into the water column. The meter was allowed to equilibrate for at least 90 seconds before data were recorded. The meter was calibrated at the beginning of the sampling day. Calibration logs for the CWFR monitoring events are included in Appendix B-1 and the logs for the RPP monitoring events are included in Appendix C-1.
Turbidity Turbidity was measured using a turbidity meter. Turbidity measurements were recorded for both the CWFR and the RPP.
Grab Samples For both the CWFR and the RPP, grab samples were collected by a qualified and trained crew of Kleinfelder technicians. The water grab samples were collected using a Kemmerer water sampler (either stainless steel and Teflon model or clear acrylic and PVC model; approximately 1.5-liter volume) at a depth equal to one-half the water column. The Kemmerer was emptied into a stainless steel container and the process repeated until the appropriate volume of water was acquired to split into the required number of samples. This process allowed for homogenization as additional sample volume was added to the container. Certified sample containers were filled with the composite sample using a stainless steel funnel, with an additional bottle filled to be held in sample control as a back-up sample.
Non-disposable equipment used in sample collection was decontaminated after each use by rinsing thoroughly with distilled water. The sample equipment was also rinsed at each site with water from the middle of the water column before sample collection. Clean sampling equipment was not allowed to touch the ground, and field personnel wore clean, disposable gloves. New, clean sample bottles and jars were provided by the analytical laboratories or purchased from a supply company.
Sample containers were labeled at the time of sample collection with a unique sample ID number. The label also contained the following information:
Sample ID Sample location Date and time of sample collection Kleinfelder project number Sampling technician identification
Samples were held on wet or blue ice at 4°C until delivered to the laboratory for analysis.
Sample Custody and Documentation For both the CWFR and the RPP, custody of samples was maintained and documented from the time of sample collection to completion of analysis. Each sample was considered to be in the sampler’s custody, and the sampler was responsible for the care and custody of the

CHAPTER 4: MONITORING AND REPORTING REQUIREMENTS
SAC/361896/103560003 (CRC 2010 AMR REV 3-14-2011) 4-19
samples until they were delivered to the laboratory. Field data sheets and copies of COC forms were maintained in the project file for samples collected during each event.
A COC form, sample labels, and field documentation were crosschecked to verify sample identification, type of analyses, sample volume, and number and type of containers.
Field data sheets, COC forms, and calibration forms were scanned by Kleinfelder and submitted to CH2M HILL. CWFR and RPP COC forms are included in Appendixes B-1 and C-1, respectively.
Sample Delivery and Analysis For both the CWFR and the RPP, after each sampling event, Kleinfelder submitted the samples under COC to the laboratories. Sample shipments were accompanied by the original COC form, which identified contents. Samples were transported after sample collection to the lab for analysis within the sample holding time. The laboratories performing the analyses and the methods used are listed in Table 4-5.


CHAPTER 4: MONITORING AND REPORTING REQUIREMENTS
SAC/361896/103560003 (CRC 2010 AMR REV 3-14-2011) 4-21
TABLE 4-5 Analytical Laboratories and Methods, 2010
Laboratory Analytes/Analytical Method(s) Analytical Method(s) Standard Operating Procedures Notes
McCampbell Analytical, Inc. 1534 Willow Pass Road Pittsburg, CA 94565
[email protected] (925) 252-9262
Copper and hardness
TDS
TOC
Propanil
Thiobencarb (QC samples)
EPA 200.8 and SM2340B
EPA 160.1/SM2540C
EPA 415.3
EPA 532
EPA 8141A
California Laboratory Services 3249 Fitzgerald Road Rancho Cordova, CA 95742
Thiobencarb (QC samples) EPA 507
Valent Dublin Laboratory (Registrant Laboratory) 6560 Trinity Court Dublin, CA 94568
Thiobencarb Registrant method Analyzed under the RPP


SAC/361896/103560003 (CRC 2010 AMR REV 3-14-2011) 5-1
CHAPTER 5
2010 Monitoring
The 2010 CWFR and RPP monitoring season information and results are provided separately according to the relevant required information for each program. CWFR monitoring information is provided in the following manner:
Sampling schedule Field parameter results 2010 flow data Dissolved copper and hardness analysis Algae Management Plan (AMP) Propanil Management Plan
RPP monitoring information is provided in this manner:
RPP Performance Goals Water holds Pesticides monitored Sampling schedule Sampling collection, delivery, and analysis Results
CWFR Monitoring Monitoring is conducted under the CWFR according to the MRP. Monitoring at the four core sites included measurement of general physical parameters (including lab analysis of dissolved copper, total dissolved solids [TDS], and total organic carbon [TOC]). Monitoring at the three assessment sites included only dissolved copper and hardness; this monitoring was included to complete the assessment monitoring from 2009. The 2010 CWFR monitoring requirements and results follow.
Sampling Schedule The MRP specifies the general calendar for monitoring. Based on an understanding of the rice growing season, a rice-specific monitoring calendar was developed to sample the April through August “irrigation season,” with an event in August to sample a typical drainage event. In 2010, sampling was conducted as shown in Table 5-1, which lists regularly scheduled monitoring. No resampling was required in 2010.
Field Parameter Results The following field parameters were measured as part of the 2010 sampling effort: temperature, DO, pH, electrical conductivity (EC), turbidity, and flow.

CHAPTER 5: 2010 MONITORING
5-2 SAC/361896/103560003 (CRC 2010 AMR REV 3-14-2011)
TABLE 5-1 2010 Sampling Calendar
Event Type Month Date Field Copper Hardness TDS TOC QC Samples Assessment Sites – Dissolved Copper
Irrigation May 5/11 and 5/12/2010 CBD5
June 6/15 and 6/16/2010 LE CBD1
July 7/20/2010 NR NR NA NR
August 8/24/2010 NR NR NA NR
NOTES: No resampling was required during the 2010 monitoring season. NR = not required by the MRP LE = omitted by the lab; lab error in reading Chain of Custody form and sample was outside of holding time upon detection of omission NA = not applicable

CHAPTER 5: 2010 MONITORING
SAC/361896/103560003 (CRC 2010 AMR REV 3-14-2011) 5-3
Temperature Measurements Temperature measurements were taken during field sampling using the multiprobe instrument. Figure 5-1 shows the field temperature results from the 2010 season. Temperatures in water bodies are typically lowest in the winter and highest in the summer. In 2010, peak water temperatures were observed during the July sampling event, with a high of 83.1°F. As seen in previous years, water temperature in these water bodies essentially tracks with ambient air temperatures. During the peak temperatures, these bodies of water would not provide habitat for coldwater fisheries, although they may provide coldwater habitat during other times of the year.
FIGURE 5-1
Field Temperature Measurements, 2010
55.0
60.0
65.0
70.0
75.0
80.0
85.0
CWFR
May Event & RPP W
eek 1
RPP W
eek 2
RPP W
3D1
RPP W
3D2
RPP W
4D1
RPP W
4D2
RPP W
5D1
RPP W
5D2
CWFR
June Even
t & RPP W
6D1
RPP W
6D2
RPP W
7D1
RPP W
7D2
RPP W
8D1
RPP W
9D1
CWFR
July Event
CWFR
August Event
Temperature (degrees Fahrenheit)
Sample Event
2010 Field Measurements ‐ Temperature
F
BS1
CBD5
CBD1
SSB
G
H

CHAPTER 5: 2010 MONITORING
5-4 SAC/361896/103560003 (CRC 2010 AMR REV 3-14-2011)
Table 5-2 presents tabulated temperature results and basic summary information, including site minimum, maximum, mean, and median observed temperatures, as well as event minimum, maximum, mean, and median observed temperatures. Table 5-2 also includes an evaluation of the number of times and the frequency with which the observed field temperature exceeded 68°F, which is the Basin Plan water quality objective (WQO) for the lower Sacramento River.
DO Measurements The multiprobe instrument was used to take field DO measurements. Figure 5-2 shows the results of DO measurements taken during the 2010 monitoring season. Table 5-3 presents tabulated DO results and basic summary information, including site minimum, maximum, mean, and median observed DO, as well as event minimum, maximum, mean, and median observed DO. Table 5-3 also includes an evaluation of the number of times and the frequency with which the observed field DO values were less than 5 mg/L, 6 mg/L, and 7 mg/L.
FIGURE 5-2
Dissolved Oxygen Field Measurements, 2010
2.0
3.0
4.0
5.0
6.0
7.0
8.0
9.0
10.0
CWFR
May Event & RPP W
eek 1
RPP W
eek 2
RPP W
3D1
RPP W
3D2
RPP W
4D1
RPP W
4D2
RPP W
5D1
RPP W
5D2
CWFR
June Even
t & RPP W
6D1
RPP W
6D2
RPP W
7D1
RPP W
7D2
RPP W
8D1
RPP W
9D1
CWFR
July Event
CWFR
August Event
Dissolved Oxygen Concentration (mg/L)
Sample Event
2010 Field Measurements ‐ Dissolved Oxygen
F
BS1
CBD5
CBD1
SSB
G
H
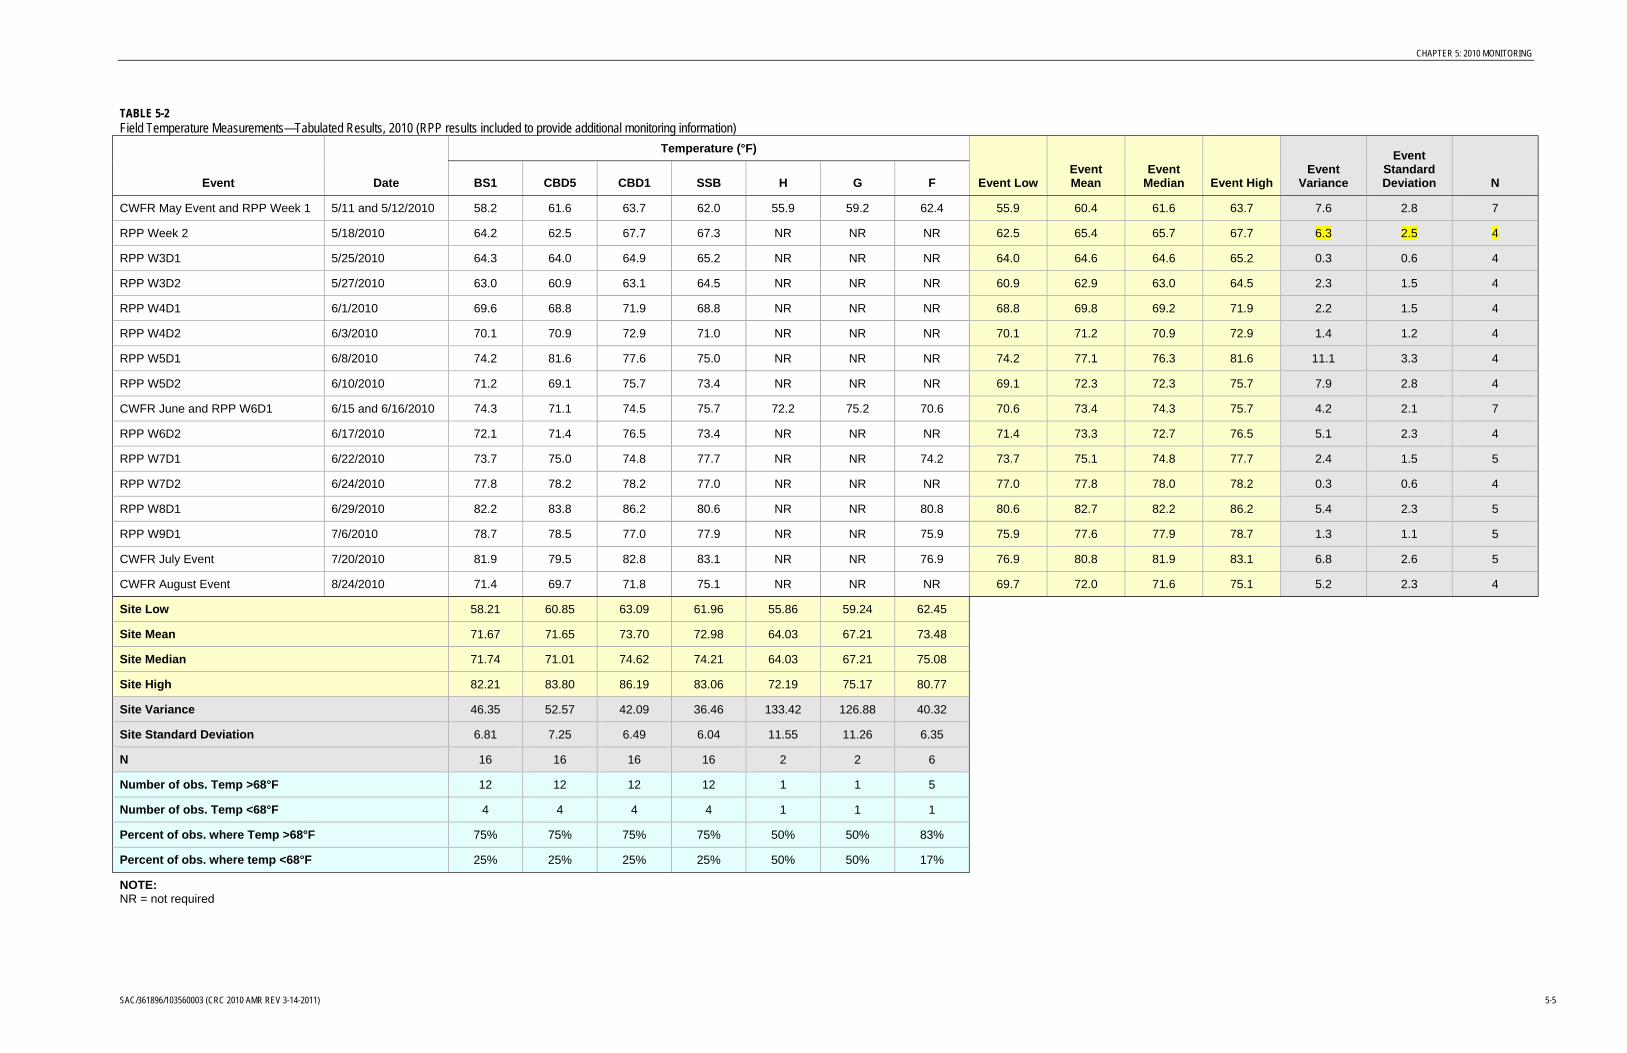
CHAPTER 5: 2010 MONITORING
SAC/361896/103560003 (CRC 2010 AMR REV 3-14-2011) 5-5
TABLE 5-2 Field Temperature Measurements—Tabulated Results, 2010 (RPP results included to provide additional monitoring information)
Event Date
Temperature (°F)
Event Low Event Mean
Event Median Event High
Event Variance
Event Standard Deviation N BS1 CBD5 CBD1 SSB H G F
CWFR May Event and RPP Week 1 5/11 and 5/12/2010 58.2 61.6 63.7 62.0 55.9 59.2 62.4 55.9 60.4 61.6 63.7 7.6 2.8 7
RPP Week 2 5/18/2010 64.2 62.5 67.7 67.3 NR NR NR 62.5 65.4 65.7 67.7 6.3 2.5 4
RPP W3D1 5/25/2010 64.3 64.0 64.9 65.2 NR NR NR 64.0 64.6 64.6 65.2 0.3 0.6 4
RPP W3D2 5/27/2010 63.0 60.9 63.1 64.5 NR NR NR 60.9 62.9 63.0 64.5 2.3 1.5 4
RPP W4D1 6/1/2010 69.6 68.8 71.9 68.8 NR NR NR 68.8 69.8 69.2 71.9 2.2 1.5 4
RPP W4D2 6/3/2010 70.1 70.9 72.9 71.0 NR NR NR 70.1 71.2 70.9 72.9 1.4 1.2 4
RPP W5D1 6/8/2010 74.2 81.6 77.6 75.0 NR NR NR 74.2 77.1 76.3 81.6 11.1 3.3 4
RPP W5D2 6/10/2010 71.2 69.1 75.7 73.4 NR NR NR 69.1 72.3 72.3 75.7 7.9 2.8 4
CWFR June and RPP W6D1 6/15 and 6/16/2010 74.3 71.1 74.5 75.7 72.2 75.2 70.6 70.6 73.4 74.3 75.7 4.2 2.1 7
RPP W6D2 6/17/2010 72.1 71.4 76.5 73.4 NR NR NR 71.4 73.3 72.7 76.5 5.1 2.3 4
RPP W7D1 6/22/2010 73.7 75.0 74.8 77.7 NR NR 74.2 73.7 75.1 74.8 77.7 2.4 1.5 5
RPP W7D2 6/24/2010 77.8 78.2 78.2 77.0 NR NR NR 77.0 77.8 78.0 78.2 0.3 0.6 4
RPP W8D1 6/29/2010 82.2 83.8 86.2 80.6 NR NR 80.8 80.6 82.7 82.2 86.2 5.4 2.3 5
RPP W9D1 7/6/2010 78.7 78.5 77.0 77.9 NR NR 75.9 75.9 77.6 77.9 78.7 1.3 1.1 5
CWFR July Event 7/20/2010 81.9 79.5 82.8 83.1 NR NR 76.9 76.9 80.8 81.9 83.1 6.8 2.6 5
CWFR August Event 8/24/2010 71.4 69.7 71.8 75.1 NR NR NR 69.7 72.0 71.6 75.1 5.2 2.3 4
Site Low 58.21 60.85 63.09 61.96 55.86 59.24 62.45
Site Mean 71.67 71.65 73.70 72.98 64.03 67.21 73.48
Site Median 71.74 71.01 74.62 74.21 64.03 67.21 75.08
Site High 82.21 83.80 86.19 83.06 72.19 75.17 80.77
Site Variance 46.35 52.57 42.09 36.46 133.42 126.88 40.32
Site Standard Deviation 6.81 7.25 6.49 6.04 11.55 11.26 6.35
N 16 16 16 16 2 2 6
Number of obs. Temp >68°F 12 12 12 12 1 1 5
Number of obs. Temp <68°F 4 4 4 4 1 1 1
Percent of obs. where Temp >68°F 75% 75% 75% 75% 50% 50% 83%
Percent of obs. where temp <68°F 25% 25% 25% 25% 50% 50% 17%
NOTE: NR = not required


CHAPTER 5: 2010 MONITORING
SAC/361896/103560003 (CRC 2010 AMR REV 3-14-2011) 5-7
TABLE 5-3 Dissolved Oxygen Field Measurements—Tabulated Results, 2010 (RPP results included to provide additional monitoring information)
Event Date
Dissolved Oxygen Concentration (mg/L) Event Low
Event Mean
Event Median
Event High
Event Variance
Event StandardDeviation N
Number of obs. DO<7
Number of obs. DO<6
Number of obs. DO<5
Percent of obs. DO<7
Percent of obs. DO<6
Percent of obs. DO<5 BS1 CBD5 CBD1 SSB H G F
CWFR May Event and RPP Week 1
5/11 and 5/12/2010 8.61 8.61 7.12 8.34 7.98 9.14 8.70 7.12 8.35 8.61 9.14 0.42 0.65 7 0 0 0 0% 0% 0%
RPP Week 2 5/18/2010 6.90 8.47 4.71 7.82 NR NR NR 4.71 6.97 7.36 8.47 2.70 1.64 4 2 1 1 50% 25% 25%
RPP W3D1 5/25/2010 7.36 8.69 7.36 7.96 NR NR NR 7.36 7.84 7.66 8.69 0.40 0.63 4 0 0 0 0% 0% 0%
RPP W3D2 5/27/2010 8.32 10.40 8.66 8.80 NR NR NR 8.32 9.04 8.73 10.40 0.86 0.93 4 0 0 0 0% 0% 0%
RPP W4D1 6/1/2010 6.65 7.57 5.71 7.66 NR NR NR 5.71 6.89 7.11 7.66 0.84 0.92 4 2 1 0 50% 25% 0%
RPP W4D2 6/3/2010 7.14 8.00 5.99 7.44 NR NR NR 5.99 7.14 7.29 8.00 0.72 0.85 4 1 1 0 25% 25% 0%
RPP W5D1 6/8/2010 6.82 6.84 5.86 6.40 NR NR NR 5.86 6.48 6.61 6.84 0.21 0.46 4 4 1 0 100% 25% 0%
RPP W5D2 6/10/2010 6.91 8.33 6.01 6.66 NR NR NR 6.01 6.98 6.79 8.33 0.96 0.98 4 3 0 0 75% 0% 0%
CWFR June and RPP W6D1
6/15 and 6/16/2010 6.66 7.26 7.31 6.17 3.40 7.20 8.67 3.40 6.66 7.20 8.67 2.66 1.63 7 3 1 1 43% 14% 14%
RPP W6D2 6/17/2010 6.70 7.81 8.74 5.92 NR NR NR 5.92 7.29 7.25 8.74 1.53 1.24 4 2 1 0 50% 25% 0%
RPP W7D1 6/22/2010 7.10 8.50 5.81 6.89 NR NR 7.05 5.81 7.07 7.05 8.50 0.92 0.96 5 2 1 0 40% 20% 0%
RPP W7D2 6/24/2010 5.71 6.08 4.37 5.07 NR NR NR 4.37 5.30 5.39 6.08 0.57 0.75 4 4 3 1 100% 75% 25%
RPP W8D1 6/29/2010 5.10 5.45 4.48 4.72 NR NR 7.45 4.48 5.44 5.10 7.45 1.40 1.18 5 4 4 2 80% 80% 40%
RPP W9D1 7/6/2010 5.89 6.44 2.21 5.34 NR NR 8.23 2.21 5.62 5.89 8.23 4.82 2.20 5 4 3 1 80% 60% 20%
CWFR July Event 7/20/2010 5.76 6.25 3.44 6.21 NR NR 7.76 3.44 5.88 6.21 7.76 2.44 1.56 5 4 2 1 80% 40% 20%
CWFR August Event
8/24/2010 7.19 7.50 6.24 6.36 NR NR NR 6.24 6.82 6.77 7.50 0.38 0.62 4 2 0 0 50% 0% 0%
Site Low 5.10 5.45 2.21 4.72 3.40 7.20 7.05
Site Mean 6.80 7.64 5.87 6.73 5.69 8.17 7.97
Site Median 6.86 7.69 5.92 6.53 5.69 8.17 7.99
Site High 8.61 10.40 8.74 8.80 7.98 9.14 8.70
Site Variance 0.82 1.54 3.13 1.41 10.51 1.89 0.45
Site Standard Deviation 0.91 1.24 1.77 1.19 3.24 1.38 0.67
N 16 16 16 16 2 2 6
Number of obs. DO<7 10 5 11 10 1 0 0
Number of obs. DO<6 4 1 9 4 1 0 0
Number of obs. DO<5 0 0 5 1 1 0 0
Percent of obs. DO<7 63% 31% 69% 63% 50% 0% 0%
Percent of obs. DO<6 25% 6% 56% 25% 50% 0% 0%
Percent of obs. DO<5 0% 0% 31% 6% 50% 0% 0%
NOTE: NR = not required

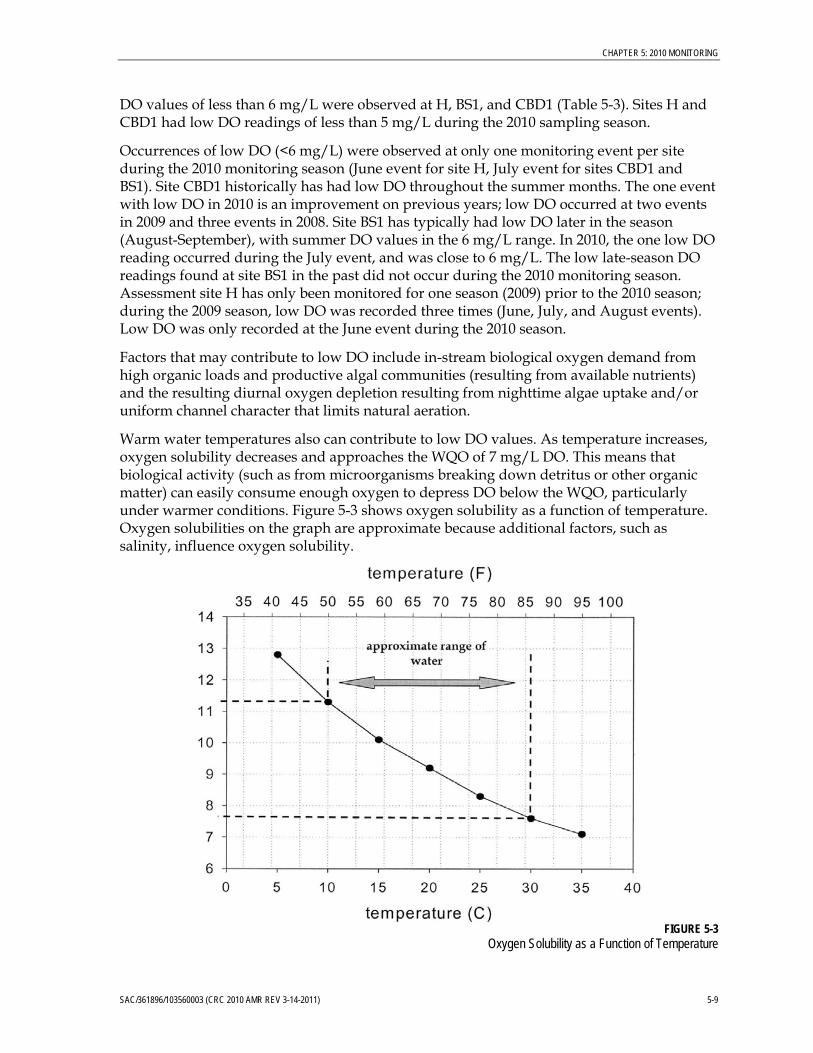
CHAPTER 5: 2010 MONITORING
SAC/361896/103560003 (CRC 2010 AMR REV 3-14-2011) 5-9
DO values of less than 6 mg/L were observed at H, BS1, and CBD1 (Table 5-3). Sites H and CBD1 had low DO readings of less than 5 mg/L during the 2010 sampling season.
Occurrences of low DO (<6 mg/L) were observed at only one monitoring event per site during the 2010 monitoring season (June event for site H, July event for sites CBD1 and BS1). Site CBD1 historically has had low DO throughout the summer months. The one event with low DO in 2010 is an improvement on previous years; low DO occurred at two events in 2009 and three events in 2008. Site BS1 has typically had low DO later in the season (August-September), with summer DO values in the 6 mg/L range. In 2010, the one low DO reading occurred during the July event, and was close to 6 mg/L. The low late-season DO readings found at site BS1 in the past did not occur during the 2010 monitoring season. Assessment site H has only been monitored for one season (2009) prior to the 2010 season; during the 2009 season, low DO was recorded three times (June, July, and August events). Low DO was only recorded at the June event during the 2010 season.
Factors that may contribute to low DO include in-stream biological oxygen demand from high organic loads and productive algal communities (resulting from available nutrients) and the resulting diurnal oxygen depletion resulting from nighttime algae uptake and/or uniform channel character that limits natural aeration.
Warm water temperatures also can contribute to low DO values. As temperature increases, oxygen solubility decreases and approaches the WQO of 7 mg/L DO. This means that biological activity (such as from microorganisms breaking down detritus or other organic matter) can easily consume enough oxygen to depress DO below the WQO, particularly under warmer conditions. Figure 5-3 shows oxygen solubility as a function of temperature. Oxygen solubilities on the graph are approximate because additional factors, such as salinity, influence oxygen solubility.
FIGURE 5-3
Oxygen Solubility as a Function of Temperature

CHAPTER 5: 2010 MONITORING
5-10 SAC/361896/103560003 (CRC 2010 AMR REV 3-14-2011)
pH Measurements The multiprobe instrument was used to measure pH in the field. Figure 5-4 shows the results of pH measurements taken during the 2010 monitoring season. Table 5-4 presents tabulated pH results and basic summary information, including site minimum, maximum, mean, and median observed pH, as well as event minimum, maximum, mean, and median observed pH. Table 5-4 also includes an evaluation of the number of times and the frequency with which the observed field pH was less than 6.5 or greater than 8.5 (WQOs). There were no observations that fell outside the 6.5 to 8.5 pH range in 2010; all samples showed achievement of water quality standards.
FIGURE 5-4
pH Field Measurements, 2010
7.0
7.5
8.0
8.5
CWFR
May Event & RPP W
eek 1
RPP W
eek 2
RPP W
3D1
RPP W
3D2
RPP W
4D1
RPP W
4D2
RPP W
5D1
RPP W
5D2
CWFR
June Even
t & RPP W
6D1
RPP W
6D2
RPP W
7D1
RPP W
7D2
RPP W
8D1
RPP W
9D1
CWFR
July Event
CWFR
August Event
pH
Sample Event
2010 Field Measurements ‐ pH
F
BS1
CBD5
CBD1
SSB
G
H
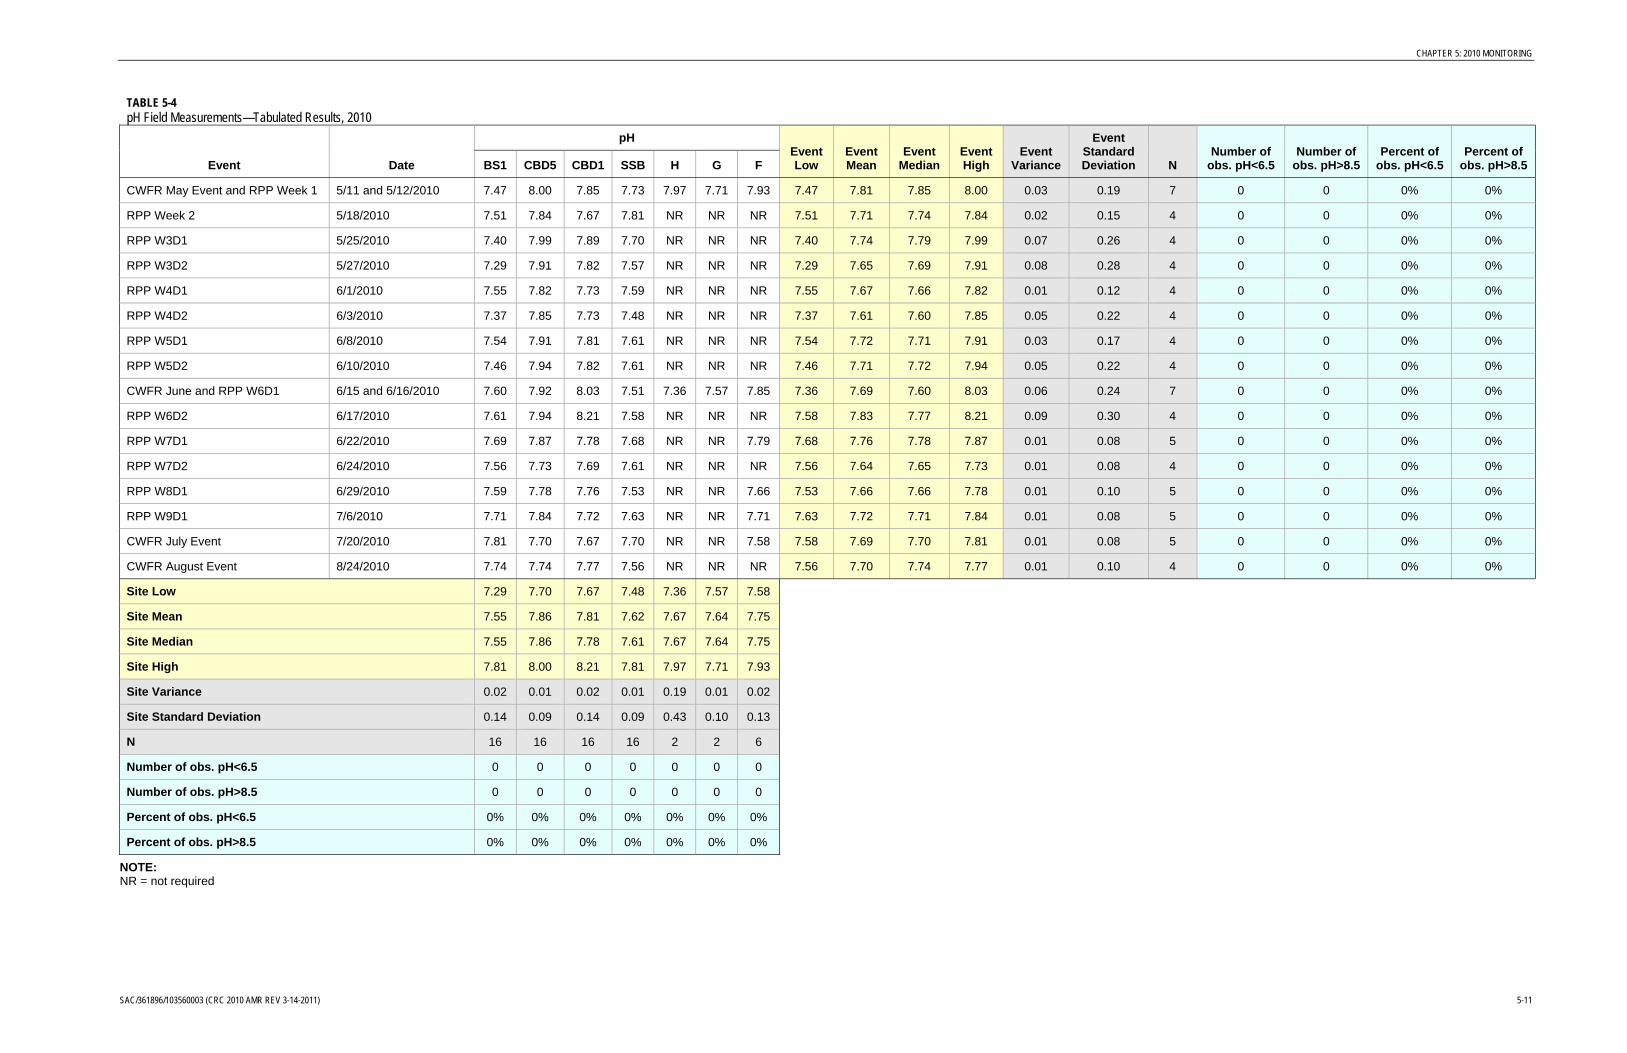
CHAPTER 5: 2010 MONITORING
SAC/361896/103560003 (CRC 2010 AMR REV 3-14-2011) 5-11
TABLE 5-4 pH Field Measurements—Tabulated Results, 2010
Event Date
pH Event Low
Event Mean
Event Median
Event High
Event Variance
Event Standard Deviation N
Number of obs. pH<6.5
Number of obs. pH>8.5
Percent of obs. pH<6.5
Percent of obs. pH>8.5 BS1 CBD5 CBD1 SSB H G F
CWFR May Event and RPP Week 1 5/11 and 5/12/2010 7.47 8.00 7.85 7.73 7.97 7.71 7.93 7.47 7.81 7.85 8.00 0.03 0.19 7 0 0 0% 0%
RPP Week 2 5/18/2010 7.51 7.84 7.67 7.81 NR NR NR 7.51 7.71 7.74 7.84 0.02 0.15 4 0 0 0% 0%
RPP W3D1 5/25/2010 7.40 7.99 7.89 7.70 NR NR NR 7.40 7.74 7.79 7.99 0.07 0.26 4 0 0 0% 0%
RPP W3D2 5/27/2010 7.29 7.91 7.82 7.57 NR NR NR 7.29 7.65 7.69 7.91 0.08 0.28 4 0 0 0% 0%
RPP W4D1 6/1/2010 7.55 7.82 7.73 7.59 NR NR NR 7.55 7.67 7.66 7.82 0.01 0.12 4 0 0 0% 0%
RPP W4D2 6/3/2010 7.37 7.85 7.73 7.48 NR NR NR 7.37 7.61 7.60 7.85 0.05 0.22 4 0 0 0% 0%
RPP W5D1 6/8/2010 7.54 7.91 7.81 7.61 NR NR NR 7.54 7.72 7.71 7.91 0.03 0.17 4 0 0 0% 0%
RPP W5D2 6/10/2010 7.46 7.94 7.82 7.61 NR NR NR 7.46 7.71 7.72 7.94 0.05 0.22 4 0 0 0% 0%
CWFR June and RPP W6D1 6/15 and 6/16/2010 7.60 7.92 8.03 7.51 7.36 7.57 7.85 7.36 7.69 7.60 8.03 0.06 0.24 7 0 0 0% 0%
RPP W6D2 6/17/2010 7.61 7.94 8.21 7.58 NR NR NR 7.58 7.83 7.77 8.21 0.09 0.30 4 0 0 0% 0%
RPP W7D1 6/22/2010 7.69 7.87 7.78 7.68 NR NR 7.79 7.68 7.76 7.78 7.87 0.01 0.08 5 0 0 0% 0%
RPP W7D2 6/24/2010 7.56 7.73 7.69 7.61 NR NR NR 7.56 7.64 7.65 7.73 0.01 0.08 4 0 0 0% 0%
RPP W8D1 6/29/2010 7.59 7.78 7.76 7.53 NR NR 7.66 7.53 7.66 7.66 7.78 0.01 0.10 5 0 0 0% 0%
RPP W9D1 7/6/2010 7.71 7.84 7.72 7.63 NR NR 7.71 7.63 7.72 7.71 7.84 0.01 0.08 5 0 0 0% 0%
CWFR July Event 7/20/2010 7.81 7.70 7.67 7.70 NR NR 7.58 7.58 7.69 7.70 7.81 0.01 0.08 5 0 0 0% 0%
CWFR August Event 8/24/2010 7.74 7.74 7.77 7.56 NR NR NR 7.56 7.70 7.74 7.77 0.01 0.10 4 0 0 0% 0%
Site Low 7.29 7.70 7.67 7.48 7.36 7.57 7.58
Site Mean 7.55 7.86 7.81 7.62 7.67 7.64 7.75
Site Median 7.55 7.86 7.78 7.61 7.67 7.64 7.75
Site High 7.81 8.00 8.21 7.81 7.97 7.71 7.93
Site Variance 0.02 0.01 0.02 0.01 0.19 0.01 0.02
Site Standard Deviation 0.14 0.09 0.14 0.09 0.43 0.10 0.13
N 16 16 16 16 2 2 6
Number of obs. pH<6.5 0 0 0 0 0 0 0
Number of obs. pH>8.5 0 0 0 0 0 0 0
Percent of obs. pH<6.5 0% 0% 0% 0% 0% 0% 0%
Percent of obs. pH>8.5 0% 0% 0% 0% 0% 0% 0%
NOTE: NR = not required

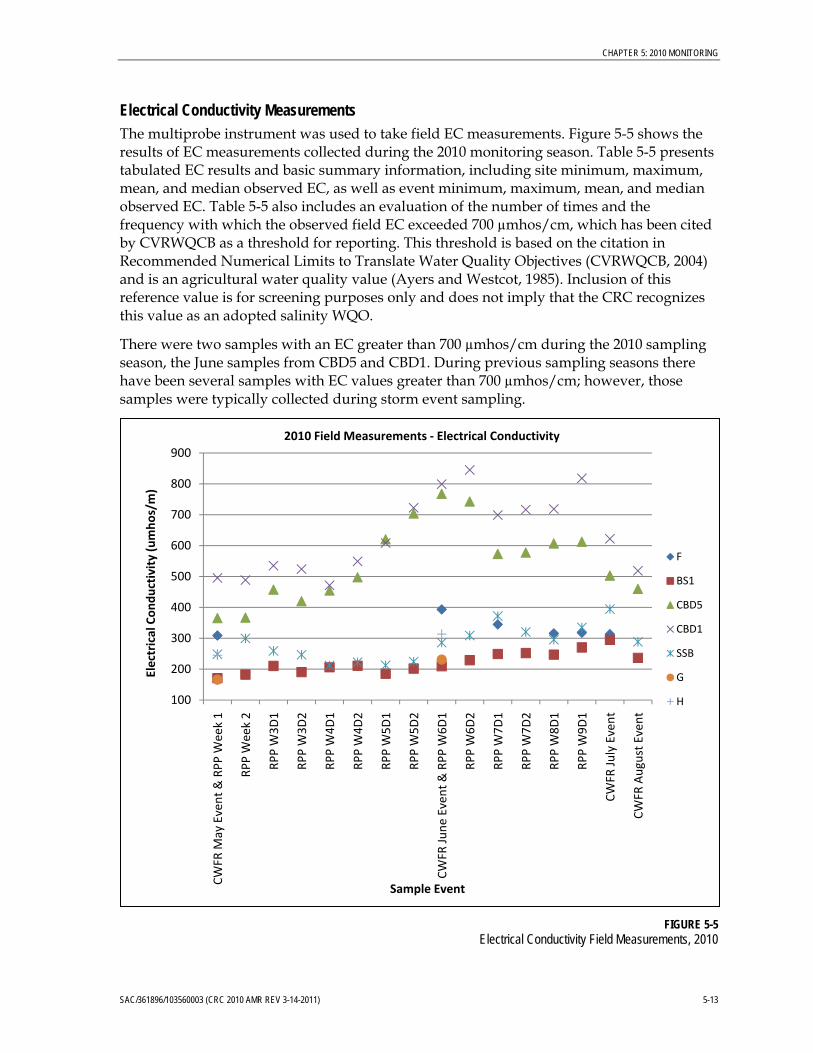
CHAPTER 5: 2010 MONITORING
SAC/361896/103560003 (CRC 2010 AMR REV 3-14-2011) 5-13
Electrical Conductivity Measurements The multiprobe instrument was used to take field EC measurements. Figure 5-5 shows the results of EC measurements collected during the 2010 monitoring season. Table 5-5 presents tabulated EC results and basic summary information, including site minimum, maximum, mean, and median observed EC, as well as event minimum, maximum, mean, and median observed EC. Table 5-5 also includes an evaluation of the number of times and the frequency with which the observed field EC exceeded 700 µmhos/cm, which has been cited by CVRWQCB as a threshold for reporting. This threshold is based on the citation in Recommended Numerical Limits to Translate Water Quality Objectives (CVRWQCB, 2004) and is an agricultural water quality value (Ayers and Westcot, 1985). Inclusion of this reference value is for screening purposes only and does not imply that the CRC recognizes this value as an adopted salinity WQO.
There were two samples with an EC greater than 700 µmhos/cm during the 2010 sampling season, the June samples from CBD5 and CBD1. During previous sampling seasons there have been several samples with EC values greater than 700 µmhos/cm; however, those samples were typically collected during storm event sampling.
FIGURE 5-5
Electrical Conductivity Field Measurements, 2010
100
200
300
400
500
600
700
800
900
CWFR
May Event & RPP W
eek 1
RPP W
eek 2
RPP W
3D1
RPP W
3D2
RPP W
4D1
RPP W
4D2
RPP W
5D1
RPP W
5D2
CWFR
June Even
t & RPP W
6D1
RPP W
6D2
RPP W
7D1
RPP W
7D2
RPP W
8D1
RPP W
9D1
CWFR
July Event
CWFR
August Event
Electrical Conductivity (umhos/m)
Sample Event
2010 Field Measurements ‐ Electrical Conductivity
F
BS1
CBD5
CBD1
SSB
G
H
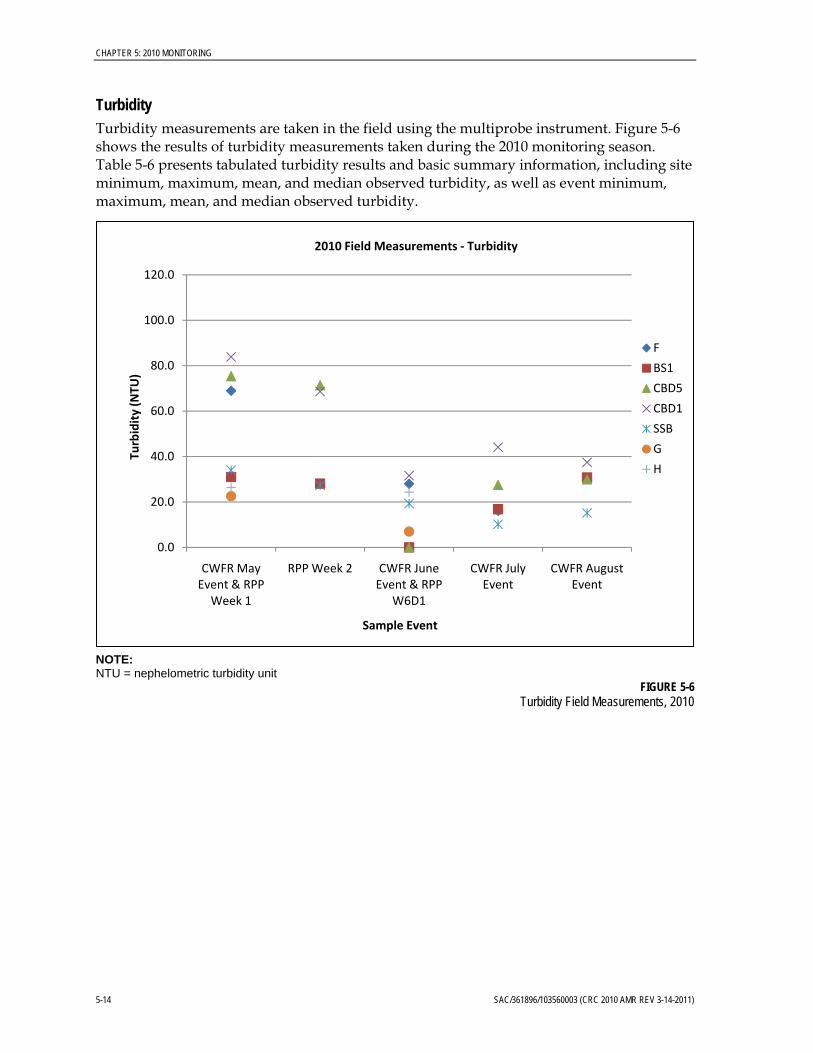
CHAPTER 5: 2010 MONITORING
5-14 SAC/361896/103560003 (CRC 2010 AMR REV 3-14-2011)
Turbidity Turbidity measurements are taken in the field using the multiprobe instrument. Figure 5-6 shows the results of turbidity measurements taken during the 2010 monitoring season. Table 5-6 presents tabulated turbidity results and basic summary information, including site minimum, maximum, mean, and median observed turbidity, as well as event minimum, maximum, mean, and median observed turbidity.
NOTE: NTU = nephelometric turbidity unit
FIGURE 5-6 Turbidity Field Measurements, 2010
0.0
20.0
40.0
60.0
80.0
100.0
120.0
CWFR May Event & RPP Week 1
RPP Week 2 CWFR June Event & RPP
W6D1
CWFR July Event
CWFR August Event
Turbidity (NTU
)
Sample Event
2010 Field Measurements ‐ Turbidity
F
BS1
CBD5
CBD1
SSB
G
H

CHAPTER 5: 2010 MONITORING
SAC/361896/103560003 (CRC 2010 AMR REV 3-14-2011) 5-15
TABLE 5-5 Electrical Conductivity Field Measurements—Tabulated Results, 2010
Event Date
Electrical Conductivity (µS/cm) Event Low
Event Mean
Event Median
Event High
Event Variance
Event Std. Deviation N
Number of obs. EC>700
Percent of obs. EC>700 BS1 CBD5 CBD1 SSB H G F
CWFR May Event and RPP Week 1 5/11 and 5/12/2010 171 366 496 249 245 166 309 166 286 249 496 13,575 117 7 0 0%
RPP Week 2 5/18/2010 183 367 489 300 NR NR NR 183 334 333 489 16,367 128 4 0 0%
RPP W3D1 5/25/2010 211 458 535 259 NR NR NR 211 366 358 535 24,187 156 4 0 0%
RPP W3D2 5/27/2010 191 420 524 247 NR NR NR 191 345 333 524 23,746 154 4 0 0%
RPP W4D1 6/1/2010 206 455 472 212 NR NR NR 206 336 333 472 21,560 147 4 0 0%
RPP W4D2 6/3/2010 211 498 549 223 NR NR NR 211 370 360 549 31,778 178 4 0 0%
RPP W5D1 6/8/2010 186 621 609 213 NR NR NR 186 407 411 621 57,692 240 4 0 0%
RPP W5D2 6/10/2010 202 704 723 225 NR NR NR 202 463 464 723 83,475 289 4 2 50%
CWFR June and RPP W6D1 6/15 and 6/16/2010 210 768 799 286 314 231 394 210 429 314 799 62,319 250 7 2 29%
RPP W6D2 6/17/2010 229 743 845 309 NR NR NR 229 532 526 845 94,676 308 4 2 50%
RPP W7D1 6/22/2010 249 573 699 372 NR NR 345 249 448 372 699 33,653 183 5 0 0%
RPP W7D2 6/24/2010 252 578 717 321 NR NR NR 252 467 449 717 47,382 218 4 1 25%
RPP W8D1 6/29/2010 247 607 719 296 NR NR 316 247 437 316 719 44,726 211 5 1 20%
RPP W9D1 7/6/2010 271 613 818 335 NR NR 318 271 471 335 818 55,634 236 5 1 20%
CWFR July Event 7/20/2010 295 503 622 395 NR NR 314 295 426 395 622 18,788 137 5 0 0%
CWFR August Event 8/24/2010 237 460 519 289 NR NR NR 237 376 374 519 18,160 135 4 0 0%
Site Low 171 366 472 212 245 166 309
Site Mean 222 546 633 283 279 199 333
Site Median 211 538 615 287 279 199 317
Site High 295 768 845 395 314 231 394
Site Variance 1,183 15,770 16,108 3,053 2,346 2,113 1,055
Site Std. Deviation 34.4 125.6 126.9 55.3 48.4 46.0 32.5
N 16 16 16 16 2 2 6
Number of obs. EC>700 0 3 6 0 0 0 0
Percent of obs. EC>700 0% 19% 38% 0% 0% 0% 0%
NOTE: NR = not required


CHAPTER 5: 2010 MONITORING
SAC/361896/103560003 (CRC 2010 AMR REV 3-14-2011) 5-17
TABLE 5-6 Turbidity Field Results—Tabulated Results, 2010
Event Date
Turbidity (NTU) Event Low
Event Mean
Event Median
Event High
Event Variance
Event Standard Deviation N BS1 CBD5 CBD1 SSB H G F
CWFR May Event and RPP Week 1 5/11 - 5/12/2010 30.99 75.38 83.87 34.01 26.43 22.53 68.95 22.53 48.88 34.01 83.87 678.14 26.04 7
RPP Week 2 5/18/2010 28.10 71.35 68.65 27.33 NR NR NR 27.33 48.86 48.38 71.35 597.32 24.44 4
CWFR June Event and RPP W6D1 6/15 - 6/16/2010 TE TE 31.60 19.30 24.30 6.98 28.00 6.98 22.04 24.30 31.60 91.58 9.57 5
CWFR July Event 7/20/2010 16.80 27.50 44.10 10.17 NR NR 16.10 10.17 22.93 16.80 44.10 179.02 13.38 5
CWFR August Event 8/24/2010 30.75 29.92 37.45 15.14 NR NR NR 15.14 28.32 30.34 37.45 88.51 9.41 4
Site Low 16.80 27.50 31.60 10.17 24.30 6.98 16.10
Site Mean 26.66 51.04 53.13 21.19 25.37 14.76 37.68
Site Median 29.43 50.64 44.10 19.30 25.37 14.76 28.00
Site High 30.99 75.38 83.87 34.01 26.43 22.53 68.95
Site Variance 44.92 668.37 494.19 90.92 2.27 120.90 768.61
Site Standard Deviation 13.26 31.97 22.23 9.54 1.51 11.00 27.72
N 4 4 5 5 2 2 3
NOTES: NR = not required TE = Technician error. Turbidity not recorded on field sheet.

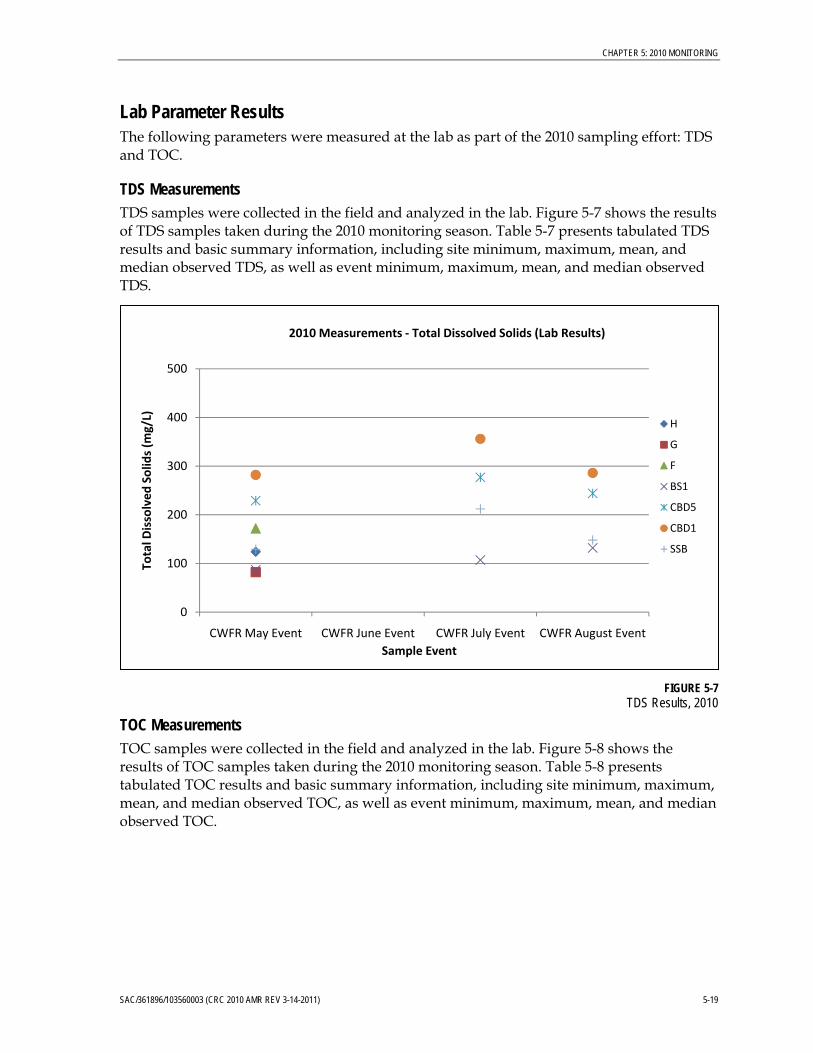
CHAPTER 5: 2010 MONITORING
SAC/361896/103560003 (CRC 2010 AMR REV 3-14-2011) 5-19
Lab Parameter Results The following parameters were measured at the lab as part of the 2010 sampling effort: TDS and TOC.
TDS Measurements TDS samples were collected in the field and analyzed in the lab. Figure 5-7 shows the results of TDS samples taken during the 2010 monitoring season. Table 5-7 presents tabulated TDS results and basic summary information, including site minimum, maximum, mean, and median observed TDS, as well as event minimum, maximum, mean, and median observed TDS.
FIGURE 5-7
TDS Results, 2010
TOC Measurements TOC samples were collected in the field and analyzed in the lab. Figure 5-8 shows the results of TOC samples taken during the 2010 monitoring season. Table 5-8 presents tabulated TOC results and basic summary information, including site minimum, maximum, mean, and median observed TOC, as well as event minimum, maximum, mean, and median observed TOC.
0
100
200
300
400
500
CWFR May Event CWFR June Event CWFR July Event CWFR August Event
Total D
issolved Solid
s (m
g/L)
Sample Event
2010 Measurements ‐ Total Dissolved Solids (Lab Results)
H
G
F
BS1
CBD5
CBD1
SSB
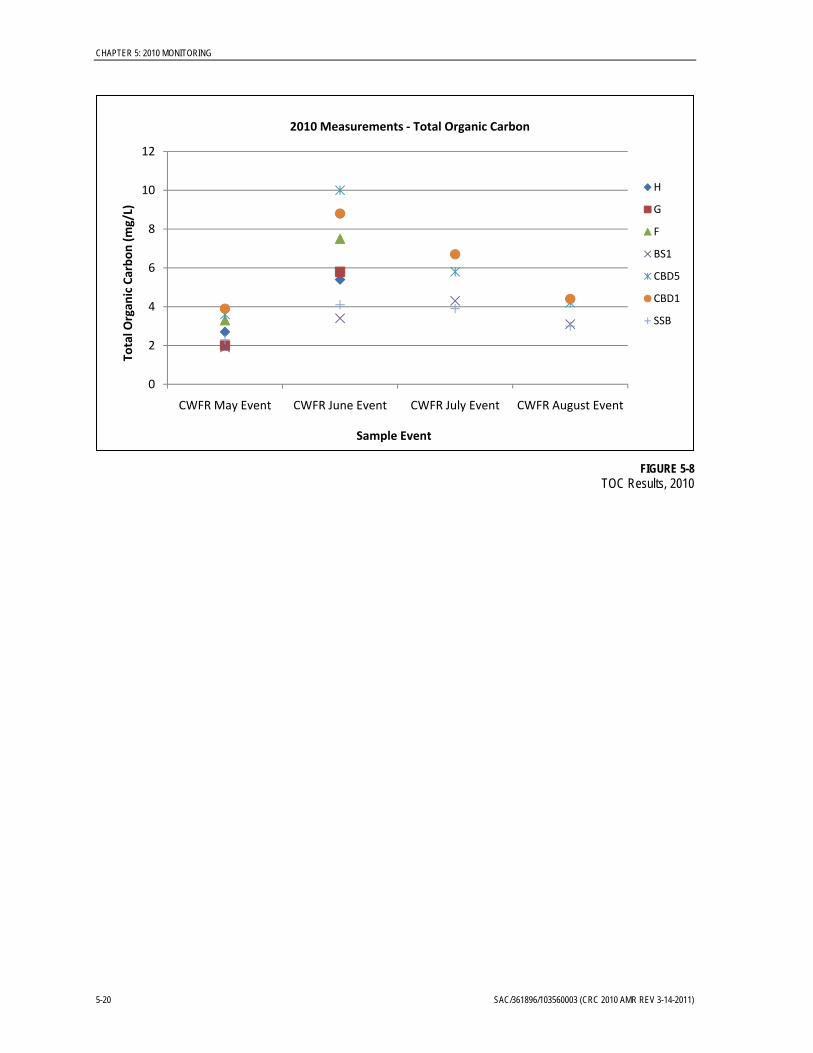
CHAPTER 5: 2010 MONITORING
5-20 SAC/361896/103560003 (CRC 2010 AMR REV 3-14-2011)
FIGURE 5-8
TOC Results, 2010
0
2
4
6
8
10
12
CWFR May Event CWFR June Event CWFR July Event CWFR August Event
Total O
rgan
ic Carbon (mg/L)
Sample Event
2010 Measurements ‐ Total Organic Carbon
H
G
F
BS1
CBD5
CBD1
SSB
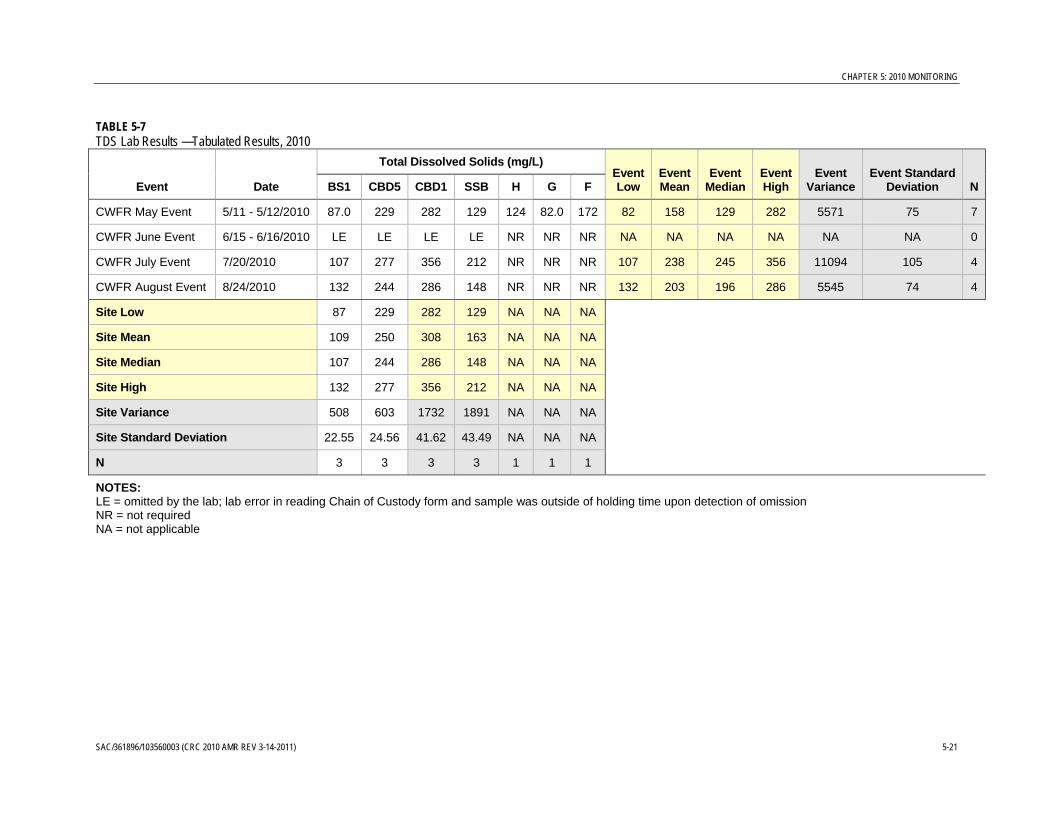
CHAPTER 5: 2010 MONITORING
SAC/361896/103560003 (CRC 2010 AMR REV 3-14-2011) 5-21
TABLE 5-7 TDS Lab Results —Tabulated Results, 2010
Event Date
Total Dissolved Solids (mg/L) Event Low
Event Mean
Event Median
Event High
Event Variance
Event Standard Deviation N BS1 CBD5 CBD1 SSB H G F
CWFR May Event 5/11 - 5/12/2010 87.0 229 282 129 124 82.0 172 82 158 129 282 5571 75 7
CWFR June Event 6/15 - 6/16/2010 LE LE LE LE NR NR NR NA NA NA NA NA NA 0
CWFR July Event 7/20/2010 107 277 356 212 NR NR NR 107 238 245 356 11094 105 4
CWFR August Event 8/24/2010 132 244 286 148 NR NR NR 132 203 196 286 5545 74 4
Site Low 87 229 282 129 NA NA NA
Site Mean 109 250 308 163 NA NA NA
Site Median 107 244 286 148 NA NA NA
Site High 132 277 356 212 NA NA NA
Site Variance 508 603 1732 1891 NA NA NA
Site Standard Deviation 22.55 24.56 41.62 43.49 NA NA NA
N 3 3 3 3 1 1 1
NOTES: LE = omitted by the lab; lab error in reading Chain of Custody form and sample was outside of holding time upon detection of omission NR = not required NA = not applicable

CHAPTER 5: 2010 MONITORING
5-22 SAC/361896/103560003 (CRC 2010 AMR REV 3-14-2011)
TABLE 5-8 TOC Lab Results —Tabulated Results, 2010
Event Date
Total Organic Carbon (mg/L) Event Low
Event Mean
Event Median
Event High
Event Variance
Event Standard Deviation N BS1 CBD5 CBD1 SSB H G F
CWFR May Event 5/11 - 5/12/2010 1.9 3.6 3.9 2.3 2.7 2.0 3.3 1.9 2.8 2.7 3.9 1 1 7
CWFR June Event 6/15 - 6/16/2010 3.4 10 8.8 4.1 5.4 5.8 7.5 3.4 6.4 5.8 10.0 6 2 7
CWFR July Event 7/20/2010 4.3 5.8 6.7 3.9 NR NR NR 3.9 5.2 5.1 6.7 2 1 4
CWFR August Event 8/24/2010 3.1 4.2 4.4 3.0 NR NR NR 3.0 3.7 3.7 4.4 1 1 4
Site Low 1.9 3.6 3.9 2.3 2.7 2.0 3.3
Site Mean 3.2 5.9 6.0 3.3 4.1 3.9 5.4
Site Median 3.3 5.0 5.6 3.5 4.1 3.9 5.4
Site High 4.3 10.0 8.8 4.1 5.4 5.8 7.5
Site Variance 1 8 5 1 4 7 9
Site Standard Deviation 0.99 2.89 2.26 0.83 1.91 2.69 2.97
N 4 4 4 4 2 2 2
NOTE: NR =not required

CHAPTER 5: 2010 MONITORING
SAC/361896/103560003 (CRC 2010 AMR REV 3-14-2011) 5-23
2010 Flow Data Table 5-9 contains the flow data collected during the 2010 monitoring season. Flow measurements were taken at 10 cross-sections at each CWFR core and assessment monitoring site. The wetted width of the waterbody was measured, recorded, and divided by 10 to determine the width of each cross-section. The midpoint of each cross-section was calculated by dividing the cross-section width in half. Velocity was measured at the midpoint of each cross-section at 0.2 and 0.8 of the total depth from the water surface, and then averaged. Field measurements were documented on field sheets contained in Appendix B-1.
TABLE 5-9 Flow Data for the 2010 Monitoring Season
Event Date
Estimated Flow (cubic feet per second)
BS1 CBD5 CBD1 SSB H G F
May Irrigation Event 5/11 and 5/12/2010 40.5 512.8 35.8 131.5 0.0 91.8 54.5
June Irrigation Event 6/15 and 6/16/2010 67.0 82.2 0.0 149.5 1.5 69.7 41.0
July Irrigation Event 7/20/2010 19.4 613.9 87.9 19.5 NR NR 50.4
August Irrigation Event 8/24/2010 95.9 952.6 490.2 307.1 NR NR NR
NOTE: NR = not required
Dissolved Copper and Hardness Analysis Samples were collected for copper and hardness analysis during the first two events of the season, in accordance with the MRP. The first two events were chosen because they represent the time of application and possible release in rice drainage waters. Samples were analyzed for copper using U.S. Environmental Protection Agency (EPA) Method 200.8, and hardness using EPA Method 200.7 and calculation SM2340B. Results are shown in Table 5-10.
The California Toxics Rule (CTR) 1-hour maximum criterion for dissolved copper is:
1-hour maximum copper concentration (µg/L) = (e 0.9422[ln(hardness)]-1.700) × 0.960
The CTR 4-day maximum criterion for dissolved copper is:
4-day maximum copper concentration (µg/L) = (e 0.8545[ln(hardness)]-1.702) × 0.960
The hardness-adjusted copper criteria, based on the actual hardness measured for the sample location and date, are shown in Table 5-11. All of the copper samples taken during the 2010 monitoring season fell below the 1-hour copper criterion. All of the samples fell below the 4-day criterion, with the exception of the Site F sample from the June event. Based on consultation with CVRWQCB staff, it is not thought that this concentration would persist over a 4-day period at the site.

CHAPTER 5: 2010 MONITORING
5-24 SAC/361896/103560003 (CRC 2010 AMR REV 3-14-2011)
TABLE 5-10 2010 Copper and Hardness Results
Event Date
Dissolved Copper Concentration (µg/L) Hardness as CaCO3 (mg/L)
CBD5 BS1 CBD1 SSB F G H CBD5 BS1 CBD1 SSB F G H
May Irrigation Event 5/11 and 5/12/2010 2.45 ND 1.7 0.54 2.7 ND ND 110 63.0 140 95.0 81.0 71.0 97.0
June Irrigation Event 6/15 and 6/16/2010 5.9 1.7 6.0 2.3 9.0 3.7 2.1 200 92.0 210 120 87.0 110 150
TABLE 5-11 Hardness adjusted CTR Copper Water Quality Criteria (1h and 4 day maximum)
Event Date
1 hr maximum copper concentration (µg/L) 4 day maximum copper concentration (µg/L)
CBD5 BS1 CBD1 SSB F G H CBD5 BS1 CBD1 SSB F G H
May Irrigation Event 5/11 and 5/12/2010 14.7 8.7 18.5 12.8 11.0 9.7 13.1 9.7 6.0 11.9 8.6 7.5 6.7 8.7
June Irrigation Event 6/15 and 6/16/2010 25.8 12.4 27.0 16.0 11.8 14.7 19.7 16.2 8.3 16.9 10.5 8.0 9.7 12.7

CHAPTER 5: 2010 MONITORING
SAC/361896/103560003 (CRC 2010 AMR REV 3-14-2011) 5-25
Management Plans CVRWQCB Resolution No. R5-2006-0077 requires that coalitions implementing water quality control programs under the Conditional Waiver submit management plans when monitoring results show two or more observed “exceedances” over a 3-year period. Past results have triggered requirements for an Algae Management Plan and a voluntary Propanil Management Plan resulting from one high monitoring result. Both final plans were submitted to the CVRWQCB in April 2010, in compliance with the 2010 MRP.
Algae Management Plan Results obtained during CRC’s 2005 through 2008 monitoring showed aquatic toxicity for Selenastrum capricornutum, an algae specified by the U.S. Environmental Protection Agency (EPA) to determine chronic aquatic toxicity of receiving waters, triggering the submittal of a Management Plan (AMP). Monitoring continued during 2009 under the 2009 Algae Management Plan. Observed toxicity for Selenastrum capricornutum was much lower during 2009 monitoring, and the frequency and magnitude of algae reductions showed a general downward trend. The 2010 AMP evaluated the toxicity and rice pesticides data collected to date, and the decision was made to commence monitoring under a core monitoring program regime and suspend additional algae toxicity testing and herbicides analysis under an AMP. The 2010 AMP, including background information on monitoring during Years 1 through 5, is attached as Appendix B-3. No algae-specific monitoring was required in 2010.
Propanil Management Plan Propanil monitoring at both assessment and core was included in 2009. The CRC surpassed the monitoring requirements by conducting additional core site propanil monitoring on a weekly basis, June through July (peak use). Results from 2009 included a detection (47 µg/L) of propanil at the assessment site location on Lurline Creek, Colusa County, California. Two additional detections of 11 and 12 µg/L (CBD5 and SSB, respectively) were noted by CVRWQCB staff. As a result, CVRWQCB staff proposed that propanil monitoring be conducted at assessment and core monitoring sites on a weekly basis during June 2010. The CRC voluntarily proposed a Propanil Management Plan in order to trigger support for additional grower education and outreach. This monitoring is considered "special project monitoring" under the conditions of the Irrigated Lands Program.
Monitoring was conducted at core sites and Lurline Creek (Assessment site F), during June, July and the first week of August. This coordinates with the typical application period for propanil. In addition to the monitoring, requirements included implementation of additional outreach activities.
Outreach activities included providing propanil use information in the CRC newsletter and grower letter, including links to the regulations, and coordination with the registrants on a brochure, Propanil Rice Herbicide: Stewardship Practices for Protecting Water Quality.
The 2010 Propanil Management Plan is attached as Appendix B-4. The management plan includes background information on water quality objectives and propanil results from the 2006 through 2009 monitoring seasons.

CHAPTER 5: 2010 MONITORING
5-26 SAC/361896/103560003 (CRC 2010 AMR REV 3-14-2011)
Results
Field sheets and results for the propanil sampling are located in Appendix B-3.
Eight consecutive weeks of propanil sampling were completed in 2010 (Table 5-12). The highest detections were from the June 22 event at site CBD5 (5.0 µg/L), the June 29 event at site F (10 µg/L), and the July 6 event at site BS1 (4.4 µg/L). Results of the order of magnitude detected at site F may indicate additional assessment monitoring per discussion with the CVRWQCB staff.
The June 22 and July 6 sampling events had the most detections. The June 22 event showed concentrations above the laboratory reporting limit at three out of five sites, and the July 6 event showed concentrations about the laboratory reporting limit at four out of five sites. The last two sampling weeks (July 27 and August 3) had no detections at any of the sampling locations.
TABLE 5-12 2010 Propanil Monitoring Results
Sampling Date
Monitoring Results (µg/L) (Reporting Limit for McCampbell Analytical <0.50 µg/L)
CBD5 BS1 CBD1 SSB F
6/15/2010 3.8 ND ND ND ND
6/22/2010 5.0 0.65J 2.7 ND ND
6/29/2010 2.2J 2.8 ND ND 10
7/6/2010 1.7 4.4 2.0 ND 0.65
7/13/2010 ND 0.65 ND 0.97 ND
7/20/2010 ND ND 0.67 ND 1.2
7/27/2010 ND ND ND ND ND
8/3/2010 ND ND ND ND ND
NOTES: Concentrations are reported in µg/L (parts per billion) ND = Not detected above laboratory reporting limits J = Analyte detected below quantitation limits No numeric standard exists for propanil, so the laboratory reporting limit is used as a guideline in analyzing sampling results
RPP Monitoring Monitoring is conducted under the RPP according CVRWQCB Resolution No. R5-2007-0018. Monitoring at the five RPP sites included measurement of general field parameters and laboratory analysis of the chemical thiobencarb.
The RPP is reviewed by the CVRWQCB, which has authority to authorize the program or use another regulatory approach to achieve water quality protection, including compliance with Performance Goals and attainment of the thiobencarb water quality objective established in the Basin Plan. The RPP has achieved substantial improvements in water
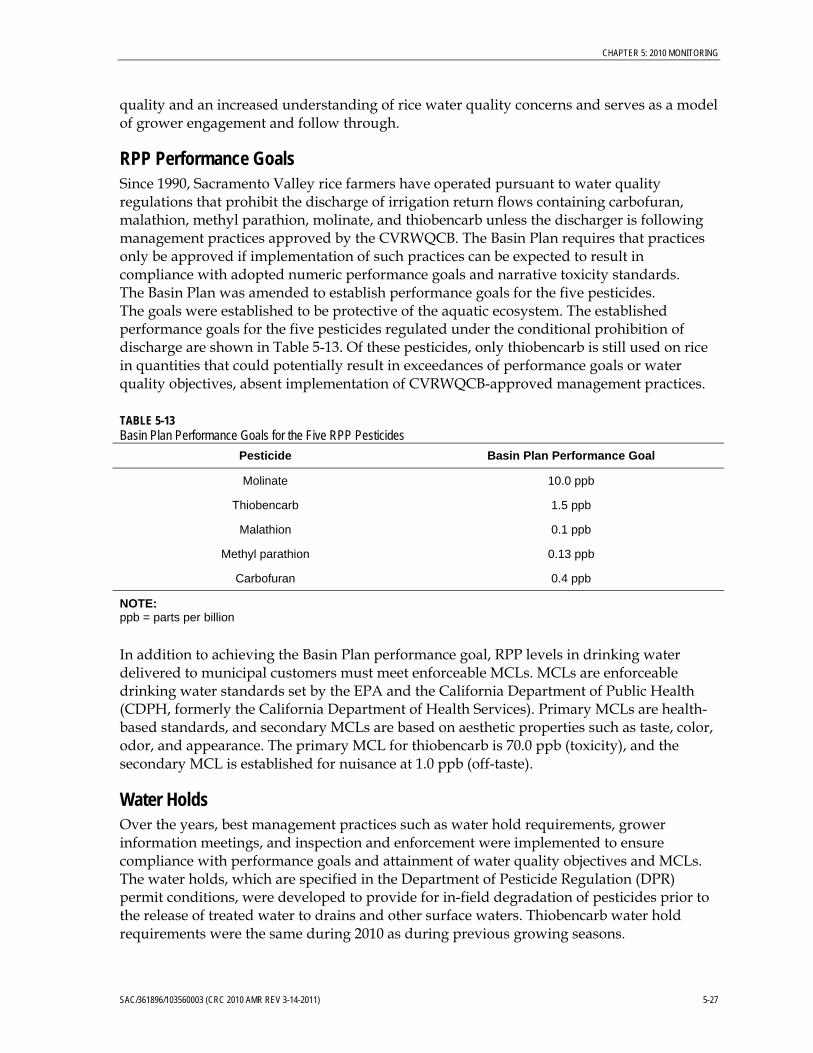
CHAPTER 5: 2010 MONITORING
SAC/361896/103560003 (CRC 2010 AMR REV 3-14-2011) 5-27
quality and an increased understanding of rice water quality concerns and serves as a model of grower engagement and follow through.
RPP Performance Goals Since 1990, Sacramento Valley rice farmers have operated pursuant to water quality regulations that prohibit the discharge of irrigation return flows containing carbofuran, malathion, methyl parathion, molinate, and thiobencarb unless the discharger is following management practices approved by the CVRWQCB. The Basin Plan requires that practices only be approved if implementation of such practices can be expected to result in compliance with adopted numeric performance goals and narrative toxicity standards. The Basin Plan was amended to establish performance goals for the five pesticides. The goals were established to be protective of the aquatic ecosystem. The established performance goals for the five pesticides regulated under the conditional prohibition of discharge are shown in Table 5-13. Of these pesticides, only thiobencarb is still used on rice in quantities that could potentially result in exceedances of performance goals or water quality objectives, absent implementation of CVRWQCB-approved management practices.
TABLE 5-13 Basin Plan Performance Goals for the Five RPP Pesticides
Pesticide Basin Plan Performance Goal
Molinate 10.0 ppb
Thiobencarb 1.5 ppb
Malathion 0.1 ppb
Methyl parathion 0.13 ppb
Carbofuran 0.4 ppb
NOTE: ppb = parts per billion
In addition to achieving the Basin Plan performance goal, RPP levels in drinking water delivered to municipal customers must meet enforceable MCLs. MCLs are enforceable drinking water standards set by the EPA and the California Department of Public Health (CDPH, formerly the California Department of Health Services). Primary MCLs are health-based standards, and secondary MCLs are based on aesthetic properties such as taste, color, odor, and appearance. The primary MCL for thiobencarb is 70.0 ppb (toxicity), and the secondary MCL is established for nuisance at 1.0 ppb (off-taste).
Water Holds Over the years, best management practices such as water hold requirements, grower information meetings, and inspection and enforcement were implemented to ensure compliance with performance goals and attainment of water quality objectives and MCLs. The water holds, which are specified in the Department of Pesticide Regulation (DPR) permit conditions, were developed to provide for in-field degradation of pesticides prior to the release of treated water to drains and other surface waters. Thiobencarb water hold requirements were the same during 2010 as during previous growing seasons.

CHAPTER 5: 2010 MONITORING
5-28 SAC/361896/103560003 (CRC 2010 AMR REV 3-14-2011)
Pesticides Monitored RPP samples were analyzed for thiobencarb during the 2010 monitoring season. As in recent years past, samples were not analyzed for carbofuran, malathion, and methyl-parathion because of registration cancellation, decrease in use, and no reportable applications to rice. Specifically, carbofuran is no longer registered for use on rice and has had no reportable use since 2000. Malathion has not been monitored since 2003 because of a dramatic decrease in its use. Historical information indicates that the maximum rice acreage treated with malathion was 9,278 acres in 1991. Annual malathion use on rice has been less than 1,000 acres since 2001. The preliminary 2010 DPR PUR documented no acres of malathion usage. Molinate was removed from monitoring during 2010 because it is now a prohibited pesticide and is no longer applied to rice.
Sampling Schedule The sampling calendar was developed based on historical data, rice pesticide use and drainage patterns, and actual 2010 conditions. The sampling start date was selected in consultation with growers, CACs, and CVRWQCB staff. Sampling was conducted for 9 weeks according to the schedule listed in Table 5-14. Sampling was initiated on May 11, 2010, at sites SR1, CBD1, CBD5, BS1, and SSB.
Weekly samples were collected on Tuesdays during weeks 2, 8, and 9. Samples were collected over a 2-day period (Tues/Wed) during week 1 in order to accommodate CWFR sampling. During weeks 3, 4, 5, 6, and 7, samples were collected on Tuesdays and Thursdays. The CVRWQCB requested this sampling frequency to monitor attainment of water quality performance goals established for rice pesticides; this sampling frequency provides a sound technical basis for screening for water quality concerns in order to inform prompt follow-up.
Sample Collection, Delivery, and Analysis During the 2010 sampling season water samples were collected to measure whether Basin Plan water quality performance goals were being attained. Sample analysis was conducted by the registrant laboratory, with additional samples submitted to a third-party laboratory for analysis.
Water samples were collected from specified surface water locations within the Sacramento River Basin. Each site serves as an end-of-basin drainage point designed to trigger further study and potential scrutiny, should measured conditions indicate an impact to existing (non-toxic event) in-stream habitat suitability. Sites included one river site and four drain sites, as shown on Figure 4-1. Samples were collected, split if necessary, and submitted under chain of custody directly to the analytical laboratories for thiobencarb analysis. Detailed maps of each station are included in Appendix A; field sheets and COCs are included in Appendix C-1.
TABLE 5-14 RPP Sampling Schedule, 2010
Date Event
5/11 and 5/12/10 W1
5/18/10 W2
5/25/10 W3D1
5/27/10 W3D2
6/01/10 W4D1
6/03/10 W4D2
6/08/10 W5D1
6/10/10 W5D2
6/15/10 W6D1
6/17/10 W6D2
6/22/10 W7D1
6/24/10 W7D2
6/29/10 W8
7/6/10 W9
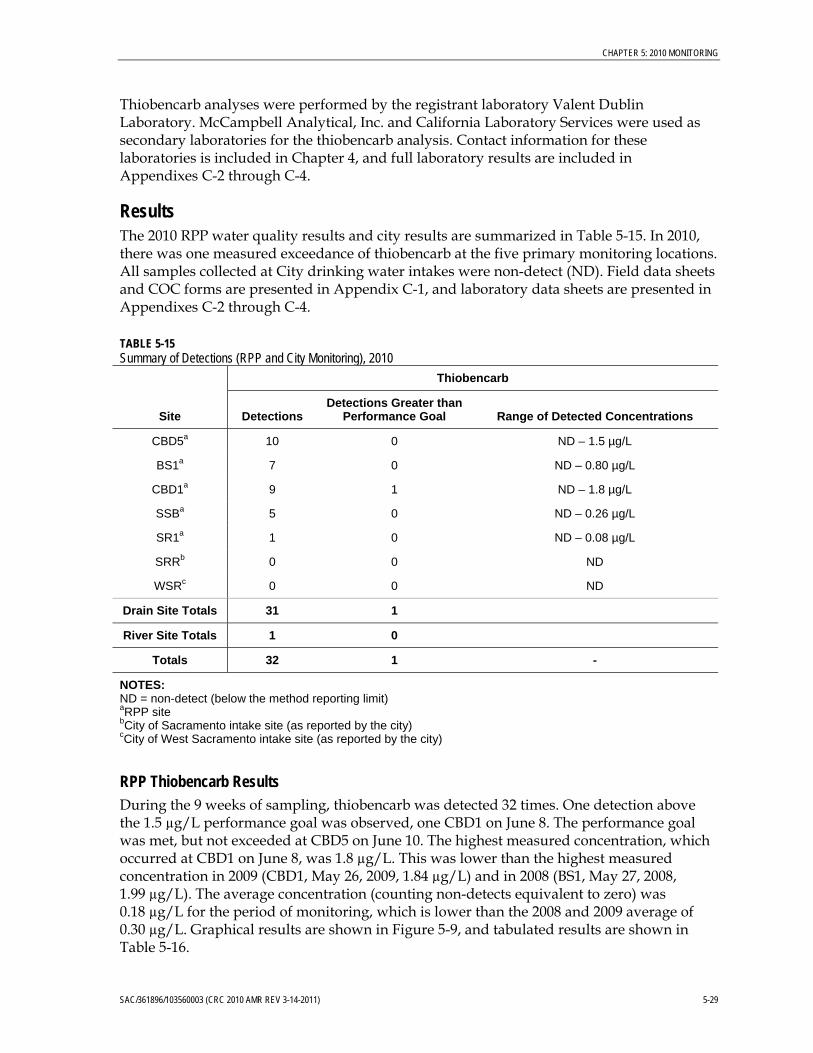
CHAPTER 5: 2010 MONITORING
SAC/361896/103560003 (CRC 2010 AMR REV 3-14-2011) 5-29
Thiobencarb analyses were performed by the registrant laboratory Valent Dublin Laboratory. McCampbell Analytical, Inc. and California Laboratory Services were used as secondary laboratories for the thiobencarb analysis. Contact information for these laboratories is included in Chapter 4, and full laboratory results are included in Appendixes C-2 through C-4.
Results The 2010 RPP water quality results and city results are summarized in Table 5-15. In 2010, there was one measured exceedance of thiobencarb at the five primary monitoring locations. All samples collected at City drinking water intakes were non-detect (ND). Field data sheets and COC forms are presented in Appendix C-1, and laboratory data sheets are presented in Appendixes C-2 through C-4.
TABLE 5-15 Summary of Detections (RPP and City Monitoring), 2010
Site
Thiobencarb
Detections Detections Greater than
Performance Goal Range of Detected Concentrations
CBD5a 10 0 ND – 1.5 µg/L
BS1a 7 0 ND – 0.80 µg/L
CBD1a 9 1 ND – 1.8 µg/L
SSBa 5 0 ND – 0.26 µg/L
SR1a 1 0 ND – 0.08 µg/L
SRRb 0 0 ND
WSRc 0 0 ND
Drain Site Totals 31 1
River Site Totals 1 0
Totals 32 1 -
NOTES: ND = non-detect (below the method reporting limit) aRPP site bCity of Sacramento intake site (as reported by the city) cCity of West Sacramento intake site (as reported by the city)
RPP Thiobencarb Results During the 9 weeks of sampling, thiobencarb was detected 32 times. One detection above the 1.5 µg/L performance goal was observed, one CBD1 on June 8. The performance goal was met, but not exceeded at CBD5 on June 10. The highest measured concentration, which occurred at CBD1 on June 8, was 1.8 µg/L. This was lower than the highest measured concentration in 2009 (CBD1, May 26, 2009, 1.84 µg/L) and in 2008 (BS1, May 27, 2008, 1.99 µg/L). The average concentration (counting non-detects equivalent to zero) was 0.18 µg/L for the period of monitoring, which is lower than the 2008 and 2009 average of 0.30 µg/L. Graphical results are shown in Figure 5-9, and tabulated results are shown in Table 5-16.
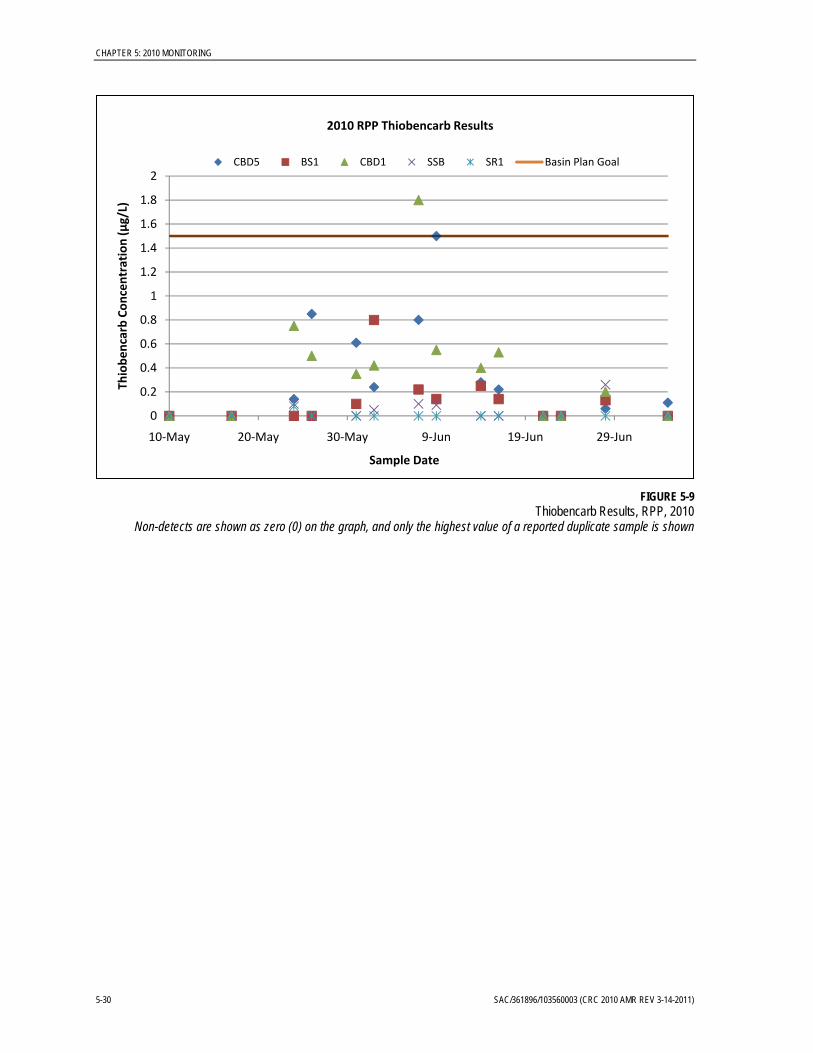
CHAPTER 5: 2010 MONITORING
5-30 SAC/361896/103560003 (CRC 2010 AMR REV 3-14-2011)
FIGURE 5-9
Thiobencarb Results, RPP, 2010 Non-detects are shown as zero (0) on the graph, and only the highest value of a reported duplicate sample is shown
0
0.2
0.4
0.6
0.8
1
1.2
1.4
1.6
1.8
2
10‐May 20‐May 30‐May 9‐Jun 19‐Jun 29‐Jun
Thiobencarb Concentration (µg/L)
Sample Date
2010 RPP Thiobencarb Results
CBD5 BS1 CBD1 SSB SR1 Basin Plan Goal

CHAPTER 5: 2010 MONITORING
SAC/361896/103560003 (CRC 2010 AMR REV 3-14-2011) 5-31
TABLE 5-16 Thiobencarb Monitoring Results, RPP 2010
Sampling Dates
Concentrations at Monitoring Sites (µg/L [ppb])
CBD5 BS1 CBD1 SSB SR1
May 11 ND ND ND ND ND
May 18 ND ND ND ND ND
May 25 0.14 ND 0.75 0.10 0.08
May 27 0.85 ND 0.50 ND ND
June 1 0.61 0.10 0.35 ND ND (V) ND (M)
June 3 0.24 0.28 (V) 0.80 (M)
0.42 0.05 ND
June 8 0.80 0.22 1.58 (V) 1.8 (M)
0.10 ND
June 10 1.12 (V) 1.5 (M)
0.14 0.55 0.09 ND
June 15 0.28 0.25 0.4 ND ND
June 17 0.22 0.14 0.53 ND (V) ND (CLS)
ND
June 22 ND ND ND ND ND
June 24 ND ND ND ND ND (V) ND (CLS)
June 29 0.06 0.13 0.20 0.26 ND
July 6 0.11 ND ND ND ND
NOTES: ND = not detected above laboratory reporting limits ppb = parts per billion If a sample was tested at the primary and secondary laboratories, each result is provided with the respective laboratory’s name (V = Valent; M = McCampbell; CLS = California Laboratory Services) Detection limit for all three labs is <0.5 µg/L The Basin Plan performance goal for thiobencarb is 1.5 µg/L (ppb)
The cause of the thiobencarb exceedance in the Colusa Basin Drain is likely attributable to conditions associated with the ACP issued by the Colusa CAC on June 10. In assessing the conditions associated with the ACP, Colusa CAC estimated that the grower was probably draining the field a few days prior to issuance of the ACP. On May 27, Abolish was applied to the fields subject to the ACP. The CAC also reported that two additional farmers called to request emergency releases on June 1 and June 4. No emergency releases were granted by Colusa County, so any releases would have been unauthorized.
The field that was issued the ACP is located toward the southern part of Colusa County. The grower was using a recirculating system to pump water from the bottom of the field to the top. The water got too deep in the bottom rice check. The CAC biologist reported that

CHAPTER 5: 2010 MONITORING
5-32 SAC/361896/103560003 (CRC 2010 AMR REV 3-14-2011)
the drain valve was partially open, as the farmer was releasing water in order to avoid blowing out the bottom check. The farmer did not drain the field, but rather released just enough water to relieve pressure on the check. The surrounding area is all rice. The June 10 unauthorized emergency release, combined with the two requests, led the DPR Senior Inspector and the CAC Biologist to hypothesize that other growers may have had to release water during that same time frame.
The DPR Senior Inspector reviewed the Yolo County thiobencarb notices of intent and use reports. There were no Yolo County applications of thiobencarb before June 8. Therefore, the source of the exceedance at CBD1 came entirely from Colusa County.
Communication between the CRC, CACs, and DPR was even greater during the rice pesticide application season as a result of the efforts from 2009. The exceedance at the CBD1 drain site resulted from an Abolish application. The grower was using a recirculating system for pumping water from the bottom of the field to the top. The water got too deep in the bottom rice check, so the grower requested an emergency release. Two other growers requested emergency releases at this time and were denied. Unfortunately the emergency release request did not fulfill the requirement of 19 days for Abolish. The DPR Senior Inspector determined the source of the exceedance at CBD1 came entirely from Colusa County. Fortunately, the monitoring results and followup investigation gave the Colusa CAC an area to target with additional outreach and inspection.
City Intake Results The City of Sacramento provided the CRC with analytical results for drinking water intake sampling for Sacramento and West Sacramento. The cities of Sacramento and West Sacramento monitor at two separate locations:
SRR: Sacramento River at the intake to the water treatment facility in Sacramento, California, approximately 0.3 kilometer downstream from the confluence with the American River in Sacramento County
WSR: Sacramento River at the intake to the water treatment facility in West Sacramento, California, approximately 100 yards west of Bryte Bend Bridge in West Sacramento
City sampling was performed from April 29 through July 6, 2010. The intake results for thiobencarb, as provided to the CRC, are detailed in Table 5-17. All of the drinking water samples showed results below the reporting limit.

CHAPTER 5: 2010 MONITORING
SAC/361896/103560003 (CRC 2010 AMR REV 3-14-2011) 5-33
TABLE 5-17 Cities of Sacramento and West Sacramento Thiobencarb Results, 2010
Sample Date
Thiobencarb Concentration (µg/L)
Percent Sacramento River Water at SRR* WSR SRR*
April 29 < 0.1 < 0.1 78.2
May 11 < 0.1 < 0.1 71.1
May 18 < 0.1 < 0.1 70.6
May 20 < 0.1 < 0.1 49.5
May 26 < 0.1 < 0.1 47.6
May 27 < 0.1 < 0.1 48.6
May 29 < 0.1* < 0.1 49.0
May 31 < 0.1^ < 0.1 60.5
June 7 < 0.1 < 0.1 58.4
June 9 < 0.1 < 0.1 56.2
June 16 < 0.1 < 0.1 56.6
June 21 < 0.1 < 0.1 56.0
July 1 < 0.1 < 0.1 80.8
July 6 < 0.1 < 0.1 74.2
NOTES:
Monitoring Site Locations:
SRR = Sacramento River Water Treatment Plant Intake
WSR = Bryte Bend Water Treatment plant Intake (except for * = sample taken at Crawdad’s Marina, slightly downstream from the water treatment plant, and ^ = sample taken at Sand Cove park)
* The sampling location SRR, which is located on the Sacramento River at the City of Sacramento’s municipal water treatment intake, is downstream of the confluence of the Sacramento and American rivers. Based on the daily flows of the two rivers, the sample taken at SRR will represent varying proportions of Sacramento and American river water. This column represents the City of Sacramento’s reported information regarding the blending ration of Sacramento River and American River water on the day of sampling
SRR Results. Prior to the City of Sacramento drinking water intake, some water mixing occurs from the American River at the Sacramento River confluence. Concentrations of thiobencarb continued to be less than 1 µg/L at SRR; in 2010 there were no detections above the detection level.
WSR Results. WSR is located upstream from the confluence of the American River, so the mixing and dilution prior to the drinking water intake that occurs at the City of Sacramento water intake (SRR) does not occur at WSR. Concentrations of thiobencarb continued to be less than 1 µg/L at WSR; in 2010 there were no detections above the detection level. These results demonstrate achievement of both the RPP Basin Plan Performance Goals and the drinking water MCLs.


SAC/361896/103560003 (CRC 2010 AMR REV 3-14-2011) 6-1
CHAPTER 6
Review of Quality Assurance/Quality Control
The validity of water quality monitoring results relies on defining and rigorously following a Quality Assurance/Quality Control (QA/QC) Program. QA/QC requirements are specified in a Monitoring Quality Assurance Project Plan (QAPP), and the laboratory QA/QC requirements are specified in QA/QC plans for each lab.
QA/QC requirements for the CWFR sampling are specified in a QAPP submitted July 2010. QA/QC requirements for the RPP sampling are specified in the same QAPP. Project schedules (sampling dates, parameters, and sites) specified for each program are revised at the beginning of each monitoring year based on actual weather conditions and grower schedules. The sampling calendars for CWFR and RPP monitoring are included in Chapter 5 (Table 5-1).
The QAPPs were prepared in accordance with Attachment C (Quality Assurance Project Plan Guidelines for California Rice Commission) of the Monitoring and Reporting Program under Order No. R5-2010-0805.
The QAPP specifies several types of QA/QC samples, including:
Field QA/QC samples Field blanks Field duplicates
Lab QA/QC samples: Method blanks Matrix spikes and matrix spike duplicates (MS/MSDs) Laboratory control spikes (LCSs) Surrogate samples
The QAPP also specifies numeric QA/QC objectives for precision, accuracy, representativeness, comparability, and completeness.
This section describes the QA/QC samples and their purposes, presents the quality assurance objectives, and then evaluates the 2010 CWFR and RPP QA/QC results against the objectives.
Internal QC Internal QC is achieved by collecting and analyzing a series of duplicate, blank, spike, and spike duplicate samples to confirm that analytical results are within the specified QC objectives. The QC sample results are used to qualify precision and accuracy, and to identify any problem or limitation in the associated sample results. The internal QC components of a sampling and analysis program ensure that data of known quality are produced and documented.

CHAPTER 6: REVIEW OF QUALITY ASSURANCE/QUALITY CONTROL
6-2 SAC/361896/103560003 (CRC 2010 AMR REV 3-14-2011)
Field QA/QC Samples Field QA/QC samples are used to assess the influence of sampling procedures and equipment used in sampling. The results from these samples are examined to ensure that field procedures yield acceptable results. Two types of field quality control samples were used during the 2010 sampling, field blanks and field duplicates.
Field Blanks A field blank is a bottle of reagent water that is exposed to sampling conditions, returned to the laboratory, and treated as an environmental sample. This blank is used to provide information about contaminants that may be introduced during sample collection, storage, and transport.
Field Duplicates Field duplicates, or split samples, consist of an additional bottle of sample collected at a randomly selected sample location. The results from the duplicate sample are compared to the results from the primary sample; if the relative percent difference (RPD) between the samples is greater than 35 percent, a thorough evaluation of the samples will be performed to determine whether to take corrective action (to either report the data or resample). Duplicate samples provide precision information for the entire measurement system, including sample acquisition, homogeneity, handling, shipping, storage, laboratory sample preparation, and laboratory analysis.
QC samples from the W6D2 and W7D2 events were analyzed at California Laboratory Services, Inc (CLS). The CRC elected to change to CLS to address reporting limit requirements for thiobencarb QC samples. Subsequent analysis of previous events by McCampbell Analytical, Inc. (MAI) ensured that the samples were reportable to the required reporting limits; however, it was decided that CLS would be used for the QC samples for the remainder of the monitoring season in 2010.
Laboratory QA/QC Samples Laboratory QA/QC samples are prepared to ensure that the required level of laboratory accuracy is being achieved. Four types of quality control samples are used to determine laboratory accuracy: method blanks, matrix spikes, LCSs, and surrogate standards.
Method Blanks Method blanks consist of deionized water that is run through all of the same steps as the environmental samples at the lab. These samples are used to determine the existence of any laboratory sources of contamination.
Matrix Spikes and Matrix Spike Duplicates MS/MSD samples are collected at the same time as the environmental samples and are spiked at the laboratory with known concentrations of the analyte(s) to be measured. These samples are used to evaluate the effect a particular sample matrix has on the accuracy of the measurement. The MSD sample serves as another check of accuracy and allows calculation of the analysis method’s precision. The difference in the measured concentrations of the original sample and the spiked sample is compared with the spike concentration, and a

CHAPTER 6: REVIEW OF QUALITY ASSURANCE/QUALITY CONTROL
SAC/361896/103560003 (CRC 2010 AMR REV 3-14-2011) 6-3
percent recovery (the concentration that the laboratory measures divided by the known concentration of a spiked sample multiplied by 100) of the spiked concentration is reported.
Laboratory Control Spikes LCSs consist of known concentrations of a constituent in distilled water. The measured concentrations are compared with the spike concentration, and a percent recovery can be determined. Results are acceptable if the percent recovery falls within a predetermined range.
Surrogate Standards Surrogate standards are samples that have been spiked with an organic compound that is chemically similar to the analyte of interest, but is not expected to occur in the environmental sample. The recovery of the surrogate standard is used to monitor for errors, unusual effects, and other anomalies. Surrogate recovery is evaluated by comparing the measured concentration with the amount added to the sample.
Quality Assurance Objectives Quality assurance objectives (QAOs) are the detailed QC specifications for precision, accuracy, representativeness, comparability, and completeness. QAOs are used as comparison criteria during data quality review to evaluate whether the minimum requirements have been met and the data can be used as planned. The basis for assessing each element of data quality for this project is discussed in the following subsections.
Precision Precision is a measure of the reproducibility of analyses under a given set of conditions. Precision will be assessed by replicate measurements of field and laboratory duplicate samples. The routine comparison of precision is measured by the RPD between duplicate sample measurements. The overall precision of a sampling event is determined by a sampling component and an analytical component.
The following formula determines the RPD between two samples:
1002/21
21x
DD
DDRPD
Where:
RPD = relative percent difference D1 = first sample value D2 = second sample value (duplicate)
The maximum acceptable RPD for this project is 35 percent.

CHAPTER 6: REVIEW OF QUALITY ASSURANCE/QUALITY CONTROL
6-4 SAC/361896/103560003 (CRC 2010 AMR REV 3-14-2011)
Accuracy Accuracy is a determination of how close the measurement is to the true value. Accuracy can be assessed using MS/MSD, LCS, calibration standard, and spiked environmental samples. The accuracy of the data submitted for this project will be assessed in the following manner:
The percent recovery of LCS, MS/MSD, and spiked surrogates will be calculated and evaluated against established laboratory recovery limits. Acceptable laboratory recovery limits for this project are 75 to 120 percent.
Laboratory method blanks will be tested to determine levels of target compounds. If a target compound is found above the method detection limit (MDL) in the method blank corresponding to a batch of samples, and the same target compound is found in a sample, then the data will not be background subtracted but will be flagged to indicate the result in the blank.
Accuracy is presented as percent recovery. Because accuracy is often evaluated from spiked samples, laboratories commonly report accuracy using this formula:
% Recovery = R / S * 100
Where:
S = spiked concentration R = reported concentration
The laboratory shall monitor accuracy by reviewing MS/MSD, LCS, calibration standard, and surrogate spike recovery results.
Representativeness Representativeness refers to the degree to which sample data accurately and precisely describe the characteristics of a population of samples, parameter variations at a sampling point, or environmental conditions. Representativeness is a qualitative parameter that is primarily concerned with the proper design of the sampling program or of the subsampling of a given sample. Representativeness will be assessed by the use of duplicate field and laboratory samples because they provide information pertaining to both precision and representativeness.
Samples that are not properly preserved or are analyzed beyond acceptable holding times will not be considered to provide representative data. Also, detection limits above applicable MCLs or screening criteria will not be considered representative.
Comparability Comparability is a qualitative parameter expressing the confidence with which one data set can be compared with another. Sample data should be comparable for similar samples collected under like conditions. This goal is achieved through the use of standard techniques to collect and analyze representative samples and reporting analytical results with appropriate units.

CHAPTER 6: REVIEW OF QUALITY ASSURANCE/QUALITY CONTROL
SAC/361896/103560003 (CRC 2010 AMR REV 3-14-2011) 6-5
Comparability is limited by other analytical control parameters; therefore, only when precision and accuracy are known can data sets be compared with confidence. Using standard operating procedures (SOPs) promotes comparability.
Completeness Completeness is a measure of the amount of valid data obtained from a measurement system compared with the amount that was expected to be obtained under normal conditions. To be considered complete, the data set must contain all analytical results and data specified for the project. In addition, all data are compared to project requirements to ensure that specifications are met. Completeness is evaluated by comparing the project objectives to the quality and quantity of the data collected to assess if any deficiencies exist. Missing data can result from any number of circumstances ranging from sample acquisition and accessibility problems to sample breakage and rejection of analytical data because of quality control deficiencies. Completeness is quantitatively assessed as the percent of controlled QC parameters that are within limits. Percent completeness for each set of samples for each individual method can be calculated as follows:
%100analyzed data total
obtained data validssCompletene
Where:
Valid data are defined as those data points that are not qualified as rejected.
The requirement for completeness is 90 percent for each individual analytical method for all QC parameters except holding times. These QC parameters will include:
Initial calibration Continuing calibrations LCS percent recovery MS/MSD Field duplicate RPDs Surrogate percent recoveries
The requirement for holding times will be 100 percent. Any deviations are reported in the report narrative.
CWFR QA/QC Sample Results and Analysis In 2010, one “QC set” was required for each analytical method batch per sampling event. The minimum required samples for chemical analysis were:
Field blank Field duplicate MS/MSD LCS and laboratory control spike duplicate (LCSD) Laboratory blank Laboratory duplicate (MS/MSD or LS/LSD pair may serve this function). (Note that
field duplicates and field blanks are not required for general parameters.)

CHAPTER 6: REVIEW OF QUALITY ASSURANCE/QUALITY CONTROL
6-6 SAC/361896/103560003 (CRC 2010 AMR REV 3-14-2011)
Field QA/QC Samples Field CWFR QA/QC samples collected during 2010 sampling included field blanks and field duplicates. The dates, events, and sites of these samples are shown in Table 6-1. Results for field QA/QC samples are provided below.
TABLE 6-1 CWFR Field QA/QC Samples, 2010
Date Event QA/QC Sample Type(s)
5/12/2010 CWFR Event 1 Field Blank at CBD5 Field Duplicate at CBD5
6/16/2010 CWFR Event 2
Propanil 1
Field Blank at CBD1 Field Duplicate at CBD1
Field Blank at F Field Duplicate at F
6/22/2010 Propanil 2 Field Blank at SSB Field Duplicate at SSB
6/29/2010 Propanil 3 Field Blank at BS1 Field Duplicate at BS1
7/6/2010 Propanil 4 Field Blank at CBD5 Field Duplicate at CBD5
7/13/2010 Propanil 5 Field Blank at CBD1 Field Duplicate at CBD1
7/20/2010 CWFR Event 3
Propanil 6
None (Sampling event was for general parameters only.)
Field Blank at F Field Duplicate at F
7/27/2010 Propanil 7 Field Blank at SSB Field Duplicate at SSB
8/3/2010 Propanil 8 Field Duplicate at CBD5 Field Duplicate at CBD5
8/25/2010 CWFR Event 4 None (Sampling event was for general parameters only.)
Field Blanks Field blank samples were collected and analyzed for the same constituents as the environmental samples. The results for the field blanks were below the method reporting limits (MRLs) for all analytes (Table 6-2).
Field Duplicates Field duplicate samples were collected and analyzed for the same constituents as the primary environmental samples. Results between primary and duplicate samples were similar, as was expected (Table 6-2).

CHAPTER 6: REVIEW OF QUALITY ASSURANCE/QUALITY CONTROL
SAC/361896/103560003 (CRC 2010 AMR REV 3-14-2011) 6-7
TABLE 6-2 2010 CWFR Field Blank and Field Duplicate Results
Field Blank Results
Event Sampling Location
Analyte
Dissolved Copper (MRL = 0.5 µg/L)
Propanil (MRL = 0.5 µg/L)
CWFR Event 1 CBD5 ND NA
CWFR Event 2 CBD1 ND NA
Propanil 1 F NA ND
Propanil 2 SSB NA ND
Propanil 3 BS1 NA ND
Propanil 4 CBD5 NA ND
Propanil 5 CBD1 NA ND
Propanil 6 F NA ND
Propanil 7 SSB NA ND
Propanil 8 CBD5 NA ND
Primary and Duplicate Results
Event Sampling Location
Analyte
Dissolved Copper (MRL = 0.5 µg/L)
Propanil (MRL = 0.5 µg/L)
Primary Duplicate Primary Duplicate
CWFR Event 1 CBD5 2.3 2.6 NA NA
CWFR Event 2 CBD1 5.4 6.5 NA NA
Propanil 1 F NA NA ND <0.50 ND <0.50
Propanil 2 SSB NA NA ND <0.50 ND <0.50
Propanil 3 BS1 NA NA 2.8 2.8
Propanil 4 CBD5 NA NA 1.4 1.7
Propanil 5 CBD1 NA NA ND <0.50 ND <0.50
Propanil 6 F NA NA 1.2 1.1
Propanil 7 SSB NA NA ND <0.50 ND <0.50
Propanil 8 CBD5 NA NA ND <0.50 ND <0.50

CHAPTER 6: REVIEW OF QUALITY ASSURANCE/QUALITY CONTROL
6-8 SAC/361896/103560003 (CRC 2010 AMR REV 3-14-2011)
Laboratory QA/QC Samples The laboratory QA/QC samples included method blanks, matrix spikes, LCSs, and surrogate standard samples; the results for each follow.
Method Blank Method blank samples were prepared by the laboratory and tested for the same analytes as the environmental samples. The results of all the method blank samples were below the MRL (non-detect) for these analytes (Table 6-3).
TABLE 6-3 2010 CWFR Method Blank Results
Event
Analyte (MRL)
Hardness (1.0 mg CaCO3/L)
Copper (0.1 µg/L)
TOC (0.3 mg/L)
Propanil (0.05 µg/L)
CWFR Event 1 ND ND ND NA
CWFR Event 2 ND ND ND NA
Propanil 1 NA NA NA ND
Propanil 2 NA NA NA ND
Propanil 3 NA NA NA ND
Propanil 4 NA NA NA ND
Propanil 5 NA NA NA ND
CWFR Event 3 NA NA ND NA
Propanil 6 NA NA NA ND
Propanil 7 NA NA NA ND
Propanil 8 NA NA NA ND
CWFR Event 4 NA NA ND NA
NOTES: ND = non-detect at the MRL NA = not scheduled during that sampling event
MS/MSD MS and MSD samples were prepared and analyzed for every sampling event during the 2010 season (Table 6-4). All the recoveries and RPD values were within the acceptable range.
LCS LCS samples were prepared and analyzed for every sampling event during the 2010 season. The recoveries and RPD percentages for all of the samples were within the acceptable limits (Table 6-5).
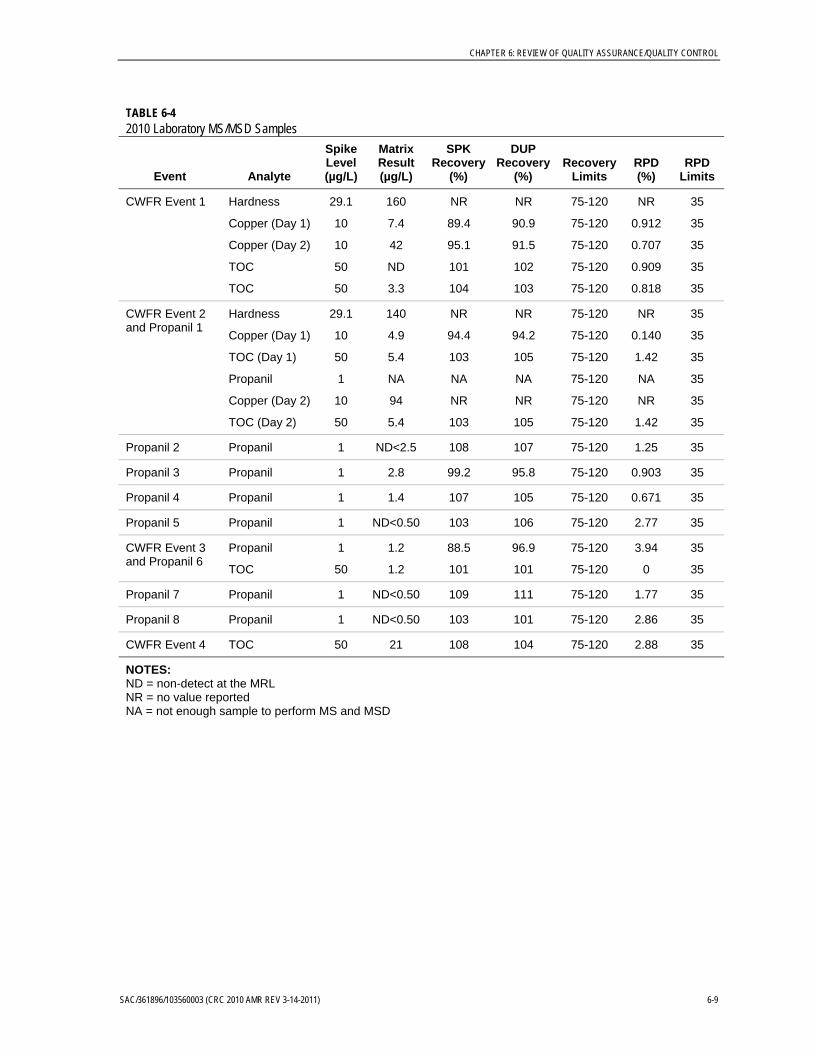
CHAPTER 6: REVIEW OF QUALITY ASSURANCE/QUALITY CONTROL
SAC/361896/103560003 (CRC 2010 AMR REV 3-14-2011) 6-9
TABLE 6-4 2010 Laboratory MS/MSD Samples
Event Analyte
Spike Level (µg/L)
Matrix Result (µg/L)
SPK Recovery
(%)
DUP Recovery
(%) Recovery
Limits RPD (%)
RPD Limits
CWFR Event 1 Hardness 29.1 160 NR NR 75-120 NR 35
Copper (Day 1) 10 7.4 89.4 90.9 75-120 0.912 35
Copper (Day 2) 10 42 95.1 91.5 75-120 0.707 35
TOC 50 ND 101 102 75-120 0.909 35
TOC 50 3.3 104 103 75-120 0.818 35
CWFR Event 2 and Propanil 1
Hardness 29.1 140 NR NR 75-120 NR 35
Copper (Day 1) 10 4.9 94.4 94.2 75-120 0.140 35
TOC (Day 1) 50 5.4 103 105 75-120 1.42 35
Propanil 1 NA NA NA 75-120 NA 35
Copper (Day 2) 10 94 NR NR 75-120 NR 35
TOC (Day 2) 50 5.4 103 105 75-120 1.42 35
Propanil 2 Propanil 1 ND<2.5 108 107 75-120 1.25 35
Propanil 3 Propanil 1 2.8 99.2 95.8 75-120 0.903 35
Propanil 4 Propanil 1 1.4 107 105 75-120 0.671 35
Propanil 5 Propanil 1 ND<0.50 103 106 75-120 2.77 35
CWFR Event 3 and Propanil 6
Propanil 1 1.2 88.5 96.9 75-120 3.94 35
TOC 50 1.2 101 101 75-120 0 35
Propanil 7 Propanil 1 ND<0.50 109 111 75-120 1.77 35
Propanil 8 Propanil 1 ND<0.50 103 101 75-120 2.86 35
CWFR Event 4 TOC 50 21 108 104 75-120 2.88 35
NOTES: ND = non-detect at the MRL NR = no value reported NA = not enough sample to perform MS and MSD
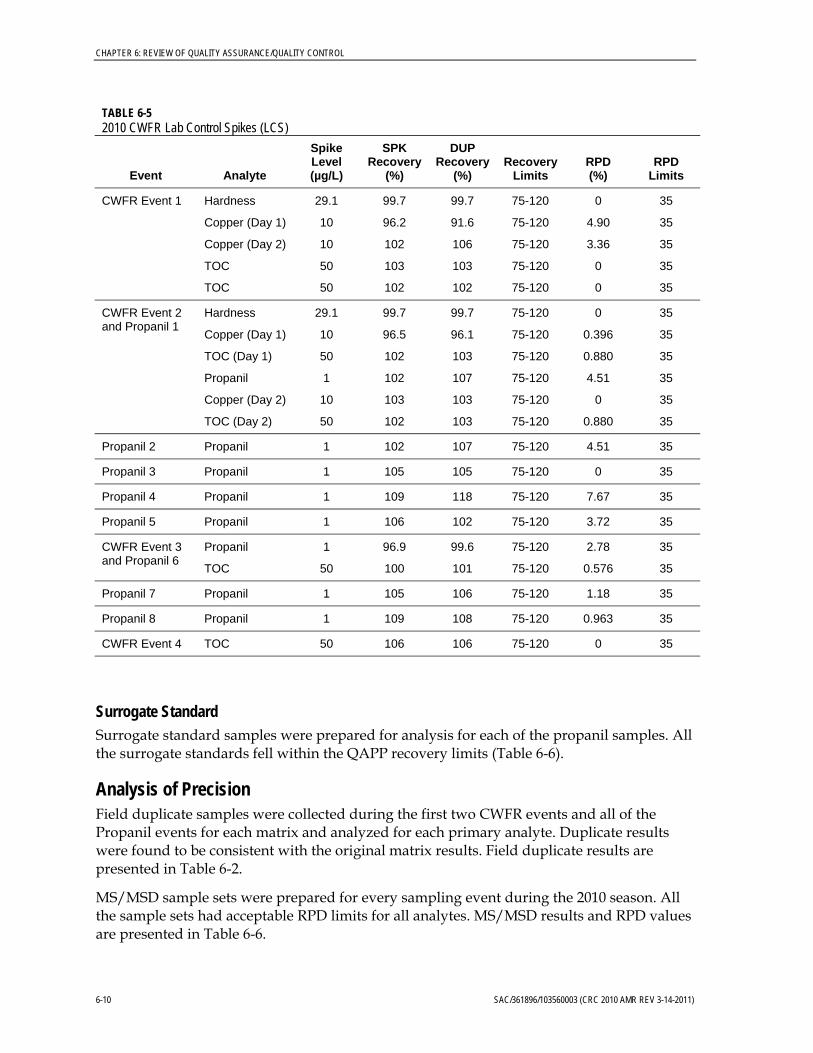
CHAPTER 6: REVIEW OF QUALITY ASSURANCE/QUALITY CONTROL
6-10 SAC/361896/103560003 (CRC 2010 AMR REV 3-14-2011)
TABLE 6-5 2010 CWFR Lab Control Spikes (LCS)
Event Analyte
Spike Level (µg/L)
SPK Recovery
(%)
DUP Recovery
(%) Recovery
Limits RPD (%)
RPD Limits
CWFR Event 1 Hardness 29.1 99.7 99.7 75-120 0 35
Copper (Day 1) 10 96.2 91.6 75-120 4.90 35
Copper (Day 2) 10 102 106 75-120 3.36 35
TOC 50 103 103 75-120 0 35
TOC 50 102 102 75-120 0 35
CWFR Event 2 and Propanil 1
Hardness 29.1 99.7 99.7 75-120 0 35
Copper (Day 1) 10 96.5 96.1 75-120 0.396 35
TOC (Day 1) 50 102 103 75-120 0.880 35
Propanil 1 102 107 75-120 4.51 35
Copper (Day 2) 10 103 103 75-120 0 35
TOC (Day 2) 50 102 103 75-120 0.880 35
Propanil 2 Propanil 1 102 107 75-120 4.51 35
Propanil 3 Propanil 1 105 105 75-120 0 35
Propanil 4 Propanil 1 109 118 75-120 7.67 35
Propanil 5 Propanil 1 106 102 75-120 3.72 35
CWFR Event 3 and Propanil 6
Propanil 1 96.9 99.6 75-120 2.78 35
TOC 50 100 101 75-120 0.576 35
Propanil 7 Propanil 1 105 106 75-120 1.18 35
Propanil 8 Propanil 1 109 108 75-120 0.963 35
CWFR Event 4 TOC 50 106 106 75-120 0 35
Surrogate Standard Surrogate standard samples were prepared for analysis for each of the propanil samples. All the surrogate standards fell within the QAPP recovery limits (Table 6-6).
Analysis of Precision Field duplicate samples were collected during the first two CWFR events and all of the Propanil events for each matrix and analyzed for each primary analyte. Duplicate results were found to be consistent with the original matrix results. Field duplicate results are presented in Table 6-2.
MS/MSD sample sets were prepared for every sampling event during the 2010 season. All the sample sets had acceptable RPD limits for all analytes. MS/MSD results and RPD values are presented in Table 6-6.

CHAPTER 6: REVIEW OF QUALITY ASSURANCE/QUALITY CONTROL
SAC/361896/103560003 (CRC 2010 AMR REV 3-14-2011) 6-11
TABLE 6-6 2010 CWFR Surrogate Standard Sample Results
Sampling Event Sample Location
Surrogate Recovery Results (%)
Carbazole (EPA 532)
(65-135)*
Propanil 1 F 101
F –Dup 110
F-FBL 98
F-MS 103
CBD5 83
F-MSD 85
CBD1 97
BS1 95
SSB 88
Propanil 2 CBD1 84
SSB 91
SSB-Dup 80
SSB-FBL 84
BS1 87
CBD5 85
F 87
Propanil 3 SSB 83
BS1 84
BS1-Dup 83
BS1-MS 80
BS1-MSD 85
BS1-FBL 91
CBD5 73
F 81
CBD1 81
Propanil 4 SSB 73
BS1 75
CBD5 71
CBD5-Dup 72
CBD5-FBL 81
CBD5-MS 76
CBD5-MSD 74
CBD1 78
F 73

CHAPTER 6: REVIEW OF QUALITY ASSURANCE/QUALITY CONTROL
6-12 SAC/361896/103560003 (CRC 2010 AMR REV 3-14-2011)
TABLE 6-6 2010 CWFR Surrogate Standard Sample Results
Sampling Event Sample Location
Surrogate Recovery Results (%)
Carbazole (EPA 532)
(65-135)*
Propanil 5 SSB 75
BS1 92
CBD5 93
F 96
CBD1 81
CBD1-Dup 87
CBD1-FBL 92
Propanil 6 BS1 90
CBD5 90
F 90
F-Dup 90
F-FBL 100
CBD1 89
SSB 90
Propanil 7 BS1 89
CBD5 91
F 87
CBD1 90
SSB 92
SSB-Dup 91
SSB-FBL 89
Propanil 8 SSB 81
BS1 78
CBD5 81
CBD5-Dup 81
CBD5-FBL 85
CBD1 86
F 83
NOTE: *Control limits
LCS samples were prepared and analyzed for every sampling event during the 2010 season. The RPD percentages for all the samples were within the acceptable limits. LCS results and RPD values are presented in Table 6-7.

CHAPTER 6: REVIEW OF QUALITY ASSURANCE/QUALITY CONTROL
SAC/361896/103560003 (CRC 2010 AMR REV 3-14-2011) 6-13
TABLE 6-7 QA/QC Samples, RPP 2010
Date Event QA/QC Sample Type
5/18 W2D1 RB at SSB
6/1 W4D1 Dup at SR1
6/3 W4D2 Dup at BS1, blind spikes
6/8 W5D1 Dup at CBD1
6/10 W5D2 Dup and RB at CBD5
6/17 W6D2 Dup at SSB
6/24 W7D2 Dup at SR1, blind spikes
NOTE: RB = Rinse blank
Analysis of Accuracy Field blank samples were utilized during each sampling event, and were analyzed for each primary analyte. All field blank samples were found to have analyte levels below the MRLs. Field blank results are presented in Table 6-2.
Method blank samples were run with every batch of analytical samples. All method blank samples were found to have analyte levels below the MRLs. Method blank results are presented in Table 6-3.
MS and MSD samples were prepared and analyzed for every sampling event during the 2010 season. All of the MS/MSD results were within the acceptable recovery limits (Table 6-4).
LCS samples were prepared and analyzed for every sampling event during the 2010 season. All the LCS results were within the acceptable recovery limits (Table 6-5).
Surrogate standard samples were prepared for analysis with the environmental samples. All the surrogate standards fell within the required recovery limits (Table 6-6).
Analysis Summary The following summarizes the results of the QA/QC analysis performed on the CWFR data:
All QA/QC samples were within acceptable limits during 2010.
RPP QA/QC Sample Results and Analysis As described in Chapter 5, thiobencarb samples are analyzed by the Valent Dublin Laboratory registrant laboratory. In addition, the CRC submits QA/QC samples to MAI throughout the monitoring season.

CHAPTER 6: REVIEW OF QUALITY ASSURANCE/QUALITY CONTROL
6-14 SAC/361896/103560003 (CRC 2010 AMR REV 3-14-2011)
During each QC sampling event, two sets of samples were collected. One set was sent to the analyte-specific laboratory (Valent), and the other set was sent to the MAI laboratory for comparison.
The field RPP QA/QC samples are shown in Table 6-7. In addition to the field QA/QC samples, analytical laboratories typically perform method blank, LCS, and surrogate standard analyses with each event.
Field QA/QC Samples Field QA/QC samples included rinse blank, field duplicate, and MS/MSD samples; the results for each follow.
Rinse Blank Rinse blank samples were collected twice during the sampling season, at the W2D1 and W5D2 sampling events. The results for all rinse blank samples were below the MDL for thiobencarb (Table 6-8).
TABLE 6-8 2010 RPP Comparison of Rinse Blank Samples to Primary Samples
Date Sample Event Monitoring Site Sample Type* Thiobencarb (µg/L)
5/18 W2D1 SSB Primary ND
Rinse ND
6/10 W5D2 CBD5 Primary 1.12
Rinse ND<0.05
NOTE: *Primary thiobencarb samples analyzed at Valent Laboratories, and rinse samples analyzed at McCampbell Analytical, Inc.
Field Duplicate Field duplicate samples were collected during 6 weeks of RPP sampling (Table 6-9). Although the primary and duplicate samples are analyzed at two different labs, the majority of the sample pairs yielded similar results for the primary and duplicate samples.
TABLE 6-9 2010 RPP Field Duplicate Results
Date Sample Event Monitoring Site Sample Type* Thiobencarb (µg/L)
6/1 W4D1 SR1 Primary ND
Duplicate ND
6/3 W4D2 BS1 Primary 0.28
Duplicate 0.80
6/8 W5D1 CBD1 Primary 1.58
Duplicate 1.8

CHAPTER 6: REVIEW OF QUALITY ASSURANCE/QUALITY CONTROL
SAC/361896/103560003 (CRC 2010 AMR REV 3-14-2011) 6-15
TABLE 6-9 2010 RPP Field Duplicate Results
Date Sample Event Monitoring Site Sample Type* Thiobencarb (µg/L)
6/10 W5D2 CBD5 Primary 1.12
Duplicate 1.5
6/17 W6D2 SSB Primary ND
Duplicate ND
6/24 W7D2 SR1 Primary ND
Duplicate ND
NOTE: *Primary samples are analyzed at Valent, and duplicate samples were analyzed at either McCampbell Analytical or California Laboratory Services (W6D2 and W7D2 samples). Reporting limit for all labs is 0.5 µg/L
Samples collected during W4D2, W5D1, and W5D2 had detectable levels of thiobencarb; the results from the different labs are remarkably similar. This shows good correlation between the labs used for this analysis.
MS/MSD Matrix (environmental) spike samples were collected during the W4D2 and W7D2 sampling events. These samples were spiked by Kleinfelder and submitted to the laboratory with fictitious sample site identification for analysis for thiobencarb (Table 6-10).
TABLE 6-10 Matrix Spike Sample Results, RPP 2010
Date Sample Event
Sample Location Laboratory
Spike Level (µg/L)
SPK Result (µg/L)
SPK Recovery (Percent)
Recovery Limits
6/3 W4D2 CRC1* Valent 1.5 1.56 104 75–120
MAI 1.5 0.99J 66 75–120
6/24 W7D2 CRC1* Valent 1.0 1.06 106 75–120
CLS 1.0 1.2 120 75–120
NOTES: Bold indicates values that do not meet acceptable recovery limits. Reporting limit for all labs = 0.5 µg/L. J = analyte detected below quantitation limits *CRC1 is a fictitious sample location name given to the spike samples for laboratory analysis.
An RPD value could not be calculated for these samples because the two sets of values for each analyte were spiked and analyzed at different laboratories.
One sample had a recovery percentage outside of the acceptable range for recovery limits: the MAI sample from the W4D2 sampling event. The recovery for that sample was below the acceptable recovery range.

CHAPTER 6: REVIEW OF QUALITY ASSURANCE/QUALITY CONTROL
6-16 SAC/361896/103560003 (CRC 2010 AMR REV 3-14-2011)
Laboratory QA/QC Samples The laboratory QA/QC samples included method blanks, LCSs, and surrogate standard samples; the results for each follow.
Method Blank Method blank samples were prepared and tested for the same analytes as the environmental samples. The values below are for the MAI laboratory analysis. All samples had values below the MRL for thiobencarb (Table 6-11).
TABLE 6-11 Method Blank Results (MAI and CLS), RPP 2010
Sample Date Event Thiobencarb (RL = 0.50)
5/18 W2D1 ND
6/1 W4D1 ND
6/3 W4D2 ND
6/8 W5D1 ND
6/10 W5D2 ND
6/17 W6D2* ND
6/24 W7D2* ND
NOTES: *Sample run at CLS lab; the rest were run at MAI.
Laboratory Control Spikes LCS samples were utilized at all three analytical laboratories as an internal QC for the data. The results of all three laboratories’ LCS samples are included in Appendix B-2.
Valent Laboratories. LCS samples were spiked with thiobencarb and analyzed at Valent Laboratories for selected sampling events. The RPD percentages and recovery limits for all samples were within acceptable limits
MAI and CLS Laboratories. LCS samples were analyzed at the secondary QA/QC laboratories MAI and CLS, for selected sampling events. The CLS LCS samples were spiked with thiobencarb, while MAI spiked their LCS samples with other compounds representative of the extraction efficiency of the method. The thiobencarb method does not dictate a QC compound list; therefore, the labs select nitrogen or sulfur-phosphorus containing compounds to achieve a good representative sub-list for the 8141A method. The labs reported RPD results for three or more method compounds, representing a range of degradation characteristics (e.g. mid retention time, late retention time, and early retention time). The chemicals reported for the LCS results are not used on rice nor were they analyzed in any of the environmental samples required by the MRP; they are reported by the laboratories per their standard methods solely for the purpose of demonstrating the ability of their methods to achieve QA/QC requirements for extraction efficiencies. The RPD percentages for all samples were within acceptable limits; however, some samples had

CHAPTER 6: REVIEW OF QUALITY ASSURANCE/QUALITY CONTROL
SAC/361896/103560003 (CRC 2010 AMR REV 3-14-2011) 6-17
recovery limits outside the QAPP acceptable range. These samples included: a single result from the W2D1 and W4D1/W4D2 events; two results from the W2D1, W4D1/W4D2 and W5D1/W5D2 events; one result from the W6D2 event; and one result from the W7D2 event. As a followup, the labs have been requested to report out thiobencarb LCS results. These revised lab reports will be provided as an addendum appendix to this report.
Surrogate Standard Surrogate standard samples were prepared by MAI and CLS for analysis with the environmental samples. All sample results were within the required recovery limits (Table 6-12).
TABLE 6-12 Surrogate Standard Results, RPP 2010
Sample Event/Date Sample Location
Surrogate Recovery Results (%)
Triphenylphosphate (65–135)a EPN (65-135)a
W2D1 5/18 SSB 87
W4D1 6/1 SR1 NRb
W4D2 6/3 CRC1 77
BS1 65
W5D1 6/8 CBD1 75
W5D2 6/10 CBD5-Dup 75
CBD5-RB 98
W6D2 6/17 SSB 76
W7D2 6/24 SR1 79
CRC1 81
NOTES: aControl limits bSurrogate was diminished by dilution of original extract. NR = not reported Triphenylphosphate is MAI’s surrogate; EPN is CLS’s surrogate.
Analysis of Precision Duplicates for the RPP sampling were uniquely processed, with the primary and duplicate samples analyzed at different laboratories (primary samples at Valent, duplicate samples at MAI or CLS). Although this prevents a direct comparison of results from within a site, it allows a comparison of laboratories.
A field duplicate sample was collected during six of the fourteen sampling events. Although the primary and duplicate samples were analyzed at two different labs, the majority of the sample pairs yielded similar results for the primary and duplicate samples. Samples collected during W4D2, W5D1 and W5D2 had detectable levels of thiobencarb; the results from the two different labs are remarkably similar. This shows good correlation between the two labs used for this analysis. Field duplicate results are presented in Table 6-9.
CHAPTER 6: REVIEW OF QUALITY ASSURANCE/QUALITY CONTROL
6-18 SAC/361896/103560003 (CRC 2010 AMR REV 3-14-2011)
MS/MSD samples were utilized for each matrix during the W4D2 and W7D2 sampling events. Although two samples for each analyte were taken at each event, the samples were spiked and analyzed at different laboratories, making an RPD comparison inappropriate. MS/MSD results are presented in Table 6-10.
LCS samples were prepared at MAI and CLS for the W2D1, W4D1&D2, W5D1&D2, W6D2 and W7D2 sampling events. All of the LCS sample results fell within the acceptable RPD limits. LCS samples were analyzed at Valent for all analysis dates. All samples from all dates were within RPD limits for thiobencarb.
Analysis of Accuracy Rinse blank samples were collected twice during the 2010 sampling season, at the W2D1 and W5D2 sampling events. All rinse blank samples were found to have analyte levels below the MRLs. Rinse blank results are presented in Table 6-8.
Method blank samples were run with every batch of analytical samples. All method blank samples were found to have analyte levels below the MRLs. Method blank results are presented in Table 6-11.
MS/MSD samples were prepared for the W4D2 and W7D2 sampling events. One sample had a recovery percentage outside of the acceptable range for recovery limits: the MAI sample from the W4D2 sampling event. The recovery for that sample was below the acceptable recovery range. MS results and recovery limits are presented in Table 6-10.
Some LCS samples prepared at MAI and CLS reported recovery limits outside the acceptable range for several non-rice products being used as QC indicator values for extraction efficiency. As a followup, the labs have been requested to report out thiobencarb LCS results. These revised lab reports will be provided as an addendum appendix to this report. It is noted that the Valent samples met the LCS requirements, and should be considered the primary dataset for the events flagged above.
LCS samples for all analysis dates were analyzed at Valent. All samples from all dates were within the acceptable recovery limits for thiobencarb. Surrogate standards were evaluated with the analytical samples at MAI and CLS. All of the sample results were within the acceptable recovery limits. Surrogate standard results and recovery limits are presented in Table 6-12.
Analysis Summary The following summarizes the results of the QA/QC analysis performed on the RPP data:
Primary and duplicate samples were analyzed at two different laboratories, making a comparison for RPD inappropriate.
MSD samples were not submitted for analysis to each laboratory in conjunction with MS samples. Rather, the submittal of MS samples to MAI and CLS provided an in-lieu MSD for the MS samples submitted to Valent.
One MS sample had a recovery percentage outside of the acceptable range: the MAI sample from the W4D2 sampling event. The recovery for that sample was below the acceptable recovery range.
CHAPTER 6: REVIEW OF QUALITY ASSURANCE/QUALITY CONTROL
SAC/361896/103560003 (CRC 2010 AMR REV 3-14-2011) 6-19
Some of the LCS samples from the secondary QA/QC laboratories MAI and CLS had recovery limits outside the acceptable range. It is noted that the primary Valent samples met the LCS requirements, and should be considered the primary dataset for the events flagged above.
Surrogate standard samples were run at MAI and CLS. All samples had recoveries within acceptable limits.
Chains of Custody Chains of custody (COCs) were utilized to document sample possession from the time of field sampling until the time of laboratory analysis. A COC form was completed after sample collection at each sample event and prior to sample shipment or release. The COC record forms were completed with indelible ink. Unused portions of the form were crossed out and initialed by the sampler. The COC form, sample labels, and field documentation were cross-checked to verify sample identification, type of analyses, sample volume, and number and type of containers.
COC forms for the CWFR and RPP monitoring programs are included in Appendixes B-1 and C-1, respectively.

SAC/361896/103560003 (CRC 2010 AMR REV 3-14-2011) 7-1
CHAPTER 7
Summary and Recommendations
The CRC implemented water quality monitoring and reporting activities in compliance with the following two programs of the CVRWQCB:
CWFR monitoring and reporting, pursuant to the MRP issued under the CVRWQCB’s Conditional Waiver of Waste Discharge Requirements for Discharges from Irrigated Lands. The monitoring and reporting requirements for the 2010 CWFR are specified in the MRP Order R5-2010-0805 (CRC MRP), under Resolution No. R5-2006-0053 as amended by R5-2006-0077.
RPP pursuant to the Conditional Prohibition of Discharge requirements specified in the Water Quality Control Plan for the Sacramento and San Joaquin River Basins (Basin Plan). Monitoring and reporting requirements for the 2010 RPP are specified in CVRWQCB Resolution No. R5-2010-9001.
Each program is summarized below, and recommendations are included.
CWFR CWFR monitoring included field assessment of field parameters, including temperature, DO, pH, and EC. Lab analyses were conducted as required for TDS, TOC, hardness, dissolved copper. Propanil monitoring was conducted under the Propanil Monitoring Plan.
Temperature: Temperature results indicate warm water conditions during the monitoring season. Core and assessment site temperatures were consistent with results observed in previous years. Water temperatures track with observed air temperatures. Peak temperatures were observed during the July monitoring event, with a high of 83.1F.
DO: DO results were generally consistent with observations in previous years. DO typically trended above the 6 mg/L warm water standard. Low DO (less than the WARM WQO of 5 mg/L) was observed at two events in 2010: Site H at the June event, and Site CBD1 at the July event.
pH: There were no observations outside the 6.5 to 8.5 WQO range during 2010.
EC: The 2010 sampling season yielded two samples with an EC greater than 700 µmhos/cm. These samples were both from the June event, at Sites CBD1 and CBD5.
TDS: TDS samples were collected at core sites from May through August, and at assessment sites in May. June results were not reported by the lab due to an error in reading the COC form. TDS was generally highest in July, possibly due to lower rice discharges and overall lower flows observed during July. The maximum observed TDS was 356 mg/L, at CBD1 in July.
CHAPTER 7: SUMMARY AND RECOMMENDATIONS
7-2 SAC/361896/103560003 (CRC 2010 AMR REV 3-14-2011)
TOC: TOC samples were collected at core sites from May through August, and at assessment sites in May and June. TOC was generally lowest and May, and highest in June. The maximum observed TOC was 10 mg/L at CBD1 in July, while all other observed TOC values were less than 6.4 mg/L.
Copper and Hardness: Samples from the first two events were analyzed for hardness and dissolved copper, in accordance with the MRP. The 1 –hour and 4-day California Toxics Rule (CTR) hardness-adjusted copper criteria also were calculated based on the actual hardness measured for the sample location and date. All the copper samples taken during the 2010 monitoring season fell below the 1-hour maximum copper criterion. One sample was above the 4-day criterion: Event 2, Site F (Lurline Creek). This sample had a concentration of 9 µg/L; 8 µg/L was the hardness-adjusted criterion level.
Propanil Management Plan – Propanil Analysis: Eight consecutive weeks of propanil sampling were completed in 2010 (Table 5-10). The highest detections were from the June 22 event at site CBD5 (5.0 µg/L), the June 29 event at Site F (10 µg/L), and the July 6 event at site BS1 (4.4 µg/L). Results from the 2010 monitoring indicate effectiveness of the Propanil Management Plan.
The June 22 and July 6 sampling events had the most detections, as would be anticipated due to monitoring during the peak use season. The June 22 event showed detectable concentrations at three out of five sites, and the July 6 event showed concentrations about the detection limit at four out of five sites. The last two sampling weeks (July 27 and August 3) had no detections at any of the sampling locations.
Assessment of the 2010 CWFR Program This year represents the sixth full year of the CWFR program. The key successes and challenges faced during 2010 program implementation are summarized as follows:
Late rains and unseasonable cool weather resulted in an atypical year for rice production. Late rains delayed planting, and cool weather postponed plant maturity, resulting in a later harvest, poor quality rice, and low yields.
Monitoring and assessment were conducted in accordance with the requirements of the MRP and Propanil Management Plan. Regularly scheduled CWFR sampling was conducted as required under the MRP. This sampling included core site analysis for field parameters (temperature, DO, pH, electrical conductivity, and flow), core sampling for lab parameters (TOC and TDS), core and assessment site analysis for dissolved copper and hardness during the first two events, and propanil sampling and analysis during a eight week period consistent with the use period.
CWFR water quality monitoring was conducted at four core sites. The three assessment sites were sampled during the first two events. Total copper was reported for this assessment monitoring in 2009; dissolved copper was included in 2010 to provide for comparison to CTR criteria, which use dissolved copper as the basis of calculation. This effort satisfies the MRP requirement for implementation of a phased core/assessment monitoring regime, which includes assessment monitoring on a 3-year cycle. Assessment monitoring at core and assessment sites will next take place in 2012.

CHAPTER 7: SUMMARY AND RECOMMENDATIONS
SAC/361896/103560003 (CRC 2010 AMR REV 3-14-2011) 7-3
The CRC continued to implement a SWAMP-compliant electronic data submittal system, including laboratory prepared SWAMP-compliant Electronic Data Reports for chemistry analyses. The CRC submitted results to the CVRWQCB on a regular basis to provide for real-time discussion of results, their potential implications, and appropriate management actions.
The CRC’s SWAMP-compliant QAPP was updated to include 2010 requirements, and was implemented. As part of the SWAMP submittal, lab MDL studies for modified EPA analysis methods were submitted to the CVRWQCB. The MDL studies provide technical confirmation of the detection limits reported by McCampbell Analytical.
Review of field and laboratory QA/QC samples indicates substantial achievement of quality objectives.
All field blank samples were found to have analyte levels below the MRLs. Field duplicate sample results were consistent with primary sample results.
Laboratory QA/QC substantially achieved data quality objectives. Method blanks achieved data quality objectives, with all results nondetect, as expected. MS/MSD and LCS samples achieved data quality objectives, with all recoveries and RPD values within the target range.
Propanil analysis demonstrated that management practices are substantially protecting water quality, with the majority of the results below magnitude that would indicate continued assessment monitoring. The June 29 Site F sample had a result of 10 mg/L. Based on these results, it is recommended that the Propanil Management Plan be discussed with the CVRWQCB staff to consider whether to include 8 weeks of assessment monitoring at sites CBD5, BS1, and F.
Core monitoring sites for trend monitoring of rice water quality impacts continue to be appropriate because of the uniformity of rice farming practices across the valley. Rice water management and rice water quality management practices are relatively consistent throughout the valley: The same set of field preparation, irrigation, and harvest practices are available to growers. Additionally, the water hold requirements apply to all rice growers, leaving little variation in the methods of rice farming from the various drainage areas.
Implementation of management practices continued in 2010, including water hold requirements; education and outreach (newsletters and grower meetings); stakeholder involvement with enforcement activities; and coordination with the UC Cooperative Extension, UC Davis, and the Rice Research Board. Additionally, the CRC has the ability to directly contact each of its members and is committed to using its outreach capabilities to address water quality concerns when they are identified.
The CRC continues to be engaged in the CVRWQCB’s efforts to refine the irrigated lands conditional waiver program through its regular consultation with CVRWQCB staff and through its participation in the CVRWQCB’s Technical Issues Committee, CV-SALTS Salinity Coalition, Central Valley Pesticide Total Maximum Daily Load and Basin Plan Amendment, and Drinking Water Policy Workgroup.

CHAPTER 7: SUMMARY AND RECOMMENDATIONS
7-4 SAC/361896/103560003 (CRC 2010 AMR REV 3-14-2011)
CWFR Recommendations for 2011 The CRC’s 2010 monitoring satisfies the MRP requirements for a phased monitoring
regime that includes assessment and core monitoring on a 3-year cycle. It is recommended that monitoring in 2011 include core monitoring parameters at core sites.
It is recommended the results of the Propanil Monitoring Plan be evaluated collaboratively with CVRWQCB staff in order to develop an appropriate recommendation for continued monitoring.
Close consultation with CVRWQCB staff regarding the program should continue in an effort to refine the program to focus on identified water quality concerns and appropriate implementation actions, if warranted. The CVRWQCB is developing a Long-Term Irrigated Lands Regulatory Program (LT-ILRP), scheduled for Board consideration in 2011. The CRC anticipates developing a rice-specific MRP under the LT-ILRP.
RPP The results of all monitoring of drinking water intakes and the SR1 river site during 2010, including intake monitoring conducted by the cities of Sacramento and West Sacramento and RPP monitoring conducted by CRC, showed thiobencarb concentrations below the drinking water maximum contaminant level and Basin Plan Performance Goals. One Colusa Basin Drain monitoring location had a measured exceedance of the 1.5 µg/L Basin Plan Performance Goals for thiobencarb during the 2010 monitoring season. The exceedance was at Site CBD1 (June 8), and Site CBD5 (June 10) met, but did not exceed the performance goal.
The CRC initiated its communication strategy in 2009, which includes outreach to its grower membership, CVRWQCB staff, the Cities of Sacramento and West Sacramento, and the CACs. The CRC sent letters to all growers and the rice CACs on June 5, 2009, as notification of the 2009 thiobencarb exceedances and asking for their assistance in remedying the problem. The grower letter included complete pesticide regulation information, including water hold information for Bolero UltraMax. Following the aggressive outreach to grower membership, no further exceedances were detected.
Communication among the CRC, CACs, and DPR was even greater during the 2010 rice pesticide application season as a result of the efforts from 2009. The exceedance at the CBD1 drain site resulted from an Abolish application. The grower was using a recirculating system for pumping water from the bottom of the field to the top. The water got too deep in the bottom rice check, so the grower requested an emergency release. Two other growers requested emergency releases at this time and were denied. Unfortunately the emergency release request did not fulfill the requirement of 19 days for Abolish. The DPR Senior Inspector determined the source of the exceedance at CBD1 came entirely from Colusa County. Fortunately, the monitoring results and followup investigation gave the Colusa CAC an area to target with additional outreach and inspection.

CHAPTER 7: SUMMARY AND RECOMMENDATIONS
SAC/361896/103560003 (CRC 2010 AMR REV 3-14-2011) 7-5
Assessment of the 2010 RPP Program The RPP continues to be an example of an effective agricultural water quality regulatory
program. The RPP implements an aggressive monitoring schedule designed to focus sampling activities during the 9 weeks of peak pesticide use and on high-use products that are regulated under the Basin Plan’s Conditional Prohibition of Discharge.
The CRC’s RPP monitoring schedule continues to provide a rigorous sampling regime designed to rapidly assess compliance with Performance Goals and attainment of the thiobencarb water quality objective for rice pesticides regulated under the Basin Plan Prohibition of Discharge.
The cause of the thiobencarb exceedance in the Colusa Basin Drain is attributable to conditions associated with the ACP issued by the Colusa CAC for a field located toward the southern part of Colusa County, approximately 3 to 5 miles north of the Yolo County line. The unauthorized emergency release, combined with possible releases resulting from the two requests, led the DPR Senior Inspector and the CAC Biologist to hypothesize that other growers may have had to release water during that same time frame. The CAC has an area to target for inspections in 2011
Water holds and other management practices implemented by rice growers and the CRC continue to be critical to protect water quality. Three CACs participate in surveillance inspections, including additional holiday and weekends, which were historically funded by the CRC. In 2010, Valent offered to match the CRC in providing funding for surveillance inspection in the nine rice counties. Four counties accepted the offer, so the surveillance program extended to seven counties in 2010. The surveillance inspections continue to be an important component of the water quality protection program.
Two new management practices were required in 2010, pursuant to Resolution No. R5-2010-9001. These new management practices are included below and the CRC’s 2010 implementation of these practices is described in the next bullet. “1)b). The California Rice Commission will provide additional outreach on results from 2009 thiobencarb monitoring and required management practices to pesticide applicators. This outreach will include, but not be limited to, clarification of hold time requirements, application rates, proper application procedures, and notification of the finding of elevated thiobencarb levels in the Sacramento River near drinking water intakes. The California Rice Commission will also contact ten thiobencarb dealers and distributors in the Sacramento River Basin to discuss the Rice Pesticides Program and possible areas of improvement.” “1)c). The California Rice Commission will increase the funding of additional county surveillance at non-traditional hours to double the level of 2009 and extend the program to counties not previously funded. Surveillance inspections will increase to approximately 1.5 times the current level with the new funding.”
The new 2010 management practices were implemented as follows: 1) b). The California Rice Commission was successful in increasing outreach to
the dealers and distributors in order to identify possible areas of improvement.
CHAPTER 7: SUMMARY AND RECOMMENDATIONS
7-6 SAC/361896/103560003 (CRC 2010 AMR REV 3-14-2011)
The dealers and distributors confirmed that they attended the Mandatory Thiobencarb Stewardship Meeting and could not identify any improvements to the Rice Pesticides Program.
1)c). The additional surveillance inspections were specific to the major rice growing counties at the time of implementation: Butte, Colusa and Glenn. For the 2010 growing season, the CRC approached the additional rice growing counties to inquire about interest in participating in the surveillance program. Both Sacramento and Tehama Counties declined due to little rice acreage remaining in the county. Sutter County declined to participate directly in the surveillance program, but committed 20% inspection time to the Rice Pesticides Program through the Pesticide Use Enforcement set of goals and objectives with DPR. The counties participating in the additional inspections for 2011 include Butte, Colusa, Glenn, Placer, Yolo and Yuba.
RPP Recommendations for 2010 The CRC continues to implement aggressive efforts to implement additional, industry
outreach and education to growers, pest control advisors (PCAs), applicators, dealers, and distributors during the 2011 season, as was accomplished early in the 2010 season. Examples include the following:
Continuance of the mandatory thiobencarb stewardship meetings
Close coordination with the CACs
Outreach via the CRC newsletter and website
Maintenance of the ongoing relationships with applicators and PCAs
A continued outreach focus on management practices for Bolero UltraMax, which is the newer formulation of thiobencarb
Grower implementation of measures to effectively manage thiobencarb discharges, as detailed in the CVRWQCB Resolution and the DPR Permit Conditions
The CRC plans to continue the approved recommendations as outlined in R5-2010-9001. From experience in managing the Rice Pesticides Program and communication with the CACs, the CRC recognizes additional refinement in the following program areas:
Coordination with DPR by providing feedback on updating documents that define the water holding and early/emergency release requirements to the CACs.
Remind the CACs to provide DPR with the rice pesticide use data by October 31.
It is recommended that the CRC continue to implement RPP water quality monitoring and reporting activities consistent with the program implemented during 2008 and renewed and approved in 2010 through Resolution R5-2010-9001..
The CRC will utilize the stakeholder process in gaining collaboration from DPR, the CVRWQCB, and the city utilities on the RPP recommendations through 2010.
SAC/361896/103560003 (CRC 2010 AMR REV 3-14-2011) 8-1
CHAPTER 8
References
Ayers, R.S. and D.W. Wescot. 1985. Water Quality for Agriculture. Food and Agriculture Organization of the United Nations—Irrigation and Drainage Paper No. 29, Rev. 1. Rome.
CH2M HILL. 2010. Quality Assurance Project Plan for the California Rice Commission Water Quality Programs (RPP, CWFR).
CVRWQCB. 2004. Recommended Numerical Limits to Translate Water Quality Objectives. May 19, 2004. Available at: http://www.waterboards.ca.gov/centralvalley/ water_issues/water_quality_standards_limits/water_quality_goals/index.shtml.


![Apostila Cursos CRC - Administração de Departamento Pessoal CRC[1]](https://img.dokumen.tips/doc/110x75/5571f85049795991698d254a/apostila-cursos-crc-administracao-de-departamento-pessoal-crc1.jpg)