Embed Size (px)
DESCRIPTION
Section P.3 – Functions and their Graphs. Functions. A relation such that there is no more than one output for each input. A B C. W Z. 4 Examples of Functions. These are all functions because every x value has only one possible y value. Every one of these functions is a relation. . - PowerPoint PPT Presentation
Citation preview

Section P.3 – Functions and their Graphs

Functions
Algebraic Function
Can be written as finite sums, differences, multiples, quotients, and radicals involving xn.Examples:
Transcendental Function
A function that is not Algebraic.Examples:
A relation such that there is no more than one output for each input
A
B
C
W
Z
4
2
2 14
3 10xx
f x x x
g x
sin
ln
h x x
g x x

4 Examples of Functions
X Y-3 1-1 00 45 77 3
X Y10 215 -518 -520 17 -5
These are all functions
because every x value has only one possible y
value
Every one of these functions is a
relation.

3 Examples of Non-Functions
X Y0 41 102 111 -35 3
Every one of these non-functions is a
relation.
Not a function since x=1 can
be either y=10 or y=-3
Not a function since x=-4
can be either y=7 or y=1
Not a function since multiple x values have multiple y
values
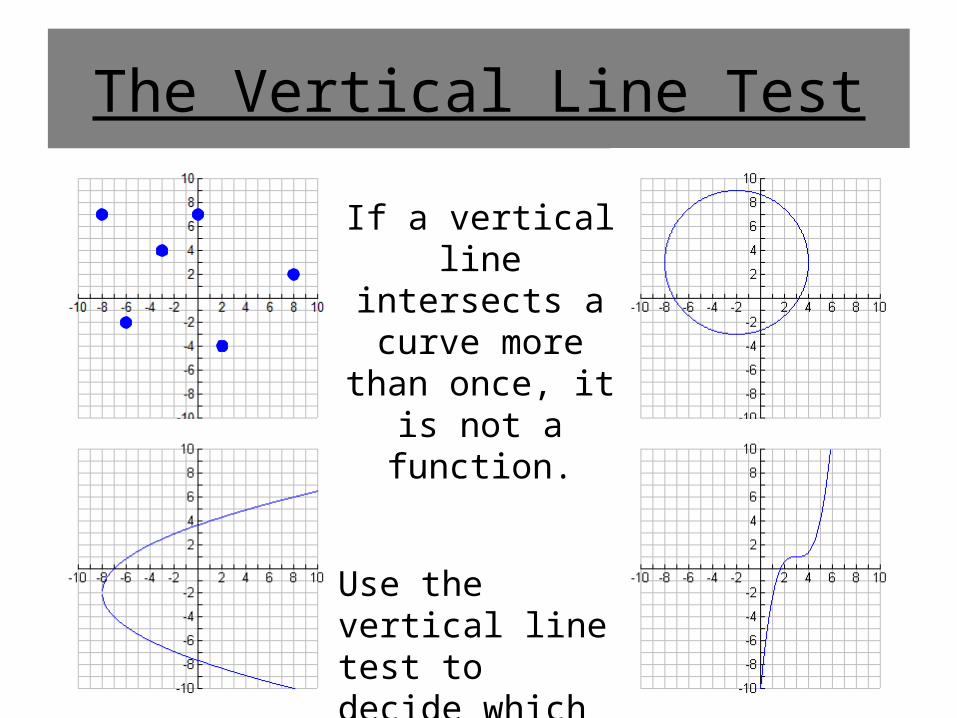
The Vertical Line Test
If a vertical line intersects a curve more than once, it is not a function.
Use the vertical line test to decide which graphs are functions. Make sure to circle the functions.

The Vertical Line Test
If a vertical line intersects a curve more than once, it is not a function.
Use the vertical line test to decide which graphs are functions. Make sure to circle the functions.

Function Notation: f(x)Equations that are functions are typically written in a
different form than “y =.” Below is an example of function notation:
The equation above is read:f of x equals the square root of x.
The first letter, in this case f, is the name of the function machine and the value inside the parentheses is the input. The expression to the right of the equal sign shows what the machine does to the input.
f x xDoes not stand for “f times x”
It does stand for “plug a value for x into a formula f”

Example
If g(x) = 2x + 3, find g(5).
5g 2 5 3
5 10 3g
5 13g
You want x=5 since g(x) was
changed to g(5)
When evaluating, do not write g(x)!
You wanted to find g(5). So the
complete final answer includes
g(5) not g(x)

Solving v Evaluating 2
3If 3, complete the following:f x x
a. Evaluate 3f b. Find if 5x f x Substitute and Evaluate
The input (or x) is 3.
Solve for x
The output is -5.
23 3 3 2
35 3x
No equal sign Equal sign
2 3
1
238 x
12 x

Number Sets Counting numbers
(maybe 0, 1, 2, 3, 4, and so on)Natural Numbers:
Positive and negative counting numbers (-2, -1, 0, 1, 2, and so on)Integers:
a number that can be expressed as an integer fraction (-3/2, -1/3, 0, 1, 55/7, 22, and so on)
Rational Numbers:
a number that can NOT be expressed as an integer fraction (π, √2, and so on)
Irrational Numbers:NONE

Number Sets The set of all rational
and irrational numbersReal Numbers:
Natural Numbers
Integers
Rational Numbers
Irrational
Numbers
Rea
l Num
ber V
enn
Dia
gram
:

Set NotationNot Included
The interval does NOT include the endpoint(s)Interval Notation Inequality Notation Graph
Parentheses ( )
< Less than > Greater than
Open Dot
Included The interval does include the endpoint(s)
Interval Notation Inequality Notation GraphSquare Bracket
[ ]≤ Less than
≥ Greater thanClosed Dot

Graphically and algebraically represent the following:
All real numbers greater than 11
Graph:
Inequality:
Interval:
Example 1
10 11 12
11x
11,Infinity never ends. Thus we always
use parentheses to indicate there is no
endpoint.

Describe, graphically, and algebraically represent
the following: Description:
Graph:
Interval:
Example 2
1 3 5
1 5x
1,5
All real numbers greater than or equal to 1 and less than 5

Describe and algebraically represent the
following:
Describe:
Inequality:
Symbolic:
Example 3
-2 1 4
2 or 4x x
, 2 4,
All real numbers less than -2 or greater than 4
The union or combination of the
two sets.

Domain and Range
DomainAll possible input values (usually x), which allows the function to work.
RangeAll possible output values (usually y), which result from using the function.
The domain and range help determine the window of a graph.
x y
f

Example 1
Domain: ,
Range: 25,
Domain: 8,2 2,9
Range: 7,8
1 9y x x
Describe the domain and range of both functions in interval notation:

Example 2Find the domain and range of .
h t 4 3t
t -32 -20 -15 5 -4 0 1 2 3
h 10 8 7 -7 4 2 1 ER ER
0, DOMAIN: RANGE:
The range is clear from the graph and table.
The input to a square root function must be greater
than or equal to 0
4 3t 0
3t 4
t 43
Dividing by a negative switches
the sign
, 43
The domain is not obvious with the graph or table.

Piecewise Functions
For Piecewise Functions, different formulas are used in different regions of the domain.
Ex: An absolute value function can be written as a piecewise function:
if 0 if 0x x
xx x
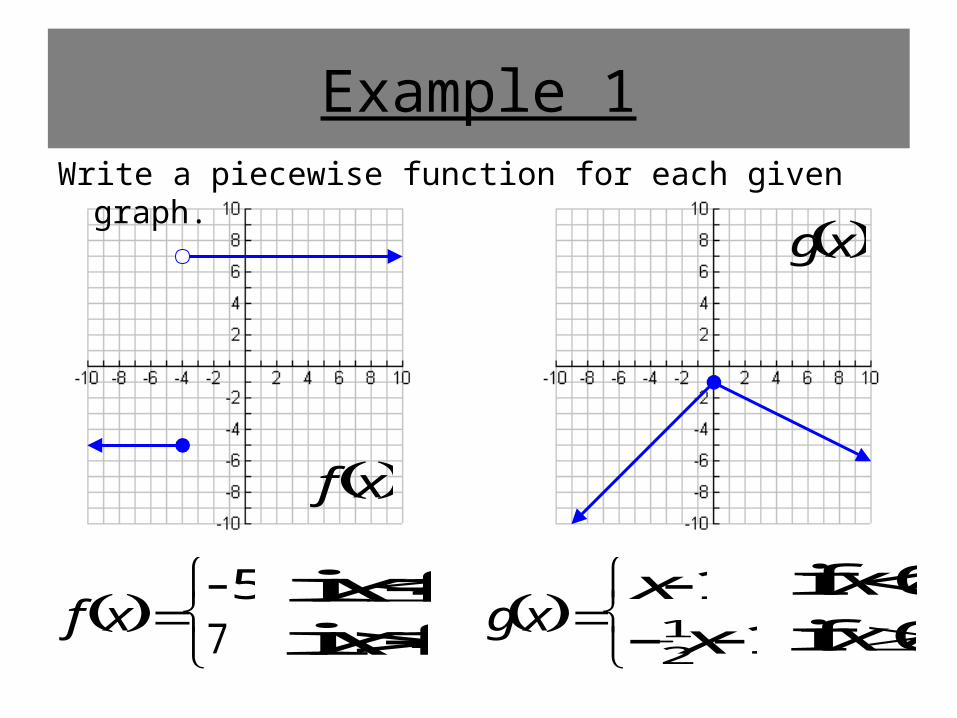
Example 1Write a piecewise function for each given graph.
f x
f x
g x
g x
7
if x 4
5
if x 4
12 x 1 if 0x
x 1 if 0x

Example 2Rewrite as a piecewise function.
f x x 2 1
Find the x value of the vertex
Change the absolute values to parentheses. Plus make the one on
the left negative.
x -3 -2 -1 0 1 2 3 4
f(x) 6 5 4 3 2 1 2 3
f x
x 2 1
2 1x
if x 2
if x 2
Use a graph or table to help.

Basic Types of Transformations
( h, k ): The Key Point
y a f x h k
When negative, the original graph is flipped about
the x-axis
When negative, the original graph is flipped
about the y-axis
Horizontal shift of h units
Vertical shift of k units
Parent/Original Function: y f xA vertical stretch if
|a|>1and a vertical
compression if |a|<1

Transformation Example1xy
Shift the parent graph four units to the left and three
units down.
Description:
14 3xy
Use the graph of below to describe and sketch the graph of .

Composition of Functions
g xff
g
First Second
f g xOR
Substituting a function or it’s value into another function. There are two notations:
(inside parentheses always first)

Example 1
Let and . Find:
1gf 2 5g x x 2 3f x x
211 5g
4
1 5
44 2 3f
11
8 3
1 11f g
Substitute x=1 into g(x) first
Substitute the result into f(x)
last
1gf
4

Example 2
Let and . Find:
g f x 2 5g x x 2 3f x x
2 3f x x
22 3 52 3g xx
24 12 9 5x x 2 3 2 3 5x x
24 12 4g f x x x
Substitute x into f(x) first
Substitute the result into g(x) last
24 12 4x x
24 12 9 5x x
g f x
2 3x

Even v Odd FunctionSymmetrical with respect to the y-axis.
Even Function
Tests…
Replacing x in the function by –x yields
an equivalent function.
Replacing x in the function by –x yields the opposite of the function.
Symmetrical with respect to the origin.
Odd Function
f x f x f x f x

ExampleIs the function odd, even, or neither? 4f x x
4f x x
4f x x
Check out the graph first. Test by Replacing x in the function by –x.
The equation is even.
An equivalent equation.

Delta xΔx stands for “the change in x.” It is a variable that
represents ONE unknown value. For example, if x1 = 5 and x2 = 7 then Δx = 7 – 5 = 2. Δx can be algebraically manipulated similarly to single letter variables. Simplify the following statements:
21. 5 1x 2. x x xx
5 1 5 1x x
225 10 1x x 225 5 5 1x x x
x x xx
1
xx