Embed Size (px)
Citation preview
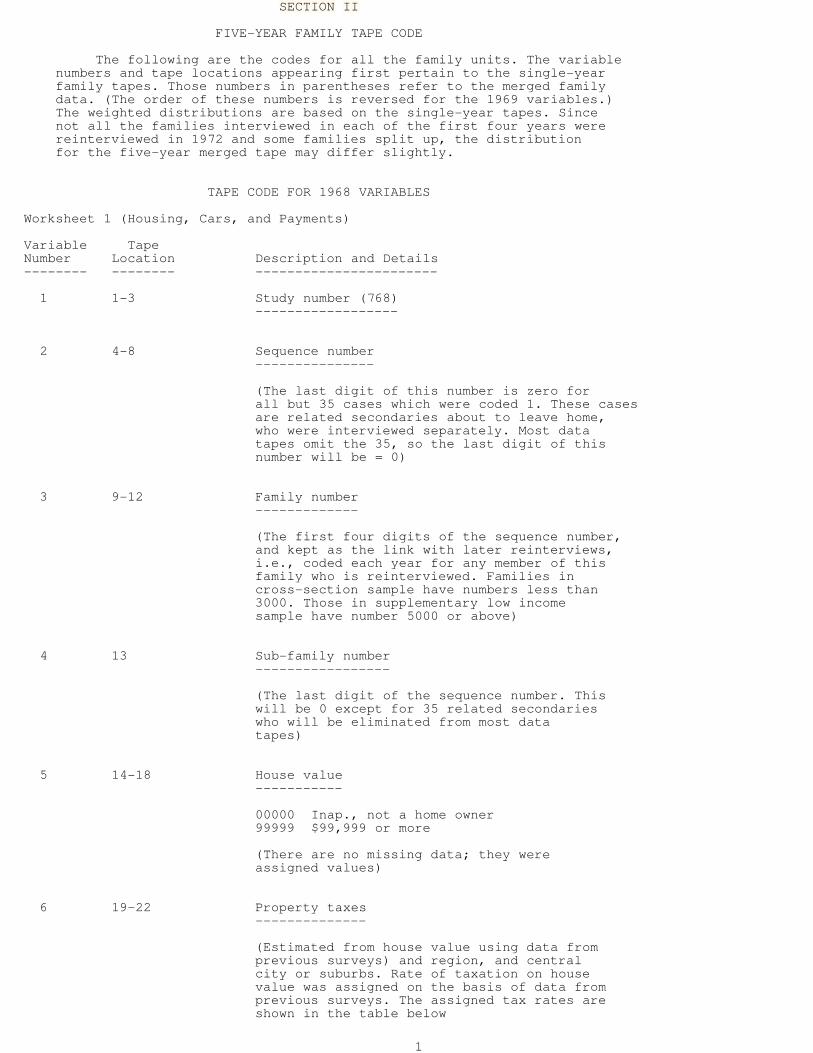
SECTION II
FIVE-YEAR FAMILY TAPE CODE
The following are the codes for all the family units. The variablenumbers and tape locations appearing first pertain to the single-yearfamily tapes. Those numbers in parentheses refer to the merged familydata. (The order of these numbers is reversed for the 1969 variables.)The weighted distributions are based on the single-year tapes. Sincenot all the families interviewed in each of the first four years werereinterviewed in 1972 and some families split up, the distributionfor the five-year merged tape may differ slightly.
TAPE CODE FOR 1968 VARIABLES
Worksheet 1 (Housing, Cars, and Payments)
Variable TapeNumber Location Description and Details-------- -------- -----------------------
1 1-3 Study number (768)------------------
2 4-8 Sequence number---------------
(The last digit of this number is zero forall but 35 cases which were coded 1. These casesare related secondaries about to leave home,who were interviewed separately. Most datatapes omit the 35, so the last digit of thisnumber will be = 0)
3 9-12 Family number-------------
(The first four digits of the sequence number,and kept as the link with later reinterviews,i.e., coded each year for any member of thisfamily who is reinterviewed. Families incross-section sample have numbers less than3000. Those in supplementary low incomesample have number 5000 or above)
4 13 Sub-family number-----------------
(The last digit of the sequence number. Thiswill be 0 except for 35 related secondarieswho will be eliminated from most datatapes)
5 14-18 House value-----------
00000 Inap., not a home owner99999 $99,999 or more
(There are no missing data; they wereassigned values)
6 19-22 Property taxes--------------
(Estimated from house value using data fromprevious surveys) and region, and centralcity or suburbs. Rate of taxation on housevalue was assigned on the basis of data fromprevious surveys. The assigned tax rates areshown in the table below
1

-------------------------------------------------------------------PROPERTY TAXES/HOUSE VALUE
Maine, Vermont, Mass.,Distance from Nearest Rhode Island, N.H.,City of 50,000 or More Connecticut, New England
(Question N11) (See Interviewer Label) Other---------------------- ------------------------ -----
0 - 5 .025 .0205 - 49 .020 .015
50 miles or more .015 .010
Source: E.S. Maynes and J.N. Morgan, "The Effective Role ofReal Estate Taxation," R.E. Stat. XXXIX (Feb. 1957),14-22.
-------------------------------------------------------------------
7 23 Accuracy of house value and property taxes------------------------------------------
0. No assignments1. Minor assignments2. Major assignments (probable errors more
than $300 or 10%)3. Complex property, requiring allocation of
property taxes, etc. between dwelling andother purposes of building.
8 24-27 Annual mortgage payments------------------------0000. Inap., does not have mortgage payments9999. $9,999 or more
9 28 Accuracy of mortgage payments-----------------------------
(See code for Variable 7)
10 29-32 Annual rent paid----------------
0000. Inap., does not pay rent9999. $9,999 or more
11 33 Accuracy of rent payments-------------------------
0. No assignments1. Minor assignments2. Major assignments (probable errors more
than $300 or 10% of the total)
12 34-37 Annual rent value of free housing (for thosewho neither own nor rent)--------------------------------------------
0000. Inap.
13 38 Accuracy of annual rent value of free housing---------------------------------------------
(See VII code)
14 39-41 Annual utilities paid---------------------
000. None999. $10,000 or more
2

15 42 Accuracy of annual utilities----------------------------
(See VII code)
16 43-46 Value of Additions and repairs done by R andfamily--------------------------------------------
0000. Did none self9999. $9,999 or more
17 47 Accuracy of V16---------------
0. No assignments1. Minor assignments2. Major assignments4. Work done free of charge by someone
outside the family unit
18 48-51 Annual payments on previous additions andrepairs (Debt)-----------------------------------------
0000. No payments9999. $9,999 or more
19 52 Accuracy of V18---------------
(See V11 code)
20 53-56 Annual cost of car insurance----------------------------
0000. No insurance (or no car)9999. $9,999 or more
21 57 Accuracy of V20---------------
(See V11 code)
22 58-61 Annual payments on car debts----------------------------
0000. No car payments9999. $9,999 or more
23 62 Accuracy of V22---------------
(See V11 code)
24 63-65 Amount saved doing own car repairs----------------------------------
0000. Nothing (or did no repairs)9999. $9,999 or more
25 66 Accuracy of V24---------------
(See V17 code)
3

26 67-69 Hours spent repairing car-------------------------
000. None999. 999 or more
27 70 Accuracy of V26---------------
(See V11 code)
28 71-74 Annual payments on other debts------------------------------
0000. No such payments9999. $9,999 or more
29 75 Accuracy of V28---------------
(See V11 code)
Worksheet 2 (Food Expenditures and Food Needs)
30 76 Family size-----------
9. Nine or more
31 77-80 Annual food standard (Needs)----------------------------
This is based on the USDA Low Cost planestimates of the weekly food costs, accordingto the table below reproduced from FamilyEconomics Review March, 1967), summed for thefamily converted to annual (times 52), andadjusted for economies of scale by USDA rulesas follows:
Single person - add 20%Two persons - add 10%Three persons - add 5%Four persons - no changeFive persons - deduct 5%Six or morepersons - deduct 10%
-------------------------------------------------------------------TABLE B. INDIVIDUAL FOOD STANDARD (LOW COST)
Age Male Female--- ---- ------Under 3 3.90 3.904 - 6 4.60 4.607 - 9 5.50 5.50
10 - 12 6.40 6.3013 - 15 7.40 6.9016 - 20 8.70 7.2021 - 35 7.50 6.5035 - 55 6.90 6.3055 + 6.30 5.40
(This same standard will be used in subsequentyears, leaving adjustments for inflation, etc.to users)
-------------------------------------------------------------------
4
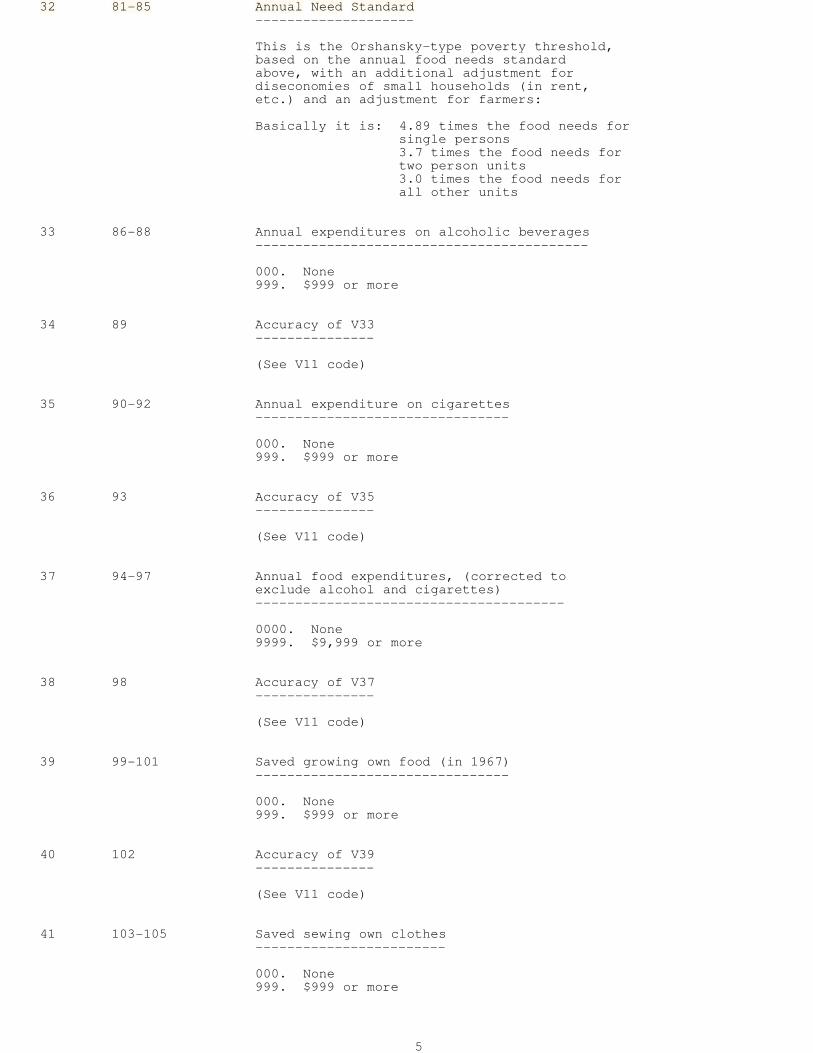
32 81-85 Annual Need Standard--------------------
This is the Orshansky-type poverty threshold,based on the annual food needs standardabove, with an additional adjustment fordiseconomies of small households (in rent,etc.) and an adjustment for farmers:
Basically it is: 4.89 times the food needs forsingle persons3.7 times the food needs fortwo person units3.0 times the food needs forall other units
33 86-88 Annual expenditures on alcoholic beverages------------------------------------------
000. None999. $999 or more
34 89 Accuracy of V33---------------
(See V11 code)
35 90-92 Annual expenditure on cigarettes--------------------------------
000. None999. $999 or more
36 93 Accuracy of V35---------------
(See V11 code)
37 94-97 Annual food expenditures, (corrected toexclude alcohol and cigarettes)---------------------------------------
0000. None9999. $9,999 or more
38 98 Accuracy of V37---------------
(See V11 code)
39 99-101 Saved growing own food (in 1967)--------------------------------
000. None999. $999 or more
40 102 Accuracy of V39---------------
(See V11 code)
41 103-105 Saved sewing own clothes------------------------
000. None999. $999 or more
5

42 106 Accuracy of V41---------------
(See V11 code)
43 107-109 Value of free food received on job (annual)-------------------------------------------
000. None999. $999 or more
44 110 Accuracy of V43---------------
(See V11 code)
45 111-113 Saved by using food stamps (non-money incomesubsidy)--------------------------------------------
000. None999. $999 or more
46 114 Accuracy of V45---------------
(see V11 code)
Worksheet 3 (Time Budgets)
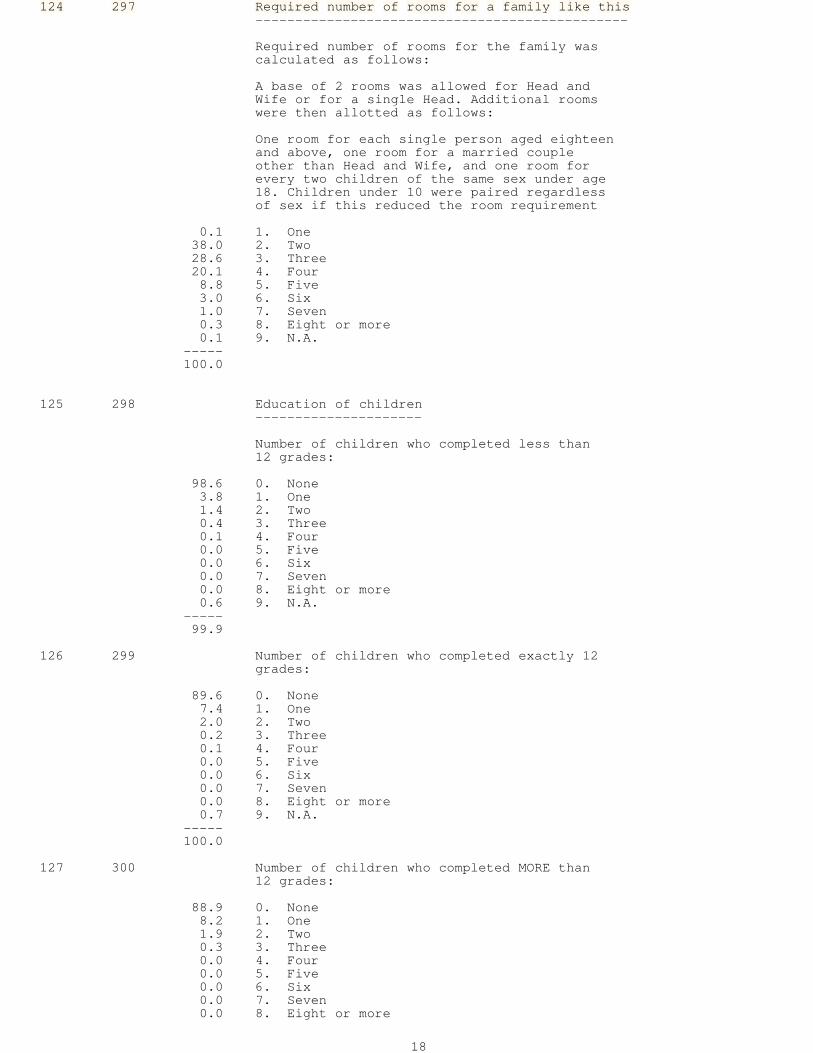
47 15-118 Head's annual hours working for money-------------------------------------
0000. None9999. 9999 or more
48 119 Accuracy of V47---------------
(See V11 code)
49 23 Head's non-leisure from unemployment (Annualhours) (Days unemployed times 8)--------------------------------------------
0000. None9999. 9999 or more
50 124 Accuracy of V49---------------
(See V11 code)
51 125-128 Head's non-leisure from illness (Annual hours)----------------------------------------------
(Days ill times 16 for the first 8 weeks andtimes 8 for time thereafter)
0000. None9999. 9999 or more
52 12 Accuracy of V51---------------
(See V11 code)
6

53 130-133 Wife's annual hours working for money-------------------------------------
0000. None or Inap.9999. 9999 or more
54 134 Accuracy of V53---------------
(See V11 code)
55 35-138 Hours of purchased child care (if childrenunder 12 and adults all work) (Based onreported cost of child care, assuming $1per hour)------------------------------------------
0000. None or Inap.
56 139 Accuracy of V55---------------
(See V11 code)
57 140-143 Free help with housework, baby sitting, etc.from outside dwelling. (Based on amount savedby such free help, assuming $1 per hour)---------------------------------------------
58 144 Accuracy of V57---------------
(See V11 code)
59 145-148 Hours spent on housework by Head and Wife.(Based on estimates from Productive Americans(see below) after deducting purchased childcare hours (V55) and free help (V57))---------------------------------------------
Single Man Housework Hours---------- ---------------No one under 18 400Youngest 6 - 18 600If child under 6, ormore than 4 in FU
Single Woman------------Alone 1000With another adult 1300One or two childrenyoungest 4 or older 1600
Youngest under 4 2200Larger families - usecouples table
Wife Wife works Wife worksDoesn't but less than more than
Married Couples Work 750 hrs/yr 750 hrs/yr--------------- ------- ------------- ----------Alone 2000 1700 1500Children or others age 4+
3 or 4 people 2300 2200 18005 or 6 people 2600 2500 20007 or more 3000 2800 2400
Youngest child under 43 people 2600 2600 1800
7
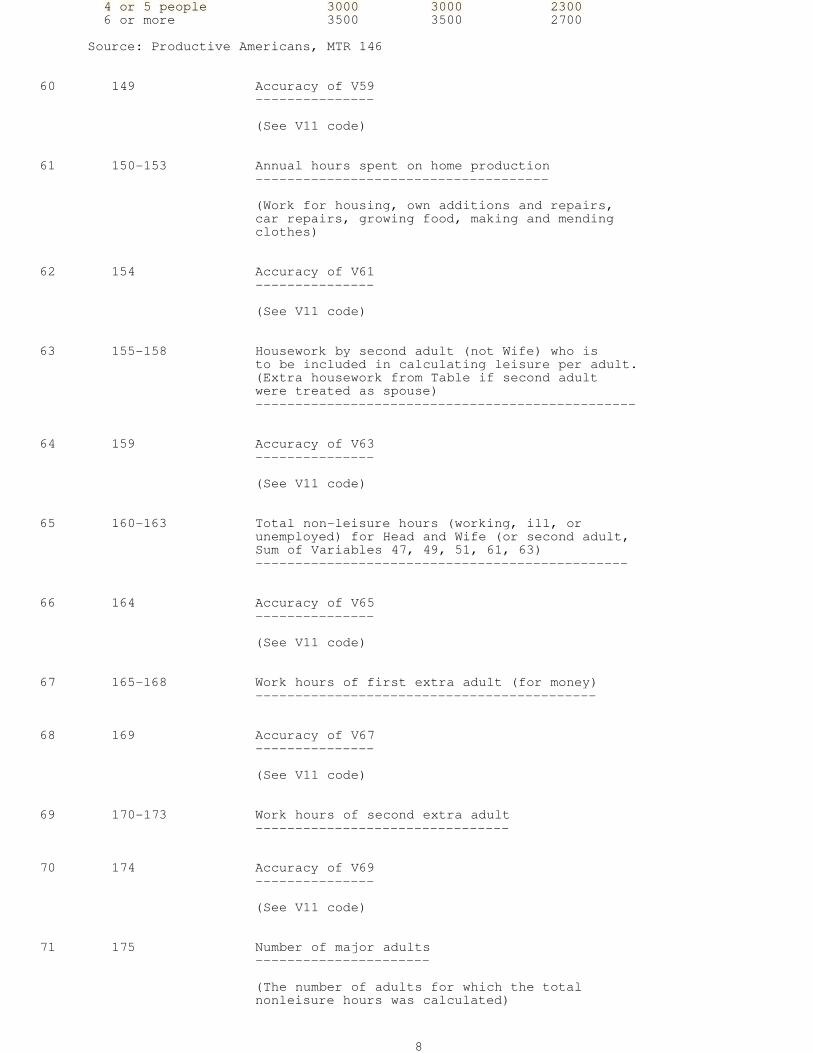
4 or 5 people 3000 3000 23006 or more 3500 3500 2700
Source: Productive Americans, MTR 146
60 149 Accuracy of V59---------------
(See V11 code)
61 150-153 Annual hours spent on home production-------------------------------------
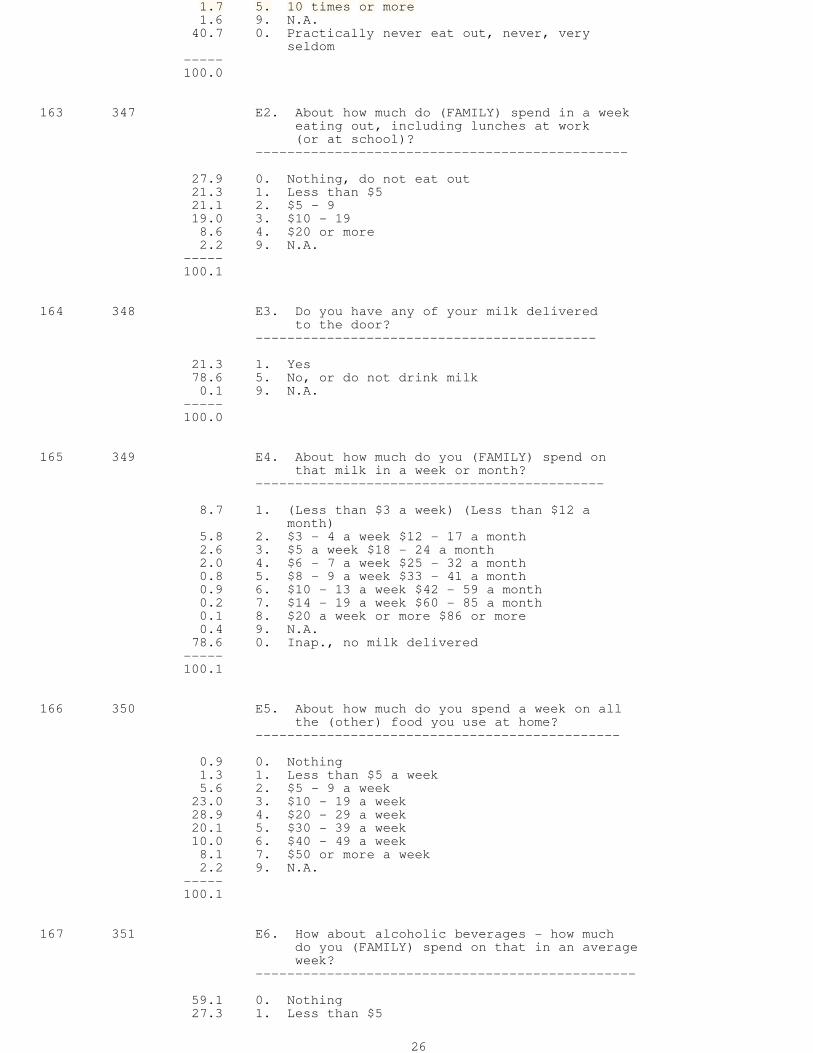
(Work for housing, own additions and repairs,car repairs, growing food, making and mendingclothes)
62 154 Accuracy of V61---------------
(See V11 code)
63 155-158 Housework by second adult (not Wife) who isto be included in calculating leisure per adult.(Extra housework from Table if second adultwere treated as spouse)------------------------------------------------
64 159 Accuracy of V63---------------
(See V11 code)
65 160-163 Total non-leisure hours (working, ill, orunemployed) for Head and Wife (or second adult,Sum of Variables 47, 49, 51, 61, 63)-----------------------------------------------
66 164 Accuracy of V65---------------
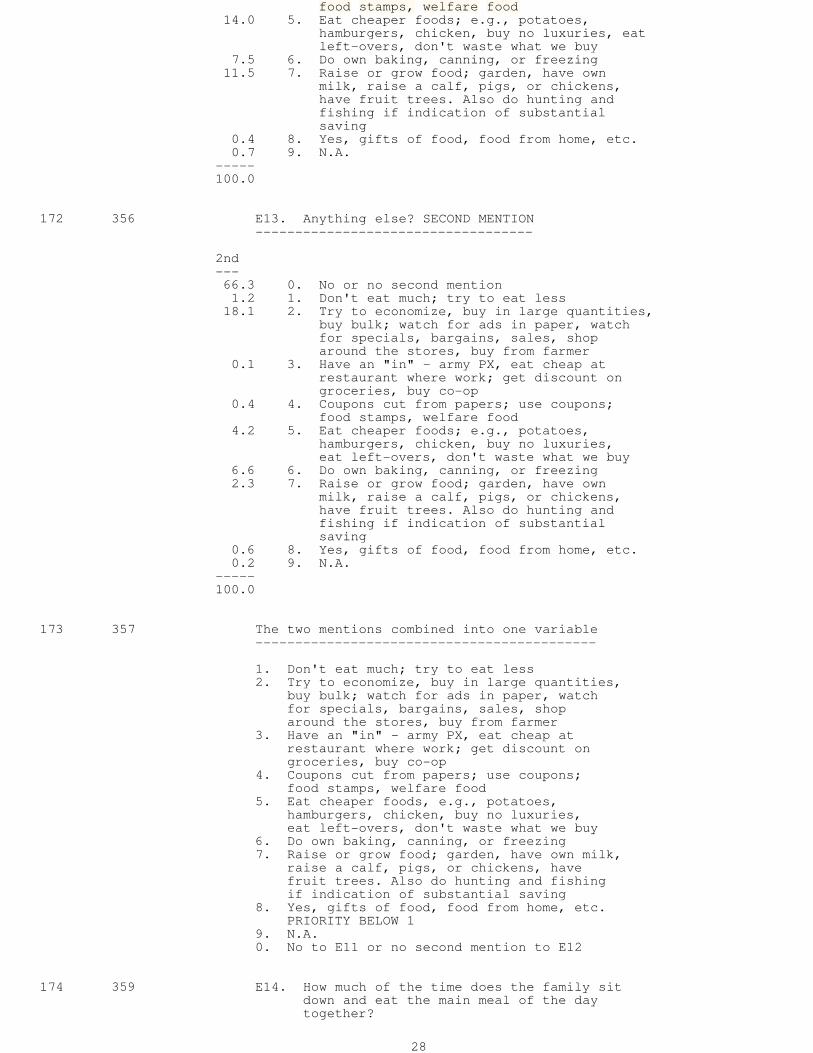
(See V11 code)
67 165-168 Work hours of first extra adult (for money)-------------------------------------------
68 169 Accuracy of V67---------------
(See V11 code)
69 170-173 Work hours of second extra adult--------------------------------
70 174 Accuracy of V69---------------
(See V11 code)
71 175 Number of major adults----------------------
(The number of adults for which the totalnonleisure hours was calculated)
8

72 176-179 Total hours worked for money by anyone otherthan Head and Wife--------------------------------------------
73 180-183 Leisure hours per major adult-----------------------------
(5840 available hours minus non-leisure, V65)Divided by number of major adults, V71)). Thesource of 5840 is 365 days of 16 hours each,allowing for 8 hours sleep
Worksheet 4 (Money Income)
74 184-188 Head's money income from labor------------------------------
(Labor part of farm income and businessincome, wages, bonuses, overtime,commissions, professional practice, laborpart of income from roomers and boarders orbusiness income (See editing instructions))
75 189-193 Wife's money income from work-----------------------------
76 194-198 Taxable income of Head and Wife-------------------------------
This variable is the sum of Head's laborincome, Wife's labor income, asset part ofincome from farm, business, roomers, etc.,rental, interest and dividend income, andWife's income from assets
77 199-203 Taxable income (from labor or capital) ofthe person other than Head or Wife with thehighest income-------------------------------------------
78 204-208 Taxable income of other person with nexthighest income----------------------------------------
79 209-213 Taxable income of all earners, other thanHead and Wife-----------------------------------------
80 214-218 Aid to Dependent Children, Aid to DependentChildren with Unemployed Fathers (ADC, ADCU)for the entire family. This is part oftransfer income--------------------------------------------
81 219-223 Total family money income-------------------------
This is the sum of V76, 79, 80 plus transferincome other than ADC, ADCU. (Total transferincome is available by subtracting Variables76 and 79 from Variable 81)
82 224-227 Contributions made to outside dependents(outside the dwelling)----------------------------------------
9
(This is an out-transfer which could bededucted from income, and is in one variantdeveloped in the 1969 wave)
0000. None9998. $10,000 or more9999. N.A.
NOTE: This is the only variable on theworksheets where missing data was notassigned
83 228-232 Total family income taxes paid------------------------------
This is estimated by editors on the basis oftaxable income, number of exemptions (takingaccount of those over 65 or blind), usingtables for single, married, and head ofhousehold which incorporate the averagedeductions from STATISTICS OF INCOME
84 233-237 Cost of income--------------
This is the sum of income taxes, cost ofchild care if all adults work, and union dues
85 238 Accuracy of V74---------------
(See V11 code)
86 239 Accuracy of V75---------------
(See V11 code)
87 240 Accuracy of V76---------------
(See V11 code)
88 241 Accuracy of V77---------------
(See V11 code)
89 242 Accuracy of V78---------------
(See V11 code)
90 243 Accuracy of V80---------------
(See V11 code)
91 244 Accuracy of V82---------------
(See V11 code)
92 245-247 Survey Research Center identifying numberof primary sampling unit (county or clusterof counties)
10

-------------------------------------------
HUNDREDS DIGIT UNITS DIGIT AREA DESIGNATED
2 1 or 2 Central cities in theNortheast of largemetropolitan areas
2 3 or 4 Suburban areas oflarge metropolitan areasin the Northeast
1 1 or 2 Central cities of largemetro areas, North Central
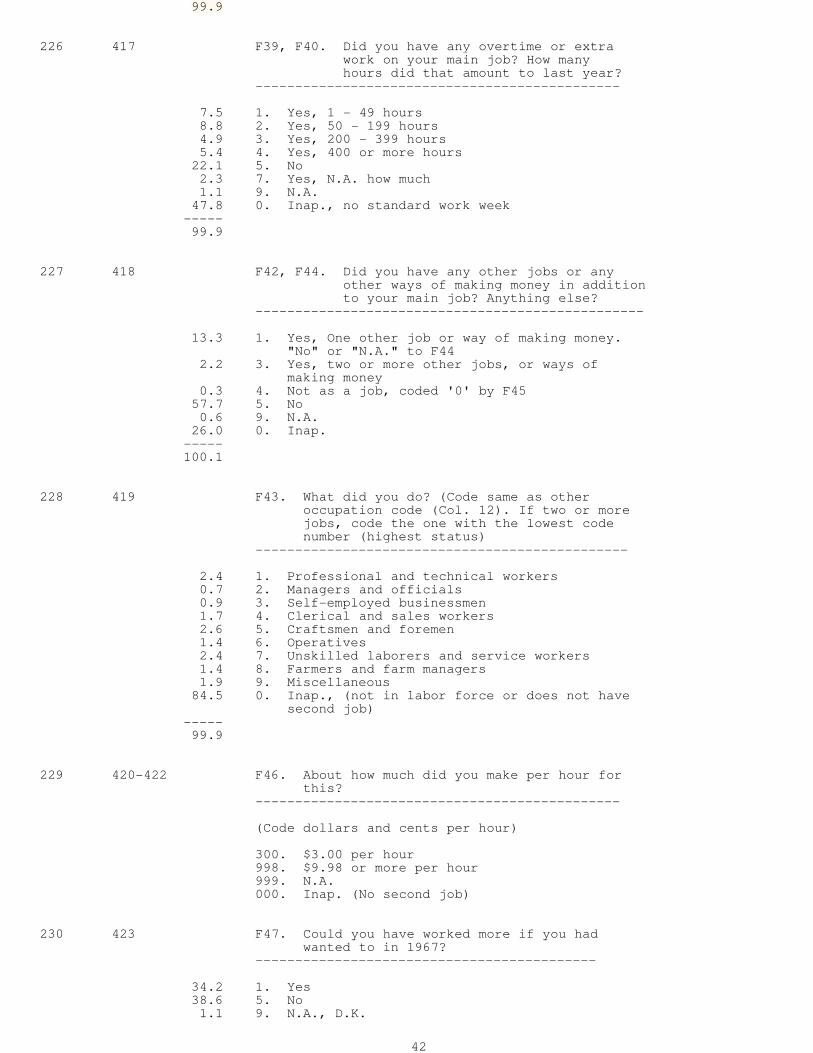
Twelve 1 3 or 4 Suburbs of large metro areas,Largest North CentralMetropolitanAreas 3 1 or 2 Central cities of large
metro areas, South
3 3 or 4 Suburbs of large metroareas, South
0 1 or 2 Central cities of large metroareas, West
0 3 or 4 Suburbs of large metroareas, West
9 5, 6, 9 Northeast, area is aStandard MetropolitanStatistical Area (containsa city of 50,000 or more)
9 7, 8 Northeast, not SMSA
6, 7 5, 6, 9 North central, area containsa SMSA
Rest of the 6, 7 7, 8 North central, no SMSACountry in area
3, 4, 5 5, 6, 9 South, SMSA
3, 4, 5 7, 8 South, not a SMSA
8 5, 6, 9 West, SMSA
8 7, 8 West, not a SMSA
This is coded even for the Census sample, but there is aseparate Census Primary Sampling Unit designation (SeeVariable 132)
93 248-249 State where lives now---------------------
Alphabetically 01 = Alabama to 49 = Wyoming,(but 50 = Alaska and 51 = Hawaii, though theydo not appear)
This and the county code are from U.S. GeneralServices Administration Geographical LocationCodes, (Office of Finance) October 1966,Washington, D.C.
94 250-252 County where lives now (See above)----------------------------------
This is usable only with V93, counties beingnumbered starting with 001 within each state
95 253 Local place (size of largest city)
11
----------------------------------
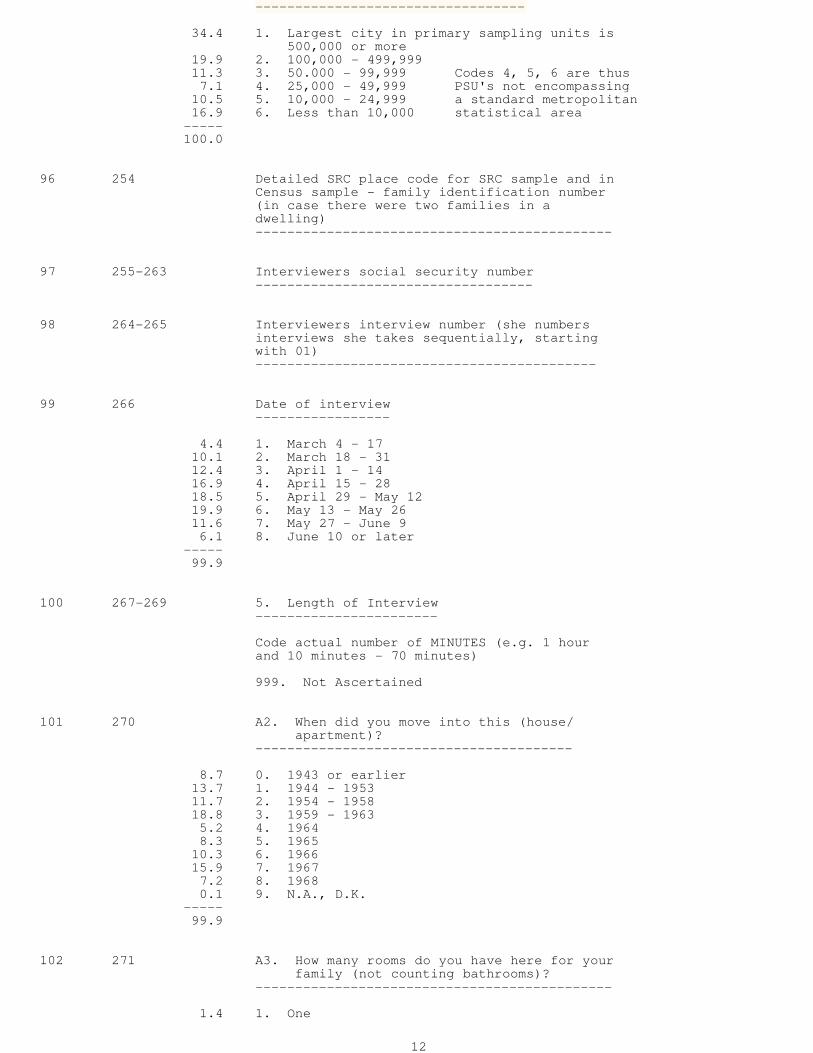
34.4 1. Largest city in primary sampling units is500,000 or more
19.9 2. 100,000 - 499,99911.3 3. 50.000 - 99,999 Codes 4, 5, 6 are thus7.1 4. 25,000 - 49,999 PSU's not encompassing
10.5 5. 10,000 - 24,999 a standard metropolitan16.9 6. Less than 10,000 statistical area
-----100.0
96 254 Detailed SRC place code for SRC sample and inCensus sample - family identification number(in case there were two families in adwelling)---------------------------------------------
97 255-263 Interviewers social security number-----------------------------------
98 264-265 Interviewers interview number (she numbersinterviews she takes sequentially, startingwith 01)-------------------------------------------
99 266 Date of interview-----------------
4.4 1. March 4 - 1710.1 2. March 18 - 3112.4 3. April 1 - 1416.9 4. April 15 - 2818.5 5. April 29 - May 1219.9 6. May 13 - May 2611.6 7. May 27 - June 96.1 8. June 10 or later
-----99.9
100 267-269 5. Length of Interview-----------------------
Code actual number of MINUTES (e.g. 1 hourand 10 minutes - 70 minutes)
999. Not Ascertained
101 270 A2. When did you move into this (house/apartment)?
----------------------------------------
8.7 0. 1943 or earlier13.7 1. 1944 - 195311.7 2. 1954 - 195818.8 3. 1959 - 19635.2 4. 19648.3 5. 1965
10.3 6. 196615.9 7. 19677.2 8. 19680.1 9. N.A., D.K.
-----99.9
102 271 A3. How many rooms do you have here for yourfamily (not counting bathrooms)?
---------------------------------------------
1.4 1. One
12

2.5 2. Two9.8 3. Three
20.6 4. Four24.3 5. Five21.5 6. Six10.0 7. Seven8.5 8. Eight or more1.3 9. N.A., D.K.0.0 0. None, shares room
-----99.9
103 272 A4. Do you (FU) own this home or pay rent orwhat?
---------------------------------------------
61.5 1. Owns home (or trailer, fully or jointly)34.7 5. Rents (or shares rent)3.8 8. Neither (owns nor rents)
-----100.0
104 273 A7, A10. Do you have a mortgage on thisproperty? Do you also have a secondmortgage?
---------------------------------------------
33.6 1. First mortgage only1.3 2. Two mortgages
26.4 5. No mortgage38.6 0. Inap.
-----99.9
105 274 A14. (IF NEITHER) How is that?-------------------------------
0.2 1. Servant; housekeeper0.6 2. Farm laborer1.2 3. Other person for whom housing is part
of compensation (janitors, gardeners,nurses, etc.)
1.3 4. Persons for whom housing is a gift,paid for by someone outside of FU, ownedby relative, pays no rent or only taxes
0.1 5. Sold own home, but still living there0.1 6. Living in house which will inherit;
estate in process0.0 7. Living in temporary quarters (garage,
shed, etc.) while home is underconstruction
0.2 8. Other96.3 0. Inap.
-----100.0
106 275 A15. Do you do some work in return for housing?(What?)
------------------------------------------------
97.5 0. No, do no work or Inap.0.1 1. Do work worth about 20% of rental value
(1 - 2 hours a week)0.0 2. 40%, "some" general maintenance of DU
(3 - 4 hours a week)0.1 3. 60%, maintenance of 1 - 3 other DU's,
as well, or substantial maintenance andrepairs on own DU (5 - 6 hours a week)
0.0 4. 80%, substantial maintenance and repairsof other DU's as well or substantialrenovation of own DU (7 - 8 hours a week)
0.5 5. Do work worth 100% of rental value(maintenance of apartment building)
13
1.8 6. Housing is part of job - tenant farmer,domestic
-----100.0
107 276 A19. Did you have any work done on the (house/apartment) during the last year, or do anywork on it yourselves?
------------------------------------------------
43.9 1. Yes56.0 5. No0.1 9. N.A.
-----100.0
108 277 A20. What was done?--------------------
13.1 1. Simple repairs, painting (little skill)5.6 2. Moderately complex things (carpeting, new
faucets, heater repair, installation ofready-made things) N.A. how complex
13.7 3. Fairly complex, one trade-skill (roofing,eaves trough, siding, carpentry)
5.3 4. Extensive repairs requiring several skills(electrical work, finish off the attic,alter room-divisions, masonry work
5.6 5. Very complex additions or alterationsrequiring several difficult skills, orrare skills such as plumbing, add a room
0.5 9. N.A., D.K.56.1 0. Inap.
-----99.9
109 278 A21-22. Did you or your family do any of it?(If yes) what did you do?
---------------------------------------------
12.6 1. Simple repairs, painting (little skill)3.7 2. Moderately complex things (carpeting, new
faucets, heater repair, installation ofready-made things) N.A. how complex
8.4 3. Fairly complex, one trade-skill (roofing,eaves trough, siding, carpentry)
3.4 4. Extensive repairs requiring several skills(electrical work, finish off the attic,alter room-divisions, masonry work)
3.1 5. Very complex additions or alterationsrequiring several difficult skills, orrare skills such as plumbing, add a room
0.4 9. N.A., D.K.68.5 0. Inap., did not do any of it themselves,
or did not have anything done-----100.1
110 279 A25-26. Do you still owe anything on it? (Ifyes) - is it included in your mortgage?
------------------------------------------------
0.8 1. Yes, owe, and yes included in mortgage2.1 3. Yes, owe, but NOT included in mortgage
(or N.A. whether included)40.1 5. No, do not owe on additions and repairs0.7 9. N.A., D.K.
56.4 0. Inap., did no additions or repairs-----100.1
111 280 A28. Do you think you might move in the next
14

couple of years?---------------------------------------------
23.2 1. Yes, will move6.1 2. Probably will; "Yes, I might"8.2 3. Pro-Con, DO NOT KNOW, It all depends,
maybe2.4 4. Probably not, not likely
59.7 5. No, never0.4 9. N.A.
-----100.0
112 281 A29. Why might you move?-------------------------
5.5 1. Purposive productive reasons, to takeanother job, to get nearer work
19.8 2. Purposive consumption reasons - more orless space, less rent, better neighborhood,want to own a home, better house
6.4 3. Ambiguous, cannot tell whether purposiveor response to outside events; other
4.2 4. Response to outside events, involuntaryreasons (DU coming down, being evicted),armed services, etc.
1.4 9. N.A.62.7 0. Inap.
-----100.0
113 282-283 B1. How many people live here altogether?------------------------------------------
CODE ACTUAL NUMBER
02. 2...
10. 1099. N.A.
114 284 Household Composition (from Q's B1 and B2)------------------------------------------
86.8 1. Head, Wife and children8.4 2. FU includes other related people -
grandparents, grandchildren and in-laws0.6 3. FU includes unrelated people
if an unrelated person is included in theextra earner's sequence, pp 22 - 23, thenhe has been included in the family
2.7 4. Primary in a DU including secondariesThe listing box includes someone labeledas Roomer, Boarder, Friend, Roommate,etc. In such cases the number of peoplein the FU is smaller than the numberin the DU
1.1 5. SecondariesThe Roomer, Boarder, Friend, etc. fromthe household whose Head is coded 4.In the Census Sample, some secondarieswill be included in the sample while theprimaries are not. Also, there will besome persons from the Census Sample whohave moved in with relatives who are notin the sample. If they are NOT poolingfinances, they will be coded 4 as if theywere unrelated secondaries
0.0 6. Sub families - final digit of ID# is1, 2, 3, etc.These are related persons who areincluded in the PRIMARY family FU but who
15

had substantial (> $2000) income lastyear, didn't pool it with the family, andare likely to move out. The sub-familyinterview applies to a sub-unit (a Head'sson and daughter-in-law, for instance)are included in the sub-family FU
0.4 7. Special case for Census movers----- This person or family was in the Census100.0 Sample in spring 1967 but has since
moved in with another family which is notin the sample. They pool income andexpenses, so all are included in thisyear's FU. Usually in these cases theinterview will have been taken with thehead of the sample family, and thenon-sample member of the new enlarged FUwill be included on pages 22 and 23
115 285-286 Number of people (children plus adults) inthis FAMILY UNIT (living here) (fromlisting box)------------------------------------------
CODE ACTUAL NUMBER
02. 2...
10. 1099. N.A.
116 287 Number of Adults in this Family Unit (fromlisting box) (Adults are persons 18 years andolder or who are married)---------------------------------------------
22.5 1. One62.7 2. Two10.9 3. Three3.1 4. Four0.6 5. Five0.1 6. Six0.0 7. Seven0.0 8. Eight or more0.0 9. N.A.
-----99.9
117 288-289 B2. Age of Head of Family Unit-------------------------------
Up to 96. Actual age in years97. 97 years or older
118 290-291 B2. Age of Wife of Head------------------------
Up to 96. Actual age in years97. 97 years or older99. N.A.00. Head of FU is not married
119 292 B2. Sex of Head of Family Unit-------------------------------
79.0 1. Male21.0 2. Female0.0 9. N.A.
-----100.0
16

120 293 How old are they?-----------------
Age of YOUNGEST CHILD UNDER 18 IN FU(children at home only)
10.0 1. Less than two years4.8 2. 2 years up to 2.99 years4.4 3. 3 years up to 3.99 years3.8 4. 4 years up to 4.99 years3.3 5. 5 years up to 5.99 years7.6 6. 6 years up to 8.99 years9.7 7. 9 years up to 13.99 years7.3 8. 14 years up to 18 years0.0 9. N.A.
49.1 0. No children under 18 in FU-----100.0
121 294 B3. Is he/she in school? (Code number ofchildren in FU in school and living athome) (exclude in-laws)
-------------------------------------------
59.0 0. None, no13.1 1. One12.3 2. Two8.0 3. Three4.0 4. Four2.0 5. Five0.6 6. Six0.4 7. Seven0.3 8. Eight0.2 9. Nine
-----99.9
122 295 B6-7. Number of children of Head under 25 notliving with parents
----------------------------------------------
81.3 0. None12.1 1. One4.8 2. Two1.3 3. Three0.3 4. Four0.1 5. Five0.0 6. Six0.0 7. Seven0.0 8. Eight or more0.1 9. Not Ascertained
-----100.0
123 296 B9. Number of children of Head under 25 notliving at home, but in institutions (army,jail, boarding school)
-----------------------------------------------
92.5 0. None6.2 1. One1.1 2. Two0.1 3. Three0.0 4. Four0.0 5. Five0.0 6. Six0.0 7. Seven0.0 8. Eight or more0.1 9. Not Ascertained
-----100.0
17
124 297 Required number of rooms for a family like this-----------------------------------------------
Required number of rooms for the family wascalculated as follows:
A base of 2 rooms was allowed for Head andWife or for a single Head. Additional roomswere then allotted as follows:
One room for each single person aged eighteenand above, one room for a married coupleother than Head and Wife, and one room forevery two children of the same sex under age18. Children under 10 were paired regardlessof sex if this reduced the room requirement
0.1 1. One38.0 2. Two28.6 3. Three20.1 4. Four8.8 5. Five3.0 6. Six1.0 7. Seven0.3 8. Eight or more0.1 9. N.A.
-----100.0
125 298 Education of children---------------------
Number of children who completed less than12 grades:
98.6 0. None3.8 1. One1.4 2. Two0.4 3. Three0.1 4. Four0.0 5. Five0.0 6. Six0.0 7. Seven0.0 8. Eight or more0.6 9. N.A.
-----99.9
126 299 Number of children who completed exactly 12grades:
89.6 0. None7.4 1. One2.0 2. Two0.2 3. Three0.1 4. Four0.0 5. Five0.0 6. Six0.0 7. Seven0.0 8. Eight or more0.7 9. N.A.
-----100.0
127 300 Number of children who completed MORE than12 grades:
88.9 0. None8.2 1. One1.9 2. Two0.3 3. Three0.0 4. Four0.0 5. Five0.0 6. Six0.0 7. Seven0.0 8. Eight or more
18

0.6 9. N.A.-----99.9
128 301 B11, 12. Has anyone moved into your householdin the last year?
----------------------------------------------
6.9 1. Yes, one person0.8 2. Yes, two persons0.2 3. Yes, three people0.2 4. Yes, four or more people
91.4 5. No0.4 9. N.A.
-----99.9
129 302 B12. If Yes, who moved in?---------------------------
0.6 1. Head of family0.3 2. Wife3.8 3. Son or daughter under 18 (include
babies born or adopted)0.3 4. Brother or sister0.1 5. Father or mother0.9 6. Grandchild, any child relative1.5 7. Other adult relatives, in-laws0.9 8. Unrelated person (roomer, boarder,
etc.)0.2 9. N.A.
91.3 0. Inap., coded 5 or 9 in Column 67-----99.9
130 303 B13. Has anyone moved out in the last year?--------------------------------------------
8.6 1. Yes, one person1.2 2. Yes, two persons0.3 3. Yes, three people0.3 4. Yes, four or more people
88.9 5. No0.1 7. Yes, N.A. how many0.6 9. N.A.
-----100.0
131 304 B14. (If yes) Who moved out? (Relation to Headand age)
-----------------------------------------------
1.8 1. Head (previous Head)0.3 2. Wife1.9 3. Son or daughter (under 18)0.1 4. Head's brother or sister0.3 5. Head's father or mother0.4 6. Grandchild, any child relative4.5 7. Other adult relatives (including children
18 or older), in-laws1.1 8. Unrelated person (roomer, boarder)0.1 9. N.A.
89.5 0. Inap.
132 305-307 Census designation of primary sampling area(where originally sampled)-------------------------------------------
(Zero for SRC sample)
133 308-311 Census serial number (household number)
19

---------------------------------------
(Zero for SRC sample)
134 312 Census segment number (designation of an areawithin the primary sampling area)---------------------------------------------
(Zero for SRC sample)
135 313-314 Census segment number (designation of an areawithin the primary sampling)---------------------------------------------
(Zero for SRC sample)
136 315 B15-17. (If children in school) Have you (oryour wife) ever attended any meetingsof a parent-teacher's organization?When was the last time?
----------------------------------------------
12.5 1. Yes, less than three months ago10.3 2. Yes, 3 - 12 months ago5.5 3. Yes, but more than a year ago;
several years ago0.8 4. Yes, but cannot remember when
10.9 5. No (to B16): Cases where childrenlive outside FU
1.1 9. N.A., no P.T.A.58.9 0. Inap. (no children in school)
-----100.0
137 316 B18-19. How much education do you think yourchildren will have when they stopgoing to school? What do you reallythink will happen?
---------------------------------------------
12.4 1. All will go to college (definite), theywill get a college education
10.3 2. Some will go to college, or will get somecollege, hope will complete college
12.2 3. All will finish high school, high schoolat least, 12 grades, hope they will goto college
2.5 4. Some high school, some will finish highschool, may finish high school
0.4 5. One or more will NOT finish high school,or probably not, not much, even so theycan read and write
1.3 6. "Hope they finish high school"1.0 7. Don't know, gives only desires but not
codable in 61.5 9. N.A.
58.4 0. Inap., no children in school-----100.0
138 317-318 B20. Have you (HEAD) ever had any children?B21. When was your (HEAD's) first child born?----------------------------------------------
12. First child born when Head was 1217. First child born when Head was 1718. Etc.99. Don't know, N.A.00. Inap., Head never had any children
139 319 C1. Altogether how many people are there in
20

your family here who can drive? (Includedrivers in sub-family)
---------------------------------------------
11.9 0. None32.3 1. One44.0 2. Two8.5 3. Three2.5 4. Four0.5 5. Five0.1 6. Six0.0 7. Seven0.0 8. Eight or more0.1 9. Not Ascertained
-----100.0
140 320 C2. Do you or anyone else in the family hereown a car? C3. (If no) Does not having acar cause you (Family) any difficulties?
---------------------------------------------
80.4 1. Yes, own a car (Yes to C2)8.4 2. No, and it causes difficulties (Yes
to Q. C3)10.1 5. No, and it causes no difficulties (No
to Q. C3)0.9 7. No car, N.A. whether causes any
difficulties0.2 9. N.A.
-----100.0
141 321 C4. What are they?-------------------
3.8 1. Can't get around; have to depend onothers; no way to have fun, etc.
2.5 2. Makes expenses higher (taxis, have tobuy in more expensive stores), have topay more rent, inconvenience in regardsto necessities, i.e., getting groceries
0.9 3. Can't get to doctor1.0 4. Can't get to job; difficult to get to
work; cannot get to better job1.3 9. N.A.
90.4 0. Inap., family owns a car (Coded I inColumn 16)
-----99.9
142 322 C5. Is there public transportation withinwalking distance that is adequate for you?
-----------------------------------------------
11.5 1. Yes6.1 5. No0.0 8. D.K.1.7 9. N.A.
80.7 0. Inap., family owns a car-----100.0
143 323 C6. How many cars do you and your familyliving here own? (Include trucks, leasedcars, in the count if they are used asfamily transportation, i.e., left in byEditor)
---------------------------------------------
49.4 1. One26.8 2. Two3.6 3. Three
21

0.5 4. Four0.1 5. Five0.0 6. Six0.0 7. Seven0.0 8. Eight or more0.0 9. Not Ascertained
19.6 0. Inap., family does not own a car-----100.0
144 324-325 C7. Year model of newest car-----------------------------
Code last 2 digits of year for newest car
55. 195568. 196899. N.A.00. Inap., family does not own a car
145 326-329 Value of all cars owned (Wholesale, Midwest,NADA, Middle Range V-8)--------------------------------------------
0837. $8373500. $35009998. $9998 or more9999. Not Ascertained0000. Inap., family does not own a car; or
car leased or owned by business
146 330 C9. Is it in good, fair, or poor condition?--------------------------------------------
(Code condition of car in BEST condition)
65.0 1. Good, excellent, very good12.2 3. Fair2.7 5. Poor0.5 9. Not Ascertained
19.6 0. Inap., family does not own a car-----100.0
147 331 C9. Is it in good, fair or poor condition?-------------------------------------------
Code condition of car in WORST condition
53.3 1. Good If only one, can code same20.3 3. Fair as V1466.1 5. Poor0.7 9. N.A.
19.6 0. Inap., family does not own a car-----100.0
148 332 C10. Do you owe any money on it?---------------------------------
(Code whether owes on ANY car)
28.9 1. Yes (Owes on one or more cars)51.0 5. No0.4 9. N.A.
19.6 0. Inap., family does not own a car-----99.9
149 333 C11. Is that car insured?C15. Do they include insurance?
22

--------------------------------
Check for ALL cars69.5 1. All cars insured2.8 3. Some insured, but one or more uninsured;
some insured but N.A. whether all insured0.1 4. N.A. whether first car insured; second car
uninsured, but if newer car is uninsured,then assume that all cars are uninsured
5.9 5. No insured car (all cars uninsured)2.0 9. Not Ascertained
19.6 0. Inap., family does not own a car-----99.9
150 334 C14. How many payments do you have left?-----------------------------------------
(Largest number of payments)
Bracket code:4.5 1. 1 - 66.6 2. 7 - 125.2 3. 13 - 184.9 4. 19 - 242.7 5. 25 - 302.2 6. 31 - 360.2 7. 37 or more0.5 8. Has debt, but no regular payments; lump
sum deal2.5 9. Not Ascertained
70.7 0. Inap., no car debt-----100.0
From C14.151 335 How many payments do you have left?
-----------------------------------
25.1 1. One set of payments only (May be on 1or more cars)
3.0 2. Is making more than one set of payments(May be on 2 or more cars)
1.2 9. N.A.70.7 0. Inap., no car debt
-----100.0
152 336 C17. Does the car you (HEAD) drive most of thetime have seat belts?
-----------------------------------------------
53.2 1. Yes26.2 5. No1.0 9. N.A.
19.6 0. Inap., no car-----100.0
153 337 C18. Do you have them fastened all the timewhile you are driving? part of thetime, or practically none of the time?
--------------------------------------------
10.9 1. Fastened all the time20.7 3. Fastened part of the time21.5 5. Fastened practically none of the time0.2 9. N.A. how often fastened
46.8 0. Inap., does not drive, does not own car,car has no seat belts
-----100.0
23

154 338 C19. Do you (or your family) do any of yourown repair work on your car(s)?
--------------------------------------------
32.2 1. Yes48.1 5. No0.2 9. N.A.
19.6 0. Inap., family does not have car-----100.0
155 339 C20. (If Yes) What kinds of things have youdone on your car(s) in the last year?
--------------------------------------------
Priority code - highest number
1.7 5. Yes, complex repairs that usually takea skilled mechanic (rebuilt engine ortransmission), complete overhaul
5.9 4. Yes, extensive repairs, taking much skill(rings, valves, bearings, install factoryrebuilt engine, king pins, ball joints,transmission work, motor work, or "I doanything that needs doing"
6.9 3. Yes, some skill required, (brakes, wheelbearings, exhaust system, starter)
11.3 2. Yes, some skill (tune-up, points,plugs, adjust carburetor, fuel pump)
3.9 1. Yes, little or no skill, mostly mainten-ance (oil change, greasing, tireswitching) (touch-up painting)
1.4 9. N.A. whether or kind of repairs1.2 7. Yes, does work, but did none in 1967
67.7 0. Inap., family does not have car, does norepair work
-----100.0
156 340 C21. In the last year do you think you savedmore than $50 that way?
C22. (If yes) About how much do you think yousaved?
----------------------------------------------
10.5 1. Saved, but did not save $50, "No" to Q.C21
14.4 2. Saved $50 - 1994.0 3. Saved $200 - 4990.6 4. Saved $500 or more0.9 7. N.A. how much0.9 9. N.A.
68.8 0. Inap., family does not have car; did notdo any of own repair work
-----100.1
157 341 C23. About how much time did that take youaltogether?
-------------------------------------------
14.6 1. Less than 50 hours (1 - 6 days)3.2 2. 50 - 199 hours (1 - 4 weeks,
7 - 25 days)0.2 3. 200 - 499 hours (5 - 12 weeks, 26 - 62
days)0.1 4. 500 hours or more (13+ weeks, 63+ days)3.3 9. N.A.
78.6 0. Inap., did not save $50; family hasno car
-----100.0
24

158 342 D3. Are you (HEAD) covered by some hospitalor medical insurance like Blue Cross?
D4. Does this insurance cover the entirefamily?
D5. Can you get free medical care in anyway such as from medicare, medicaid, oras a veteran?
--------------------------------------------
Priority code
71.2 1. Whole family is covered by insurance(Yes to A. D3 and D4)
6.4 2. Head is covered, but not entire family(Yes to D3 and No or N.A. to Q. D4)
10.6 3. Head not insured, but can get free medicalcare (No to Q. D3 and Yes to Q. D5)
9.1 4. Neither; Head is not insured, nor eligiblefor free medical care (No to Q. D3 and Noto Q. D5)
1.2 5. Head not insured but family can get freemedical care
1.1 7. Yes, N.A. what kind or who covered0.4 9. Not Ascertained to Q. D3
-----100.0
159 343 D6. Does your FAMILY have any savings, such aschecking or savings accounts, or governmentbonds?
------------------------------------------------
75.6 1. Yes24.0 5. No0.3 9. N.A.
-----99.9
160 344 D7. Would they amount to as much as twomonths income or more?
----------------------------------------
53.2 1. Yes21.8 5. No0.6 9. N.A.
24.4 0. Inap., does not have any savings-----100.0
161 345 D8. Was there a time in the last five yearswhen you had as much as two months' incomesaved up?
-----------------------------------------------
18.5 1. Yes25.9 5. No2.4 9. N.A.
53.2 0. Inap., has two months' income or more insavings now
-----100.0
162 346 E1. Now I have a few questions about food andclothing. About how many times a weekdo you (FAMILY) eat out at restaurants ordrive-ins?
----------------------------------------------
24.6 1. Less than once; sometimes23.0 2. 1 or 2 times5.0 3. 3 or 4 times3.4 4. 5 - 9 times
25
1.7 5. 10 times or more1.6 9. N.A.
40.7 0. Practically never eat out, never, veryseldom
-----100.0
163 347 E2. About how much do (FAMILY) spend in a weekeating out, including lunches at work(or at school)?
-----------------------------------------------
27.9 0. Nothing, do not eat out21.3 1. Less than $521.1 2. $5 - 919.0 3. $10 - 198.6 4. $20 or more2.2 9. N.A.
-----100.1
164 348 E3. Do you have any of your milk deliveredto the door?
-------------------------------------------
21.3 1. Yes78.6 5. No, or do not drink milk0.1 9. N.A.
-----100.0
165 349 E4. About how much do you (FAMILY) spend onthat milk in a week or month?
--------------------------------------------
8.7 1. (Less than $3 a week) (Less than $12 amonth)
5.8 2. $3 - 4 a week $12 - 17 a month2.6 3. $5 a week $18 - 24 a month2.0 4. $6 - 7 a week $25 - 32 a month0.8 5. $8 - 9 a week $33 - 41 a month0.9 6. $10 - 13 a week $42 - 59 a month0.2 7. $14 - 19 a week $60 - 85 a month0.1 8. $20 a week or more $86 or more0.4 9. N.A.
78.6 0. Inap., no milk delivered-----100.1
166 350 E5. About how much do you spend a week on allthe (other) food you use at home?
----------------------------------------------
0.9 0. Nothing1.3 1. Less than $5 a week5.6 2. $5 - 9 a week
23.0 3. $10 - 19 a week28.9 4. $20 - 29 a week20.1 5. $30 - 39 a week10.0 6. $40 - 49 a week8.1 7. $50 or more a week2.2 9. N.A.
-----100.1
167 351 E6. How about alcoholic beverages - how muchdo you (FAMILY) spend on that in an averageweek?
------------------------------------------------
59.1 0. Nothing27.3 1. Less than $5
26

8.7 2. $5 - 93.4 3. $10 - 190.9 4. $20 or more0.6 9. N.A.
-----99.9
168 352 E7. Is that included in the food bill?---------------------------------------
4.8 1. Yes35.3 5. No0.7 9. N.A.
59.1 0. Inap., spends nothing on alcoholicbeverages
-----99.9
169 353 E8. Do any of you smoke? (If yes) About howE9. many cigarettes do you (FAMILY) smoke in a
day or week?-----------------------------------------------
(1 pack - 20 cigarettes)(1 carton - 10 packs)
Per Day Per Week------- --------41.0 0. Do not smoke anything1.1 1. Less than 3 a day Less than a pack a week
10.9 2. 3 - 17 a day 1 - 6 packs a week14.4 3. 18 - 22 a day (a pack a day) 7 packs a week11.9 4. 23 - 35 a day (1-1/2 packs 8 - 14 packs a week (a
a day) carton a week)13.4 5. 2 - 3 packs a day 15 - 24 packs a week
(two cartons a week)2.0 6. 4 or more packs a day 25 or more packs a week
(three or more cartonsa week)
4.8 8. Smokes cigars, pipe, etc. Roll own cigarettes0.6 9. N.A. how many cigarettes
-----100.1
170 354 E10. Is that included in the food bill?----------------------------------------
17.4 1. Yes37.3 5. No4.4 9. N.A.
41.0 0. Inap., family does not smoke-----100.1
171 355 E11. Are there any special ways that you tryto keep the food bill down? CODE 2MENTIONS WITH LARGEST CODE NUMBERS
E12. What special ways do you have for keepingthe food bill down? FIRST MENTION
-------------------------------------------------
1st---43.1 0. No or no second mention1.4 1. Don't eat much, try to eat less
19.5 2. Try to economize, buy in large quantities,buy bulk; watch for ads in paper, watchfor specials, bargains, sales, shoparound the stores, buy from farmer
1.0 3. Have an "in" - army PX, eat cheap atrestaurant where work; get discount ongroceries, buy co-op
0.9 4. Coupons cut from papers; use coupons;
27
food stamps, welfare food14.0 5. Eat cheaper foods; e.g., potatoes,
hamburgers, chicken, buy no luxuries, eatleft-overs, don't waste what we buy
7.5 6. Do own baking, canning, or freezing11.5 7. Raise or grow food; garden, have own
milk, raise a calf, pigs, or chickens,have fruit trees. Also do hunting andfishing if indication of substantialsaving
0.4 8. Yes, gifts of food, food from home, etc.0.7 9. N.A.
-----100.0
172 356 E13. Anything else? SECOND MENTION-----------------------------------
2nd---66.3 0. No or no second mention1.2 1. Don't eat much; try to eat less
18.1 2. Try to economize, buy in large quantities,buy bulk; watch for ads in paper, watchfor specials, bargains, sales, shoparound the stores, buy from farmer
0.1 3. Have an "in" - army PX, eat cheap atrestaurant where work; get discount ongroceries, buy co-op
0.4 4. Coupons cut from papers; use coupons;food stamps, welfare food
4.2 5. Eat cheaper foods; e.g., potatoes,hamburgers, chicken, buy no luxuries,eat left-overs, don't waste what we buy
6.6 6. Do own baking, canning, or freezing2.3 7. Raise or grow food; garden, have own
milk, raise a calf, pigs, or chickens,have fruit trees. Also do hunting andfishing if indication of substantialsaving
0.6 8. Yes, gifts of food, food from home, etc.0.2 9. N.A.
-----100.0
173 357 The two mentions combined into one variable-------------------------------------------
1. Don't eat much; try to eat less2. Try to economize, buy in large quantities,
buy bulk; watch for ads in paper, watchfor specials, bargains, sales, shoparound the stores, buy from farmer
3. Have an "in" - army PX, eat cheap atrestaurant where work; get discount ongroceries, buy co-op
4. Coupons cut from papers; use coupons;food stamps, welfare food
5. Eat cheaper foods, e.g., potatoes,hamburgers, chicken, buy no luxuries,eat left-overs, don't waste what we buy
6. Do own baking, canning, or freezing7. Raise or grow food; garden, have own milk,
raise a calf, pigs, or chickens, havefruit trees. Also do hunting and fishingif indication of substantial saving
8. Yes, gifts of food, food from home, etc.PRIORITY BELOW 1
9. N.A.0. No to E11 or no second mention to E12
174 359 E14. How much of the time does the family sitdown and eat the main meal of the daytogether?
28

----------------------------------------------
17.4 0. Inap., one-person family5.1 1. Once a week or less (only on Sunday),
never, hardly ever6.1 2. Part of the time, 2 - 3 days a week5.0 3. Most of the time, 4 - 6 days a week
62.1 4. Every day, nearly every day, all thetime; 100% of the time; once a day
4.4 9. N.A.-----100.1
175 360 E15. Do you have any special ways of saving onclothing costs?
(If yes) What are they? FIRST MENTION-----------------------------------------------
1st---48.6 0. No or no second mention4.9 1. Just do not buy much, keep it clean
10.5 2. Yes, buy economically, shop in largercities, shop for sales or bargains,seasonal shopping at end of season
5.1 3. Yes, shop at discount stores, hand-me-downs; buy used clothing
1.4 4. Yes, discount on clothing because ofemployment
1.8 5. Yes, mending11.4 6. Yes, sewing, alterations, makes some
clothes13.6 7. Yes, make a lot of own clothes, "Wife
sews for all our daughters," etc.2.4 8. Yes, gifts of clothing, clothes sewn by
someone else (outside FU)NOTE: This is not the highest priority
code. Place lower than 10.2 9. N.A.
-----99.9
176 361 (If yes) What are they? SECOND MENTION--------------------------------------
2nd---83.3 0. No or no second mention3.8 1. Just do not buy much, keep it clean6.9 2. Yes, buy economically, shop in larger
cities, shop for sales or bargains,seasonal shopping at end of season
1.8 3. Yes, shop at discount stores, hand-me-downs; buy used clothing
0.2 4. Yes, discount on clothing because ofemployment
1.0 5. Yes, mending0.7 6. Yes, sewing, alterations, makes some
clothes0.3 7. Yes, make a lot of own clothes, "Wife
sews for all our daughters," etc.1.8 8. Yes, gifts of clothing, clothes sewn by
someone else (outside FU)NOTE: This is not the highest priority
code. Place lower than 10.1 9. N.A.
-----99.9
177 362-363 E16. Two mentions combined into one variable---------------------------------------------
1. Just do not buy much, keep it clean2. Yes, buy economically, shop in larger
29

cities, shop for sales or bargains,seasonal shopping at end of season
3. Yes, shop at discount stores, hand-me-downs; buy used clothing
4. Yes, discount on clothing because ofemployment
5. Yes, mending6. Yes, sewing, alterations, makes some
clothes7. Yes, make a lot of own clothes, "Wife
sews for all our daughters," etc.8. Yes, gifts of clothing, clothes sewn by
someone else (outside FU)NOTE: This is not the highest priority
code. Place lower than 19. N.A.0. No, or no second mention
178 364 E17. Did you (FAMILY) save more than $50on your clothing bill this way lastyear?
E18. (If yes) About how much did you savethis way in the last year?
------------------------------------------
15.1 1. Some ways, but did not save more than$50
21.7 2. Saved $51 - 1995.2 3. Saved $200 - 4990.7 4. Saved $500 or more4.8 7. N.A. how much2.7 9. N.A., D.K. whether
49.9 0. Inap., no special ways of saving(El5 = 0)
-----100.1
SECTION N (By Observation)
179 365 N1. Who was present during interview?--------------------------------------
35.1 1. Respondent only29.8 2. Respondent and spouse16.9 3. Respondent and someone else (not spouse)18.2 4. Respondent and spouse and someone else
(include children, count others even ifpart-time)
0.1 9. N.A., D.K.-----100.1
180 366 N2. Who was respondent (relation to Head)------------------------------------------
93.2 1. Head0.7 2. Wife, responding for self0.3 3. Other5.4 8. Wife responding for husband0.4 9. N.A.
-----100.0
181 367 N3. Race---------
86.6 1. White10.6 2. Negro1.8 3. Puerto Rican, Mexican0.7 7. Other (including Oriental, Philippino)0.3 9. N.A.
-----
30

100.0
182 368 N4. Number of calls--------------------
29.9 1. One28.5 2. Two17.7 3. Three10.3 4. Four4.7 5. Five3.1 6. Six1.9 7. Seven1.9 8. Eight or more2.0 9. N.A.
-----100.0
183 369 N5. How clean was the interior of the DU?------------------------------------------
40.7 1. Very clean33.6 2. Clean13.7 3. So-so4.8 4. Not very clean2.7 5. Dirty4.5 9. N.A.
-----100.0
184 370 N6. How much reading material was visible inthe DU?
---------------------------------------------
12.7 1. A lot52.6 3. Some28.0 5. None6.7 9. N.A., D.K.
-----100.0
185 371 N7. About how many times did you have torepeat a question?
-----------------------------------------
43.8 0. Never26.3 1. Once or twice, hardly ever, seldom17.8 2. 3 - 5 times6.3 3. 6 - 9 times, several times, a fair amount1.2 4. 10 - 19 times3.5 5. 20 times or more, many times, a lot1.1 9. N.A.
-----100.0
186 372 N8. About how many times did you have to askR to repeat a reply?
---------------------------------------------
67.1 0. Never18.5 1. Once or twice, hardly ever, seldom8.5 2. 3 - 5 times2.8 3. 6 - 8 times, frequently, several times0.4 4. 10 - 19 times1.4 5. 20 times or more, many times1.2 9. N.A.
-----99.9
187 373 N9. Does R have any obvious disfigurements orhabits that could make it difficult forhim to get a job?
31

----------------------------------------------
6.2 1. Yes3.7 3. Yes, qualified, minor ones
88.4 5. No, old age1.8 9. N.A.
-----100.1
188 374-376 N10. What is the name of the nearest city of50,000 population or more?
---------------------------------------------
(Not available, to insure confidentialityof records)
189 377 N11. How far is this DU from the center ofthat city?
-------------------------------------------
24.1 1. Less than 5 miles25.3 2. 5 - 14.9 miles16.1 3. 15 - 29.9 miles9.0 4. 30 - 49.9 miles
24.9 5. 50 miles or more0.6 9. N.A.
-----100.0
190 378 N12. Type of Structure in which Family Lives---------------------------------------------
3.2 0. Trailer67.5 1. Detached single family house3.5 2. 2-family house, 2 units side by side6.2 3. 2-family house, 2 units one above the
other3.3 4. Detached 3 - 4 family house4.0 5. Row house (3 or more units in an attached
row)6.0 6. Apartment house (5 or more units,
3 stories or less)3.5 7. Apartment house (5 or more units,
4 stories or more)1.0 8. Apartment in a partly commercial
structure1.8 9. Other, or N.A.
-----100.0
191 379 N13. Neighborhood------------------
Code the lowest number of any box checked
13.1 0. Vacant land3.6 1. Trailer
62.6 2. Detached single-family house5.7 3. 2-family house, 2 units side by side OR
2-family house, 2 units one above theother
5.0 4. Detached 3 - 4 family house OR Rowhouse - 3 or more units in an attachedrow
4.3 5. Apartment house (5 or more units,3 stories or less)
3.1 6. Apartment house (5 or more units, 4stories or more)
0.5 7. Apartment in a partly commercialstructure
0.7 8. Wholly commercial or industrial structure1.5 9. Other, or N.A.
-----
32

100.1
192 380 N13. Neighborhood------------------
Code the highest number of any box checked
8.1 0. Vacant land2.2 1. Trailer
56.8 2. Detached single-family house10.3 3. 2-family house, 2 units side by side OR
2-family house, 2 units one above theother
6.3 4. Detached 3 - 4 family house ORRow house - 3 or more units in anattached row
5.4 5. Apartment house (5 or more units, 3stories or less)
3.1 6. Apartment house (5 or more units, 4stories or more)
1.7 7. Apartment in a partly commercialstructure
3.0 8. Wholly commercial or industrial structure3.1 9. Other, or N.A.
-----100.0
193 381 N14. Is this DU located in a public housingproject?
--------------------------------------------
2.1 1. Yes93.5 5. No4.4 9. N.A.
-----100.0
194 382 Thumbnail sketch evidence on housing------------------------------------
PRIORITY CODE the lowest number applicable
1.0 1. No rimming water, or no water inside DU1.0 2. Outside toilet (privy)0.3 3. Other structural defects (no hot water,
no heat)3.9 4. Poor maintenance (unpainted, broken windows,
etc.)88.6 5. No evidence of any of the above5.1 9. Evidence, but N.A. what degree
-----99.9
195 383-384 Word-to-picture Score (Two Digits)----------------------------------
00. Zero01. One... Etc.98. Test not given (no number at top of page)99. (Test not taken), N.A.
For half the Census sample, in half the PSU'S, respondents weregiven a set of four pictures and fourteen words were read,asking the respondent to indicate which was the best picturefor that word. The words and pictures came from the AmmonsQuick. Test,* but the procedure was so altered that the resultshould not be considered an application of that test. Actually,as graded in tests on school children, we took every third wordup through age 12, so that many people would be expected to getthem all right, and only the bottom fringe would be distinguished.(This reduces the amount of failure experience and field difficulties,
33

we feel.) The simplest words were names of objects actually inone picture, and as the words get more difficult, their connectionto a picture also becomes more indirect.
*Martha J. Mednick, "The Relationship of the Ammons Quick Test ofIntelligence to Other Ability Measures," Psychological Reports, 72, 1965,48-59.
196 385 F1. Are you working now, unemployed, retired,or what?*
----------------------------------------------
74.2 1. Working now, or laid off only temporarily2.2 2. Unemployed
14.1 3. Retired, permanently disabled7.1 4. Housewife2.3 5. Student0.1 6. Other
-----100.0
*F questions were asked only of the Employed, G questions only of theunemployed, and H questions only of the Retired. If no question is listedfor that group, its members will be coded "0" for that code. Thus, ifno F question is given, all employed will be coded "0" (Inap.)
197 386 F2. What is your main occupation?G1. What do you do when you work? (What is
your occupation?)H2. What kind of work did you do when you
worked? (What was your occupation?)-------------------------------------------
12.7 1. Professional, technical and kindredworkers
7.4 2. Managers, officials and proprietors4.5 3. Self-employed businessmen
11.6 4. Clerical and sales workers16.0 5. Craftsmen, foremen, and kindred workers13.9 6. Operatives and kindred workers12.0 7. Laborers and service workers, farm laborers3.0 8. Farmers and farm managers2.5 9. Miscellaneous (armed services, protective
workers, unemployed last year but lookingfor work, N.A.)
16.4 0. Not in labor force at all in 1967, retired----- (includes students and housewives who did100.0 no work last year and are not working).
Permanently disabled or not in laborforce and did no work last year
198 387 F4. Do you work for someone else, yourselfor what?
-------------------------------------------
61.7 1. Someone else2.3 2. Both someone else and self
10.1 3. Self only0.2 9. N.A.
25.8 0. Inap.-----100.1
199 388 F5. How important is it for you to make yourown decisions on a job?
G29. How important is it for you to make yourown decisions on a job?
----------------------------------------------
26.6 1. Very important; of great importance; Idon't want anyone to tell me what to do;
34

I make all the decisions I can18.3 2. Important; quite important; pretty
important; I'm on my own3.7 3. Somewhat important; 50% important; fairly
important9.6 4. Not very important; not too important;
not that important; don't mind workingunder someone else
4.6 5. Not important at all; just do whatI'm told; I don't like to make decisions
3.3 9. N.A., D.K.33.8 0. Inap.
-----99.9
200 389 F6. How long have you been working for yourpresent employer?
--------------------------------------------
6.4 1. Less than half a year; 0 - 6 months8.0 2. 1 year; 7 - 18 months
11.1 3. 2 - 3 years; 19 months - 42 months14.2 4. 4 through 9 years14.6 5. 10 through 19 years8.6 6. 20 years or more0.8 9. N.A.
36.2 0. Inap., (retired, housewife, student,self-employed)
-----99.9
201 390 F7. What happened to the job you had before -did the company fold, were you laid off,or what?
G5. Did the company you worked for fold, wereyou laid off, or what?
----------------------------------------------
4.1 1. Company folded, changed hands, movedout of town; employer died, went out ofbusiness
0.6 2. Strike or lockout4.8 3. Laid off; fired
20.4 4. Quit or resigned, retired, pregnant4.1 5. First full time or permanent job I ever
had; wasn't working before this1.5 6. Was self-employed before4.2 7. Other; drafted (in service) and did not
come back to same job after service; justwanted a change in job; needed moremoney; was in service, any mention ofservice, seasonal work, job ended
1.3 8. Job stopped; work was seasonal1.8 9. N.A.
57.1 0. Inap.-----99.9
202 391 F8. Would you say your present job is a betterjob than the one you had before?
F9. (If not clear) Does it pay more than theprevious job?
-----------------------------------------------
27.7 1. "Yes" to F8, or reply to F8 unclear, butsays yes ("pays more") to F9
2.6 3. "Pro-con," better in some ways, worse inothers
5.5 5. "No, same," or "No, worse"1.6 9. N.A.
62.7 0. Inap., first job-----100.1
35

203 392 F10. How many different employers have you hadin the last ten years?
G6. How many different employers have you hadin the last ten years?
-----------------------------------------------
4.1 1. 112.8 2. 28.6 3. 35.3 4. 43.4 5. 52.9 6. 6 - 91.6 7. 10 - 190.8 8. 20 or more2.1 9. N.A.
58.5 0. Inap.-----100.1
204 393 F11. Have you ever moved out of a communitywhere you were living in order to take ajob somewhere else?
G7. Have you ever moved out of a communitywhere you were living in order to takea job somewhere else?
----------------------------------------------
21.9 1. Yes53.5 5. No0.9 9. N.A.
23.6 0. Inap.-----99.9
205 384 F12. Have you ever turned down a job becauseyou did not want to move?
G8. Have you ever turned down a job becauseyou did not want to move?
---------------------------------------------
6.9 1. Yes42.7 5. No4.8 9. N.A.
45.6 0. Inap., (retired, housewife, student, havemoved from community)
-----100.0
206 395 G9. Do you think you will be able to findsteady work - around here, or will youhave to move?
-------------------------------------------
1.1 1. Will find steady work0.5 3. Depends, might or might not0.5 5. Will not, will have to move0.3 9. N.A.
97.7 0. Inap. (employed)-----100.1
207 396 F13. How good would a job have to be beforeyou would be willing to move somewhereelse in order to get it?
G10. How good would a job have to be beforeyou would be willing to move somewhereelse in order to get it?
--------------------------------------------
IF R REPLIES IN TERMS OF SPECIFIC DOLLARAMOUNT DIFFERENCES, TRANSLATE INTO PERCENTAGEDIFFERENCE OF CURRENT WAGE RATE
36

2.7 1. Would move to get a job; if same orbetter salary, would move; would like tomove to take another job; wouldn't mindmoving
8.4 2. Fairly good; would have to have good pay;would have to be somewhat better paying;would have to have moderate pay increase;pay increase of 1 - 10% of what now getting
4.4 3. Like the situation I have; pro-conresponses; pay increase of 11 - 24% ofcurrent salary
35.3 4. Very good; whole lot better; much betterpaying; don't want to move; considerablybetter financially; pay increase of 25%or more; I plan to stay here
15.3 5. Would never consider moving; too old toconsider moving; could never find abetter situation anywhere else; couldn'tmove my business is here; couldn't begood enough to make me move
5.8 6. R answers only in terms of qualities ofjob, i.e., warm climate, depends on unionconsiderations, and cannot be coded in1 - 5 above
0.9 7. Other3.5 9. N.A.
23.7 0. Inap.-----100.0
208 397 F14. Do you plan to try for a new job or lineof work or will you keep the job you havenow?
-----------------------------------------------
11.6 1. Try for a new job, or line of work61.6 5. Keep job have now0.9 9. N.A.
26.0 0. Inap.-----100.1
209 398 F15. What kind of Job do you have in mind?-------------------------------------------
7.6 1. Mentions some explicit job, e.g.,machinist, computer programmer,secretarial work
0.6 2. Self-employment with mention of explicittype of work or broad type of workmentioned
1.7 3. Mentions broad type of work; "factorywork"
0.1 4. Self-employment with no mention of anyexplicit type of work
0.7 5. Does not mention any particular kind ofwork; mentions only company
0.7 9. N.A.88.4 0. Inap.
-----99.8
210 399-401 F16. How much might you earn?------------------------------
300. $3.00 per hour998. $9.98 or more per hour999. N.A.000. Inap.
211 402 F17. Would you have to get additional trainingto qualify?
37

-----------------------------------------------
2.2 1. Yes, but does not mention what2.1 2. Yes, and mentions the explicit training
needed; or that he is getting training0.9 3. Maybe, might help5.7 5. No0.7 9. N.A.
88.4 0. Inap., (keep job now have)-----100.0
212 403 F18, F19. Have you been doing anything inparticular about it? What have youdone?
---------------------------------------------
1.4 1. Yes, to F18, but no response or onlyvague response; have a few feelers out;been looking into it
2.5 2. Yes to F18; mentions looking for a job;going to employment office, going tounion office
3.0 3. Yes to F18; mentions going to school,special training program; membersstudying for exam
4.1 5. No to F180.5 7. Yes, other0.2 9. N.A.
88.4 0. Inap., (keep job now have)-----100.1
213 404 F20. How much do you like a job where you aretold exactly what to do?
G16. How much do you like a job where you aretold exactly what to do?
----------------------------------------------
7.1 1. I like it11.5 2. I don't mind it too much; don't mind
following instructions; like it - if donethe right way; O.K.
7.6 3. I don't mind it sometimes; not too fondof it; like it sometimes; fair; dependson the job (situation); not too fond ofit; I can take it; "Tell me what to doand then leave me alone."
29.7 4. Don't like it; don't think I'd like it;not (very) much; prefer a job where I'mon my own; wouldn't like it; like to beon my own really
16.1 5. I don't like it at all; hate it; don'tlike it a bit; that's why I'm in thiskind of business; or that's why I own abusiness
4.4 9. N.A.23.7 0. Inap.
-----100.1
214 405 F21, F22. Would you have any trouble gettinganother job if you wanted one?Why is that?
G11, G12. Is there anything in particularthat might make it difficult foryou to get another job?
---------------------------------------------
0.1 1. Yes, mentions arrest or prison record;wages garnished too frequently
2.2 2. Yes, lack training in something else;only limited education
9.0 3. Yes, mentions age; physical or mental
38

disability1.2 4. Yes, gives only vague reasons, other
reasons61.8 5. No0.2 6. Foreign-language difficulty0.0 7. Yes, but N.A. what1.7 9. N.A.
23.9 0. Inap.-----100.0
215 406 F23, F24. Have you ever had an illness oraccident that laid you up for amonth or more? When was that?
G17, G18. Have you ever had an illness oraccident that laid you up for a monthor more? (If yes) When was that?
------------------------------------------------
5.1 1. Yes, a year ago; within the last year ormore recently; 1967 or 1968
4.6 2. Yes, 2 - 3 years ago; 1965 or 19666.2 3. Yes, 4 - 9 years ago; 1959-19647.6 4. Yes, 10 or more years ago; before 1959;
1958 or earlier51.7 5. No0.1 8. Yes, N.A. when0.8 9. N.A., D.K.
23.7 0. Inap.-----99.9
216 407 F25. Do you have a physical or nervousH11. condition that limits the type of work
or the amount of work you can do?(If Yes - F26. How much does it limityour work?) H12.
G19, G20. Do you have a physical or nervouscondition that limits the type ofwork or the amount of work you cando? (If Yes - How much does itlimit your work?
---------------------------------------------
4.9 1. Yes, complete limitation; can't workat all
4.7 2. Yes, severe limitation on work8.1 3. Yes, some limitation on work (must rest,
mentions part-time work, occasional limiton work, can't lift heavy objects,reports periods of pain, sickness, etc.)
1.4 4. Yes, but no limitation on work77.7 5. No.2.4 7. Yes, N.A. limitation on work0.9 9. N.A.
-----100.1
217 408 F27. Are there times when you are late gettingto work? (If yes, F28) About how oftendoes that happen?
G21, G22. When you were working, were theretimes when you were late getting towork? (If yes) About how often didthat happen?
----------------------------------------------
3.4 1. Yes, frequently; once a week or moreoften
3.6 2. Yes, fairly often; 1 - 3 times a month5.0 3. Yes, once in a while; a few times a year,
not very often1.8 4. Yes, rarely; once a year or less
60.2 5. No; never
39

0.8 8. Yes, N.A. how often1.2 9. N.A.
24.0 0. Inap.-----100.0
218 409 F29. Are there times when you don't go towork at all, even though you are notsick? (If yes - F30) How often does thathappen?
G23, G24. Were there times when you didn'tget to work at all, even though youwere not sick? (if yes) How oftendid that happen?
----------------------------------------------
0.5 1. Yes, frequently; once a week or more often1.6 2. Yes, fairly often; 1 - 3 times a month4.2 3. Yes, once in a while; a few times a year,
not very often1.4 4. Yes, rarely; once a year or less
66.4 5. No1.0 8. Yes, but N.A. how often1.0 9. N.A.
23.9 0. Inap.-----100.0
219 410 F31. Have you ever been out of a job or onstrike for two months or more at a time?(If Yes - F32) When was the last timethat happened?
G25, G26. Have you ever been out of a job oron strike for two months or moreat a time? (If yes) When was thelast time that happened?
----------------------------------------------
If gives 2 dates, code most recent
3.6 1. 1967 or 19681.7 2. 1965 - 19661.9 3. 1962 - 19643.1 4. 1955 - 1961
62.4 5. No1.6 6. 1945 - 19540.7 7. Before 19450.2 8. Yes, N.A. when0.8 9. N.A., D.K.
24.0 0. Inap.-----100.0
220 411 F33. In the last year, how many days wereyou unemployed, laid off or without work?
-----------------------------------------------
87.2 0. None, or Inap.2.3 1. 1 - 5 days; 1 week1.7 2. 6 - 10 days; 2 weeks2.6 3. 11 - 25 days; 3 - 5 weeks4.7 4. 26 or more days (or unemployed now), 6 or
more weeks1.5 9. N.A.
-----100.0
221 412 F34. How many days of work did you miss onyour main job in the last year because youwere sick or otherwise unable to work?
------------------------------------------------
23.2 1. 1 - 5 days 1 week
40

5.7 2. 6 - 10 days 2 weeks3.4 3. 11 - 25 days 3 - 5 weeks3.7 4. 26 or more days (or unemployed now), 6 or
more weeks1.0 9. N.A. (includes retired, unemployed)
62.9 0. Inap.-----99.9
222 413 F35. And how many weeks of vacation did youtake last year?
--------------------------------------------
45.9 0. None12.4 1. One; 1 - 5 days19.8 2. Two; 6 - 10 days10.1 3. Three; 11 - 15 days11.1 4. Four or more; 16 or more days0.7 9. N.A.
-----100.0
223 414 F36. Then how many weeks did you actuallywork on your main job in 1967?
G3. How many weeks did you work last year?H3. How many weeks did you work last year?-------------------------------------------
17.4 0. None (did not work at all last year) orInap.
3.4 1. 1 - 133.4 2. 14 - 265.6 3. 27 - 39
13.3 4. 40 - 4719.3 5. 48 - 4925.6 6. 50 - 5110.1 7. 521.9 9. N.A.
-----100.0
224 415 F37. Did you have a standard work week on yourmain job?
-----------------------------------------------
51.7 1. Yes21.8 5. No0.4 9. N.A.
26.0 0. Inap.-----99.9
225 416 F38, F41. How many hours a week is that? Onthe average, how many hours a weekdid you work on your main joblast year?
G4. About how many hours a week did you work(when you worked)?
H4. About how many hours a week did you work(when you worked)?
---------------------------------------------
2.7 1. 1 - 19 hours a week4.5 2. 20 - 345.1 3. 35 - 39
40.1 4. 406.4 5. 41 - 473.5 6. 489.1 7. 49 - 598.1 8. 60 or more2.9 9. N.A.
17.5 0. Inap., did not work last year-----
41
99.9
226 417 F39, F40. Did you have any overtime or extrawork on your main job? How manyhours did that amount to last year?
----------------------------------------------
7.5 1. Yes, 1 - 49 hours8.8 2. Yes, 50 - 199 hours4.9 3. Yes, 200 - 399 hours5.4 4. Yes, 400 or more hours
22.1 5. No2.3 7. Yes, N.A. how much1.1 9. N.A.
47.8 0. Inap., no standard work week-----99.9
227 418 F42, F44. Did you have any other jobs or anyother ways of making money in additionto your main job? Anything else?
-------------------------------------------------
13.3 1. Yes, One other job or way of making money."No" or "N.A." to F44
2.2 3. Yes, two or more other jobs, or ways ofmaking money
0.3 4. Not as a job, coded '0' by F4557.7 5. No0.6 9. N.A.
26.0 0. Inap.-----100.1
228 419 F43. What did you do? (Code same as otheroccupation code (Col. 12). If two or morejobs, code the one with the lowest codenumber (highest status)
-----------------------------------------------
2.4 1. Professional and technical workers0.7 2. Managers and officials0.9 3. Self-employed businessmen1.7 4. Clerical and sales workers2.6 5. Craftsmen and foremen1.4 6. Operatives2.4 7. Unskilled laborers and service workers1.4 8. Farmers and farm managers1.9 9. Miscellaneous
84.5 0. Inap., (not in labor force or does not havesecond job)
-----99.9
229 420-422 F46. About how much did you make per hour forthis?
----------------------------------------------
(Code dollars and cents per hour)
300. $3.00 per hour998. $9.98 or more per hour999. N.A.000. Inap. (No second job)
230 423 F47. Could you have worked more if you hadwanted to in 1967?
-------------------------------------------
34.2 1. Yes38.6 5. No1.1 9. N.A., D.K.
42

26.1 0. Inap.-----100.0
231 424 F48. Would you have liked to work more?----------------------------------------
10.5 1. Yes25.5 5. No3.7 9. N.A., D.K.
60.3 0. Inap. (Could have worked more)-----100.0
232 425 F49. Could you have worked less if you hadwanted to?
-------------------------------------------
33.0 1. Yes27.9 5. No2.6 9. N.A., D.K.
36.5 0. Inap. (Could not have worked more andwould like to have worked more)
-----100.0
233 426 F50. Would you have preferred less work evenif you had earned less money?
---------------------------------------------
2.3 1. Yes23.7 5. No4.3 9. N.A., D.K.
69.7 0. Inap. (Could have worked less)-----100.0
234 427 Bracket on Taxable Income of Head and Wife------------------------------------------
13.9 0. Less than $5003.4 1. $500 - 9996.0 2. $1000 - 19994.7 3. $2000 - 29995.0 4. $3000 - 39996.2 5. $4000 - 4999
18.0 6. $5000 - 749915.5 7. $7500 - 999918.5 8. $10,000 - 14,9998.7 9. $15,000 or more
-----99.9
(REPLACES AN EMPTY CODE, since Question C9 wasactually coded in Variable 206 [TL 3951])
235 428 G13. How many places do you have your name infor a job?
H5, H6. Are you thinking about going to work?(If yes) How many places do you haveyour name in for a job?
----------------------------------------------
1.0 1. Yes, 1 place0.4 2. Yes, 2 places0.3 3. Yes, 3 places0.8 4. Yes, 4 or more places3.6 5. No (Yes to H5, No to H6)0.6 9. N.A., D.K.
93.4 0. Inap., not thinking about going to work(No to H5)
-----100.1
43

236 429 G14, G15. Have you applied for a job anywherein the last 2 weeks? (If yes) Howmany places did you apply?
H7, H8. Have you applied for a job anywherein the last two weeks? (If yes) Howmany places did you apply?
----------------------------------------------
0.7 1. Yes, 1 place0.2 2. Yes, 2 places0.1 3. Yes, 3 places0.4 4. Yes, 4 or more places2.7 5. No0.6 9. N.A., D.K.
95.2 0. Inap., (employed, or retired and notthinking of going to work)
-----99.9
237 430 G27. Are there jobs available around herethat just aren't worth taking?
H9. Are there jobs around here that justaren't worth taking?
------------------------------------------
2.1 1. Yes1.0 5. No1.7 9. N.A., D.K.
95.2 0. Inap., not thinking of going to work-----100.0
238 431-433 G28. (If yes) How much do they pay?H10. (If yes) How much do they pay?------------------------------------
050. 50 cts per hour300. $3.00 per hour.... etc.998. $9.98 or more per hour999. N.A., D.K. how much000. Inap., no jobs that are worth taking
or not thinking of going to work
239 434 I1. Are you married, single, widowed,divorced, or separated?
--------------------------------------
71.5 1. Married7.6 2. Single
12.0 3. Widowed4.7 4. Divorced3.2 5. Separated0.7 8. Married, spouse absent0.2 9. N.A.
-----99.9
240 435-436 I3, I5, I22, or I23. When were you firstmarried?
-----------------------------------------
23. 23 years old... etc.99. N.A.00. Inap., never married
241 437 I4. (If widowed, divorced, or separated)"For how long?"
-----------------------------------------
44

3.3 1. About 1 year or less, 1967 - 19684.9 2. 2 - 4 years; 1964 - 19664.2 3. 5 - 9 years; 1959 - 19634.2 4. 10 - 19 years; 1949 - 19582.4 5. 20 years or more; 1948 or earlier2.0 9. N.A.
79.0 0. Inap., not widowed, divorced, or separated-----100.0
242 438 I7, I14. How were the children taken care ofwhile you were working? How were thetaken care of while your wife childrenwas working?
------------------------------------------------
0.6 1. They take care of themselves3.2 2. Children in school, Wife home when they
are not5.7. 3. Relatives (inside or outside household),
spouse0.6 4. Friend or neighbor0.5 5. Nursery school, day care center4.2 6. Unrelated baby sitter or housekeeper0.8 7. Other0.8 9. N.A.
83.6 0. Inap., no children under 12 or Head notworking or a Wife not working
-----100.0
243 439 I9, I10. Did your wife do any work for moneylast year? (If yes) What kind of workdid she do?
-----------------------------------------------
4.4 1. Professional or technical0.6 2. Manager, official0.7 3. Self-employed businesswoman
11.9 4. Clerical or sales0.5 5. Craftswoman or foreman5.1 6. Operative6.9 7. Unskilled laborer or service0.0 8. Farming1.7 9. Miscellaneous
68.1 0. Wife did not do any work for money lastyear. ("No to I9 or No Wife)
-----99.9
244 440 I11. About how many weeks did she work lastyear?
--------------------------------------------
4.9 1. 1 - 13 weeks4.1 2. 14 - 26 weeks3.9 3. 27 - 392.9 4. 40 - 473.2 5. 48 - 498.0 6. 50 - 513.1 7. 521.8 9. N.A.
68.1 0. Inap., no working wife-----100.0
245 441 I12. And about how many hours a week did shework?
---------------------------------------------
3.5 1. 1 - 19 hours a week5.0 2. 20 - 34 hours a week
45
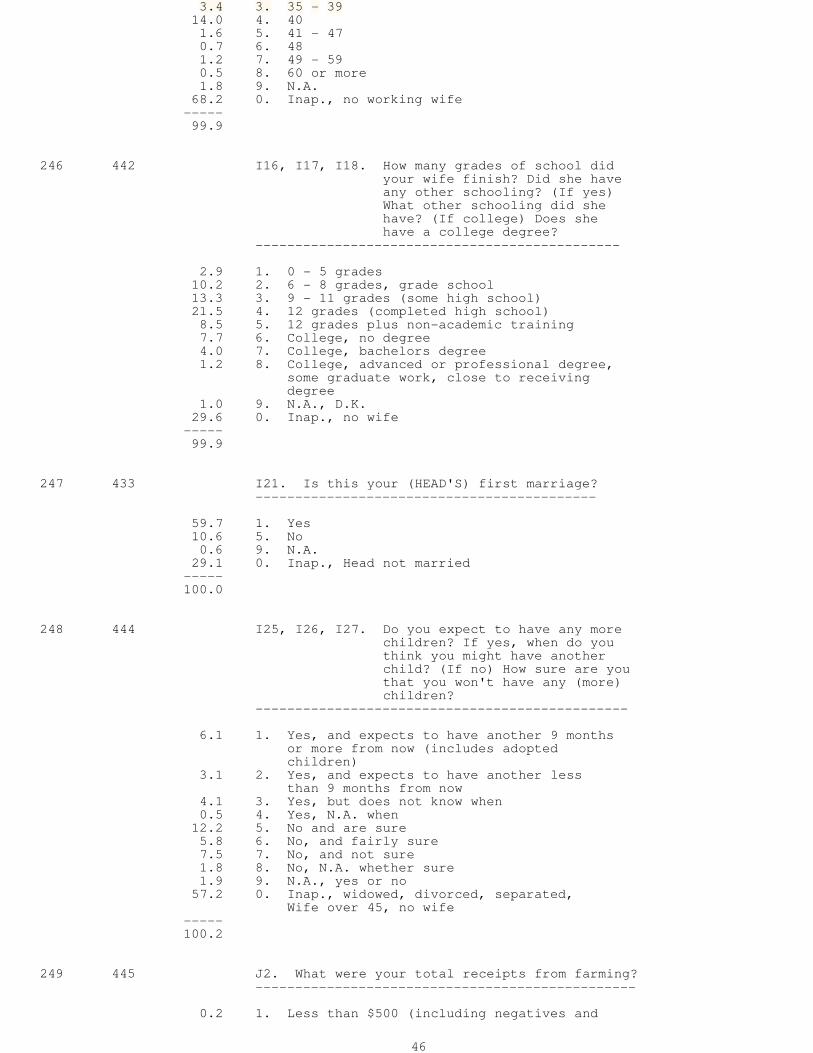
3.4 3. 35 - 3914.0 4. 401.6 5. 41 - 470.7 6. 481.2 7. 49 - 590.5 8. 60 or more1.8 9. N.A.
68.2 0. Inap., no working wife-----99.9
246 442 I16, I17, I18. How many grades of school didyour wife finish? Did she haveany other schooling? (If yes)What other schooling did shehave? (If college) Does shehave a college degree?
----------------------------------------------
2.9 1. 0 - 5 grades10.2 2. 6 - 8 grades, grade school13.3 3. 9 - 11 grades (some high school)21.5 4. 12 grades (completed high school)8.5 5. 12 grades plus non-academic training7.7 6. College, no degree4.0 7. College, bachelors degree1.2 8. College, advanced or professional degree,
some graduate work, close to receivingdegree
1.0 9. N.A., D.K.29.6 0. Inap., no wife
-----99.9
247 433 I21. Is this your (HEAD'S) first marriage?-------------------------------------------
59.7 1. Yes10.6 5. No0.6 9. N.A.
29.1 0. Inap., Head not married-----100.0
248 444 I25, I26, I27. Do you expect to have any morechildren? If yes, when do youthink you might have anotherchild? (If no) How sure are youthat you won't have any (more)children?
-----------------------------------------------
6.1 1. Yes, and expects to have another 9 monthsor more from now (includes adoptedchildren)
3.1 2. Yes, and expects to have another lessthan 9 months from now
4.1 3. Yes, but does not know when0.5 4. Yes, N.A. when
12.2 5. No and are sure5.8 6. No, and fairly sure7.5 7. No, and not sure1.8 8. No, N.A. whether sure1.9 9. N.A., yes or no
57.2 0. Inap., widowed, divorced, separated,Wife over 45, no wife
-----100.2
249 445 J2. What were your total receipts from farming?------------------------------------------------
0.2 1. Less than $500 (including negatives and
46
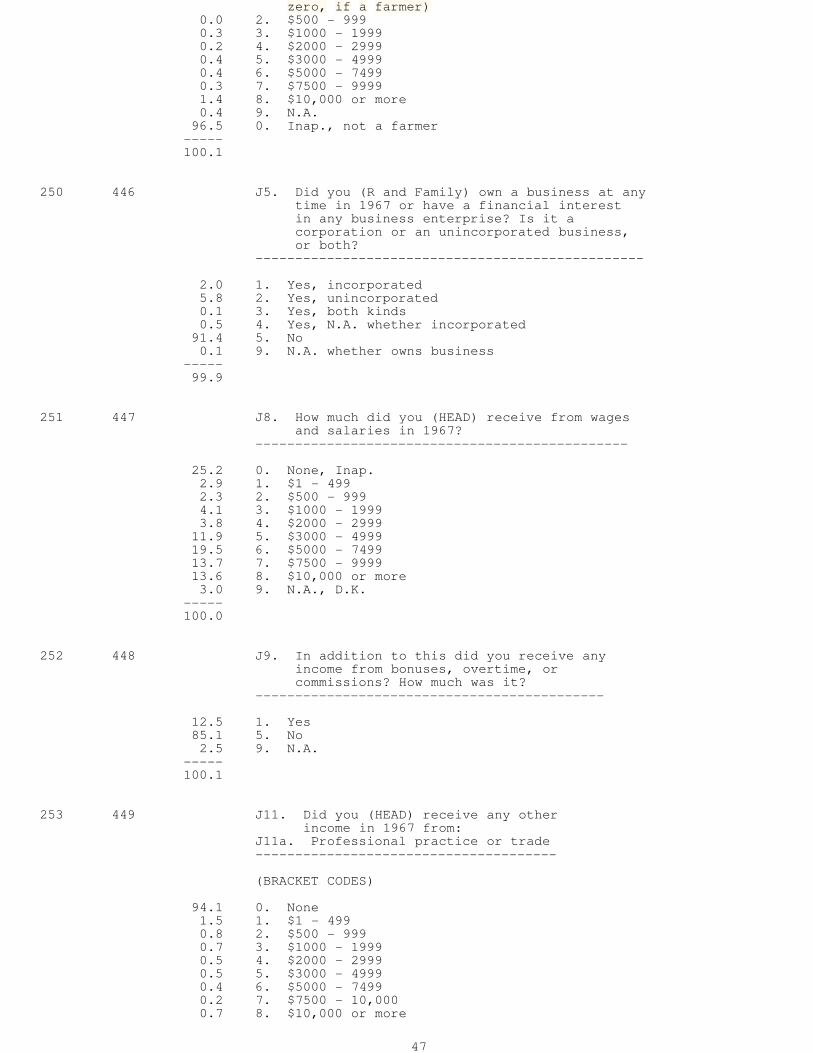
zero, if a farmer)0.0 2. $500 - 9990.3 3. $1000 - 19990.2 4. $2000 - 29990.4 5. $3000 - 49990.4 6. $5000 - 74990.3 7. $7500 - 99991.4 8. $10,000 or more0.4 9. N.A.
96.5 0. Inap., not a farmer-----100.1
250 446 J5. Did you (R and Family) own a business at anytime in 1967 or have a financial interestin any business enterprise? Is it acorporation or an unincorporated business,or both?
-------------------------------------------------
2.0 1. Yes, incorporated5.8 2. Yes, unincorporated0.1 3. Yes, both kinds0.5 4. Yes, N.A. whether incorporated
91.4 5. No0.1 9. N.A. whether owns business
-----99.9
251 447 J8. How much did you (HEAD) receive from wagesand salaries in 1967?
-----------------------------------------------
25.2 0. None, Inap.2.9 1. $1 - 4992.3 2. $500 - 9994.1 3. $1000 - 19993.8 4. $2000 - 2999
11.9 5. $3000 - 499919.5 6. $5000 - 749913.7 7. $7500 - 999913.6 8. $10,000 or more3.0 9. N.A., D.K.
-----100.0
252 448 J9. In addition to this did you receive anyincome from bonuses, overtime, orcommissions? How much was it?
--------------------------------------------
12.5 1. Yes85.1 5. No2.5 9. N.A.
-----100.1
253 449 J11. Did you (HEAD) receive any otherincome in 1967 from:
J11a. Professional practice or trade--------------------------------------
(BRACKET CODES)
94.1 0. None1.5 1. $1 - 4990.8 2. $500 - 9990.7 3. $1000 - 19990.5 4. $2000 - 29990.5 5. $3000 - 49990.4 6. $5000 - 74990.2 7. $7500 - 10,0000.7 8. $10,000 or more
47

0.7 9. N.A.-----100.1
254 450 J11b. Farming or market gardening, roomers orboarders
----------------------------------------------
95.7 0. None1.3 1. $1 - 4990.9 2. $500 - 9990.8 3. $1000 - 19990.3 4. $2000 - 29990.2 5. $3000 - 49990.1 6. $5000 - 74990.0 7. $7500 - 9,9990.0 8. $10,000 or more0.7 9. N.A.
-----100.0
255 451 J11c. Dividends, interest, rent, trust funds,or royalties
----------------------------------------------
64.1 0. None19.0 1. $1 - 4995.2 2. $500 - 9994.5 3. $1000 - 19991.5 4. $2000 - 29991.3 5. $3000 - 49990.5 6. $5000 - 74990.3 7. $7500 - 9,9990.5 8. $10,000 or more2.9 9. N.A.
-----99.8
256 452 J11d. ADC, ADCU----------------
97.8 0. None0.3 1. $1 - 4990.4 2. $500 - 9990.6 3. $1000 - 19990.4 4. $2000 - 29990.3 5. $3000 - 49990.1 6. $5000 - 74990.0 7. $7500 - 9,9990.0 8. $10,000 or more0.2 9. N.A.
-----100.1
257 453 J11e. Other welfare--------------------
96.4 0. None0.7 1. $1 - 4990.6 2. $500 - 9991.1 3. $1000 - 19990.2 4. $2000 - 29990.2 5. $3000 - 49990.0 6. $5000 - 74990.0 7. $7500 - 9,9990.0 8. $10,000 or more0.7 9. N.A.
-----99.9
258 454 J11f. Social Security----------------------
48

82.1 0. None1.6 1. $1 - 4995.5 2. $500 - 9997.6 3. $1000 - 19991.6 4. $2000 - 29990.5 5. $3000 - 49990.0 6. $5000 - 74990.0 7. $7500 - 9,9990.0 8. $10,000 or more1.1 9. N.A.
-----100.0
259 455 J11g. Other retirement pay, pensions,annuities
--------------------------------------
88.1 0. None2.0 1. $1 - 4992.8 2. $500 - 9993.2 3. $1000 - 19991.2 4. $2000 - 29991.3 5. $3000 - 49990.5 6. $5000 - 74990.1 7. $7500 - 9,9990.1 8. $10,000 or more1.0 9. N.A.
-----100.3
260 456 J11h. Unemployment or workmen's compensation---------------------------------------------
95.3 0. None2.5 1. $1 - 4991.0 2. $500 - 9990.5 3. $1000 - 19990.1 4. $2000 - 29990.0 5. $3000 - 49990.0 6. $5000 - 74990.0 7. $7500 - 9,9990.0 8. $10,000 or more0.6 9. N.A.
-----100.0
261 457 J11i. Alimony, child support-----------------------------
97.3 0. None0.4 1. $1 - 4990.6 2. $500 - 9990.5 3. $1000 - 19990.4 4. $2000 - 29990.1 5. $3000 - 49990.0 6. $5000 - 74990.0 7. $7500 - 9,9990.0 8. $10,000 or more0.6 9. N.A.
-----99.9
262 458 J11j. Help from Relatives--------------------------
94.6 0. None2.2 1. $1 - 4991.0 2. $500 - 9990.9 3. $1000 - 19990.3 4. $2000 - 29990.2 5. $3000 - 49990.1 6. $5000 - 7499
49

0.0 7. $7500 - 9,9990.0 8. $10,000 or more0.7 9. N.A.
-----100.0
263 459 J12. Did your wife have any income during1967? (If yes) Was it income from wages,salary, a business or what? Any otherincome?
----------------------------------------------
30.7 1. Yes, solely from work (wages,business, farming, transfers, assets)
3.9 2. Yes, from non-labor sources0.8 3. Yes, from both work and non-work
33.0 5. No0.1 9. N.A.
31.5 0. Inap., no wife-----100.0
264 460 J15. How much was it, before deductions?Wife's TOTAL income
-----------------------------------------
64.3 0. None6.0 1. $1 - 4994.2 2. $500 - 9995.7 3. $1000 - 19994.4 4. $2,000 - 2,9997.6 5. $3,000 - 4,9994.6 6. $5,000 - 7,4990.9 7. $7,500 - 9,9990.2 8. $10,000 or more2.1 9. N.A.
-----100.0
265 461 J17. Did (MENTION MEMBER) have any incomeduring 1967?
------------------------------------------
(Number of others with income)
78.1 0. No other income receivers15.6 1. One other income receiver4.9 2. Two1.1 3. Three0.3 4. Four0.0 5. Five or more0.1 9. N.A.
-----100.1
266 462 J28. Did you get any other money in thelast year -- like a big settlement froman insurance company, an inheritance,or anything?
J29. (If yes) How much did that amount to?---------------------------------------------
93.1 0. No, nothing1.8 1. Yes, less than $5001.1 2. $500 - 9991.1 3. $1,000 - 1,9990.5 4. $2,000 - 2,9990.5 5. $3,000 - 4,9990.3 6. $5,000 - 7,4990.3 7. $7,500 - 9,9990.7 8. $10,000 or more0.6 9. N.A. (whether, or amount)
-----
50

100.0
267 463 Source Code - J28-----------------
1.9 1. Insurance settlement1.1 2. Inheritance - gifts1.2 3. Sale of property - stocks - bonds0.2 4. Loan taken out0.1 5. Loan repayment received0.4 7. Other2.0 9. N.A.
93.1 0. Inap., no such income-----100.0
268 464 J30-31. Did anyone here get more than $50worth of food or clothing as part oftheir pay?
---------------------------------------------
2.0 1. Yes, food0.5 2. Yes, clothes1.3 3. Yes, mixed or N.A. which
95.9 5. No to J300.4 9. N.A.
-----100.1
269 465 J32-J33. Did you get more than $50 worth offree food, clothing, or food stampsin 1967?
---------------------------------------------
2.5 1. Yes, food, food stamps2.8 2. Yes, clothing2.7 3. Yes, mixed or N.A. which
91.4 5. No to J320.5 9. N.A.
-----99.9
270 466 J34. Was your family's income a lot higheror lower than usual this past year (1967)?
------------------------------------------------
56.5 0. No, about the same as usual28.1 1. Higher than usual14.3 2. Lower than usual1.1 9. N.A.
-----100.0
271 467 J35. Why was that?-------------------
13.6 1. Head had more or less work than usual(include unemployment, illness of Head,overtime, strike, second job)
18.7 2. Head's income from work was higher orlower than usual (wages or profits orfarm income different, not work hours)
4.7 3. More or less income from other earners inthe family
2.8 4. More of less income than usual from other(none-labor) sources
1.8 5. Other reasons, more or fewer people infamily
0.0 6. Retirement1.9 9. N.A.
56.5 0. Inap., family's income normal-----
51

100.0
272 468 J36. Does your family's income change frommonth to month, stay the same over theyear, or what?
--------------------------------------------
80.2 1. Stays the same19.1 2. Changes from month to month0.7 9. N.A.
-----100.0
273 469 J37. Why does it vary?-----------------------
11.5 1. Amount of work varies, more or lessovertime, seasonal, etc.
5.6 2. Profits or commissions, farm sale,etc. vary
0.7 3. Other family members work intermittently1.0 4. Other1.1 9. N.A.
80.2 0. Inap.-----100.1
274 470 J38. Would you say you are better offfinancially than you were a few years ago,or are you in the same situation?
------------------------------------------------
43.1 1. Better off5.5 2. Better off, qualified
34.7 3. Same, pro-con, better in some ways, worsein others
2.2 4. Worse off, qualified11.4 5. Worse off3.0 9. N.A.
-----99.9
275 471 J39. Is there anything that makes yourfamily's expenses unusually high?
J40. (If yes) What is that?---------------------------------------
68.4 0. No, nothing13.8 1. Yes, medical bills, special diets,
illness, psychiatrists2.3 2. Yes, rents or other housing costs,
property taxes3.7 3. Children in college, boarding school,
child support, alimony5.5 4. Food, expenses too high, high prices in
general1.1 5. Change in family size3.7 7. Other, including luxuries1.0 8. Head or Wife in college0.6 9. N.A. whether
-----100.1
276 472 J41. Is anything likely to happen over thenext few years that will make things muchdifferent for your family - like moreor less earners, a better job foryou, or fewer people living here?
J42. (If yes) What is that?-----------------------------------------------
62.8 0. No, nothing
52

0.8 1. Asset or debt transactions5.4 2. Family situation changes (marriage,
death)4.7 3. Expenses changes (medical expenses, living
expenses)3.3 4. Pay raises, more or less unemployment6.1 5. Number of earners changes; job changes of
others13.0 6. Job changes of Head, get a better job,
promotion1.8 7. Other reasons2.1 9. N.A.
-----100.0
277 473 J43. Will that make things better, or worse,financially?
---------------------------------------------
23.7 1. Better2.6 3. Pro-con, better in some ways, worse in
others6.0 5. Worse4.9 9. N.A.
62.8 0. Inap., nothing likely to happen (No to J41)-----100.0
278 474 J44. Are there any people that do NOT live withyou who are dependent on you for more thanhalf of their support?
J45. (If yes) How many are there?------------------------------------------------
94.3 0. No, none2.9 1. Yes, one1.3 2. Yes, two0.4 3. Yes, three0.3 4. Yes, four or more0.4 5. Yes, N.A. how many0.4 9. N.A. (whether)
-----100.0
279 475 J47. Do you (FAMILY) have parents or otherrelatives that you would feel that you hadto help (more), if you had more money?
------------------------------------------------
21.1 1. Yes78.3 5. No0.6 9. N.A.
-----100.0
280 476 K1. We're interested in how people spendtheir spare time. What things do you (HEAD)usually do in your spare time? FIRSTMENTION
------------------------------------------------
1st---
4.2 0. Nothing. Have no spare time, just sit5.5 1. Watch TV, other passive things
30.0 2. Drive the car, talk with neighbors,play cards, walk, read, fish, do flowergardening
25.0 3. Energetic activities requiringinitiative: sports, active hobbies,bowling, tennis, hunting, square dancing
31.1 4. Productive activities (that save moneyor produce direct service: having
53

vegetable garden, working around house)2.7 5. Investment in self: learning new things,
things that may benefit one economically0.6 7. Other0.9 9. N.A.
-----100.0
281 477 Second mention to K1--------------------
2nd---
24.6 0. Nothing. Have no spare time, just sit14.0 1. Watch TV, other passive things37.2 2. Drive the car, talk with neighbors,
play cards, walk, read, fish, do flowergardening
17.3 3. Energetic activities requiringinitiative: sports, active hobbies,bowling, tennis, hunting, square dancing
5.9 4. Productive activities (that save moneyor produce direct service: havingvegetable garden, working around house)
0.1 5. Investment in self: learning new things,things that may benefit one economically
0.2 7. Other0.7 9. N.A.
-----100.0
282 478-479 Two mentions (V280 and V281) combined intoone variable------------------------------------------
283 480 K1. (Number of things mentioned)---------------------------------
19.5 1. One30.6 2. Two25.7 3. Three12.2 4. Four4.9 5. Five1.7 6. Six0.9 7. Seven0.5 8. Eight or more0.7 9. N.A.3.2 0. None
-----99.9
284 481 K2. How often do you (HEAD) go to church?------------------------------------------
23.9 0. Never21.0 1. Once in a while, a few times a year,
not often, seldom6.6 2. About once a month, sometimes8.2 3. Every few weeks, several times a
month, once or twice a month, often30.5 4. Every week, once a week, every Sunday7.6 5. More than once a week, once a week plus2.2 9. N.A.
-----100.0
285 482 K3. Are you (HEAD) taking any courses orlessons?
K4. (If yes) what are they?-----------------------------------------
Highest number has priority
54

87.9 0. No0.6 1. Yes, for increasing consumption pleasure
(hobbies, bridge, etc.)0.6 2. Yes, for increasing knowledge about
world, etc., public affairs0.4 3. Yes, for learning how to do-it-yourself,
fix-it courses, carpentry, N.A. what4.3 4. Yes, with potential earning applications.
Job training5.4 5. Formal academic work - college, high school0.7 9. N.A. whether
-----99.9
286 483 K5. About how many hours do you (HEAD)usually watch television on an averageweek-day?
-------------------------------------------
12.0 0. None28.4 1. One up to 1.421.5 2. Two - 1.5 to 2.4, sometimes, seldom19.2 3. Three6.0 4. Four5.8 5. Five1.4 6. Six0.8 7. Seven1.5 8. Eight or more3.0 9. N.A.
-----99.6
287 484 K6. How often do you (HEAD) read a newspaperevery day, once a week, or what?
---------------------------------------------
8.8 0. Never1.3 1. Hardly ever. Only when something unusual,
only during some season1.1 2. Occasionally (less than once a week)9.9 3. Once or twice a week, Sunday only3.6 4. Week days, several times a week
74.2 5. Every day1.2 9. N.A.
-----100.1
288 485 K7. About how many people in thisneighborhood do you know by name?
--------------------------------------
(If counting families, multiply by two)
4.3 0. No one2.7 1. One4.3 2. Two4.1 3. Three, a few3.2 4. Four5.0 5. Five, 50%9.3 6. 6 - 9, not many
19.6 7. 10 - 19, 95%, most44.8 8. 20 or more, lots of people, everyone,
all of them2.7 9. N.A.
-----100.0
289 486 K8. Do you (FAMILY) have any relatives wholive within walking distance of here?
-------------------------------------------
39.9 1. Yes
55

0.4 3. Yes, qualified (they are never home, theyare here only part of year, we never seethem)
59.1 5. No0.5 9. N.A.
-----99.9
290 487 K9. Did you spend more than 40 hours helpingfriends or relatives last year?
K10. (If yes) About how many hours was that?---------------------------------------------
52.4 0. No29.7 1. Yes, 41 - 120 hours5.0 2. 121 - 240 hours4.5 3. 241 or more hours6.6 7. N.A. how much, but more than 401.9 9. N.A.
-----100.1
291 488 K14. Was that from someone who does not livehere?
---------------------------------------------
80.1 0. Inap., No to K1115.6 1. Yes0.1 3. Part of it was2.6 5. No1.6. 9. N.A.
-----100.0
292 489 K15. How often do you (HEAD) go to socialclubs or organizations?
------------------------------------------
57.5 0. Never9.5 1. Hardly ever. A few times a year
18.8 2. Occasionally, once or twice a month(less than once a week)
7.1 3. Once a week, every Friday, etc.4.4 4. A few times a week, more than once a week0.7 5. Every day, 4 days a week or more2.0 9. N.A.
-----100.0
293 490 K16. How often do you (HEAD) go to a bar ortavern?
--------------------------------------------
63.3 0. Never11.1 1. Hardly ever, a few times a year, almost
never, seldom9.6 2. Occasionally, once or twice a month
(less than once a week)6.8 3. Once a week4.7 4. A few times a week, more than once a
week2.6 5. Every day, four days a week or more1.9 9. N.A.
-----100.0
294 491 K17. Do you (HEAD) belong to a labor union?K18. (If yes) How much did your union dues
amount to last year?--------------------------------------------
76.6 0. No
56
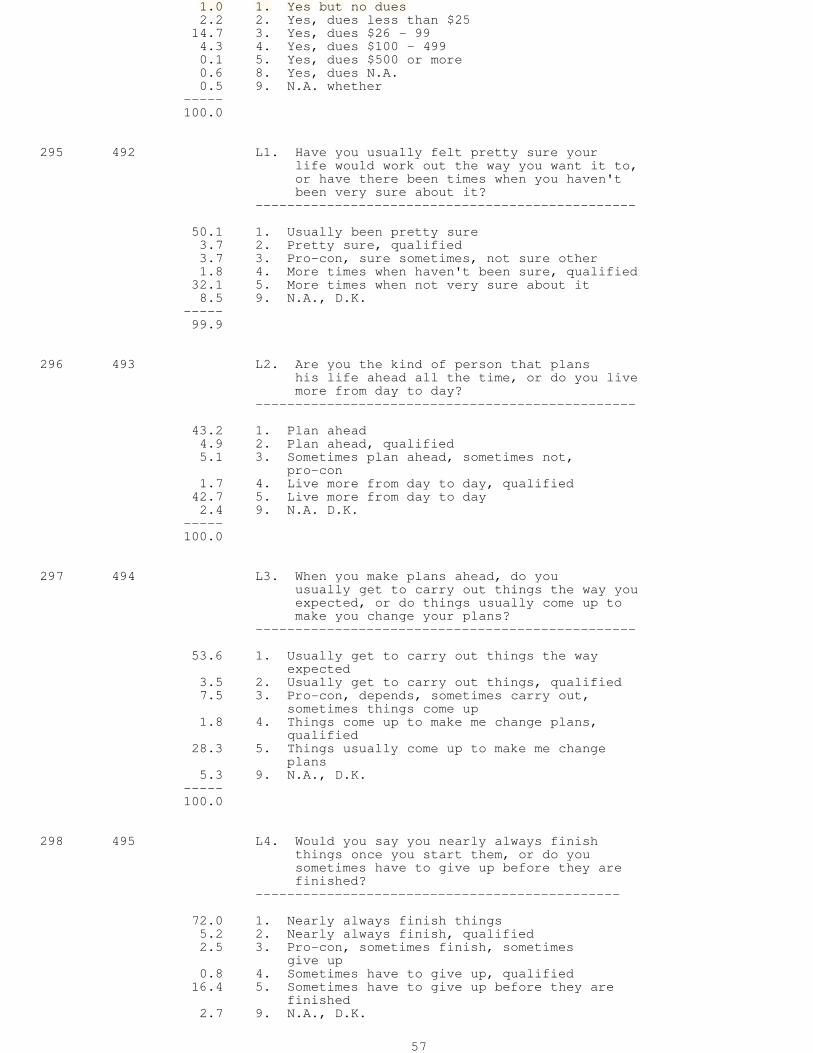
1.0 1. Yes but no dues2.2 2. Yes, dues less than $25
14.7 3. Yes, dues $26 - 994.3 4. Yes, dues $100 - 4990.1 5. Yes, dues $500 or more0.6 8. Yes, dues N.A.0.5 9. N.A. whether
-----100.0
295 492 L1. Have you usually felt pretty sure yourlife would work out the way you want it to,or have there been times when you haven'tbeen very sure about it?
------------------------------------------------
50.1 1. Usually been pretty sure3.7 2. Pretty sure, qualified3.7 3. Pro-con, sure sometimes, not sure other1.8 4. More times when haven't been sure, qualified
32.1 5. More times when not very sure about it8.5 9. N.A., D.K.
-----99.9
296 493 L2. Are you the kind of person that planshis life ahead all the time, or do you livemore from day to day?
------------------------------------------------
43.2 1. Plan ahead4.9 2. Plan ahead, qualified5.1 3. Sometimes plan ahead, sometimes not,
pro-con1.7 4. Live more from day to day, qualified
42.7 5. Live more from day to day2.4 9. N.A. D.K.
-----100.0
297 494 L3. When you make plans ahead, do youusually get to carry out things the way youexpected, or do things usually come up tomake you change your plans?
------------------------------------------------
53.6 1. Usually get to carry out things the wayexpected
3.5 2. Usually get to carry out things, qualified7.5 3. Pro-con, depends, sometimes carry out,
sometimes things come up1.8 4. Things come up to make me change plans,
qualified28.3 5. Things usually come up to make me change
plans5.3 9. N.A., D.K.
-----100.0
298 495 L4. Would you say you nearly always finishthings once you start them, or do yousometimes have to give up before they arefinished?
----------------------------------------------
72.0 1. Nearly always finish things5.2 2. Nearly always finish, qualified2.5 3. Pro-con, sometimes finish, sometimes
give up0.8 4. Sometimes have to give up, qualified
16.4 5. Sometimes have to give up before they arefinished
2.7 9. N.A., D.K.
57

-----99.6
299 496 L5. How much do you like to do things thatare difficult and challenging?
-------------------------------------------
52.7 1. A lot, like it very much11.7 2. A lot, qualified, some things a lot8.0 3. Pro-con, depends, sometimes yes, sometimes
no10.1 4. Not much, qualified11.3 5. Don't like things that are difficult and
challenging6.2 9. N.A., D.K.
-----100.0
300 497 L6. Would you rather spend your money and enjoylife today or save more for the future?
------------------------------------------------
36.8 1. Would rather spend money and enjoy lifetoday
2.4 2. Rather spend and enjoy, qualified, wouldif had it
20.3 3. Pro-con, want to do both4.5 4. Save more for the future, qualified
32.0 5. Save more for the future4.2 9. N.A., D.K.
-----100.2
301 498 L7. Would you rather have a job that youlike even if the chances for a raise weresmall, or a job you don't like which offersa good chance for making more money?
------------------------------------------------
73.7 1. Rather have a job I like1.1 2. Rather have a job I like, qualified2.0 3. Pro-con, depends, want both0.9 4. Rather have a job I don't like with good
chance for making more money, qualified16.0 5. Rather have a job I don't like which
offers a good chance for making moremoney
6.3 9. N.A., D.K.-----100.0
302 499 L8. Are you more often satisfied ordissatisfied with yourself?
------------------------------------
73.0 1. More often satisfied3.6 2. More often satisfied, qualified4.0 3. Pro-con, depends, satisfied some ways,
dissatisfied others1.3 4. More often dissatisfied, qualified
15.2 5. More often dissatisfied2.9 9. N.A., D.K.
-----100.0
303 500 L9. Do you have some limitations that keepyou from getting ahead as far as you wouldlike?
-----------------------------------------------
42.0 1. Yes, health included5.1 3. Yes, but not important, depends
58

47.9 5. No5.0 9. N.A., D.K.
-----100.0
304 501 L10. Do you get angry fairly easily, or doesit take a lot to get you angry?
---------------------------------------------
20.9 1. Get angry fairly easily1.9 2. Get angry fairly easily, qualified4.8 3. Pro-con, depends4.9 4. Takes a lot to get me angry, qualified
(But I really blow when I do)64.6 5. Takes a lot to get me angry (I never get
angry)2.8 9. N.A., D.K.
-----99.9
305 502 L11. How much does it matter what other peoplethink about you?
-----------------------------------------------
46.5 1. Not at all. Doesn't matter15.3 2. Very little, matters what one or two
people think8.4 3. Pro-con, depends. Matters in some areas
12.1 4. A good deal. It matters14.2 5. It matters a lot. I'm very sensitive3.5 9. N.A., D.K.
-----100.0
306 503 L12. Do you trust most other people, some, orvery few?
----------------------------------------------
56.9 1. Most3.7 2. Most, qualified
18.5 3. Pro-con, depends, should trust some3.5 4. Few, not many, qualified
14.5 5. Very few. I trust no one2.8 9. N.A., D.K.
-----99.9
307 504 L13. Do you spend much time figuring outways to get more money?
-----------------------------------------
65.5 1. None at all3.8 2. Very little, not much3.8 3. Pro-con, sometimes I do, should spend
more (less), used to in the past1.9 4. Quite a bit
22.2 5. A lot. I'm always figuring out how toget more money
2.8 9. N.A., D.K.-----100.0
308 505 L14. Do you think a lot about things thatmight happen in the future, or do youusually just take things as they come?
--------------------------------------------
36.7 1. Think a lot about things that might happen2.1 2. Think a good deal, qualified3.6 3. Pro-con, sometimes do, sometimes, not.
Should think more (less)1.7 4. Usually just take things as they come,
59

qualified, but .....53.2 5. Usually just take things as they come2.6 9. N.A., D.K.
-----99.9
309 506 L15. Do you think the life of the averageman is getting better or is it gettingworse?
--------------------------------------------
49.7 1. Getting better3.3 2. Getting better, qualified; better for most9.0 3. Pro-con, better some ways, worse others,
should be different1.8 4. Getting worse, qualified
28.2 5. Getting worse8.0 9. N.A., D.K.
-----100.0
310 507 L16. Are there a lot of people who have goodthings they don't deserve?
---------------------------------------------
30.4 1. Yes, a lot2.5 2. A lot, qualified, quite a few5.4 3. Pro-con, depends, some do4.3 4. Not many, but a few
41.0 5. No16.4 9. N.A., D.K., not concerned, can't judge
-----100.0
311 508-509 M1. Where did you (HEAD) grow up?----------------------------------
Alphabetical state code running from 01 =Alabama to 49 = Wyomingexcept, Alaska - 50 and Hawaii 49. FromGeographical Location Codes, U.S. GeneralServices Administration Office of Finance,October, 1966. (Note that Census city-countydata book inserts Alaska and Hawaii,as 02 and 12, and has all 50 states in order.
For this code we added:61. English speaking foreign countries:
England, Canada, Australia, New Zealand62. Other northern European countries: France,
Low Countries, Scandinavia, Poland,Czechoslovakia, Austria, Switzerland,Russia, Germany
63. Southern European countries and EasternEurope: Spain, Italy, Greece, Yugoslavia,Albania, Rumania, Bulgaria
64. Spanish America: Mexico, Central American,West Indies, South America
65. Asia, Mideast (including Egypt)66. Africa, excluding Egypt99. N.A.
312 510 M2. Was that on a farm, in a large city,small town, or what?
-----------------------------------------
34.0 1. Farm31.5 2. Large city, any size city32.1 3. Small town, any size town1.5 4. Other, many different places0.8 9. N.A.
-----99.9
60

313 511 M3-10. How many grades of school did you (HEAD)finish?
------------------------------------------------
3.1 0. 0 - 5 grades and has difficulty reading4.7 1. 0 - 5 grades, no difficulty reading
20.3 2. 6 - 8 grades17.7 3. 9 - 11 grades17.0 4. 12 grades (completed high school)9.8 5. 12 grades plus non-academic training
14.0 6. College, no degree8.2 7. College, bachelors degree (A.B., B.S.,
etc.)4.7 8. College, advanced or professional degrees
(M.A., Ph.D., LLB, BD, M.S., etc.)0.5 9. N.A., D.K.
-----100.0
314 512 M4-5. Did you get any other training; if Yes,what was it?
M7-8. Did you have any other schooling; if Yes,what other schooling did you have?
------------------------------------------------
21.1 1. Some training outside the regular schoolsystem (apprenticeships, manpower trainingprograms, etc.
0.9 9. N.A.78.0 0. No training except regular school and
college-----100.0
315 513 M11. Are you (HEAD) a veteran?-------------------------------
35.8 1. Yes63.5 5. No0.7 9. N.A.
-----100.0
316 514 M12. How many brothers and sisters did youhave? (Includes half-sisters, adoptedchildren, but not foster children)
-------------------------------------------
6.5 0. None13.8 1. One14.0 2. Two14.4 3. Three12.1 4. Four9.2 5. Five8.3 6. Six6.0 7. Seven
14.2 8. Eight or more1.6 9. N.A.
-----100.0
317 515 M13. Were your parents poor when you weregrowing up, pretty well off, or what?
-------------------------------------------
47.9 1. Poor36.5 3. Average, it varied14.6 5. Pretty well off1.3 9. Don't know, didn't live with parents
-----100.3
61

318 516 M14. How much education did your father have?M15. (If don't know) Could he read and write?----------------------------------------------
10.7 1. 0 - 5 grades, or D.K. and could not reador write
59.4 2. 6 - 8 grades, grade school, or D.K. andcould read and write
5.7 3. 9 - 11 grades, some high school10.8 4. 12 grades, high school0.9 5. 12 grades plus non-academic training3.7 6. College, no degree3.2 7. College degree, no advanced degree
mentioned1.5 8. College, advanced or professional degree3.9 9. N.A., D.K., both M14 and M15
-----99.8
319 517 Accuracy of Mortgage owed-------------------------
(See V7 code)
320 518-521 Imputed rental income (6% of net equity inowned home)------------------------------------------
321 522 Accuracy of imputed rent------------------------
(See V7 code)
(The remaining variables were created by thecomputer)
322 523-528 Total 1967 Family real Income in Dollars----------------------------------------
This variable is composed of the sum of thefollowing variables:
V81 Total 1967 Family Money Income+V16 Imputed income from doing ADDITIONS AND
REPAIRS in 1967+V24 Imputed income from doing own CAR REPAIRS
in 1967+V39 Imputed income from GROWING OWN FOOD in
1967+V41 Imputed income from SEWING & MENDING
in 1967+V43 Earned income in form of food or clothing
(only if worth more than $50) in 1967+V320 Imputed 1967 rental value of owner-
occupied house (.06 x net equity inhouse)
+V12 Estimated annual 1967 rental value of DU(for those who neither own nor rent)
+V45 Value of free food, clothing, or foodstamps received in 1967 (only if $50or more during year)
+V57 Value of services received free from othersNOTE: Total value added in if all thetime received was from someone livingoutside DU; 1/2 total value added if onlypart of help was from someone outsideDU (Valued at $1 = 1 hour)
323 529-534 Total 1967 FAMILY Real Income Net of Cost ofEarning Income - In Dollars
62

--------------------------------------------
V322 Total 1967 Family Real Income-V84 Child care costs, Federal Income Tax,
and 1967 Union dues for Head offamily
-V57 if added originally (free child care)
324 535-540 Total 1967 FAMILY Real Income Net of Costs ofEarning Income and Net of Housing Costs - InDollars---------------------------------------------
V322 Total 1967 Family Real Income-V84 Cost of Earning Income-V10 1967 Rent Payments-V14 1967 Utilities Payments-V18 1967 Payments for additions and
repairs (for all those still owinganything at time of interview)
-V12 Estimated annual 1967 rental value ofDU (for those who neither own nor rent)
-V16 Imputed income from doing additionsand repairs in 1967
-.06 x V5 Imputed 1967 annual rental value of DU(for homeowners excluding farmers andothers with complex property, i.e., ifcoded 3 in V7)
-V6 Estimated 1967 Property taxes forhomeowners
V320 Imputed rent of homeowners (if coded3 in V7, i.e., have complex property)
-V57 if added originally (Free Child Care)
325 541-544 "Orshansky Ratio" (Full Detail Variant)(V81 / V32)
xx.xx ---------------------------------------
V81 1967 Total Family Money Income/ V32 Annual Family Need Standard - Orshansky
Result multiplied by 1.25 if V197 or V228 = 8,.i.e., first or second job a farmer
326 545-548 Ratio of Total 1967 FAMILY Real Income Net ofxx.xx Cost of Earning Income to Annual Family Need
Standard - Orshansky (V323 / V32)---------------------------------------------
V323 Total 1967 Family Real IncomeNet of Cost of Earning Income
/ V32 Annual Family Need Standard - Orshansky
327 549-552 Ratio of Total 1967 Family Real Income Net ofxx.xx Cost of Earning Income and Net of Housing Costs
to 1967 Family Food Standard - OrshanskyLow Cost (V324 / V31)-----------------------------------------------
V324 Total 1967 Family Real Income Net ofCost of Earning Income and Net ofHousing Costs
/ V31 Annual Family Food Standard - OrshanskyLow Cost
328 553-558 FAMILY Well-offness Index -- uses "OrshanskyRatio"--------------------------------------------
V325 "Orshansky Ratio"x V73 Average hours of leisure per major
63

adult in family, in 1967
329 559-564 FAMILY Well-offness Index - uses Ratio ofTotal 1967 Family Real Income Net of Cost ofEarning Income to Annual Family Need Standard -Orshansky-----------------------------------------------
V326 Ratio of Total 1967 Family Real IncomeNet of Cost of Earning Income to AnnualFamily Need Standard - Orshansky
x V73 Average hours of leisure time permajor adult in family, in 1967
330 565-570 FAMILY Well-offness Index - uses Ratio of Total1967 Family Real Income Net of Cost of EarningIncome and Net of Cost of Housing to AnnualFamily-Need Standard - Orshansky-----------------------------------------------
327 Ratio of Total 1967 Family Real IncomeNet of Cost of Earning Income and Netof Housing Costs to Annual Family NeedStandard - Orshansky
x V73 Average Hours of leisure time permajor adult in family, in 1967
331 571-575 Total 1967 Family Contractual Payments - InDollars-------------------------------------------
V8 Annual Mortgage payments made in 1967(for Home owners)
+ V10 1967 Rent payments+ V14 1967 Utilities Payments+ V18 1967 payments for additions and repairs+ V20 1967 Car insurance payments+ V22 1967 Car debt payments+ V28 Other 1967 debt payments+ V6 Estimated annual property taxes paid
in 1967 (for home owners)
332 576-580 Total 1967 Family Fixed Expenditures - InDollars-----------------------------------------
V331 Total 1967 Family Contractual Payments+ V37 Total 1967 Family food expenditures+ V84 Child care costs (for families where
there are children under 12 and Wifeof Head works, or single Head offamily works for money)AND1967 Union dues for HEAD of family
+ V82 Total 1967 payments to dependentsoutside DU (only for cases whereamount was ascertained)
333 581-586 Total 1967 Family Uncommitted Money Income -in Dollars--------------------------------------------
V81 Total 1967 Family money income- V332 Total 1967 Family fixed expenditures
334 587-591 Total 1967 Family Food Consumption----------------------------------
V37 Total 1967 Family food expenditures+ V39 Imputed income from growing own food
in 1967
64

+ V43 Earned income in form of food in 1967(1 x V43 added if source code indicatesthat all was food - if V268 = 1;.7 x V43 added if source code saysfood and clothing or N.A. which, i.e.,if V268 = 3)
+ V45 Value of free food or food stampsreceived in 1967(1 x V45 added if source code indicatesthat all was food or food stamps - ifV269 = 1; .7 x V45 if source code saysfood and clothing or N.A. which - ifV269 = 3)
335 592-596 Total 1967 Family Hours of Work (Work forMoney Plus Unpaid Work)-----------------------------------------
V47 1967 Hours of Work for Money - HEAD+ V53 1967 Hours of Work for Money - WIFE+ V59 1967 Hours of Housework - FAMILY+ V61 1967 Hours of Home Production - HEAD
AND WIFE+ V72 1967 Hours of Work for Money - OTHERS
(other than Head or Wife)+ V57 1967 Hours of Help from others -
(estimated part from inside familyunit)(1 x V57 if all from someone insidefamily unit, i.e., if V291 = 5;.5 x V57 if only part from someoneinside family unit, i.e., V291 = 3)
+ V63 1967 Hours of house work and work formoney by others in FU - adjustmentfactor if someone other than Head orWife included as a major adult)(Added in when hours of work byothers, V72 = 0000, to avoid doublecounting)
336 597-599 Ratio of Total 1967 Family Food Consumption tox.xx 1967 Family Food Standard
----------------------------------------------
V334 Total 1967 Family Food ConsumptionV31 1967 Family food standard - Orshansky
(Low-cost plan for family of givensize and age-sex composition)
337 *600-603 1967 Hourly Earnings - HEADxx.xx ---------------------------
V74 1967 Income from Labor - HEAD/ V47 1967 Hours of Work for Money - HEAD
*Coded 99.99 when V47 = 0000 (Did not work for money in 1967)
338 *604-607 1967 Hourly Earnings - WIFExx.xx ---------------------------
V75 1967 Income from Labor - WIFE/ V53 1967 Hours of work for money - WIFE
*Coded 99.99 when V53 = 0000 (Did not work for money in 1967)
339 608 Bkt. V81 Total 1967 Family Money Income----------------------------------------
0.5 0. Less than $5002.0 1. $500 - 9997.5 2. $1000 - 19998.0 3. $2000 - 2999
65
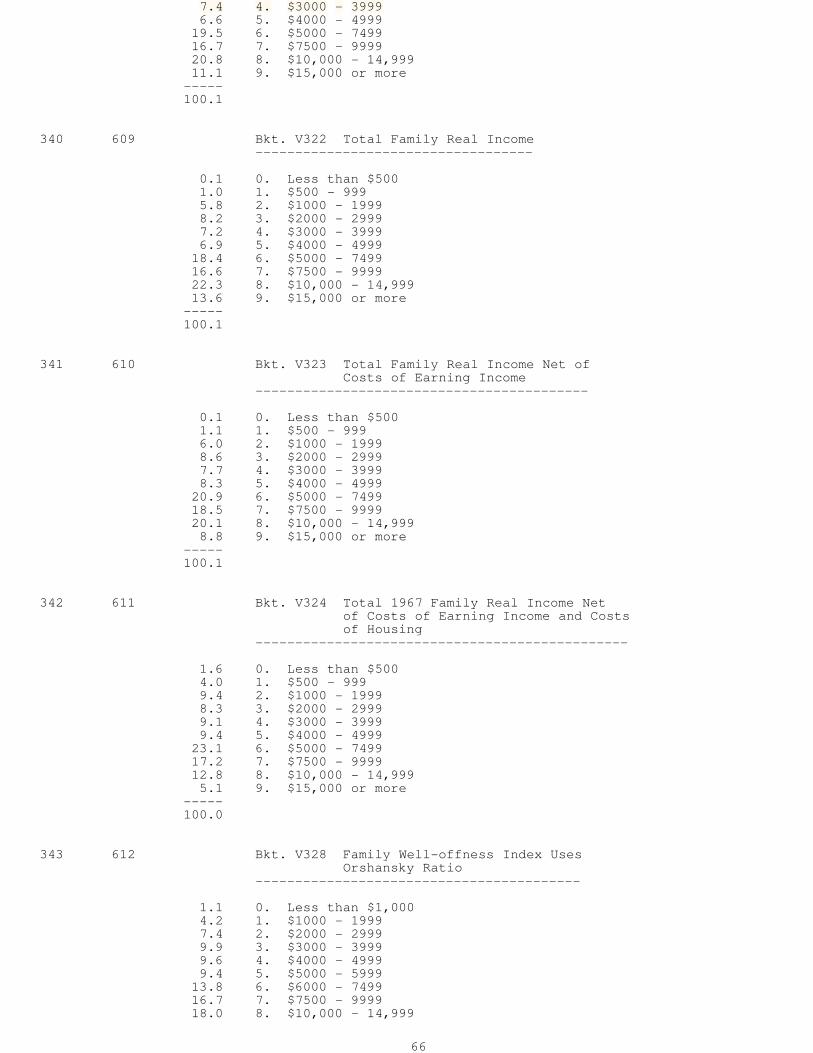
7.4 4. $3000 - 39996.6 5. $4000 - 4999
19.5 6. $5000 - 749916.7 7. $7500 - 999920.8 8. $10,000 - 14,99911.1 9. $15,000 or more
-----100.1
340 609 Bkt. V322 Total Family Real Income-----------------------------------
0.1 0. Less than $5001.0 1. $500 - 9995.8 2. $1000 - 19998.2 3. $2000 - 29997.2 4. $3000 - 39996.9 5. $4000 - 4999
18.4 6. $5000 - 749916.6 7. $7500 - 999922.3 8. $10,000 - 14,99913.6 9. $15,000 or more
-----100.1
341 610 Bkt. V323 Total Family Real Income Net ofCosts of Earning Income
------------------------------------------
0.1 0. Less than $5001.1 1. $500 - 9996.0 2. $1000 - 19998.6 3. $2000 - 29997.7 4. $3000 - 39998.3 5. $4000 - 4999
20.9 6. $5000 - 749918.5 7. $7500 - 999920.1 8. $10,000 - 14,9998.8 9. $15,000 or more
-----100.1
342 611 Bkt. V324 Total 1967 Family Real Income Netof Costs of Earning Income and Costsof Housing
-----------------------------------------------
1.6 0. Less than $5004.0 1. $500 - 9999.4 2. $1000 - 19998.3 3. $2000 - 29999.1 4. $3000 - 39999.4 5. $4000 - 4999
23.1 6. $5000 - 749917.2 7. $7500 - 999912.8 8. $10,000 - 14,9995.1 9. $15,000 or more
-----100.0
343 612 Bkt. V328 Family Well-offness Index UsesOrshansky Ratio
-----------------------------------------
1.1 0. Less than $1,0004.2 1. $1000 - 19997.4 2. $2000 - 29999.9 3. $3000 - 39999.6 4. $4000 - 49999.4 5. $5000 - 5999
13.8 6. $6000 - 749916.7 7. $7500 - 999918.0 8. $10,000 - 14,999
66

10.0 9. $15,000 or more-----100.1
344 613 Bkt. V329 Family Well-offness Index - UsesRatio of Family Real Income Net ofCost of Earning Income to AnnualFamily Need Standard
---------------------------------------------
0.7 0. Less than $1,0003.1 1. $1000 - 19996.4 2. $2000 - 29999.5 3. $3000 - 3999
10.6 4. $4000 - 499910.3 5. $5000 - 599914.7 6. $6000 - 749918.9 7. $7500 - 999917.3 8. $10,000 - 14,9998.5 9. $15,000 or more
-----100.0
345 614 Bkt. V330 Family Well-offness Index - UsesRatio of Total 1967 Family RealIncome Net of Costs of EarningIncome and Net of Costs of Housingto Annual Family Food Standard
---------------------------------------------
2.1 0. Less than $30005.7 1. $3000 - 59998.3 2. $6000 - 8999
10.9 3. $9000 - 11,99911.1 4. $12,000 - 14,99910.8 5. $15,000 - 17,99913.0 6. $18,000 - 22,49914.9 7. $22,500 - 29,99913.9 8. $30,000 - 44,9999.1 9. $45,000 or more
-----99.8
346 615 Bkt. V331 Total 1967 Family ContractualPayments
----------------------------------------
13.1 0. Less than $50019.8 1. $500 - 99930.9 2. $1000 - 199920.6 3. $2000 - 299910.0 4. $3000 - 39994.1 5. $4000 - 49991.4 6. $5000 - 74990.2 7. $7500 - 99990.0 8. $10,000 - 14,9990.0 9. $15,000 or more
-----100.1
347 616 Bkt. V332 Total 1967 Family Fixed Expenditures-----------------------------------------------
1.1 0. Less than $5004.7 1. $500 - 999
14.0 2. $1000 - 199914.4 3. $2000 - 299916.8 4. $3000 - 399913.4 5. $4000 - 499924.0 6. $5000 - 74997.9 7. $7500 - 99992.9 8. $10,000 - 14,9990.7 9. $15,000 or more
67

-----99.9
348 617 Bkt. V333 Total 1967 Family Uncommitted MoneyIncome
----------------------------------------------
14.7 0. Less than $5007.2 1. $1000 - 1999
13.5 2. $1000 - 199912.9 3. $2000 - 299913.1 4. $3000 - 39999.5 5. $4000 - 4999
16.0 6. $5000 - 74996.7 7. $7500 - 99994.3 8. $10,000 - 14,9992.0 9. $15,000 or more
-----99.9
349 618 Bkt. V334 Total 1967 Family Food Consumption---------------------------------------------
5.0 0. None18.2 1. $1 - 49943.6 2. $500 - 99924.1 3. $1000 - 19996.5 4. $2000 - 29992.0 5. $3000 - 49990.7 6. $5000 - 74990.0 7. $7500 - 99990.0 8. $10,000 or more0.0 9. N.A.
-----100.0
350 619 Bkt. V335 Total 1967 Family Hours of Work(Work for money plus unpaid work)
--------------------------------------------
1.7 0. None1.2 1. $1 - 4998.3 2. $500 - 999
15.2 3. $1000 - 199911.4 4. $2000 - 299918.5 5. $3000 - 499939.0 6. $5000 - 74994.3 7. $7500 - 99990.4 8. $10,000 or more0.0 9. N.A.
-----100.0
351 620 Bkt. V325 "Orshansky Ratio" (Full DetailVariant) Use V407
-----------------------------------------
9.9 0 = -99.95 - 00.7414.3 1 = 00.75 - 01.2414.6 2 = 01.25 - 01.7414.1 3 = 01.75 - 02.2428.1 4 = 02.25 - 03.7415.1 5 = 03.75 - 06.242.8 6 = 06.25 - 09.740.8 7 = 09.75 - 14.240.3 8 = 14.25 - 99.980.0 9 = 99.99 = N.A.
-----100.0
352 621 Bkt. V326 Ratio of Total 1967 Family RealIncome Net of Cost of Earning Income
68

to Annual Family Need Standard.Use V408
-----------------------------------------------
7.1 0 = -99.95 - 00.7414.8 1 = 00.75 - 01.2416.0 2 = 01.25 - 01.7415.9 3 = 01.75 - 02.2430.3 4 = 02.25 - 03.7413.1 5 = 03.75 - 06.242.3 6 = 06.25 - 09.740.5 7 = 09.75 - 14.240.1 8 = 14.25 - 99.980.0 9 = 99.99 = N.A.
-----100.0
353 622 Bkt. V327 Ratio of Total 1967 Family RealIncome Net of Cost of Earning Incomeand Net of Housing Costs to 1967Family Food Standard. Use V410
-----------------------------------------------
1.8 0 = -99.95 - 00.742.4 1 = 00.75 - 01.243.7 2 = 01.25 - 01.744.3 3 = 01.75 - 02.24
16.2 4 = 02.25 - 03.7427.1 5 = 03.75 - 06.2424.1 6 = 06.25 - 09.7412.1 7 = 09.75 - 14.248.3 8 = 14.25 - 99.980.0 9 = 99.99 - N.A.
-----100.0
354 623 Bkt. V336 Ratio of Total 1967 Family FoodConsumption to 1967 Family FoodStandard
------------------------------------------
3.9 0 = -99.95 - 00.7423.7 1 = 00.75 - 01.2430.7 2 = 01.25 - 01.7421.4 3 = 01.75 - 02.2417.2 4 = 02.25 - 03.742.9 5 = 03.75 - 06.240.3 6 = 06.25 - 09.740.0 7 = 09.75 - 14.240.0 8 = 14.25 - 99.980.0 9 = 99.99 - N.A.
-----100.1
355 624 Bkt. V337 1967 Hourly Earnings - HEAD--------------------------------------
1.4 0. Less than $0.504.1 1. $0.50 - 0.998.2 2. $1.00 - 1.499.4 3. $1.50 - 1.999.9 4. $2.00 - 2.499.9 5. $2.50 - 2.99
17.7 6. $3.00 - 3.9915.8 7. $4.00 - 5.996.6 8. $6.00 - 99.98
17.1 9. $99.99, did not work-----100.1
356 625 Bkt. V338 1967 Hourly Earnings - WIFE--------------------------------------
69

1.4 0. Less than $0.503.2 1. $0.50 - 0.996.4 2. $1.00 - 1.496.4 3. $1.50 - 1.995.1 4. $2.00 - 2.493.8 5. $2.50 - 2.992.6 6. $3.00 - 3.991.9 7. $4.00 - 5.990.9 8. $6.00 - 99.98
68.2 9. $99.99, did not work-----99.9
357 626-628 Difference between Age at Birth of FirstChild and Age at Marriage - HEAD----------------------------------------
xxx Difference in years-xx First child before marriage098 Inap., Never married; never had any
children099 N.A. whether currently married; N.A.
when first marriage; N.A. whether hadchildren; N.A. when first child wasborn
358 629 Bkt. V357 Difference between Age at Birth ofFirst Child and Age at FirstMarriage - HEAD
---------------------------------------------
15.5 0. (-99 to -2) First child born 2 or moreyears BEFORE first marriage
39.8 1. (-l to +1) First child 1 year beforemarriage to 1 year after marriage
14.7 2. (2) First child 2 years after first marriage7.1 3. (3) First child 3 years after first marriage4.5 4. (4) First child 4 years after first marriage3.3 5. (5) First child 5 years after first marriage2.0 6. (6) First child 6 years after first marriage1.5 7. (7) First child 7 years after first marriage6.8 8. (8 - 97) First child 8 or more years after
first marriage4.9 9. (98 - 99) Never married or never had any
----- children; N.A. whether currently100.1 married; N.A. when first married; N.A.
whether had children; N.A. when firstchild was born
359 630 WHETHER RESERVE FUNDS (Q. D6) Do you (FAMILY)have any savings, such as checking or savingsaccounts, or government bonds? (IF YES) (Q.D7) Would they amount to as much as twomonths' income or more? (Q. D8) (IF NO) Wasthere a time in the last five years when youhad as much as two months' income saved up?---------------------------------------------
53.2 1. Had savings in early 1968 that amounted toas much as two months' income or more("Yes" to both D6 and D7)
11.5 2. Had savings in early 1968 that did notamount to as much as two months' incomeor more, but did in past. ("Yes to D6,"No" or "N.A." to D7, and "Yes" to D8)
6.9 3. Had savings in the past five years thatamounted to as much as two months' incomeor more but did not have any savings inearly 1968. ("No" or "N.A." to D6, and"Yes" to D8)
9.6 4. Had savings in early 1968, but did notamount to as much as two months' incomeor more, and never in the past five yearshad that much. ("Yes" to D6 and "No" or
70
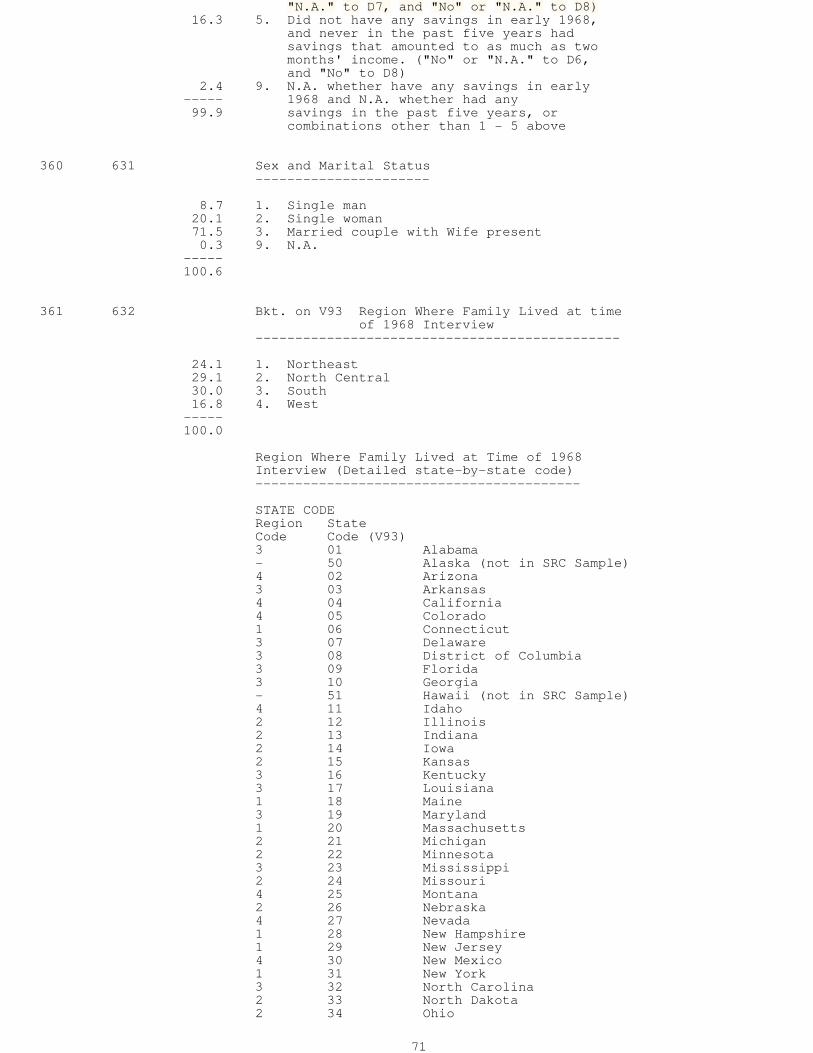
"N.A." to D7, and "No" or "N.A." to D8)16.3 5. Did not have any savings in early 1968,
and never in the past five years hadsavings that amounted to as much as twomonths' income. ("No" or "N.A." to D6,and "No" to D8)
2.4 9. N.A. whether have any savings in early----- 1968 and N.A. whether had any99.9 savings in the past five years, or
combinations other than 1 - 5 above
360 631 Sex and Marital Status----------------------
8.7 1. Single man20.1 2. Single woman71.5 3. Married couple with Wife present0.3 9. N.A.
-----100.6
361 632 Bkt. on V93 Region Where Family Lived at timeof 1968 Interview
----------------------------------------------
24.1 1. Northeast29.1 2. North Central30.0 3. South16.8 4. West
-----100.0
Region Where Family Lived at Time of 1968Interview (Detailed state-by-state code)-----------------------------------------
STATE CODERegion StateCode Code (V93)3 01 Alabama- 50 Alaska (not in SRC Sample)4 02 Arizona3 03 Arkansas4 04 California4 05 Colorado1 06 Connecticut3 07 Delaware3 08 District of Columbia3 09 Florida3 10 Georgia- 51 Hawaii (not in SRC Sample)4 11 Idaho2 12 Illinois2 13 Indiana2 14 Iowa2 15 Kansas3 16 Kentucky3 17 Louisiana1 18 Maine3 19 Maryland1 20 Massachusetts2 21 Michigan2 22 Minnesota3 23 Mississippi2 24 Missouri4 25 Montana2 26 Nebraska4 27 Nevada1 28 New Hampshire1 29 New Jersey4 30 New Mexico1 31 New York3 32 North Carolina2 33 North Dakota2 34 Ohio
71

3 35 Oklahoma4 36 Oregon1 37 Pennsylvania1 38 Rhode Island3 39 South Carolina2 40 South Dakota3 41 Tennessee3 42 Texas4 43 Utah1 44 Vermont3 45 Virginia4 46 Washington3 47 West Virginia2 48 Wisconsin4 49 Wyoming
362 633 Bkt. V311 State or Country Where Head Grew UpRegion Where Head of Family Grew Up
----------------------------------------------
22.7 1. Northeast29.2 2. North Central32.6 3. South8.9 4. West0.0 5. Alaska, Hawaii0.0 6. All foreign countries6.5 9. Not ascertained region where 1967
Head grew up-----99.9
This is the summary code. See V311 forregion code details, and V361 for state codedetails
363 634 Geographic Mobility of Head of Family(Whether now lives in different state and/orregion than where grew up)--------------------------------------------
63.7 0. Lives in same state where grew up(V93 EQ V311)
11.5 1. Lives in same region but different state(V361 EQ V362, and V93 NE V311)
24.1 2. Lives in both a different state anddifferent region from where grew up (V361NE V362)
0.7 9. Region where grew up N.A.-----100.0
364 635 Bkt. Average Accuracy of 1967 IncomeInformation - FAMILY------------------------------------
88.4 0. No assignment0.0 1. Less than .050.0 2. .05 - .094.0 3. .10 - .194.5 4. .20 - .290.6 5. .30 - .491.7 6. .50 - .740.6 7. .75 - .990.1 8. 1.00 - 1.990.0 9. 2.00 or higher
-----99.9
This variable is a bracket code of the simpleaverage of variables 85 - 91, whose code valuesare as follows:0. No assignment1. Minor assignment2. Major assignment, i.e., probable error of
greater than $300 or 10 percent of amount
72

assigned (whichever is greater)5. Estimate not accurate reflection of income or
payments in 1967, i.e., mortgage incurred in1968; married in 1968, etc.
V85 Accuracy of Labor Income -- HEADV86 Accuracy of Labor Income -- WIFEV87 Accuracy of Capital Income -- FAMILYV88 Accuracy of Labor and Capital Income --
Other in FU with largest taxable incomeV89 Accuracy of Labor and Capital Income -
Other(s) in FU with second largest taxableincome
V90 Accuracy of Income from A.D.C. and A.F.D.C.-- FAMILY
V91 Accuracy of amount committed for supportof others outside FU
365 636 Bkt. Average Accuracy of 1967 FinancialInformation Other than Income -- FAMILY---------------------------------------
75.2 0. No assignment0.0 1. Less than .05
11.6 2. .05 - .094.4 3. .10 - .194.3 4. .20 - .293.3 5. .30 - .490.6 6. .50 - .740.5 7. .75 - .990.2 8. 1.00 - 1.990.0 9. 2.00 or higher
-----100.1
This variable is a bracket code of the simpleaverage of the variables listed below whose codevalues are as follows:
0. No assignment1. Minor assignment2. Major assignment; probable error of greater
than $300 or 10 percent of amount assigned(whichever is greater)
3. Complex property - the reported house valueincluded farm or business property, butimputed rent and housing payments werecomputed on the basis of the estimatedportion of property used for housing
5. Estimate not an accurate reflection ofincome or payments in 1967
V7 Accuracy of House Value and Property TaxesV319 Accuracy of MortgageV321 Accuracy of Net Equity and Imputed RentV9 Accuracy of 1967 Mortgage PaymentsV11 Accuracy of 1967 Rent PaymentsV13 Accuracy of 1967 Rent Value for those who
neither own nor rentV15 Accuracy of 1967 Cost of UtilitiesV19 Accuracy of 1967 Additions and Repairs
PaymentsV21 Accuracy of 1967 Car Insurance PaymentsV23 Accuracy of 1967 Car Debt PaymentsV29 Accuracy of 1967 Payments on "Other Things"V34 Accuracy of 1967 Alcoholic Beverages BillV36 Accuracy of 1967 Cigarette BillV38 Accuracy of 1967 Total Food Bill
366 637 Accuracy of Hours Variables - FAMILY------------------------------------
See V364 for bracket code.This variable is a bracket code of the simpleaverage of the variables listed below whose
73

code values are as follows:
68.7 0. No assignment0.0 1. Minor assignment
14.7 2. Major assignment; probable error ofgreater than $300 or 10 percent ofassignment value (whichever is greater)
9.8 4. Work done by someone other than Head orWife
3.4 5. Estimate not an accurate reflection ofincome or payments in 1967
V27 Accuracy of 1967 hours spent on car repairsV48 Accuracy of 1967 hours of work for money
-- HEADV50 Accuracy of 1967 hours of unemployment --
HEADV52 Accuracy of 1967 hours of illness -- HEADV54 Accuracy of 1967 hours of work for money
-- WIFEV56 Accuracy of 1967 hours of child care
-- FAMILYV58 Accuracy of 1967 free help from others
-- FAMILYV60 Accuracy of 1967 family housework hours
-- FAMILYV62 Accuracy of 1967 hours of homeV64 Accuracy of adjustment factor for
Single Head of HouseholdV66 Accuracy of 1967 Sum of Hours on which
Leisure Ratio Based -- FAMILYV68 Accuracy of 1967 Hours of Other #1
Work for MoneyV70 Accuracy of 1967 Hours of Other #2
Work for Money
68.7 0. No assignment0.0 1. Less than .05 - minor assignment
14.7 2. .05 - .09 - major assignment; probable errorof greater than $300 or 10 percent ofassignment value (whichever is greater)
9.8 3. .10 - .193.4 4. .20 - .29 - work done by someone other than
Head or Wife2.8 5. .30 - .49 - estimate not an accurate
reflection of income or payments in 19670.5 6. .50 - .740.0 7. .75 - .990.0 8. 1.00 - 1.990.0 9. 2.00 or higher
-----99.9
367 638 Bkt. Average Accuracy of 1967 Income CreationItems
---------------------------------------------
75.3 0. No assignment0.0 1. Less than .050.0 2. .05 - .09
19.2 3. .10 - .190.0 4. .20 - .294.0 5. .30 - .491.2 6. .50 - .740.2 7. .75 - .990.1 8. 1.00 - 1.990.0 9. 2.00 or higher
-----100.0
This variable is a bracket code of the simpleaverage of the variables listed below whosecode values are as follows:
0. No assignment1. Minor assignment
74

2. Major assignment; probable error of greaterthan $300 or 10 percent of assigned value(whichever is greater)
4. Work done by someone other than Head or Wife5. Estimate not an accurate reflection of
income or payments in 1967
V17 Accuracy of value of Additions and Repairsdone by Family
V25 Accuracy of value of Car Repairs done byFamily
V40 Accuracy of value of Home Grown Food ofFamily
V42 Accuracy of value of clothes made and/ormended by Family
V44 Accuracy of value of food received as partof pay by Family
V46 Accuracy of value of free food, clothingor food stamps received by Family
368 639 Bkt. V117 Age of Head of Family--------------------------------
9.3 1. Under 2517.8 2. 25 - 3421.4 3. 35 - 4418.9 4. 45 - 5416.0 5. 55 - 6410.9 6. 65 - 745.5 7. 75 or older0.1 9. N.A.
-----99.9
369 640 Bkt. V118 Age of Wife of Head of Family----------------------------------------
9.6 1. Under 2515.4 2. 25 - 3417.7 3. 35 - 4413.0 4. 45 - 549.3 5. 55 - 644.7 6. 65 - 741.1 7. 75 or older0.2 9. N.A.
29.0 0. Inap., no wife-----100.0
370 641-642 Average Age of Head and Wife (In Years)---------------------------------------
This Variable is the simple average of V117(age of Head), V118 (age of Wife). If V118 = 00(no wife), age of Head is recorded again
36. Average age of Head and Wife = 36; or noWife present, and Head is 36 years old
371 643 Bkt. V370 Average Age of Head and Wife---------------------------------------
19.9 1. Under 25 (Do not use this code25.1 2. 25 - 34 where there is NO Wife)23.2 3. 35 - 4413.9 4. 45 - 5410.6 5. 55 - 645.5 6. 65 - 741.7 7. 75 or older0.0 9. N.A.
-----99.9
75

372 644 Bkt. on Difference in Age between Head and Wife-----------------------------------------------
V117 (Age of Head) minus V118 (Age of Wife)0.3 0. (-98 to -10) Husband is 10 or more years
YOUNGER than Wife1.6 1. (-9 to -5) Husband is between 5 and 9
years YOUNGER than Wife3.4 2. (-4 to -2) Husband is between 2 and 4
years YOUNGER than Wife3.9 3. (-l) Husband is 1 year YOUNGER than Wife7.6 4. (0) Husband and Wife the SAME age8.6 5. (+1) Husband 1 year OLDER than Wife
24.6 6. (+2 to +4) Husband 2 to 4 years OLDER thanWife
15.0 7. (+5 to +9) Husband 5 to 9 years OLDER thanWife
5.4 8. (+10 to +19) Husband 10 to 19 years OLDERthan Wife
29.6 9. (20-99) Husband 20 or more years OLDERthan Wife; or no wife
-----100.0
373 645-649 Average Value Per Room in Dwelling Unit---------------------------------------
For Homeowners: V5 House Value/V102 Number of rooms in DU
*For Renters: 10 x V11 Annual Rent/t V102 Number of rooms in DU
*For Those who 10 x V12 Rental Valueneither own V102 Number of rooms in DUnor rent:
xxxx. Coded in Dollars
*(Calculated value assumes that value of DU isapproximately 10 times its annual rental value)
374 650 Bkt. V373 Average Value per Room in DwellingUnit
---------------------------------------------
2.3 1. Less than $5007.3 2. $500 - 999
26.5 3. $1000 - 199924.5 4. $2000 - 299919.0 5. $3000 - 39999.4 6. $4000 - 49997.4 7. $5000 - 74992.3 8. $7500 to 99,9981.3 9. N.A.
-----100.0
375 651 Brackets on Value of All Cars Owned (V145)------------------------------------------
20.0 0. Family owns no cars26.8 1. Less than $50015.2 2. $500 - 99923.9 3. $1000 - 19999.1 4. $2000 - 29992.6 5. $3000 - 39991.2 6. $4000 - 49990.6 7. $5000 - 79990.0 8. $8000 - 99980.4 9. N.A.
-----99.8
76

376 652 Number correct Word-to-picture test (V195)------------------------------------------
0.1 0. 0 - 50.3 1. 6 - 90.3 2. 10 - 110.5 3. 120.8 4. 131.0 5. 14 (all correct)
97.0 9. Refused to take test or did not take for----- some other reason (99); or test not100.0 assigned to family (98)
377 653 Bkt. Annual Head Might Earn Per Hour anAnother Job (V210)---------------------------------------
88.4 0. Inap., question not asked0.1 1. $0.01 - 0.990.1 2. $1.00 - 1.490.3 3. $1.50 - 1.990.5 4. $2.00 - 2.491.0 5. $2.50 - 2.992.4 6. $3.00 - 3.992.6 7. $4.00 - 5.992.5 8. $6.00 or more2.1 9. N.A.
-----100.0
378 654 Bkt. Hourly Wage of Jobs Not Worth TakingHead (V238)-----------------------------------------
96.2 0. Inap., question not asked0.4 1. $0.01 - 0.990.7 2. $1.00 - 1.490.3 3. $1.50 - 1.990.1 4. $2.00 - 2.490.1 5. $2.50 - 2.990.1 6. $3.00 - 3.990.1 7. $4.00 - 5.990.0 8. $6.00 or more2.0 9. N.A.
-----100.0
379 655 Bkt. Age When Head of Family Married (V240)-------------------------------------------
1.3 1. Under 164.9 2. 16 - 17
13.7 3. 18 - 1919.2 4. 20 - 2126.9 5. 22 - 2514.5 6. 26 - 306.4 7. 31 - 391.9 8. 40 or older3.3 9. N.A.7.9 0. Inap., not married
-----100.0
380 656 Bkt. Age of Head at Birth of First Child (V138)-----------------------------------------------
0.7 1. Under 162.3 2. 16 - 176.1 3. 18 - 19
11.7 4. 20 - 2125.8 5. 22 - 2519.0 6. 26 - 30
77

9.6 7. 31 - 392.4 8. 40 or older1.8 9. N.A.
20.5 0. Inap., not married-----99.9
381 657 Actual Minus Required Rooms for Family ofThis Size, Age and Sex Composition (V102,V124)-----------------------------------------
0.6 0. -3 or less (DU has 3 fewer rooms thanrequired)
1.0 1. -24.3 2. -19.8 3. 0 (actual number of rooms equals required
number)22.6 4. +123.8 5. +219.1 6. +311.0 7. +46.5 8. +5 or more1.3 9. N.A.
-----100.0 NOTE: Actual number of rooms only coded
through 8, required number of roomsthrough 9; therefore, range is actually-8 to +7
382 658-660 Persons Per Room----------------
09.8 = Family has no room of its own09.9 N.A.Otherwise Person WITH ONE DIGIT AFTER DECIMAL
------Rooms
383 661 Race and Sex of Head--------------------
70.0 0. White male9.2 1. Nonwhite male
16.9 2. White female3.9 3. Nonwhite female
-----100.0
384 662 Employment Problems of Head---------------------------
One point for each of these:
Lost his previous job(V201 = 1 - 3)
Had more than five employers in last 10 years(V203 = 6 - 8)
Turned down a job rather than move(V205 = 1)
Serious illness or accident in last 3 years(V215 = 1 - 2)
Serious unemployment in last 3 years(V219 = 1 - 2)
Would have trouble getting another job,for explicit reasons(V214 = 1)
Score values48.4 023.1 120.0 26.3 3
78

1.7 40.5 50.1 60.0 70.0 80.0 9
-----100.1
385 663 Background Problems of Head---------------------------
Grew up on a farm(V312 = 1)
Completed less than 6 grades, and hasdifficulty reading(V313 = 0)
Parents were poor(V317 = 1)
Age <20 at birth of first child(V380 = 1 - 3)
Score values25.7 041.2 126.3 26.3 30.4 40.0 50.0 60.0 70.0 80.0 9
-----99.9
386 664 Current Handicaps of Head-------------------------
No reading matter visible in DU to interviewer(V184 = 5)
Many (6 or more) questions had to berepeated(V185 = 3 - 5)
Many (6 or more) answers had to berepeated(V186 = 3 - 5)
Head has disfigurements or dysfunctionalhabits(V187 = 1)
Family lives 30 miles or more from thenearest city of 50,000 or more(V189 = 4 - 5)
Head has disabilities that limit work(V216 = 1 - 3)
Head has dependents outside his DU(V278 = 1 - 5)
Family has relatives they might have tohelp more(V279 = 1)
NOTE: This code has values from 0 through 8.No additional points have been givenfor MORE dependents, or more SERIOUSdisabilities, or EXTREME incoherence,since they are so rare
Score values28.3 035.6 119.8 210.3 34.0 41.6 50.3 6
79

0.1 70.0 80.0 9
-----100.0
387 665 Housing Quality (Dwelling Unit and Neighborhood)------------------------------------------------
See V418 for a revised version of this variable
Family owns its own home(V103 = 1)
Family does not share dwelling with anotherfamily(V114 = 1, 2, 5 - 7)
Family owns car or causes no difficultiesnot to have a car(V140 = 1 or 5)
DU is less than 15 miles from center of cityof 50,000 or more (but not within 5 milesof center)(V189 = 2)
Live in a single family house(V190 = 1)
Neighborhood contains only single familyhouses(V192 = 2)
Interviewer noted no housing defects(V194 = 5)
House value (or 10 times annual rent) equals$2000 or more per room(V374 = 4 - 8)
Number of rooms equal to or greater thannumber required(V381 = 4 - 9)
Score values0.0 00.0 10.8 23.7 39.4 4
17.0 518.2 617.9 722.5 810.4 9
-----99.9
388 666 Sense of Efficacy-----------------
See V419 for a revised version of thisvariable
Not unsure life would work out(V295 = 1, 2, 3, 9)
Sure life would work out(V295 = 1 - 2)
Some planning(V296 = 1, 2, 3, 9)
Plans ahead(V296 = 1 - 2)
Doesn't fail to carry out things(V297 = 1, 2, 3, 9)
Get to carry out things as expected(V297 = 1 - 2)
Not dissatisfied with self(V302 = 1, 2, 3, 9)
Satisfied with self(V302 = 1 - 2)
No limitations seen for self(V303 = 3, 5, 9)
80

Score values2.9 02.0 17.1 27.4 3
10.4 414.9 512.9 617.0 711.2 814.2 9
-----100.0
389 667 Trust in Others---------------
See V420 for a revised version of thisvariableNeither likes nor dislikes a job where toldwhat to do(V213 = 2 - 4, 9)
Would not have trouble getting anotherjob(V214 = 5)
Is not concerned with what others think(V305 = 0 - 2)
Trusts other people(V306 = 0 - 2)
Thinks life of average man is gettingbetter(V309 = 0 - 2)
Thinks there are not many who have thingsthey don't deserve(V310 = 4, 5)
Score values1.5 09.4 1
16.4 224.8 326.0 416.3 55.6 60.0 70.0 80.0 9
-----100.0
390 668 Ambition (Verbal Aspiration Expressed)--------------------------------------
See V423 for a revised version of thisvariablePlans to move (purposive move)(V112 EQ 1 - 3)
Has high educational aspirations forchildren(V137 EQ 1 - 3)
Says it is important to make own decisionson a job(V199 EQ 1 - 2)
Is willing to move for even a moderatelybetter job(V207 EQ 1 - 3)
Has plans to try for a new job(V208 EQ 1)
Doesn't like a job where told what to do(V213 EQ 4 - 5)
Wanted to work more hours than did(V231 EQ 1)
Did not want to work fewer hours than did(neutralizes the Inaps.)
81
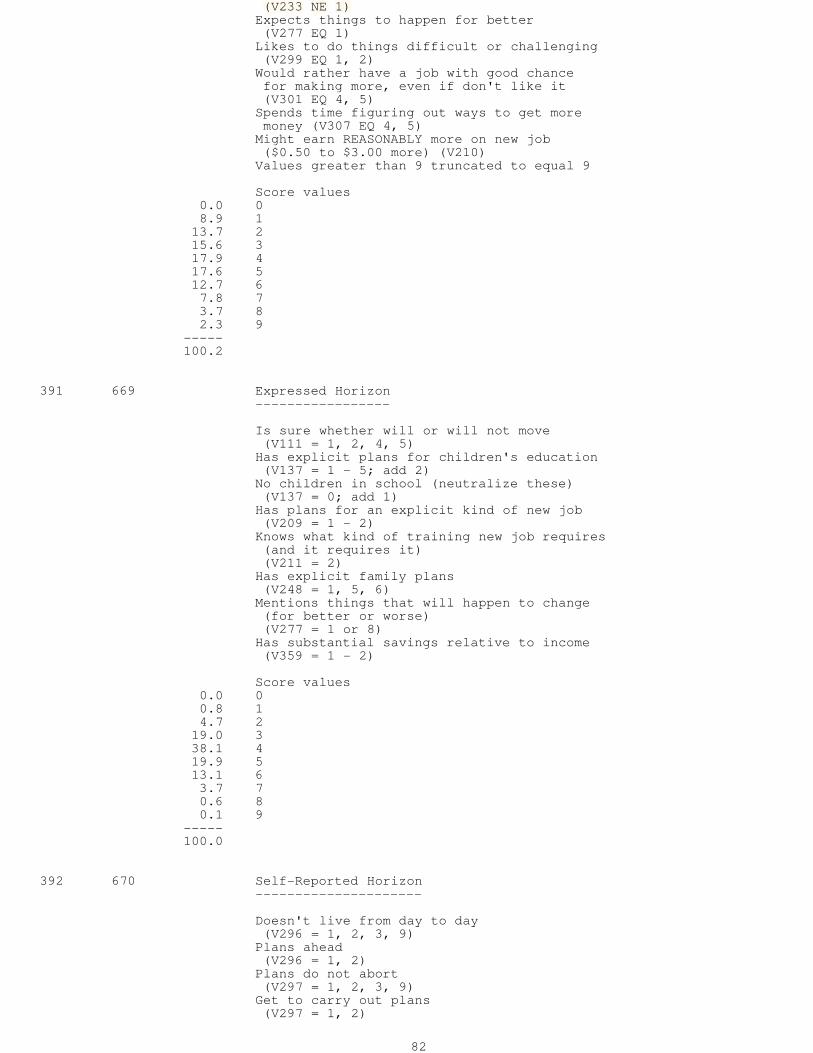
(V233 NE 1)Expects things to happen for better(V277 EQ 1)
Likes to do things difficult or challenging(V299 EQ 1, 2)
Would rather have a job with good chancefor making more, even if don't like it(V301 EQ 4, 5)
Spends time figuring out ways to get moremoney (V307 EQ 4, 5)
Might earn REASONABLY more on new job($0.50 to $3.00 more) (V210)
Values greater than 9 truncated to equal 9
Score values0.0 08.9 1
13.7 215.6 317.9 417.6 512.7 67.8 73.7 82.3 9
-----100.2
391 669 Expressed Horizon-----------------
Is sure whether will or will not move(V111 = 1, 2, 4, 5)
Has explicit plans for children's education(V137 = 1 - 5; add 2)
No children in school (neutralize these)(V137 = 0; add 1)
Has plans for an explicit kind of new job(V209 = 1 - 2)
Knows what kind of training new job requires(and it requires it)(V211 = 2)
Has explicit family plans(V248 = 1, 5, 6)
Mentions things that will happen to change(for better or worse)(V277 = 1 or 8)
Has substantial savings relative to income(V359 = 1 - 2)
Score values0.0 00.8 14.7 2
19.0 338.1 419.9 513.1 63.7 70.6 80.1 9
-----100.0
392 670 Self-Reported Horizon---------------------
Doesn't live from day to day(V296 = 1, 2, 3, 9)
Plans ahead(V296 = 1, 2)
Plans do not abort(V297 = 1, 2, 3, 9)
Get to carry out plans(V297 = 1, 2)
82

Wouldn't rather spend it today(V00 = 3 or higher)
Would rather save for future(V300 = 4, 5)
Does not just take things as they come(V308 = 1, 2, 3, 9)
Thinks about things that may happen(V308 = 1, 2)
Score values7.1 04.5 1
16.8 28.3 3
21.9 49.6 5
16.9 66.7 78.2 80.0 9
-----100.0
393 671 Connectedness to Potential Sources of Help------------------------------------------
Went to a PTA meeting, within last year(V136 = 1 - 2)
Neutralize those with no children in school(V136 = 0, 1, 2)
Attends church once a month or more(V284 = 2 - 5)
Watches television a lot (more than 1 hourper day)(V286 = 2 - 8)
Reads a newspaper once a week or more(V287 = 3 - 5)
Knows two or more neighbors by name(V288 = 2 - 8)
Knows six or more neighbors by name(V288 = 6 - 8)
Has relatives within walking distance of DU(V289 = 1)
Goes to organizations once a month or more(V292 = 2 - 5)
Goes to bar or tavern once a month or more(V293 = 2 - 5)
Belongs to a labor union and pays dues(V294 = 2 - 8)
Values greater than 9 truncated to 9
Score values0.2 00.7 12.3 26.0 3
11.5 420.1 523.9 619.8 710.5 85.0 9
-----100.0
394 672 Money Earning Acts (Current Money EarningBehaviors)-----------------------------------------
Head works more than 2,000 hours(V47 GE 3 2000)
Wife works more than 1,00- hours(V53 GE 4 1000)
Neutralize: No wife, or children under 4(V239 GT 1 -- no wife) or (V120 EQ 1 - 3 --
83

child under 4)Head self-employed and/or owns a business(V198 EQ 2 - 3 or V250 LT 5)
Moved to get a better job(V204 EQ 1)
Has done something about a better job(V212 EQ 1 - 3)
Head seldom or never late for work(V217 EQ 3 - 5)
If Employed Head rarely or never fails to go to work whennot sick(V218 EQ 4 - 5)
Head has extra jobs (or ways of making money)(V227 EQ 1, 3, 4)
Has name in several places for a jobUnemployed (V235 EQ 2 - 4)or Retired Has applied to 2 or more places in last 2 weeks
(V236 EQ 2 - 4)Low reservation price: no jobs not worthtaking, or they pay less than $1.50 per hour(V238 LT 150)
Score values0.3 09.5 1
14.8 29.0 3
21.0 423.1 514.9 65.6 71.6 80.3 9
-----100.1
395 673 Real Earning Acts (nonmoney, or investmentfor future)------------------------------------------
Saved more than $100 doing own additions andrepairs(V16 > 0100, add 2; V16 < 0100, add 1)
Saved more than $100 by growing own food(V39 > 100)
Saved more than $100 by sewing(V41 > 100)
Spends time on other productive activities(V280 = 4 - 5)
Spends time on other productive activities(V281 = 4 - 5)
Taking courses or lessons with earning pos-sibilities(V285 = 3 - 5)
Saved more than $100 on car repairs(V24 > 100; add 2)
Neutralize non-owners(V143 = 0; add 1)
COMMENT: The above items were made into aseparate index from the incomeincreasing behaviors more directlyrelated to regular jobs, becausethey may actually be substitutesfor increasing money earnings byworking more on the main job
Score values19.7 028.3 127.6 214.5 36.6 42.4 5
84

0.7 60.1 70.0 80.0 9
-----99.9
396 674 Economizing-----------
Received free help from others inside or outsidethe house for more than 100 hours(V57 GT 100)
Does not own a recent year model car (1966 - 68)(V144 NE 66, 67, 68)
Spends less than $150/year on alcohol(V33 GT $150)
Spends less than $150/year on cigarettes(V35 LT $150)
Eat out less than once a week(V162 LT 2)
Reports special ways of keeping food bill down(V171 NE 0) (V172 NE 0)
Family eats together most or all the time(V174 EQ 3 - 4)
Report special ways of saving on clothing(V175 NE 0)(V176 NE 0)
Score values0.3 01.9 15.0 2
11.8 319.0 418.4 516.7 614.5 79.7 82.7 9
-----100.0
397 675 Risk Avoidance--------------
At least one car in good condition(V146 EQ 1)
Worst car not in poor condition (alsoneutralizes non-owners)(V147 NE 5)
All cars insured(V149 EQ 1)
Has no uninsured car (neutralizes non-ownerswho get a point)(V149 NE 3 - 5)
Head has seat belts fastened all the time(V153 EQ 1; add 2)
Head has seat belts fastened part of the time(V153 EQ 3; add 1)
Neutralize the non-owners(V152 EQ 0; add 1)
Head insured, or family can get free medicalcare(V158 EQ 1 - 3, 5, 7)
Family does not smoke more than 17 cigarettesa day(V169 EQ 0 - 2)
Family has some savings(V359 EQ 1, 2, or 4)
Values greater than 9 truncated to 9
Score values0.0 00.6 1
85

1.5 22.7 3
10.4 417.7 527.7 621.4 712.9 85.0 9
-----99.9
398 676 Number of Children Under 18 Living with Family----------------------------------------------
14.8 1. One15.0 2. Two9.8 3. Three5.2 4. Four2.6 5. Five1.5 6. Six0.7 7. Seven0.3 8. Eight0.4 9. Nine
49.6 0. None-----99.9
399 677-680 Ratio of Family Money Income to Family MoneyNeeds: SSA Economy Level (70% Farm FamilyCutoffs)--------------------------------------------
xx.xx This Social Security Administration definitionis based on the economy level food budget, whichwas the same definition that was applied to the1967 CPS data. The cutoffs are unaltered evento take account of price changes. Economies ofscale are related to family size, although thedefinition assumes that the marginal cost foradditional family members beyond 7 is zero.Incorporated in the definition are adjustmentsfor the sex of the head and the ages of familymembers. For farm families, those whose headsindicate that farming is their first or secondjob, the cutoff is .7 x nonfarm values
400 681-684 Ratio of Family Money Income to Family MoneyNeeds: SSA Economy Level (80% Farm FamilyCutoffs)--------------------------------------------
xx.xx This variable is identical to V399 exceptthat the cutoff for farm families is .8 x non-farm values
401 685-688 Ratio of Family Money Income to Family MoneyNeeds: SSA Low-Cost Level (70% Farm FamilyCutoffs)--------------------------------------------
xx.xx This definition is identical in structure toV399, but allows a higher money need per person.In contrast to the economy-level definitions(V399 - 400), the cutoffs here have been adjustedupward from the 1967 level to reflect pricechanges. The cutoff for farm families is.7 x nonfarm values
402 689-692 Ratio of Family Money Income to Family MoneyNeeds SSA Low-Cost Level (80% Farm FamilyCutoffs)--------------------------------------------
86

xx.xx
403 693-696 Ratio of Family Money Income to Family MoneyNeeds Modified SSA Economy Level (70% FarmFamily Cutoffs)--------------------------------------------
xx.xx This definition differs in two ways from V399.First, it rests on a 1965 food expenditures surveyand, second, it assumes that the marginal costof additional family members becomes zero afterthe 11th member, rather than the 7th. There area larger number of poor when this definition isused because the extension of the range in whichfamily members have a positive marginal cost,and because of the higher cutoffs resultingfrom the 1965 food expenditure survey, whichshowed the ratio of food expenditure to totalneeds to be less than 1/3, the ratio developedfrom the 1955 survey
404 697-700 Ratio of Family Money Income to Family MoneyNeeds Modified SSA Economy Level (80% FarmFamily Cutoffs)--------------------------------------------
xx.xx
405 701-704 Ratio of Family Money Income to Family MoneyNeeds Modified SSA Low-Cost Level (70% FarmFamily Cutoffs)--------------------------------------------
xx.xx This definition differs from V401 in the sameway that the modified SSA economy-leveldefinition differs from V399
406 705-708 Ratio of Family Money Income to Family MoneyNeeds Modified SSA Low-Cost Level (80% FarmFamily Cutoffs)--------------------------------------------
xx.xx The following bracket code is used for variables407 - 409
0. Less than .401. .40 - .792. .80 - 1.193. 1.20 - 1.594. 1.60 - 1.995. 2.00 - 2.396. 2.40 - 2.997. 3.00 - 3.998. 4.00 - 5.999. 6.00 or higher
407 709 Bkt. on V325: "Orshansky Ratio"--------------------------------
408 710 Bkt. on V326: Ratio of Total 1967 Family RealIncome Net of Cost of Earning Income toAnnual Family Need Standard----------------------------------------------
409 711 Bkt. on V399: Ratio of Family Money Income toFamily Money Needs: SSA Economy Level (70%Farm Family Cutoffs)----------------------------------------------
87

410 712 Bkt. on 8V327: Ratio of Total 1967 FamilyReal Income Net of Cost of Earning Income andNet of Housing Costs to 1967 Family FoodStandard---------------------------------------------
0. -9.99 - 0.991. 1.00 - 1.992. 2.00 - 2.993. 3.00 - 3.994. 4.00 - 4.995. 5.00 - 5.996. 6.00 - 7.497. 7.50 - 9.998. 10.00 - 14.999. 15.00 or higher
411 713 Bkt. on 8V382: Persons per Room--------------------------------
0. Under 00.31. 0.3 - 0.42. 0.5 - 0.63. 0.7 - 0.84. 0.9 - 1.25. 1.3 - 1.66. 1.7 - 2.07. 2.1 - 3.08. 3.1 - 9.89. 09.9 or higher; N.A.
Variables 412 - 417 are employment and incomecharacteristics of the county in which thefamily was interviewed in 1968. The value ofeach variable is a constant for everyone in thatcounty. Data from variables 412 - 414 are derivedfrom questionnaires sent to one stateunemployment compensation commissioners, askingthem about the sample counties in their state
412 714 Whether Surplus or Shortage of UnskilledTemporary Labor in County----------------------------------------
1. Many more jobs than there are applicants2. More jobs than applicants3. Most people are able to find jobs4. A number of unskilled workers unable to
find jobs5. Many unskilled workers unable to find jobs9. N.A.
413 715 Average hourly wage in county for unskilledtemporary labor-------------------------------------------
1. Under $1.502. $1.50 - 1.993. $2.00 - 2.494. $2.50 - 2.995. $3.00 - 4.009. N.A.
414 716 County Unemployment Rate, Spring 1968-------------------------------------
1. Under 2%2. 2 - 3.9%3. 4 - 5.9%4. 6 - 10%5. Over 10%9. N.A.
88

415 717 Public Welfare, 1962 Per Capita Expenditurein County - (In Dollars). CENSUS OFGOVERNMENTS 1962, Summary - Table 28-------------------------------------------
1. 00.00 - 00.412. 00.42 - 01.093. 01.10 - 02.794. 02.80 - 04.995. 05.00 - 08.996. 09.00 - 15.997. 16.00 - 29.998. 30.00 - 79.999. N.A.
416 718 Per Student Public 1962 Public SchoolExpenditures in County (dollars per year).CENSUS OF GOVERNMENTS, Summary - Table 28------------------------------------------
1. 100 - 1792. 180 - 2193. 220 - 2544. 255 - 2855. 286 - 3096. 310 - 3197. 320 - 3448. 345 - 3899. 390 - 599
417 719 Percent Employment Change in County,1962-1967, County Business Patterns, SummaryTables--------------------------------------------
1. -20 - 112. 12 - 163. 17 - 224. 23 - 265. 27 - 316. 32 - 367. 37 - 618. 62 - 2009. N.A.
418 720 Housing and Neighborhood Quality Redone(Revised V387)---------------------------------------
Owns home V103 = 1Live 5 - 30 miles from center ofcity of 50,000 or more V189 = 2, 3
Single Family home V190 = 1Neighborhood of Single Family V192 = 2Houses
Value per room Value - (10 x rentfor non-owners) 2000 V374 = 4 - 8
Actual - Required rooms V381 = 5 - 9No visible defects V194 = 5
OMITS:Car Lack FeltShare Dwelling (Hard to Determine)Changes: Distance to Center, Surplus of Rooms
419 721 Reported Efficacy and Planning(Revised V388 and V392)------------------------------
Sure Life Would Work Out V295 EQ 1Plans Life Ahead V296 EQ 1
89
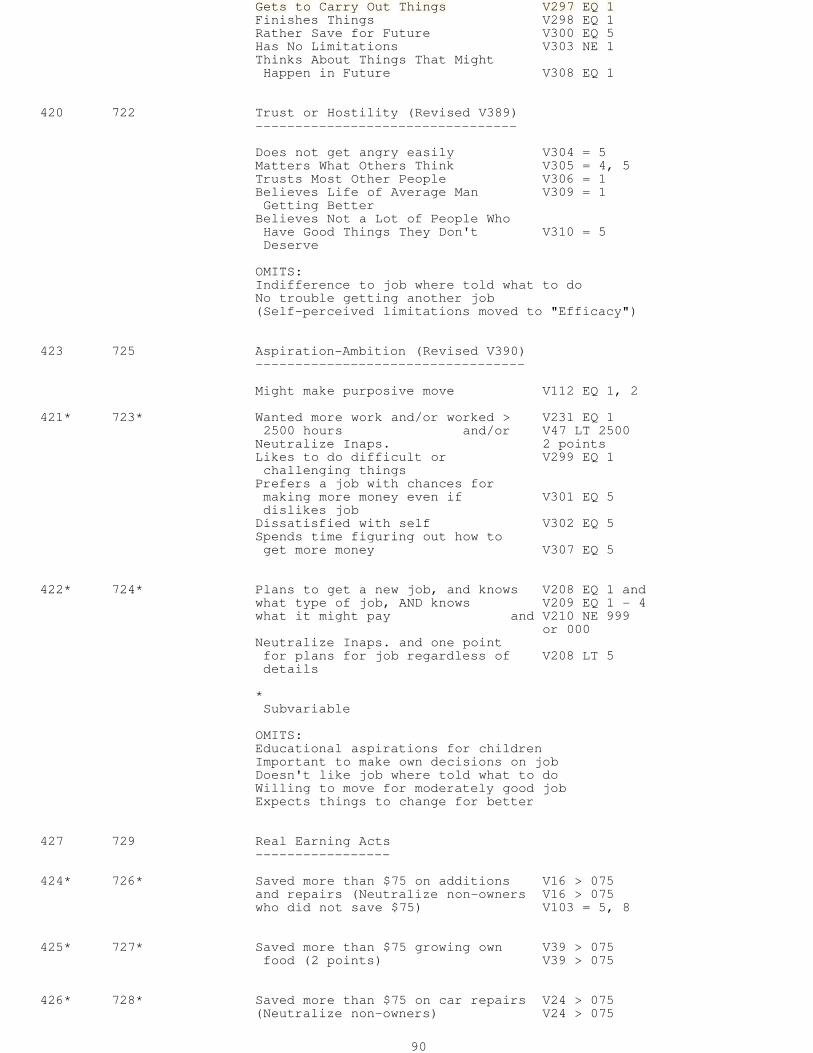
Gets to Carry Out Things V297 EQ 1Finishes Things V298 EQ 1Rather Save for Future V300 EQ 5Has No Limitations V303 NE 1Thinks About Things That MightHappen in Future V308 EQ 1
420 722 Trust or Hostility (Revised V389)---------------------------------
Does not get angry easily V304 = 5Matters What Others Think V305 = 4, 5Trusts Most Other People V306 = 1Believes Life of Average Man V309 = 1Getting Better
Believes Not a Lot of People WhoHave Good Things They Don't V310 = 5Deserve
OMITS:Indifference to job where told what to doNo trouble getting another job(Self-perceived limitations moved to "Efficacy")
423 725 Aspiration-Ambition (Revised V390)----------------------------------
Might make purposive move V112 EQ 1, 2
421* 723* Wanted more work and/or worked > V231 EQ 12500 hours and/or V47 LT 2500
Neutralize Inaps. 2 pointsLikes to do difficult or V299 EQ 1challenging things
Prefers a job with chances formaking more money even if V301 EQ 5dislikes job
Dissatisfied with self V302 EQ 5Spends time figuring out how toget more money V307 EQ 5
422* 724* Plans to get a new job, and knows V208 EQ 1 andwhat type of job, AND knows V209 EQ 1 - 4what it might pay and V210 NE 999
or 000Neutralize Inaps. and one pointfor plans for job regardless of V208 LT 5details
*Subvariable
OMITS:Educational aspirations for childrenImportant to make own decisions on jobDoesn't like job where told what to doWilling to move for moderately good jobExpects things to change for better
427 729 Real Earning Acts-----------------
424* 726* Saved more than $75 on additions V16 > 075and repairs (Neutralize non-owners V16 > 075who did not save $75) V103 = 5, 8
425* 727* Saved more than $75 growing own V39 > 075food (2 points) V39 > 075
426* 728* Saved more than $75 on car repairs V24 > 075(Neutralize non-owners) V24 > 075
90

V143 = 0Taking courses or lessons witheconomic potential V285 = 3 - 5
Spends spare time productively V280 = 4, 5(added)
OMITS:Saved on sewing*Subvariable
432 734 Economizing 1968-----------
428 730 Spend less than $150 a year on V33 LT 150alcohol
429 731 Spend less than $150 a year on V35 LT 150cigarettes
430 732 Received more than 100 hours of V57 GT 100free help
431 733 Do not own very new car V144 NE 66,(in 1969) 67, or 68
Eat out seldom V162 EQ 0, 1Eat together most of time V174 EQ 3, 4
OMITS:Reported ways of keeping food bill downReported ways of saving on clothing
434 736 Risk Avoidance--------------
Has at least one car in good V146 = 1condition
No car V1 + 6 = 0All cars are insured V149 = 1Uses seat belts some of the time V153 = 3(Neutralize non-owners) V152 = 0
Uses seat belts all the time V153 = 1(2 points)
433 735 Has medical insurance or a V158 = 1, 2,way to get free care 3, 5, 7
Head is not a heavy smoker (lessthan one pack a day) V169 = 0 - 2
Have some liquid savings V359 = 1, 2, 4Have two months income saved up V359 = 1
435 737-739 Square root of V328 using money income (3digits)-----------------------------------------
436 740-742 Square root of V329, well-offness using realincome (3 digits)--------------------------------------------
437 743-745 Square root of V330, well-offness using realincome net of housing outlays relative tofood needs (3 digits)--------------------------------------------
438 746 Bkt. Wage rate on second job----------------------------
0. 0 or Inap.
91

1. Under $1.002. $1.00 - 1.493. $1.50 - 1.994. $2.00 - 2.995. $2.50 - 2.996. $3.00 - 3.997. $4.00 - 5.998. $6.00 or more9. N.A.
439 747-748 Weight------
All analysis on the entire sample using 1968data only should be based on data weightedby this variable to reduce the biases fromdifferential sampling and response rates
However, it is possible to use the SRC cross-section sample only, without weights, sincethe response rates did not vary so much as toproduce substantial biases
Cross-section sample is identified by valuesof V3 (Family number) less than 3000
440 (749-800) Dummy Variable--------------
A nondata variable separating the 1968 fromthe 1969 data. Never use this variable foranything
•
92