Embed Size (px)
Citation preview

Section D. Water Supply, Demand, and Water Budget


San Luis Obispo Integrated Regional Water Management Plan Section D. Water Supply, Demand, and Water Budget
July 2014 D-i San Luis Obispo County IRWM Region
Section D. Water Supply, Demand, and Water Budget Table of Contents
Section D. Water Supply, Demand, and Water Budget D-1 D.1 Introduction ................................................................................................................................................................... D-1
Intended Use of the Water Budget .................................................................................................................................. D-3 D.1.1 Use of IRWM Plan for Determining Adequacy of Water Supplies Under Senate Bill 610 and 221 ................................... D-3 D.1.2
D.2 Regional Water Supply Availability ................................................................................................................................. D-3 Surface Water ................................................................................................................................................................... D-3 D.2.1 Groundwater Supply ........................................................................................................................................................ D-4 D.2.2 California Department of Water Resources State Water Project Supply ......................................................................... D-7 D.2.3 Appropriated Water Rights ............................................................................................................................................ D-11 D.2.4 Other Sources of Water Supply ...................................................................................................................................... D-11 D.2.5
Twitchell Reservoir ..................................................................................................................................................D-12 D.2.5.1 Desalination .............................................................................................................................................................D-12 D.2.5.2 Water Recycling .......................................................................................................................................................D-14 D.2.5.3
Other Cooperative Supply Opportunities ....................................................................................................................... D-16 D.2.6 Current Water Supply Total ............................................................................................................................................ D-18 D.2.7
Current Urban Water Supply Breakdown by Sub-Region ........................................................................................D-18 D.2.7.1 Urban Water Supply Summary by Water Sector and WPA ......................................................................................D-19 D.2.7.2
D.3 Current and Future Water Demands and Supplies ........................................................................................................ D-20 Water Demand Data Sources ......................................................................................................................................... D-20 D.3.1
2010 Urban Water Management Plans ...................................................................................................................D-22 D.3.1.1 2012 San Luis Obispo Master Water Report ............................................................................................................D-22 D.3.1.2
Method for Developing Projected Water Demands ....................................................................................................... D-23 D.3.2 Urban Water Demand .............................................................................................................................................D-23 D.3.2.1 Rural Water Demand ...............................................................................................................................................D-24 D.3.2.2 Agricultural Water Demand .....................................................................................................................................D-25 D.3.2.3 Environmental Demand and Unimpaired Runoff ....................................................................................................D-26 D.3.2.4 Assumptions ............................................................................................................................................................D-27 D.3.2.5
D.4 Water Demand and Supplies by Sub-Region and WPA .................................................................................................. D-28 North Coast Sub-Region ................................................................................................................................................. D-30 D.4.1
WPA 1 – San Simeon ................................................................................................................................................D-30 D.4.1.1 WPA 2 – Cambria .....................................................................................................................................................D-34 D.4.1.2 WPA 3 – Cayucos .....................................................................................................................................................D-37 D.4.1.3 WPA 4 – Morro Bay .................................................................................................................................................D-40 D.4.1.4 WPA 5 – Los Osos ....................................................................................................................................................D-43 D.4.1.5
South County Sub-Region ............................................................................................................................................... D-46 D.4.2 WPA 6 – San Luis Obispo/Avila ................................................................................................................................D-46 D.4.2.1 WPA 7 – South Coast ...............................................................................................................................................D-51 D.4.2.2 WPA 8 – Huasana Valley ..........................................................................................................................................D-55 D.4.2.3 WPA 9 – Cuyama Valley ...........................................................................................................................................D-58 D.4.2.4
North County Sub-Region ............................................................................................................................................... D-61 D.4.3 WPA 10 – Carrizo Plain ............................................................................................................................................D-62 D.4.3.1 WPA 11 – Rafael/Big Spring .....................................................................................................................................D-65 D.4.3.2 WPA 12 – Santa Margarita ......................................................................................................................................D-68 D.4.3.3 WPA 13 – Atascadero/Templeton ...........................................................................................................................D-71 D.4.3.4 WPA 14 – Salinas/Estrella ........................................................................................................................................D-75 D.4.3.5 WPA 15 – Cholame Valley .......................................................................................................................................D-78 D.4.3.6 WPA 16 – Nacimiento ..............................................................................................................................................D-81 D.4.3.7
Need for Per Capita Water Demand ............................................................................................................................... D-84 D.4.4D.5 Demand Review Summary Discussion .......................................................................................................................... D-85

San Luis Obispo Integrated Regional Water Management Plan Section D. Water Supply, Demand, and Water Budget
San Luis Obispo County IRWM Region D-ii July 2014
List of Figures
Figure D-1. San Luis Obispo County Reservoirs ..............................................................................................................................D-5 Figure D-2. San Luis Obispo County Groundwater Basins ..............................................................................................................D-6 Figure D-3. California Department of Water Resources State Water Project Facilities .................................................................D-9 Figure D-4. Cambria CSD Desalination Schematic ........................................................................................................................D-13 Figure D-5. Municipal Water Recycling Process ...........................................................................................................................D-15 Figure D-6. Urban Water Supply Breakdown by Sub-Region and for Total Region ......................................................................D-19 Figure D-7. Comparison in Urban Water Supply Portfolio 2010 and 2035 ..................................................................................D-21 Figure D-8. Map of Urban and Rural Areas ..................................................................................................................................D-24 Figure D-9. Agricultural Areas ......................................................................................................................................................D-25 Figure D-10. IRWM Plan Sub-Region Projected Demand Totals ..................................................................................................D-29 Figure D-11. North Coast WPA Water Demand Summary ...........................................................................................................D-30 Figure D-12. WPA-1 San Simeon Water Demands .......................................................................................................................D-31 Figure D-13. WPA 2. Cambria Water Demands............................................................................................................................D-34 Figure D-14. WPA 3. Cayucos Water Demands ............................................................................................................................D-37 Figure D-15. WPA 2. Morro Bay Water Demands ........................................................................................................................D-40 Figure D-16. WPA 5. Los Osos Water Demands ...........................................................................................................................D-43 Figure D-17. South County WPA Water Demand Summary.........................................................................................................D-46 Figure D-18. WPA-6 San Luis Obispo/Avila Water Demands .......................................................................................................D-47 Figure D-19. WPA-7 South Coast Water Demands ......................................................................................................................D-51 Figure D-20. WPA-8 Huasna Valley Water Demands ...................................................................................................................D-55 Figure D-21. WPA-9 – Cuyama Water Demands ..........................................................................................................................D-58 Figure D-22. North County WPA Water Demand Summary ........................................................................................................D-61 Figure D-23. WPA-10 Carrizo Plain Water Demands ....................................................................................................................D-62 Figure D-24. WPA-11 Rafael/Big Spring Water Demands ............................................................................................................D-65 Figure D-25. WPA-12 Santa Margarita Water Demands ..............................................................................................................D-68 Figure D-26. WPA-13 Atascadero/Templeton Water Demands...................................................................................................D-71 Figure D-27. WPA-14 Salinas/Estrella Water Demands ...............................................................................................................D-75 Figure D-28. WPA-15 Cholame Water Demands .........................................................................................................................D-78 Figure D-29. WPA-16 Nacimiento Water Demands .....................................................................................................................D-81
List of Tables
Table D-1. List of Communities and Water Districts with Active Water Demand Reporting .........................................................D-2 Table D-2. In-County Reservoir Contracted Amounts ....................................................................................................................D-4 Table D-3. Groundwater Basin Yields .............................................................................................................................................D-7 Table D-4. State Water Project Water Service Amount (AFY) ........................................................................................................D-8 Table D-5. Existing and Projected Recycled Water Use ...............................................................................................................D-16 Table D-6. Other Developed Supply Sources ...............................................................................................................................D-17 Table D-7. Current (2010) Urban Water Supply for Entire IRWM Planning Region .....................................................................D-18 Table D-8. Water Supplies for 2010 Urban Uses ..........................................................................................................................D-20 Table D-9. Water Supplies for 2035 Urban Uses ..........................................................................................................................D-21 Table D-10. Crop Group Primary Commodities............................................................................................................................D-26 Table D-11. IRWM Plan Sub-Region Demand Totals ....................................................................................................................D-29 Table D-12. North Coast Subregion WPA Annual Average Water Demand Summary (AFY) ........................................................D-30 Table D-13. WPA No. 1 - San Simeon ...........................................................................................................................................D-32 Table D-14. WPA No. 1 – San Simeon Demand Supply Balance ...................................................................................................D-33 Table D-15. WPA No. 2 - Cambria ................................................................................................................................................D-35 Table D-16. WPA No. 2 – Cambria Demand Supply Balance ........................................................................................................D-36 Table D-17. WPA No. 3 - Cayucos ................................................................................................................................................D-38 Table D-18. WPA No. 3– Cayucos Demand Supply Balance .........................................................................................................D-39 Table D-19. WPA No. 4 - Morro Bay.............................................................................................................................................D-41 Table D-20. WPA No. 4 – Morro Bay Demand Supply Balance ....................................................................................................D-42 Table D-21. WPA No. 5 - Los Osos ................................................................................................................................................D-44 Table D-22. WPA No. 5 – Los Osos Demand Supply Balance .......................................................................................................D-45

San Luis Obispo Integrated Regional Water Management Plan Section D. Water Supply, Demand, and Water Budget
July 2014 D-iii San Luis Obispo County IRWM Region
Table D-23. South County WPA Annual Average Water Demand Summary (AFY) ......................................................................D-46 Table D-24. WPA No. 6 - San Luis Obispo/Avila ...........................................................................................................................D-48 Table D-25. WPA No. 6 – San Luis Obispo/Avila Demand Supply Balance ...................................................................................D-49 Table D-26. WPA No. 7 - South Coast ..........................................................................................................................................D-52 Table D-27. WPA No. 7 – South Coast Demand Supply Balance ..................................................................................................D-53 Table D-28. WPA No. 8 - Huasna Valley .......................................................................................................................................D-56 Table D-29. WPA No. 8 - Huasna Valley Demand Supply Balance ...............................................................................................D-57 Table D-30. WPA No. 9 - Cuyama Valley ......................................................................................................................................D-59 Table D-31. WPA No. 9 – Cuyama Valley Demand Supply Balance ..............................................................................................D-60 Table D-32. North County Subregion WPA Water Demand Summary .........................................................................................D-61 Table D-33. WPA No. 10 – Carrizo Plain .......................................................................................................................................D-63 Table D-34. WPA No. 10 – Carrizo Plain Demand Supply Balance ...............................................................................................D-64 Table D-35. WPA No. 11 - Rafael/Big Spring ................................................................................................................................D-66 Table D-36. WPA No. 11 – Rafael/Big Spring Demand Supply Balance ........................................................................................D-67 Table D-37. WPA No. 12 - Santa Margarita ..................................................................................................................................D-69 Table D-38. WPA No. 12 – Santa Margarita Demand Supply Balance .........................................................................................D-70 Table D-39. WPA No. 13 - Atascadero/Templeton ......................................................................................................................D-72 Table D-40. WPA No. 13 - Atascadero/Templeton Demand Supply Balance ...............................................................................D-73 Table D-41. WPA No. 14 - Salinas/Estrella ...................................................................................................................................D-76 Table D-42. WPA No. 14 – Salinas/Estrella Demand Supply Balance ...........................................................................................D-77 Table D-43. WPA No. 15 - Cholame .............................................................................................................................................D-79 Table D-44. WPA No. 15 – Cholame Demand Supply Balance .....................................................................................................D-80 Table D-45. WPA No. 16 - Nacimiento .........................................................................................................................................D-82 Table D-46. WPA No. 16 - Nacimiento Demand Supply Balance .................................................................................................D-83 Table D-47. Per Capita 20X2020 Goals for Large Urban Water Suppliers ....................................................................................D-85

San Luis Obispo Integrated Regional Water Management Plan Section D. Water Supply, Demand, and Water Budget
San Luis Obispo County IRWM Region D-iv July 2014
(This page Intentionally left blank)

San Luis Obispo Integrated Regional Water Management Plan Section D. Water Supply, Demand, and Water Budget
July 2014 D-1 San Luis Obispo County IRWM Region
Section D. Water Supply, Demand, and Water Budget
San Luis Obispo’s IRWM planning region area is approximately 3,322 square miles, and currently includes 36 actively reporting unincorporated and incorporated communities (see Table D-1) situated within 26 watersheds including urban, rural, and agricultural water demands. The need to separate the water demand and supply budgets and balance from Section C – Region Description is prudent to the importance of keeping track of the region’s water issues. The content of this section is instrumental in the identification of the region’s trends, the stakeholders involved, and the potential solutions amongst grouped water users in each of the Water Planning Areas (WPAs).
D.1 INTRODUCTION This section of the San Luis Obispo IRWM Plan provides a discussion and analysis of the current and projected water supply and demand for the San Luis Obispo IRWMP planning region. This section is limited to descriptions of supply infrastructure and demand areas addressed in Section C – Region Description. To address the requirements of the IRWM Plan, the Region Description provides the broader descriptions of the San Luis Obispo watershed system and maintains a relatively high level evaluation of critical water issues; whereas, this section delves into the details of water demands and supplies for each water use sector of each WPA, using data from individual water districts and watersheds.
The data contained within this section is taken from existing published documents describing the water demands and supply of a water use sector, water district, or environmental demand. Unlike the 2012 San Luis Obispo Master Water Report (MWR), the analysis window used in this section specifies exact dates for the planning horizon. The years from 2010 through 2035, in five-year increments, are used to match the IRWM Plan’s planning window as well as the planning windows of many General Plans and Urban Water Management Plans (UWMPs). The ramification of this change in definition is that water demand projections need to have a higher level of scrutiny to ensure the correct comparison of water demands and supplies occur over time. Schedules for water supply projects driven by increasing water demands can be phased appropriately over time; thereby, increasing the level of confidence for IRWM project implementation.

San Luis Obispo Integrated Regional Water Management Plan Section D. Water Supply, Demand, and Water Budget
San Luis Obispo County IRWM Region D-2 July 2014
Table D-1. List of Communities and Water Districts with Active Water Demand Reporting WPA No. Joint Management Agencies Community/Water District Name
North Coast 1 San Simeon CSD 2 Cambria CSD
3 Cayucos Area Water Organization
Cayucos Cemetery District CSA 10A Morro Rock Mutual Water Co Paso Robles Beach Water Assn
4 City of Morro Bay
4 Chorro Valley Water System
California Men’s Colony Camp SLO - National Guard County Operation Center of Education Cuesta College
5 Community of Los Osos Golden State Water Company – Los Osos Los Osos CSD S & T Mutual Water Company
South County 6 Avila Beach CSD 6 Avila Valley Mutual Water Co 6 Cal Poly San Luis Obispo 6 City of San Luis Obispo 6 CSA 12 6 Port San Luis 6 San Miguelito MWC 7 Golden State Water Company – Edna
7 Nipomo Mesa Management Area
Conoco Phillips Co Golden State Water Company – Nipomo Nipomo CSD Rural Water Company/Cypress Ridge Sewer Co Woodlands Mutual Water Company
7 Northern Cities Management Area
City of Arroyo Grande City of Grover Beach City of Pismo Beach Oceano CSD
North County 12 CSA 23 12 Santa Margarita Ranch 13 Atascadero Mutual Water Co 13 Garden Farms C.W.D. 13 Paso Robles Municipal Well Pumping 13 Templeton CSD
14 Paso Robles Groundwater Basin Users
Camp Roberts City of Paso Robles San Miguel CSD SLO CSA No. 16 – Shandon
16 Heritage Ranch CSD 16 Nacimiento Water Company

San Luis Obispo Integrated Regional Water Management Plan Section D. Water Supply, Demand, and Water Budget
July 2014 D-3 San Luis Obispo County IRWM Region
Intended Use of the Water Budget D.1.1
What follows is a relatively linear accounting of water supply and demand for each of the WPAs. The first subsections provide the setting for potential water supply and conservation efforts in relation to the different WPAs, and used to identify areas where: 1) water demands are known to be outpacing available water supplies, 2) opportunities for in-Region transfers exist, or 3) alternative water supply options can be studied. The importance is in the comparison between supply and demand and to Identify critical issues so that solutions can be sought.
Use of IRWM Plan for Determining Adequacy of Water Supplies Under Senate D.1.2Bill 610 and 221
This section does not make any conclusions on the adequacy of water supplies to meet water demands, but does discuss likely deficiencies and probable actions. The rigor of analysis required as part of the required study of sustainable water supplies under Senate Bills 610 and 221 for new developments should be done as a separate evaluation supported by the latest local UWMPs and groundwater management plans.
D.2 REGIONAL WATER SUPPLY AVAILABILITY Water is drawn from a number of supply sources, both inside and outside of the County. In-county reservoirs have a significant role in water supply, drainage and flood control, potential hydro-power, and recreation for the region. Groundwater basins, while currently threatened by contamination and over-pumping, are the largest source of in-county supply currently in use. As groundwater basins are relied upon for their Perennial yield of drinking water, imported surface water from the California State Water Project helps reduce the pressure on these basins when used conjunctively, based on availability of state water and facility capacity, over hydrologic wet and dry periods.
Below are brief summaries of the current supply sources either in use or being planned for near term implementation. By establishing what is known of water supplies currently (2013), future forecasting of supply needs can be placed in context with the constraints and costs associated with each supply source.
Surface Water D.2.1
Water is drawn from a number of surface sources, both inside and outside of the County. This section describes the reservoirs in and out of the County that are used as water supply sources within the County. It also includes a brief description of the State Water Project. Allocations and key user agreements are described for each water source.

San Luis Obispo Integrated Regional Water Management Plan Section D. Water Supply, Demand, and Water Budget
San Luis Obispo County IRWM Region D-4 July 2014
Local Surface Water
Many of the local reservoirs are multi-purpose by providing flood control, water supply, groundwater recharge, environmental, hydropower, and recreation benefits. Dams and reservoirs were constructed as the need for supplemental water supplies and flood control became apparent with growing development in the region.
Table D-2. In-County Reservoir Contracted Amounts Surface Water
Source (Year Built)
Storage Capacity
(AF)
Contracted Amount/ Average
Annual Yield in SLO IRWM Region (AFY)
Primary Purpose(s) Owner/ Operator (if different)
Sub-Region(s) Supplied
Nacimiento Reservoir
(1957)
377,900 15,750(1) Water supply Flood control Groundwater
recharge
Monterey County Water Resources Agency
North Coast, South County, North County
Whale Rock Reservoir
(1961)
40,662 40,660(2) Water supply Whale Rock Commission / City of San Luis Obispo
North Coast, South County
Lopez Lake (1968)
49,388 4,530 Water supply Flood protection
San Luis Obispo County Flood Control & Water Conservation District
South County
San Margarita Lake/ Salinas Reservoir
(1941)
23,843 6,950 Water supply U.S. Army Corps of Engineers / San Luis Obispo County Flood Control & Water Conservation District
South County, North County
Chorro Reservoir (1941)
90 140 Water supply CA Dept of Corrections(3) North Coast
Twitchell Reservoir(4)
224,300 0 Irrigation Santa Maria Valley Water Conservation District
South County
Notes: 1. 17,500 AFY total, less 1,750 AFY for lakeside users 15,750 AFY available to SLO Co Nacimiento Water Project. 2. 40,660 AFY of Whale Rock Reservoir water is allocated to the joint right-holders in addition to downstream water rights,
which are accounted for separately. 3. Per CA Dam Safety website inventory. 4. Straddles SLO County with the Dam located in Santa Barbara County
Groundwater Supply D.2.2
The IRWM planning region contains 251 hydraulically separated groundwater basins (see Figure D-2), each relatively independent of the others, with only a few exceptions. The availability of fresh groundwater supplies remain the primary staple for most of this Region’s communities and, especially, for the private well owners living in rural and agricultural areas. Groundwater
1 Based on 2012 Master Water Report (District, 2012) listed groundwater basins, not including sub-basins. See Section C – Region Description for brief descriptions, and Appendix L – Groundwater Basin Descriptions for detailed descriptions of each basin.
July 2014
D-5
San Luis O
bispo County IRWM
Region
San Luis Obispo Integrated Regional W
ater Managem
ent Plan Section D. W
ater Supply, Demand, and W
ater Budget
Figure D-1. San Luis Obispo County Reservoirs

San Luis Obispo County IRW
M Region
D-6
July 2014
San Luis Obispo Integrated Regional W
ater Managem
ent Plan Section D. W
ater Supply, Demand, and W
ater Budget
Figure D-2. San Luis Obispo County Groundwater Basins

San Luis Obispo Integrated Regional Water Management Plan Section D. Water Supply, Demand, and Water Budget
July 2014 D-7 San Luis Obispo County IRWM Region
studies conducted in the past provide some understanding of the perennial average safe yield of the various groundwater basins, but many still are without some form of groundwater management and setting of a perennial yield amount as shown in Table D-3. Identified sources are based on the MWR identification of hydrogeologic studies and groundwater management plans containing the latest perennial yield annual volumes.
Table D-3. Groundwater Basin Yields
Groundwater Basin Name
Estimated Perennial Yield
(AFY) WPA Groundwater Basin
Name
Estimated Perennial Yield
(AFY)
WPA
Arroyo de la Cruz Valley 1,244 1 Pismo Creek Valley Sub-basin(2)
No estimates of basin yield exist. 7
Pico Creek Valley 120 1 Nipomo Valley Sub-basin(2)
No estimates of basin yield exist. 7
San Carpoforo Valley No estimates of basin yield exist. 1 Nipomo Mesa
Management Area 4,800 - 6,000 7
San Simeon Valley 1,040 2 Northern Cities Management Area 5,600 - 6,800 7
Santa Rosa Valley 2,260 2 Santa Maria Valley Management Area 124,000 7
Villa Valley 1,000 2 Huasna Valley No estimates of basin yield exist.
8
Cayucos Valley 600 3 Cuyama Valley 10,000 9 Old Valley 505 3 Carrizo Plain 8,000 - 11,000 10
Toro Valley 532 3 Big Spring Area No estimates of basin yield exist.
11
Chorro Valley 2,210 4 Rafael Valley No estimates of basin yield exist.
11
Morro Valley 1,500 4 Pozo Valley 1,000 12
Los Osos Valley 3,200 5 Rinconada Valley No estimates of basin yield exist.
12
Avila Valley Sub-basin(1) No estimates of basin yield exist. 6 Santa Margarita Valley No estimates of
basin yield exist.(3) 12
Edna Valley Sub-basin(2) 4,000 6 Atascadero Sub-Basin 16,400 13 San Luis Valley Sub-basin(1) 2,000 6 Paso Robles(4) 97,700 13, 14
Arroyo Grande Valley Sub-basin(2)
No estimates of basin yield exist. 7 Cholame Valley No estimates of
basin yield exist. 15
Salinas River Underflow(5) State Permitted 11,419
13, 14
Sources: 2012 Master Water Report (District, 2012), Paso Robles Groundwater Basin Modeling Report (Draft, 2014)
Notes: 1. Sub-basin of the San Luis Obispo Valley Groundwater Basin 2. Sub-basin of the Santa Maria River Valley Groundwater Basin 3. The average annual yield of the basin in the vicinity of the proposed Santa Margarita Ranch development may be in
the range of 400 to 600 AFY. 4. Includes 16,400 AFY perennial yield from the Atascadero Groundwater Sub-basin. 5. The Salinas River Underflow is managed by the State Water Resources Control Board through issuance of water right
permits; although consider to be groundwater and a sub-basin of the Paso Robles groundwater basin.
California Department of Water Resources State Water Project Supply D.2.3

San Luis Obispo Integrated Regional Water Management Plan Section D. Water Supply, Demand, and Water Budget
San Luis Obispo County IRWM Region D-8 July 2014
The California Department of Water Resources (CDWR) owns and operates the State Water Project (SWP). Shown in Figure D-3, it is the largest state-built water and power project in the United States. The SWP first started delivering water to Californians in the 1960s. In 1963, the San Luis Obispo County Flood Control and Water Conservation District (District) contracted with DWR for 25,000 AFY of State Water. However, the Central Coast was not served State Water until 1997 when the Coastal Branch conveyance and treatment facilities, serving Santa Barbara and San Luis Obispo counties, were completed.
Table D-4 below summarizes the regional SWP Water Service Amounts (WSAmt) for the San Luis Obispo Region. Additional detail on the SWP infrastructure delivering to the San Luis Obispo Region is discussed in Section C – Region Description and the MWR.
Table D-4. State Water Project Water Service Amount Contractor WSAmt
(AFY)
Drought Buffer
(AFY)
Total Reserved
(AFY)
6 percent Allocation Year
(1977) (AFY)
66-69% Allocation
Year (AFY)
100% Allocation
Year (AFY)
WPA
Chorro Valley Turnout Morro Bay, City of 1,313 2,290 3,603 216 1,313 1,313 4 California Men’s Colony 400 400 800 48 400 400 4 County Operations Center 425 425 850 51 425 425 4 Cuesta College 200 200 400 24 200 200 4
Subtotal 2,338 3,315 5,653 339 2,338 2,338 Lopez Turnout
Pismo Beach, City of 1,240 1,240 2,480 149 1,240 1,240 7 Oceano CSD 750 0 750 45 495 750 7 San Miguelito MWC 275 275 550 33 275 275 6 Avila Beach CSD 100 0 100 6 66 100 6 Avila Valley MWC 20 60 80 5 20 20 6 San Luis Coastal USD 7 7 14 1 7 7 6
Subtotal 2,392 1,582 3,974 239 2,103 2,392 Shandon Turnout
Shandon 100 0 100 6 66 100 14 Subtotal 100 0 100 6 66 100
Total Reserved 4,830 4,897 9,727 584 4,507 4,830 Total District Allocation 25,000 “Excess Allocation” 15,273 Notes: 1. Minimum, average, and maximum allocations established in the State Water Project Delivery Reliability Report 2007 (August 2008), page 51, Table 6.13. This study used 66 percent for the average allocation year.

San Luis Obispo Integrated Regional Water Management Plan Section D. Water Supply, Demand, and Water Budget
July 2014 D-9 San Luis Obispo County IRWM Region
Figure D-3. California Department of Water Resources State Water Project Facilities

San Luis Obispo Integrated Regional Water Management Plan Section D. Water Supply, Demand, and Water Budget
San Luis Obispo County IRWM Region D-10 July 2014
Maintenance schedules and repair requirements can cause reduced deliveries or a complete shutdown of the delivery system. Since delivery to the Central Coast began, the SWP has provided between 50 and 100 percent of the contracted allocations, but recently, drought conditions coupled with pumping restrictions in consideration of endangered species habitat lowered that amount to 35 percent in 2008, 40 percent in 2009, and 0 percent at the start of 2014. To receive a greater portion of State Water during these shortages (up to their full WSAmts), most agencies have entered into “Drought Buffer Water Agreements” with the District for use of an additional portion of the District’s SWP allocation, as shown in the table above. For example, when the SWP can only deliver 50 percent of contracted allocations, an agency with 100 AFY WSAmt and 100 AFY drought buffer allocation can still receive 100 AFY WSAmt – 50 percent of their 100 AFY allocation plus 50 percent of their 100 AFY drought buffer allocation equals 100 AFY.
The District has 15,273 AFY of unsubscribed SWP allocation (equal to District allocation (25,000 AFY) minus Total Reserved (9,727 AFY)), commonly referred to as the “excess allocation.” Hydraulics, treatment plant capacity, and contractual terms and conditions limit how the excess allocation (or capacity) can be used. In 2011, the District evaluated the available hydraulic capacity in the treated water portion of the Coastal Branch, and compiled a report in partnership with the Central Coast Water Authority (CCWA) titled, “Capacity Assessment of the Coastal Branch, Chorro Valley, & Lopez Pipelines.” This comprehensive report can be found at:
<http://www.slocountywater.org/site/Major%20Projects/State%20Water%20Project/pdf/Capacity%20Study.pdf>
The reach of pipeline reviewed in the report begins at the Devil’s Den Pumping Plant and ends at Tank 5 (see close-up figure above of Figure D-3), including the Chorro Valley and Lopez pipelines in San Luis Obispo county. The capacity assessment provides the recommendations to consider in rating the pipeline capacity, and develops operational scenarios for future optimal use.
The following is a summarized list of options for use of excess pipeline capacity:
Coastal Branch

San Luis Obispo Integrated Regional Water Management Plan Section D. Water Supply, Demand, and Water Budget
July 2014 D-11 San Luis Obispo County IRWM Region
• Direct delivery after contract-revision negotiation for use of any additional capacity available in the Coastal Branch treatment and conveyance facilities for use as a conjunctive use supply to relieve groundwater basins in the wet hydrologic years when surface water availability is at its highest
• As additional drought buffer water to supplement deficiencies in other supply sources in dry and critical years
• Permanent, multi-year or single year transfer or exchange to other SWP contractors, utilizing revenues to improve the reliability of existing water systems
• As a source of either direct groundwater recharge through injection or spreading basins, or as a source of water for reservoir storage
• As a source of irrigation supply in lieu of groundwater use in normal/wet year hydrology through extension of raw water conveyance and distribution facilities beginning at the Coastal Branch Water Treatment Plant, where the larger SWP raw water pipeline terminates, and delivering to Paso Robles Basin residents and agricultural lands
Further detailed discussion on the reliability of SWP supply to the San Luis Obispo Region can be found in the MWR.
Appropriated Water Rights D.2.4
The State Water Resources Control Board has historically regulated and permitted diversions from rivers and creeks for beneficial purposes. Appropriative water right permits are held by numerous entities (i.e., water agencies, landowners, industry, etc.) and typically have a maximum diversion limit stated in the permit. The seniority of water rights is based on the permit number with older permits having seniority over more recent permits. The location and diversions amounts of this type are perhaps the most difficult to site and quantify given that many diverters are private landowners using water for irrigation with no annual reporting of the quantity used. Urban water agencies, however, do report their diversion locations and amounts, and are included in the overall water budget for the IRWM Region.
Other Sources of Water Supply D.2.5
In a few cases, water originating from outside the IRWM planning region is used within a WPA. In these cases, the source of water is either from a watershed and groundwater basin shared between two regions, resulting in coordinated management, or the water comes from non-potable sources such as ocean water or treated wastewater, delivered in the form of desalinated or recycled water supplies, respectively.

San Luis Obispo Integrated Regional Water Management Plan Section D. Water Supply, Demand, and Water Budget
San Luis Obispo County IRWM Region D-12 July 2014
Twitchell Reservoir D.2.5.1
Twitchell Dam is on the Cuyama River about six miles upstream from its junction with the Sisquoc River. Though the dam is located in Santa Barbara County to the south, and operated by the Santa Maria Valley Water Conservation District (SMVWCD), the reservoir straddles the county line and some agricultural land within San Luis Obispo County (South County Sub-Region) is irrigated from the Santa Maria Groundwater Basin, which is replenished by the reservoir’s and downstream Cuyama River flood plain’s natural groundwater recharge capacity.
The multiple-purpose Twitchell Reservoir has a total capacity of 224,300 AF. It stores floodwaters of the Cuyama River, which are released as needed to recharge the groundwater basin and to prevent sea water intrusion. The reservoir supplies on average 32,000 AFY of recharge to the Santa Maria Valley Groundwater Basin, though this value fluctuates significantly relative to annual precipitation. Because the reservoir is managed for flood control and groundwater recharge, the reservoir is empty much of the time. A majority of the groundwater flows towards the ocean, though a small gradient flows seasonally to the Nipomo Mesa Management Area groundwater basin.
Desalination D.2.5.2
The Cambria CSD service area is isolated from inland areas by the Santa Lucia mountain range to the east and the Pacific Ocean to the west, and there are currently no nearby aqueducts from which to import freshwater into the area. These factors resulted in the CSD’s Water Master Plan's Program-level EIR (WMP PEIR) to recommend sea water desalination as the most cost-effective alternative for supplemental potable drinking water supplies.
Since then, the Army Corps of Engineers conducted four facilitated workshops in 2012, which evaluated and screened numerous supply alternatives. This process identified a brackish water project located on CCSD property off of San Simeon Creek Road as being a technically preferred alternative. The CCSD's current emergency water supply project used this earlier San Simeon Brackish water supply alternative as a starting point in developing its design. The project's advanced water treatment plant will include reverse osmosis for removing salt from brackish water. The brackish water is a combination of creek underflow, percolated wastewater

San Luis Obispo Integrated Regional Water Management Plan Section D. Water Supply, Demand, and Water Budget
July 2014 D-13 San Luis Obispo County IRWM Region
treatment plant effluent, and a mixture of freshwater and seawater from a deeper saltwater wedge area.
Figure D-4. Cambria CSD Desalination Schematic
Once completed, the emergency supply project will be capable of producing 250 AF of potable water over a six-month dry season period. In addition to the current emergency project, the CCSD Army Corps of Engineers is completing a longer term supply project through a WRDA authorization. An EIS is currently being completed by the Corps, which will identify a preferred long term water supply alternative.
The plant, if implemented, is expected to produce up to 602 AFY, and is planned to operate during the summer season to augment supply during the summer and high demand periods (from summer tourism). A recycled water system is also planned, with an estimated 65 AFY made available for unrestricted outdoor irrigation use.
In addition, the City of Arroyo Grande, the City of Grover Beach, and the Oceano Community Services District participated in the evaluation of a desalination project to supplement their existing potable water sources. Currently, all three agencies receive water from various sources, including the California State Water Project, Lopez Lake Reservoir, and groundwater from the Arroyo Grande Plain Hydrologic Subarea that is part of the Santa Maria Valley Groundwater Basin. Recent projections of water supply shortfalls in the region motivated the agencies to

San Luis Obispo Integrated Regional Water Management Plan Section D. Water Supply, Demand, and Water Budget
San Luis Obispo County IRWM Region D-14 July 2014
conduct a more detailed study of desalination as a supplemental water supply.2 The study focused on utilizing the existing South San Luis Obispo County Sanitation District’s (SSLOCSD) wastewater treatment plant to take advantage of utilizing the existing ocean outfall, while having the plant located near the ocean sea water source. The feasibility study, completed in 2008, was based on a 2,300 AFY sea water desalination facility. Some of the major points of interest and concern of this study include:
• Some 20 or more beach wells may be needed to provide enough sea water to produce the 2,300 AFY potable water
• Permitting and environmental issues could be complex, and implementation could take eight years or longer
Initial capital cost could be in the range of $35 million, and customer rates could be impacted by 18 percent to over 100 percent to fund the project, and would cost approximately $2,300 per AF or more, on a 20-year life cycle basis; project design could begin by 2016, depending on availability of existing water supplies.
Water Recycling D.2.5.3
Several purveyors and agencies in the County recycle municipal wastewater (see Figure D-5 for illustration of water recycling process). Details of each purveyor or sanitary agency’s recycled water program are discussed later in this report. Recycled water qualities range from secondary quality (as defined by Title 22 California Code of Regulations (CCR)) to the highest level of treatment for unrestricted use.
The most established water recycling program in the County is that of the City of San Luis Obispo. The City of San Luis Obispo currently delivers 135 AFY to nearby golf courses, schools, and commercial establishments, with expectations of increasing recycled water deliveries to 1,000 AFY. The City must also maintain treated effluent discharge from their wastewater treatment plant to San Luis Obispo Creek, and this flow amounts to approximately 1,800 AFY.
2 City of Arroyo Grande 2010 UWMP currently cites a 2006 report entitled, Water Supply Study; Desalination, concluding that the estimated cost per acre-foot of desalination water of $2,675/AF (2010 Dollars) makes desalination infeasible.

San Luis Obispo Integrated Regional Water Management Plan Section D. Water Supply, Demand, and Water Budget
July 2014 D-15 San Luis Obispo County IRWM Region
Source: http://www.ieua.org/facilities/rp5.html
Figure D-5. Municipal Water Recycling Process
Other water recycling projects in the County include those listed in Table D-5 and are discussed briefly in the MWR, and in the draft San Luis Obispo County Regional Recycled Water Strategic Plan (RRWSP).3 The planned future use of recycled water from San Luis Obispo County agencies are included in their forecasted water supply portfolio discussed in water demand sections below.
3 June 2014 Public Draft Regional Recycled Water Strategic Plan (Review for Public Comments) <http://www.slocountywater.org/site/Frequent%20Downloads/Integrated%20Regional%20Water%20Management%20Plan/Recycled%20Water/>

San Luis Obispo Integrated Regional Water Management Plan Section D. Water Supply, Demand, and Water Budget
San Luis Obispo County IRWM Region D-16 July 2014
Table D-5. Existing and Projected Recycled Water Use
Agency / WWTP Existing Effluent Inland Discharge
Ocean / Coastal
Discharge
Existing Reuse
Planned Future Reuse
North Coast Sub-Region (mgd) (AFY) (AFY) (AFY) (AFY) (AFY)
California Men’s Colony 1.20 1,340 1,1403 -- 200 3 200 Cambria CSD 0.50 540 -- 540 -- 4 Cayucos CSD 0.25 275 -- 275 -- Los Osos WWTP5 1.20 1,340 1,340 -- -- Morro Bay 0.87 975 -- 975 -- 1,121 San Simeon CSD 0.07 80 -- 80 --6
North County Sub-Region
City of Atascadero 1.00 1,100 800 -- 300 300 Heritage Ranch CSD 0.20 230 230 -- -- -- City of Paso Robles 3.00 3,300 3,300 -- -- -- San Miguel CSD 0.10 130 130 -- -- -- TCSD Meadowbrook WWTP1 0.15 170 170 2 -- -- 750
South County Sub-Region
Avila Beach CSD 0.05 50 -- 50 -- NCSD Blacklake WWTP 0.05 50 -- -- 50 80 NCSD Southland WWTF 0.60 640 640 7 -- -- 1,900 Pismo Beach 1.10 1,230 -- 1,230 -- 2,020 Rural Water Company 0.05 50 -- -- 50 50 City of San Luis Obispo8 5.10 5,700 5,540 8 -- 160 400 San Miguelito MWC 0.15 170 -- 170 -- SSLOCSD WWTP 2.60 2,910 -- 2,910 -- 3,920 Woodland MWC 0.05 50 -- -- 50 50 Total 18.29 20,330 13,290 6,230 810 10,791 Source: (Public Draft RRWSP, June 19, 2014), MWR, and UWMPs
Notes: 1 Templeton CSD is considering diverting existing sewer flows that go to the Paso Robles WWTP (approximately
0.22mgd) and conveying the flow for treatment at the TCSD Meadowbrook WWTP. 2 Templeton CSD retrieves the percolated water at downstream wells. 3 Must maintain a minimum discharge of 0.75 cfs (0.5mgd ; 540AFY ) to Chorro Creek. 4 Percolated effluent serves as a barrier to slow the seaward migration of subterranean fresh water. 5 Currently under construction and start of operations planned for 2016. 6 Trucking of recycled water for irrigation started in 2014. 7 Percolated water is accounted for in the Nipomo Mesa Management Area groundwater balance. 8 Must maintain a minimum discharge of 2.5 cfs (1.6mgd ; 1,800AFY ) to San Luis Obispo Creek.
Other Cooperative Supply Opportunities D.2.6
Other cooperative supply opportunities exist between agencies internal to the planning region. There are also future programs such as expansion of the existing Nacimiento Water Project (NWP). Currently, 9,655 AFY of water available from the project is subscribed for and 6,095 AFY

San Luis Obispo Integrated Regional Water Management Plan Section D. Water Supply, Demand, and Water Budget
July 2014 D-17 San Luis Obispo County IRWM Region
is unsubscribed for. The following are examples from the MWR of how the use of the NWP could be used as a viable supply source in the future.
Unsubscribed Urban Use: This would entail direct delivery of the unsubscribed water to existing or new urban participants.
Unsubscribed Non-Urban Use: This would entail delivery to new rural and/or agricultural participants directly or via wheeling through existing participants’ infrastructure.
Groundwater Banking or Recharge: This would entail direct or in-lieu delivery of subscribed and/or unsubscribed water to a recharge location for later extraction and/or to benefit the groundwater basin. In-lieu delivery refers to delivering additional NWP water to existing participants in-lieu of those existing participants pumping groundwater.
Exchanges: This would entail using the unsubscribed water in exchange of a currently used water resource. Examples include connecting CMC or Cal Poly to the NWP and freeing up State Water and/or Whale Rock Reservoir water for use by others; the City of San Luis Obispo utilizing additional water from the NWP and freeing up Salinas Reservoir water for use by others; or delivering unsubscribed water to urban areas to free up groundwater for rural and/or agricultural users.
Other more developed supply sources of the County that are outside of groundwater basins discussed above are listed in Table D-6. If the District requires more detailed information, focused studies would be necessary.
Table D-6. Other Developed Supply Sources ub-Region Area
North Coast Villa/Cayucos/Old/Willow/Toro Creek Roads North County Nacimiento/San Antonio Lakes North County Adelaida North County Park Hill North County Templeton Hills South County Coast San Luis Hills/Oak Park South County Coast Nipomo Valley/Los Berros/Tematte Ridge
Source: 2012 MWR
Most of these opportunities do provide a reliable source of water due to the nature of existing contract provisions and surface water rights. However, given the affordability and institutional challenges associated with new urban or non-urban participants working both inside and outside of the San Luis Obispo County IRWM region, and costs associated with a banking/recharge program that would likely only have a short-term benefit, further studies are needed to look at:
• Developing supply scenarios and evaluating each scenario regarding the needs,

San Luis Obispo Integrated Regional Water Management Plan Section D. Water Supply, Demand, and Water Budget
San Luis Obispo County IRWM Region D-18 July 2014
willingness of participants, capacity availability, stakeholder review and/or approval, exchange valuation assessments, and water rights issues.
• Conducting flow tests or reservoir releases to evaluate the benefit of outside cooperative new supply scenarios.
Current Water Supply Total D.2.7
Total current water supplies of the IRWM planning region are presented in two different aggregations to present the supply totals on both a Sub-Region and WPA level. The breakdown of water supplies includes five categories of water supply sources:
1. Groundwater – groundwater indigenous to the Sub-Region 2. SWRCB Water Rights Diversions – SWRCB permitted surface water diversions within
the IRWM Region 3. Imported Surface Water – includes SWP water from the Coastal Branch WTP 4. Reuse/Recycled water – includes recycled and desalination supplies 5. Other Cooperative Supply Opportunities – includes working within and adjoining
IRWM regions in securing urban and non-urban supplies for direct use or banking and exchange using groundwater basins.
Current Urban Water Supply Breakdown by Sub-Region D.2.7.1
As shown in Table D-7 and Figure D-6, approximately two-thirds of the current urban water supply comes from groundwater. Typical for many regions, the dependency on groundwater is a result of using the least cost/best quality water supply alternative. With groundwater elevations continually sliding downward causing increased pumping costs, and with the real threat of sea water intrusion and upwelling of high TDS groundwater requiring expensive treatment, the reduced availability of low cost fresh groundwater supplies is driving the need for looking to supplemental surface water, recycled water, and desalinated water supplies.
Table D-7. Current (2010) Urban Water Supply for Entire IRWM Planning Region Total Water Supply By Sub-Region (AFY) Sub-
Region Totals
Sub Region Groundwater
SWRCB Water Rights
Diversions
Imported Surface Water
ReUse/ Recycled Desalinated
Other Cooperative
Supply Opportunities
North Coast 5,028 3,609 0 300 645 600 10,182 North County 24,093 7,672 66 475 0 1,700 34,006 South County 10,205 11,749 1,735 2,635 0 7,919 34,243
Region Total 39,326 23,030 1,801 3,410 645 10,219 78,431 Source: IRWM Database

San Luis Obispo Integrated Regional Water Management Plan Section D. Water Supply, Demand, and Water Budget
July 2014 D-19 San Luis Obispo County IRWM Region
Groundwater57%
SWRCB Water Rights Diversions
28%
Imported Surface Water3%
ReUse/ Recycled1%
Desalinated0%
Other Cooperative Supply Opportunities
11%
2010 Apportionment of Urban Water Supplies
0
5,000
10,000
15,000
20,000
25,000
30,000
35,000
40,000
Groundwater SWRCB WaterRights
Diversions
ImportedSurface Water
ReUse/Recycled
Desalinated OtherCooperative
SupplyOpportunities
Annu
al A
vera
ge S
uppl
y U
tiliz
atio
n (A
FY)
Water Supply Categories
North Coast
North County
South County
Figure D-6. Urban Water Supply Breakdown by Sub-Region and for Total Region
Urban Water Supply Summary by Water Sector and WPA D.2.7.2
To better represent the urban supply usage, Table D-8 and Table D-9 provide a breakdown in water supplies in the IRWM planning region by WPA and Sub-Region for the years 2010 and 2035. Urban supplies often use a mix of groundwater, surface water, imported water, recycled water and/or desalinated water. Figure D-7 illustrates the change in water supplies between

San Luis Obispo Integrated Regional Water Management Plan Section D. Water Supply, Demand, and Water Budget
San Luis Obispo County IRWM Region D-20 July 2014
2010 and 2035 showing increases in all supply sources with recycled water and desalinated water having the largest percent change.
Table D-8. Water Supplies for 2010 Urban Uses
WPA
Total Water Supply (AFY) by WPA
Totals Groundwater
SWRCB Water Rights
Diversions
Imported Surface Water
ReUse/ Recycled Desalinated
Other Cooperative Supply
Opportunities
North Coast 1.San Simeon 140 - - - - - 140 2.Cambria 673 - - - - - 673 3.Cayucos - 661 - - - - 661 4.Morro Bay 328 2,508 - 200 258 - 3,294 5.Los Osos 2,156 - - - - - 2,156 North Coast Total 3,297 3,169 - 200 258 - 6,924 North County 10.Carrizo - - - - - - - 11.Rafael/Big Spring - - - - - - - 12.Santa Margarita 1,785 22 - - - - 1,807 13.Atascadero/Templeton 12,452 2,250 - 132 - - 14,834 14.Salinas/Estrella 6,898 - 66 - - - 6,964 15.Cholame - - - - - - - 16.Nacimiento - - - - - 1,700 1,700 North County Total 21,135 2,272 66 132 - 1,700 25,305
South County Total 6.San Luis Obispo/Avila 238 11,749 - 151 - 23 12,161 7.South Coast 10,432 - 1,571 76 - 5,379 17,458 8.Huasna Valley - - - - - - - 9.Cuyama Valley - - - - - - - South County Total 10,670 11,749 1,571 227 - 5,402 29,619
IRWM Total Urban 35,102 17,190 1,637 559 258 7,102 61,848 Sources: IRWM Database, 2014
D.3 CURRENT AND FUTURE WATER DEMANDS AND SUPPLIES Having established the baseline of water supplies above, the balance of those supplies are compared against current and future water demands. This water balance is used to recognize where problems are either already occurring or will occur, and if there are data gaps making the balance of supplies and demands not possible unless further study is completed.
Water Demand Data Sources D.3.1
The primary sources of data used to develop the water balance for the San Luis Obispo Planning Region were 2010 Urban Water Management Plans and the 2012 San Luis Obispo County Master Water Report. Additional information was provided by urban water suppliers within the San Luis Obispo Planning Region.

San Luis Obispo Integrated Regional Water Management Plan Section D. Water Supply, Demand, and Water Budget
July 2014 D-21 San Luis Obispo County IRWM Region
Table D-9. Water Supplies for 2035 Urban Uses
WPA
Total Water Supply (AFY) by WPA
Totals Groundwater
SWRCB Water Rights
Diversions
Imported Surface Water
ReUse/ Recycled Desalinated
Other Cooperative Supply
Opportunities
North Coast 1.San Simeon 140 - - - - - 140 2.Cambria 809 - - 100 - 600 1,509 3.Cayucos - 661 - - - - 661 4.Morro Bay 1,923 2,948 - 200 645 - 5,716 5.Los Osos 2,156 - - - - - 2,156 North Coast Total 5,028 3,609 - 300 645 600 10,182 North County 10.Carrizo - - - - - - - 11.Rafael/Big Spring - - - - - - - 12.Santa Margarita 1,785 22 - - - - 1,807 13.Atascadero/Templeton 13,447 2,250 - 475 - - 16,172 14.Salinas/Estrella 8,861 5,400 66 - - - 14,327 15.Cholame - - - - - - - 16.Nacimiento - - - - - 1,700 1,700 North County Total 24,093 7,672 66 475 - 1,700 34,006 South County Total 6.San Luis Obispo/Avila 238 11,749 - 400 - 23 12,410 7.South Coast 9,967 - 1,735 2,235 - 7,896 21,833 8.Huasna Valley - - - - - - - 9.Cuyama Valley - - - - - - - South County Total 10,205 11,749 1,735 2,635 - 7,919 34,243 IRWM Total Urban 39,326 23,030 1,801 3,410 645 10,219 78,431
Sources: IRWM Database, 2014
Figure D-7. Comparison in Urban Water Supply Portfolio 2010 and 2035
0
5,000
10,000
15,000
20,000
25,000
30,000
35,000
40,000
2010
Gro
undw
ater
2035
Gro
undw
ater
2010
SW
RCB
Wat
erRi
ghts
Div
ersio
ns
2035
SW
RCB
Wat
erRi
ghts
Div
ersio
ns
2010
Impo
rted
Surf
ace
Wat
er
2035
Impo
rted
Surf
ace
Wat
er
2010
ReU
se/
Recy
cled
2035
ReU
se/
Recy
cled
2010
Des
alin
ated
2035
Des
alin
ated
2010
Oth
erCo
oper
ativ
e Su
pply
Opp
ortu
nitie
s
2035
Oth
erCo
oper
ativ
e Su
pply
Opp
ortu
nitie
s
Annu
al A
vera
ge U
tiliz
atio
n (A
FY)
Water Supply Categories
North Coast
North County
South County

San Luis Obispo Integrated Regional Water Management Plan Section D. Water Supply, Demand, and Water Budget
San Luis Obispo County IRWM Region D-22 July 2014
2010 Urban Water Management Plans D.3.1.1
Urban Water Management Plans (UWMPs) are prepared by California's urban water suppliers to support their long-term resource planning and ensure adequate water supplies are available to meet existing and future water demands. Every urban water supplier that either provides over 3,000 acre-feet of water annually or serves 3,000 or more connections is required to assess the reliability of its water sources over a 20-year planning horizon considering normal, dry, and multiple dry years. This assessment is included in an urban water supplier’s UWMP, which are prepared every five years and submitted to the Department of Water Resources. The following water suppliers prepared 2010 UWMPs that were used in this analysis (see Section N – Relation to Local Water and Land Use Planning, Table N-1 for list of UWMP and their URLs):
• City of Arroyo Grande • Cambria Community Services District • City of Grover Beach • City of Morro Bay • Nipomo Community Services District • City of Paso Robles • City of Pismo Beach • City of San Luis Obispo
2012 San Luis Obispo Master Water Report D.3.1.2
The Master Water Report (MWR) is a compilation of the current and future water resource management activities being undertaken by various entities within the County and is organized by WPA. The MWR explores how these activities interrelate, analyzes current and future supplies and demands, identifies future water management strategies and ways to optimize existing strategies, and documents the role of the MWR in supporting other water resource planning efforts.
The MWR evaluates and compares the available water supplies (apart from the untreated ocean) to the water demands for the different water planning areas. This was accomplished by reviewing or developing the following:
• Current water supplies and demands based on available information • Forecast water demands and water supplies available in the future under current
land use policies and designations • Criteria under which there is a shortfall when looking at supplies versus demands • Criteria for analyzing potential water resource management strategies, projects,
programs, or policies • Potential water resource management strategies, projects, programs, or policies to
resolve potential supply deficiencies

San Luis Obispo Integrated Regional Water Management Plan Section D. Water Supply, Demand, and Water Budget
July 2014 D-23 San Luis Obispo County IRWM Region
Given the amount of overlap between the MWR and the IRWM Plan, the District is going to manage updates of the information in the MWR as part of the IRWM Plan update process. The IRWM Plan has to update urban water demands based on all of the 2010 UWMPs, which were not available when the MWR was written. Agricultural water demands are also updated from the MWR based on a 2013 updated county survey and groundwater modeling work currently taking place in the Paso Robles groundwater basin (see Figure D-9). Much of the descriptive information has either been brought into the IRWM Plan or is summarized with a reference to the MWR. To adhere to the MWR’s methods of reporting, the water budget tables are kept very close to the same look and content, but the forecast numbers and supply sources have changed. More specifically, each demand source is assigned a supply source regardless of the uncertainty. For instance, in rural cases where the water supply comes from groundwater, groundwater supplies are assigned to equal the demand, even if “Other Groundwater Sources” is the named supply source.
Method for Developing Projected Water Demands D.3.2
The IRWM region demand analysis period starts at the year 2010, corresponding to the most recent Urban Water Management Plans, and extends through 2035; the planning horizon of this IRWM Plan Update. Unlike the MWR, the IRWM analysis does not consider a build-out demand, unless the urban area is truly built-out by 2035. It is important, in this case, to place IRWM projects on a common timeline with the availability of water supplies, and regional statewide projects.
Urban Water Demand D.3.2.1
Figure D-8 provides a mapping of population density by census block to identify urban areas requiring public water service for drinking water and outdoor water use. The Urban /Reserve Boundaries indicate the potential build-out of incorporated cities and communities. Urban water demand refers to residential, commercial, industrial, parks, institutional, and golf course water demand within the unincorporated communities and incorporated cities in the IRWM Region.
For purposes of the IRWM Plan, the urban water demand includes all unincorporated communities and incorporated cities in the County where water purveyors have provided water demand information for the purposes of reporting in the IRWM Plan. As mentioned above, the urban water demand analysis relies heavily on the 2010 UWMPs. Data analysis was completed in five-year estimates, reflecting the information provided by the 2010 UWMPs. Notification was made to all urban water districts not having a UWMP, with some not responding to the data request. In these cases, the MWR is used as the basis assuming the districts are small enough to not change significantly.

San Luis Obispo Integrated Regional Water Management Plan Section D. Water Supply, Demand, and Water Budget
San Luis Obispo County IRWM Region D-24 July 2014
Figure D-8. Map of Urban and Rural Areas
Rural Water Demand D.3.2.2
Rural water demand refers to water demands that are not considered agricultural or urban, and typically supplied through a private well or small water system. The typical land use is small to medium acreage ranchette homes of 5 to 20 acres in size with minimal urban-style landscaping. Since no update of the rural areas was conducted as part of the IRWM Plan Update, the analysis used herein, to determine rural water demands relies wholly on the estimated current and projected MWR demands. For purposes of illustration, the areas shown on Figure D-8 to be of population densities 501 to 2,500 people per square mile are considered to be typical of rural residential zoning.
San Simeon

San Luis Obispo Integrated Regional Water Management Plan Section D. Water Supply, Demand, and Water Budget
July 2014 D-25 San Luis Obispo County IRWM Region
Agricultural Water Demand D.3.2.3
Agricultural water demand (see Figure D-9) refers to the annual applied water in all agricultural areas in the IRWM planning region. The current agricultural water demand was calculated using the same method and crop-specific applied water variables employed by the MWR, which utilized information on crop evapotranspiration, effective rainfall, leaching requirements,
Figure D-9. Agricultural Areas
irrigation efficiency, deficit irrigation, and frost protection. The variables used in the 2012 MWR were reviewed and determined to be the most current values available. The Agricultural/Crop ArcGIS® layer for the San Luis Obispo County from August 2013 was provided to update the 2008 MWR agricultural water use estimates. The seven (7) crop categories presented in the IRWM represent approximately 37 crop types (or Primary Commodities, see Table D-10) with each category’s water demand being based on a calculation of applied water using the crop-specific evapotranspiration, contribution from rain or shallow water table, leaching requirements, irrigation efficiency, and frost protection.

San Luis Obispo Integrated Regional Water Management Plan Section D. Water Supply, Demand, and Water Budget
San Luis Obispo County IRWM Region D-26 July 2014
Table D-10. Crop Group Primary Commodities Seven (7) Crop
Categories Crop Types (Primary Commodities)
Alfalfa • Alfalfa
Nursery • Christmas trees • miscellaneous
nursery plants
• flowers
Pasture • miscellaneous
grasses • mixed pasture
• sod/turf • sudan grass
Citrus
• Avocados • Grapefruits • Lemons
• Oranges • Olives • Kiwis • pomegranates
Deciduous
• Apples • Apricots • Berries • Peaches • Nectarines • Plum
• Figs • Pistachios • Persimmons • Pears • Quince • strawberries
Vegetables
• Artichokes • Beans • miscellaneous
vegetables
• mushrooms • onions • peas • peppers • tomatoes
Vineyard • wine grapes • table grapes
For the Paso Robles groundwater basin, agricultural areas were taken from the recent groundwater modeling effort to ensure consistency of the two ongoing efforts. Replacement of the Paso Basin areas in the county data was done in GIS to create a single agricultural area layer for calculation purposes.
For details on the methodology used for calculating agricultural water demands, see Chapter 4.6.3 of the MWR. For a detailed report on agricultural water demands presented in the IRWM, see Appendix J-1 – Agricultural Water Demand Analysis.
Environmental Demand and Unimpaired Runoff D.3.2.4
Environmental water demand refers to the amount of water needed in an aquatic ecosystem, or released into it, to sustain aquatic habitat and ecosystem processes. The federally threatened south-central California coast steelhead (Oncorhynchus mykiss) was used as the primary indicator species for the development of a reasonable estimation of the amount of water needed to support this species. Mean daily flow values from stream gaging stations representative of long-term, unimpaired (or natural) flow conditions were used to derive unimpaired mean annual discharge (MAD) estimates. The Unimpaired Mean Annual Discharge (UMAD) is estimated to translate the total volume of water yielded from the watershed

San Luis Obispo Integrated Regional Water Management Plan Section D. Water Supply, Demand, and Water Budget
July 2014 D-27 San Luis Obispo County IRWM Region
unimpaired from any impoundments or other regulated flow structures. The Environmental Water Demand and UMAD are calculated for the entire WPA and not for individual streams. These estimates, taken from the MWR, are not available for all WPAs and the calculation of both Environmental and UMAD flow volumes are described fully in the MWR.
Note: Environmental water demands were to be determined based on watershed “snapshots” provided by the County through a consultant contract being completed in parallel with the IRWM Plan Update. Given delays, the environmental demands provided in this section come directly from the MWR, unless updated demands become available prior to the Public Draft.
As noted in the MWR, DWR identified over 1,000 water rights applications and permits for San Luis Obispo County (DWR, 2009b) in 2009. Because many of those water rights are uncertain as to their use and permitted amounts, and for purposes of the MWR analysis, the Environmental and UMAD flow volumes are presented without including an analysis of the 1,000 diversion rights in the IRWM region.
In order to obtain a better understanding of how much surface water is available for aquatic life, the District would need to identify and quantify all diversion rights and instream flow requirements in the watershed. (MWR)
Assumptions D.3.2.5
As in all planning studies where projections are based on what is known today, with an eye towards the future using General and Community plans and various population projections, the goal is to minimize the level of uncertainty to the extent possible given the data available. The three primary planning documents used in this section are the 2007 IRWM plan, the 2012 MWR, and various 2010 UWMPs. To achieve this goal, a number of assumptions are made in the development of the San Luis Obispo Region water demand analysis using these three sources, including the GIS analysis conducted for agricultural demands:
• Existing and projected urban water demand values are obtained from the 2010 UWMPs, if available. If no 2010 UWMP is available, such as in the case of a smaller water district, the water district is notified of the need to update their water demands
• For the purposes of IRWM Plan’s reporting of urban water demands where no UWMP or requested update exists, 2010 is assumed to be the MWR demand labeled as existing, and 2035 is assumed to be the MWR demand labeled as Build-out. Moreover, a straight-line interpolation is used in most cases to obtain the urban demands in five-year intervals, unless information is available to change the assumption on the rate of growth
• Projected 2010 UWMP urban water demand values are assumed to include existing

San Luis Obispo Integrated Regional Water Management Plan Section D. Water Supply, Demand, and Water Budget
San Luis Obispo County IRWM Region D-28 July 2014
and planned conservation measures, including those implemented to meet the California 20x2020 Water Conservation Plan (SBX7-7)
• Where the MWR water demand is used and demands are presented as a range representing conservation and maximum build-out, the average of that range is calculated and used in this analysis
• For rural and agricultural water demands, MWR and GIS updated values, respectively, are used for each WPA, and straight-line interpolation is used in most cases to obtain the demands in five-year intervals
• Agricultural and rural water supplies are approximated based on the area of each groundwater basin underlying the agricultural and rural land uses. Surface water use is estimated based on availability of water rights and assumed areas to utilize surface water for irrigation (e.g., areas not overlying a groundwater basin)
D.4 WATER DEMAND AND SUPPLIES BY SUB-REGION AND WPA Each of the Sub-Regions and WPAs described in Section C – Region Description are included below to represent the forecast summary of water demands and 2035 water budget in the form of a water balance showing demands for urban, rural, and agriculture water uses and available supplies. Environmental water and estimated UMAD are also included to capture each WPA’s full water supply requirements. This information is stored and managed in the Region Description Database (see Section K – Data Management) and the tables produced are exported for each WPA and Sub-Region. For further detailed information on supplies and demands, please refer to the MWR. One significant change from the MWR is the use of actual assumed values where, in some cases, supply amounts are listed as unknown. The purpose is to provide a placeholder that allows for the summation of demands and supplies for a comparison. Estimated values will be the focus of future updates to improve the understanding of a very complex water demand and supply comparison.
This section is organized by Sub-Region, starting with a summary table (Table D-11) and graph (Figure D-10) for the three Sub-Regions of the IRWM region, followed by a summary of the WPAs for each Sub-Region, and ending with detailed information for each WPA at the scale of a water district. More importantly, the collection of water demand and supply information contained below is a reporting of published material, especially the 2012 MWR and 2010 UWMPs included in Section M – Technical Analysis, and a reporting of calculated agricultural demands based upon analysis conducted by crop type for each WPA. No separate unpublished findings of water supply sufficiency are made within this section.

San Luis Obispo Integrated Regional Water Management Plan Section D. Water Supply, Demand, and Water Budget
July 2014 D-29 San Luis Obispo County IRWM Region
Table D-11. IRWM Plan Sub-Region Demand Totals
Sum Urban, Rural, Ag 2010 2015 2020 2025 2030 2035
North Coast 11,354 12,109 12,732 13,366 13,974 15,179 North County 117,909 126,043 134,414 142,760 148,316 154,457 South County 106,282 104,262 99,984 96,477 93,021 89,665
Total for IRWM Region 235,545 242,414 247,130 252,603 255,311 259,301
Figure D-10. IRWM Plan Sub-Region Projected Demand Totals

San Luis Obispo Integrated Regional Water Management Plan Section D. Water Supply, Demand, and Water Budget
San Luis Obispo County IRWM Region D-30 July 2014
-
2,000
4,000
6,000
8,000
10,000
12,000
14,000
16,000
2010 2015 2020 2025 2030 2035
Wat
er D
eman
d (A
FY)
Year
WPA No. 1 - San Simeon
WPA No. 2 - Cambria
WPA No. 3 - Cayucos
WPA No. 4 - Morro Bay
WPA No. 5 - Los Osos
North Coast Sub-Region D.4.1
As listed in Table D-12, the North Coast Sub-Region includes five WPAs (See Figure D-8). Most of the urban water demands stem from small coastal communities reliant on small groundwater basins where the ocean’s salinity influence on fresh groundwater supplies is of critical concern (i.e., see basin descriptions in Section C – Region Description). A small amount of surface water, desalinated water, and recycled water is used in the southern portion of the sub-region. Pockets of rural and agricultural demands are reliant on local groundwater supplies using private wells to meet both irrigation and potable water demands.
Table D-12. North Coast Subregion WPA Annual Average Water Demand Summary (AFY)
Sum Urban, Rural, Ag 2010 2015 2020 2025 2030 2035
WPA No. 1 - San Simeon 169 203 238 271 305 339 WPA No. 2 - Cambria 1,293 1,563 1,768 1,949 2,088 2,581 WPA No. 3 - Cayucos 1,348 1,353 1,360 1,365 1,371 1,376 WPA No. 4 - Morro Bay 4,945 5,039 5,055 5,098 5,157 5,802
WPA No. 5 - Los Osos 5,052 5,113 5,185 5,263 5,342 5,435
Total for Sub-Region 12,807 13,271 13,606 13,946 14,263 15,533
Figure D-11. North Coast WPA Water Demand Summary
WPA 1 – San Simeon D.4.1.1
Water Demands
Water demands for the primary water use sectors are presented in both Figure D-12 and Table D-13. For urban water demands, the San Simeon Community Services District (San Simeon CSD) is the only urban water supplier in WPA 1. With sea water intrusion being a continuous threat to their groundwater supplies, an effort to reduce groundwater demand included San Simeon CSD adopting strict conservation measures and critical ordinances. The first ordinance, passed in 1986, declared the serious water quality problem and issued a building moratorium citing the threat to public health and safety. In 1988, the San Simeon CSD issued a permanent building

San Luis Obispo Integrated Regional Water Management Plan Section D. Water Supply, Demand, and Water Budget
July 2014 D-31 San Luis Obispo County IRWM Region
moratorium which, to this day, is still in place. San Simeon CSD is looking to implement recycled water in the near future to reduce the need for severe rationing in the summer months when both irrigation demands and tourism is at its highest. Urban demands indicated by the CSD in Table D-13 reflect an aggressive growth schedule, in hopes that system improvements and alternative supplies will be perfected and the building moratorium lifted after 25+ years.
The existing annual applied water for agriculture in WPA 1 is approximately 324 AFY. The existing crops in this area include citrus, deciduous, pasture, and vineyards. The projected future annual applied water for WPA 1 decreases significantly to an average of 38 AFY in 2035. The projected future agricultural demand is less than existing, due to increased irrigation efficiencies, fallowing or redevelopment of agricultural lands, and reduced growth of agricultural uses in this area. Agriculture water can provide improved sustainability in groundwater supplies and better overall management of salinity intrusion and tidal influences currently occurring.
According to the MWR, the total UMAD in WPA 1 is approximately 104,490 AFY and environmental water demand is approximately 72,980 AFY.
Demand Supply Balance
Table D-14 indicates a deficit of water supply due to the current restriction of further growth on groundwater. Planned growth indicates a 2035 demand of 250 AFY with only 140 AFY of perennial groundwater supplies. Absent implementation of recharge, recycled water, and desalination projects and programs, the WPA 1 imbalance will continue into the future. Given the DAC status of the community of San Simeon, project formulation and implementation through grant and loan programs are needed to achieve the most cost-effective alternative supply.
Figure D-12. WPA-1 San Simeon Water Demands

San Luis Obispo Integrated Regional Water Management Plan Section D. Water Supply, Demand, and Water Budget
San Luis Obispo County IRWM Region D-32 July 2014
Table D-13. WPA No. 1 - San Simeon Urban Water Demands (AFY)
Urban Water District 2010 2015 2020 2025 2030 2035 Notes
San Simeon CSD 108 136 165 193 222 250 1
Total 108 136 165 193 222 250 Rural Water Demands (AFY)
Rural Areas/Districts 2010 2015 2020 2025 2030 2035 Notes
San Simeon - Rural 20 26 32 38 44 50 2
Total 20 26 32 38 44 50 Agricultural Water Demands (AFY)
Crop Types 2010 2015 2020 2025 2030 2035 Notes
Alfalfa 0 0 0 0 0 0 Citrus 20 17 13 10 6 2 Deciduous 2 2 2 1 1 0 Nursery 0 0 0 0 0 0 Pasture 286 236 186 135 85 34 Vegetable 0 0 0 0 0 0
Vineyard 16 13 10 8 5 2
Total 324 268 211 154 97 38 Total Water Demands (AFY)
Sum Urban, Rural, Ag 2010 2015 2020 2025 2030 2035
Total Water Demand 452 430 408 385 363 338 Environmental Water Demands (AFY)
Environmental Category 2010 2015 2020 2025 2030 2035
Estimated Unimpaired Mean Annual Discharge 72,980 72,980 72,980 72,980 72,980 72,980 2
Estimated Environmental Water Demand 104,490 104,490 104,490 104,490 104,490 104,490 2
Notes:
1 Straight line interpolation between 2010 demand and 2035. 2 Straightline Interpolation 2010 to 2035

July 2014
D-33
San Luis O
bispo County IRWM
Region
San Luis Obispo Integrated Regional W
ater Managem
ent Plan Section D. W
ater Supply, Demand, and W
ater Budget
Table D-14. WPA No. 1 – San Simeon Demand Supply Balance
WPA No. 1 - San Simeon
Water Districts/Use Sectors/Environmental/Unimpaired Summary
San Simeon CSD San Simeon - Agriculture San Simeon - Rural Environmental &
UMAD Total
Urban/Ag/ Rural Water
Demands
Demand (AFY)
Notes Demand (AFY)
Notes Demand (AFY)
Notes Demand (AFY)
Notes Demand (AFY)
Notes
Existing Demands
108 1 324 6 20 6 0 452
Forecasted Demands (2035)
250 2 38 6 50 6 0 338
Water Supply Source
Groundwater
GW Supply (AFY)
GW Supply (AFY)
GW Supply (AFY)
GW Supply (AFY)
GW Supply (AFY)
Pico Creek Valley Basin
140 3 0 3 140
San Carpoforo Valley
0 4 0 7 0
Arroyo de la Cruz Valley
0 14 8 18 8 32
Other GW Supply Sources
0 22 22
Total GW
140 14 40 0 194
Surface Water
SW Supply (AFY)
SW Supply (AFY)
SW Supply (AFY)
SW Supply (AFY)
SW Supply (AFY)
SWRCB-WPA 1
0 5 8 5 10 5 18
Total SW
0 8 10 0 18
Total Supplies
140 21 50 0 211
Balance (Supplies - Demand) -110 -17 0 0 -127
Environmental Water
72,980
Unimpaired Mean Annual Inflow
104,490
Notes:
1 Demands fluctuate between 70 and 140 AFY due to changes in tourism. 2 Extensive conservation program in place. No further conservation expected at build-out by San Simeon CSD.
Most recent master plan forecast a build-out demand of 224 AFY, but San Simeon CSD's current build-out demand estimate is 250 AFY. 3 Estimated safe basin yield of Pico Creek underflow is 120 AFY. 4 No estimates of basin yield exist 5 Diversions from sources other than the three basins noted above total 238 AFY according to diversion reporting forms to the SWRCB from Hearst Holdings Inc.
(June 2010) and the SWRCB diversion database. 6 Agricultural and rural demand calculations do not account for livestock operations and likely underestimates actual water demands. For example Hearst
Holdings Inc. makes up the majority of agriculture/rural land ownership in this WPA and has submitted surface water diversion reporting forms to the SWRCB estimating 1829 AFY of irrigation livestock and domestic usage for their property from surface sources.
7 No estimates of basin yield exist. 8 1,607 AFY of Arroyo De La Cruz Underflow is reported in the State Board diversion database as a permitted appropriative water right for Hearst Holdings Inc.
Estimated safe basin yield is 1,244 AFY and all pumping is for agricultural or rural users.

San Luis Obispo Integrated Regional Water Management Plan Section D. Water Supply, Demand, and Water Budget
San Luis Obispo County IRWM Region D-34 July 2014
WPA 2 – Cambria D.4.1.2
Water Demands
As shown in Table D-15, the Cambria Community Services District (Cambria CSD) is the only urban water supplier in WPA 2. Cambria, along with other nearby water districts is currently in the feasibility stage of implementing recycled water in the local region. Planned implementation of recycled water use will increase potable supplies in summer months when tourism and irrigation demands are at their highest. Similar to San Simeon, Cambria is also under a building moratorium due to insufficient water supplies and infrastructure.
The existing annual applied water for agricultural uses in WPA 2 is approximately 521 AFY. The existing crops in this area include citrus, deciduous, pasture, vegetable, and vineyards. The projected future annual applied water for WPA 2 averages approximately 1,115 AFY. The projected future agricultural demand is higher than existing due to increases in acreage of existing crop groups, especially vegetables and vineyards.
The total UMAD in WPA 2 is approximately 87,050 AFY and environmental water demand is approximately 51,460 AFY.
Demand Supply Balance
Table D-16 indicates a total surplus of water supplies due to forecasted implementation of recycled water and possibly desalinated water by 2035. Absent the addition of new supplies or a groundwater basin management strategy to increase the perennial yield, the existing supplies are insufficient to accommodate the expected growth over the next 20 years as per the Cambria Community Plan.
Figure D-13. WPA 2. Cambria Water Demands
0
500
1,000
1,500
2,000
2,500
2010 2015 2020 2025 2030 2035
Wat
er D
eman
d (A
FY)
Year
Agricultural WaterDemands (AFY)
Rural Water Demands(AFY)
Urban Water Demands(AFY)

San Luis Obispo Integrated Regional Water Management Plan Section D. Water Supply, Demand, and Water Budget
July 2014 D-35 San Luis Obispo County IRWM Region
Table D-15. WPA No. 2 - Cambria Urban Water Demands (AFY)
Urban Water District 2010 2015 2020 2025 2030 2035 Notes
Cambria CSD 673 804 868 909 909 909 1
Total 673 804 868 909 909 909 Rural Water Demands (AFY)
Rural Areas/Districts 2010 2015 2020 2025 2030 2035 Notes
Cambria - Rural 100 121 142 163 184 205 2
Total 100 121 142 163 184 205 Agricultural Water Demands (AFY)
Crop Types 2010 2015 2020 2025 2030 2035 Notes
Alfalfa 0 0 0 0 0 0 Citrus 311 382 453 524 595 666 Deciduous 8 9 11 13 14 16 Nursery 0 0 0 0 0 0 Pasture 23 29 34 39 45 50 Vegetable 148 182 216 249 283 317
Vineyard 31 38 45 52 59 66
Total 521 640 759 877 996 1,115 Total Water Demands (AFY)
Sum Urban, Rural, Ag 2010 2015 2020 2025 2030 2035
Total Water Demand 1,294 1,565 1,769 1,949 2,089 2,229 Environmental Water Demands (AFY)
Environmental Category 2010 2015 2020 2025 2030 2035
Estimated Unimpaired Mean Annual Discharge 51,460 51,460 51,460 51,460 51,460 51,460 Estimated Environmental Water Demand 87,050 87,050 87,050 87,050 87,050 87,050 3 Notes:
1 2012 MWR Future demand given as a range, 1009-1514 AFY. Average of range used for 2035.
2 Straightline Interpolation 2010 to 2035
3 Mean daily flow values from stream gaging stations representative of long-term, unimpaired (or natural) flow conditions were used to derive unimpaired mean annual discharge (MAD) estimates. The unimpaired MAD is the cumulative flow for the creeks within the water planning area that were included in the calculation.

San Luis Obispo County IRW
M Region
D-36
July 2014
San Luis Obispo Integrated Regional W
ater Managem
ent Plan Section D. W
ater Supply, Demand, and W
ater Budget
Table D-16. WPA No. 2 – Cambria Demand Supply Balance
WPA No. 2 - Cambria
Water Districts/Use Sectors/Environmental/Unimpaired Summary
Cambria CSD Cambria - Agriculture Cambria - Rural Environmental &
UMAD Total
Urban/Ag/ Rural Water
Demands
Demand (AFY)
Notes Demand (AFY)
Notes Demand (AFY)
Notes Demand (AFY)
Notes Demand (AFY)
Notes
Existing Demands
673 1 521 100 0 1,294
Forecasted Demands (2035)
909 2 1,115 205 0 2,229
Water Supply Source
Groundwater
GW Supply (AFY)
GW Supply (AFY)
GW Supply (AFY)
GW Supply (AFY)
GW Supply (AFY)
San Simeon Valley
610 3 11 7 2 7 623
Santa Rosa Valley - WPA 2
199 4 301 8 55 8 555
Villa Valley
0 112 9 21 9 132
Other GW Supply Sources
0 691 127 818
Total GW
809 1,115 205 0 2,129
Surface Water
SW Supply (AFY)
SW Supply (AFY)
SW Supply (AFY)
SW Supply (AFY)
SW Supply (AFY)
Other
600 5 600
Recycled Water
100 100
SWRCB-WPA 1
0 6 0
Total SW
700 0 0 0 700
Total Supplies
1,509 1,115 205 0 2,829
Balance (Supplies - Demand) 600 0 0 0 600
Environmental Water
51,460
Unimpaired Mean Annual Inflow
87,050
Notes:
1 Existing Demand = Projected 2015 Water Demand using the 20x2020 interim water use target. 20x2020 target water use was calculated using DWR Method 3. 2 Assumes 20x2020 per capita target water use. 3 State Board allows Cambria CSD 1230 AFY maximum extraction and 370 AF dry season extraction.
California Coastal Commission limits Cambria CSD total diversion from both San Simeon and Santa Rosa Creeks to 1230 AFY 4 State Board allows Cambria CSD 518 AFY maximum extraction and 260 AF dry season extraction.
California Coastal Commission limits Cambria CSD total diversion from both San Simeon and Santa Rosa Creeks to 1230 AFY 5 Alternatives identified in a 2004 Assessment of Long-Term WS Alts included seawater desalination an exchange of buying Nacimiento reservoir water for the
use of water stored in the Whale Rock Reservoir direct transmission of Nacimiento reservoir 6 Diversions do not distinguish type of use. Potentially 158 AFY could be diverted for use to either agriculture or rural residential. 7 Estimated safe basin yield is 1,040 AFY. State Board allows Cambria CSD 1,230 AFY maximum extraction and 370 AF dry season extraction 8 Estimated safe basin yield is 2,260 AFY. State Board allows Cambria CSD 518 AFY maximum extraction and 260 AF dry season extraction. California Coastal
Commission limits Cambria CSD total diversion from both San Simeon and Santa Rosa Creeks to 1,230 AFY 9 Estimated safe basin yield is 1,000 AFY and all pumping is for agricultural or rural users.

San Luis Obispo Integrated Regional Water Management Plan
Section D. Water Supply, Demand, and Water Budget
July 2014 D-37 San Luis Obispo County IRWM Region
0
200
400
600
800
1,000
1,200
1,400
1,600
2010 2015 2020 2025 2030 2035
Wat
er D
eman
d (A
FY)
Year
Agricultural WaterDemands (AFY)
Rural Water Demands(AFY)
Urban Water Demands(AFY)
WPA 3 – Cayucos D.4.1.3
Water Demands
As shown in Table D-17, there are four urban water suppliers in WPA 3: Cayucos Cemetery District, Paso Robles Beach Water Association, Morro Rock Mutual Water Company, and County Service Area 3. Information on these water districts is in Section C – Region Description. The urban water demands for WPA 3 are shown below.
The existing annual applied water for WPA 3 is approximately 547 AFY. The existing crops in this area include citrus, pasture, vegetables, and vineyards. The projected future annual applied water for WPA 3 averages approximately 617 AFY. The projected future agricultural demand is higher than existing due to slight increases in acreage of citrus and vineyards, and a significant increase in vegetables.
For WPA 3, the total UMAD is approximately 33,340 AFY and environmental water demand is approximately 26,160 AFY.
Demand Supply Balance
Table D-18 indicates a reliance on Whale Rock Reservoir and the Nacimiento Water Project (CSA 10) for meeting potable supply needs. Supply sources for agriculture and rural come from local groundwater basins. With a moderate growth rate in all land uses (see Figure D-14), the existing supply sources are shown to meet forecasted water supply demands.
Figure D-14. WPA 3. Cayucos Water Demands

San Luis Obispo Integrated Regional Water Management Plan
Section D. Water Supply, Demand, and Water Budget
San Luis Obispo County IRWM Region D-38 July 2014
Table D-17. WPA No. 3 - Cayucos Urban Water Demands (AFY)
Urban Water District 2010 2015 2020 2025 2030 2035 Notes
Morro Rock Mutual Water Co 121 130 140 150 159 168 1 Paso Robles Beach Water Assn 163 173 183 193 203 212 2 CSA 10A 132 151 170 188 207 226 3
Cayucos Cemetary District 16 16 17 17 17 18 4
Total 432 470 510 548 586 624 Rural Water Demands (AFY)
Rural Areas/Districts 2010 2015 2020 2025 2030 2035 Notes
Cayucos - Rural 80 91 102 113 124 135 5
Total 80 91 102 113 124 135 Agricultural Water Demands (AFY)
Crop Types 2010 2015 2020 2025 2030 2035 Notes
Alfalfa 3 3 3 3 3 3 Citrus 101 104 106 109 111 114 Deciduous 2 2 2 2 2 2 Nursery 0 0 0 0 0 0 Pasture 441 453 464 475 487 498 Vegetable 0 0 0 0 0 0
Vineyard 0 0 0 0 0 0
Total 547 562 575 589 603 617 Total Water Demands (AFY)
Sum Urban, Rural, Ag 2010 2015 2020 2025 2030 2035
Total Water Demand 1,059 1,123 1,187 1,250 1,313 1,376 Environmental Water Demands (AFY)
Environmental Category 2010 2015 2020 2025 2030 2035
Estimated Unimpaired Mean Annual Discharge 26,160 26,160 26,160 26,160 26,160 26,160 5 Estimated Environmental Water Demand 33,340 33,340 33,340 33,340 33,340 33,340 5 Notes:
1 2012 MWR Future demand given as a range, 164-173 AFY. Average of range used for 2035. Straight line interpolation between 2010 demand and the average of the 2035 demand range.
2 2012 MWR Future demand given as a range, 207-218 AFY. Average of range used for 2035. Straight line
interpolation between 2010 demand and the average of the 2035 demand range.
3 2012 MWR Future demand given as a range, 220-232 AFY. Average of range used for 2035. Straight line interpolation between 2010 demand and the average of the 2035 demand range.
4 2012 MWR Future demand given as a range, 17-18 AFY. Average of range used for 2035. Straight line
interpolation between 2010 demand and the average of the 2035 demand range.
5 Straightline Interpolation 2010 to 2035

July 2014
D-39
San Luis O
bispo County IRWM
Region
San Luis Obispo Integrated Regional W
ater Managem
ent Plan Section D. W
ater Supply, Demand, and W
ater Budget
Table D-18. WPA No. 3– Cayucos Demand Supply Balance
WPA No. 3 - Cayucos
Water Districts/Use Sectors/Environmental/Unimpaired Summary
Morro Rock Mutual Water
Co
Paso Robles Beach Water
Assn CSA 10A
Cayucos Cemetery
District
Cayucos - Agriculture
Cayucos - Rural
Environmental & UMAD Total
Urban/Ag/ Rural Water
Demands
Demand (AFY)
Notes Demand (AFY)
Notes Demand (AFY)
Notes Demand (AFY)
Notes Demand (AFY)
Notes Demand (AFY)
Notes Demand (AFY)
Notes Demand (AFY)
Notes
Existing Demands
121 1 163 1 132 1 16 1 547 80 0 1059
Forecasted Demands (2035)
168 1 212 1 226 1 18 1 617 135 0 1,376
Water Supply Source
Groundwater
GW Supply (AFY)
GW Supply (AFY)
GW Supply (AFY)
GW Supply (AFY)
GW Supply (AFY)
GW Supply (AFY)
GW Supply (AFY)
GW Supply (AFY)
Cayucos Valley
0 0 0 49 2 11 2 60
Old Valley
12 3 15
Other GW Supply Sources
555 122 677
Total GW
0 0 0 0 617 135 0 752
Surface Water
SW Supply (AFY)
SW Supply (AFY)
SW Supply (AFY)
SW Supply (AFY)
SW Supply (AFY)
SW Supply (AFY)
SW Supply (AFY)
SW Supply (AFY)
SWRCB - WPA 3
3 3
Whale Rock Reservoir
170 222 190 18 600
Nacimiento Project
58 58
Total SW
173 222 248 18 0 0 0 661
Total Supplies
173 222 248 18 617 135 0 1,413
Balance (Supplies - Demand) 5 10 22 0 0 0 0 37
Environmental Water
26,160
Unimpaired Mean Annual Inflow
33,340
Notes:
1 The Cayucos Area Water Organization includes the Morro Rock MWC, the Paso Robles Beach Water Association, CSA 10A, and the Cayucos Cemetery District. 2 Estimated safe basin yield is 600 AFY and the majority of pumping is for agricultural or rural users but a small public water system does serve a mobile home park.

San Luis Obispo Integrated Regional Water Management Plan Section D. Water Supply, Demand, and Water Budget
San Luis Obispo County IRWM Region D-40 July 2014
WPA 4 – Morro Bay D.4.1.4
Water Demand
As shown in Table D-19, there are five urban water suppliers and users in WPA 4: City of Morro Bay, California Men’s Colony, Camp San Luis Obispo – National Guard, County Operation Center of Education, and Cuesta College. Information on these water districts and water users is in Section C – Region Description. The urban water demands for WPA 4 are shown below:
The existing annual applied water for WPA 4 is approximately 1,923 AFY. The existing crops in this area include alfalfa, citrus, deciduous, irrigated pasture, vegetable, and vineyards. The projected 2035 annual applied water is estimated at approximately 2,065 AFY. The projected future agricultural demand is higher than existing due to increases in acreage of vegetables and vineyards.
The UMAD for WPA 4 is approximately 43,430 AFY and environmental water demand is approximately 27,880 AFY.
Demand Supply Balance
Table D-20 indicates a reliance on groundwater and surface water supplies. In addition, desalinated water use in the City of Morro Bay4 is currently, and in the future, a large source of the region’s water supply to reduce reliance on constrained groundwater aquifers in use by urban, agriculture, and rural sectors.
Figure D-15. WPA 2. Morro Bay Water Demands
4 City of Morro Bay is currently (Feb 2014) going through a re-permitting process for their desalination plant with the California Coastal Commission. <http://www.newtimesslo.com/news/10642/the-run-on-state-water-is-creating-more-problems-for-morro-bay/>

San Luis Obispo Integrated Regional Water Management Plan Section D. Water Supply, Demand, and Water Budget
July 2014 D-41 San Luis Obispo County IRWM Region
Table D-19. WPA No. 4 - Morro Bay Urban Water Demands (AFY)
Urban Water District 2010 2015 2020 2025 2030 2035 Notes
City of Morro Bay 1,255 1,334 1,336 1,364 1,409 2,040 1 California Mens Colony 1,135 1,135 1,135 1,135 1,135 1,135 2 Camp SLO - National Guard 138 138 138 138 138 138 2 County Operation Center of Education 94 94 94 94 94 94 2
Cuesta College 125 125 125 125 125 125 2
Total 2,747 2,826 2,828 2,856 2,901 3,532 Rural Water Demands (AFY)
Rural Areas/Districts 2010 2015 2020 2025 2030 2035 Notes
Morro Bay - Rural 120 137 154 171 188 205 3
Total 120 137 154 171 188 205 Agricultural Water Demands (AFY)
Crop Types 2010 2015 2020 2025 2030 2035 Notes
Alfalfa 27 28 28 29 29 29 Citrus 1,196 1,213 1,231 1,249 1,267 1,284 Deciduous 6 6 6 7 7 7 Nursery 0 0 0 0 0 0 Pasture 19 19 19 20 20 20 Vegetable 613 623 632 641 650 659
Vineyard 62 63 63 64 65 66
Total 1,923 1,952 1,979 2,010 2,038 2,065 Total Water Demands (AFY)
Sum Urban, Rural, Ag 2010 2015 2020 2025 2030 2035
Total Water Demand 4,790 4,915 4,961 5,037 5,127 5,802 Environmental Water Demands (AFY)
Environmental Category 2010 2015 2020 2025 2030 2035
Estimated Unimpaired Mean Annual Discharge 27,880 27,880 27,880 27,880 27,880 27,880 3 Estimated Environmental Water Demand 43,430 43,430 43,430 43,430 43,430 43,430 3
Notes:
1 2012 MWR Future demand given as a range, 164-173 AFY. Average of range used for 2035. Straight line
interpolation between 2010 demand and the average of the 2035 demand range.
2 Assumed demand was held constant between Current (2010) and Future (build-out/2035). 3 Straightline Interpolation 2010 to 2035

San Luis Obispo County IRW
M Region
D-42
July 2014
San Luis Obispo Integrated Regional W
ater Managem
ent Plan Section D. W
ater Supply, Demand, and W
ater Budget
Table D-20. WPA No. 4 – Morro Bay Demand Supply Balance
WPA No. 4 - Morro Bay
Water Districts/Use Sectors/Environmental/Unimpaired Summary
City of Morro Bay
California Mens
Colony
Camp SLO - National
Guard
County Operation
Center of Ed.
Cuesta College
Morro Bay -
Agriculture
Morro Bay - Rural
Environmental & UMAD Total
Urban/Ag/ Rural Water
Demands
Demand (AFY)
Notes Demand (AFY)
Notes Demand (AFY)
Notes Demand (AFY)
Notes Demand (AFY)
Notes Demand (AFY)
Notes Demand (AFY)
Notes Demand (AFY)
Notes Demand (AFY)
Notes
Existing Demands
1,255 1 1,135 7 138 7 94 7 125 7 1,923 120 4,790
Forecasted Demands (2035)
2,040 2 1,135 7 138 7 94 7 125 7 2,065 205 0 5,802
Water Supply Source
Groundwater
GW Supply (AFY)
GW Supply (AFY)
GW Supply (AFY)
GW Supply (AFY)
GW Supply (AFY)
GW Supply (AFY)
GW Supply (AFY)
GW Supply (AFY)
GW Supply (AFY)
Morro Valley
581 3 310 3 31 922
Chorro Valley
1,142 4 200 9 124 4 12 1,478
Other GW Supply Sources
1,631 162 1,793
Total GW
1,723 0 200 0 0 2,065 205 0 4,193
Surface Water
SW Supply (AFY)
SW Supply (AFY)
SW Supply (AFY)
SW Supply (AFY)
SW Supply (AFY)
SW Supply (AFY)
SW Supply (AFY)
SW Supply (AFY)
SW Supply (AFY)
DeSal Plant - Other
645 645
SWRCB - WPA 4
1,313 5 735 150 10 140 10 2,338
Whale Rock Reservoir
0 6 420 25 11 445
Chorro Reservoir
25 140 165
Recycled Water 200 8 200
Total SW
1,958 1,380 140 175 140 0 0 0 3,793
Total Supplies
3,681 1,380 340 175 140 2,065 205 0 7,986
Balance (Supplies - Demand) 1,641 245 202 81 15 0 0 0 2,184
Environmental Water
27,880
Unimpaired Mean Annual Inflow
43,430
Notes:
1 Existing Demand = Projected 2015 Water Demand using the 20x2020 interim water use target. 20x2020 target water use was calculated using DWR Method 3. 2 Assumes 20x2020 per capita target water use. 3 Estimated safe basin yield is 1500 AFY and the groundwater is used by urban agriculture and rural users. 4 Perennial yield estimated at 2210 AFY and the groundwater is used by urban agriculture and rural users. 5 State Water Project average allocation assumed 66 percent of contract water service amount. 6 Mutual aid agreements with CMC and Whale Rock Commission for emergency supply only. 7 Part of Chorro Valley Water System. 8 Must maintain a minimum discharge of 0.75 cfs (0.5mgd 540AFY ) to Chorro Creek. 9 County Well No. 1.
10 CMC receives 60 AFY of Cuesta College 200 AFY allocation. County Operations Center provides up to 275 AFY from their 425 AFY State Water Project allocation to CMC. Totals in table reflect these agreements.
11 25 AFY of Whale Rock water provided by CMC as part of the County Well No. 1 development agreement.

San Luis Obispo Integrated Regional Water Management Plan Section D. Water Supply, Demand, and Water Budget
July 2014 D-43 San Luis Obispo County IRWM Region
WPA 5 – Los Osos D.4.1.5
Water Demand
As shown in Table D-21, there are three urban water suppliers in WPA 5: S & T Mutual Water Company, Los Osos Community Services District, and Golden State Water Company-Los Osos. Information on these water districts and water users is in Section C – Region Description.
The majority of WPA 5 is composed of agricultural and urban areas, with only a small number of parcels in WPA 5 zoned for additional rural development.
The existing annual applied water for WPA 5 is approximately 1,888 AFY. The existing crops in this area include citrus, deciduous, nursery, pasture, vegetable, and vineyards. The projected future annual applied water for WPA 5 averages approximately 3,258 AFY. The increase is due primarily to an increase in irrigated pasture and nursery crops.
The UMAD for WPA 5 is approximately 8,200 AFY and environmental water demand is approximately 7,040 AFY.
Demand Supply Balance
Table D-21 indicates total reliance on local groundwater supplies in the Los Osos Valley.5 Between urban and agriculture uses, demands exceed the existing groundwater supply of 3,200 AFY of perennial yield in the Los Osos Valley basin. The community and surrounding rural and agricultural pumpers are pro-actively managing the groundwater basin to improve yield through active management (i.e., improve recharge), reduced demand and improved water quality. No alternative source of supply has been identified to meet forecasted increases in demand; assuming that new growth will not occur unless sufficiency in supplies can be shown.
Figure D-16. WPA 5. Los Osos Water Demands
5 Given active groundwater and water demand management activities taking place, groundwater supplies are shown to increase, with re-use and improved recharge increasing the effective basin yield in the future.
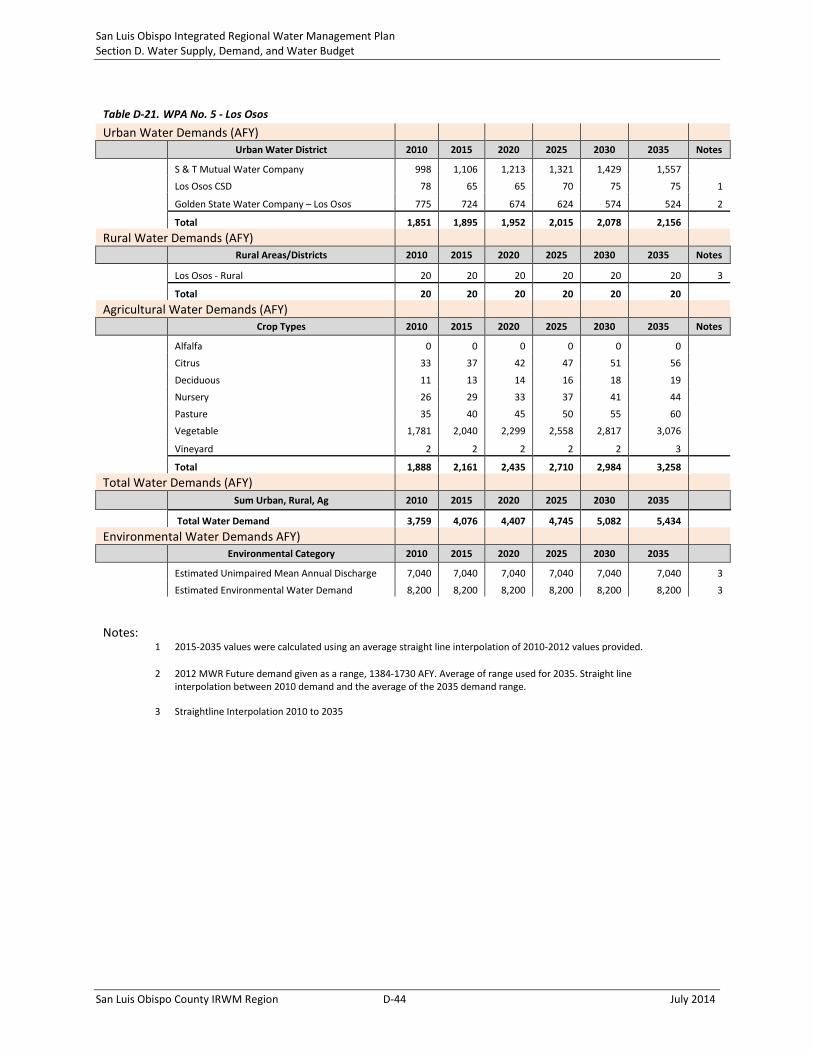
San Luis Obispo Integrated Regional Water Management Plan Section D. Water Supply, Demand, and Water Budget
San Luis Obispo County IRWM Region D-44 July 2014
Table D-21. WPA No. 5 - Los Osos Urban Water Demands (AFY)
Urban Water District 2010 2015 2020 2025 2030 2035 Notes
S & T Mutual Water Company 998 1,106 1,213 1,321 1,429 1,557 Los Osos CSD 78 65 65 70 75 75 1
Golden State Water Company – Los Osos 775 724 674 624 574 524 2
Total 1,851 1,895 1,952 2,015 2,078 2,156 Rural Water Demands (AFY)
Rural Areas/Districts 2010 2015 2020 2025 2030 2035 Notes
Los Osos - Rural 20 20 20 20 20 20 3
Total 20 20 20 20 20 20 Agricultural Water Demands (AFY)
Crop Types 2010 2015 2020 2025 2030 2035 Notes
Alfalfa 0 0 0 0 0 0 Citrus 33 37 42 47 51 56 Deciduous 11 13 14 16 18 19 Nursery 26 29 33 37 41 44 Pasture 35 40 45 50 55 60 Vegetable 1,781 2,040 2,299 2,558 2,817 3,076
Vineyard 2 2 2 2 2 3
Total 1,888 2,161 2,435 2,710 2,984 3,258 Total Water Demands (AFY)
Sum Urban, Rural, Ag 2010 2015 2020 2025 2030 2035
Total Water Demand 3,759 4,076 4,407 4,745 5,082 5,434 Environmental Water Demands AFY)
Environmental Category 2010 2015 2020 2025 2030 2035
Estimated Unimpaired Mean Annual Discharge 7,040 7,040 7,040 7,040 7,040 7,040 3 Estimated Environmental Water Demand 8,200 8,200 8,200 8,200 8,200 8,200 3
Notes:
1 2015-2035 values were calculated using an average straight line interpolation of 2010-2012 values provided.
2 2012 MWR Future demand given as a range, 1384-1730 AFY. Average of range used for 2035. Straight line
interpolation between 2010 demand and the average of the 2035 demand range.
3 Straightline Interpolation 2010 to 2035

July 2014
D-45
San Luis O
bispo County IRWM
Region
San Luis Obispo Integrated Regional W
ater Managem
ent Plan Section D. W
ater Supply, Demand, and W
ater Budget
Table D-22. WPA No. 5 – Los Osos Demand Supply Balance
WPA No. 5 - Los Osos
Water Districts/Use Sectors/Environmental/Unimpaired Summary
Golden State Water
Company – Los Osos
S & T Mutual Water
Company Los Osos CSD Los Osos -
Agriculture Los Osos -
Rural Environmental
& UMAD Total
Urban/Ag/ Rural Water
Demands
Demand (AFY)
Notes Demand (AFY)
Notes Demand (AFY)
Notes Demand (AFY)
Notes Demand (AFY)
Notes Demand (AFY)
Notes Demand (AFY)
Notes
Existing Demands
998 78 775 2 1,888 20 3,759
Forecasted Demands (2035)
1,557 75 524 2 3,258 20 0 5,434
Water Supply Source
Groundwater
GW Supply (AFY)
GW Supply (AFY)
GW Supply (AFY)
GW Supply (AFY)
GW Supply (AFY)
GW Supply (AFY)
GW Supply (AFY)
Los Osos Valley
1,557 1 75 1 524 1 1,271 1 8 1 3,434
San Luis Obispo Valley
33 3 0 33
Other GW Supply Sources
1,955 4 12 1,967
Total GW
1,557 75 524 3,258 20 0 5,434
Surface Water
SW Supply (AFY)
SW Supply (AFY)
SW Supply (AFY)
SW Supply (AFY)
SW Supply (AFY)
SW Supply (AFY)
SW Supply (AFY)
SWRCB - WPA 5
0 0
Total SW
0 0 0 0 0 0 0
Total Supplies
1,557 75 524 3,258 20 0 5,434
Balance (Supplies - Demand)
0
0
0
0
0
0
0
Environmental Water
7,040
Unimpaired Mean Annual Inflow
8,200
Notes:
1 Estimated safe basin yield is 3200 AFY and all pumping is for urban agricultural or rural users. Purveyors have 2100 AFY available for their use. The remaining 1100 AFY is used for agricultural irrigation private domestic use and golf course irrigation.
2 2015-2035 values were calculated using an average straight line interpolation of 2010-2012 values provided.
3 Increased demands are assumed to be met with groundwater supplies. See MWR for local actions being taken to improve the effective groundwater yield in the future. 4 A small area of WPA 5 overlies the San Luis Obispo Valley sub-basin based on location of agricultural land uses.

San Luis Obispo Integrated Regional Water Management Plan Section D. Water Supply, Demand, and Water Budget
San Luis Obispo County IRWM Region D-46 July 2014
-
20,000
40,000
60,000
80,000
100,000
120,000
2010 2015 2020 2025 2030 2035
Wat
er D
eman
d (A
FY)
Year
WPA No. 6 - San Luis Obispo/Avila
WPA No. 7 - South Coast
WPA No. 8 - Huasna Valley
WPA No. 9 - Cuyama Valley
South County Sub-Region D.4.2
As listed in Table D-23, the South County Sub-Region includes four WPAs (See Figure D-17). Most of the urban water demands coastal communities reliant on groundwater basins constrained by both the ocean’s salinity and by the long term impacts of septic systems. With use of local and SWP surface water supplies, active groundwater management, and agricultural fallowing and development, sufficient supplies are shown to meet the majority of future growth projections. A small amount of recycled water is also used to meet a portion of the sub-region non-potable demands. Pockets of rural and agricultural demands are reliant on local groundwater supplies using private wells to meet both irrigation and potable water demands. Southern WPAs have no urban demands, and supply source are primarily groundwater with little knowledge of the amount of water rights being diverted for agriculture.
Table D-23. South County WPA Annual Average Water Demand Summary (AFY)
Sum Urban, Rural, Ag 2010 2015 2020 2025 2030 2035 WPA No. 6 - San Luis Obispo/Avila 10,362 11,065 11,449 11,794 12,178 12,551 WPA No. 7 - South Coast 63,179 60,567 56,018 52,274 48,547 44,927 WPA No. 8 - Huasna Valley 1,548 1,807 2,065 2,327 2,585 2,845 WPA No. 9 - Cuyama Valley 30,724 30,380 30,035 29,691 29,347 29,003 Total for Sub-Region 105,813 103,819 99,567 96,086 92,657 89,326
Figure D-17. South County WPA Water Demand Summary
WPA 6 – San Luis Obispo/Avila D.4.2.1
Water Demands
There are seven urban water suppliers and users in WPA 6: City of San Luis Obispo, Cal Poly San Luis Obispo, Avila Beach Community Services District, Avila Valley Mutual Water Company, San

San Luis Obispo Integrated Regional Water Management Plan Section D. Water Supply, Demand, and Water Budget
July 2014 D-47 San Luis Obispo County IRWM Region
Miguelito Mutual Water Company, County Service Area 12, and Port San Luis. Information on these water districts and water users is in Section C – Region Description.
The existing annual applied water for WPA 6 is approximately 3,195 AFY. The existing crops in this area include citrus, deciduous, pasture, vegetable, and vineyards. The projected future annual applied water for WPA 6 increases gradually to a 2035 demand of 3,466 AFY. Increases in applied water are primarily due to a projected increase in vegetable crops.
The UMAD for WPA 6 is approximately 45,820 AFY and environmental water demand is approximately 33,030 AFY.
Demand Supply Balance
The urban water providers depend on primarily surface water from the SWP, Nacimiento Project, Salinas Reservoir and Whale Rock Reservoir. Local groundwater supplies are the primary source of supply for agriculture and rural users. Given the current surface water contracts and water rights, supplies are sufficient to meet projected water demands. The regionalization of water conveyance facilities ensures the maximum conjunctive use potential for the region to better manage groundwater quantity and quality in 2035.
Figure D-18. WPA-6 San Luis Obispo/Avila Water Demands

San Luis Obispo Integrated Regional Water Management Plan Section D. Water Supply, Demand, and Water Budget
San Luis Obispo County IRWM Region D-48 July 2014
Table D-24. WPA No. 6 - San Luis Obispo/Avila Urban Water Demands (AFY)
Urban Water District 2010 2015 2020 2025 2030 2035 Notes
City of San Luis Obispo 5,218 5,689 5,843 5,956 6,109 6,251 1 Cal Poly San Luis Obispo 1,040 1,136 1,231 1,327 1,422 1,518 2 Avila Beach CSD 51 74 97 120 143 166 3 Avila Valley Mutual Water Co 32 32 32 31 31 31 4 San Miguelito MWC 263 287 311 335 359 383 5 CSA 12 68 68 67 67 67 66 6
Port San Luis 35 35 35 35 35 35 6
Total 6,707 7,321 7,616 7,871 8,166 8,450 Rural Water Demands (AFY)
Rural Areas/Districts 2010 2015 2020 2025 2030 2035 Notes
San Luis Obispo/Avila - Rural 460 495 530 565 600 635 7
Total 460 495 530 565 600 635 Agricultural Water Demands (AFY)
Crop Types 2010 2015 2020 2025 2030 2035 Notes
Alfalfa 0 0 0 0 0 0 Citrus 359 365 371 377 383 389 Deciduous 475 483 491 499 507 515 Nursery 0 0 0 0 0 0 Pasture 235 239 243 247 251 255 Vegetable 1,114 1,133 1,152 1,171 1,190 1,209
Vineyard 1,012 1,029 1,046 1,064 1,081 1,098
Total 3,195 3,249 3,303 3,358 3,412 3,466 Total Water Demands (AFY)
Sum Urban, Rural, Ag 2010 2015 2020 2025 2030 2035
Total Water Demand 10,362 11,065 11,449 11,794 12,178 12,551 Environmental Water Demands (AFY)
Environmental Category 2010 2015 2020 2025 2030 2035
Estimated Unimpaired Mean Annual Discharge 33,030 33,030 33,030 33,030 33,030 33,030 Estimated Environmental Water Demand 45,820 45,820 45,820 45,820 45,820 45,820
Notes:
1 Straightline Interpolation 2010 to 2039
2 2012 MWR Future demand given as a range, 1479-1557 AFY. Average of range used for 2035. Straight line interpolation between 2010 demand and the average of the 2035 demand range.
3 2012 MWR Future demand given as a range, 162-170 AFY. Average of range used for 2035. Straight line interpolation between 2010 demand and the average of the 2035 demand range.
4 2012 MWR Future demand given as a range, 30-32 AFY. Average of range used for 2035. Straight line interpolation between 2010 demand and the average of the 2035 demand range.
5 2012 MWR Future demand given as a range, 373-393 AFY. Average of range used for 2035. Straight line interpolation between 2010 demand and the average of the 2035 demand range.
6 2012 MWR Future demand given as a range, 65-68 AFY. Average of range used for 2035. Straight line interpolation between 2010 demand and the average of the 2035 demand range.
7 Straightline Interpolation 2010 to 2040

July 2014
D-49
San Luis Obispo County IRW
M Region
San Luis Obispo Integrated Regional W
ater Managem
ent Plan Section D. W
ater Supply, Demand, and W
ater Budget
Table D-25. WPA No. 6 – San Luis Obispo/Avila Demand Supply Balance
WPA No. 6 - San Luis Obispo/Avila
Water Districts/Use Sectors/Environmental/ Unimpaired Summary
City of San Luis Obispo
Cal Poly San Luis Obispo
Avila Beach CSD
Avila Valley
Mutual Water Co
San Miguelito
MWC CSA 12
Port San Luis
San Luis Obispo/ Avila -
Agriculture
San Luis Obispo/Avila
- Rural
Environ-mental &
UMAD Total
Urban/ Ag/ Rural
Water Demands
Demand (AFY)
Notes Demand (AFY)
Notes Demand (AFY)
Demand (AFY)
Notes Demand (AFY) Demand
(AFY) Notes Demand
(AFY) Demand (AFY) Demand (AFY) Demand (AFY) Demand (AFY)
Existing Demands
5,218 1 1,040 51 32 7 263 68 35 3,195 460 10,362 Forecasted Demands (2035)
6,251 2 1,518 166 31 383 66 35 3,466 635 0 12,552
Water Supply Source
Groundwater
GW Supply (AFY)
GW Supply (AFY)
GW Supply (AFY)
GW Supply (AFY)
GW Supply (AFY)
GW Supply (AFY)
GW Supply (AFY)
GW Supply (AFY)
GW Supply (AFY)
GW Supply (AFY)
GW Supply (AFY)
San Luis Valley Sub-basin
100
0
970 178 1,248
Avila Valley Sub-basin
20 118 0 8 0 138 Other GW Supply Sources
2,496 457 2,953
Total GW
100 0 0 20 118 0 0 3,466 635 0 4,339
Surface Water
SW Supply (AFY)
SW Supply (AFY)
SW Supply (AFY)
SW Supply (AFY)
SW Supply (AFY)
SW Supply (AFY)
SW Supply (AFY)
SW Supply (AFY)
SW Supply (AFY)
SW Supply (AFY)
SW Supply (AFY)
Loss of Availability Due to Siltation
-500
-500 Nacimiento Project
3,380 3 0 3,380
Recycled Water
400 4 400 Salinas Reservoir
3,470 5 3,470
Whale Rock Reservoir
3,470 5 1,384 6 4,854 SWRCB - WPA 6
45 45
Lopez Lake
68 12 61 100 241 SWP - WPA 6
275 7 9 282
Total SW
10,220 1,429 68 12 275 68 100 0 0 0 12,172
Total Supplies
10,320 1,429 68 32 393 68 100 3,466 635 0 16,511
Balance (Supplies - Demand)
4,069
-89
-98 1
10 2
65 0 0 0 3,960
Environmental Water
33,030
Unimpaired Mean Annual Inflow
45,820

San Luis Obispo County IRW
M Region
D-50
July 2014
San Luis Obispo Integrated Regional W
ater Managem
ent Plan Section D. W
ater Supply, Demand, and W
ater Budget
Notes:
1 Existing Demand = Projected 2015 Water Demand using the 20x2020 interim water use target. 20x2020 target water use was calculated using DWR Method 3. 2 Assumes 20x2020 per capita target water use. 3 Nacimiento Project went on-line in 2010 4 The City's current recycled water use is 130 AFY. Expansion of the City of San Luis Obispo Water Reclamation Facility could make 4690 AFY of recycled water available for use but the
current plans are to use only 1000 AFY in the future. 5 The City of San Luis Obispo's withdrawals from the Salinas Reservoir are coordinated with Whale Rock Reservoir. San Luis Obispo's combined safe yield of the two reservoirs was 6940 AFY
in 2010. 6 Includes 600 AFY of treated water delivered from the City of San Luis Obispo. 7 2012 MWR 8 Individual water users within CSA 12 boundary could request an exemption to install a private well and pump water from the Avila Valley Sub-basin. It is unknown the number of users with
private wells but it is likely minimal. 9 7 AFY of SWP water allocated to the San Luis Coastal Unified School District.

`San Luis Obispo Integrated Regional Water Management Plan Section D. Water Supply, Demand, and Water Budget
July 2014 D-51 San Luis Obispo County IRWM Region
0
10,000
20,000
30,000
40,000
50,000
60,000
70,000
2010 2015 2020 2025 2030 2035
Wat
er D
eman
d (A
FY)
Year
Agricultural WaterDemands (AFY)
Rural Water Demands(AFY)
Urban Water Demands(AFY)
WPA 7 – South Coast D.4.2.2
Water Demands
There are ten urban water suppliers and users in WPA 7: Conoco Phillips Company, City of Arroyo Grande, City of Grover Beach, Oceano Community Services District, City of Pismo Beach, Golden State Water Company – Nipomo, Golden State Water Company – Edna, Nipomo Community Services District, Rural Water Company, and Woodlands Mutual Water Company. Information on these water districts and water users is in Section C - Region Description.
The existing rural demand for WPA 7 is 3,466 AFY and the average projected demand is 5,661 AFY. The existing annual applied water for agricultural lands within WPA 7 is estimated at 45,746 AFY, which supports citrus, deciduous, nursery, pasture, vegetable and vineyard crops. The projected future agricultural demand decreases to 20,222 AFY due to the significant decrease in vegetable crops. The 25,524 AFY decrease in agriculture is offset by the urban (increase of 5,000 AFY) and rural residential (increase of 2,200 AFY) areas.
The UMAD for WPA 7, inclusive of the water management areas, is approximately 49,100 AFY and environmental water demand of 32,960 AFY.
Demand Supply Balance
With a significant reliance on both surface water and groundwater, WPA 7 can meet its forecasted water demands through agricultural off-sets, surface water transfers, recycled water and expanded surface water and groundwater facilities. Groundwater is constrained in the region both in quantity and quality, and requires management efforts to increase its effective yield in providing for the region. See MWR for a full detailed description of the region’s water supply portfolio.
Figure D-19. WPA-7 South Coast Water Demands

San Luis Obispo Integrated Regional Water Management Plan Section D. Water Supply, Demand, and Water Budget
San Luis Obispo County IRWM Region D-52 July 2014
Table D-26. WPA No. 7 - South Coast Urban Water Demands (AFY)
Urban Water District 2010 2015 2020 2025 2030 2035 Notes
Golden State Water Company – Edna 410 410 411 412 412 458 1 City of Pismo Beach 1,944 2,036 2,002 2,182 2,364 2,550 1 City of Arroyo Grande 2,956 3,288 2,987 3,089 3,176 3,318 2 City of Grover Beach 1,605 1,781 1,634 1,669 1,703 1,755 2 Oceano CSD 855 954 1,052 1,151 1,249 1,348 3 Golden State Water Company – Nipomo 1,060 1,217 1,375 1,532 1,690 1,847 4 Nipomo CSD 2,367 3,404 3,588 3,775 3,995 4,198 2 Rural Water Company/Cypress Ridge Sewer Co 720 720 720 720 720 720 5 Woodlands Mutual Water Company 850 984 1,118 1,252 1,386 1,520 6
Conoco Phillips Co 1,200 1,226 1,252 1,278 1,304 1,330 7
Total 13,967 16,020 16,139 17,060 17,999 19,044 Rural Water Demands (AFY)
Rural Areas/Districts 2010 2015 2020 2025 2030 2035 Notes
South Coast - Rural 3,466 3,905 4,344 4,783 5,222 5,661 8
Total 3,466 3,905 4,344 4,783 5,222 5,661 Agricultural Water Demands (AFY)
Crop Types 2010 2015 2020 2025 2030 2035 Notes
Alfalfa 0 0 0 0 0 0 Citrus 7,614 6,765 5,915 5,065 4,216 3,366 Deciduous 4,701 4,176 3,651 3,127 2,602 2,078 Nursery 655 582 508 435 362 289 Pasture 725 644 563 483 402 321 Vegetable 29,263 25,998 22,732 19,467 16,201 12,936
Vineyard 2,788 2,477 2,166 1,854 1,543 1,232
Total 45,746 40,642 35,535 30,431 25,326 20,222 Total Water Demands (AFY)
Sum Urban, Rural, Ag 2010 2015 2020 2025 2030 2035
Total Water Demand 63,179 60,567 56,018 52,274 48,547 44,927 Environmental Water Demands (AFY)
Environmental Category 2010 2015 2020 2025 2030 2035
Estimated Unimpaired Mean Annual Discharge 32,960 32,960 32,960 32,960 32,960 32,960 Estimated Environmental Water Demand 49,100 49,100 49,100 49,100 49,100 49,100
Notes: 1 2012 MWR Future demand given as a range, 434-482 AFY. Average of range used for 2035. Straight line interpolation between 2010 demand and the average of the 2035 demand range.
2 2035 demand calculated using straight line interpolation from 2020 and 2030 given demands. 3 2012 MWR Future demand given as a range, 1277-1419 AFY. Average of range used for 2035. Straight line
interpolation between 2010 demand and the average of the 2035 demand range. 4 2012 MWR Future demand given as a range, 1750-1944 AFY. Average of range used for 2035. Straight line
interpolation between 2010 demand and the average of the 2035 demand range. 5 Future (Build-out/2035) demand not available; calculations not performed. 6 2012 MWR Future demand given as a range, 1440-1600 AFY. Average of range used for 2035. Straight line
interpolation between 2010 demand and the average of the 2035 demand range. 7 2012 MWR Future demand given as a range, 1260-1400 AFY. Average of range used for 2035. Straight line
interpolation between 2010 demand and the average of the 2035 demand range. 8 Straightline Interpolation 2010 to 2035

July 2014
D-53
San Luis Obispo County IRW
M Region
San Luis Obispo Integrated Regional W
ater Managem
ent Plan Section D. W
ater Supply, Demand, and W
ater Budget
Table D-27. WPA No. 7 – South Coast Demand Supply Balance
WPA No. 7 - South Coast
Water Districts/Use Sectors/Environmental/ Unimpaired Summary
Golden State Water
Company – Edna
City of Pismo Beach
City of Arroyo Grande
City of Grover Beach
Oceano CSD
Golden State Water
Company – Nipomo
Nipomo CSD
Rural Water Company/Cypress Ridge Sewer Co
Woodlands Mutual Water
Company
Conoco Phillips
Co
South Coast - Agricult
ure
South Coast - Rural
Environ-mental &
UMAD Total
Urban/Ag/ Rural Water
Demands
Demand (AFY) N
otes
Demand (AFY) N
otes
Demand (AFY) N
otes
Demand (AFY) N
otes
Demand (AFY) N
otes
Demand (AFY) N
otes
Demand (AFY) N
otes
Demand (AFY) N
otes
Demand (AFY) N
otes
Demand (AFY)
Demand (AFY)
Demand (AFY)
Demand (AFY)
Demand (AFY)
Existing Demands
410 1 1,944 2,956 5 1,605 7 855 9 1,060 1 2,367 7 720 12 850 1 1,200 45,746 3,466 63,179 Forecasted Demands (2035)
458 1 2,550 3 3,318 6 1,755 3 1,348 1,847 4,198 3 720 13 1,520 1,330 20,222 5,661 0 44,927
Water Supply Source
Groundwater
GW Supply (AFY)
GW Supply (AFY)
GW Supply (AFY)
GW Supply (AFY)
GW Supply (AFY)
GW Supply (AFY)
GW Supply (AFY)
GW Supply (AFY)
GW Supply (AFY)
GW Supply (AFY)
GW Supply (AFY)
GW Supply (AFY)
GW Supply (AFY)
GW Supply (AFY)
Edna Valley
482 2 482 Northern Cities Management Area
700
700
Pismo Creek Valley (outside NCMA)
160
160
Arroyo Grande Plain (Part of Santa Maria Valley Basin)
1,323
1,423
8
900
3,646 Nipomo Mesa Hyd Sub-Area-Santa Maria Basin
852
1,448
462
817
1,400 4,979 San Luis Obispo Valley
809 226 1,035
Santa Maria Valley 7,482 2,095 9,577
Other GW Supply Sources 11,931 3,340 15,271
Total GW
482 700 1,483 1,423 900 852 1,448 462 817 1,400 20,222 5,661 0 35,850
Surface Water
SW Supply (AFY)
SW Supply (AFY)
SW Supply (AFY)
SW Supply (AFY)
SW Supply (AFY)
SW Supply (AFY)
SW Supply (AFY)
SW Supply (AFY)
SW Supply (AFY)
SW Supply (AFY)
SW Supply (AFY)
SW Supply (AFY)
SW Supply (AFY)
SW Supply (AFY)
Lopez Lake 896 2,290 800 303 4,289
Recycled Water 1,985 50 200 16 2,235

San Luis Obispo County IRW
M Region
D-54
July 2014
San Luis Obispo Integrated Regional W
ater Managem
ent Plan Section D. W
ater Supply, Demand, and W
ater Budget
WPA No. 7 - South Coast
Water Districts/Use Sectors/Environmental/ Unimpaired Summary
Golden State Water
Company – Edna
City of Pismo Beach
City of Arroyo Grande
City of Grover Beach
Oceano CSD
Golden State Water
Company – Nipomo
Nipomo CSD
Rural Water Company/Cypress Ridge Sewer Co
Woodlands Mutual Water
Company
Conoco Phillips
Co
South Coast - Agricult
ure
South Coast - Rural
Environ-mental &
UMAD Total
SWP - WPA 7 1,240 4 495 10 1,735
Ag Land Conversion Credit 112 14 209 14 321
In-Region Transfer 100 11
100
Transfers - WPA 7 -100 11 -100
Nipomo Supplemental Water Project
208
15
2,167
15
208
15
703
15
3,286 Total SW
0 4,121 2,502 1,009 698 208 2,167 258 903 0 0 0 0 11,866
Total Supplies
482 4,821 3,985 2,432 1,598 1,060 3,615 720 1,720 1,400 20,222 5,661 0 47,716
Balance (Supplies - Demand)
24
2,271
667
677
250
-787
-583
0
200
70 0 0 0 2,789
Environmental Water
32,960
Unimpaired Mean Annual Inflow
49,100
Notes:
1 2012 MWR 2 Edna Valley Sub-basin estimated safe basin yield is 4000 AFY and all pumping is for urban agricultural rural users golf courses and CSA 18. 3 Assumes 20x2020 per capita target water use. 4 140 AFY of the 1240 AFY contracted amount has been allocated for Pismo Ranch. 5 20x2020 target water use was calculated using DWR Method 1. 6 Provided by City of Arroyo Grande 7 Existing Demand = Projected 2015 Water Demand using the 20x2020 interim water use target. 20x2020 target water use was calculated using DWR Method 4. 8 Non-potable groundwater pumped from irrigation wells used on the State Parks Department golf course and a City park. The portion of the 225 AFY attributed to the golf course predates the
Gentlemen's Agreement. 9 Ten percent additional water conservation (beyond what has already been accomplished) assumed for the low end of the forecast build-out demand, except for Grover Beach, which assumed
20% additional reduction. 10 Oceano CSD has a 750 AFY allocation but no drought buffer. Therefore the 66 percent assumption for State Water Project delivery is 495 AFY. 11 Arroyo Grande has an active agreement to purchase 100 AFY of Oceano CSD supplies from groundwater or Lopez Lake water. This temporary agreement ends in 2014. 12 Existing demand = 2010 demand. Currently there are over 100 lots within the service area that could request water service, plus other potential requests for service 13 2015 Demand 14 2002 Settlement Agreement provides that groundwater allocations can be increased when land within the incorporated boundaries is converted from agricultural uses to urban uses. 15 Nipomo supplemental water project includes Nipomo CSD, Woodlands MWC, Golden State Water Company, and Rural Water Company. Nipomo CSD will receive approximately 1,667 AFY and
has reserved an additional 500 AFY. The other three will receive 833 AFY. 16 All effluent is currently reused at the Monarch Dunes Golf Course and capacity remains to reuse more effluent at the course as flows to the plant increase.

San Luis Obispo Integrated Regional Water Management Plan Section D. Water Supply, Demand, and Water Budget
July 2014 D-55 San Luis Obispo County IRWM Region
0
500
1,000
1,500
2,000
2,500
3,000
2010 2015 2020 2025 2030 2035
Wat
er D
eman
d (A
FY)
Year
Agricultural WaterDemands (AFY)
Rural Water Demands(AFY)
Urban Water Demands(AFY)
WPA 8 – Huasana Valley D.4.2.3
Water Demand
There are no large population centers in WPA 8.
For WPA 8, the existing annual rural water demand is 90 AFY and the projected future demand is 405 AFY. The existing annual applied water for WPA 8 is approximately 1,458 AFY. The existing crops in this area include alfalfa, citrus, deciduous, pasture, vegetables, and vineyards. The projected future annual applied water for WPA 8 averages 2,440 AFY. The projected future agricultural demand is higher than existing due to increases in acreage of nursery, pasture, and vineyards.
The UMAD for WPA 8 inclusive of the water management areas is approximately 34,220 AFY and environmental water demand of 25,020 AFY.
Demand Supply Balance
The water supply sources for this WPA include the Santa Maria and Huasna Valley groundwater basins, other groundwater supply sources, and unquantified State Board water diversions. With no urban land uses, and the uncertainty of existing water rights and use of surface water supplies, groundwater is shown to meet demands to the extent sufficiency in all supplies can be achieved in the future.
Figure D-20. WPA-8 Huasna Valley Water Demands

San Luis Obispo Integrated Regional Water Management Plan Section D. Water Supply, Demand, and Water Budget
San Luis Obispo County IRWM Region D-56 July 2014
Table D-28. WPA No. 8 - Huasna Valley Urban Water Demands (AFY)
Urban Water District 2010 2015 2020 2025 2030 2035 Notes
Rural Water Demands (AFY)
Rural Areas/Districts 2010 2015 2020 2025 2030 2035 Notes
Huasna Valley - Rural 90 153 216 279 342 405 1
Total 90 153 216 279 342 405 Agricultural Water Demands (AFY)
Crop Types 2010 2015 2020 2025 2030 2035 Notes
Nursery 202 229 256 284 311 338 Pasture 183 208 232 257 282 306 Vegetable 13 14 16 18 19 21 Vineyard 0 0 0 0 0 0 Alfalfa 18 20 22 25 27 30 Citrus 135 153 171 189 207 225
Deciduous 907 1,030 1,152 1,275 1,397 1,520
Total 1,458 1,654 1,849 2,048 2,243 2,440 Total Water Demands (AFY)
Sum Urban, Rural, Ag 2010 2015 2020 2025 2030 2035
Total Water Demand 1,548 1,807 2,065 2,327 2,585 2,845 Environmental Water Demands (AFY)
Environmental Category 2010 2015 2020 2025 2030 2035
Estimated Unimpaired Mean Annual Discharge 25,020 25,020 25,020 25,020 25,020 25,020 Estimated Environmental Water Demand 34,220 34,220 34,220 34,220 34,220 34,220
Notes:
1 Straightline Interpolation 2010 to 2042

San Luis Obispo Integrated Regional Water Management Plan Section D. Water Supply, Demand, and Water Budget
July 2014 D-57 San Luis Obispo County IRWM Region
Table D-29. WPA No. 8 - Huasna Valley Demand Supply Balance
WPA No. 8 - Huasna Valley
Water Districts/Use Sectors/Environmental/Unimpaired Summary
Huasna Valley - Agriculture
Huasna Valley - Rural
Environmental & UMAD Total
Urban/Ag/ Rural Water
Demands
Demand (AFY)
Notes Demand (AFY)
Notes Demand (AFY)
Notes Demand (AFY)
Notes
Existing Demands
1,458 90 1,548
Forecasted Demands (2035)
2,440 405 0 2,845
Water Supply Source
Groundwater
GW Supply (AFY)
GW Supply (AFY)
GW Supply (AFY)
GW Supply (AFY)
Santa Maria Valley
488 81 569
Huasna Valley
122 20 142
Other GW Supply Sources
1,830 304 2,134
Total GW
2,440 405 0 2,845
Surface Water
SW Supply (AFY)
SW Supply (AFY)
SW Supply (AFY)
SW Supply (AFY)
SWRCB - WPA 7
0 0
Total SW
0 0 0 0
Total Supplies
2,440 405 0 2,845
Balance (Supplies - Demand)
0
0
0
0
Environmental Water
25,020
Unimpaired Mean Annual Inflow
34,220

San Luis Obispo Integrated Regional Water Management Plan Section D. Water Supply, Demand, and Water Budget
San Luis Obispo County IRWM Region D-58 July 2014
0
5,000
10,000
15,000
20,000
25,000
30,000
35,000
2010 2015 2020 2025 2030 2035
Wat
er D
eman
d (A
FY)
Year
Agricultural WaterDemands (AFY)
Rural Water Demands(AFY)
Urban Water Demands(AFY)
WPA 9 – Cuyama Valley D.4.2.4
Water Demand
There are no large population centers in WPA 9 that lie within San Luis Obispo County. The communities of Cuyama and New Cuyama both lie within Santa Barbara County.
For WPA 9, the existing annual rural water demand is 10 AFY and the average projected future demand is 180 AFY. The existing annual applied water for WPA 9 is approximately 30,714 AFY. The existing crops in this area include alfalfa, deciduous, vegetables, and vineyards. The projected future annual applied water for WPA 9 is shown to decrease to 28,823 AFY as a result of a reduction in vegetable crops.
The eastern portion of the County (i.e., WPAs 9, 10, 11, 14, and 15) was ultimately excluded from the environmental water demand analysis due to the lack of data and regional physiographic differences. No environmental flows are included for this WPA.
Supply Demand Balance
The water supply sources for this WPA include the Cuyama Valley Groundwater Basin, other groundwater supply sources, and unquantified State Board water diversions. With no urban land uses, and the uncertainty of existing water rights and use of surface water supplies, groundwater is shown to meet demands to the extent sufficiency in all supplies can be achieved in the future.
Figure D-21. WPA-9 – Cuyama Water Demands

San Luis Obispo Integrated Regional Water Management Plan Section D. Water Supply, Demand, and Water Budget
July 2014 D-59 San Luis Obispo County IRWM Region
Table D-30. WPA No. 9 - Cuyama Valley Urban Water Demands (AFY)
Urban Water District 2010 2015 2020 2025 2030 2035 Notes
Rural Water Demands (AFY)
Rural Areas/Districts 2010 2015 2020 2025 2030 2035 Notes
Cuyama Valley - Rural 10 44 78 112 146 180 1
Total 10 44 78 112 146 180 Agricultural Water Demands (AFY)
Crop Types 2010 2015 2020 2025 2030 2035 Notes
Alfalfa 2,428 2,398 2,368 2,338 2,308 2,278 Citrus 0 0 0 0 0 0 Deciduous 172 170 167 165 163 161 Nursery 0 0 0 0 0 0 Pasture 0 0 0 0 0 0 Vegetable 28,114 27,768 27,422 27,076 26,730 26,384
Vineyard 0 0 0 0 0 0
Total 30,714 30,336 29,957 29,579 29,201 28,823 Total Water Demands (AFY)
Sum Urban, Rural, Ag 2010 2015 2020 2025 2030 2035
Total Water Demand 30,724 30,380 30,035 29,691 29,347 29,003 Environmental Water Demands (AFY)
Environmental Category 2010 2015 2020 2025 2030 2035
Estimated Unimpaired Mean Annual Discharge 0 0 0 0 0 0 2 Estimated Environmental Water Demand 0 0 0 0 0 0 3
Notes:
1 Straightline Interpolation 2010 to 2043
2 Straightline Interpolation 2010 to 2042
3 The eastern portion of the County (i.e., WPAs 9, 10, 11, 14, and 15) was ultimately excluded from the
environmental water demand analysis due to the lack of data and regional physiographic differences.

San Luis Obispo Integrated Regional Water Management Plan Section D. Water Supply, Demand, and Water Budget
San Luis Obispo County IRWM Region D-60 July 2014
Table D-31. WPA No. 9 – Cuyama Valley Demand Supply Balance
WPA No. 9 - Cuyama Valley
Water Districts/Use Sectors/Environmental/Unimpaired Summary
Cuyama Valley - Agriculture
Cuyama Valley - Rural
Environmental & UMAD Total
Urban/Ag/ Rural Water
Demands
Demand (AFY)
Notes Demand (AFY)
Notes Demand (AFY)
Notes Demand (AFY)
Notes
Existing Demands
30,714 10 30,724
Forecasted Demands (2035)
28,823 180 0 29,003
Water Supply Source
Groundwater
GW Supply (AFY)
GW Supply (AFY)
GW Supply (AFY)
GW Supply (AFY)
Cuyama Valley
9,800 1 61 1 9,861
Other GW Supply Sources
19,023 119 19,142
Total GW
28,823 180 0 29,003
Surface Water
SW Supply (AFY)
SW Supply (AFY)
SW Supply (AFY)
SW Supply (AFY)
SWRCB - WPA 9
0 0
Total SW
0 0 0 0
Total Supplies
28,823 180 0 29,003
Balance (Supplies - Demand)
0 0 0 0
Environmental Water
0 2
Unimpaired Mean Annual Inflow
0 3
Notes:
1 There is no separate yield estimate for the San Luis Obispo County portion of the basin. 2 Not Available 3 The eastern portion of the County (i.e., WPAs 9, 10, 11, 14, and 15) was ultimately excluded from the environmental
water demand analysis due to the lack of data and regional physiographic differences.

San Luis Obispo Integrated Regional Water Management Plan Section D. Water Supply, Demand, and Water Budget
July 2014 D-61 San Luis Obispo County IRWM Region
-
20,000
40,000
60,000
80,000
100,000
120,000
140,000
160,000
180,000
2010 2015 2020 2025 2030 2035
Wat
er D
eman
d (A
FY)
Year
WPA No. 10 - Carrizo
WPA No. 11 - Rafael/Big Spring
WPA No. 12 - Santa Margarita
WPA No. 13 - Atascadero/Templeton
WPA No. 14 - Salinas/Estrella
WPA No. 15 - Cholame
WPA No. 16 - Nacimiento
North County Sub-Region D.4.3
As listed in Table D-32, the South County Sub-Region includes seven WPAs (See Figure D-17). Most of the urban water demands rely on groundwater supplies from the Paso Groundwater Basins and its many sub-basins.
Table D-32. North County Subregion WPA Water Demand Summary
Sum Urban, Rural, Ag 2010 2015 2020 2025 2030 2035 WPA No. 10 - Carrizo Plain 733 2,978 5,223 7,469 9,714 11,959 WPA No. 11 - Rafael/Big Spring 519 633 748 862 976 1,090 WPA No. 12 - Santa Margarita 3,523 4,513 5,500 6,488 7,477 8,465 WPA No. 13 - Atascadero/Templeton 22,151 23,644 25,167 26,687 27,832 29,559 WPA No. 14 - Salinas/Estrella 87,127 89,409 91,903 94,370 94,425 94,482 WPA No. 15 - Cholame 118 143 168 193 218 243 WPA No. 16 - Nacimiento 3,269 4,280 5,288 6,300 7,310 8,320
Total for Sub-Region 117,440 125,600 133,997 142,369 147,952 154,118
Figure D-22. North County WPA Water Demand Summary

San Luis Obispo Integrated Regional Water Management Plan Section D. Water Supply, Demand, and Water Budget
San Luis Obispo County IRWM Region D-62 July 2014
0
2,000
4,000
6,000
8,000
10,000
12,000
14,000
2010 2015 2020 2025 2030 2035
Wat
er D
eman
d (A
FY)
Year
Agricultural WaterDemands (AFY)
Rural Water Demands(AFY)
Urban Water Demands(AFY)
WPA 10 – Carrizo Plain D.4.3.1
Water Demand
There are no large population centers in WPA 10. Two solar power facilities exist in this WPA. These two large solar farms are referred to as the Topaz Solar Farm, and the SunPower-California Valley Solar Ranch. The estimated water demand of these facilities is 13.8 AFY, but is not shown in this water balance (for purposes of consistency with MWR).
The estimated rural demand for the Carrizo Plain, WPA 10, is 210 AFY and has a future demand of 11,175 AFY. However, it is unlikely that the number of residential units that are zoned as potential residential will be developed due to limited water availability and other factors. The existing annual applied water for WPA 10 is approximately 520 AFY. The existing crops in this area are primarily citrus crops. The projected future annual applied water for WPA 10 averages approximately 784 AFY.
The eastern portion of the County (i.e., WPAs 9, 10, 11, 14, and 15) was ultimately excluded from the environmental water demand analysis due to the lack of data and regional physiographic differences. No environmental flows are included for this WPA.
Supply Demand Balance
The primary source of water supply for this WPA is the Carrizo Plain Groundwater Basin, and to a limited extent, other groundwater basins and State Board water diversions. With no urban land uses, groundwater is shown to meet demands to the extent sufficiency in all supplies can be achieved in the future. Potential demands occurring from the two identified future solar power projects are not included.
Figure D-23. WPA-10 Carrizo Plain Water Demands

San Luis Obispo Integrated Regional Water Management Plan Section D. Water Supply, Demand, and Water Budget
July 2014 D-63 San Luis Obispo County IRWM Region
Table D-33. WPA No. 10 – Carrizo Plain Urban Water Demands (AFY)
Urban Water District 2010 2015 2020 2025 2030 2035 Notes
Rural Water Demands (AFY)
Rural Areas/Districts 2010 2015 2020 2025 2030 2035 Notes
Carrizo - Rural 210 2,403 4,596 6,789 8,982 11,175 1
Total 210 2,403 4,596 6,789 8,982 11,175 Agricultural Water Demands (AFY)
Crop Types 2010 2015 2020 2025 2030 2035 Notes
Alfalfa 0 0 0 0 0 0 Citrus 523 575 627 680 732 784 Deciduous 0 0 0 0 0 0 Nursery 0 0 0 0 0 0 Pasture 0 0 0 0 0 0 Vegetable 0 0 0 0 0 0
Vineyard 0 0 0 0 0 0
Total 523 575 627 680 732 784 Total Water Demands (AFY)
Sum Urban, Rural, Ag 2010 2015 2020 2025 2030 2035
Total Water Demand 733 2,978 5,223 7,469 9,714 11,959 Environmental Water Demands (AFY)
Environmental Category 2010 2015 2020 2025 2030 2035
Estimated Unimpaired Mean Annual Discharge 0 0 0 0 0 0 2 Estimated Environmental Water Demand 0 0 0 0 0 0 2
Notes:
1 Straightline Interpolation 2010 to 2044. Carrizo Plain rural demand projections are based on existing zoning, which
includes the potential for extensive California Valley development. The actual development may be much lower than the range shown due to water quality and other considerations.
2 The eastern portion of the County (i.e., WPAs 9, 10, 11, 14, and 15) was ultimately excluded from the environmental water demand analysis due to the lack of data and regional physiographic differences.

San Luis Obispo Integrated Regional Water Management Plan Section D. Water Supply, Demand, and Water Budget
San Luis Obispo County IRWM Region D-64 July 2014
Table D-34. WPA No. 10 – Carrizo Plain Demand Supply Balance
WPA No. 10 - Carrizo
Water Districts/Use Sectors/Environmental/Unimpaired Summary
Carrizo - Agriculture Carrizo - Rural Environmental
& UMAD Total
Urban/Ag/ Rural Water
Demands
Demand (AFY)
Notes Demand (AFY)
Notes Demand (AFY)
Notes Demand (AFY)
Notes
Existing Demands
523 210 733
Forecasted Demands (2035)
784 11,175 0 11,959
Water Supply Source
Groundwater
GW Supply (AFY)
GW Supply (AFY)
GW Supply (AFY)
GW Supply (AFY)
Carrizo Plain
800 1 224 1,023
Other GW Supply Sources
0 10,952 10,952
Total GW
800 11,175 0 11,975
Surface Water
SW Supply (AFY)
SW Supply (AFY)
SW Supply (AFY)
SW Supply (AFY)
SWRCB - WPA 10
0 2 0 2 0
Total SW
0 0 0 0
Total Supplies
800 11,175 0 11,975
Balance (Supplies - Demand)
16
0
0
16
Environmental Water
0 3
Unimpaired Mean Annual Inflow
0 3
Notes:
1 The safe seasonal yield was estimated at 8000 - 11000 AFY. 2 Diversions do not distinguish type of use. Potentially 81 AFY could be diverted for use to either agriculture or rural
residential. 3 The eastern portion of the County (i.e., WPAs 9, 10, 11, 14, and 15) was ultimately excluded from the environmental
water demand analysis due to the lack of data and regional physiographic differences.

San Luis Obispo Integrated Regional Water Management Plan Section D. Water Supply, Demand, and Water Budget
July 2014 D-65 San Luis Obispo County IRWM Region
0
200
400
600
800
1,000
1,200
2010 2015 2020 2025 2030 2035
Wat
er D
eman
d (A
FY)
Year
Agricultural WaterDemands (AFY)
Rural Water Demands(AFY)
Urban Water Demands(AFY)
WPA 11 – Rafael/Big Spring D.4.3.2
Water Demand
There are no large population centers in WPA 11.
There is minimal or no existing rural demand for WPA 11, but in the future, if water is available and development occurs, there could be up to 1,090 AFY. There are minimal (519 AFY) applied water demands estimated in 2010, and no future agricultural demands, with existing citrus shown as declining to zero by 2035 likely being replaced by rural development, and constrained from a lack of reliable water supplies.
The eastern portion of the County (i.e., WPAs 9, 10, 11, 14, and 15) was ultimately excluded from the environmental water demand analysis due to the lack of data and regional physiographic differences.
Demand Supply Balance
The primary source of water supply for this WPA is the Rafael Valley and Big Spring Valley Groundwater Basins, and to a limited extent, State Board water diversions. The water supply sources for this WPA include other groundwater supply sources because the amount of groundwater taken from the two larger basins, and from smaller basins, has not been quantified. With no urban land uses, groundwater is shown to meet demands to the extent sufficiency in all supplies can be achieved in the future.
Figure D-24. WPA-11 Rafael/Big Spring Water Demands

San Luis Obispo Integrated Regional Water Management Plan Section D. Water Supply, Demand, and Water Budget
San Luis Obispo County IRWM Region D-66 July 2014
Table D-35. WPA No. 11 - Rafael/Big Spring Urban Water Demands (AFY)
Urban Water District 2010 2015 2020 2025 2030 2035 Notes
Rural Water Demands (AFY)
Rural Areas/Districts 2010 2015 2020 2025 2030 2035 Notes
Rafael/Big Spring - Rural 0 218 436 654 872 1,090 1
Total 0 218 436 654 872 1,090 Agricultural Water Demands (AFY)
Crop Types 2010 2015 2020 2025 2030 2035 Notes
Alfalfa 0 0 0 0 0 0 Citrus 519 415 312 208 104 0 Deciduous 0 0 0 0 0 0 Nursery 0 0 0 0 0 0 Pasture 0 0 0 0 0 0 Vegetable 0 0 0 0 0 0
Vineyard 0 0 0 0 0 0
Total 519 415 312 208 104 0 Total Water Demands (AFY)
Sum Urban, Rural, Ag 2010 2015 2020 2025 2030 2035
Total Water Demand 519 633 748 862 976 1,090 Environmental Water Demands (AFY)
Environmental Category 2010 2015 2020 2025 2030 2035
Estimated Unimpaired Mean Annual Discharge 0 0 0 0 0 0 2 Estimated Environmental Water Demand 0 0 0 0 0 0 2
Notes:
1 Straightline Interpolation 2010 to 2045
2 The eastern portion of the County (i.e., WPAs 9, 10, 11, 14, and 15) was ultimately excluded from the
environmental water demand analysis due to the lack of data and regional physiographic differences.

San Luis Obispo Integrated Regional Water Management Plan Section D. Water Supply, Demand, and Water Budget
July 2014 D-67 San Luis Obispo County IRWM Region
Table D-36. WPA No. 11 – Rafael/Big Spring Demand Supply Balance
WPA No. 11 - Rafael/Big Spring
Water Districts/Use Sectors/Environmental/Unimpaired Summary
Rafael/Big Spring -
Agriculture
Rafael/Big Spring - Rural
Environmental & UMAD Total
Urban/Ag/ Rural Water
Demands
Demand (AFY)
Notes Demand (AFY)
Notes Demand (AFY)
Notes Demand (AFY)
Notes
Existing Demands
519 519
Forecasted Demands (2035)
0 1,090 0 1,090
Water Supply Source
Groundwater
GW Supply (AFY)
GW Supply (AFY)
GW Supply (AFY)
GW Supply (AFY)
Rafael Valley
0 1 0
Big Spring Area
0 1 0
Other GW Supply Sources
0 2 1,090 2 1,090
Total GW
0 1,090 0 1,090
Surface Water
SW Supply (AFY)
SW Supply (AFY)
SW Supply (AFY)
SW Supply (AFY)
SWRCB - WPA 11
0 3 0
Total SW
0 0 0 0
Total Supplies
0 1,090 0 1,090
Balance (Supplies - Demand)
0
0
0
0
Environmental Water
0 4
Unimpaired Mean Annual Inflow
0 4
Notes:
1 There is no information describing the basin yield. 2 It is uncertain which basins are used and the quantity of water pumped from each basin. Future studies should invest the
resources to quantify the location and use of each basin. 3 Diversions do not distinguish type of use. Potentially 59 AFY could be diverted for use to either agriculture or rural
residential. 4 The eastern portion of the County (i.e., WPAs 9, 10, 11, 14, and 15) was ultimately excluded from the environmental
water demand analysis due to the lack of data and regional physiographic differences.

San Luis Obispo Integrated Regional Water Management Plan Section D. Water Supply, Demand, and Water Budget
San Luis Obispo County IRWM Region D-68 July 2014
0
1,000
2,000
3,000
4,000
5,000
6,000
7,000
8,000
9,000
2010 2015 2020 2025 2030 2035
Wat
er D
eman
d (A
FY)
Year
Agricultural WaterDemands (AFY)
Rural Water Demands(AFY)
Urban Water Demands(AFY)
WPA 12 – Santa Margarita D.4.3.3
Water Demand
There are two urban water suppliers and users in WPA 12: County Service Area 23 and Santa Margarita Ranch Mutual Water Company. Information on these water districts and water users is in Section C – Region Description.
The estimated rural demand for the Santa Margarita area, WPA 12, is 240 AFY and has a future demand of 485 AFY. However, it is unlikely that the number of residential units that are zoned as potential residential will be developed due to limited water availability and other factors. The existing annual applied water for WPA 12 is approximately 1,498 AFY. The existing crops in this area include alfalfa, deciduous, pasture, and vineyards. The projected future annual applied water for WPA 12 is estimated to be 2,202 AFY. The projected future agricultural demand is higher than existing due to increases in acreage of citrus, pasture, and vineyards.
The UMAD for WPA 12 inclusive of the water management areas is approximately 46,630 AFY and environmental water demand of 32,850 AFY.
Demand Supply Balance
The primary source of water supply for this WPA is the Santa Margarita, Rinconada, and Pozo Valley Groundwater Basins, Santa Margarita Creek Alluvial Aquifer, and to a limited extent other groundwater supplies and State Board water diversions. The water supply sources for this WPA include other groundwater supply sources because the amount of groundwater taken from the two larger basins, and from smaller basins, has not been quantified. Based on preliminary review of basin perennial yield, groundwater is shown to be in deficit for the two urban districts, requiring the development of alternative supplies from surface water and potentially recycled water.
Figure D-25. WPA-12 Santa Margarita Water Demands

San Luis Obispo Integrated Regional Water Management Plan Section D. Water Supply, Demand, and Water Budget
July 2014 D-69 San Luis Obispo County IRWM Region
Table D-37. WPA No. 12 - Santa Margarita Urban Water Demands (AFY)
Urban Water District 2010 2015 2020 2025 2030 2035 Notes
CSA 23 164 168 171 175 179 182 1
Santa Margarita Ranch Mutual Water Company 1,621 2,416 3,211 4,006 4,801 5,596 2
Total 1,785 2,584 3,382 4,181 4,980 5,778 Rural Water Demands (AFY)
Rural Areas/Districts 2010 2015 2020 2025 2030 2035 Notes
Santa Margarita - Rural 240 289 338 387 436 485 3
Total 240 289 338 387 436 485 Agricultural Water Demands (AFY)
Crop Types 2010 2015 2020 2025 2030 2035 Notes
Alfalfa 200 219 238 256 275 294 Citrus 0 0 0 0 0 0 Deciduous 29 32 34 37 40 43 Nursery 0 0 0 0 0 0 Pasture 21 23 25 27 29 31 Vegetable 0 0 0 0 0 0
Vineyard 1,248 1,366 1,483 1,600 1,717 1,834
Total 1,498 1,640 1,780 1,920 2,061 2,202 Total Water Demands (AFY)
Sum Urban, Rural, Ag 2010 2015 2020 2025 2030 2035
Total Water Demand 3,523 4,513 5,500 6,488 7,477 8,465 Environmental Water Demands (AFY)
Environmental Category 2010 2015 2020 2025 2030 2035
Estimated Unimpaired Mean Annual Discharge 32,850 32,850 32,850 32,850 32,850 32,850 Estimated Environmental Water Demand 46,630 46,630 46,630 46,630 46,630 46,630 Notes:
1 2012 MWR Future demand given as a range, 173-192 AFY. Average of range used for 2035. Straight line interpolation between 2010 demand and the average of the 2035 demand range.
2 2012 MWR Future demand given as a range, 5301-5890 AFY. Average of range used for 2035. Straight line
interpolation between 2010 demand and the average of the 2035 demand range.
3 Straightline Interpolation 2010 to 2046

San Luis Obispo County IRW
M Region
D-70
July 2014
San Luis Obispo Integrated Regional W
ater Managem
ent Plan Section D. W
ater Supply, Demand, and W
ater Budget
Table D-38. WPA No. 12 – Santa Margarita Demand Supply Balance
WPA No. 12 - Santa Margarita
Water Districts/Use Sectors/Environmental/Unimpaired Summary
CSA 23 Santa Margarita Ranch MWC
Santa Margarita - Agriculture
Santa Margarita - Rural
Environmental & UMAD Total
Urban/Ag/ Rural Water
Demands
Demand (AFY)
Notes Demand (AFY)
Notes Demand (AFY)
Notes Demand (AFY)
Notes Demand (AFY)
Notes Demand (AFY)
Notes
Existing Demands
164 1 1,621 1,508 240 3,533
Forecasted Demands (2035)
182 5,596 2,202 485 0 8,465
Water Supply Source
Groundwater
GW Supply (AFY)
GW Supply (AFY)
GW Supply (AFY)
GW Supply (AFY)
GW Supply (AFY)
GW Supply (AFY)
Santa Margarita Valley
164 2 1,621 2 0 2 1,785
Rinconada Valley
0 3 0 2 308 3 68 376
Pozo Valley
0 4 0 4 110 4 24 134
Other GW Supply Sources
1,762 388 2,150
Salinas River Underflow
22 5 27
Total GW
164 1,621 2,202 485 0 4,472
Surface Water
SW Supply (AFY)
SW Supply (AFY)
SW Supply (AFY)
SW Supply (AFY)
SW Supply (AFY)
SW Supply (AFY)
SWRCB-WPA 1
22 5 22
Total SW
0 22 0 0 0 22
Total Supplies
164 1,643 2,202 485 0 4,494
Balance (Supplies - Demand)
-18
-3,953
0
0
0
-3,971
Environmental Water
32,850
Unimpaired Mean Annual Inflow
46,630
Notes:
1 2012 MWR 2 No comprehensive studies to determine the perennial yield are known to exist. However some reports indicate an average annual yield may range between 400 to 600 AFY. 3 There is no information describing the basin yield. 4 The safe available storage has been reported to be 1000 AFY. There is insufficient information to characterize water availability. 5 Supplemental water supply options for Santa Margarita Ranch are State Water and Nacimiento water.

San Luis Obispo Integrated Regional Water Management Plan Section D. Water Supply, Demand, and Water Budget
July 2014 D-71 San Luis Obispo County IRWM Region
0
5,000
10,000
15,000
20,000
25,000
30,000
35,000
2010 2015 2020 2025 2030 2035
Wat
er D
eman
d (A
FY)
Year
Agricultural WaterDemands (AFY)
Rural Water Demands(AFY)
Urban Water Demands(AFY)
WPA 13 – Atascadero/Templeton D.4.3.4
Water Demand
There are three urban water suppliers and users in WPA 13: Garden Farms Community Water District, Atascadero Mutual Water Company, and Templeton Community Services District. Information on these water districts and water users is in Section C – Region Description.
The estimated rural demand for the Atascadero/Templeton area, WPA 13, is 1,480 AFY and has a future demand of 1,870 AFY. However, it is unlikely that the number of residential units that are zoned as potential residential will be developed due to limited water availability and other factors. The existing annual applied water for WPA 13 is approximately 7,852 AFY. All crop types are currently grown in this area. The projected future annual applied water for WPA 13 is estimated to be 12,170 AFY. The projected future agricultural demand is slightly higher than existing due to increases in acreage of deciduous, nursery, pasture, vegetable, and vineyards.
The UMAD for WPA 13 inclusive of the water management areas is approximately 74,090 AFY and environmental water demand of 41,010 AFY.
Demand Supply Balance
The primary source of water supply for this WPA is the Atascadero Groundwater Sub-basin (Paso Robles Formation and Salinas River Underflow), recycled water, Nacimiento Water Project, and to a limited extent, other groundwater supplies and State Board water diversions. The Templeton CSD can extract water from the Paso Robles Formation any time during the year; however, the Templeton CSD extracts the majority of the water during the summer months when the main river water allocation is not available. The agencies, County, District, and local land owners intend to actively and cooperatively manage the Paso Robles Groundwater Basin via the development of a Groundwater Management Plan.
Figure D-26. WPA-13 Atascadero/Templeton Water Demands

San Luis Obispo Integrated Regional Water Management Plan Section D. Water Supply, Demand, and Water Budget
San Luis Obispo County IRWM Region D-72 July 2014
Table D-39. WPA No. 13 - Atascadero/Templeton Urban Water Demands (AFY)
Urban Water District 2010 2015 2020 2025 2030 2035 Notes
Garden Farms C.W.D. 48 57 66 75 84 93 1 Templeton CSD 1,682 1,775 1,868 1,961 2,054 2,147 2 Atascadero Mutual Water Co 7,026 7,476 7,955 8,431 8,867 9,551 3
Paso Robles Municipal Well Pumping 4,063 4,063 4,063 4,063 3,728 3,728 3
Total 12,819 13,371 13,952 14,530 14,733 15,519 Rural Water Demands (AFY)
Rural Areas/Districts 2010 2015 2020 2025 2030 2035 Notes
Atascadero/Templeton - Rural 1,480 1,558 1,636 1,714 1,792 1,870 4
Total 1,480 1,558 1,636 1,714 1,792 1,870 Agricultural Water Demands (AFY)
Crop Types 2010 2015 2020 2025 2030 2035 Notes
Alfalfa 319 354 389 424 459 494 Citrus 156 173 190 207 224 241 Deciduous 44 48 53 58 63 68 Nursery 25 28 31 34 37 39 Pasture 1,518 1,685 1,852 2,019 2,186 2,353 Vegetable 34 38 42 46 50 53
Vineyard 5,756 6,389 7,022 7,655 8,288 8,922
Total 7,852 8,715 9,579 10,443 11,307 12,170 Total Water Demands (AFY)
Sum Urban, Rural, Ag 2010 2015 2020 2025 2030 2035
Total Water Demand 22,151 23,644 25,167 26,687 27,832 29,559 Environmental Water Demands (AFY)
Environmental Category 2010 2015 2020 2025 2030 2035
Estimated Unimpaired Mean Annual Discharge 41,010 41,010 41,010 41,010 41,010 41,010 Estimated Environmental Water Demand 74,090 74,090 74,090 74,090 74,090 74,090 Notes:
1 Straight line interpolation between 2010 demand and 2035 demand.
2 2012 MWR Future demand given as a range, 2034-2260 AFY. Average of range used for 2035. Straight line interpolation between 2010 demand and the average of the 2035 demand range.
3 2035 demand calculated using straight line interpolation from 2020 and 2030 given demands.
4 Straightline Interpolation 2010 to 2047

July 2014
D-73
San Luis O
bispo County IRWM
Region
San Luis Obispo Integrated Regional W
ater Managem
ent Plan Section D. W
ater Supply, Demand, and W
ater Budget
Table D-40. WPA No. 13 - Atascadero/Templeton Demand Supply Balance
WPA No. 13 - Atascadero/Templeton
Water Districts/Use Sectors/Environmental/Unimpaired Summary
Garden Farms C.W.D.
Templeton CSD
Atascadero Mutual
Water Co
Paso Robles Municipal
Well Pumping
Atascadero/ Templeton - Agriculture
Atascadero/ Templeton -
Rural
Environ-mental &
UMAD Total
Urban/ Ag/ Rural Water
Demands
Demand (AFY)
Notes Demand (AFY)
Notes Demand (AFY)
Notes Demand (AFY)
Notes Demand (AFY)
Notes Demand (AFY)
Notes Demand (AFY) Demand (AFY)
Existing Demands
48 1 1,682 1 7,026 1 4,063 7,852 1,480 22,151 Forecasted Demands (2035)
93 2,147 9,551 3,728 12,170 1,870 0 29,559
Water Supply Source
Groundwater
GW Supply (AFY)
GW Supply (AFY)
GW Supply (AFY)
GW Supply (AFY)
GW Supply (AFY)
GW Supply (AFY)
GW Supply (AFY)
GW Supply (AFY)
Paso Robles
93 2 1,050 3 3,193 8 0 10 0 14 4,336 Salinas River Underflow
500 4 4,883 9 3,728 11 2,434 12 374 11,919
Atascadero
0 7 0 Other GW Supply Sources
9,736 1,496 11,232
Total GW
93 1,550 8,076 3,728 12,170 1,870 0 27,487
Surface Water
SW Supply (AFY)
SW Supply (AFY)
SW Supply (AFY)
SW Supply (AFY)
SW Supply (AFY)
SW Supply (AFY)
SW Supply (AFY)
SW Supply (AFY)
Nacimiento Project
250 5 2,000 2,250 Recycled Water
475 6 475
SWRCB - WPA 13
0 13 0 13 0 Total SW
0 725 2,000 0 0 0 0 2,725
Total Supplies
93 2,275 10,076
3,728 12,170 1,870 0 30,212
Balance (Supplies - Demand)
0
128
525
0
0
0
0 653
Environmental Water
41,010
Unimpaired Mean Annual Inflow
74,090 Notes:
1 2012 MWR 2 Perennial yield estimated to be 16400 AFY. Extractions occur primarily from Salinas River Underflow and deeper formations. Depending on the estimated use sub-basin studies
are indicating that the perennial yield may be exceeded in the future. 3 Nine of Templeton CSD's wells extract groundwater from the Atascadero Groundwater Sub-basin. 4 Templeton CSD is permitted to extract 500 AFY from the Salinas River Underflow between October 1 and April 1. 5 Nacimiento Project went on-line in 2010 6 Percolation of treated wastewater effluent into the Salinas River underflow and extraction of the same amount 28 months later. Currently about 132 AFY is percolated and
extracted. This could increase to 475 AFY in the future.

San Luis Obispo County IRW
M Region
D-74
July 2014
San Luis Obispo Integrated Regional W
ater Managem
ent Plan Section D. W
ater Supply, Demand, and W
ater Budget
7 The agencies County District and local land owners intend to actively and cooperatively manage the Paso Robles Groundwater Basin (which includes the Sub-basin) via the development of a Groundwater Management Plan.
8 Included with Salinas River Underflow 9 Atascadero MWC currently has rights to 3372 AFY from Salinas River underflow. Increased supplies from the underflow are shown due to UWMP shwing 4613 AFY in 2030.
10 Amount included in Salinas River Underflow 11 It was assumed that half (4063 AFY) of the existing Paso demand of 8126 AFY was extracted from the Salinas River Underflow via the Thunderbird Well Field in WPA 13 12 SWRCB records indicate that 745 AFY could have been diverted from the Salinas River (direct diversion or underflow). It is assumed that the entire amount is used for
agriculture. 13 Diversions do not distinguish type of use. Potentially 1431 AFY could be diverted for use to either agriculture or rural residential. Diversions were not analyzed as to whether
they are within or outside the Sub-basin. 14 It is assumed that the majority of water supply for rural users and about 13 percent of the supply for agricultural users comes from the Sub-basin.

San Luis Obispo Integrated Regional Water Management Plan Section D. Water Supply, Demand, and Water Budget
July 2014 D-75 San Luis Obispo County IRWM Region
0
10,000
20,000
30,000
40,000
50,000
60,000
70,000
80,000
90,000
100,000
2010 2015 2020 2025 2030 2035
Wat
er D
eman
d (A
FY)
Year
Agricultural Water Demands(AFY)
Rural Water Demands (AFY)
Urban Water Demands (AFY)
WPA 14 – Salinas/Estrella D.4.3.5
Water Demand
There are four urban water suppliers and users in WPA 14: Camp Roberts, City of Paso Robles, San Miguel Community Services District, and San Luis Obispo County Service Area 16 (Shandon). Information on these water districts and water users is in Section C – Region Description.
The estimated rural demand for the Salinas/Estrella area, WPA 14, is 3,590 AFY and has a future demand of 5,900 AFY. However, it is unlikely that the number of residential units that are zoned as potential residential will be developed due to limited water availability and other factors. The existing annual applied water for WPA 14 is approximately 76,639 AFY. All crop types are currently grown in this area. The projected future annual applied water for WPA 14 is estimated to decrease slightly to 73,782 AFY. The projected future agricultural demand is slightly lower than existing due to decreases in acreage of alfalfa, citrus, and vineyards.
The eastern portion of the County (i.e., WPAs 9, 10, 11, 14, and 15) was ultimately excluded from the environmental water demand analysis due to the lack of data and regional physiographic differences.
Demand Supply Balance
The primary source of water supply for this WPA is the Paso Robles Groundwater Basin (Paso Robles Formation (and/or alluvium) and Salinas River Underflow), Nacimiento Water Project, and to a limited extent, other groundwater supplies and State Board water diversions. The DAC community of San Miguel overlies a portion of the Paso Basin not constrained by groundwater. The City of Paso Robles is currently construction the Nacimiento Project providing for an estimated 5,400 AFY of surface water. Shandon is also planning for the construction of a turnout for SWP water, but will continue to rely mostly on less costly groundwater supplies to the extent that the basin can sustain the total demands of all pumpers.
Figure D-27. WPA-14 Salinas/Estrella Water Demands

San Luis Obispo Integrated Regional Water Management Plan Section D. Water Supply, Demand, and Water Budget
San Luis Obispo County IRWM Region D-76 July 2014
Table D-41. WPA No. 14 - Salinas/Estrella Urban Water Demands (AFY)
Urban Water District 2010 2015 2020 2025 2030 2035 Notes
San Miguel CSD 235 293 351 408 466 524 1 Camp Roberts 190 190 190 190 190 190 2 City of Paso Robles 6,326 8,550 10,990 13,400 13,400 13,400 2
SLO CSA No. 16 – Shandon 147 255 362 470 578 686 3
Total 6,898 9,288 11,893 14,468 14,634 14,800 Rural Water Demands (AFY)
Rural Areas/Districts 2010 2015 2020 2025 2030 2035 Notes
Salinas/Estrella - Rural 3,590 4,052 4,514 4,976 5,438 5,900 4
Total 3,590 4,052 4,514 4,976 5,438 5,900 Agricultural Water Demands (AFY)
Crop Types 2010 2015 2020 2025 2030 2035 Notes
Alfalfa 10,560 10,481 10,402 10,323 10,245 10,166 Citrus 1,190 1,182 1,173 1,164 1,155 1,146 Deciduous 1,585 1,573 1,561 1,550 1,538 1,526 Nursery 147 146 145 144 143 142 Pasture 3,815 3,787 3,758 3,730 3,701 3,673 Vegetable 2,878 2,857 2,835 2,814 2,792 2,771
Vineyard 56,464 56,043 55,622 55,201 54,779 54,358
Total 76,639 76,069 75,496 74,926 74,353 73,782 Total Water Demands (AFY)
Sum Urban, Rural, Ag 2010 2015 2020 2025 2030 2035
Total Water Demand 87,127 89,409 91,903 94,370 94,425 94,482 Environmental Water Demands (AFY)
Environmental Category 2010 2015 2020 2025 2030 2035
Estimated Unimpaired Mean Annual Discharge 0 0 0 0 0 0 5 Estimated Environmental Water Demand 0 0 0 0 0 0 5 Notes:
1 2012 MWR Future demand given as a range, 466-582 AFY. Average of range used for 2035. Straight line interpolation between 2010 demand and the average of the 2035 demand range.
2 Assumed demand was held constant between Current (2010) and Future (build-out/2035).
3 2012 MWR Future demand given as a range, 271-1100 AFY. Average of range used for 2035. Straight line
interpolation between 2010 demand and the average of the 2035 demand range.
4 Straightline Interpolation 2010 to 2048
5 The eastern portion of the County (i.e., WPAs 9, 10, 11, 14, and 15) was ultimately excluded from the environmental water demand analysis due to the lack of data and regional physiographic differences.

July 2014
D-77
San Luis Obispo County IRW
M Region
San Luis Obispo Integrated Regional W
ater Managem
ent Plan Section D. W
ater Supply, Demand, and W
ater Budget
Table D-42. WPA No. 14 – Salinas/Estrella Demand Supply Balance
WPA No. 14 - Salinas/Estrella
Water Districts/Use Sectors/Environmental/Unimpaired Summary
San Miguel CSD
Camp Roberts
City of Paso Robles
SLO CSA No. 16 – Shandon
Salinas/Estrella - Agriculture
Salinas/ Estrella - Rural
Environmental & UMAD Total
Urban/Ag/ Rural Water
Demands
Demand (AFY)
Notes Demand (AFY)
Notes Demand (AFY)
Notes Demand (AFY)
Notes Demand (AFY)
Notes Demand (AFY)
Notes Demand (AFY)
Notes Demand (AFY)
Existing Demands
235 1 190 1 6,326 3 147 1 76,639 3,590 87,127 Forecasted Demands (2035)
524 190 13,400 686 73,782 5,900 0 94,482
Water Supply Source
Groundwater
GW Supply (AFY)
GW Supply (AFY)
GW Supply (AFY)
GW Supply (AFY)
GW Supply (AFY)
GW Supply (AFY)
GW Supply (AFY)
GW Supply (AFY)
Paso Robles
524 2 190 3,400 4 147 51,647 4,130 60,038 Salinas River Underflow
4,600 5 14,756 7 1,180 20,536
Other GW Supply Sources
3,689 295 3,984 Total GW
524 190 8,000 147 70,093 5,605 0 84,559
Surface Water
SW Supply (AFY)
SW Supply (AFY)
SW Supply (AFY)
SW Supply (AFY)
SW Supply (AFY)
SW Supply (AFY)
SW Supply (AFY)
SW Supply (AFY)
Nacimiento Project
5,400 5,400 SWP - WPA 14
66 6 66
SWRCB - WPA 14
3,689 8 295 8 3,984 Total SW
0 0 5,400 66 3,689 295 0 9,450
Total Supplies
524 190 13,400 213 73,782 5,900 0 94,009
Balance (Supplies - Demand)
0
0
0
-473
0
0
0
-473 Environmental Water
0 9
Unimpaired Mean Annual Inflow
0 9 Notes:
1 2012 MWR 2 The local Paso Basin yield underlying San Miguel is assumed to be sufficient for meeting future demands. Future groundwater management and governance of the Paso
Basin will need to provide proof of sufficiency. 3 The 20x2020 target water use was calculated using DWR Method 1, which is 80% of the Base Daily per Capita Water Use. 4 The deeper formations of the Paso Robles Groundwater Basin contribute approximately 2856 AFY to the City of Paso Robles supply. The City plans to maintain this extraction
rate in the future. 5 The City of Paso Robles is permitted to extract up to 8 cfs (3590 gpm) with a maximum extraction of 4600 AFY (January 1 to December 31). 6 CSA 16 has an allocation of 100 AFY of State Water Project (but no drought buffer) but has not developed this supply due to high cost. State Water Project average allocation
assumed 66 percent of contract water service amount which equate to 66 AFY. 7 SWRCB records indicate that 738 AFY could be diverted from the Salinas River (direct diversion or underflow). It is assumed that the entire amount is used for agriculture. 8 Diversions do not distinguish type of use. Potentially 4884 AFY could be diverted for use to either agriculture or rural residential. 9 The eastern portion of the County (i.e., WPAs 9, 10, 11, 14, and 15) was ultimately excluded from the environmental water demand analysis due to the lack of data and
regional physiographic differences.

San Luis Obispo Integrated Regional Water Management Plan Section D. Water Supply, Demand, and Water Budget
San Luis Obispo County IRWM Region D-78 July 2014
0
50
100
150
200
250
300
2010 2015 2020 2025 2030 2035
Wat
er D
eman
d (A
FY)
Year
Agricultural WaterDemands (AFY)
Rural Water Demands(AFY)
Urban Water Demands(AFY)
WPA 15 – Cholame Valley D.4.3.6
Water Demand
There are no large population centers in WPA 15.
The estimated rural demand for the Cholame Valley area, WPA 15, is 10 AFY and has a future demand of 170 AFY. However, it is unlikely that the number of residential units that are zoned as potential residential will be developed due to limited water availability and other factors. The existing annual applied water for WPA 15 is approximately 108 AFY shown to be solely from citrus crops. The projected future annual applied water for WPA 15 is estimated to decrease slightly to 73 AFY. The projected future agricultural demand is slightly lower than existing due to a decrease in the citrus (olive) crops.
The eastern portion of the County (i.e., WPAs 9, 10, 11, 14, and 15) was ultimately excluded from the environmental water demand analysis due to the lack of data and regional physiographic differences.
Demand Supply Balance
The primary source of water supply for this WPA is the Cholame Valley Groundwater Basin, and to a limited extent, other groundwater supplies and State Board water diversions. Given the current land use, the projection for WPA 15 in particular could be refined significantly by taking ranching operations water use and conservation easement provisions into account. There is no information for basin yields.
Figure D-28. WPA-15 Cholame Water Demands

San Luis Obispo Integrated Regional Water Management Plan Section D. Water Supply, Demand, and Water Budget
July 2014 D-79 San Luis Obispo County IRWM Region
Table D-43. WPA No. 15 - Cholame Urban Water Demands (AFY)
Urban Water District 2010 2015 2020 2025 2030 2035 Notes
Rural Water Demands (AFY)
Rural Areas/Districts 2010 2015 2020 2025 2030 2035 Notes
Cholame - Rural 10 42 74 106 138 170 1
Total 10 42 74 106 138 170 Agricultural Water Demands (AFY)
Crop Types 2010 2015 2020 2025 2030 2035 Notes
Alfalfa 0 0 0 0 0 0 Citrus 108 101 94 87 80 73 Deciduous 0 0 0 0 0 0 Nursery 0 0 0 0 0 0 Pasture 0 0 0 0 0 0 Vegetable 0 0 0 0 0 0
Vineyard 0 0 0 0 0 0
Total 108 101 94 87 80 73 Total Water Demands (AFY)
Sum Urban, Rural, Ag 2010 2015 2020 2025 2030 2035
Total Water Demand 118 143 168 193 218 243 Environmental Water Demands (AFY)
Environmental Category 2010 2015 2020 2025 2030 2035
Estimated Unimpaired Mean Annual Discharge 0 0 0 0 0 0 2 Estimated Environmental Water Demand 0 0 0 0 0 0 2
Notes:
1 Straightline Interpolation 2010 to 2049 2 The eastern portion of the County (i.e., WPAs 9, 10, 11, 14, and 15) was ultimately excluded from the
environmental water demand analysis due to the lack of data and regional physiographic differences.

San Luis Obispo County IRW
M Region
D-80
July 2014
San Luis Obispo Integrated Regional W
ater Managem
ent Plan Section D. W
ater Supply, Demand, and W
ater Budget
Table D-44. WPA No. 15 – Cholame Demand Supply Balance
WPA No. 15 - Cholame
Water Districts/Use Sectors/Environmental/Unimpaired Summary
Cholame - Agriculture Cholame - Rural Environmental & UMAD Total
Urban/Ag/ Rural Water Demands
Demand (AFY) Notes
Demand (AFY) Notes
Demand (AFY) Notes
Demand (AFY) Notes
Existing Demands
108 10 118
Forecasted Demands (2035)
73 170 0 243
Water Supply Source
Groundwater
GW Supply (AFY)
GW Supply (AFY)
GW Supply (AFY)
GW Supply (AFY)
Cholame Valley
80 1 80
Other GW Supply Sources
0 170 170
Total GW
80 170 0 250
Surface Water
SW Supply (AFY)
SW Supply (AFY)
SW Supply (AFY)
SW Supply (AFY)
SWRCB - WPA 15
41 41
Total SW
41 0 0 41
Total Supplies
121 170 0 291
Balance (Supplies - Demand)
48
0
0
48
Environmental Water
0 2
Unimpaired Mean Annual Inflow
0 2
Notes:
1 The perennial yield was estimated to be 977,00 AFY (includes 16,400 AFY from the Atascadero Groundwater Sub-basin). Previous studies estimated that the total groundwater pumping in the basin during 2006 including Monterey County demands was 88154 acre-feet
2 The eastern portion of the County (i.e., WPAs 9, 10, 11, 14, and 15) was ultimately excluded from the environmental water demand analysis due to the lack of data and regional physiographic differences.

San Luis Obispo Integrated Regional Water Management Plan Section D. Water Supply, Demand, and Water Budget
July 2014 D-81 San Luis Obispo County IRWM Region
0
1,000
2,000
3,000
4,000
5,000
6,000
7,000
8,000
9,000
2010 2015 2020 2025 2030 2035
Wat
er D
eman
d (A
FY)
Year
Agricultural WaterDemands (AFY)
Rural Water Demands(AFY)
Urban Water Demands(AFY)
WPA 16 – Nacimiento D.4.3.7
Water Demand
There are two urban water suppliers and users in WPA 16: Heritage Ranch Community Services District and Nacimiento Water Company. Information on these water districts and water users is in Section C – Region Description.
The estimated rural demand for the Nacimiento area, WPA 16, is 280 AFY and has a future demand of 805 AFY. However, it is unlikely that the number of residential units that are zoned as potential residential will be developed due to limited drought year water availability. The existing annual applied water for WPA 16 is approximately 1770 AFY shown to be from citrus, deciduous, pasture, and vineyard crops. The projected future annual applied water for WPA 16 is estimated to increase to 5,928 AFY. The projected future agricultural demand is higher than existing due to an increase in all existing crop types.
The UMAD for WPA 16 inclusive of the water management areas is approximately 251,124 AFY and environmental water demand of 108,390 AFY.
Demand Supply Balance
The primary source of water supply for this WPA is Lake Nacimiento, and to a limited extent, other groundwater supplies and State Board water diversions. The 1,100 AFY of allocation of Nacimiento Reservoir water designated for use in Heritage Ranch’s service area is part of the 1,750 AFY reserved for County residents in the Lake Nacimiento area. It is sufficient to provide water for build-out demand, but the configuration of the delivery system leaves the Heritage Ranch CSD vulnerable to a termination in water supply in an extreme drought. Alternative sources are under consideration, including taking water directly from the lake and connecting to the Nacimiento Pipeline.
Figure D-29. WPA-16 Nacimiento Water Demands

San Luis Obispo Integrated Regional Water Management Plan Section D. Water Supply, Demand, and Water Budget
San Luis Obispo County IRWM Region D-82 July 2014
Table D-45. WPA No. 16 - Nacimiento Urban Water Demands (AFY)
Urban Water District 2010 2015 2020 2025 2030 2035 Notes
Nacimiento Water Company 600 600 600 600 600 600 1
Heritage Ranch CSD 619 693 766 840 913 987 2
Total 1,219 1,293 1,366 1,440 1,513 1,587
Rural Water Demands (AFY) Rural Areas/Districts 2010 2015 2020 2025 2030 2035 Notes
Nacimiento - Rural 280 385 490 595 700 805 3
Total 280 385 490 595 700 805 Agricultural Water Demands (AFY) Crop Types 2010 2015 2020 2025 2030 2035 Notes
Alfalfa 0 0 0 0 0 0 Citrus 27 40 52 65 78 90 Deciduous 8 12 15 19 23 26 Nursery 0 0 0 0 0 0 Pasture 0 0 0 0 0 0 Vegetable 0 0 0 0 0 0 Vineyard 1,735 2,550 3,365 4,181 4,996 5,812
Total 1,770 2,602 3,432 4,265 5,097 5,928 Total Water Demands (AFY)
Sum Urban, Rural, Ag 2010 2015 2020 2025 2030 2035
Total Water Demand 3,269 4,280 5,288 6,300 7,310 8,320 Environmental Water Demands (AFY)
Environmental Category 2010 2015 2020 2025 2030 2035
Estimated Unimpaired Mean Annual Discharge 108,390 108,390 108,390 108,390 108,390 108,390 Estimated Environmental Water Demand 251,120 251,120 251,120 251,120 251,120 251,120 Notes:
1 Current (2010) and Future (Build-out/2035) demands not available; calculations not performed.
2 2012 MWR Future demand given as a range, 935-1039 AFY. Average of range used for 2035. Straight line interpolation between 2010 demand and the average of the 2035 demand range.
3 Straightline Interpolation 2010 to 2050

July 2014
D-83
San Luis O
bispo County IRWM
Region
San Luis Obispo Integrated Regional W
ater Managem
ent Plan Section D. W
ater Supply, Demand, and W
ater Budget
Table D-46. WPA No. 16 - Nacimiento Demand Supply Balance
WPA No. 16 - Nacimiento
Water Districts/Use Sectors/Environmental/Unimpaired Summary
Nacimiento Water Company
Heritage Ranch CSD
Nacimiento - Agriculture
Nacimiento - Rural
Environmental & UMAD Total
Urban/Ag/ Rural Water
Demands
Demand (AFY)
Notes Demand (AFY)
Notes Demand (AFY)
Notes Demand (AFY)
Notes Demand (AFY)
Notes Demand (AFY)
Notes
Existing Demands
600 619 1,770 280 3,269
Forecasted Demands (2035)
600 987 5,928 805 0 8,320
Water Supply Source
Groundwater
GW Supply (AFY)
GW Supply (AFY)
GW Supply (AFY)
GW Supply (AFY)
GW Supply (AFY)
GW Supply (AFY)
Other GW Supply Sources
5,928 2 805 2 6,733
Total GW
0 0 5,928 805 0 6,733
Surface Water
SW Supply (AFY)
SW Supply (AFY)
SW Supply (AFY)
SW Supply (AFY)
SW Supply (AFY)
SW Supply (AFY)
Nacimiento Lake
600 1 1,100 1 1,700
SWRCB - WPA 15
0 0
Total SW
600 1,100 0 0 0 1,700
Total Supplies
600 1,100 5,928 805 0 8,433
Balance (Supplies - Demand)
0
113
0
0
0
113
Environmental Water
108,390
Unimpaired Mean Annual Inflow
251,120
Notes:
1 The 600 AFY water supply allocation for Oak Shores is part of the 1750 AFY reserved for San Luis Obispo County residents in the Lake Nacimiento area. Heritage Ranch CSD's allocation of Lake Nacimiento is 1100 AFY.
2 Groundwater supply sources around Lake Nacimiento are the typical sources of supply for wells that serve agricultural and rural users. There is no information on yield of groundwater supplies.

San Luis Obispo Integrated Regional Water Management Plan Section D. Water Supply, Demand, and Water Budget
San Luis Obispo County IRWM Region D-84 July 2014
Need for Per Capita Water Demand D.4.4
An IRWM Plan’s use of per capita demands in place of aggregated land use-based demands is often preferred where the correlation in daily indoor water use and population work well and are useful in showing progress in meeting given levels of water conservation over time.
The California Water Conservation Plan calls for a 20 percent per capita water use reduction statewide by the year 2020. As part of the Urban Water Management Plan Act, urban water suppliers are required to complete a plan and set an interim (2015) 10 percent reduction goal as per the DWR guidance manual to meet the goals of the California Water Conservation Plan as briefly summarized in the excerpts below:
#1. An urban retail water supplier shall include in its urban water management plan…due in 2010 the baseline daily per capita water use, urban water use target, interim urban water use target, and compliance daily per capita water use, along with the bases for determining those estimates, including references to supporting data.
#2. Urban wholesale water suppliers shall include in the urban water management plans . . . an assessment of their present and proposed future measures, programs, and policies to help achieve the water use reductions required by this part (10608.36). Urban retail water suppliers are to prepare a plan for implementing the Water Conservation Bill of 2009 requirements and conduct a public meeting, which includes consideration of economic impacts (CWC §10608.26).
#25. Quantify, to the extent records are available, past and current water use, and projected water use (over the same five-year increments described in subdivision (a)), identifying the uses among water use sectors, including, but not necessarily limited to, all of the following uses: (A) Single family residential; (B) Multifamily; (C) Commercial; (D) Industrial; (E) Institutional and governmental; (F) Landscape; (G) Sales to other agencies; (H) Saline water intrusion barriers, groundwater recharge, or conjunctive use, or any combination thereof; (I) Agricultural (10631(e)(1) and (2)).
The table below presents the baseline and target per capita water demands for the urban water suppliers required by the Urban Water Management Plan Act.

San Luis Obispo Integrated Regional Water Management Plan Section D. Water Supply, Demand, and Water Budget
July 2014 D-85 San Luis Obispo County IRWM Region
Table D-47. Per Capita 20X2020 Goals for Large Urban Water Suppliers Per Capita Water Use (GPCD)
Urban Water Supplier Baseline 2015 Interim 2020 Target City of Arroyo Grande 186 167 149 Cambria CSD 112.4 109 105 City of Grover Beach 140.7 127 113 City of Morro Bay 125 119 113 City of Paso Robles 241 217 193 City of Pismo Beach 236 214 192 City of San Luis Obispo 124 120 117 Nipomo CSD 240 222 204 Source: 2010 UWMPs
D.5 DEMAND REVIEW SUMMARY DISCUSSION As noted earlier in this section, no “unpublished” conclusions are made by the IRWM Plan. The reasoning behind this decision is to maintain local agency control over reporting of water demands and water supply use and management practices, including agricultural and rural users. From the UWMPs and various planning documents, it appears that, in some WPAs, the current and projected water supply cannot keep up with the growing water demands where planned growth is already approved.
An additional concern is the inherent uncertainty of water demands where supplies for rural and agricultural water use are estimated based on current land use and crop demand coefficients. In some parts of the region, the water supply for rural and agricultural water uses is currently in deficit and/or the basin safe basin yield in unknown. It should be noted that the main source of supply for rural and agricultural applications is groundwater, and 16 out of the 37 groundwater basins supplying the San Luis Obispo Region do not have reported safe basin yields. This leaves uncertainty when estimating water balances. Moreover, many of the DWR groundwater basin studies are out of date, such as the study for the Santa Maria Valley Basin in 2002, which was prior to the formal establishment of both the Nipomo Mesa Management Area, Northern Cities Management Area and Santa Maria Valley Management Area. Without an assessment on the safe basin yields for all of the groundwater sources in the San Luis Obispo Region, the total future supply sustainability is unknown.
Urban water supply appears more balanced due to the use of multiple water supply sources. In addition to groundwater, urban water demand is met by surface water, State Water Project Water, and alternative sources such as recycled water. However, as with the rural and agricultural water applications, not knowing the current state of the groundwater basins in the San Luis Obispo Region makes any true and meaningful comparison difficult to impossible.

San Luis Obispo Integrated Regional Water Management Plan Section D. Water Supply, Demand, and Water Budget
San Luis Obispo County IRWM Region D-86 July 2014
While uncertainty exists around groundwater supplies and sustainability, the region has made a concerted effort to increase water reliability by diversifying communities’ water portfolios. Communities and unincorporated areas of the region are considering the potential for various surface water sources, recycled water and desalination facilities to improve sustainability. As is described in Section G – Project Solicitation, Selection and Prioritization, stakeholders are considering a number of projects to help adapt water supplies to the changing situations this region faces (e.g. climate change, extended droughts, etc.).