Embed Size (px)
Citation preview

Section 4: County Profile
DMA 2000 Hazard Mitigation Plan Update – Morris County, New Jersey 4-2 June 2015
SECTION 4 COUNTY PROFILE This profile describes the general information of the County (physical setting, population and demographics,
general building stock, and land use and population trends) and critical facilities located within Morris County.
In Section 5, specific profile information is presented and analyzed to develop an understanding of the study
area, including the economic, structural, and population assets at risk and the particular concerns that may be
present related to hazards analyzed (for example, a high percentage of vulnerable persons in an area).
2015 Plan Update Changes
The “County Profile” is now located in Section 4; previously located in Section 3. It contains updated
information regarding the county's physical setting, population and demographics and trends, general
building stock, land use and trends, and critical facilities. Additionally, future development trends in the
county are now included in Section 4.
4.1 GENERAL INFORMATION
Morris County is one of the fastest growing counties in the New York-New Jersey-Connecticut metropolitan
region. It is located amid rolling hills, broad valleys, and lakes approximately 30 miles northwest of New York
City. The County was created by an Act of the State Legislature on March 15, 1738, separating it from
Hunterdon County. Morris County was named after Colonel Lewis Morris, then Governor of the Province of
New Jersey (the area that now includes Morris, Sussex, and Warren Counties). During the Revolutionary War,
the County was known as the military capital of the American Revolution due to its strategic location. General
George Washington and his army made their winter camp near Morristown. Much of this area is now preserved
today in the Morristown National Historical Park (Morris County 2015).
The Morris Canal was completed in 1831. It crossed the State from Phillipsburg to Newark, a distance of 90
miles, and played a major role in the movement of iron ore, coal and freight up until the 1920s when it was
dismantled when it fell into disuse. In 1838, the tracks of the Morris & Essex Railroad reached Morristown and
10 years later, extended to Dover (Morris County 2015).
Since the turn of the century, the industry of Morris County changed from iron mining to research,
pharmaceuticals and light manufacturing. The character of the land also changed from agricultural to residential.
Today, Morris County is the seventh largest county in New Jersey and home to major shopping centers, large
residential areas, and colleges and universities. Thirty-nine municipalities are found in the 477.8 square miles
of the County (Morris County 2015).
4.1.1 Physical Setting
This section presents the physical setting of the County, including: location, hydrography and hydrology,
topography and geology, and climate.
Location
Morris County is located in the north-central section of New Jersey and encompasses a total area of
approximately 481 square miles. The County is bordered by Passaic County to the northeast, Essex County to
the east, Union County to the southeast, Somerset County to the south, Hunterdon County to the southwest,
Warren County to the west, and Sussex County to the north/northwest. Most of the county’s borders are riverine
borders. The northern boundary is characterized by the Peaquannock River. The Pompton River and the eastern
Section 4: County Profile
DMA 2000 Hazard Mitigation Plan Update – Morris County, New Jersey 4-3 June 2015
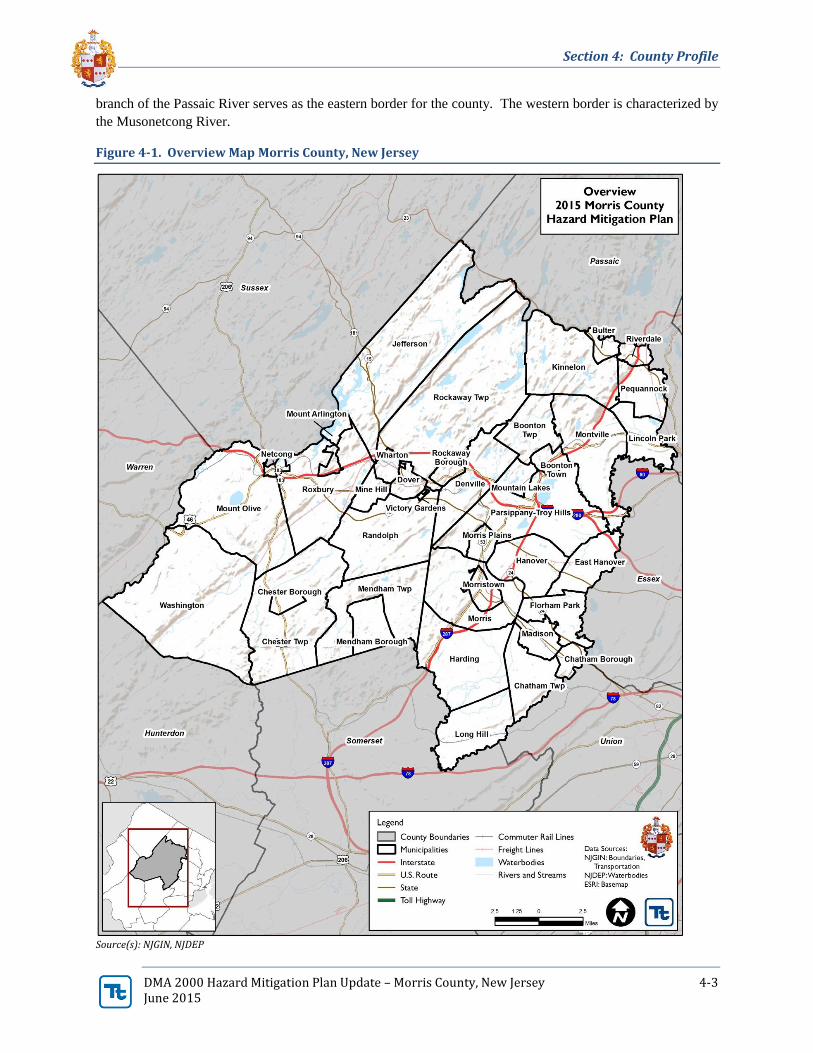
branch of the Passaic River serves as the eastern border for the county. The western border is characterized by
the Musonetcong River.
Figure 4-1. Overview Map Morris County, New Jersey
Source(s): NJGIN, NJDEP
Section 4: County Profile
DMA 2000 Hazard Mitigation Plan Update – Morris County, New Jersey 4-4 June 2015
Hydrography and Hydrology
Numerous ponds, lakes, creeks, and rivers make up the waterscape of Morris County and include: Musconetcong
River, North and South Branch Raritan River, Northern and Southern Tributary, Passaic River, Peapack River,
Pequannock River, Pinch Brook, Pompton River, Primrose Brook, Ramapo River, Rockaway River, Silver
Brook, Spring Garden Brook, Stephensburg Brook, Stonehouse Brook, Stony Brook, Susquehanna Brook,
Tanglewood Brook, Tanners Brook, Troy Brook, Watnong Brook, Weldon Brook, West Brook, West Ditch,
Western Tributary, Whippany River, White Meadow Brook, and Wills Brook (FEMA FIS 2010).
The rivers and streams within Morris County flow generally southwestward, following the trends of the
Highlands. Exceptions to this are the east flowing Pequannock River, the Rockaway River which flows south
out of Berkshire Valley and then east through a gap in the eastern Highlands, and the Passaic River which rises
in southern Mendham Township, flows north through the Watchung Valley and turns eastward at Montville
towards the Great Notch, Little Falls and Paterson (Morris County NRI 2000).
Watersheds
A watershed is the area of land that drains into a body of water such as a river, lake, stream, or bay. It is separated
from other systems by high points in the area such as hills or slopes. It includes not only the waterway itself but
also the entire land area that drains to it. For example, the watershed of a lake would include not only the streams
entering the lake but also the land area that drains into those streams and eventually the lake. Watersheds come
in all shapes and sizes and can cross municipal and county boundaries.
Drainage basins generally refer to large watersheds that encompass the watersheds of many smaller rivers and
streams. Morris County is encompassed by three major watershed basins: Delaware, Raritan and Passaic. Each
of which are made up of smaller watersheds. Details regarding these water basins and watersheds are described
below.
Delaware River Basin
The Delaware River Basin rises in the Catskill Mountains in New York State and travels 330 miles through
13,500 square miles of rural and urban landscapes and empties into the Atlantic Ocean. In Morris County, this
Basin only has a small percentage of area. The Musconetcong Watershed is the only watershed in Morris County
that is part of this Basin.
The Musconetcong River watershed includes portions of Hunterdon, Morris, Warren, and Sussex Counties. The
watershed is 157.6 square miles in size and drains the Musconetcong River. It includes Lake Hopatcong and
several smaller lakes that drain to the River. The River forms the western boundary of the County and its
watershed encompasses Jefferson Township, Mount Arlington Borough, Mount Olive Township, Netcong
Borough, Roxbury Township, and Washington Township (Musconetcong Watershed Association 2015). In
addition to the River and Lake Hopatcong, the Willis Brook, Mine Brook, Bungalow Brook and Stephensburg
Brook are located within this watershed (Morris County NRI 2000).
Passaic River Basin
The Passaic River Basin drains approximately 935 square miles of northern New Jersey and southern New York
State. The Basin is divided into three regions, Highlands, Central Basin, and Lower Valley due to the amount
and character of flooding within the Basin. The Highlands section of the Passaic River Basin drains
approximately 489 square miles and most of the major tributaries to the Passaic River drain from the Highalnds.
These tributaries include the Whippany, Rockaway, Pequannock, Wanaque, Ramapo, and Pompton Rivers.
These waterbodies are characterized by flash floods due to narrow and steep sided valleys. Flooding is common
in the established municipalities of this section of the Basin (Passaic River Coalition 2015).

Section 4: County Profile
DMA 2000 Hazard Mitigation Plan Update – Morris County, New Jersey 4-5 June 2015
The Central Basin of the Passaic River Basin is made up of large areas of meadows and swamps. It extends
from Long Hill Township in to the south to Pequannock Township in the north. Flooding has occurred primarily
in Wayne, Lincoln Park (Morris County), Pequannock (Morris County), Pompton Lakes, and Fairfield. Lastly,
the Lower Valley of the Basin extends from Little Falls to Newark Bay. It is 173 square miles in size and is the
most extensively developed area of the Basin (Passaic River Coalition 2015).
Several watersheds make up the Passaic River Basin in Morris County, including the Upper Passaic, Whippany,
Rockaway, and Pequannock River watersheds. The Upper Passaic River watershed is the most extensive of the
County's major watersheds. The Passaic River provides riverine, open water and wetland habitats for wildlife
and drinking water, fishing and recreational opportunities for those that live within the watershed. Waterbodies
in the Upper Passaic include Primrose Brook, the Great Swamp, Great Brook, Black Brook, Loantaka Brook,
Upper Passaic River, and Jersey Brook's (Morris County NRI 2000).
The Rockaway River watershed emanates in Sussex County and travels through Morris County. Prior to 1700,
there were only four natural impoundments in Morris County: Green Pond, Split Rock Reservoir, Cranberry
Pond, and one unnamed pond below Oak Ridge Lake. When the iron industry was booming in the County, the
need for water impoundments, water supply, recreation, and real estate development resulted in the current
number of water impoundments in the County, with a total of 23 lakes and 275 ponds. Today, the major
waterbodies in the County include Mountain Lake, Upper Longwood Lake, Boonton Reservoir, Taylortown
Reservoir, Splitrock Reservoir, White Meadow Lake, and Lake Denmark (Morris County NRI 2000).
The Whippany River watershed is an area of 69.3 square miles in Morris County. It is made up of small streams
and tributaries that drain into the Whippany River. The River is 16 miles long and is one of the sources of
drinking water for more than one million people in northern New Jersey. The watershed encompasses numerous
municipalities in Morris County, including: Boonton Township, Boonton Town, Denville Township, Mountain
Lakes Borough, Parsippany-Troy Hills Township, Randolph Township, Mendham Township and Borough,
Harding Township, Morris Township, Morristown, Hanover Township, East Hanover Township, Florham Park
Borough and Madison Borough (Whippany River Watershed Action Committee 2014). The major waterbodies
of the Whippany River watershed include Troy Brook, Watnong Brook, Clyde Potts Reservoir, Speedwell Lake,
and Pocahontas Lake (Morris County NRI 2000).
The Pequannock River watershed drains 90 square miles and travels 30 miles before joining with the Wanaque
River. Its headwaters are in the highlands of Sussex County and the River serves as the political boundary
between Morris and Passaic Counties. Most of the land in this watershed is forested and protected. The Newark
Watershed Conservation and Development Corporation holds 35,200 acres to protect a supply of water that is
stored in five major reservoirs: Canistear, Charlotteburg, Clinton, Oak Ridge Reservoirs and Echo Lake (New
Jersey Audubon Society 2013). Numerous lakes, ponds and reservoirs make up the Pequannock River
watershed, with the major waterbodies including Lake Kinnelon, Lake Kakeout, Charlottesburg Reservoir and
Oak Ridge Reservoir (Morris County NRI 2000).
Raritan River Basin
The Raritan River basin is the largest drainage area located entirely in New Jersey. The Basin contains portions
of Morris, Hunterdon, Somerset, Mercer, Union, Middlesex, and Monmouth Counties. Approximately 1,100
square miles of the State's land drain into the Raritan Bay via the Raritan River and its tributaries while an
additional 122 square miles is drained by the Shrewsberry and Navesink Rivers which empty into Sandy Hook
Bay (New Jersey Audubon Society 2013). The South Branch Raritan River makes up the Basin and Morris
County is located within its watershed. The South Branch drains almost 280 square miles as it winds 51 miles
from western Morris County through central Hunterdon County and into western Somerset County, before
combining with the North Branch. The South Branch begins in Morris County as the outflow of Budd Lake.

Section 4: County Profile
DMA 2000 Hazard Mitigation Plan Update – Morris County, New Jersey 4-6 June 2015
Major tributaries include the Neshanic River, Spruce Run creek, Mullhockaway Creek, and Cakepoulin Creek.
Major impoundments are the Spruce Run Reservoir and Round Valley Reservoir (NJDEP Date Unknown).
Watershed Management Areas
In 1996, the NJDEP began implementing a watershed management approach to maintaining the physical,
chemical, and biological integrity of the State's waters. This approach concentrates on managing individual
watershed areas by defining the physical geographic boundaries of the watersheds, basing water policy on sound
scientific principles, and developing partnerships with the public. The NJDEP divided New Jersey into five
water regions: the Northeast, Raritan, Northwest, Lower Delaware and Atlantic Coastal. Each water region is
then divided into three to five watershed management areas (WMAs), for a total of 20 WMAs. Each WMA
encompasses a particular group of major rivers and each consists of numerous smaller watersheds (USGS 2000).
Morris County is located within the Raritan, Northwest and Northeast water regions. Additionally, the County
is located in five of the 20 WMAs, which are described below (NJDEP 2007).
WMA 1: Upper Delaware
WMA 1 is also known as the Upper Delaware River Watershed and encompasses 746 square miles in the
mountainous northwestern corner of the State. WMA 1 includes portions of Sussex, Morris, Hunterdon Counties
and all of Warren County. In total, it contains 54 municipalities in New Jersey. Within WMA 1, there are six
major drainage basins: Delaware River, Flat Brook, Paulins Kill, Pequest River, Lopatcong and Pohatcong River
Drainage, and the Musconetcong River. These drainage basins flow in a southeasterly direction to the Delaware
River, providing an outstanding recreational resource for trout production and maintenance, as well as habitat
for an abundance of wildlife including threatened and endangered species (NJDEP 2014).
WMA 3: Pompton, Pequannock, Wanaque, Ramapo
WMA 3 is located within the water-rich Highlands Province of New Jersey. The Pequannock, Wanaque and
Ramapo Rivers all flow into the Pompton River. The Pompton River is, in turn, a major tributary to the Upper
Passaic River. WMA 3 contains some of the State's major water supply reservoir systems including the Wanaque
Reservoir, the largest surface water reservoir in New Jersey. There are four watersheds in WMA 3: Pompton,
Ramapo, Pequannock and Wanaque River Watersheds. WMA 3 lies mostly in Passaic County but also includes
parts of Bergen, Morris and Sussex Counties (NJDEP 2014).
WMA 4: Lower Passaic, Saddle River
WMA 4 includes the Lower Passaic River (from the Pompton River confluence downstream to the Newark Bay)
and its tributaries, including the Saddle River. The WMA 4 drainage area is approximately 180 square miles and
lies within portions of Passaic, Essex, Hudson, Morris and Bergen Counties. Two watersheds makeup WMA 4:
the Lower Passaic River Watershed and Saddle River Watershed. The Lower Passaic River Watershed originates
from the confluence of the Pompton River downstream to the Newark Bay. This 33-mile section meanders
through Bergen, Hudson, Passaic and Essex Counties and includes a number of falls, culminating with the Great
Falls in Paterson. This watershed has a drainage area of approximately 129 square miles. The major tributaries
to this section of the Passaic River are the Saddle River, Preakness Brook, Second River and Third River. The
Saddle River is one of the larger tributaries to the Lower Passaic River. The Saddle River Watershed has a
drainage area of approximately 51 square miles. Land in this watershed is extensively developed and contains
many older cities and industrial centers including Newark, Paterson, Clifton and East Orange (NJDEP 2014).
WMA 6: Upper and Mid Passaic, Whippany, Rockaway
WMA 6 represents the area drained by waters from the upper reaches of the Passaic River Basin including the
Passaic River from its headwaters in Morris County to its confluence with the Pompton River. WMA 6 is
characterized by extensive suburban development and reliance upon groundwater sources for water supply. It

Section 4: County Profile
DMA 2000 Hazard Mitigation Plan Update – Morris County, New Jersey 4-7 June 2015
lies within portions of Morris, Somerset, Sussex and Essex Counties and includes the Upper and Middle Passaic
River, Whippany River and Rockaway River Watersheds (NJDEP 2014).
WMA 8: North and South Branch Raritan
WMA 8 includes the North and South Branches of the Raritan River and their tributaries. Large portions of
Somerset, Hunterdon, and Morris Counties are included in this land area. The North Branch of the Raritan River
is 23 miles long and flows from northwestern Morris County through Somerset County to the confluence with
the South Branch between the towns of Branchburg and Raritan (Somerset County). Major tributaries include
the Peapack Brook, Rockaway Creek and Lamington River and the only major impoundment is Ravine Lake.
Land use in the North Branch Raritan River Watershed is primarily rural, woodland and agricultural with
scattered areas of commercial and residential but there is intense development along the major road corridors.
There are over 20 NJPDES permitted discharges and 51 biological monitoring stations in this watershed (NJDEP
2014).
The South Branch of the Raritan River is 51 miles long and flows from western Morris County through central
Hunterdon County into western Somerset County before joining the North Branch. Major tributaries include the
Neshanic River, Spruce Run Creek, Mulhockaway Creek and Cakepoulin Creek and major impoundments are
the Spruce Run and Round Valley Reservoirs. Land use in the South Branch Raritan River Watershed is mostly
agricultural, but suburban-industrial development is increasing at a rapid rate. There are approximately 23
NJPDES permitted discharges and 51 biological monitoring stations in this watershed (NJDEP 2014).
Topography and Geology
Hills and valleys run east-west, with rocky out-croppings as high as 1,000 feet above sea level in the County.
Morris County is located within two physiographic provinces: the Highlands Province from to the north and
west and the Piedmont Province to the east and southeast.
The Highlands portion of the county is characterized by a series of discontinuous rounded ridges separated by
deep and narrow valleys. In general, this area of the County is located high above sea level. Landforms within
the Highlands include generally northeast trending ridges and valleys gradually dropping in elevation from west
to east. A 200 to 400 foot border escarpment on the eastern edge, traversing the County from the Borough of
Kinnelon through Morristown and separates the Highlands from the adjacent Piedmont. Morris County is mostly
encompassed by the Highlands Province and consists mainly of Precambrian gneissic bedrock underlain by
limestone, sandstone, or shale bedrock in the area’s valley regions (USDA 1976; Morris County NRI 2000).
The Piedmont portions of Morris County are characterized by low rolling plains divided by higher ridges. In the
area of the County where the Highlands Province meets the Piedmont Province, the land is approximately 300
to 400 feet above sea level. The land then slopes downward towards the south and eastern portions of the county
(NJDEP 2006). In the Piedmont Province area of the County, the ground mainly consists of soft red shale also
known as Brunswick shale or sandstone bedrock.
Climate
The climate of Morris County is mostly a temperate continental climate with some moderate maritime influences.
Winter climate is controlled by polar continental air masses; summer climate by tropical air masses moving up
over the United States from the Gulf of Mexico. Precipitation is fairly evenly distributed from month to month,
with an average of three to four inches per month in the fall, winter and spring. The average annual precipitation
is 44.1 inches, with approximately 50 inches of and 35 inches of snow falling each year. Average seasonal
temperatures range from 29.2°F in January and 74.5°F in July; however, it varies widely from area to area in the
County (Morris County 2015; FEMA FIS 2010).

Section 4: County Profile
DMA 2000 Hazard Mitigation Plan Update – Morris County, New Jersey 4-8 June 2015
Land Use, Land Cover, and Land Use Trends
Local zoning and planning authority is provided for under the New Jersey Municipal Land Use Law, which gives
municipalities zoning and planning authority. DMA 2000 requires that communities consider land use trends,
which can impact the need for, and priority of, mitigation options over time. Land use trends significantly impact
exposure and vulnerability to various hazards. For example, significant development in a hazard area increases
the building stock and population exposed to that hazard.
This plan provides a general overview of population and land use and types of development occurring within the
study area. An understanding of these development trends can assist in planning for future development and
ensuring that appropriate mitigation, planning, and preparedness measures are in place to protect human health
and community infrastructure.
Morris County is one of the largest Counties in the State and has a diverse landscape; the majority of the county
is either forested or developed land. In 2002, the majority or 39.78 percent of the land in Morris County was
forested land. The 2007 figures show a slight decrease in total forested land, which was 38.66 percent of the
County. In 2002 37.16 percent was urban land; 14.10 percent was wetlands land; 1.05 percent was barren land;
and 4.33 percent was agricultural lands. When compared with the land use land cover data set from 2007, there
has been a decrease in agricultural land (-4.6 percent), barren land (-16 percent), forest (-2.8 percent) and
wetlands (-0.8 percent), while there was an increase in urban land use (+ 4.1 percent). Refer to Table 4-1 and
Figure 4-2 below.
Table 4-1. Land Use Summary for Morris County, 2002 & 2007
Land Use Category
2002 Data 2007 Data
Acreage
Percent of Morris
County Acreage
Percent of
Morris County
Agriculture 13,353.70 4.33% 12,733.32 4.13%
Barren 3,237.77 1.05% 2,709.99 0.88%
Forest 122,565.72 39.78% 119,132.19 38.66%
Urban 114,486.72 37.16% 119,135.15 38.67%
Wetlands 43,453.39 14.10% 43,103.74 13.99%
Source: NJDEP (2007 LULC)
Note: Urban land includes residential, industrial, transportation, and recreational land. Water is excluded from the table above.

Section 4: County Profile
DMA 2000 Hazard Mitigation Plan Update – Morris County, New Jersey 4-9 June 2015
Figure 4-2. 2007 Land Use Land Cover for Morris County
Source: NJDEP 2007

Section 4: County Profile
DMA 2000 Hazard Mitigation Plan Update – Morris County, New Jersey 4-10 June 2015
Highlands Region of New Jersey
The New Jersey Highlands is a 1,343 square mile area (over 800,000 acres) in the northwest portion of New
Jersey. It is noted for its scenic beauty and environmental significance. The Highlands stretches from
Phillipsburg (Warren County) in southwest New Jersey to Ringwood (Passaic County) in the northeast. The
Highlands Region lies within portions of seven counties, Hunterdon, Somerset, Sussex, Warren, Morris, Passaic
and Bergen, and includes 88 municipalities. The Highlands Act designates approximately 398,000 acres as the
Highlands Preservation Area which is identified as an area of exceptional natural resource value. The remainder
of the Highlands Region that is not located within the Preservation Area lies within the Highlands Planning Area.
All of Morris County is located within the New Jersey Highlands. Northern and southwestern Morris County
are located in the Highlands Preservation Area and the remainder of the County is located within the Highlands
Planning Area.
Agriculture
In 2012, there were 366 farms in Morris County, a decrease of 13% from 2007 which had 422 farms. The farms
in the County cover 14,458 acres, again, a decrease since 2007 (17,028 acres) (USDA 2012). Over the last 20
years, farming in the County has shifted from livestock to nursery products. Many farms in Morris County
operate seasonal and/or year-round farm markets or farm stands which provide the farms direct links to their
customers. Nearly every municipality in Morris County contains several acres of farmland, with Washington
Township having the largest area of land used for farmland (10,815 acres or 37.7% of the Township's total land
area) (Morris County Planning 2014).
Open Space and Parkland
The Morris County Park Commission includes 38 facilities: historic sites, golf courses, outdoor educational and
recreational facilities, arboreta, conservation areas, 150 miles of trails, and ice skating arena. The Commission
is the largest park system in New Jersey (based on acreage) with more than 17,500 acres of passive and active
recreational opportunities throughout the County. This includes golf, hiking, ice skating, sledding, ice fishing,
fishing, boating, swimming, cross-country skiing, snowshoeing, biking, recreational fields, environmental
education and special programming throughout the year. The largest wildlife preserves in the County are the
Mahlon Dickerson Reverse in Jefferson Township and Silas Condict Park in Kinnelon. Table 4-2 identifies the
Morris County and New Jersey State parks located throughout the County.
Table 4-2. County and State Parks in Morris County
Park Acreage Municipality
Allamuchy Mountain and Stephens State Park 2,440 Mount Olive Township
Bamboo Brook Outdoor Education Center 100 Chester Township
Cooper Gristmill N/A Chester Township
Craigmeur Recreation Complex 130 Jefferson Township and Rockaway Township
Elizabeth D. Kay Environmental Center 223 Chester Township
Fosterfields Living Historical Farm 200 Morris Township
Frelinghuysen Arboretum 127 Morris Township
Great Swamp Outdoor Education Center 7,500 Chatham Township
Hacklebarney State Park 978 Chester Township
Hedden Park 380 Dover, Mine Hill, and Randolph
Historic Speedwell 7.5 Morristown

Section 4: County Profile
DMA 2000 Hazard Mitigation Plan Update – Morris County, New Jersey 4-11 June 2015
Park Acreage Municipality
James Andrews Memorial Park 75 Randolph Township
Lee's Park Marina N/A Mount Arlington Borough
Lewis Morris Park 1,154 Harding, Mendham and Morris Townships
Loantaka Brook Reservation 570 Morristown
Mahlon Dickerson Reservation 3,200 Jefferson Township
Mennen Sports Arena N/A Morris Township
Mount Hope Historical Park 391 Rockaway Township
Mount Paul Memorial Park 285 Chester Township
Old Troy Park 96 Parsippany-Troy Hills Township
Passaic River Park 769 Chatham and Long Hill Townships
Patriots' Path 35 miles Throughout the County
Pyramid Mountain Natural Historic Area 1,500 Kinnelon Borough and Montville Township
Schooley's Mountain Park 797 Washington Township
Seaton Hackney Farm 38 Morris Township
Silas Condict Park 1,508.75 Kinnelon Borough
Tourne Park 546.9 Denville Township
Traction Line Recreation Trail 2 miles Madison Borough, Morristown and Morris
Township
Willowwood Arboretum 130 Chester Township
Source: Morris County Park Commission
N/A Not Available
Urban Land
Urban land includes most of what normally would be considered developed land. Residential areas, commercial
areas, services and institutions, industrial areas, and those developed for transportation and utilities are the
primary land uses included in urban land. There are several other open land categories that are included with
urban land. Developed recreation areas, whether a part of a park, educational facility, or private concern (e.g.
golf course), are also considered a part of urban land. Also included are areas such as large, landscaped lawns
in corporate businesses and service centers, parks, and residential areas (NJDEP, 2014). The following table
identifies the urbanized municipalities in Morris County, based on NJDEP 2002 land use/land cover data.
Urbanized municipalities in Morris County are those communities where 90% or more of the total land is
considered urban.
Table 4-3. Urban Municipalities in Morris County
Municipality
Population
(2010 Census)
Land Area
(Square Miles)
Population per
Square Mile
Boonton Town 8,347 2.34 3,575
Butler 7,539 2.04 3703
Chatham Borough 8,962 2.37 3776
Dover 18,157 2.68 6766
Madison 15,845 4.21 3768
Morristown 18,411 2.93 6285
Rockaway Borough 6,438 2.07 3107
Victory Gardens 1,520 0.15 10,419
Wharton 6,522 2.15 3039
Source: Morris County Department of Planning and Public Works, 2011
Section 4: County Profile
DMA 2000 Hazard Mitigation Plan Update – Morris County, New Jersey 4-12 June 2015
4.2 POPULATION AND DEMOGRAPHICS
DMA 2000 requires that HMPs consider the risk and vulnerability of socially vulnerable populations to natural
hazards. These populations can be more susceptible to hazard events, based on a number of factors including
their physical and financial ability to react or respond during a hazard and the location and construction quality
of their housing. For the purposes of this study, vulnerable populations shall include (1) the elderly (persons
aged 65 and over) and (2) those living in low-income households.
4.2.1 Population Characteristics
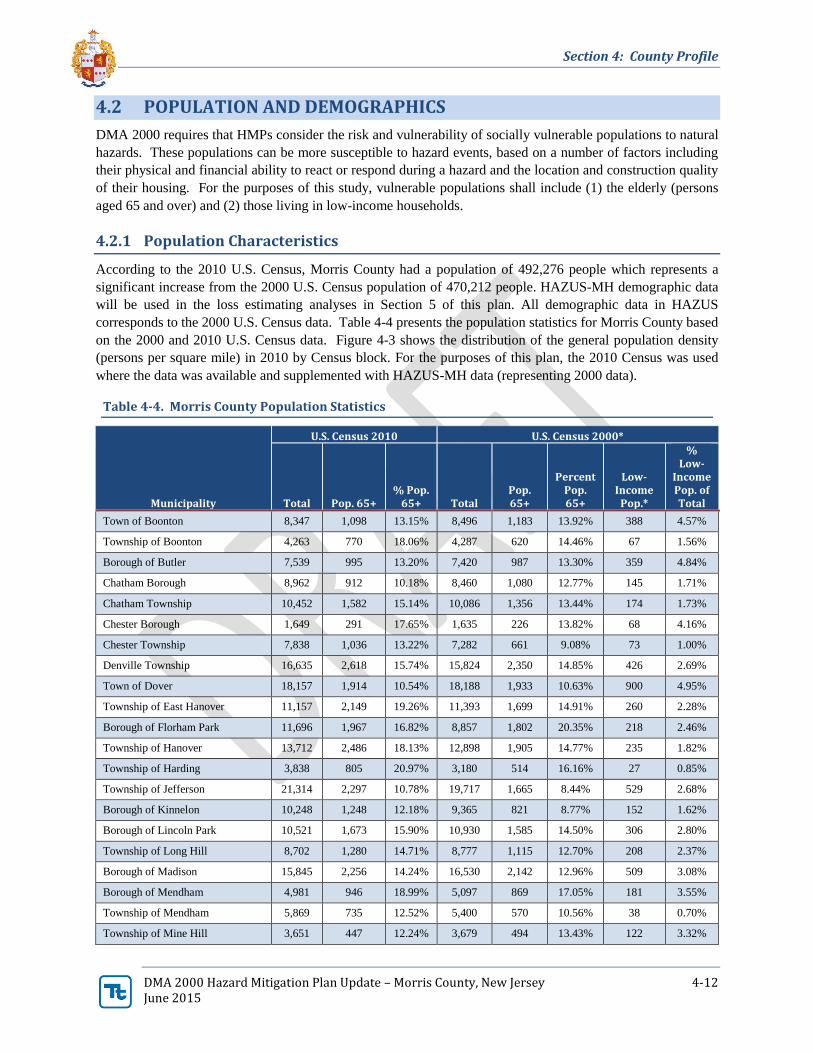
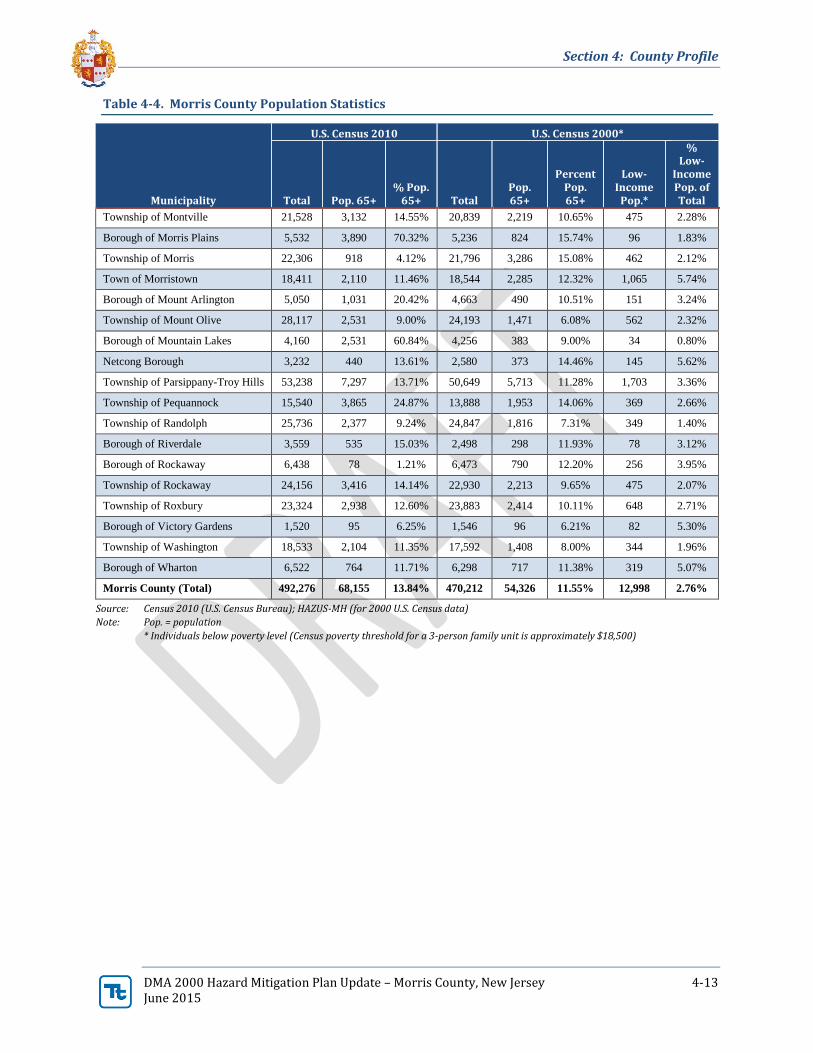
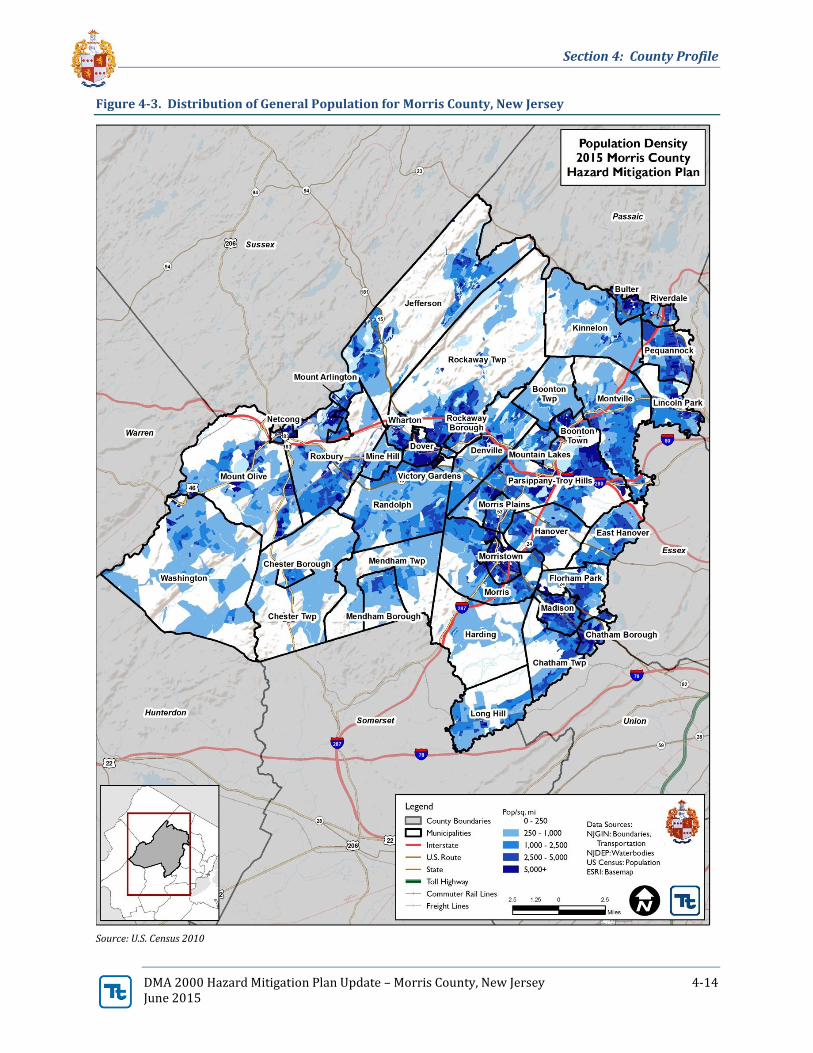
According to the 2010 U.S. Census, Morris County had a population of 492,276 people which represents a
significant increase from the 2000 U.S. Census population of 470,212 people. HAZUS-MH demographic data
will be used in the loss estimating analyses in Section 5 of this plan. All demographic data in HAZUS
corresponds to the 2000 U.S. Census data. Table 4-4 presents the population statistics for Morris County based
on the 2000 and 2010 U.S. Census data. Figure 4-3 shows the distribution of the general population density
(persons per square mile) in 2010 by Census block. For the purposes of this plan, the 2010 Census was used
where the data was available and supplemented with HAZUS-MH data (representing 2000 data).
Table 4-4. Morris County Population Statistics
Municipality
U.S. Census 2010 U.S. Census 2000*
Total Pop. 65+ % Pop.
65+ Total Pop. 65+
Percent Pop. 65+
Low-Income
Pop.*
% Low-
Income Pop. of Total
Town of Boonton 8,347 1,098 13.15% 8,496 1,183 13.92% 388 4.57%
Township of Boonton 4,263 770 18.06% 4,287 620 14.46% 67 1.56%
Borough of Butler 7,539 995 13.20% 7,420 987 13.30% 359 4.84%
Chatham Borough 8,962 912 10.18% 8,460 1,080 12.77% 145 1.71%
Chatham Township 10,452 1,582 15.14% 10,086 1,356 13.44% 174 1.73%
Chester Borough 1,649 291 17.65% 1,635 226 13.82% 68 4.16%
Chester Township 7,838 1,036 13.22% 7,282 661 9.08% 73 1.00%
Denville Township 16,635 2,618 15.74% 15,824 2,350 14.85% 426 2.69%
Town of Dover 18,157 1,914 10.54% 18,188 1,933 10.63% 900 4.95%
Township of East Hanover 11,157 2,149 19.26% 11,393 1,699 14.91% 260 2.28%
Borough of Florham Park 11,696 1,967 16.82% 8,857 1,802 20.35% 218 2.46%
Township of Hanover 13,712 2,486 18.13% 12,898 1,905 14.77% 235 1.82%
Township of Harding 3,838 805 20.97% 3,180 514 16.16% 27 0.85%
Township of Jefferson 21,314 2,297 10.78% 19,717 1,665 8.44% 529 2.68%
Borough of Kinnelon 10,248 1,248 12.18% 9,365 821 8.77% 152 1.62%
Borough of Lincoln Park 10,521 1,673 15.90% 10,930 1,585 14.50% 306 2.80%
Township of Long Hill 8,702 1,280 14.71% 8,777 1,115 12.70% 208 2.37%
Borough of Madison 15,845 2,256 14.24% 16,530 2,142 12.96% 509 3.08%
Borough of Mendham 4,981 946 18.99% 5,097 869 17.05% 181 3.55%
Township of Mendham 5,869 735 12.52% 5,400 570 10.56% 38 0.70%
Township of Mine Hill 3,651 447 12.24% 3,679 494 13.43% 122 3.32%
Section 4: County Profile
DMA 2000 Hazard Mitigation Plan Update – Morris County, New Jersey 4-13 June 2015
Table 4-4. Morris County Population Statistics
Municipality
U.S. Census 2010 U.S. Census 2000*
Total Pop. 65+ % Pop.
65+ Total Pop. 65+
Percent Pop. 65+
Low-Income
Pop.*
% Low-
Income Pop. of Total
Township of Montville 21,528 3,132 14.55% 20,839 2,219 10.65% 475 2.28%
Borough of Morris Plains 5,532 3,890 70.32% 5,236 824 15.74% 96 1.83%
Township of Morris 22,306 918 4.12% 21,796 3,286 15.08% 462 2.12%
Town of Morristown 18,411 2,110 11.46% 18,544 2,285 12.32% 1,065 5.74%
Borough of Mount Arlington 5,050 1,031 20.42% 4,663 490 10.51% 151 3.24%
Township of Mount Olive 28,117 2,531 9.00% 24,193 1,471 6.08% 562 2.32%
Borough of Mountain Lakes 4,160 2,531 60.84% 4,256 383 9.00% 34 0.80%
Netcong Borough 3,232 440 13.61% 2,580 373 14.46% 145 5.62%
Township of Parsippany-Troy Hills 53,238 7,297 13.71% 50,649 5,713 11.28% 1,703 3.36%
Township of Pequannock 15,540 3,865 24.87% 13,888 1,953 14.06% 369 2.66%
Township of Randolph 25,736 2,377 9.24% 24,847 1,816 7.31% 349 1.40%
Borough of Riverdale 3,559 535 15.03% 2,498 298 11.93% 78 3.12%
Borough of Rockaway 6,438 78 1.21% 6,473 790 12.20% 256 3.95%
Township of Rockaway 24,156 3,416 14.14% 22,930 2,213 9.65% 475 2.07%
Township of Roxbury 23,324 2,938 12.60% 23,883 2,414 10.11% 648 2.71%
Borough of Victory Gardens 1,520 95 6.25% 1,546 96 6.21% 82 5.30%
Township of Washington 18,533 2,104 11.35% 17,592 1,408 8.00% 344 1.96%
Borough of Wharton 6,522 764 11.71% 6,298 717 11.38% 319 5.07%
Morris County (Total) 492,276 68,155 13.84% 470,212 54,326 11.55% 12,998 2.76%
Source: Census 2010 (U.S. Census Bureau); HAZUS-MH (for 2000 U.S. Census data)
Note: Pop. = population
* Individuals below poverty level (Census poverty threshold for a 3-person family unit is approximately $18,500)
Section 4: County Profile
DMA 2000 Hazard Mitigation Plan Update – Morris County, New Jersey 4-14 June 2015
Figure 4-3. Distribution of General Population for Morris County, New Jersey
Source: U.S. Census 2010

Section 4: County Profile
DMA 2000 Hazard Mitigation Plan Update – Morris County, New Jersey 4-15 June 2015
4.2.2 Vulnerable Populations
Identifying concentrations of vulnerable populations can assist communities in targeting preparedness, response
and mitigation actions. For the purposes of this planning process, vulnerable populations in Morris County
include children, elderly, low-income, the physically or mentally disabled, non-English speakers and the
medically or chemically dependent.
Age
Children are considered vulnerable because they are dependent on others to safely access resources during
emergencies. The elderly are more apt to lack the physical and economic resources necessary for response to
hazard events and are more likely to suffer health-related consequences making recovery slower. Those living
on their own may have more difficulty evacuating their homes. The elderly are also more likely to live in senior
care and living facilities (described in Section 4.6) where emergency preparedness occurs at the discretion of
facility operators.
According to the 2010 Census, the median age in Morris County was 41.3 years. Of the 2010 population, 68,155
(13.8%) of the County’s population is age 65 and older. According to the 2000 Census, 11.6% of the County’s
total population (or 54,326 persons) were age 65 and older. Figure 4-4 shows the distribution of persons over
age 65 in Morris County. According to the 2010 Census, 103,023 (20.9%) people were age 16 or younger;
105,127 people (22.4%) were age 16 or younger according to the 2000 Census. Figure 4-6 shows the distribution
of person under age 16 in Morris County.
Income
Of the total population, economically disadvantaged populations are more vulnerable because they are likely to
evaluate their risk and make decisions based on the major economic impact to their family and may not have
funds to evacuate. Based on the 2009-2013 American Community Survey five-year estimates, per capita income
in Morris County was estimated at $48,814 and the median household income for Morris County is $98,633 (in
2013 inflation-adjusted dollars). It is estimated that over 14.1% of households receive an income between
$50,000 and $74,999 per year and 17% of households receive over $200,000 annually.
The 2012 U.S. Census American Community Survey data identified approximately 17,249 households as having
an annual income of less than $25,000 and are therefore below the poverty level. According to the Census’ 2013
poverty thresholds, the weighted average thresholds for a family of four in 2013 was $23,834; for a family of
three, $18,552; for a family of two, $15,142, and for unrelated individuals, $11,888. Figure 4-5 shows the
distribution of low income persons.
It is noted that the Census data for household income provided in HAZUS-MH includes two ranges ($0-10,000
and $10,000-$20,000/year) that were totaled to provide the “low-income” data used in this study. This does not
correspond exactly with the “poverty” thresholds established by the 2013 U.S. Census Bureau, which identifies
households with three adults and no children with an annual household income below $18,222 per year, or
households with one adult and two children with an annual household income below $18,769 per year as “low
income” for this region. This difference is not believed to be significant for the purposes of this planning effort.
Physically or Mentally Disabled
Based on the 2009-2013 American Community Survey, the total non-institutionalized population of Passaic
County is 491,293, which is approximately 99% of the total population. Approximately 37,386 of those residents
are living with a disability. About 7.7% of these residents are under the age of 18 and about 53.3% are 65 years
or older.

Section 4: County Profile
DMA 2000 Hazard Mitigation Plan Update – Morris County, New Jersey 4-16 June 2015
Non-English Speakers
According to the 2009-2013 American Community Survey, 23.9% of the County’s population over the age of 5
primarily speaks a language other than English at home; this is slightly lower than the State average of 30.0%.
The greatest population of non-English speakers is Spanish-speaking residents, which make up approximately
10.1% of the population. Of the communities in Morris County, the Towns of Dover (72.8%) and Morristown
(40.4%) and the Borough of Wharton (45.3%) have the largest proportion of non-English speaking households
in the County. The primary non-English language spoken in these homes in Spanish; this is most prevalent in
the Town of Dover, where 68.5% of the population speaks Spanish at home.

Section 4: County Profile
DMA 2000 Hazard Mitigation Plan Update – Morris County, New Jersey 4-17 June 2015
Figure 4-4. Distribution of Persons over the Age of 65 in Morris County, New Jersey
Source: HAZUS-MH
Note: Distribution is based on Census Block designations.

Section 4: County Profile
DMA 2000 Hazard Mitigation Plan Update – Morris County, New Jersey 4-18 June 2015
Figure 4-5. Distribution of Low-Income Population in Morris County, New Jersey
Source: HAZUS-MH
Note: Distribution is based on Census Block designations.

Section 4: County Profile
DMA 2000 Hazard Mitigation Plan Update – Morris County, New Jersey 4-19 June 2015
Figure 4-6. Distribution of Persons under the Age of 16 in Morris County, New Jersey
Source: HAZUS-MH
Note: Distribution is based on Census Block designations.

Section 4: County Profile
DMA 2000 Hazard Mitigation Plan Update – Morris County, New Jersey 4-20 June 2015
Metropolitan Statistical Area (MSA)
Metropolitan statistical areas are geographic entities delineated by the New Jersey Office of Management and
Budget (OMB) for use by Federal statistical agencies in collecting, tabulating, and publishing Federal statistics.
The general concept of a metropolitan area is that of a large nucleus, together with adjacent communities, having
a high degree of social and economic integration with that core (Census 2014).
Northeast New Jersey and portions of New York State are located in the New York-Newark Combined Statistical
Area. This area is broken down into smaller metropolitan statistical areas (MSA). Morris County is located
within the New York-Newark Combined Statistical Area and the New York-Newark-Jersey City Metropolitan
Statistical Area U.S. Census 2014).
Due to the size of the New York-Newark-Jersey City Metropolitan Statistical Area, it is further divided into four
metropolitan divisions which are separately identifiable employments centers within the MSA. Passaic County
is part of the New York-Jersey City-White Plains NY-NJ Metropolitan Division labor market (Camoin
Associates 2014). Figure 4-6 illustrates the different statistical areas in New Jersey and parts of New York State.

Section 4: County Profile
DMA 2000 Hazard Mitigation Plan Update – Morris County, New Jersey 4-21 June 2015
Figure 4-6. New York Combined Statistical Area
Source: U.S. Census 2014 (https://www.census.gov/geo/maps-data/maps/statecbsa.html)

Section 4: County Profile
DMA 2000 Hazard Mitigation Plan Update – Morris County, New Jersey 4-22 June 2015
4.2.3 Population Trends
This section discusses population trends to use as a basis for estimating future changes of the population and
significantly change the character of the area. Population trends can provide a basis for making decisions on the
type of mitigation approaches to consider and the locations in which these approaches should be applied. This
information can also be used to support planning decisions regarding future development in vulnerable areas.
Over the last 10 years, new regulations, new economic realities and changing conditions influenced the rate of
population growth in Morris County and will continue to influence population growth moving forward.
Enactment of the Highlands Act in 2004 and subsequent adoption of related NJDEP regulations is one of the
reasons for the rate of population growth. These actions reduced the development capacity in most of Morris
County since 89% of the County is in the Highlands Region. The addition of Highlands-specific environmental
restrictions further reduces the development potential in the County. Continued support for open space and
farmland preservation programs also reduced the availability of land for residential development and subsequent
population growth. Demographic trends tend to influence overall population growth in the County. The number
of households with children is declining in Morris County; however, the number of non-family and one-person
households has been rising. Additionally, the local population continues to age. A continuation of these trends
may suppress future rates of population growth. Lastly, the amount of available land for residential development
is shrinking. With these trends and conditions, the County's population is currently projected to grow just 1.9%
by the year 2020 (Morris County Planning 2013). Population growth projections is discussed later on in this
section.
According to the U.S. Census Bureau Morris County’s 2010 population was 492,276 persons, which is 4.69%
decrease from the 2000 Census population of 470,212. From 1820 to 2013, the County has experienced a
constant growth in population. Between 1810 and 1820, the County started seeing a slight decrease in total
population before continuing population growth. The largest increase was seen between the years 1950 to 1960,
when the County experienced a 59.16% (97,249 persons) population increase. The smallest increase was seen
between the years 1980 and 1990, when Morris County experienced a 3.37% (13,723 persons) population
increase. Since 1820, the County has seen a continual increase in population with the largest growth occurring
during the middle of the 20th Century. Table 4-5 displays the population and change in population from 1790 to
2013 in Morris County.
Table 4-5. Morris County Population Trends, 1790 to 2013
Year Population
Change in
Population
Percent (%)
Population
Change
1790 16,216 N/A N/A
1800 17,750 1,534 9.46%
1810 21,828 4,078 22.97%
1820 21,368 -460 -2.11%
1830 23,666 2,298 10.75%
1840 25,844 2,178 9.20%
1850 30,158 4,314 16.69%
1860 34,677 4,519 14.98%
1870 43,137 8,460 24.40%
1880 50,861 7,724 17.91%
1890 54,101 3,240 6.37%

Section 4: County Profile
DMA 2000 Hazard Mitigation Plan Update – Morris County, New Jersey 4-23 June 2015
Year Population
Change in
Population
Percent (%)
Population
Change
1900 65,156 11,055 20.43%
1910 74,704 9,548 14.65%
1920 82,694 7,990 10.70%
1930 110,445 27,751 33.56%
1940 125,732 15,287 13.84%
1950 164,371 38,639 30.73%
1960 261,620 97,249 59.16%
1970 383,454 121,834 46.57%
1980 407,630 24,176 6.30%
1990 421,353 13,723 3.37%
2000 470,212 48,859 11.60%
2010 492,276 22,064 4.69%
2013 499,397 7,121 1.45%
Source: U.S. Census Bureau, 2014
Note: Change in population and percent in population change was calculated from available data
Table 4-6 displays the ten largest municipalities in Morris County. According to the 2010 data, the Township
of Parsippany-Troy Hills was the most populous municipality in Morris County, comprising 10.8% of the
County's total population.
Table 4-6. Ten Largest Municipalities in Morris County
Rank Municipality 2010 Population
1 Township of Parsippany-
Troy Hills 53,238
2 Township of Mount Olive 28,117
3 Township of Randolph 25,736
4 Township of Rockaway 24,156
5 Township of Roxbury 23,324
6 Township of Morris 22,306
7 Township of Montville 21,528
8 Township of Jefferson 21,314
9 Township of Washington 18,533
10 Town of Morristown 18,411
Source: U.S. Census, 2010
Over the next 15 years, from 2017 to 2032, Morris County has a projected population growth of 9.2% percent.
Based on New Jersey Department of Labor population projections, the County population is expected to reach
510,700 by 2017 and 557,900 by 2032 (Figure 4-7).

Section 4: County Profile
DMA 2000 Hazard Mitigation Plan Update – Morris County, New Jersey 4-24 June 2015
Figure 4-7. Morris County Population Projections, 2017 to 2032
Source: New Jersey Department of Labor and Workforce Development, 2014
From 1970 to 2011, almost two-thirds of Morris County's population growth occurred in just seven of the 39
municipalities: Township of Mount Olive, Township of Randolph, Township of Roxbury, Township of
Washington, Township of Jefferson, and Township of Rockaway. Over the same period of time, the Township
of Mount Olive also led with the greatest percentage increase of 172%. As shown in Table 4-7, a majority of
the County's municipalities experienced an increase in population, with the Borough of Riverdale seeing the
greatest increase in population, 42.5%. The Borough of Chester experienced the smallest increase in population
of just 0.86%. The Borough of Madison experienced the largest decrease in population between 2000 and 2010,
with a 4.14% decrease, while the Town of Dover saw the smallest decrease in population, a 0.17% decrease.
Table 4-7. Population Trends in Morris County by Municipality
Municipality 2000 Census 2010 Census
Change in
Population
Percent (%)
Population
Change
Town of Boonton 8,496 8,347 -149 -1.75%
Township of Boonton 4,287 4,263 -24 -0.56%
Borough of Butler 7,420 7,539 119 1.60%
Chatham Borough 8,460 8,962 502 5.93%
Chatham Township 10,086 10,452 366 3.63%
Chester Borough 1,635 1,649 14 0.86%

Section 4: County Profile
DMA 2000 Hazard Mitigation Plan Update – Morris County, New Jersey 4-25 June 2015
Table 4-7. Population Trends in Morris County by Municipality
Municipality 2000 Census 2010 Census
Change in
Population
Percent (%)
Population
Change
Chester Township 7,282 7,838 556 7.64%
Denville Township 15,824 16,635 811 5.13%
Town of Dover 18,188 18,157 -31 -0.17%
Township of East Hanover 11,393 11,157 -236 -2.07%
Borough of Florham Park 8,857 11,696 2,839 32.05%
Township of Hanover 12,898 13,712 814 6.31%
Township of Harding 3,180 3,838 658 20.69%
Township of Jefferson 19,717 21,314 1,597 8.10%
Borough of Kinnelon 9,365 10,248 883 9.43%
Borough of Lincoln Park 10,930 10,521 -409 -3.74%
Township of Long Hill 8,777 8,702 -75 -0.85%
Borough of Madison 16,530 15,845 -685 -4.14%
Borough of Mendham 5,097 4,981 -116 -2.28%
Township of Mendham 5,400 5,869 469 8.69%
Township of Mine Hill 3,679 3,651 -28 -0.76%
Township of Montville 20,839 21,528 689 3.31%
Borough of Morris Plains 5,236 5,532 296 5.65%
Township of Morris 21,796 22,306 510 2.34%
Town of Morristown 18,544 18,411 -133 -0.72%
Borough of Mount Arlington 4,663 5,050 387 8.30%
Township of Mount Olive 24,193 28,117 3,924 16.22%
Borough of Mountain Lakes 4,256 4,160 -96 -2.26%
Netcong Borough 2,580 3,232 652 25.27%
Township of Parsippany-Troy Hills 50,649 53,238 2,589 5.11%
Township of Pequannock 13,888 15,540 1,652 11.90%
Township of Randolph 24,847 25,736 889 3.58%
Borough of Riverdale 2,498 3,559 1,061 42.47%
Borough of Rockaway 6,473 6,438 -35 -0.54%
Township of Rockaway 22,930 24,156 1,226 5.35%
Township of Roxbury 23,883 23,324 -559 -2.34%
Borough of Victory Gardens 1,546 1,520 -26 -1.68%
Township of Washington 17,592 18,533 941 5.35%
Borough of Wharton 6,298 6,522 224 3.56%

Section 4: County Profile
DMA 2000 Hazard Mitigation Plan Update – Morris County, New Jersey 4-26 June 2015
4.3 GENERAL BUILDING STOCK
The 2000 U.S. Census data identified 169,711 households (174,379 housing units) in Morris County. The 2010
U.S. Census reported 180,534 households (189,842 housing units) in Morris County. The County experienced
an increase in both households and housing units from 2000 to 2010. As for households, between 2000 and
2010, the County saw a 6.4% increase. As for housing units, the County experienced an increase of 8.9%
between 2000 and 2010. The U.S. Census defines household as all the persons who occupy a housing unit, and
a housing unit as a house, an apartment, a mobile home, a group of rooms, or a single room that is occupied (or
if vacant, is intended for occupancy) as separate living quarters. Therefore, you may have more than one
household per housing unit. The median price of a single family home in Morris County was estimated at
$432,400 (U.S. Census, 2013).
For this update, the default general building stock in HAZUS-MH was updated and replaced with a custom
building inventory for Morris County both at the aggregate and structure level. The building stock update was
performed using the most current parcel and tax assessment data provided by the Morris County Geographic
Information System Services. For the purposes of this plan, building footprints were also received from the
County. The tax data associated to the parcels was spatial joined to the building footprints to gain an accurate
building location for the Vulnerability Assessment; this resulted in approximately 185,799 structures with
improved values. The improved value was utilized to estimate the building structure replacement value, which
total approximately $96 billion. Estimated content value was calculated by using 50-percent of the residential
improvement value, and 100-percent of the non-residential improvement values. Using this methodology, there
is approximately $60 billion in contents within these improved properties. Approximately 90-percent of the total
buildings in the County are residential, which make up approximately 71-percent of the building stock structural
value associated with residential housing. Table 4-8 presents building stock statistics by occupancy class for
Morris County.

Section 4: County Profile
DMA 2000 Hazard Mitigation Plan Update – Morris County, New Jersey 4-27 June 2015
Table 4-8. Number of Buildings and Improvement Value by Occupancy Class
Municipality
All Occupancies Residential Commercial Industrial
Count
Improved
Value
Estimated
Contents
Total
(Improved +
Contents) Count
Total (Improved
+ Contents) Count
Total
(Improved +
Contents) Count
Total
(Improved +
Contents)
Town of Boonton 3,210 $1,457,301,260 $902,505,444 $2,359,806,704 2,840 $1,664,387,447 206 $263,574,856 60 $265,769,756
Township of Boonton 1,853 $1,054,314,439 $603,540,055 $1,657,854,494 1,667 $1,352,323,151 50 $34,427,756 15 $76,547,881
Borough of Butler 2,725 $1,135,469,854 $682,689,218 $1,818,159,072 2,494 $1,358,341,909 157 $221,969,358 22 $96,263,688
Chatham Borough 3,245 $1,327,968,537 $784,801,195 $2,112,769,732 2,950 $1,629,502,024 215 $274,440,554 44 $62,895,336
Chatham Township 3,998 $2,099,403,804 $1,135,469,036 $3,234,872,840 3,827 $2,891,804,306 46 $87,276,697 2 $1,185,252
Chester Borough 859 $463,303,287 $334,729,449 $798,032,736 545 $385,721,513 182 $289,000,048 0 $0
Chester Township 3,587 $2,412,577,533 $1,350,758,112 $3,763,335,644 3,041 $3,185,458,262 113 $127,995,497 9 $322,838,243
Denville Township 7,032 $3,563,818,505 $2,123,394,460 $5,687,212,965 6,424 $4,321,272,137 311 $563,144,607 60 $405,497,182
Town of Dover 4,385 $1,855,474,161 $1,220,271,165 $3,075,745,326 3,875 $1,905,608,989 330 $388,982,856 66 $699,112,064
Township of East Hanover 4,776 $3,225,617,098 $2,176,279,135 $5,401,896,233 4,277 $3,148,013,888 253 $1,271,691,827 138 $327,816,526
Borough of Florham Park 3,722 $2,384,920,542 $1,606,922,715 $3,991,843,257 3,415 $2,333,993,480 171 $887,770,764 16 $922,576,276
Township of Hanover 7,045 $3,892,006,627 $2,690,767,686 $6,582,774,313 6,328 $3,603,716,824 386 $1,583,375,996 138 $322,838,243
Township of Harding 2,050 $1,503,850,292 $840,794,371 $2,344,644,664 1,676 $1,989,167,762 61 $90,005,979 0 $0
Township of Jefferson 9,281 $3,243,744,317 $1,830,589,001 $5,074,333,318 8,596 $4,239,465,949 397 $429,632,476 30 $27,638,417
Borough of Kinnelon 4,078 $2,575,473,364 $1,367,138,826 $3,942,612,191 3,939 $3,625,003,613 48 $110,143,729 2 $1,115,997
Borough of Lincoln Park 4,184 $1,578,621,777 $942,709,715 $2,521,331,492 3,846 $1,907,736,186 75 $139,666,925 39 $223,630,510
Township of Long Hill 3,515 $1,690,599,454 $995,729,639 $2,686,329,094 3,184 $2,084,609,446 167 $277,880,989 52 $111,043,221
Borough of Madison 6,235 $2,527,368,462 $1,510,850,273 $4,038,218,735 5,693 $3,049,554,564 285 $444,406,712 23 $15,768,467
Borough of Mendham 2,054 $1,227,026,329 $711,207,723 $1,938,234,052 1,802 $1,547,455,817 112 $132,952,604 1 $302,240
Township of Mendham 2,545 $1,881,795,736 $1,018,756,001 $2,900,551,737 2,274 $2,589,119,205 14 $11,002,849 0 $0
Township of Mine Hill 1,555 $615,167,212 $353,135,153 $968,302,365 1,448 $786,096,175 68 $57,993,343 9 $80,707,493
Township of Montville 8,066 $4,968,934,467 $2,966,574,465 $7,935,508,932 7,405 $6,007,080,006 267 $449,944,780 112 $999,277,261
Borough of Morris Plains 2,361 $1,410,196,945 $943,307,495 $2,353,504,441 2,193 $1,400,668,351 99 $386,806,293 23 $460,763,164

Section 4: County Profile
DMA 2000 Hazard Mitigation Plan Update – Morris County, New Jersey 4-28 June 2015
Municipality
All Occupancies Residential Commercial Industrial
Count
Improved
Value
Estimated
Contents
Total
(Improved +
Contents) Count
Total (Improved
+ Contents) Count
Total
(Improved +
Contents) Count
Total
(Improved +
Contents)
Township of Morris 9,488 $5,292,581,229 $3,130,649,406 $8,423,230,635 8,778 $6,485,795,471 215 $795,915,503 149 $479,034,878
Town of Morristown 4,935 $2,423,804,905 $1,707,446,571 $4,131,251,475 4,061 $2,149,075,002 638 $1,469,937,136 17 $36,345,322
Borough of Mount Arlington 2,303 $1,100,750,349 $597,755,766 $1,698,506,114 2,186 $1,508,983,750 43 $107,206,175 2 $1,242,893
Township of Mount Olive 8,525 $4,700,404,870 $3,026,114,840 $7,726,519,709 7,741 $5,022,870,090 263 $721,753,548 115 $1,336,925,417
Borough of Mountain Lakes 1,589 $928,117,718 $542,715,868 $1,470,833,586 1,488 $1,156,205,551 59 $143,062,096 6 $16,711,623
Netcong Borough 1,075 $577,262,159 $359,215,245 $936,477,404 922 $654,140,744 89 $111,823,440 13 $113,215,044
Township of Parsippany-
Troy Hills 17,033 $8,514,083,386 $5,748,553,952 $14,262,637,338 15,533 $8,296,588,304 1,013 $3,654,260,949 191 $1,519,541,170
Township of Pequannock 5,586 $3,034,459,545 $1,869,528,895 $4,903,988,440 5,087 $3,494,791,950 245 $398,431,132 25 $201,896,630
Township of Randolph 8,375 $5,212,226,320 $3,070,794,831 $8,283,021,151 7,755 $6,424,294,468 255 $608,615,501 72 $594,471,247
Borough of Riverdale 1,155 $736,335,484 $510,244,848 $1,246,580,332 956 $678,271,908 136 $373,398,562 40 $122,995,329
Borough of Rockaway 2,580 $1,087,960,104 $716,193,967 $1,804,154,071 2,157 $1,115,298,410 286 $367,648,682 52 $144,545,461
Township of Rockaway 11,215 $4,684,834,674 $3,097,393,461 $7,782,228,135 9,781 $4,762,323,637 296 $848,032,893 144 $675,364,012
Township of Roxbury 9,408 $4,069,706,358 $2,531,387,293 $6,601,093,651 8,509 $4,614,957,195 544 $1,197,871,660 105 $311,163,752
Borough of Victory Gardens 338 $85,038,516 $53,802,341 $138,840,857 311 $93,708,527 17 $31,440,454 7 $8,792,982
Township of Washington 7,793 $4,177,174,224 $2,403,134,042 $6,580,308,267 6,623 $5,322,120,546 215 $206,703,374 36 $145,182,157
Borough of Wharton 2,040 $1,018,114,011 $681,283,911 $1,699,397,922 1,854 $1,010,490,300 103 $177,584,327 15 $437,842,420
Morris County (Total) 185,799 $95,737,807,854 $59,139,135,568 $154,876,943,422 167,481 $109,796,016,857 8,430 $19,737,772,929 1,850 $11,265,062,919
Source: Morris County
Section 4: County Profile
DMA 2000 Hazard Mitigation Plan Update – Morris County, New Jersey 4-29 June 2015
The 2009-2013 American Community Survey identified that the majority of housing units (66.5% or 126,422
units) in Morris County are single-family detached units. The 2012 U.S. Census Bureau’s County Business
Patterns data identified 16,724 business establishments employing 278,522 people in Morris County. The
professional, scientific, and technical services industry has the most number of establishments in the County
with 2,716 establishments. This is followed by the retail trade industry with 1,827 establishments and the
healthcare and social assistance trade with 1,717 establishments (U.S. Census, 2011).
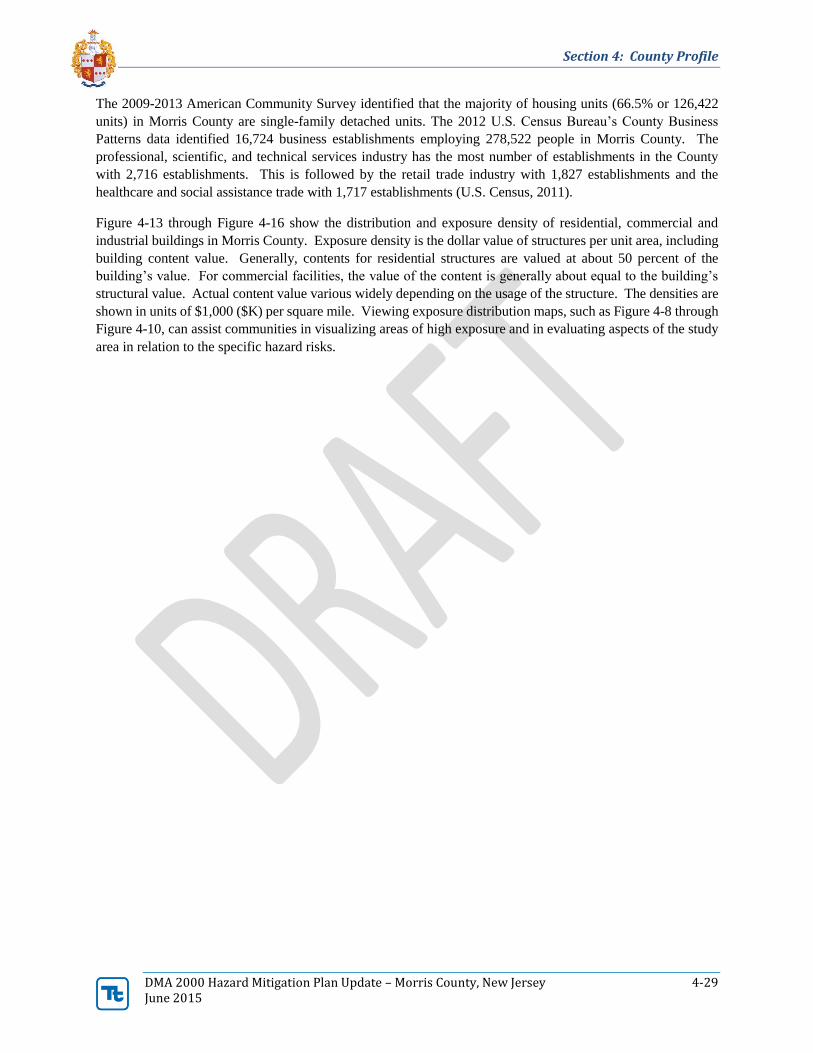
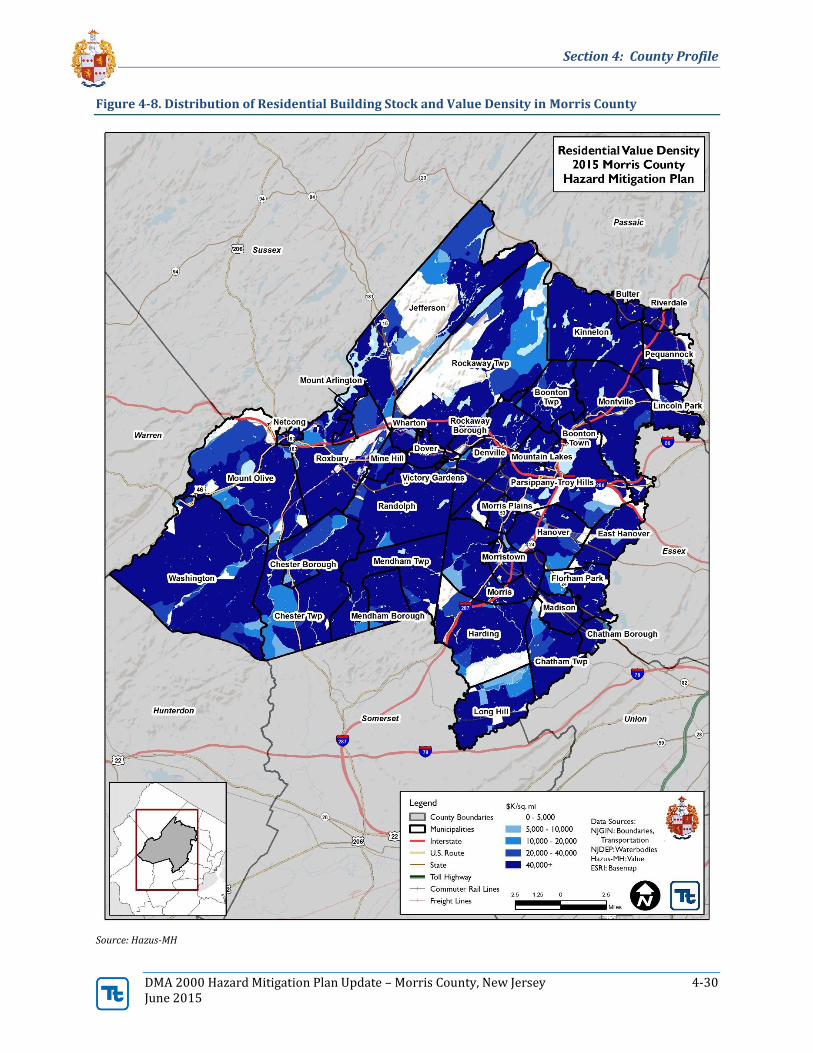
Figure 4-13 through Figure 4-16 show the distribution and exposure density of residential, commercial and
industrial buildings in Morris County. Exposure density is the dollar value of structures per unit area, including
building content value. Generally, contents for residential structures are valued at about 50 percent of the
building’s value. For commercial facilities, the value of the content is generally about equal to the building’s
structural value. Actual content value various widely depending on the usage of the structure. The densities are
shown in units of $1,000 ($K) per square mile. Viewing exposure distribution maps, such as Figure 4-8 through
Figure 4-10, can assist communities in visualizing areas of high exposure and in evaluating aspects of the study
area in relation to the specific hazard risks.
Section 4: County Profile
DMA 2000 Hazard Mitigation Plan Update – Morris County, New Jersey 4-30 June 2015
Figure 4-8. Distribution of Residential Building Stock and Value Density in Morris County
Source: Hazus-MH
Section 4: County Profile
DMA 2000 Hazard Mitigation Plan Update – Morris County, New Jersey 4-31 June 2015
Figure 4-9. Distribution of Commercial Building Stock and Exposure Density in Morris County
Source: Hazus-MH

Section 4: County Profile
DMA 2000 Hazard Mitigation Plan Update – Morris County, New Jersey 4-32 June 2015
Figure 4-10. Distribution of Industrial Building Stock and Value Density in Morris County
Source: Hazus-MH

Section 4: County Profile
DMA 2000 Hazard Mitigation Plan Update – Morris County, New Jersey 4-33 June 2015
4.4 ECONOMY
As discussed in the FEMA Local Mitigation Handbook, after a natural hazard event, economic resiliency drives
recovery. An understanding of the major employers and economic sectors in the County whose losses or
inoperability would impact the community and its ability to receive from a disaster is essential. The following
provides information regarding the economy in Morris County.
Agriculture
Agriculture is an important part of Morris County's economy and a major contributor to New Jersey's and the
United States' farming industry. The 2012 U.S. Census of Agriculture indicates that Morris County ranked 10th
in the State for total market value of agricultural products sold with over $28.3 million in sales. This is a 4%
increase from 2007 ($27.3 million in sales). The 2012 average sales per farm was $77,560, a 20% increase from
the 2007 Census which was an average of $64,720. The top commodities, by sales, in Morris County for 2012
include: nursery, greenhouse, floriculture, and sod at $21.4 million in sales; vegetables, melons, potatoes, and
sweet potatoes at $3.1 million sales; and fruits, tree nuts, and berries at $1.4 million in sales (USDA 2012). For
details regarding agriculture and land use, refer to Section 4.1.1 of this county profile.
The Morris County Agriculture Development Board (MCADB) was formed in 1999 and focuses on farmland
preservation and creating a positive climate for the farming business.
4.5 DEVELOPMENT TRENDS AND NEW DEVELOPMENT
An understanding of population and development trends can assist in planning for future development and ensuring that appropriate mitigation, planning, and preparedness measures are in place to protect human health and community infrastructure. DMA 2000 requires that communities consider land use trends, which can impact the need for, and priority of, mitigation options over time. Land use and development trends significantly impact exposure and vulnerability to various hazards. For example, significant development in a hazard area increases the building stock and population exposed to that hazard.
Local zoning and planning authority is provided for under the New Jersey Municipal Land Use Law, which gives municipalities zoning and planning authority. Refer to Sections 6 and 9 for further details on the planning and regulatory capabilities for the County and each municipality.
New development that has occurred in the last five years within the County and potential future development in
the next five years, as identified by each municipality, is noted in the following table and figure. Refer to Section
9 which evaluates the potential new development exposure to natural hazards.
Figure 4-11. Potential New Development in Morris County
Source:
Section 4: County Profile
DMA 2000 Hazard Mitigation Plan Update – Morris County, New Jersey 4-34 June 2015
4.6 CRITICAL FACILITIES
Critical and essential facilities are necessary for a
community’s response to and recovery from natural hazard
events. A comprehensive inventory of critical facilities in
Morris County was developed from various sources provided
by the County. The inventory of critical facilities presented
in this section represents the current state of this effort at the
time of publication of the HMP and was used for the risk
assessment in Section 5.
The inventory of critical facilities identified for the HMP is
considered sensitive information. It is protected by the
Protected Critical Infrastructure Information (PCII) program
and under New Jersey Executive Order 21. Therefore,
individual facility names and addresses are not provided in
this HMP Update. A summary of the facility types used for
the risk assessment are presented further in this section.
4.6.1 Essential Facilities
This section provides information on emergency facilities, hospital and medical facilities, schools, shelters and
senior care and living facilities. Figure 4-13 illustrates the inventory of these essential facilities in Morris
County.
Emergency Facilities
For the purposes of this Plan, emergency facilities include police, fire, emergency medical services (EMS) and
emergency operations centers (EOC). The County has a highly coordinated and interconnected network of
emergency facilities and services at the county and municipal level. The Morris County Office of Emergency
Management (MCOEM) serves as the primary coordinating agency between local, state and federal agencies.
In response to an emergency event, MCOEM will work with County and municipal health agencies and
healthcare providers, emergency facilities and the County Sheriff’s Office to provide aid to residents of the
County.
Each municipality is responsible for maintaining its own police department, fire department and emergency
operation center. There are 38 enforcement facilities, 94 fire stations, 35 emergency medical services facilities
and 43 emergency operation centers.
Correctional Facilities
There are no correctional facilities located within Morris County.
Hospital and Medical Facilities
There are eight major medical and hospital centers located within the County.
Schools
There are 249 schools ranging from pre-k to higher education learning facilities in the County. During an
emergency event, schools can be used as a shelter for residents.
Critical facilities are those facilities considered
critical to the health and welfare of the population and
that are especially important following a hazard. As
defined for this HMP, critical facilities include
essential facilities, transportation systems, lifeline
utility systems, high-potential loss facilities and
hazardous material facilities.
Essential facilities are a subset of critical facilities
that include those facilities that are important to
ensure a full recovery following the occurrence of a
hazard event. For the County risk assessment, this
category was defined to include police, fire, EMS,
EOCs, schools, shelters, senior facilities and medical
facilities.
Emergency Facilities are for the purposes of this
Plan, emergency facilities include police, fire,
emergency medical services (EMS) and emergency
operations centers (EOC).
Section 4: County Profile
DMA 2000 Hazard Mitigation Plan Update – Morris County, New Jersey 4-35 June 2015
Shelters
There were 27 shelters identified within the County; many schools, community centers and municipal buildings
could serve as a shelter during an emergency.
Senior Care and Living Facilities
It is important to identify and account for senior facilities, as they are highly vulnerable to the potential impacts
of disasters. Understanding the location and numbers of these types of facilities can help manage effective
response plan post disaster. There are 21 senior facilities located within the County.
Government Buildings
In addition to the facilities discussed, county and municipal buildings, department of public works facilities and
public health departments are essential to the continuity of operations pre-, during and post-disasters. These
facilities are included in the risk assessment. There are 79 government facilities located in the County.

Section 4: County Profile
DMA 2000 Hazard Mitigation Plan Update – Morris County, New Jersey 4-36 June 2015
Figure 4-12. Essentials Facilities in Morris County
Source: Morris County, Hazus-MH

Section 4: County Profile
DMA 2000 Hazard Mitigation Plan Update – Morris County, New Jersey 4-37 June 2015
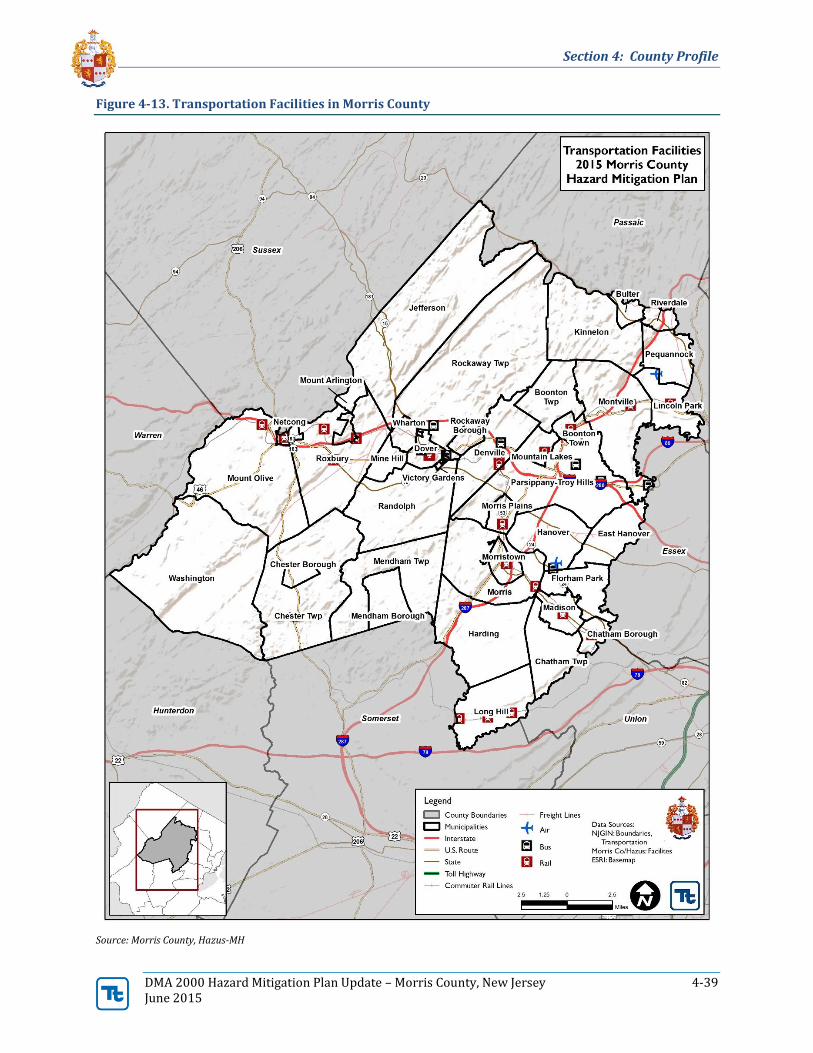
4.6.2 Transportation Systems
The County is bisected by a network of approximately 2,000 miles of federal interstate freeways, and state,
county and municipal roads. Major interstate highways in Morris County included Interstate 80, 280, and 287,
and State Routes 10 and 46. In addition to the roadways, the County is served by rail, bus and air, which are
described below. Figure 4-13 illustrates the regional transportation lifelines serving the County. The
transportation inventory included as part of this HMP includes airports, major bus stations, and major rail
facilities.
Rail Service
New Jersey Transit (NJ Transit), formerly Erie Lackawanna Railroad, serves thousands of County commuters
each day. NJ Transit operates an extensive commuter rail network and offers connections with other rail service.
NJ Transit service in Morris County include: Morris & Essex (Morristown Line), Morris & Essex (Gladstone
Branch), and Montclair-Boonton Line. The Morristown Line and Gladstone Branch both have service to New
York Penn Station, Newark-Broad Street Station, and Hoboken. The Montclair-Boonton Line provides service
to Hoboken with connections to New York City (Morris County Transportation 2015).
Additionally, the Central Railroad of New Jersey, the Morristown & Erie Railroad, and the New York,
Susquehanna & Western Railroad cross the County. There are 21 rail facilities located in the County.
Bus Service
Overall, there are nine bus facilities located in Morris County. Bus service links the 39 municipalities in the
County to the metropolitan region. NJ Transit operates a statewide bus system that includes service from Morris
County to New York City Port Authority, local service within Morris County, and local service between Morris,
Essex, and Passaic Counties (Morris County Transportation 2015).
Lakeland Bus Lines, Inc. provides service between Morris and Sussex Counties and New York City, including
service to the Port Authority Bus Terminal, Midtown Manhattan, and Lower Manhattan. Lakeland Bus also
provides local service within Morris County and between Morris and Sussex Counties. In addition, Community
Coach, a member of Coach USA, provides bus service from Morris and Essex Counties to the New York City
Port Authority Bus Terminal (Morris County Transportation 2015).
Other bus services in Morris County include the following:
The Township of Parsippany-Troy Hills operates the Parsippany Free Transit System. This system
provides two free best routes within the Township and serves its residents. Both routes begin at the
Morris Hills Shopping Center.
The Town of Morristown provides Colonial Coach to its residents. This free service consists of one
route operating in and around Morristown on Mondays, Wednesdays and Fridays.
Morris on the Move (M.O.M.) is a community transportation service for low-income individuals
running between the Town of Dover and the Township of Mount Olive. The service is sponsored by
the Morris County Department of Human Services.
TransOperations manages the Morris Avenue Direct Shuttle on the Madison Avenue (NJ-124) corridor
in the Borough of Madison and the Township of Morris. The shuttle is funded through a Congestion
Management Air Quality grant and the three colleges it services. It primarily serves the campuses but
is open to residents and employees.
The Morris Area Paratransit System (MAPS) is operated by the Morris County Department of Human
Services and provides curb-to-curb transportation to County residents age 60 and older and to residents
age 18 and older who have a physical or mental disability that includes functional limitations. In order
Section 4: County Profile
DMA 2000 Hazard Mitigation Plan Update – Morris County, New Jersey 4-38 June 2015
for residents to use MAPS, the Department of Human Services needs to be contacted (Morris County
Transportation 2015).
Airports
There are two airports located in Morris County. The Morristown Municipal Airport is located in the Township
of Hanover and is used as a private airport for corporate and personal aircraft. The Lincoln Park Airport is
located in the Borough of Lincoln Park and is privately owned airport with a flight school (Morris County
Transportation 2015).
Section 4: County Profile
DMA 2000 Hazard Mitigation Plan Update – Morris County, New Jersey 4-39 June 2015
Figure 4-13. Transportation Facilities in Morris County
Source: Morris County, Hazus-MH
Section 4: County Profile
DMA 2000 Hazard Mitigation Plan Update – Morris County, New Jersey 4-40 June 2015
4.6.3 Lifeline Utility Systems
This section presents communication, potable water, wastewater, and energy resource utility system data. Due
to heightened security concerns, local utility lifeline data sufficient to complete the analysis have only partially
been obtained.
Communication
Morris County has a network of both public and private communication facilities and towers.
Telecommunication services are provided by multiple organizations, including Verizon, Sprint International,
and TRANSCOM. There were nine essential communication facilities identified in the County.
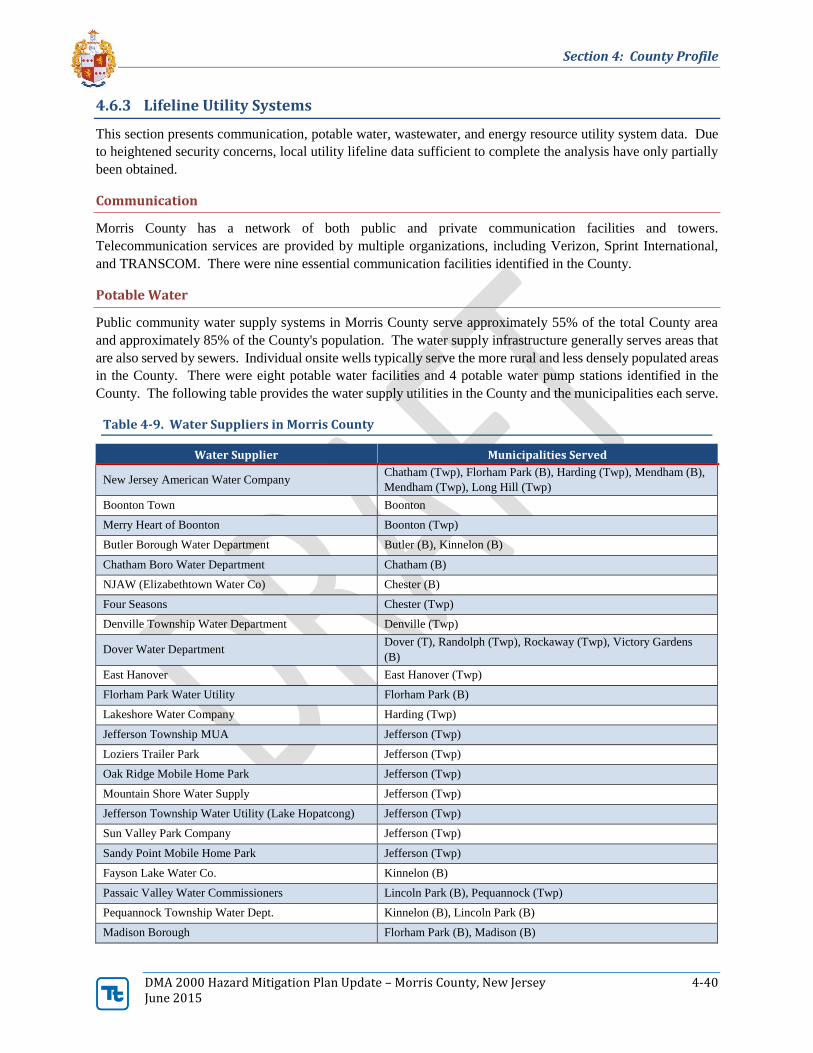
Potable Water
Public community water supply systems in Morris County serve approximately 55% of the total County area
and approximately 85% of the County's population. The water supply infrastructure generally serves areas that
are also served by sewers. Individual onsite wells typically serve the more rural and less densely populated areas
in the County. There were eight potable water facilities and 4 potable water pump stations identified in the
County. The following table provides the water supply utilities in the County and the municipalities each serve.
Table 4-9. Water Suppliers in Morris County
Water Supplier Municipalities Served
New Jersey American Water Company Chatham (Twp), Florham Park (B), Harding (Twp), Mendham (B),
Mendham (Twp), Long Hill (Twp)
Boonton Town Boonton
Merry Heart of Boonton Boonton (Twp)
Butler Borough Water Department Butler (B), Kinnelon (B)
Chatham Boro Water Department Chatham (B)
NJAW (Elizabethtown Water Co) Chester (B)
Four Seasons Chester (Twp)
Denville Township Water Department Denville (Twp)
Dover Water Department Dover (T), Randolph (Twp), Rockaway (Twp), Victory Gardens
(B)
East Hanover East Hanover (Twp)
Florham Park Water Utility Florham Park (B)
Lakeshore Water Company Harding (Twp)
Jefferson Township MUA Jefferson (Twp)
Loziers Trailer Park Jefferson (Twp)
Oak Ridge Mobile Home Park Jefferson (Twp)
Mountain Shore Water Supply Jefferson (Twp)
Jefferson Township Water Utility (Lake Hopatcong) Jefferson (Twp)
Sun Valley Park Company Jefferson (Twp)
Sandy Point Mobile Home Park Jefferson (Twp)
Fayson Lake Water Co. Kinnelon (B)
Passaic Valley Water Commissioners Lincoln Park (B), Pequannock (Twp)
Pequannock Township Water Dept. Kinnelon (B), Lincoln Park (B)
Madison Borough Florham Park (B), Madison (B)

Section 4: County Profile
DMA 2000 Hazard Mitigation Plan Update – Morris County, New Jersey 4-41 June 2015
Table 4-9. Water Suppliers in Morris County
Water Supplier Municipalities Served
NJAW Mendham (B)
Roxiticus Water Company Mendham (Twp)
Mine Hill Township Water Dept. Mine Hill (Twp)
Montville Township Montville (Twp)
Plausha Park Inc. Montville (Twp)
NJAM Florham Park (B), Morris (Twp)
Southeast Morris County MUA Chatham (Twp), Hanover (Twp), Harding (Twp), Mendham (Twp),
Morris (Twp), Morris Plains (B), Morristown (T)
Mountain Lakes Water Dept. Mountain Lakes (B)
United Water Mount Arlington (B)
Mount Olive Villages (NJ Vasa) Mount Olive (Twp)
Mount Olive Water Department Jefferson (Twp), Mount Olive (Twp)
Netcong Borough Water Dept. Netcong (B)
Par-Troy Hills Water Dept. Parsippany-Troy Hills (Twp)
Pequannock Township Water Dept. Kinnelon (B), Lincoln Park (B), Pequannock (Twp)
MCMUA
Chester (B), Denville (Twp), Jefferson (Twp), Mine Hill (Twp),
Mount Arlington (B), Mendham (B), Parsippany-Troy Hills (Twp),
Randolph (Twp), Roxbury (Twp), Wharton (B)
Randolph Township Randolph (Twp)
Riverdale Borough and PVWC Riverdale (Twp)
Rockaway Borough Water Dept. Rockaway (B), Rockaway (Twp)
Hoffman Homes Rockaway (Twp)
Rockaway Township Water Dept. Rockaway (Twp)
Picatinny Arsenal Jefferson (Twp), Rockaway (Twp)
Roxbury Water Company Roxbury (Twp)
Roxbury Township Water Dept. Mount Arlington (B), Roxbury (Twp)
Cliffside Park Association Washington (Twp)
Washington Twp MUA Washington (Twp)
Sherwood Mobile Home Park Washington (Twp)
New Jersey American Water Chester (Twp)
Lake Stockholm Inc. Jefferson (Twp)
Hackettstown MUA Washington (Twp)
Source: Morris County Planning Board 2014 (http://www.morrisplanning.org/wastewater/county_wide_summary.pdf)
Wastewater Facilities
Centralized wastewater treatment systems in Morris County serve approximately 41% of the total County area
and approximately 70% of the total County population. Centralized wastewater treatment systems treat flow
collected from within their designated sewer service area (SSA). SSAs may include industrial businesses that
discharge process wastewater into collection system for treatment by a facility not allowed by that business. The
wastewater collection and treatment infrastructure generally serve the more densely populated urban and
suburban communities. Rural and less densely populated areas of the County not served by SSAs are defined
as general service areas (GSAs) and are predominately served by septic systems. There are not combined sewers

Section 4: County Profile
DMA 2000 Hazard Mitigation Plan Update – Morris County, New Jersey 4-42 June 2015
that include both stormwater and wastewater in the same system within Morris County. There were 24
wastewater facilities identified in the County.
Energy Resources
Jersey Central Power & Light (JCP&L) is the primary energy service provider for Morris County. Other service
providers include Public Service Electricity & Gas (PSE&G), New Jersey Natural Gas, Transco Gas
Transmission, Madison Electric Department, Elizabethtown Gas, Duke Energy, Columbia Gas Transmission,
Butler Electric Company and Algonquin Pipeline Company. There were 7 electric generation facilities, three
electric substations, seven natural gas facilities, and 5 oil facilities identified in the County.
A number of utility providers supply various services throughout the County as noted in Figure 4-14.
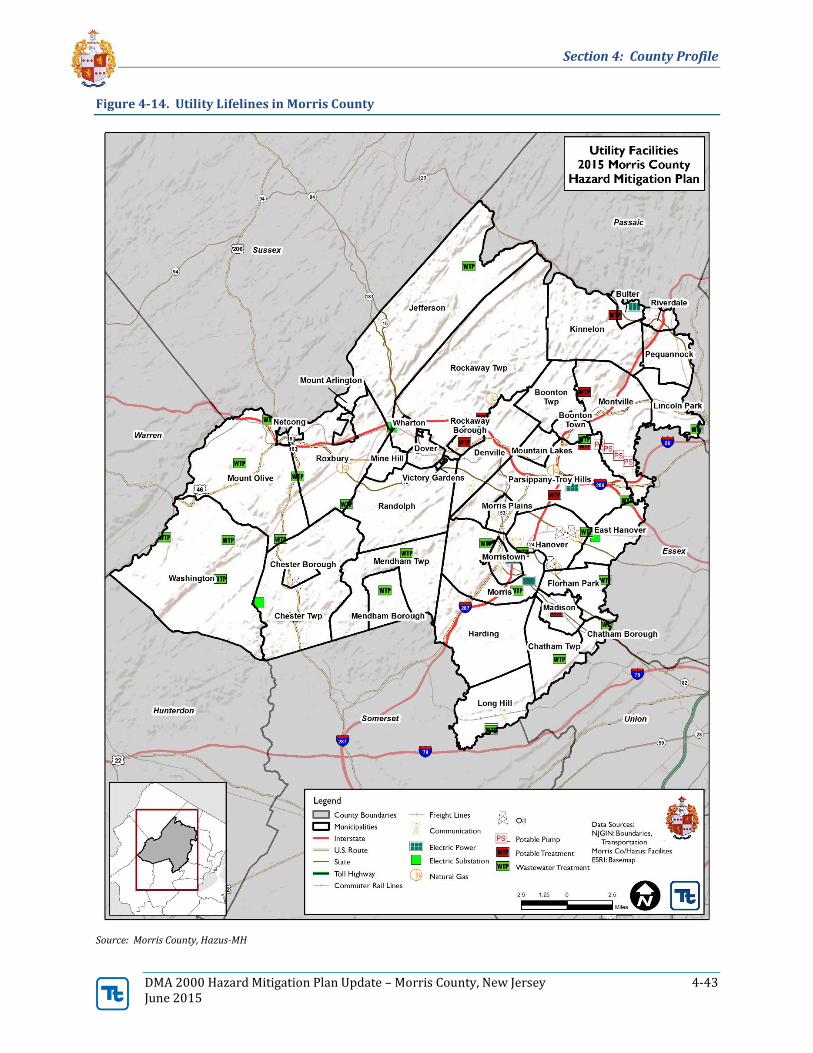
Section 4: County Profile
DMA 2000 Hazard Mitigation Plan Update – Morris County, New Jersey 4-43 June 2015
Figure 4-14. Utility Lifelines in Morris County
Source: Morris County, Hazus-MH

Section 4: County Profile
DMA 2000 Hazard Mitigation Plan Update – Morris County, New Jersey 4-44 June 2015
4.6.4 High-Potential Loss Facilities
High-potential loss facilities include dams, levees, chemical storage facilities and nuclear power facilities.
Figure 4-15 displays the general locations of these facilities in the County. Dams are discussed further below.
Dams and Levees
According to the New Jersey Department of Environmental Protection (NJDEP), there are four hazard
classifications of dams in New Jersey. The classifications relate to the potential for property damage and/or loss
of life should the dam fail:
Class I (High-Hazard Potential) - Failure of the dam may result in probable loss of life and/or extensive
property damage
Class II (Significant-Hazard Potential) - Failure of the dam may result in significant property damage;
however loss of life is not envisioned.
Class III (Low-Hazard Potential) - Failure of the dam is not expected to result in loss of life and/or
significant property damage.
Class IV (Small-Dam Low-Hazard Potential) - Failure of the dam is not expected to result in loss of life
or significant property damage.
According to the NJDEP Bureau of Dam Safety, there are 249 dams located in Morris County, 35 of which are
classified with a high-hazard potential.
4.6.5 Other Facilities
The Planning Committee identified additional facilities (user-defined facilities) as critical. These facilities
include but are not limited to additional municipal and county-owned facilities and essential commercial and
retail locations. Figure 4-16 illustrates the general locations of these facilities in the County.

Section 4: County Profile
DMA 2000 Hazard Mitigation Plan Update – Morris County, New Jersey 4-45 June 2015
Figure 4-15. High-Potential Loss Facilities in Morris County
Source: Morris County, Hazus-MH

Section 4: County Profile
DMA 2000 Hazard Mitigation Plan Update – Morris County, New Jersey 4-46 June 2015
Figure 4-16. Other Facilities in Morris County
Source: Morris County, Hazus-MH