Embed Size (px)
Citation preview

Socio-Economic Characteristics 35
SECTION - 2: SOCIO-ECONOMIC CHARACTERISTICSThe data relating to different socio-economic aspects of rural people have been covered in this section viz., Net Domestic Product by Economic Activity, Rural and Urban Incomes, Work Force, Occupation-wise number of Workers, Labour Force Estimates, Migration Details, Literacy Rates, Employment and Unemployment Estimates and Incidence of Poverty. State-wise data are furnished for the recent years.
2.1: Time-series data (from 1950–51 to 2015–16) on the Gross National Product , Net National Product and also the Per Capita Net National Product both at current and constant prices are shown.
2.2: The percentage contribution of different “industry” groups to Gross Value Added for the period 2011-12 to 2014-15 are presented at constant prices in this Table.
2.3: The Net Domestic Product (NDP) industry-wise for rural and urban areas as worked out by CSO for a few selected years are shown.
2.4: Data on Net State Domestic Product State-wise at current prices for some selected years i.e 2006-07 to 2014–15 are furnished.
2.5: Growth rates of Net State Domestic Product State-wise at current prices for some selected years i.e. 2005-06 to 2014–15 are presented.
2.6: This Table provides the per capita Net State Domestic Product figures at current prices for selected years during the period 2004-05 to 2014–15.
2.7: Growth rates of Net State Domestic Product State-wise at current prices for some selected years i.e. 2005-06 to 2014–15 are presented.
2.8: This Table presents the per capita Net State Domestic Product values at constant prices (2004-05) for selected years during the period 2006-07 to 2013-14.
2.9: Rates of Growth of SDP by major States for Eighth, Ninth, Tenth and Eleventh Plan periods are shown.
2.10: Target growth rates of GDP by major industry at factor cost for Eleventh and Twelfth Five Year Plans State-wise are presented.
2.11: Growth Rate in Gross Value Added (GVA) at Basic Prices for Different Sectors are presented.
2.12: Annual Growth Rate of GDP Industry-wise at Origin at Constant Prices (2004-05) is presented in this table.
2.13 & 2.14: These Tables contain data on population figures and labour force growth for some selected years.
2.15 (a & b): Estimates of Rural Labour force Participation Rates sex-wise for different NSS rounds are shown.
2.16 (a, b & c): The data on distribution of rural workers by major occupation in 2001 and 2011 State-wise and All India-wise are presented in these Tables.
36 Rural Development Statistics
2.17, 2.17 (a) & 2.18: Labour force participation rate for all persons and for persons in age group of 15-59 years by Usual Principal Status, Principal Status & Subsidiary Status, Current Weekly Status and Current Daily Status for the year 2011-12 are presented in these Tables.
2.19 to 2.27 The National Sample Survey Organisation (NSSO) collects data on Employment and Unemployment periodically. The estimates thrown up by the NSSO on the employment and unemployment rates are based on the three approaches viz., usual status approach, current weekly status approach, and current daily status approach. The estimates of number of workers, unemployed and persons out of labour force as developed by National Sample Survey Organisation for different States in different NSS Rounds are included in these Tables following the three approaches for both males and females separately.
2.28 (a to e): Sex-wise literacy rates as per population census in rural and urban areas for the years 1951, 1961, 1971, 1981, 1991, 2001 and 2011 are shown.
2.29: The literacy rates of the rural population aged 7 years and above (sex-wise) in different States and UTs according to 2001 and 2011 censuses are provided.
2.30: State-wise and Sex-wise literacy levels in each State and UT for the year 2001 and 2011 are given.
2.31: Percentage distribution of indebted rural labour households by purpose-wise in 2004-05 is presented. Incidence of indebtedness to institutional and non-institutional credit agencies by household asset holding class – All –India 2012.
2.32 to 2.35 (a & b): Migration rates obtained from different NSS rounds are presented.
2.36, 2.36 (a & b): Percentage distribution of indebted rural labour households by purpose-wise 2004-05 is presented. Incidence of indebtedness to institutional and non-institutional credit agencies by household asset holding class – All –India 2012.
2.37: Percentage distribution of indebted rural labour households by source of debt (2004-05) is shown.
2.38: The estimates of number of rural households, farmer households and indebted farmer households in the States and UTs are presented for the year 2003.
2.39: Incidence of indebtedness among rural labour households for 2004-05 is presented.
2.40: Extent of indebtedness among rural labour households 2004-05 is presented.
2.41: Daily rates of minimum wages for agricultural workers for 2014 are included.
2.42: Average wage/ salary earnings per day received by casual labourer of age 15-59 years engaged in public works other than MGNREGS public works for the year 2009-10 are presented.
2.43: The average quantity and value of cereals consumed for the years 1987-88 to 2009-10 are presented.

Socio-Economic Characteristics 37
2.44: Monthly per capita consumer expenditure on food and non-food items of the rural households during July 2011 – June 2012 in different States are shown.
2.45: Data on monthly per capita consumer expenditure on cereals for the year 2009-10 are included for major States-rural.
Data on Average Consumer Expenditure per Person in MPCE different Decile Classes of 2011-12 is shown. Share of Consumer Expenditure for Different Fractile Classes of 2011-12 are presented.
2.46 (a & b): Monthly average quantity and value of consumption of different cereals per person in 2009-10 are shown in these Tables.
2.47: Data on per capita cereal consumption in major States are presented for different NSSO rounds.
2.48: This Table shows the Lorenz ratios of consumption expenditure distribution of population in States / UTs for 2009-10.
2.49: State-wise consumer price indices for “Food” and “General” items in the case of Agricultural Labourers for selected years are presented.
2.50 (a & b): The official estimates as per Tendulkar and Rangarajan methodology on incidence of poverty are included in these Tables both for rural and urban areas and for specific years (1983, 1993-94, 2009-10 & 2011-12).
2.51 (a, b & c): State-specific Poverty Lines (` per month per capita) relating to the rural areas of different States and UTs for the years 1973-74, 1983, 1993-94, 1999-2000, 2004-05, 2009-10 and 2011-12 are furnished.
2.52: These Tables provide data on the absolute number of poor and poverty ratios in rural, urban and combined areas of each State/UT for the years 2004-05, 2009-10 & 2011-12.
2.53 to 2.56: The Table contains State-wise values and ranks on Human Development Index (HDI).
2.57: Distribution of number of members seeking / available for work in rural areas for 2001 by age groups-wise is presented in these Tables.
2.58: Distribution of households classified according to the availability of two square meals a day in the rural and urban parts of the country is given.
2.59: Distribution of households by household type and according to the availability of two square meals a day in the rural areas is presented in the Table.

38 Rural Development Statistics
Highlightsl During the period 2005-06 to 2015-16, Indian economy grew at an impressive rate and even the per
capita income registered a growth rate over 2.7 times in constant prices.
l The share of agriculture in NDP has been declining at the rate of one per cent per annum in the recent years (at 1999-2000 prices). The share of rural areas in NDP has fallen from 59 and to 48 per cent in 24 years period ending 2004-05. The agriculture growth rate has been still lagging behind the target growth rate of 4 per cent.
l The rural-urban differences in per capita NDP have widened during 1980-81 to 2004-05.
l The rural labour force has been declining partly due to migration of workers to urban areas and also due to increased participation of youth in education. The percentage of cultivators among workers was high in the major States of Chhattisgarh, Himachal Pradesh, Jammu & Kashmir, Madhya Pradesh and Rajasthan. The casualisation of labour is still a significant phenomenon in rural areas. The dependency of workforce on agriculture has reduced for male workers but not for female workers. The number of employed has gone up by 40 millions in two decades ending 2004-05 i.e at the rate of 2 millions per annum. It is disheartening to note that 92 per cent of workforce is engaged in informal sector. The unemployment levels in rural India still hover around 8 per cent.
l The rural-urban and gender differences are conspicuous in literacy levels even while the levels have been rising.
l The rural-rural, intra-State and female migration are the dominant streams of migration in India. The employment related factors are responsible for migration of males while marriage is driving force in respect of females. As per NSSO data, migration rates have been rising in rural India.
l Nearly 50 per cent of the Indian farmers are indebted and average debt is of the order of ` 12585 for 2003. In Bihar, Himachal Pradesh, Jammu & Kashmir and Jharkhand, almost 70 to 80 per cent did not have access to credit facility at all; similar is the situation in the North-East. Average outstanding loan per farmer was high in Punjab, Kerala, Haryana, Andhra Pradesh and Tamil Nadu. Around three-fifths of indebted farmers were marginal farmers. Money lenders’ share in outstanding loans was one-fourth while banks account for more than one-third of the debt. The indebtedness was one of the main reasons for farmers’ suicides in India and suicide rate was about 1.55 per lakh farmers in 2005.
l The agricultural wages have gone up during the recent years largely due to MGNREGS.
l The gini coefficient of inequality in consumption expenditure has gone up during the last three decades. Also the share of bottom 30 per cent population remained more or less stable in most of the States and it varied between 13 and 19 per cent. The average consumption of cereals, the principal source of calories, has been declining over the years. Further, the share of food in total consumption expenditure at the aggregate level was almost 50 per cent. These together indicate that poverty levels in rural India are high. While official estimates of rural poverty was 28 per cent in 2004-05, the Tendulkar Committee places it at 42 per cent. However, inequality among the poor has reduced.

Socio-Economic Characteristics 39
2: SOCIO-ECONOMIC CHARACTERISTICSA. NATIONAL INCOME
Table 2.1: National Income
S.No. Year
GNP at factor cost(` in Crore)
NNP at factor cost(` in Crore)
Per capita NNP (`)
At Current Prices
AtConstant
Prices
At Current Prices
AtConstant
Prices
At Current Prices
AtConstant
Prices(2004-05 Series)
1. 1950-51 10360 292996 9829 269724 274 7513
2. 1960-61 17870 434497 17062 411519 393 9482
3. 1970-71 47354 640275 44550 596470 823 11025
4. 1980-81 149987 866338 138565 795193 2041 11711
5. 1990-91 578667 1470766 526017 1342031 6270 15996
6. 1995-96 1213241 1888228 1100655 1715639 11861 18487
7. 1996-97 1406195 2032837 1276347 1849226 13492 19548
8. 1997-98 1559189 2118975 1411922 1920927 14646 19927
9. 1998-99 1788410 2250012 1624669 2038124 16528 20734
10. 1999-2000 2007699 2448654 1821227 2220003 18194 22178
11. 2000-01 2154680 2535911 1947788 2291795 19115 22491
12. 2001-02 2335777 2661819 2106928 2401875 20259 23095
13. 2002-03 2519637 2766298 2273456 2492931 21529 23607
14. 2003-04 2820795 2983497 2548640 2692470 23775 25116
15. 2004-05 3219835 3219835 2899944 2899944 26629 26629
16. 2005-06 3667253 3518348 3303532 3167455 29869 28639
17. 2006-07 4261472 3841974 3842743 3456274 34249 30805
18. 2007-08 4966578 4233768 4481882 3806140 39384 33446
19. 2008-09 5597140 4390966 5031943 3922062 43604 33987
20. 2009-10 6439827 4763090 5780028 4241183 49402 36249
21. 2010-11 7702308 5227739 6942089 4657438 58534 39270
22. 2011-12 8932892 5586683 8052996 4958849 66997 41255
(2011-12 Series)23. 2011-12 8659215 8659215 7742074 7742074 63460 63460
24. 2012-13 9834581 9118709 8774615 8109505 71050 65664
25. 2013-14 11132877 9717062 9934405 8615309 79412 68867
26. 2014-15 12340772 10427701 11007592 9235026 86879 72889
27 2015-16 13409892 11214077 11961524 9934339 93231 77431
1R : 1st Revised Estimates 2R : 2nd Revised Estimates 3R: 3rd Revised EstimatesNNP : Net National Product GNP : Gross National ProductSource : GOI , Ministry of Finance, Economic Survey 2015-16.

40 Rural Development Statistics
Table 2.2: Percentage Share of Gross Value Added (GVA) by Economic Activity (2011-12, 2012-13, 2013-14, 2014-15)
(At 2011-12 Prices) (Percentage Distribution)
S.No. Industry 2011-12 2012-13 2013-14 2014-15
1. Agriculture, Forest and Fishing 18.5 17.8 17.5 16.3
2. Mining and Quarrying 3.2 3.0 2.9 3.0
3. Manufacturing 17.4 17.5 17.4 17.1
4. Electricity, Gas and Water Supply 2.3 2.2 2.2 2.2
5. Construction 9.6 9.2 9.0 8.8
6. Trade, Hotel and Restaurant 10.9 11.5 11.6 12.0
7. Transport, Storage, Communication and Services Related to Broadcasting
6.5 6.7 6.8 6.9
8. Financial Services 5.9 6.2 6.1 6.1
Source : GOI, Central Statistical Organisation, National Accounts Statistics 2016.

Socio-Economic Characteristics 41
Tabl
e 2.
3: N
et D
omes
tic P
rodu
ct in
Rur
al a
nd U
rban
Are
as(A
t Cur
rent
Pric
es)
( `
in C
rore
)
Indu
stry
1980
-81
1993
-94
1999
-200
020
04-0
520
11-1
2
Rura
lUr
ban
Rura
lUr
ban
Rura
l Ur
ban
Rura
l Ur
ban
Rura
l Ur
ban
Agric
ultu
re, F
ores
try &
Fi
shin
g41
837
(94.
9)22
54(5
.1)
2158
90(9
3.9)
1393
9(6
.1)
3958
73(9
3.2)
2868
6(6
.8)
4867
81
(94.
0)30
870
(6.0
)13
2822
077
893
Min
ing
& Q
uarry
ing
807
(54.
8)66
7(4
5.3)
9849
(65.
9)51
01(3
4.1)
1397
8(4
2.4)
1899
7(5
7.6)
4701
4(6
6.3)
2391
3(3
3.7)
1222
9210
6894
Man
ufac
turin
g59
54(3
1.8)
1274
4(6
8.2)
3088
5(2
9.8)
7285
4(7
0.2)
8563
3(4
1.5)
1204
93(5
8.5)
1506
15(4
2.5)
2035
81(5
7.5)
5876
3255
9290
Elec
tricit
y, G
as &
W
ater
Sup
ply
365
(40.
0)54
7(6
0.0)
3334
(37.
9)54
67(6
2.1)
1099
8(4
5.4)
1320
6(5
4.6)
8442
(33.
2)16
951
(66.
8)41
098
8271
3
Cons
truct
ion
2633
(45.
6)31
38(5
4.4)
1748
0(4
5.1)
2126
9(5
4.9)
4301
9(4
3.4)
5629
3(5
6.6)
1004
57(4
5.5)
1205
22(5
4.5)
3463
7639
1830
Trad
e, H
otel
s &
Res-
taur
ant
4345
(30.
3)99
77(6
9.7)
2942
4(3
0.5)
6720
3(6
9.5)
6713
9(2
7.0)
1810
57(7
3.0)
1902
27(4
0.9)
2748
64(5
9.1)
2337
1660
4393
Tran
spor
t, St
orag
e &
Com
mun
icatio
n 85
6(2
3.0)
2868
(77.
0)12
933
(34.
3)24
788
(65.
7)31
00(2
9.3)
7479
3(7
0.6)
7380
4(3
3.4)
1471
77(6
6.6)
1320
1931
1701
Bank
ing
Insu
ranc
e52
5(1
5.7)
2819
9(8
4.3)
6565
(16.
4)33
545
(83.
6)14
895
(14.
5)87
716
(85.
5)24
863
(14.
8)14
2907
(85.
2)62
144
4112
55
(Con
td...
)

42 Rural Development Statistics
Indu
stry
1980
-81
1993
-94
1999
-200
020
04-0
520
11-1
2
Rura
lUr
ban
Rura
lUr
ban
Rura
l Ur
ban
Rura
l Ur
ban
Rura
l Ur
ban
Real
Est
ate,
Own
-er
ship
of D
wellin
g &
Busin
ess
Serv
ices
2960
(50.
0)29
61(5
0.0)
1613
0(3
9.9)
2430
1(6
0.1)
3541
5(3
2.0)
7500
4(6
8.0)
8197
5(3
5.8)
1469
21(6
4.2)
3263
8357
1402
Com
mun
ity, S
ocia
l &
Pers
onal
Ser
vices
(o
ther
ser
vices
)
4723
(39.
1)73
61(6
0.9)
3630
1(4
1.7)
5073
4(5
8.3)
7176
2(2
9.0)
1749
76(7
1.0)
1055
40(2
8.2)
2689
47(7
1.8)
1523
6733
4306
Net D
omes
tic P
rodu
ct65
004
(58.
9)45
336
(41.
1)37
8791
(54.
3)31
9201
(45.
7)77
3326
(48.
4)82
7606
(51.
6)12
6971
7(4
8.0)
1376
653
(52.
0)34
0893
637
8058
0
Popu
latio
n (M
illion
)52
29(7
6.9)
157
(23.
1)65
5 (7
3.5)
236
(26.
5)72
6(7
2.5)
275
(27.
5)77
7.7
(71.
4)31
1.3
(28.
6)83
838
2
Per C
apita
NDP
(`)
1245
2888
5783
1352
510
652
3009
516
327
4422
340
679
9896
8
Note
: Figu
res i
n pa
rent
hese
s are
shar
es o
f rur
al / u
rban
secto
rs in
the
net d
omes
tic p
rodu
ct of
resp
ectiv
e ind
ustri
al ca
tego
ry fo
r the
refe
renc
e ye
ar.
Sour
ce: G
OI, C
SO, N
ation
al Ac
coun
ts St
atist
ics, 2
016.
Tabl
e 2.
3: (C
ontd
...)

Socio-Economic Characteristics 43
Tabl
e 2.
4: N
et S
tate
Dom
estic
Pro
duct
of S
tate
s an
d UT
s - 2
006-
07 to
201
4-15
(At C
urre
nt P
rices
)(`
in C
rore
)
S.No
.St
ate/
UT20
06-0
720
07-0
820
08-0
920
09-1
020
10-1
120
11-1
220
12-1
320
13-1
4 20
14-1
5
1.An
dhra
Pra
desh
1566
4619
0738
2148
7324
6936
2897
7632
1806
3623
5341
1387
4612
57
2.Ar
unac
hal P
rade
sh37
6544
0751
9968
4083
5610
011
1096
312
557
1446
4
3.As
sam
5703
362
342
7147
885
253
1006
2711
1833
1213
8013
9604
1597
77
4.Bi
har
9133
110
2853
1296
9014
8151
1857
4522
2442
2689
0231
5225
3695
76
5.Ch
hatti
sgar
h57
536
6934
882
809
8419
610
2912
1233
3313
9920
1551
4917
3994
6.G
oa14
394
1704
522
149
2522
429
387
3806
137
035
4256
4NA
7.G
ujar
at24
0733
2815
7931
4485
3711
8745
4853
5114
4556
0687
6519
16NA
8.Ha
ryan
a11
6104
1365
8416
4636
2038
5523
7163
2730
9431
2753
3537
1439
5885
9.Hi
mac
hal P
rade
sh26
247
2887
333
115
3914
146
216
5188
558
489
6499
5NA
10.
Jam
mu
& Ka
shm
ir27
652
3072
034
290
3871
846
740
5517
462
611
7170
472
049
11.
Jhar
khan
d58
512
7438
876
234
8711
210
8652
1159
7512
9402
1503
3317
2189
12.
Karn
atak
a20
3819
2430
2827
8534
3007
4736
8338
4068
2146
5959
5460
0162
5412
13.
Kera
la13
5104
1539
8118
0134
2060
7023
3177
2772
3330
8272
3512
45NA
14.
Mad
hya
Prad
esh
1276
6314
2917
1755
0320
2225
2327
9427
0964
3214
4238
9277
4559
41
15.
Mah
aras
htra
5269
1061
9884
6777
8177
0794
9507
7110
5939
211
9520
913
6514
915
2585
7
16.
Man
ipur
5503
6049
6614
7372
8020
9746
1113
112
559
NA
17.
Meg
hala
ya77
0186
1910
341
1112
212
852
1514
416
707
1946
122
529
18.
Mizo
ram
2944
3411
4154
4717
5772
6230
7556
9302
NA
19.
Naga
land
6728
7477
8784
9711
1085
012
788
1444
116
328
1846
9
20.
Odi
sha
8792
111
1109
1275
1613
5837
1647
6018
3522
2106
2222
7877
2602
22(C
ontd
...)

44 Rural Development Statistics
S.No
.St
ate/
UT20
06-0
720
07-0
820
08-0
920
09-1
020
10-1
120
11-1
220
12-1
320
13-1
4 20
14-1
5
21.
Punj
ab11
3013
1357
0615
4827
1761
8720
2025
2273
8725
1812
2802
5530
7776
22.
Raja
stha
n15
1428
1722
5020
3939
2337
6730
0907
3740
9042
2982
4655
0451
6462
23.
Sikk
im18
7121
3927
9654
6366
3680
2994
3211
137
NA
24.
Tam
il Nad
u27
6711
3138
1235
9391
4300
1352
7912
6028
5167
1728
7717
6288
4195
25.
Tela
ngan
a11
2474
1352
1616
9132
1806
2423
4919
2664
7130
5876
3460
1838
0066
26.
Trip
ura
9981
1080
812
509
1416
216
573
1851
821
141
2596
5NA
27.
Utta
r Pra
desh
2967
6733
5810
3927
7146
3583
5322
1860
8926
6907
7576
0542
8610
54
28.
Utta
rakh
and
3267
040
279
4861
661
138
7297
085
602
9411
210
6890
1207
66
29.
Wes
t Ben
gal
2386
2927
3557
3105
3036
2517
4212
3148
0376
5477
0164
1695
7289
74
UTs
30.
A &
N Is
land
s22
9627
1531
6837
4239
3945
0050
3156
72NA
31.
Chan
diga
rh11
074
1232
713
745
1573
917
883
2025
921
998
2548
9NA
32.
Delh
i12
8276
1495
1917
8822
2053
7624
1234
2735
0532
0148
3734
4143
1948
33.
Pudu
cher
ry74
2981
7989
0811
085
1178
613
034
1480
019
076
2381
8
All-I
ndia
NDP
(200
4-05
bas
e)35
3454
740
9739
047
3836
954
4910
464
8864
175
1179
583
7274
492
9934
5NA
NA :
Not A
vaila
ble
Sour
ce :
GO
I, M
inist
ry o
f Fin
ance
, Eco
nom
ic Su
rvey
201
5-16
.
Tabl
e 2.
4: (C
ontd
...)

Socio-Economic Characteristics 45
Tabl
e 2.
5: G
row
th R
ates
* of
Net
Sta
te D
omes
tic P
rodu
ct o
f Sta
tes
and
UTs
- 20
05-0
6 to
201
4-15
(At C
urre
nt P
rices
)(%
)
S. N
o.St
ate/
UT20
05-0
620
06-0
720
07-0
820
08-0
920
09-1
020
10-1
120
11-1
220
12-1
320
13-1
420
14-1
5
1.An
dhra
Pra
desh
9.6
17.7
21.8
12.7
14.9
17.3
11.1
12.6
13.5
12.1
2.Ar
unac
hal P
rade
sh7.
99.
517
.118
.031
.622
.219
.89.
514
.515
.2
3.As
sam
11.1
8.8
9.3
14.7
19.3
18.0
11.1
8.5
15.0
14.5
4.Bi
har
5.7
23.2
12.6
26.1
14.2
25.4
19.8
20.9
17.2
17.2
5.Ch
hatti
sgar
h10
.326
.020
.519
.41.
722
.219
.813
.410
.912
.1
6.G
oa13
.515
.318
.429
.913
.916
.529
.52.
714
.9NA
7.G
ujar
at19
.816
.617
.011
.718
.022
.512
.49.
616
.3NA
8.Ha
ryan
a13
.518
.617
.620
.523
.816
.315
.214
.513
.111
.9
9.Hi
mac
hal P
rade
sh12
.110
.510
.014
.718
.218
.112
.312
.711
.1NA
10.
Jam
mu
& Ka
shm
ir8.
59.
411
.111
.612
.920
.718
.013
.514
.50.
5
11.
Jhar
khan
d0.
69.
727
.12.
514
.324
.76.
711
.616
.214
.5
12.
Karn
atak
a17
.616
.519
.214
.68.
022
.510
.414
.517
.214
.5
13.
Kera
la14
.812
.314
.017
.014
.413
.218
.911
.213
.9NA
14.
Mad
hya
Prad
esh
9.7
16.5
11.9
22.8
15.2
15.1
16.4
18.6
21.1
17.1
15.
Mah
aras
htra
18.1
20.5
17.6
9.3
13.7
23.3
11.4
12.8
14.2
11.8
16.
Man
ipur
11.6
7.1
9.9
9.3
11.5
8.8
21.5
14.2
12.8
Na
17.
Meg
hala
ya10
.519
.211
.920
.07.
615
.617
.810
.316
.515
.8
18.
Mizo
ram
11.0
10.5
15.9
21.8
13.6
22.4
7.9
21.3
23.1
NA
(Con
td...
)
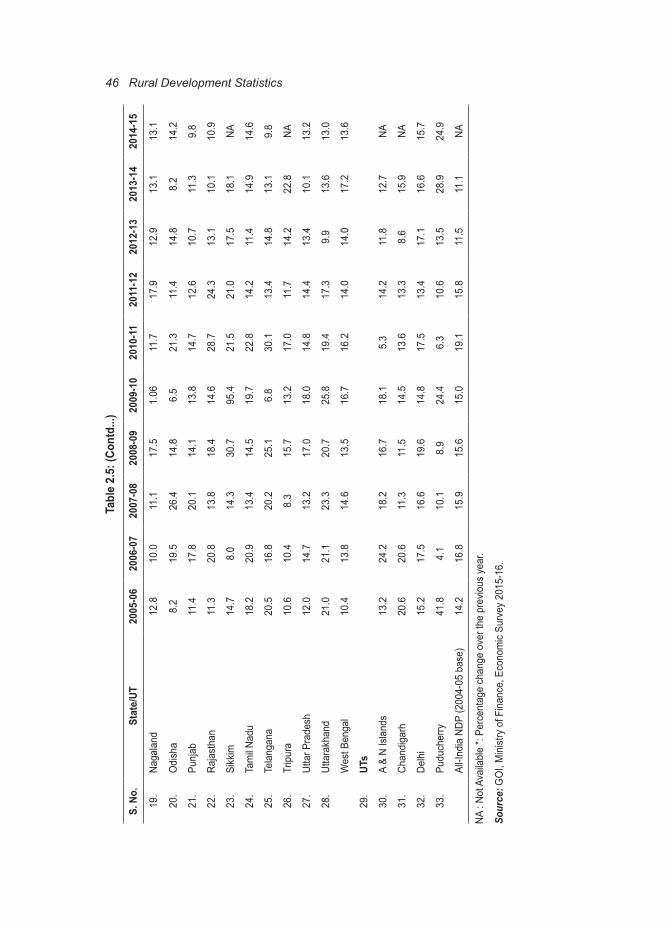
46 Rural Development Statistics
S. N
o.St
ate/
UT20
05-0
620
06-0
720
07-0
820
08-0
920
09-1
020
10-1
120
11-1
220
12-1
320
13-1
420
14-1
5
19.
Naga
land
12.8
10.0
11.1
17.5
1.06
11.7
17.9
12.9
13.1
13.1
20.
Odi
sha
8.2
19.5
26.4
14.8
6.5
21.3
11.4
14.8
8.2
14.2
21.
Punj
ab11
.417
.820
.114
.113
.814
.712
.610
.711
.39.
8
22.
Raja
stha
n11
.320
.813
.818
.414
.628
.724
.313
.110
.110
.9
23.
Sikk
im14
.78.
014
.330
.795
.421
.521
.017
.518
.1NA
24.
Tam
il Nad
u18
.220
.913
.414
.519
.722
.814
.211
.414
.914
.6
25.
Tela
ngan
a20
.516
.820
.225
.16.
830
.113
.414
.813
.19.
8
26.
Trip
ura
10.6
10.4
8.3
15.7
13.2
17.0
11.7
14.2
22.8
NA
27.
Utta
r Pra
desh
12.0
14.7
13.2
17.0
18.0
14.8
14.4
13.4
10.1
13.2
28.
Utta
rakh
and
21.0
21.1
23.3
20.7
25.8
19.4
17.3
9.9
13.6
13.0
Wes
t Ben
gal
10.4
13.8
14.6
13.5
16.7
16.2
14.0
14.0
17.2
13.6
29.
UTs
30.
A &
N Is
land
s13
.224
.218
.216
.718
.15.
314
.211
.812
.7NA
31.
Chan
diga
rh20
.620
.611
.311
.514
.513
.613
.38.
615
.9NA
32.
Delh
i15
.217
.516
.619
.614
.817
.513
.417
.116
.615
.7
33.
Pudu
cher
ry41
.84.
110
.18.
924
.46.
310
.613
.528
.924
.9
All-I
ndia
NDP
(200
4-05
bas
e)14
.216
.815
.915
.615
.019
.115
.811
.511
.1NA
NA :
Not A
vaila
ble
*: Pe
rcen
tage
cha
nge
over
the
prev
ious
yea
r.
Sour
ce: G
OI,
Min
istry
of F
inan
ce, E
cono
mic
Surv
ey 2
015-
16.
Tabl
e 2.
5: (C
ontd
...)

Socio-Economic Characteristics 47
Tab
le 2
.6: P
er C
apita
Sta
te D
omes
tic P
rodu
ct a
t Cur
rent
Pric
es (2
004-
05 S
erie
s)(2
004-
05 to
201
4-15
)
(`)
S. N
o.St
ate/
UT20
04-0
520
05-0
620
06-0
720
07-0
820
08-0
920
09-1
020
10-1
120
11-1
220
12-1
320
13-1
420
14-1
5
1.An
dhra
Pra
desh
2595
928
223
3296
139
780
4437
650
515
5873
364
773
7230
181
397
9051
7
2.Ar
unac
hal P
rade
sh26
721
2817
130
132
3446
639
726
5106
860
961
7136
676
370
8546
896
199
3.As
sam
1678
218
396
1973
721
290
2409
928
383
3308
736
320
3894
544
263
4948
0
4.Bi
har
7914
8223
9967
1105
113
728
1545
719
111
2258
226
948
3119
936
143
5.Ch
hatti
sgar
h18
559
2011
724
800
2938
534
360
3436
641
165
4836
653
815
5854
764
442
6.G
oa76
968
8472
194
882
1087
0813
5966
1491
6416
8024
2115
7020
0514
2241
38NA
7.G
ujar
at32
021
3778
043
395
5001
655
068
6409
777
485
8597
993
046
1068
31NA
8.Ha
ryan
a37
972
4230
949
261
5691
767
405
8203
793
852
1063
2011
9833
1334
2714
7076
9.Hi
mac
hal P
rade
sh33
348
3694
940
393
4396
649
903
5840
268
297
7518
583
899
9230
0NA
10.
Jam
mu
& Ka
shm
ir21
734
2324
025
059
2744
830
212
3365
040
089
4673
452
386
5927
958
888
11.
Jhar
khan
d18
510
1832
619
789
2478
925
046
2822
334
721
3655
440
238
4613
152
147
12.
Karn
atak
a26
882
3123
935
981
4241
948
084
5136
462
251
6805
377
168
8954
510
1594
13.
Kera
la32
351
3695
841
318
4686
554
560
6211
469
943
8275
391
567
1038
20NA
14.
Mad
hya
Prad
esh
1544
216
631
1902
820
935
2527
828
651
3245
337
180
4342
651
798
5977
0
15.
Mah
aras
htra
3607
741
965
4983
157
760
6223
469
765
8485
893
282
1038
5611
7091
1292
35
16.
Man
ipur
1854
720
251
2122
022
820
2441
326
621
2833
633
695
3765
641
573
NA
17.
Meg
hala
ya23
079
2488
528
940
3160
236
992
3881
943
766
5031
654
156
6154
869
516
18.
Mizo
ram
2466
226
698
2876
432
488
3858
242
715
5095
653
624
6341
376
120
NA
19.
Naga
land
3044
133
792
3656
839
985
4620
750
263
5558
263
781
7027
477
529
8554
4
(Con
td...
)

48 Rural Development Statistics
S. N
o.St
ate/
UT20
04-0
520
05-0
620
06-0
720
07-0
820
08-0
920
09-1
020
10-1
120
11-1
220
12-1
320
13-1
420
14-1
5
20.
Odi
sha
1765
018
846
2223
727
735
3141
633
029
3953
743
463
4922
752
559
5922
9
21.
Punj
ab33
103
3619
941
883
4938
055
315
6180
569
582
7689
584
512
9235
099
578
22.
Raja
stha
n18
565
2027
524
055
2688
231
279
3525
444
644
5463
760
844
6597
472
156
23.
Sikk
im26
690
3025
232
199
3644
846
983
9074
910
8972
1301
2715
1395
1764
91NA
24.
Tam
il Nad
u30
062
3524
342
288
4760
654
137
6433
878
473
8905
098
628
1126
6412
8366
25.
Tela
ngan
a24
409
2898
733
381
3965
249
114
5195
566
951
7512
485
169
9536
110
3889
26.
Trip
ura
2439
426
668
2908
131
111
3558
739
815
4605
050
859
5740
269
705
NA
27.
Utta
r Pra
desh
1295
014
221
1601
317
785
2042
223
671
2669
830
021
3348
236
250
4037
3
28.
Utta
rakh
and
2472
629
441
3511
142
619
5065
762
757
7381
985
372
9256
610
3716
1156
32
29W
est B
enga
l22
649
2472
027
823
3156
735
487
4103
947
245
5338
360
318
7005
978
903
UTs
30.
A &
N Is
land
s40
921
4475
453
778
6143
069
177
7893
680
558
8964
297
687
1074
18NA
31.
Chan
diga
rh74
173
8499
397
568
1029
8010
8486
1173
7112
6651
1368
8314
1926
1569
51NA
32.
Delh
i63
877
7220
883
275
9524
111
1756
1259
3614
5129
1614
4618
5421
2122
1924
0849
33Pu
duch
erry
4830
267
205
6867
374
201
7930
696
860
1010
7210
3149
1142
5614
3677
1750
06
All-I
ndia
Per
Cap
ita
NNI (
2004
-05
base
)24
143
2713
131
206
3582
540
775
4624
954
021
6185
567
839
7438
0NA
NNI:
Net N
atio
nal I
ncom
e NA
: Not
Ava
ilabl
e So
urce
: G
OI,
Min
istry
of F
inan
ce, E
cono
mic
Surv
ey 2
015-
16.
Tabl
e 2.
6: (C
ontd
...)

Socio-Economic Characteristics 49
Tab
le 2
.7: G
row
th P
er C
apita
Net
Sta
te D
omes
tic P
rodu
ct a
t Cur
rent
Pric
es (
2004
-05
Serie
s)(P
erce
ntag
e ch
ange
ove
r pre
viou
s ye
ar)
(%
)
S.No
.St
ate/
UT20
05-0
620
06-0
720
07-0
820
08-0
920
09-1
020
10-1
120
11-1
220
12-1
320
13-1
420
14-1
5
1.An
dhra
Pra
desh
8.7
16.8
20.7
11.6
13.8
16.3
10.3
11.6
12.6
11.2
2.Ar
unac
hal P
rade
sh5.
47.
014
.415
.328
.619
.417
.17.
011
.912
.6
3.As
sam
9.6
7.3
7.9
13.2
17.8
16.6
9.8
7.2
13.7
11.8
4.Bi
har
3.9
21.2
10.9
24.2
12.6
23.6
18.2
19.3
15.8
15.8
5.Ch
hatti
sgar
h8.
423
.318
.516
.90.
019
.817
.511
.38.
810
.1
6.G
oa10
.112
.014
.625
.19.
712
.625
.9-5
.211
.8NA
7.G
ujar
at18
.014
.915
.310
.116
.420
.911
.08.
214
.8NA
8.Ha
ryan
a11
.416
.415
.518
.421
.714
.413
.312
.711
.310
.2
9.Hi
mac
hal P
rade
sh10
.89.
38.
813
.517
.016
.910
.111
.610
.0NA
10.
Jam
mu
& Ka
shm
ir6.
97.
89.
510
.111
.419
.116
.612
.113
.2-0
.7
11.
Jhar
khan
d-1
.08.
025
.31.
012
.723
.05.
310
.114
.613
.0
12.
Karn
atak
a16
.215
.217
.913
.46.
821
.29.
313
.416
.013
.5
13.
Kera
la14
.211
.813
.416
.413
.812
.618
.310
.713
.4NA
14.
Mad
hya
Prad
esh
7.7
14.4
10.0
20.7
13.3
13.3
14.6
16.8
19.3
15.4
15.
Mah
aras
htra
16.3
18.7
15.9
7.7
12.1
21.6
9.9
11.3
12.7
10.4
16.
Man
ipur
9.2
4.8
7.5
7.0
9.0
6.4
18.9
11.8
10.4
NA
17.
Meg
hala
ya7.
816
.39.
217
.14.
912
.715
.07.
613
.612
.9
18.
Mizo
ram
8.3
7.7
12.9
18.8
10.7
19.3
5.2
18.3
20.0
NA
19.
Naga
land
11.0
8.2
9.3
15.6
8.8
10.6
14.8
10.2
10.3
10.3
(Con
td...
)

50 Rural Development Statistics
S.No
.St
ate/
UT20
05-0
620
06-0
720
07-0
820
08-0
920
09-1
020
10-1
120
11-1
220
12-1
320
13-1
420
14-1
5
20.
Odi
sha
6.8
18.0
24.7
13.3
5.1
19.7
9.9
13.3
6.8
12.7
21.
Punj
ab9.
415
.717
.912
.011
.712
.610
.59.
99.
37.
8
22.
Raja
stha
n9.
218
.611
.816
.412
.726
.622
.411
.48.
49.
4
23.
Sikk
im13
.36.
413
.228
.923
.220
.119
.416
.316
.6NA
24.
Tam
il Nad
u17
.220
.012
.613
.718
.822
.013
.510
.814
.213
.9
25.
Tela
ngan
a18
.815
.218
.823
.95.
828
.912
.213
.412
.08.
9
26.
Trip
ura
9.3
9.0
7.0
14.4
11.9
15.7
10.4
12.9
21.4
NA
27.
Utta
r Pra
desh
9.8
12.6
11.1
14.8
15.9
12.8
12.4
11.5
8.3
11.4
28.
Utta
rakh
and
19.1
19.3
21.4
18.9
23.9
17.6
15.7
8.4
12.0
11.5
29W
est B
enga
l9.
112
.613
.512
.415
.615
.113
.013
.016
.112
.6
UTs
30.
A &
N Is
land
s9.
420
.214
.212
.614
.12.
111
.39.
010
.0NA
31.
Chan
diga
rh14
.614
.85.
55.
38.
27.
98.
13.
710
.6NA
32.
Delh
i13
.015
.314
.417
.312
.715
.211
.214
.914
.513
.5
33Pu
duch
erry
39.1
2.2
8.0
6.9
22.1
4.3
2.1
10.8
25.8
21.8
All-I
ndia
Per
Cap
ita
NNI (
2004
-05
Base
)12
.415
.014
.813
.813
.416
.814
.59.
79.
6NA
NA: N
ot A
vaila
ble
Sour
ce :
GO
I, M
inist
ry o
f Fin
ance
, Eco
nom
ic Su
rvey
201
5-16
.
Tab
le 2
.7: (
Cont
d...)

Socio-Economic Characteristics 51
Tabl
e 2.
8: P
er C
apita
Net
Sta
te D
omes
tic P
rodu
ct
(At C
onst
ant P
rices
) (Ba
se: 2
004-
05)
(`)
S.No
.St
ate/
UT20
06-0
720
07-0
820
08-0
920
09-1
020
10-1
120
11-1
220
12-1
320
13-1
4
1.An
dhra
Pra
desh
3011
433
239
3527
237
061
4005
442
589
4452
646
788
2.Ar
unac
hal P
rade
sh27
554
3018
731
971
3527
834
470
3523
135
845
3776
7
3.As
sam
1757
918
089
1892
220
193
2161
122
420
2344
824
533
4.Bi
har
9150
9685
1099
412
012
1209
013
149
1436
215
650
5.Jh
arkh
and
1742
720
996
1986
720
646
2433
025
265
2701
028
882
6.G
oa86
257
8708
590
386
9688
511
0306
1293
9713
2121
-
7.G
ujar
at38
568
4249
843
685
4851
153
813
5744
761
220
-
8.Ha
ryan
a44
425
4705
449
806
5488
457
797
6171
664
136
6731
7
9.Hi
mac
hal P
rade
sh38
195
4014
341
666
4330
546
682
4920
351
730
5449
4
10.
Jam
mu
& Ka
shm
ir23
375
2447
025
641
2634
427
666
2883
339
754
3105
4
11.
Karn
atak
a31
967
3557
437
687
3864
640
6999
4149
242
976
4502
4
12.
Kera
la37
284
4028
842
433
4590
848
504
5209
556
115
-
13.
Mad
hya
Prad
esh
1707
317
572
1944
221
095
2170
623
447
2546
327
917
14.
Chha
ttisg
arh
2158
022
929
2392
624
690
2599
127
163
2742
128
113
15.
Mah
aras
htra
4615
850
532
5105
357
458
5958
761
468
6421
869
584
16.
Man
ipur
1943
120
106
2116
922
359
2114
722
739
2239
5--
17.
Meg
hala
ya27
242
2776
430
963
3323
535
363
3421
734
004
3743
9
18.
Mizo
ram
2630
828
467
3193
334
456
4007
237
921
3934
7--
19.
Naga
land
3507
437
317
3904
140
057
4399
246
340
4811
149
963
(Con
td...)

52 Rural Development Statistics
S.No
.St
ate/
UT20
06-0
720
07-0
820
08-0
920
09-1
020
10-1
120
11-1
220
12-1
320
13-1
4
20.
Odi
sha
2019
421
640
2296
324
275
2396
824
151
2541
525
891
21.
Punj
ab37
087
3956
741
003
4272
744
769
4632
547
834
4941
1
22.
Raja
stha
n21
342
2192
223
356
2416
627
502
2842
929
244
3012
0
23.
Sikk
im30
296
3172
535
398
4418
666
136
7370
478
427
8352
7
24.
Tam
il Nad
u39
166
4131
442
939
4669
253
507
5709
358
360
6236
1
25.
Trip
ura
2755
829
022
3171
134
328
3671
839
382
4231
5--
26.
Utta
r Pra
desh
1424
114
875
1571
316
374
1738
817
980
1859
519
234
27.
Utta
rakh
and
3072
035
437
3862
542
292
4852
552
607
5446
256
822
28.
Wes
t Ben
gal
2540
027
094
2791
430
372
3131
432
164
3388
936
527
UTs
29.
A &
N Is
land
s47
522
5062
956
304
5613
664
712
6835
671
896
7271
6
30.
Chan
diga
rh85
372
8692
388
284
9159
883
319
8080
179
153
8279
8
31.
Delh
i76
243
8324
391
845
1000
5010
3619
1107
8011
8960
1276
67
32.
Pudu
cher
ry61
142
6474
969
760
7472
084
142
8051
787
177
9622
2
All-
Indi
a (P
er C
apita
NNP
at f
acto
r cos
t)--
----
----
----
--
NA :
Not A
vaila
ble
Sour
ce: G
OI,
Hand
book
of S
tatis
tics
on In
dian
Eco
nom
y, 20
13-1
4, R
eser
ve B
ank
of In
dia.
Tab
le 2
.8: (
Cont
d...)

Socio-Economic Characteristics 53
Table 2.9: Growth Rates of State Domestic Product in Different States (% per annum)
S.No. State/UT Eighth Plan Ninth Plan Tenth Plan # Eleventh Plan
Non-special Category States
1. Andhra Pradesh 5.4 4.6 6.7 8.33
2. Bihar 2.2 4.0 4.7 12.11
3. Chhattisgarh N.A N.A 9.2 8.44
4. Goa 8.9 5.5 7.8 9.02
5. Gujarat 12.4 4.0 10.6 9.59
6. Haryana 5.2 4.1 7.6 9.10
7. Jharkhand N.A N.A 11.1 7.27
8. Karnataka 6.2 7.2 7.0 8.04
9. Kerala 6.5 5.7 7.2 8.04
10. Madhya Pradesh 6.3 4.0 4.3 8.93
11. Maharashtra 8.9 4.7 7.9 9.48
12. Odisha 2.1 5.1 9.1 8.23
13. Punjab 4.7 4.4 4.5 6.87
14. Rajasthan 7.5 3.5 5.0 7.68
15. Tamil Nadu 7.0 6.3 6.6 8.32
16. Uttar Pradesh 4.9 4.0 4.6 6.90
17. West Bengal 6.3 6.9 6.1 7.32
Special Category States
18. Arunachal Pradesh 5.1 4.4 5.8 9.42
19. Assam 2.8 2.1 6.1 5.50
20. Himachal Pradesh 6.5 5.9 7.3 5.50
21. Jammu and Kashmir 5.0 5.2 5.2 4.40
22. Manipur 4.6 6.4 11.6 4.60
23. Meghalaya 3.8 6.2 5.6 7.50
24. Mizoram N.A N.A 5.9 8.70
25. Nagaland 8.9 2.6 8.3 3.50
26. Sikkim 5.3 8.3 7.7 12.20
27. Tripura 6.6 7.4 8.7 8.00
28. Uttarakhand N.A N.A 8.8 9.30
#: Average of 2002-03 to 2005-06 for all States except J&K, Mizoram, Nagaland (2002-03) and Tripura (2002-03 to 2003-04).Source : GOI, Planning Commission, Twelfth Five Year Plan, 2012-2017, Volume-I, Faster More Inclusive and Sustainable Growth.

54 Rural Development Statistics
Table 2.10: State-wise Growth Targets for the Eleventh & Twelfth Five Year Plan Period(Annual Average in %)
S.No. State/UT
State-wise Growth Target
Eleventh Plan Twelfth Plan
Agricul-ture Industry Services Agricul-
ture Industry Services
Non-special Category States
1. Andhra Pradesh 4.0 12.0 10.4 5.2 8.6 9.5
2. Bihar 7.0 8.0 8.0 6.0 10.0 10.0
3. Chhattisgarh 1.7 12.0 8.0 5.0 10.0 10.0
4. Goa 7.7 15.7 9.0 0.5 7.7 10.0
5. Gujarat 5.5 14.0 10.5 4.0 8.3 9.5
6. Haryana 5.3 14.0 12.0 4.2 7.5 9.5
7. Jharkhand 6.3 12.0 8.0 6.0 7.0 9.0
8. Karnataka 5.4 12.5 12.0 4.5 6.5 9.0
9. Kerala 0.3 9.0 11.0 1.0 7.0 9.5
10. Madhya Pradesh 4.4 8.0 7.0 7.0 10.0 9.0
11. Maharashtra 4.4 8.0 10.2 3.5 9.0 9.5
12. Odisha 3.0 12.0 9.6 4.0 9.0 9.0
13. Punjab 2.4 8.0 7.4 1.6 7.5 8.0
14. Rajasthan 3.5 8.0 8.9 4.6 7.0 9.0
15. Tamil Nadu 4.7 8.0 9.4 4.0 7.7 8.5
16. Uttar Pradesh 3.0 8.0 7.1 3.5 8.2 9.0
17. West Bengal 4.0 11.0 11.0 3.2 7.0 9.0
Special Category States
18. Arunachal Pradesh 2.8 8.0 7.2 5.5 9.0 10.0
19. Assam 2.0 8.0 8.0 4.8 4.7 9.0
20. Himachal Pradesh 3.0 14.5 7.5 3.0 8.7 9.0
21. Jammu and Kashmir
4.3 9.8 6.4 1.5 7.0 8.5
22. Manipur 1.2 8.0 7.0 5.3 5.0 8.5
23. Meghalaya 4.7 8.0 7.9 3.1 8.8 9.0
24. Mizoram 1.6 8.0 8.0 6.9 9.9 9.0
25. Nagaland 8.4 8.0 10.0 4.5 9.0 8.0
26. Sikkim 3.3 8.0 7.2 4.0 8.0 10.0
27. Tripura 1.4 8.0 8.0 5.0 8.0 9.0
28. Uttarakhand 3.0 12.0 11.0 3.0 9.3 10.0
All-India 4.0 8.1 9.1Source : GOI, Planning Commission, Twelfth Five Year Plan, 2012-2017, Volume-II, Economic Sectors.

Socio-Economic Characteristics 55
Tabl
e 2.
11: G
row
th R
ate
in G
ross
Val
ue A
dded
(GVA
) at B
asic
Pric
es fo
r diff
eren
t Sec
tors
(%)
Sect
or
2012
-13
a20
13-1
4 a
2014
-15
b20
15-1
6 c
2016
-17
d20
16-1
7
H1H2
Agric
ultu
re, F
ores
try a
nd F
ishin
g1.
54.
2-0
.21.
24.
12.
55.
2
Indu
stry
3.6
5.0
5.9
7.4
5.2
5.6
4.9
Min
ing
and
Qua
rryin
g-0
.53.
010
.87.
4-1
.8-0
.9-2
.6
Man
ufac
turin
g6.
05.
65.
59.
37.
48.
16.
7
Elec
tricit
y, G
as, W
ater
Sup
ply,
etc.
2.8
4.7
8.0
6.6
6.5
6.4
6.6
Cons
truct
ion
0.6
4.6
4.4
3.9
2.9
2.5
3.4
Serv
ices
8.1
7.8
10.3
8.9
8.8
9.2
8.4
Trad
e, H
otel
, Tra
nspo
rt an
d St
orag
e9.
77.
89.
89.
06.
07.
64.
5
Fina
ncia
l, Re
al E
stat
e an
d Pr
ofes
-sio
nal S
ervic
es9.
510
.110
.610
.39.
08.
89.
2
Pubi
c Adm
inist
ratio
n, D
efen
ce, e
tc.
4.1
4.5
10.7
6.6
12.8
12.4
13.2
GVA
at B
asic
Price
s 5.
46.
37.
17.
27.
07.
26.
7
a= se
cond
revis
ed e
stim
ate
b: fir
st re
vised
esti
mat
e c:
prov
ision
al es
timat
e d:
first
adva
nce
estim
ate.
Sour
ce: M
inistr
y of F
inanc
e, E
cono
mic
Surv
ey 2
016-
17.

56 Rural Development Statistics
Tabl
e 2.
12: A
nnua
l Gro
wth
Rat
es o
f GDP
Indu
stry
-wis
e at
Orig
in a
t Co
nsta
nt P
rices
(200
4-05
)
(%)
S. No.
Indu
stry
Elev
enth
Pla
n Pe
riod
Twel
fth P
lan
Perio
d
2007
-08
2008
-09
2009
-10
2010
-11
2011
-12
Aver
age
2007
-08
2008
-09
2009
-10
2010
-11
2011
-12
Aver
age
1Ag
ricul
ture
, For
estry
an
d Fi
shin
g 5.
80.
11.
07.
02.
83.
30.
56.
04.
54.
54.
54.
0
2M
inin
g an
d Q
uarry
ing
3.7
2.1
6.3
5.0
-0.9
3.2
4.4
7.5
7.5
8.0
8.5
7.2
3M
anuf
actu
ring
10.3
4.3
9.7
7.6
2.5
6.9
4.5
7.5
8.0
10.0
10.0
8.0
4El
ectri
city,
Gas
and
W
ater
Sup
ply
8.3
4.6
6.3
3.0
7.9
6.0
8.0
7.0
8.0
8.0
8.0
7.8
5Co
nstru
ctio
n10
.85.
37.
08.
05.
37.
36.
57.
58.
010
.011
.08.
6
6Tr
ade,
Hot
els
and
Rest
aura
nts
10.1
5.7
7.8
9.0
9.0
8.3
8.0
8.2
8.5
8.7
8.7
8.4
7Tr
ansp
ort,
Stor
age
and
Com
mun
icatio
n11
.910
.814
.814
.711
.512
.711
.311
.912
.211
.811
.811
.8
8Fi
nanc
e, In
sura
nce,
Re
al E
stat
e an
d Bu
sines
s Se
rvice
s
11.9
12.0
9.4
10.4
9.6
10.7
9.5
9.5
9.5
9.7
10.0
9.6
9Co
mm
unity
, Soc
ial a
nd
Pers
onal
Ser
vices
6.9
12.5
12.0
4.5
5.8
8.4
7.0
6.0
6.5
7.0
7.0
6.7
Tota
l GDP
9.3
6.7
8.4
8.4
6.5
7.9
6.7
8.1
8.2
8.8
9.0
8.2
Indu
stry
( 2
- 5)
9.7
4.4
8.4
7.2
3.4
6.6
5.3
7.5
8.0
9.7
10.0
8.1
Serv
ices
(6 -
9)10
.210
.010
.29.
38.
99.
88.
98.
89.
19.
39.
49.
1
* : P
roje
ctio
n.So
urce
: G
OI,
Plan
ning
Com
miss
ion,
Twe
lfth
Five
Yea
r Pla
n, 2
012-
2017
, Vol
ume-
I, Fa
ster
Mor
e Ex
clusiv
e an
d Su
stai
nabl
e G
rowt
h.

Socio-Economic Characteristics 57
B. L
ABO
UR F
ORC
E PA
RTIC
IPAT
ION
RATE
S (L
FPR)
Tabl
e 2.
13: P
opul
atio
n Pr
ojec
tions
in D
iffer
ent P
erio
ds(N
umbe
r in
Lakh
s)
Cate
gory
Basi
s 19
8319
93-9
4 *
2004
-05
*20
06-0
720
11-1
220
16-1
7
Popu
latio
n (a
ge 0
+)
7181
.01
8936
.76
1092
8.30
1128
3.13
1207
9.71
1283
2.42
Popu
latio
n (a
ge 1
5-59
)50
17.6
065
29.4
068
71.2
076
01.1
082
05.7
0
Labo
ur F
orce
US (P
S)37
86.5
047
12.5
049
26.6
054
18.4
058
64.4
0
Labo
ur F
orce
CD
S26
38.2
433
41.9
741
96.4
743
89.4
848
36.5
952
40.5
7
Labo
ur F
orce
(Rur
al)
CDS
2061
.52
2529
.55
3031
.72
Tabl
e 2.
14: L
abou
r For
ce G
row
th R
ates
(% p
er a
nnum
)
Cate
gory
Basi
s 19
83 to
199
3-94
1993
-94
to 2
004-
05 *
2004
-05
to 2
006-
0720
06-0
7 to
201
1-12
2011
-12
to 2
016-
17
Popu
latio
n (a
ge 0
+)
2.11
1.85
1.43
1.37
1.22
Popu
latio
n (a
ge 1
5-59
)2.
422.
292.
041.
54
Labo
ur F
orce
US (P
S)2.
011.
991.
921.
59
Labo
ur F
orce
CD
S2.
282.
092.
021.
961.
62
Labo
ur F
orce
(Rur
al)
CDS
1.97
1.66
US (P
S) :
Usua
l Sta
tus
(Prin
cipal
Sta
tus)
CDS
: Cur
rent
Dai
ly St
atus
*: A
ctua
l tak
en fr
om N
SSO
. So
urce
: G
OI,
Plan
ning
Com
miss
ion,
Ele
vent
h Fi
ve Y
ear P
lan,
200
7-20
12, V
olum
e-I,
Inclu
sive
Gro
wth.

58 Rural Development Statistics
Tabl
e 2.
15a:
Lab
our F
orce
Par
ticip
atio
n Ra
tes
(LFP
R) b
y Se
x –
Rura
l (Al
l-Age
s)
(Per
100
0 M
ales
/ Fe
mal
es)
Stat
usM
ale
Fem
ale
1993
-94
1999
-20
0020
04-
0520
05-
0620
07-
0820
09-
1020
11-
1219
93-
9419
99-
2000
2004
-05
2005
-06
2007
-08
2009
-10
2011
-12
I.Us
ual
Stat
us
(i)Pr
incip
al54
953
354
655
155
154
854
.723
723
524
922
922
020
818
1
(ii)
Prin
cipal
&
Subs
idia
ry56
154
055
556
155
955
655
.333
030
233
331
429
226
525
3
II.Cu
rrent
St
atus
(i)W
eekly
547
531
545
548
547
548
54.5
276
263
287
265
245
231
215
(ii)
Daily
534
515
531
536
536
536
53.4
232
220
237
219
204
197
180
Sour
ce :
GO
I, NS
SO, K
ey In
dica
tors
of E
mpl
oym
ent &
Une
mpl
oym
ent S
ituat
ion
in In
dia
2011
-12,
68th
Rou
nd, J
uly
2011
– J
une
2012
.
Tabl
e 2.
15 (b
): La
bour
For
ce P
artic
ipat
ion
Rate
(LFP
R) b
ased
on
UPS
& UP
SS a
ppro
ach
for p
erso
ns a
ged
15 y
ears
& a
bove
(All-
Indi
a) (%
)20
15-1
6
Appr
oach
Rura
lUr
ban
Rura
l + U
rban
Mal
eFe
mal
eTo
tal
Mal
eFe
mal
eTo
tal
Mal
eFe
mal
eTo
tal
UPS
77.3
26.7
51.1
69.1
16.2
41.2
75.0
23.7
48.0
UPSS
78.0
31.7
52.2
69.1
16.6
41.2
75.5
27.4
78.8
Sour
ce :
Labo
ur B
urea
ru, M
inistr
y of L
abou
r & E
mplo
ymen
t, Re
port
on F
ifth A
nnua
l Em
ploym
ent –
Une
mplo
ymen
t Sur
vey,
2015
-16.

Socio-Economic Characteristics 59
Tabl
e 2.
16 (a
): Di
strib
utio
n of
Pop
ulat
ion
Acco
rdin
g to
Cat
egor
y of
Wor
k –
2001
and
201
1
S. N
o.Un
it20
0120
11
Tota
lRu
ral
Urba
nTo
tal
Rura
lUr
ban
1No
. of P
erso
nsM
illion
1025
740
285
1210
.19
833.
0837
7.11
2 (a
)To
tal W
orke
rs (M
ain
+ M
argi
nal)
Perc
enta
ge39
.342
.032
.239
.841
.835
.3
2 (b
)M
ain-
Wor
kers
to to
tal W
orke
rsPe
rcen
tage
77.8
73.9
90.8
75.2
70.5
87.6
Mar
gina
l Wor
kers
to to
tal W
orke
rs22
.226
.19.
224
.829
.512
.4
3 (a
)Ca
tego
ry o
f Wor
kers
(Mai
n+ M
argi
nal)
Perc
enta
ge
(i) C
ultiv
ator
s31
.740
.13.
224
.633
.02.
8
(ii) A
gricu
ltura
l Lab
oure
rs26
.733
.24.
730
.039
.35.
5
(iii)
Wor
kers
in H
H In
dust
ry4.
13.
85.
13.
83.
44.
8
(iv) O
ther
Wor
kers
37.5
22.9
87.0
41.6
24.3
86.9
Tota
l10
0.0
100.
010
0.0
100.
010
0.0
100.
0
Sour
ce :
www.
cens
usin
dia.
gov.i
n.

60 Rural Development Statistics
Table 2.16 (b): Distribution of Rural Workers by Occupation, Sex and State-wise – 2011 (Percentage)
S. No. State/UTPercentage to Total Workers (Main and Marginal)
Cultivators Agri. LabourersMale Female Persons Male Female Persons
(1) (2) (3) (4) (5) (6) (7) (8)1. Andhra Pradesh 25.4 16.5 21.6 46.4 67.3 55.42. Arunachal Pradesh 56.7 71.9 63.4 6.4 8.1 7.13. Assam 42.2 30.6 38.8 15.3 22.7 17.54. Bihar 24.9 16.0 22.3 54.3 63.4 56.95. Chhattisgarh 42.6 34.1 38.8 40.6 58.4 48.66. Goa 10.1 17.3 12.3 7.2 15.1 9.57. Gujarat 40.1 21.7 33.7 33.5 56.9 41.68. Haryana 39.2 42.0 40.0 21.5 28.7 23.49. Himachal Pradesh 49.0 79.1 62.3 5.4 4.9 5.2
10. Karnataka 40.4 24.7 34.3 26.9 51.3 36.411. Jammu & Kashmir 33.0 50.0 37.9 17.0 13.6 16.012. Jharkhand 34.7 35.1 34.8 35.1 48.0 40.313. Kerala 10.6 5.9 9.3 15.3 21.4 17.114. Madhya Pradesh 42.7 31.8 38.3 40.8 57.0 47.315. Maharashtra 41.0 38.3 39.9 35.3 50.3 41.516. Manipur 51.5 48.2 50.1 7.3 15.0 10.717. Meghalaya 48.5 51.9 50.0 18.3 21.8 19.718. Mizoram 74.3 78.6 76.2 6.6 8.9 7.619. Nagaland 62.0 74.7 68.0 7.0 7.7 7.320. Odisha 33.3 13.9 26.7 34.2 623 43.821. Punjab 33.4 14.4 29.8 22.9 27.8 23.922. Rajasthan 53.4 56.6 54.8 14.6 25.6 19.423. Sikkim 42.4 56.1 47.8 8.3 13.2 10.224. Tamil Nadu 22.1 18.4 20.6 37.1 55.5 44.625. Tripura 28.6 18.9 25.6 26.5 38.9 30.426. Uttarakhand 41.7 72.3 54.0 15.2 9.6 12.927. Uttar Pradesh 39.2 25.5 35.6 33.8 43.8 36.428. West Bengal 24.0 10.0 20.6 39.4 45.5 40.929. A & N Islands 16.6 19.3 17.1 4.8 5.1 4.930. Chandigarh 3.8 3.0 3.7 1.1 2.7 1.431. D & N Haveli 30.0 33.1 31.1 8.8 41.2 19.732. Daman & Diu 5.0 16.1 7.1 1.0 8.1 2.433. Delhi 10.1 12.5 10.5 5.8 11.0 6.534. Lakshadweep 0.0 0.0 0.0 0.0 0.0 6.535. Puducherry 7.0 3.8 6.1 33.5 54.2 0.0
All India 35.2 28.8 33.0 34.4 48.5 39.3(Contd…)

Socio-Economic Characteristics 61
Tabl
e 2.
16 (b
): (C
ontd
..)
Dist
ribut
ion
of R
ural
Wor
kers
by
Occ
upat
ion,
Sex
and
Sta
te-w
ise
– 20
11(%
)
S. N
o.St
ate/
UTPe
rcen
tage
to T
otal
Wor
kers
(Mai
n +
Mar
gina
l)To
tal W
orke
rs (M
ain
+ M
argi
nal)
Hous
ehol
d In
dust
ry W
orke
rsO
ther
Wor
kers
Mal
eFe
mal
ePe
rson
sM
ale
Fem
ale
Pers
ons
Mal
eFe
mal
ePe
rson
s(1
)(2
)(9
)(1
0)(1
1)(1
2)(1
3)(1
4)(1
5)(1
6)(1
7)1.
Andh
ra P
rade
sh2.
24.
43.
126
.011
.819
.958
.444
.651
.52.
Arun
acha
l Pra
desh
1.1
1.5
1.3
35.8
18.4
28.2
48.5
39.5
44.1
3.As
sam
2.4
8.4
4.2
40.1
38.3
39.6
53.1
23.7
38.7
4.Bi
har
2.7
6.5
3.8
18.1
14.1
17.0
46.7
20.2
34.0
5.Ch
hatti
sgar
h1.
31.
21.
215
.56.
411
.456
.446
.351
.36.
Goa
2.8
3.3
3.0
79.8
64.3
75.3
55.5
22.6
39.1
7.G
ujar
at1.
01.
21.
125
.320
.323
.657
.132
.044
.98.
Hary
ana
1.9
3.2
2.2
37.4
26.1
34.4
50.1
20.8
36.4
9.Hi
mac
hal P
rade
sh1.
81.
41.
643
.814
.731
.059
.047
.453
.310
.Ka
rnat
aka
2.0
4.1
2.8
30.7
19.9
26.5
59.8
38.8
49.4
11.
Jam
mu
& Ka
shm
ir3.
17.
14.
346
.929
.341
.846
.320
.834
.212
.Jh
arkh
and
2.7
4.8
3.5
27.5
12.1
21.4
50.8
35.0
43.0
13.
Kera
la2.
03.
42.
472
.169
.371
.353
.620
.236
.314
.M
adhy
a Pr
ades
h1.
93.
12.
414
.68.
112
.054
.339
.347
.015
.M
ahar
asht
ra1.
72.
11.
922
.09.
316
.756
.742
.549
.816
.M
anip
ur2.
612
.46.
838
.624
.432
.452
.441
.246
.917
.M
egha
laya
1.5
2.5
1.9
31.7
23.8
28.4
47.0
35.0
41.0
18.
Mizo
ram
0.9
1.2
1.0
18.2
11.3
15.3
53.9
41.9
48.0
19.
Naga
land
1.6
2.7
2.1
29.4
14.9
22.6
55.7
52.3
54.0
(Con
td...)

62 Rural Development Statistics
S. N
o.St
ate/
UTPe
rcen
tage
to T
otal
Wor
kers
(Mai
n +
Mar
gina
l)To
tal W
orke
rs (M
ain
+ M
argi
nal)
Hous
ehol
d In
dust
ry W
orke
rsO
ther
Wor
kers
Mal
eFe
mal
ePe
rson
sM
ale
Fem
ale
Pers
ons
Mal
eFe
mal
ePe
rson
s(1
)(2
)(9
)(1
0)(1
1)(1
2)(1
3)(1
4)(1
5)(1
6)(1
7)20
.O
dish
a3.
56.
04.
428
.917
.825
.156
.529
.743
.221
.Pu
njab
2.7
8.3
3.8
40.9
49.6
42.5
54.9
14.3
35.6
22.
Raja
stha
n1.
81.
91.
830
.215
.824
.051
.742
.747
.323
.Si
kkim
1.5
2.0
1.7
47.8
28.7
40.3
61.0
44.6
53.3
24.
Tam
il Nad
u2.
65.
43.
738
.220
.631
.160
.041
.250
.725
.Tr
ipur
a1.
75.
83.
043
.236
.441
.055
.326
.341
.126
.Ut
tara
khan
d2.
43.
02.
740
.715
.130
.449
.132
.941
.027
.Ut
tar P
rade
sh3.
98.
85.
223
.121
.922
.847
.418
.333
.428
.W
est B
enga
l3.
616
.36.
733
.128
.231
.957
.219
.438
.729
.A
& N
Isla
nds
2.6
6.6
3.5
76.0
69.0
74.5
59.1
17.9
39.8
30.
Chan
diga
rh0.
72.
30.
994
.391
.994
.062
.214
.242
.631
.D
& N
Have
li1.
41.
91.
659
.823
.747
.656
.833
.445
.932
.Da
man
& D
iu0.
65.
01.
493
.470
.989
.158
.215
.938
.633
.De
lhi
2.1
4.9
2.5
82.0
71.6
80.5
49.3
9.7
31.1
34.
Laks
hadw
eep
0.7
7.7
2.0
99.3
92.3
98.0
52.3
12.6
32.9
35.
Pudu
cher
ry1.
33.
11.
858
.238
.952
.754
.221
.137
.4Al
l Ind
ia2.
65.
03.
427
.817
.724
.353
.030
.041
.8
Sour
ce :
www.
cens
usin
dia.
gov.i
n.
Tabl
e 2.
16 (b
): (C
ontd
...)

Socio-Economic Characteristics 63
Table 2.16 (c): Distribution of Rural Workers by Occupation, Sex and State-wise – 2001(%)
S.No. State/UTPercentage to Total Workers (Main and Marginal) Cultivators Agri. Labourers
Male Female Persons Male Female Persons(1) (2) (3) (4) (5) (6) (7) (8)1. Andhra Pradesh 31.8 21.9 27.6 37.9 60.7 47.52. Arunachal Pradesh 57.7 82.7 68.3 4.0 4.6 4.33. Assam 44.4 42.9 43.9 14.1 17.4 15.14. Bihar 34.3 23.0 31.2 46.1 64.6 51.35. Chhattisgarh 54.3 46.8 50.8 27.1 46.3 36.06. Goa 12.5 24.8 16.5 7.4 19.9 11.57. Gujarat 43.0 31.2 38.3 26.7 44.0 33.68. Haryana 44.6 48.6 46.1 16.6 22.9 18.99. Himachal Pradesh 55.2 88.5 70.4 3.6 2.9 3.3
10. Karnataka 45.9 29.0 39.1 23.7 50.4 34.411. Jammu & Kashimir 51.5 60.4 54.4 9.3 5.4 8.012. Jharkhand 45.2 45.0 45.1 27.6 41.5 32.913. Kerala 10.1 5.5 8.9 17.6 26.2 19.714. Madhya Pradesh 54.8 46.6 51.4 27.4 43.5 34.115. Maharashtra 42.5 40.7 41.7 30.3 48.2 38.416. Manipur 53.9 53.0 53.5 9.4 14.6 11.817. Meghalaya 52.4 57.2 54.5 18.6 22.2 20.218. Mizoram 73.0 83.4 77.8 3.4 4.5 3.919. Nagaland 67.4 79.5 72.9 4.4 4.5 4.520. Odisha 39.6 20.5 33.2 30.2 56.9 39.121. Punjab 37.6 15.4 31.5 22.5 20.8 22.022. Rajasthan 60.9 70.5 65.0 8.7 17.1 12.323. Sikkim 47.6 66.9 55.0 5.8 9.1 7.124. Tamil Nadu 29.1 23.7 26.9 35.3 54.3 43.125. Tripura 31.8 30.5 31.4 23.4 38.6 28.026. Uttarakhand 46.7 82.3 61.7 12.3 6.2 9.727. Uttar Pradesh 52.6 36.8 48.4 24.1 43.9 29.328. West Bengal 28.7 16.1 25.4 31.0 38.6 33.029. A & N Islands 20.1 30.9 22.5 5.3 5.4 5.330. Chandigarh 2.5 1.8 2.4 0.7 0.6 0.631. D & N Haveli 30.7 58.6 41.4 9.2 25.7 15.532. Daman & Diu 4.1 26.0 7.2 0.7 12.8 2.433. Delhi 6.9 17.5 8.4 2.3 5.7 2.834. Lakshadweep 0.0 0.0 0.0 0.0 0.0 0.035. Paducherry 8.8 2.5 6.9 38.4 67.7 47.2
All India 42.2 36.5 40.1 27.5 43.4 33.2 (Contd…)

64 Rural Development Statistics
Tabl
e 2.
16 (c
) (Co
ntd.
.): D
istri
butio
n of
Rur
al W
orke
rs b
y O
ccup
atio
n, S
ex a
nd S
tate
-wis
e –
2001
(%)
S.No
.St
ate/
UT
Perc
enta
ge to
Tot
al W
orke
rs (M
ain
+ M
argi
nal)
Tota
l Wor
kers
(Mai
n +
Mar
gina
l)
Hous
ehol
d In
dust
ry W
orke
rsO
ther
Wor
kers
Mal
eFe
mal
ePe
rson
s
Mal
eFe
mal
ePe
rson
sM
ale
Fem
ale
Pers
ons
(1)
(2)
(9)
(10)
(11)
(12)
(13)
(14)
(15)
(16)
(17)
1.An
dhra
Pra
desh
3.0
6.0
4.3
27.3
11.4
20.6
58.5
43.2
50.9
2.Ar
unac
hal P
rade
sh0.
60.
90.
737
.711
.726
.751
.141
.346
.5
3.As
sam
1.7
7.9
3.5
39.8
31.7
37.4
49.8
22.3
36.4
4.Bi
har
2.9
5.6
3.7
16.7
6.8
13.9
48.4
20.2
34.8
5.Ch
hatti
sgar
h2.
11.
61.
816
.65.
311
.454
.346
.650
.4
6.G
oa2.
63.
93.
077
.451
.469
.054
.926
.440
.7
7.G
ujar
at1.
61.
41.
628
.723
.426
.655
.639
.047
.6
8.Ha
ryan
a1.
82.
52.
136
.926
.032
.950
.934
.243
.1
9.Hi
mac
hal P
rade
sh2.
01.
41.
739
.27.
224
.654
.746
.550
.6
10.
Karn
atak
a2.
35.
03.
428
.115
.623
.158
.339
.949
.2
11.
Jam
mu
& Ka
shim
ir4.
59.
46.
134
.724
.831
.549
.125
.837
.9
12.
Jhar
khan
d3.
75.
44.
423
.58.
117
.749
.931
.941
.1
13.
Kera
la2.
27.
13.
470
.261
.167
.950
.215
.932
.6
14.
Mad
hya
Prad
esh
2.7
4.1
3.3
15.0
5.8
11.2
53.1
40.7
47.1
15.
Mah
aras
htra
2.0
2.2
2.1
25.2
8.8
17.8
54.2
46.5
50.4
16.
Man
ipur
2.9
14.6
8.2
33.9
17.7
26.6
50.1
43.2
46.7
17.
Meg
hala
ya1.
52.
62.
027
.518
.023
.450
.138
.944
.6
18.
Mizo
ram
0.8
0.9
0.8
22.7
11.2
17.4
59.5
54.7
57.2
(Con
td…
)

Socio-Economic Characteristics 65
S.No
.St
ate/
UT
Perc
enta
ge to
Tot
al W
orke
rs (M
ain
+ M
argi
nal)
Tota
l Wor
kers
(Mai
n +
Mar
gina
l)
Hous
ehol
d In
dust
ry W
orke
rsO
ther
Wor
kers
Mal
eFe
mal
ePe
rson
s
Mal
eFe
mal
ePe
rson
sM
ale
Fem
ale
Pers
ons
(1)
(2)
(9)
(10)
(11)
(12)
(13)
(14)
(15)
(16)
(17)
19.
Naga
land
1.2
2.9
2.0
27.0
13.1
20.6
47.1
42.9
45.1
20.
Odi
sha
3.3
8.5
5.0
26.9
14.1
22.6
53.4
27.1
40.3
21.
Punj
ab1.
86.
73.
138
.257
.143
.454
.523
.239
.7
22.
Raja
stha
n2.
22.
02.
128
.110
.520
.650
.840
.745
.9
23.
Sikk
im1.
51.
01.
345
.223
.036
.757
.740
.749
.7
24.
Tam
il Nad
u3.
16.
84.
632
.515
.225
.459
.441
.350
.4
25.
Trip
ura
1.7
6.3
3.1
43.1
24.6
37.5
50.6
22.9
37.1
26.
Utta
rakh
and
2.1
2.1
2.1
38.8
9.4
26.4
46.0
33.3
39.6
27.
Utta
r Pra
desh
3.7
6.9
4.5
19.7
12.4
17.7
47.8
18.9
34.1
28.
Wes
t Ben
gal
4.0
18.2
7.8
36.2
27.2
33.8
54.3
20.7
37.9
29.
A &
N Is
land
s5.
811
.37.
068
.852
.565
.257
.018
.539
.2
30.
Chan
diga
rh1.
27.
41.
895
.790
.295
.264
.010
.343
.4
31.
D &
N Ha
veli
0.7
0.8
0.7
59.4
14.9
42.3
61.3
45.1
53.9
32.
Dam
an &
Diu
0.4
4.9
1.0
94.8
56.4
89.4
70.9
19.8
52.0
33.
Delh
i1.
94.
72.
389
.072
.186
.649
.710
.132
.0
34.
Laks
hadw
eep
4.0
15.8
5.5
96.0
84.2
94.5
40.7
6.1
23.8
35.
Padu
cher
ry1.
22.
71.
651
.727
.144
.354
.523
.839
.2
All I
ndia
2.8
5.4
3.8
27.5
14.7
22.9
52.4
31.0
42.0
Sour
ce: G
O I,
Pro
visio
nal P
opul
atio
n To
tals,
Pap
er-3
of 2
001,
Dist
ribut
ion
of W
orke
rs a
nd N
on-W
orke
rs, S
erie
s-4,
Punj
ab, C
ensu
s of
Indi
a 20
01.
Tabl
e 2.
16 (c
) (Co
ntd.
.)

66 Rural Development Statistics
Table 2.17: Labour Force Participation Rates According to Usual Status (PS & PS+SS) (July 2011- June 2012)
(%) (Rural)
S. No. State/UTPS PS +SS
Male Female Persons Male Female Persons1. Andhra Pradesh 61.0 41.1 50.8 61.2 44.8 52.82. Arunachal Pradesh 49.1 27.8 38.7 49.2 28.2 38.93. Assam 56.2 8.9 33.9 56.4 12.9 35.94. Bihar 48.2 3.7 27.2 48.7 5.8 28.45. Chhattisgarh 55.9 35.8 46.0 56.3 41.6 49.06. Delhi 54.4 14.6 37.1 54.4 14.6 37.17. Goa 58.6 21.2 39.9 58.6 21.2 39.98. Gujarat 60.1 21.2 41.6 60.2 27.9 44.89. Haryana 52.9 6.5 31.8 53.2 16.4 36.5
10. Himachal Pradesh 54.0 47.1 50.5 54.7 52.9 53.811. Jammu & Kashmir 53.9 5.0 30.2 55.9 26.3 41.512. Jharkhand 52.9 10.1 32.1 54.2 20.4 37.813. Karnataka 61.9 27.6 44.8 62.0 28.9 45.414. Kerala 56.5 20.8 37.5 58.3 25.8 41.015. Madhya Pradesh 56.1 18.7 38.1 56.4 23.9 40.716. Maharashtra 57.5 30.7 44.7 58.2 38.9 49.017. Manipur 51.6 16.2 34.4 52.3 27.0 40.018. Meghalaya 52.1 37.7 44.9 52.9 39.2 46.119. Mizoram 59.7 35.4 48.0 59.9 40.5 50.520. Nagaland 58.1 26.0 42.4 59.0 37.1 48.321. Odisha 60.3 14.3 37.1 60.6 25.1 42.722. Punjab 57.5 5.2 32.3 57.9 23.7 41.423. Rajasthan 49.5 23.7 37.0 50.0 34.9 42.724. Sikkim 58.6 48.8 53.8 58.6 49.2 53.925. Tamil Nadu 60.4 31.3 45.6 60.7 38.6 49.526. Tripura 59.0 17.8 39.3 59.9 28.7 44.927. Uttarakhand 45.4 21.9 33.7 46.5 31.5 39.028. Uttar Pradesh 48.3 8.8 29.0 49.6 17.8 34.129. West Bengal 59.4 11.2 35.6 60.2 19.4 40.0
UTs30. A & N Islands 60.3 24.8 43.1 60.3 30.0 45.731. Chandigarh 56.7 4.2 34.7 56.7 4.7 34.932. Dadra & Nagar Haveli 48.8 15.2 32.1 48.8 16.1 32.533. Daman & Diu 69.4 3.4 42.5 69.4 3.4 42.534. Lakshadweep 59.6 14.5 36.6 59.8 17.7 38.335. Puducherry 52.1 20.9 35.9 52.1 22.3 36.6
All-India 54.7 18.1 36.8 55.3 25.3 40.6Source : GOI, NSSO, Key Indicators of Employment & Unemployment Situation in India 2011-12, 68th Round, July 2011 – June 2012.

Socio-Economic Characteristics 67
Table 2.17 (a): Labour Force Participation Rates of Persons of Age 15-59 Years According toUsual Status (PS & PS+SS) (July 2011- June 2012)
(%) (Rural)
S. No. State/UTPS PS +SS
Male Female Persons Male Female Persons1. Andhra Pradesh 84.0 57.7 70.5 84.3 62.5 73.12. Arunachal Pradesh 74.3 42.4 58.6 74.4 43.1 59.03. Assam 85.5 13.2 50.4 85.7 18.9 53.24. Bihar 78.9 5.6 43.8 79.6 9.1 45.85. Chhattisgarh 84.6 56.0 70.3 85.0 65.2 75.16. Delhi 82.8 16.8 53.7 82.8 16.8 53.77. Goa 82.9 29.4 56.4 82.9 29.4 56.48. Gujarat 87.6 30.6 60.2 87.7 40.4 64.99. Haryana 78.3 9.1 45.9 78.7 23.8 53.0
10. Himachal Pradesh 78.0 62.8 70.1 78.7 70.2 74.311. Jammu & Kashmir 75.3 7.7 42.8 77.9 38.8 59.112. Jharkhand 85.4 15.6 50.7 86.6 31.8 59.413. Karnataka 84.4 39.0 62.1 84.5 40.8 63.014. Kerala 81.7 29.9 53.6 82.6 36.5 57.615. Madhya Pradesh 84.2 29.4 58.0 84.7 38.0 62.416. Maharashtra 81.0 44.4 63.5 81.9 56.7 69.817. Manipur 76.8 23.1 50.6 77.7 40.0 59.318. Meghalaya 79.9 59.7 69.9 81.2 62.2 71.819. Mizoram 89.5 54.3 72.5 89.7 62.4 76.520. Nagaland 80.9 33.6 56.9 81.6 47.9 64.521. Odisha 90.1 21.4 54.7 90.4 36.9 62.922. Punjab 82.6 7.1 45.8 83.1 33.4 58.823. Rajasthan 78.4 36.4 57.5 79.0 53.2 66.224. Sikkim 82.7 70.1 76.5 82.7 70.6 76.825. Tamil Nadu 84.8 43.3 63.4 85.1 53.1 68.626. Tripura 86.6 25.5 56.2 87.4 40.2 64.027. Uttarakhand 74.3 33.7 53.1 75.4 48.3 61.228. Uttar Pradesh 80.4 13.9 47.1 82.5 28.4 55.429. West Bengal 86.9 16.2 51.8 88.0 28.6 58.5
UTs30. A & N Islands 85.2 33.8 59.1 85.2 40.8 62.731. Chandigarh 91.6 6.7 55.6 91.6 7.6 56.032. Dadra & Nagar Haveli 72.9 23.6 48.6 72.9 25.0 49.333. Daman & Diu 94.7 5.3 60.6 94.7 5.3 60.634. Lakshadweep 88.0 22.7 55.6 88.3 27.7 58.235. Puducherry 76.2 27.1 50.0 76.2 29.1 51.0
All-India 82.7 27.1 55.1 83.5 37.8 60.9Source : GOI, NSSO, Key indicators of Employment & Unemployment Situation in India 2011-12, 68th Round, July 2011 – June 2012.

68 Rural Development Statistics
Table 2.18: Labour Force Participation Rates According to Current Weekly Status and Current Daily Status (July 2011- June 2012)
(%) (Rural)
S. No. State/UTCurrent Weekly Status Current Daily Status
Male Female Persons Male Female Persons1. Andhra Pradesh 60.1 40.3 50.0 58.4 37.5 47.72. Arunachal Pradesh 49.0 27.6 38.5 48.6 27.2 38.23. Assam 56.3 11.3 35.1 55.7 9.1 33.74. Bihar 48.6 4.7 27.9 48.1 3.9 27.35. Chhattisgarh 55.4 33.7 44.7 53.6 30.1 41.96. Delhi 54.4 14.6 37.1 54.4 14.6 37.17. Goa 58.6 20.1 39.3 58.6 20.0 39.38. Gujarat 60.0 26.4 44.0 59.7 21.7 41.69. Haryana 53.0 14.5 35.5 52.7 10.1 33.3
10. Himachal Pradesh 53.9 49.0 51.4 53.5 44.3 48.811. Jammu & Kashmir 54.5 19.4 37.4 54.0 11.9 33.612. Jharkhand 54.0 15.9 35.4 52.4 11.6 32.513. Karnataka 61.7 28.0 44.9 60.1 25.4 42.714. Kerala 56.1 22.6 38.2 52.7 20.0 35.315. Madhya Pradesh 55.7 18.9 38.0 55.1 16.6 36.516. Maharashtra 57.2 34.3 46.3 56.4 29.6 43.717. Manipur 52.0 22.8 37.8 51.1 18.4 35.218. Meghalaya 52.7 38.3 45.5 49.1 33.2 41.119. Mizoram 59.7 38.6 49.5 58.6 35.1 47.220. Nagaland 57.0 32.0 44.7 55.3 26.0 41.021. Odisha 59.0 17.3 38.0 57.5 13.4 35.222. Punjab 57.2 22.2 40.4 56.5 13.8 35.923. Rajasthan 48.9 26.8 38.2 48.4 22.8 36.024. Sikkim 58.6 48.6 53.7 58.6 48.1 53.425. Tamil Nadu 60.0 34.2 46.9 58.4 30.4 44.226. Tripura 59.6 20.1 40.7 58.9 19.2 39.927. Uttarakhand 45.8 26.3 36.1 45.1 18.7 32.028. Uttar Pradesh 48.3 13.8 31.5 47.2 10.2 29.229. West Bengal 59.1 17.3 38.4 57.3 13.2 35.5
UTs30. A & N Islands 60.3 25.0 43.2 60.0 24.9 43.031. Chandigarh 56.5 4.7 34.8 56.5 4.3 34.632. Dadra & Nagar Haveli 48.8 15.2 32.1 48.7 15.2 32.033. Daman & Diu 69.4 3.4 42.5 69.4 3.4 42.534. Lakshadweep 59.8 14.8 36.8 55.8 14.2 34.635. Puducherry 49.2 22.3 35.2 48.2 20.5 33.8
All-India 54.5 21.5 38.3 53.4 18.0 36.1Source : GOI, NSSO, Key Indicators of Employment & Unemployment Situation in India 2011-12, 68th Round, July 2011 – June 2012.

Socio-Economic Characteristics 69
C. E
MPL
OYM
ENT
Tabl
e 2.
19: N
umbe
r of P
erso
ns E
mpl
oyed
Acc
ordi
ng to
Usu
al S
tatu
s, C
urre
nt W
eekl
y St
atus
and
Cur
rent
Dai
ly S
tatu
s - R
ural
Indi
a (p
er 1
000
mal
es /
fem
ales
)
NSS
Roun
ds
Mal
eFe
mal
eUs
ual s
tatu
sCu
rren
t Wee
kly
Stat
us (P
er 1
000
Pers
on W
eeks
)
Curr
ent D
aily
St
atus
(Per
100
0 Pe
rson
days
)
Usua
l Sta
tus
Curr
ent W
eekl
y St
atus
(Per
100
0 Pe
rson
Wee
ks)
Curr
ent D
aily
St
atus
(Per
100
0 Pe
rson
days
) Ps
All (
ps +
ss)
psAl
l (ps
+ss
)
68th
(201
1-12
)53
554
352
650
417
624
820
716
966
th (2
009-
10)
537
547
531
501
202
261
223
182
64th
(200
7-08
)53
854
852
549
021
628
923
718
762
nd (2
005-
06)
537
549
524
491
224
310
257
203
61st
(200
4 –
05)
535
546
524
488
242
327
275
216
55th
(199
9 –
2000
)52
253
151
047
823
129
925
320
450
th (1
993
– 19
94)
538
553
531
504
234
328
267
219
43rd
(198
7 –
1988
)51
753
950
450
124
532
322
020
738
th (1
983)
528
547
511
482
248
340
227
198
PS :
Prin
cipal
Sta
tus
PS+S
S : P
rincip
al a
nd S
ubsid
iary
Sta
tus.
Sour
ce: G
OI,
NSSO
, Key
Indi
cato
rs o
f Em
ploy
men
t & U
nem
ploy
men
t Situ
atio
n in
Indi
a 20
11-1
2, 6
8th R
ound
, Jul
y 20
11 –
Jun
e 20
12.
Tabl
e 2.
19 (b
): W
orke
r Pop
ulat
ion
Ratio
bas
ed o
n UP
S an
d UP
SS a
ppro
ach
for p
erso
ns a
ges
15 y
ears
and
abo
ve (2
015-
16)
All-
Indi
a (%
)
Appr
oach
Rura
lUr
ban
Tota
l
Mal
eFe
mal
eTo
tal
Mal
eFe
mal
eTo
tal
Mal
eFe
mal
eTo
tal
UPS
74.1
24.6
50.0
66.8
14.3
36.9
72.1
21.7
45.9
UPSS
75.7
30.2
51.9
67.1
14.8
36.9
73.3
25.8
47.2
Sour
ce: L
abou
r Bur
earu
, Mini
stry o
f Lab
our &
Em
ploym
ent,
Repo
rt on
Fifth
Ann
ual E
mplo
ymen
t – U
nem
ploym
ent S
urve
y, 20
15-1
6
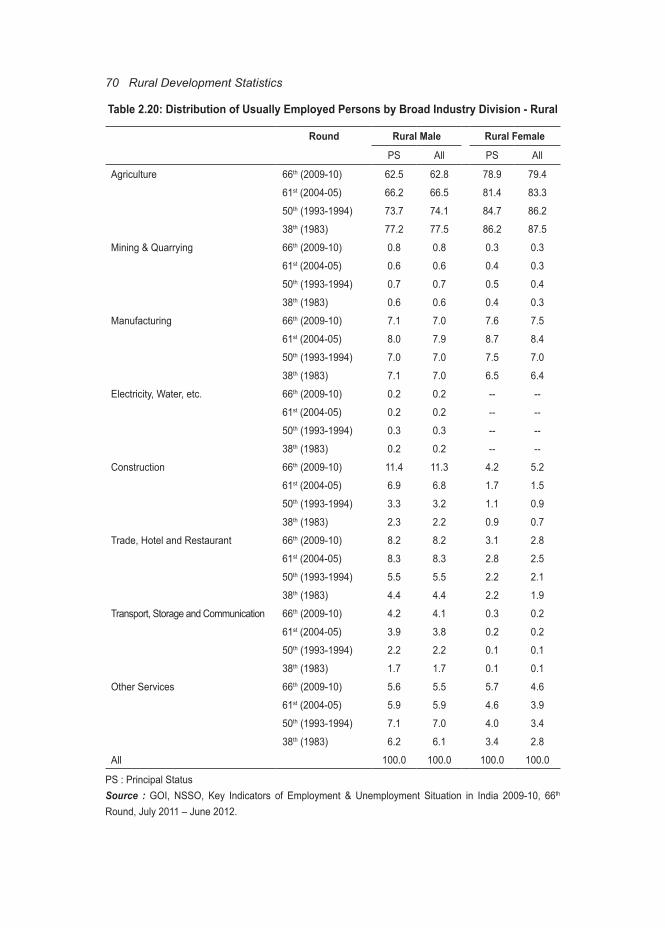
70 Rural Development Statistics
Table 2.20: Distribution of Usually Employed Persons by Broad Industry Division - Rural
Round Rural Male Rural Female
PS All PS All
Agriculture 66th (2009-10) 62.5 62.8 78.9 79.4
61st (2004-05) 66.2 66.5 81.4 83.3
50th (1993-1994) 73.7 74.1 84.7 86.2
38th (1983) 77.2 77.5 86.2 87.5
Mining & Quarrying 66th (2009-10) 0.8 0.8 0.3 0.3
61st (2004-05) 0.6 0.6 0.4 0.3
50th (1993-1994) 0.7 0.7 0.5 0.4
38th (1983) 0.6 0.6 0.4 0.3
Manufacturing 66th (2009-10) 7.1 7.0 7.6 7.5
61st (2004-05) 8.0 7.9 8.7 8.4
50th (1993-1994) 7.0 7.0 7.5 7.0
38th (1983) 7.1 7.0 6.5 6.4
Electricity, Water, etc. 66th (2009-10) 0.2 0.2 -- --
61st (2004-05) 0.2 0.2 -- --
50th (1993-1994) 0.3 0.3 -- --
38th (1983) 0.2 0.2 -- --
Construction 66th (2009-10) 11.4 11.3 4.2 5.2
61st (2004-05) 6.9 6.8 1.7 1.5
50th (1993-1994) 3.3 3.2 1.1 0.9
38th (1983) 2.3 2.2 0.9 0.7
Trade, Hotel and Restaurant 66th (2009-10) 8.2 8.2 3.1 2.8
61st (2004-05) 8.3 8.3 2.8 2.5
50th (1993-1994) 5.5 5.5 2.2 2.1
38th (1983) 4.4 4.4 2.2 1.9
Transport, Storage and Communication 66th (2009-10) 4.2 4.1 0.3 0.2
61st (2004-05) 3.9 3.8 0.2 0.2
50th (1993-1994) 2.2 2.2 0.1 0.1
38th (1983) 1.7 1.7 0.1 0.1
Other Services 66th (2009-10) 5.6 5.5 5.7 4.6
61st (2004-05) 5.9 5.9 4.6 3.9
50th (1993-1994) 7.1 7.0 4.0 3.4
38th (1983) 6.2 6.1 3.4 2.8
All 100.0 100.0 100.0 100.0
PS : Principal Status Source : GOI, NSSO, Key Indicators of Employment & Unemployment Situation in India 2009-10, 66th Round, July 2011 – June 2012.

Socio-Economic Characteristics 71
Table 2.21 (a): Distribution of the Usually Employed by Status of Employment – Males Rural India
(Per thousand persons)
RoundPrincipal Status (PS) All (PS+SS)
Self -employed
Regular Employees
Casual Labour
Self -employed
Regular Employees
Casual Labour
68th (2011-12) - - - 545 100 355
66th (2009-10) 530 87 383 535 85 380
64th (2007-08) 549 93 359 554 91 355
62nd (2005-06) 561 102 337 567 100 333
61st (2004-05) 576 91 333 581 90 329
55th (1999 – 2000) 544 90 366 550 88 362
50th (1993-1994) 567 87 346 577 85 338
43rd (1987 – 1988) 575 104 321 586 100 314
38th (1983) 595 106 299 605 103 292
PS: Principal Status SS: Subsidiary Status.Source : GOI, NSSO, Key Indicators of Employment & Unemployment Situation in India 2011-12, 68th Round, July 2011 – June 2012.
Table 2.21 (b): Distribution of the Usually Employed by Status of Employment – Females Rural India
(Per thousand persons)
RoundPrincipal Status (PS) All (PS+SS)
Self - employed
Regular Employees
Casual Labour
Self -employed
Regular Employees
Casual Labour
68th (2011-12) - - - 593 56 351
66th (2009-10) 503 55 442 557 44 399
64th (2007-08) 508 53 439 583 41 376
62nd (2005-06) 544 53 403 622 39 339
61st (2004-05) 564 48 389 637 37 326
55th (1999 – 2000) 500 39 461 573 31 396
50th (1993-1994) 513 34 453 586 27 387
43rd (1987 – 1988) 549 49 402 608 37 355
38th (1983) 541 37 422 619 28 353
PS: Principal Status SS: Subsidiary Status.Source : GOI, NSSO, Key Indicators of Employment & Unemployment Situation in India 2011-12, 68th Round, July 2011 – June 2012.

72 Rural Development Statistics
Tabl
e 2.
22: D
istri
butio
n of
Usu
ally
Em
ploy
ed b
y Ca
tego
ry o
f Em
ploy
men
t - R
ural
Mal
es a
nd F
emal
es
(Jul
y 20
11 –
Jun
e 20
12) (
Prin
cipa
l and
Sub
sidi
ary
Stat
us)
(%)
S. No.
Stat
e
Mal
esFe
mal
esPe
rson
s
Self-
em
ploy
ed
Regu
lar /
Wag
e Sa
larie
ds
Empl
oyee
s
Casu
al
Labo
urSe
lf-
empl
oyed
Regu
lar /
Wag
e Sa
larie
ds
Empl
oyee
s
Casu
al
Labo
urSe
lf-
empl
oyed
Regu
lar /
Wag
e Sa
larie
d Em
ploy
ees
Casu
al
Labo
ur
1.An
dhra
Pra
desh
48.4
11.8
39.8
44.7
3.2
52.1
46.8
8.0
45.2
2.Ar
unac
hal P
rade
sh78
.015
.46.
789
.55.
64.
882
.111
.96.
03.
Assa
m
71.1
10.4
18.5
64.3
17.5
18.2
69.9
11.6
18.5
4.Bi
har
52.9
3.9
43.2
41.7
6.6
51.7
51.8
4.1
44.0
5.Ch
hatti
sgar
h58
.05.
736
.358
.22.
039
.858
.14.
137
.86.
Delh
i23
.875
.30.
9-
99.7
0.3
19.4
79.8
0.8
7.G
oa31
.458
.110
.520
.248
.930
.828
.355
.516
.28.
Guj
arat
56.5
12.4
31.1
58.3
5.2
36.5
57.1
10.3
32.7
9.Ha
ryan
a58
.216
.525
.375
.24.
220
.661
.713
.924
.310
.Hi
mac
hal P
rade
sh54
.722
.123
.287
.96.
06.
171
.214
.114
.711
.Ja
mm
u &
Kash
mir
51.0
19.5
29.4
90.3
5.7
3.9
63.1
15.3
21.6
12.
Jhar
khan
d63
.64.
731
.682
.82.
614
.568
.64.
227
.213
.Ka
rnat
aka
53.0
13.4
33.6
49.6
8.2
42.1
51.9
11.8
36.3
14.
Kera
la38
.915
.545
.636
.423
.040
.538
.117
.844
.015
.M
adhy
a Pr
ades
h61
.05.
833
.257
.62.
739
.760
.04.
935
.116
.M
ahar
asht
ra53
.812
.333
.953
.53.
143
.353
.78.
837
.517
.M
anip
ur73
.115
.711
.250
.34.
645
.165
.612
.122
.318
.M
egha
laya
67.6
11.4
21.0
75.6
8.9
15.6
71.0
10.3
18.7
19.
Mizo
ram
83.2
12.5
4.3
81.3
4.3
14.4
82.4
9.4
8.2
(Con
td...
)
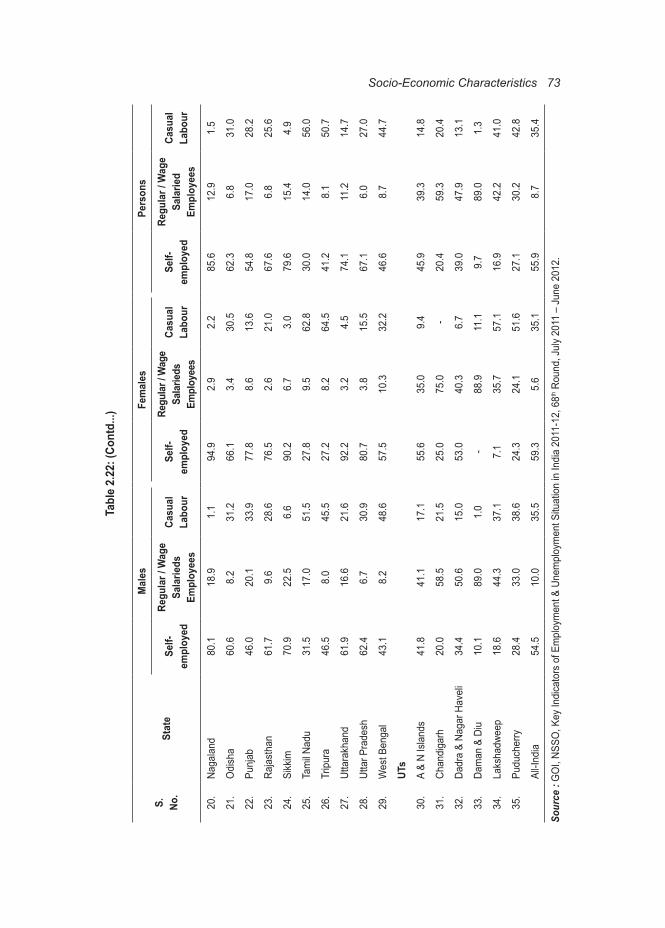
Socio-Economic Characteristics 73
Tabl
e 2.
22: (
Cont
d...)
S. No.
Stat
e
Mal
esFe
mal
esPe
rson
s
Self-
em
ploy
ed
Regu
lar /
Wag
e Sa
larie
ds
Empl
oyee
s
Casu
al
Labo
urSe
lf-
empl
oyed
Regu
lar /
Wag
e Sa
larie
ds
Empl
oyee
s
Casu
al
Labo
urSe
lf-
empl
oyed
Regu
lar /
Wag
e Sa
larie
d Em
ploy
ees
Casu
al
Labo
ur
20.
Naga
land
80.1
18.9
1.1
94.9
2.9
2.2
85.6
12.9
1.5
21.
Odi
sha
60.6
8.2
31.2
66.1
3.4
30.5
62.3
6.8
31.0
22.
Punj
ab46
.020
.133
.977
.88.
613
.654
.817
.028
.2
23.
Raja
stha
n61
.79.
628
.676
.52.
621
.067
.66.
825
.6
24.
Sikk
im
70.9
22.5
6.6
90.2
6.7
3.0
79.6
15.4
4.9
25.
Tam
il Nad
u 31
.517
.051
.527
.89.
562
.830
.014
.056
.0
26.
Trip
ura
46.5
8.0
45.5
27.2
8.2
64.5
41.2
8.1
50.7
27.
Utta
rakh
and
61.9
16.6
21.6
92.2
3.2
4.5
74.1
11.2
14.7
28.
Utta
r Pra
desh
62.4
6.7
30.9
80.7
3.8
15.5
67.1
6.0
27.0
29.
Wes
t Ben
gal
43.1
8.2
48.6
57.5
10.3
32.2
46.6
8.7
44.7
UTs
30.
A &
N Is
land
s41
.841
.117
.155
.635
.09.
445
.939
.314
.8
31.
Chan
diga
rh
20.0
58.5
21.5
25.0
75.0
-20
.459
.320
.4
32.
Dadr
a &
Naga
r Hav
eli
34.4
50.6
15.0
53.0
40.3
6.7
39.0
47.9
13.1
33.
Dam
an &
Diu
10.1
89.0
1.0
-88
.911
.19.
789
.01.
3
34.
Laks
hadw
eep
18.6
44.3
37.1
7.1
35.7
57.1
16.9
42.2
41.0
35.
Pudu
cher
ry28
.433
.038
.624
.324
.151
.627
.130
.242
.8
All-I
ndia
54.5
10.0
35.5
59.3
5.6
35.1
55.9
8.7
35.4
Sour
ce :
GO
I, NS
SO, K
ey In
dica
tors
of E
mpl
oym
ent &
Une
mpl
oym
ent S
ituat
ion
in In
dia
2011
-12,
68th
Rou
nd, J
uly
2011
– J
une
2012
.

74 Rural Development Statistics
Table 2.23: Distribution of Usually Rural Employed in the Principal Status (PS) and Principal as well as Subsidiary Status (July 2011 – June 2012)
(%)
S.No. State
Male Female PersonsPS
WorkersAll
WorkersPS
WorkersAll
WorkersPS
WorkersAll
Workers1. Andhra Pradesh 59.9 60.2 40.6 44.5 50.0 52.22. Arunachal Pradesh 48.2 48.3 27.3 27.8 38.0 38.33. Assam 53.7 54.0 8.1 12.2 32.2 34.34. Bihar 46.8 47.3 3.2 5.3 26.3 27.55. Chhattisgarh 54.9 55.7 35.7 41.5 45.4 48.66. Delhi 49.3 49.3 14.6 14.6 34.2 34.27. Goa 54.7 54.7 21.0 21.0 37.8 37.88. Gujarat 59.8 59.9 21.2 27.8 41.4 44.79. Haryana 51.5 51.8 6.2 16.2 30.9 35.6
10. Himachal Pradesh 53.0 54.1 46.2 52.4 49.6 53.311. Jammu & Kashmir 52.5 54.7 4.2 25.5 29.0 40.512. Jharkhand 52.0 53.3 9.5 19.8 31.3 37.013. Karnataka 61.1 61.2 27.4 28.7 44.3 45.014. Kerala 54.3 56.5 16.1 22.1 33.9 38.215. Madhya Pradesh 55.8 56.1 18.7 23.9 37.9 40.516. Maharashtra 56.9 57.6 30.5 38.8 44.3 48.617. Manipur 49.8 51.0 15.4 26.2 33.1 38.918. Meghalaya 51.9 52.7 37.5 39.1 44.7 45.919. Mizoram 58.6 59.1 34.1 39.4 46.7 49.620. Nagaland 46.1 50.4 17.1 31.2 31.9 41.021. Odisha 58.6 59.2 13.8 24.6 36.0 41.722. Punjab 56.2 56.6 4.8 23.4 31.5 40.623. Rajasthan 48.9 49.5 23.5 34.7 36.6 42.424. Sikkim 58.0 58.0 48.3 48.7 53.2 53.425. Tamil Nadu 59.0 59.5 30.0 37.8 44.3 48.526. Tripura 55.2 56.2 12.0 22.8 34.5 40.227. Uttarakhand 43.9 45.2 20.8 30.8 32.4 38.128. Uttar Pradesh 47.4 49.1 8.7 17.7 28.6 33.829. West Bengal 57.2 58.6 10.7 18.9 34.2 39.0
UTs30. A & N Islands 58.7 59.2 19.9 26.1 39.9 43.231. Chandigarh 56.7 56.7 4.2 4.7 34.7 34.932. Dadra & Nagar Haveli 48.8 48.8 15.2 16.1 32.1 32.533. Daman & Diu 69.4 69.4 3.4 3.4 42.5 42.534. Lakshadweep 54.5 54.8 6.3 10.5 29.9 32.235. Puducherry 51.5 51.7 20.7 22.1 35.5 36.3
All-India 53.5 54.3 17.6 24.8 35.9 39.9
Source: GOI, NSSO, Key Indicators of Employment & Unemployment Situation in India 2011-12, 68th Round, July 2011 – June 2012.

Socio-Economic Characteristics 75
Table 2.24: Distribution of Usually Rural Employed in the Current Weekly Status (CWS) and Current Daily Status (CDS) (July 2011 – June 2012)
(%)
S.No. State
Males Females PersonsCWS CDS CWS CDS CWS CDS
1. Andhra Pradesh 58.5 55.5 38.9 35.4 48.4 45.22. Arunachal Pradesh 48.0 47.7 27.0 26.7 37.7 37.43. Assam 53.7 53.0 10.6 8.3 33.4 31.94. Bihar 46.9 46.1 4.3 3.4 26.8 25.95. Chhattisgarh 52.8 50.4 32.9 29.2 42.9 39.96. Delhi 48.9 48.9 14.6 14.6 33.9 33.97. Goa 54.7 54.3 20.0 19.8 37.3 37.18. Gujarat 59.5 58.1 26.3 20.8 43.7 40.49. Haryana 51.0 50.5 14.0 9.4 34.1 31.8
10. Himachal Pradesh 52.6 52.0 48.3 43.6 50.4 47.811. Jammu & Kashmir 52.8 51.4 18.2 10.5 36.0 31.512. Jharkhand 52.8 51.0 15.2 10.8 34.5 31.513. Karnataka 60.8 57.9 27.6 24.6 44.2 41.314. Kerala 52.7 46.2 18.0 14.5 34.2 29.315. Madhya Pradesh 54.7 53.1 18.8 16.3 37.4 35.316. Maharashtra 55.9 54.0 33.7 28.4 45.3 41.817. Manipur 50.6 49.6 22.0 17.6 36.7 34.018. Meghalaya 52.4 48.7 38.2 33.0 45.3 40.819. Mizoram 58.9 57.7 37.7 34.2 48.6 46.320. Nagaland 46.5 44.3 25.0 18.1 36.0 31.521. Odisha 56.0 52.5 16.3 12.2 36.0 32.222. Punjab 54.9 53.3 21.8 13.3 39.0 34.123. Rajasthan 47.3 46.3 26.6 22.5 37.3 34.824. Sikkim 57.1 56.9 48.1 47.6 52.7 52.325. Tamil Nadu 57.2 52.2 32.7 26.7 44.8 39.326. Tripura 55.6 51.7 14.2 12.9 35.7 33.127. Uttarakhand 44.5 42.7 25.6 17.9 35.1 30.328. Uttar Pradesh 46.7 44.5 13.6 9.9 30.5 27.729. West Bengal 56.3 52.7 16.2 12.0 36.5 32.6
UTs30. A & N Islands 58.6 58.2 19.8 19.6 39.8 39.531. Chandigarh 56.5 56.5 4.7 4.3 34.8 34.632. Dadra & Nagar Haveli 48.8 48.2 15.2 15.2 32.1 31.833. Daman & Diu 69.4 69.4 3.4 3.4 42.5 42.534. Lakshadweep 52.9 46.5 7.5 5.2 29.7 25.535. Puducherry 48.5 43.6 22.0 17.1 34.7 29.8
All-India 52.6 50.4 20.7 16.9 37.0 34.0
CWS : Current Weekly Status CDS : Current Daily StatusSource : GOI, NSSO, Key Indicators of Employment & Unemployment Situation in India 2011-12, 68th Round, July 2011 – June 2012.

76 Rural Development Statistics
D. UNEMPLOYMENTTable 2.25 (a): Rural Unemployment Rates* (July 2009- June 2010 & July 2011 – June 2012)
(Per thousand persons)
Status
Unemployment Rate
2009-10 2011-12
Male Female Persons Male Female Persons
Usual Status - PS 19 (11) 24 (5) 21 (8) 21 29 23
Usual Status (adjusted) 16 (9) 16 (4) 16 (7) 17 17 17
Current Weekly Status 32 (17) 37 (8) 33 (13) 33 35 34
Current Daily Status 64 (35) 80 (16) 68 (25) 55 62 57
* : According to Usual Status, Current Weekly Status (CWS) and Current Daily Status (CDS).Note: Figures within brackets indicate the proportion of unemployed per 1000 persons / person-weeks / persondays.
Source: GOI, NSSO, Key Indicators of Employment and Unemployment Situation in India 2011-12, 68th Round, July 2011 – June 2012.
Table 2.25 (b): Unemployment Rate based on UPS and UPSS approach for persons ages 15 years & above (2015-16)
All- India (%)
ApproachRural Urban Total
Male Female Total Male Female Total Male Female Total
UPS 4.2 7.8 2.1 3.3 12.1 10.3 4.0 8.7 4.3
UPSS 2.9 4.7 0.6 3.0 10.9 10.3 3.0 5.8 3.2
Source: Labour Burearu, Ministry of Labour & Employment, Report on Fifth Annual Employment – Unemployment Survey, 2015-16

Socio-Economic Characteristics 77
Table 2.26: Unemployment Rates (Rural Areas) in Different Years (Per thousand males / females)
NSS Round
Unemployment rate
Male Female
Usual Status
Usual Status
(Adjusted)
Current Weekly Status
Current Daily
Status
Usual Status
Usual Status
(Adjusted)
Current Weekly Status
Current Daily
Status
68th (2011-12)
21 17 33 55 29 17 35 62
66th (2009-10)
19 16 32 64 24 16 37 80
64th (2007-08)
23 19 41 85 19 11 35 81
62nd (2005-06)
25 20 43 83 22 12 33 75
61st (2004-05)
21 16 38 80 31 18 42 87
55th (1999-2000)
21 17 39 72 15 10 37 70
50th (1993-94)
20 14 31 56 13 9 29 56
43rd (1987-88)
28 18 42 46 35 24 44 67
38th (1983)
21 14 37 75 14 7 43 90
32nd (1977-78)
22 13 36 71 55 20 41 92
27th (1972-73)
-- 12 30 68 -- 5 55 112
Note: Unemployment rates are expressed in persons under usual status, person weeks under CWS and persondays under CDS.Source: GOI, NSSO, Key Indicators of Employment and Unemployment Situation in India 2011-12, 68th Round, July 2011 – June 2012.

78 Rural Development Statistics
Table 2.27: Rural Unemployment Rates According to Usual Status (PS) and Usual Status (PS+SS) in States and UTs (2011-12)
(%)
S.No. State/ UTUnemployment Rate
Usual Status (PS) Usual Status (PS+SS)Male Female Persons Male Female Persons
1. Andhra Pradesh 1.8 1.3 1.6 1.7 0.5 1.22. Arunachal Pradesh 1.9 1.7 1.8 1.7 1.6 1.73. Assam 4.4 9.2 5.0 4.3 5.7 4.54. Bihar 2.9 12.7 3.5 2.7 8.2 3.25. Chhattisgarh 1.7 0.3 1.2 1.1 0.3 0.86. Delhi 9.4 - 7.8 9.4 - 7.87. Goa 6.6 0.8 5.1 6.6 0.8 5.18. Gujarat 0.6 0.3 0.5 0.4 0.2 0.39. Haryana 2.6 4.2 2.8 2.6 1.7 2.4
10. Himachal Pradesh 1.8 1.8 1.8 1.1 0.8 1.011. Jammu & Kashmir 2.7 16.6 3.9 2.2 3.0 2.512. Jharkhand 1.9 6.2 2.5 1.8 2.8 2.113. Karnataka 1.3 0.5 1.0 1.2 0.4 0.914. Kerala 3.9 22.7 9.4 3.1 14.2 6.815. Madhya Pradesh 0.6 - 0.5 0.6 - 0.416. Maharashtra 1.1 0.4 0.9 0.9 0.3 0.717. Manipur 3.5 5.0 3.9 2.4 3.0 2.618. Meghalaya 0.5 0.4 0.5 0.4 0.4 0.419. Mizoram 1.9 3.7 2.6 1.3 2.7 1.820. Nagaland 20.7 34.2 24.7 14.6 15.9 15.121. Odisha 2.7 3.4 2.9 2.3 2.0 2.222. Punjab 2.3 6.1 2.6 2.2 1.3 1.923. Rajasthan 1.2 0.7 1.0 0.9 0.4 0.724. Sikkim 0.9 1.0 1.0 0.9 1.0 1.025. Tamil Nadu 2.3 4.2 3.0 2.1 1.9 2.026. Tripura 6.6 32.7 12.3 6.2 20.3 10.527. Uttarakhand 3.4 4.9 3.8 2.7 2.1 2.528. Uttar Pradesh 1.7 1.4 1.7 1.0 0.7 0.929. West Bengal 3.6 4.5 3.8 2.8 2.4 2.730. A & N Islands 2.7 19.4 7.4 1.8 12.8 5.431. Chandigarh - - - - - -32. D & N Haveli - - - - - -33. Daman & Diu - - - - - -34. Lakshadweep 7.9 57.9 17.9 7.9 43.5 16.035. Puducherry 1.1 1.0 1.1 0.6 1.0 0.8
All India 2.1 2.9 2.3 1.7 1.7 1.7
Source: GOI, NSSO, Key Indicators of Employment & Unemployment Situation in India 2011-12, 68th Round, July 2011 – June 2012.

Socio-Economic Characteristics 79
Table 2.28: Rural Unemployment Rates According to Current Weekly Status and Current Daily Status in States and UTs (July 2011 – June 2012)
S.No. State/ UTUnemployment Rate
Current Weekly Status * Current Daily Status **Male Female Persons Male Female Persons
1. Andhra Pradesh 28 34 30 49 58 522. Arunachal Pradesh 19 21 20 19 22 203. Assam 46 66 49 49 89 544. Bihar 35 95 39 42 132 485. Chhattisgarh 47 25 39 59 30 486. Delhi 102 -- 84 102 - 847. Goa 66 9 52 73 8 578. Gujarat 9 6 8 25 39 299. Haryana 38 38 38 42 67 46
10. Himachal Pradesh 24 12 19 27 15 2211. Jammu & Kashmir 30 63 38 50 118 6112. Jharkhand 22 46 27 26 68 3313. Karnataka 15 16 16 36 31 3414. Kerala 61 206 107 122 277 16915. Madhya Pradesh 18 7 15 36 21 3316. Maharashtra 24 17 22 42 42 4217. Manipur 26 35 29 31 44 3418. Meghalaya 5 4 4 9 6 819. Mizoram 14 23 17 15 27 2020. Nagaland 184 218 196 199 302 23121. Odisha 51 53 51 88 85 8722. Punjab 40 20 35 56 33 5223. Rajasthan 32 9 24 45 12 3524. Sikkim 25 11 18 29 10 2125. Tamil Nadu 47 43 45 106 121 11126. Tripura 68 291 121 123 326 17027. Uttarakhand 28 26 28 54 43 5128. Uttar Pradesh 33 16 29 56 27 5129. West Bengal 46 64 50 81 93 8330. A & N Islands 28 212 79 30 212 8031. Chandigarh -- -- -- -- -- --32. D & N Haveli -- -- -- 11 -- 833. Daman & Diu -- -- -- -- -- --34. Lakshadweep 118 500 0 167 629 26335. Puducherry 13 13 13 94 166 117
All India 33 35 34 55 62 57
* : Per thousand person weeks **: Per thousand persondays.Source: GOI, NSSO, Key Indicators of Employment and Unemployment Situation in India 2011-12, 68th Round, July 2011 – June 2012.

80 Rural Development Statistics
Table 2.28 (a): Estimated Number of Agricultural Households, its Percentage Share in Rural Households in the Major States during the Agricultural Year July 2012 – June 2013
StateEstimated
Agricultural Households (00)
Estimated No. of Ru-ral Households (00)**
Agricultural Households as Percentage of rural
Households (%)
(1) (2) (3) (4)
Andhra Pradesh 35968 86763 41.5
Assam 34230 52494 65.2
Bihar 70943 140611 50.5
Chhattisgarh 25608 37472 68.3
Gujarat 39305 58719 66.9
Haryana 15693 25849 60.7
Jharkhand 22336 37516 59.5
Karnataka 42421 77430 54.8
Kerala 14043 51377 27.3
Madhya Pradesh 59950 84666 70.8
Maharashtra 70970 125182 56.7
Odisha 44935 78120 57.5
Punjab 14083 27552 51.1
Rajasthan 64835 82722 78.4
Tamil Nadu 32443 93607 34.7
Telangana 25389 49309 51.5
Uttar Pradesh 180486 241328 74.8
West Bengal 63624 141359 45.0
All India 902011 1561442 57.8
All India figures include all States and UTs which are not shown in the Statement**The estimate of rural households as per the results of the Land and Livestock Holding Survey of NSS 70th round
Source: NSSO, Key Indicators of Situation of Agricultural Households in India, 70th Round, January-December, 2013.

Socio-Economic Characteristics 81
2.28
(b):
Per 1
000
Dist
ribut
ion
of A
gric
ultu
ral H
ouse
hold
s by
Pr
inci
pal S
ourc
e of
Inco
me
durin
g La
st 3
65 D
ays
for e
ach
Size
Cla
ss o
f Lan
d Po
sses
sed
Size
cla
ss o
f lan
d po
sses
sed
(ha)
Per 1
000
dist
ribut
ion
of h
ouse
hold
s by
prin
cipa
l sou
rce
of in
com
e
Culti
vatio
nLi
vest
ock
Oth
er
Agric
ultu
ral A
ctiv
ityNo
n-ag
ricul
tura
l En
terp
rises
Wag
e/Sa
larie
d Em
ploy
men
tO
ther
s*al
lEs
td. o
n. o
f Agr
i. Ho
useh
olds
(00)
(1)
(2)
(3)
(4)
(5)
(6)
(7)
(8)
(9)
<0.0
116
229
2710
856
455
1000
2389
0
0.01
– 0
.40
421
4812
7535
293
1000
2876
63
0.41
– 1
.00
692
239
3620
041
1000
3148
11
1.01
– 2
.00
830
259
3286
1810
0015
4577
2.01
– 4
.00
859
2411
1671
1810
0084
345
4.01
– 1
0.00
879
275
959
2010
0033
019
10.0
0+89
455
1518
171
1000
3706
All s
izes
635
3711
4722
051
1000
9020
11
*Oth
ers’
includ
es p
ensio
n an
d re
mitta
nce
also
Sour
ce :
NSSO
, Key
Indi
cato
rs o
f Situ
atio
n of
Agr
icultu
ral H
ouse
hold
s in
Indi
a, 7
0th R
ound
, Jan
uary
-Dec
embe
r, 20
13.

82 Rural Development Statistics
Tabl
e 2.
28 (c
): Pe
r 100
0 Di
strib
utio
n of
Agr
icul
tura
l Hou
seho
lds
by P
rinci
pal S
ourc
e of
Inco
me
durin
g La
st 3
65 D
ays
for M
ajor
Sta
tes
Stat
esPe
r 100
dis
tribu
tion
of h
ouse
hold
s by
prin
cipa
l sou
rce
of in
com
e
Culti
vatio
nLi
vest
ock
Oth
er A
gric
ultu
ral
Activ
ityNo
n- A
gric
ultu
ral
Activ
ityW
age/
Sala
ried
Empl
oym
ent
Oth
ers
#Al
lEs
td. N
o. o
f Agr
i. Ho
useh
olds
(00)
(1)
(2)
(3)
(4)
(5)
(6)
(7)
(8)
(9)
Andh
ra P
rade
sh59
246
1635
280
3110
0035
968
Assa
m76
742
1623
128
2410
0034
230
Biha
r69
730
250
163
5810
0070
943
Chha
ttisg
arh
805
06
1516
87
1000
2560
8G
ujar
at58
490
737
267
1410
0039
305
Hary
ana
600
910
4723
626
1000
1569
3Jh
arkh
and
725
18
4618
635
1000
2233
6Ka
rnat
aka
694
4031
2419
317
1000
4242
1Ke
rala
161
6016
913
429
917
610
0014
043
Mad
hya
Prad
esh
753
251
620
411
1000
5995
0M
ahar
asht
ra71
727
549
180
2210
0070
970
Odi
sha
602
1012
7325
943
1000
4493
5Pu
njab
456
928
5131
974
1000
1408
3Ra
jast
han
456
648
5533
482
1000
6483
5Ta
mil N
adu
548
102
1123
293
2310
0032
443
Tela
ngan
a86
818
518
6229
1000
2538
9Ut
tar P
rade
sh65
231
251
187
7610
0018
0486
Wes
t Ben
gal
558
1217
8326
863
1000
6362
4Al
l Ind
ia*
635
3711
4722
051
1000
9020
11*B
ased
on
all S
tate
s and
UTs
, inclu
ding
Stat
es a
nd U
Ts n
ot sh
own
in th
is St
atem
ent
# ‘O
ther
s ‘In
clude
s inc
ome
from
pen
sion
and
rem
ittanc
e als
oSo
urce
: NS
SO, K
ey In
dicat
ors o
f Situ
ation
of A
gricu
ltura
l Hou
seho
lds in
India
, 70th
Rou
nd, J
anua
ry-D
ecem
ber,
2013
.

Socio-Economic Characteristics 83
Table 2.28 (d): Per 1000 Distribution of Agricultural Households by Social Group for each Decile Class of MPCE
MPCE Decile Class
Per 1000 Distribution of Agricultural Households by Social Group
Esd. No. of Agri. Households (00)
ST SC OBC Others All
(1) (2) (3) (4) (5) (6) (7)
1 306 206 375 113 1000 69253
2 205 184 444 168 1000 71907
3 173 199 465 163 1000 77923
4 126 184 484 205 1000 81850
5 144 147 474 235 1000 85797
6 106 184 474 235 1000 91467
7 123 164 480 232 1000 94987
8 108 157 475 260 1000 100969
9 83 140 479 298 1000 108888
10 65 105 388 442 1000 118972
All Classes 134 163 454 249 1000 902011
Source: NSSO, Key Indicators of Situation of Agricultural Households in India, 70th Round, January-December, 2013.
Table 2.28 (e): Per 1000 Distribution of Agricultural Households by Social Group for each Size Class of Land Possessed
Size Class of Land
Possessed (ha)
Per 1000 Distribution of AgriculturalHouseholds by Social Group Esd. No. of Agri.
Households (00)ST SC OBC Others All
(1) (2) (3) (4) (5) (6) (7)
< 0.01 94 280 522 104 1000 23890
0.01 – 1.00 97 224 446 233 1000 287663
0.41 – 1.00 157 159 452 232 1000 314811
1.01 – 2.00 176 109 455 260 1000 154577
2.01 – 4.00 138 77 472 313 1000 84345
4.01 – 10.00 80 62 444 414 1000 33019
10.00 + 32 29 528 411 1000 3706
All sizes 134 163 454 249 1000 902011
Source: NSSO, Key Indicators of Situation of Agricultural Households in India, 70th Round, January-December, 2013.

84 Rural Development Statistics
E. LITERACY AND MIGRATIONTable 2.29: Literacy Rates – All-India (Rural, Urban and Total) 1951 to 2011
(%)
Year Males Females Persons
1951
Rural 19.02 4.87 12.10
Urban 45.06 22.33 34.59
Total 27.16 8.86 18.33
1961
Rural 34.30 10.10 22.50
Urban 66.00 40.50 54.40
Total 40.40 15.35 28.30
1971
Rural 48.60 15.50 27.90
Urban 69.80 48.80 60.20
Total 45.96 21.97 34.45
1981
Rural 49.60 21.70 36.00
Urban 76.70 56.30 67.20
Total 56.38 29.76 43.57
1991
Rural 57.87 30.62 44.69
Urban 81.09 64.05 73.08
Total 64.13 39.29 52.21
2001
Rural 71.18 46.58 59.21
Urban 86.42 72.99 80.06
Total 75.85 54.16 65.38
2011
Rural 78.57 58.75 68.91
Urban 89.67 79.92 84.98
Total 82.14 65.46 74.04
Source: www.censusindia.net, as on Jan., 2012.

Socio-Economic Characteristics 85
Table 2.30: Rural Literacy Rate by Sex – 2001 & 2011(%)
S.No. State/UT
Male Female Persons2001 2011 2001 2011 2001 2011
1. Andhra Pradesh 65.35 70.24 43.50 52.05 54.50 61.14
2. Arunachal Pradesh 57.65 68.79 36.94 53.78 47.83 61.593. Assam 68.22 76.51 50.70 64.09 59.73 70.444. Bihar 57.09 71.90 29.61 50.82 43.92 61.835. Chhattisgarh 74.09 78.20 46.99 55.40 60.48 66.766. Goa 87.37 91.71 71.92 76.84 79.67 84.267. Gujarat 74.11 83.10 47.84 62.41 61.29 73.008. Haryana 75.37 83.20 49.27 60.97 63.19 72.749. Himachal Pradesh 84.51 90.48 65.68 75.33 75.08 82.91
10. Jammu & Kashmir 61.65 75.51 36.74 53.36 49.78 64.9711. Jharkhand 60.94 74.57 29.89 49.75 45.74 62.4012 Karnataka 70.45 77.92 48.01 59.60 59.33 68.8613 Kerala 93.63 95.29 86.69 90.74 90.04 92.9214. Madhya Pradesh 71.70 76.64 42.76 53.20 57.80 65.2915. Maharashtra 81.93 86.39 58.40 67.38 70.36 77.0916. Manipur 76.49 84.14 56.62 69.95 66.74 75.8617. Meghalaya 59.24 72.83 53.24 69.45 56.29 71.1518. Mizoram 84.93 88.35 77.26 80.04 81.27 84.3119. Nagaland 67.58 79.49 57.52 72.01 62.79 75.8620. Odisha 72.93 80.41 46.66 61.10 59.84 70.7821. Punjab 71.05 77.92 57.72 66.47 64.72 72.4522. Rajasthan 72.16 77.49 37.33 46.25 55.34 62.3423. Sikkim 74.45 85.42 58.01 73.42 66.82 79.8224. Tamil Nadu 77.15 82.08 55.28 65.52 66.21 73.8025. Tripura 78.40 90.86 60.50 80.06 69.72 85.5826. Uttarakhand 81.78 87.63 54.70 66.79 68.07 77.1127. Uttar Pradesh 66.59 78.48 36.90 55.61 52.53 67.5528. West Bengal 73.13 79.51 53.16 66.08 63.42 72.97
Union Territories29. A & N Islands 84.14 88.53 72.26 79.58 78.70 84.3930. Chandigarh 80.98 86.68 66.37 74.17 75.58 81.6931. D & N Haveli 64.50 78.18 30.83 51.36 49.34 65.8932. Daman & Diu 84.83 89.71 59.33 71.97 75.83 81.5133. Delhi 86.60 90.04 67.39 74.03 78.05 82.6734. Lakshadweep 91.49 95.06 78.27 88.66 85.04 91.9235. Puducherry 83.50 88.49 64.38 73.82 73.98 81.02
All-India 70.70 78.57 46.13 58.75 58.74 68.91
Source : G O I, Census of India 2011, Provisional Population Totals, Paper-1 of 2011, Registrar General, India.
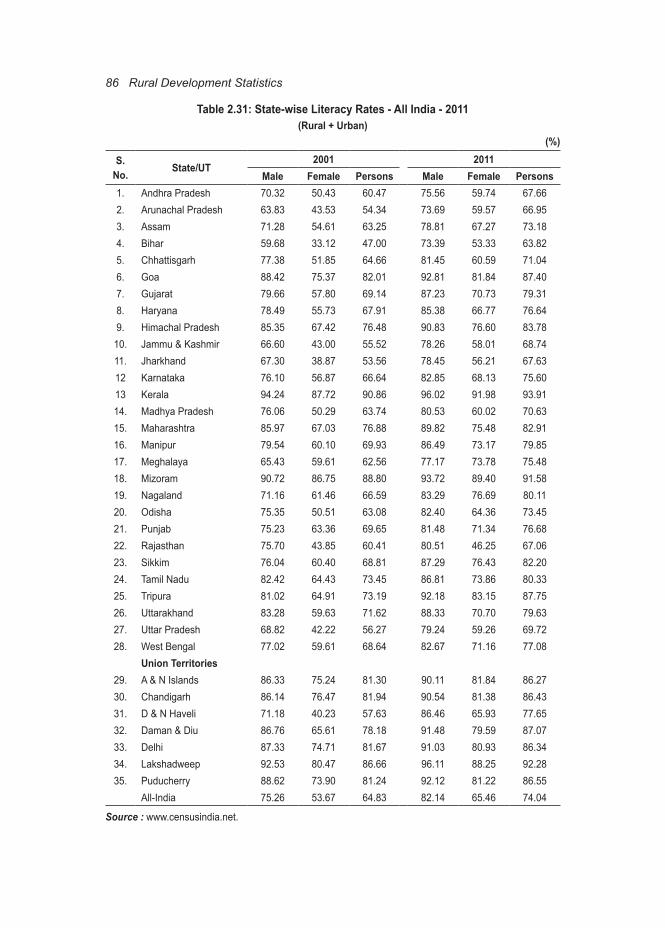
86 Rural Development Statistics
Table 2.31: State-wise Literacy Rates - All India - 2011(Rural + Urban)
(%)
S.No. State/UT
2001 2011Male Female Persons Male Female Persons
1. Andhra Pradesh 70.32 50.43 60.47 75.56 59.74 67.662. Arunachal Pradesh 63.83 43.53 54.34 73.69 59.57 66.953. Assam 71.28 54.61 63.25 78.81 67.27 73.184. Bihar 59.68 33.12 47.00 73.39 53.33 63.825. Chhattisgarh 77.38 51.85 64.66 81.45 60.59 71.046. Goa 88.42 75.37 82.01 92.81 81.84 87.407. Gujarat 79.66 57.80 69.14 87.23 70.73 79.318. Haryana 78.49 55.73 67.91 85.38 66.77 76.649. Himachal Pradesh 85.35 67.42 76.48 90.83 76.60 83.78
10. Jammu & Kashmir 66.60 43.00 55.52 78.26 58.01 68.7411. Jharkhand 67.30 38.87 53.56 78.45 56.21 67.6312 Karnataka 76.10 56.87 66.64 82.85 68.13 75.6013 Kerala 94.24 87.72 90.86 96.02 91.98 93.9114. Madhya Pradesh 76.06 50.29 63.74 80.53 60.02 70.6315. Maharashtra 85.97 67.03 76.88 89.82 75.48 82.9116. Manipur 79.54 60.10 69.93 86.49 73.17 79.8517. Meghalaya 65.43 59.61 62.56 77.17 73.78 75.4818. Mizoram 90.72 86.75 88.80 93.72 89.40 91.5819. Nagaland 71.16 61.46 66.59 83.29 76.69 80.1120. Odisha 75.35 50.51 63.08 82.40 64.36 73.4521. Punjab 75.23 63.36 69.65 81.48 71.34 76.6822. Rajasthan 75.70 43.85 60.41 80.51 46.25 67.0623. Sikkim 76.04 60.40 68.81 87.29 76.43 82.2024. Tamil Nadu 82.42 64.43 73.45 86.81 73.86 80.3325. Tripura 81.02 64.91 73.19 92.18 83.15 87.7526. Uttarakhand 83.28 59.63 71.62 88.33 70.70 79.6327. Uttar Pradesh 68.82 42.22 56.27 79.24 59.26 69.7228. West Bengal 77.02 59.61 68.64 82.67 71.16 77.08
Union Territories29. A & N Islands 86.33 75.24 81.30 90.11 81.84 86.2730. Chandigarh 86.14 76.47 81.94 90.54 81.38 86.4331. D & N Haveli 71.18 40.23 57.63 86.46 65.93 77.6532. Daman & Diu 86.76 65.61 78.18 91.48 79.59 87.0733. Delhi 87.33 74.71 81.67 91.03 80.93 86.3434. Lakshadweep 92.53 80.47 86.66 96.11 88.25 92.2835. Puducherry 88.62 73.90 81.24 92.12 81.22 86.55
All-India 75.26 53.67 64.83 82.14 65.46 74.04
Source : www.censusindia.net.

Socio-Economic Characteristics 87
Table 2.32: Migration Rates in Rural Areas as per Different NSS Rounds(Per 1000 persons)
Round (year)Category of persons
Male Female Persons64th (July 07 – June 08) 54 477 26155th (July 1999 – June 2000) 69 426 24449th (Jan.- June 1993) 65 401 22843rd (July 1987 – June 1988) 74 398 23238th (Jan. – Dec. 1983) 72 351 209
Source: GOI, NSS Report No. 533, Migration in India, July 2007- June 2008.
Table 2.33: Migrant Households by Location of Last Usual Place of Residence – Rural India (2007-08)
(Per 1000 persons)
S.No. Location of Last Usual Place of Residence Rural Urban Anywhere in India1 Rural areas of same State 610 433 5202 Urban areas of same State 171 289 231
Same state (1+2) 780 722 7513 Rural areas of other States 91 135 1134 Urban areas of other States 115 139 127
Other States (3+4) 206 274 241Rural (1+3) 701 568 633Urban (2+4) 286 428 358
5 Other countries 3 3 3All 1000 1000 1000
Source : GOI, NSS Report No. 533, Migration in India, July 2007- June 2008.
Table 2.34: Distribution of Migrants According to Types of Migration Streams (Per 1000 persons)
Category of Migrants
Migration stream
Rural to Rural Urban to Rural Rural to Urban Urban to Urban All NSS 55th Round (1999-2000)
Male 323 107 344 226 1000Female 703 52 144 101 1000Persons 618 64 188 129 1000
NSS 64th Round (2007-08)Male 272 89 390 248 1000Female 700 49 148 103 1000Persons 617 57 195 131 1000
Source: GOI, NSS Report No. 533, Migration in India, July 2007- June 2008.

88 Rural Development Statistics
Table 2.35: Distribution of Migrants by Reason for Migration (2007-08) Rural (Per 1000 persons)
S.No. Reason for Migration Male Female Persons
A Employment related reasons
1 In search of employment 46 1 6
2 In search of better employment 96 2 12
3 Business 17 0 2
4 To take up employment / better employment 81 2 10
5 Transfer of service / contract 36 1 4
6 Proximity to place of work 10 1 2
7 Sub – total (1 to 6) 286 7 36
B Studies 107 5 16
C Forced Migration
8 Natural disaster 12 1 2
9 Social / Political problem 24 2 5
10 Displacement by development projects 6 0 1
11 Sub-total ( 9 to 11) 42 3 8
12 Acquisition of own house / flat 42 3 7
13 Housing problems 39 3 7
14 Healthcare 11 1 2
15 Post-retirement 26 0 3
16 Marriage 94 912 825
17 Migration of parent / earning member of the family 221 44 63
18 Others 122 17 28
19 Sub-total ( 13 to 19) 555 980 935
D All 1000 1000 1000
Source: GOI, NSS Report No. 533, Migration in India, July 2007- June 2008.

Socio-Economic Characteristics 89
Table 2.35 (a): State-wise Migration Rates - All India – 2007-08 (Rural ) (%)
S.No. State/UT2007-08
Male Female Persons1. Andhra Pradesh 8.8 47.3 28.22. Arunachal Pradesh 1.1 0.5 0.83. Assam 2.6 22.7 12.04. Bihar 1.2 37.9 18.95. Chhattisgarh 7.0 53.1 29.56. Goa 28.2 29.6 21.27. Gujarat 12.0 57.2 29.98. Haryana 5.3 59.3 29.89. Himachal Pradesh 4.1 59.2 37.8
10. Jammu & Kashmir 15.3 32.9 17.411. Jharkhand 2.4 30.8 15.612 Karnataka 1.0 47.4 27.313 Kerala 8.0 45.9 33.314. Madhya Pradesh 19.5 53.3 26.815. Maharashtra 3.0 57.2 32.916. Manipur 9.8 0.5 0.617. Meghalaya 0.6 2.9 3.318. Mizoram 3.8 11.4 11.019. Nagaland 10.7 9.2 7.620. Odisha 6.2 51.1 28.021. Punjab 4.3 57.1 31.222. Rajasthan 7.4 54.1 28.823. Sikkim 4.6 41.4 30.024. Tamil Nadu 19.5 35.4 22.025. Tripura 7.9 16.3 11.026. Uttarakhand 5.7 53.9 34.427. Uttar Pradesh 15.1 50.1 25.628. West Bengal 2.6 51.2 27.2
Union Territories29. A & N Islands 50.8 56.2 53.330. Chandigarh 71.0 62.8 67.231. D & N Haveli 23.7 56.6 37.232. Daman & Diu 48.4 53.6 50.333. Delhi 28.2 40.7 33.934. Lakshadweep 32.0 23.9 28.135. Puducherry 13.9 35.6 24.2
All-India 5.4 47.7 26.1
Source : GOI, NSS Report No. 533, Migration in India, July 2007- June 2008.

90 Rural Development Statistics
Table 2.35 (b): Number of Persons Migrated by Reason wise -2011 (All ages)
Duration of Residence All Durations of Residence
All Durations of Residence
All Durations of Residence
Age-GroupTotal Rural Urban
Last residence Rural/Urban
Total Migrants P 4536,41,955 3084,36,693 1031,59,179
M 1409,62,280 799,10,254 447,59,786
F 3126,79,675 2285,26,439 583,99,393
Reason for Migration
Work/Employment
P 463,83,766 291,31,683 143,42,035
M 389,99,861 246,47,924 121,82,399
F 73,83,905 44,83,759 21,59,636
Bussiness P 43,45,018 22,62,023 16,77,427
M 32,19,565 16,92,667 12,64,401
F 11,25,453 5,69,356 4,13,026
Education P 80,09,653 49,32,887 23,82,858
M 47,76,882 29,45,260 14,20,952
F 32,32,771 19,87,627 9,61,906
Marriage P 2238,82,710 1839,01,783 280,52,161
M 60,17,923 46,26,322 9,24,953
F 2178,64,787 1792,75,461 271,27,208
Moved after Birth
P 479,59,194 253,96,273 181,35,547
M 285,23,392 155,09,438 104,07,408
F 194,35,802 98,86,835 77,28,139
Moved with Household
P 698,02,369 390,39,282 250,65,300
M 314,83,085 176,34,208 111,09,182
F 383,19,284 214,05,074 139,56,118
Others P 532,59,245 237,72,762 135,03,851
M 279,41,572 128,54,435 74,50,491
F 253,17,673 109,18,327 60,53,360
Source : www.censusindia.gov.in.

Socio-Economic Characteristics 91
Table 2.35 (c): State-wise Rural Migration by Sex-wise -2011
Total Migrants (in number) Percentage of Migrants* Persons Male Female Persons Male Female
Andaman & Nicobar Islands
1,10,643 54,625 56,018 0.05 0.13 0.03
Andhra Pradesh 158,63,863 38,34,404 120,29,459 7.02 9.08 6.55Arunachal Pradesh 2,92,601 1,25,092 1,67,509 0.13 0.3 0.09Assam 70,52,687 19,53,731 50,98,956 3.12 4.62 2.78Bihar 218,13,130 21,86,698 196,26,432 9.66 5.18 10.69Chandigarh 15,336 9,047 6,289 0.01 0.02 0Chhattisgarh 54,41,464 8,69,151 45,72,313 2.41 2.06 2.49Dadra & Nagar Haveli 52,222 22,936 29,286 0.02 0.05 0.02Daman & Diu 14,549 7,260 7,289 0.01 0.02 0Goa 2,03,859 81,249 1,22,610 0.09 0.19 0.07Gujarat 103,49,615 20,65,568 82,84,047 4.58 4.89 4.51Haryana 47,68,334 6,51,021 41,17,313 2.11 1.54 2.24Himachal Pradesh 20,09,507 3,55,896 16,53,611 0.89 0.84 0.9Jammu & Kashmir 15,55,300 2,97,099 12,58,201 0.69 0.7 0.69Jharkhand 61,36,594 6,06,503 55,30,091 2.72 1.44 3.01Karnataka 107,40,347 26,74,731 80,65,616 4.76 6.33 4.39Kerala 67,07,834 25,09,255 41,98,579 2.97 5.94 2.29Lakshadweep 1,382 836 546 0 0 0Madhya Pradesh 143,19,353 22,01,685 121,17,668 6.34 5.21 6.6Maharashtra 218,87,646 65,29,204 153,58,442 9.69 15.45 8.37Manipur 3,63,041 1,23,627 2,39,414 0.16 0.29 0.13Meghalaya 4,22,516 2,32,987 1,89,529 0.19 0.55 0.1Mizoram 89,810 44,793 45,017 0.04 0.11 0.02Nagaland 1,63,244 80,363 82,881 0.07 0.19 0.05NCT of Delhi 1,28,491 48,980 79,511 0.06 0.12 0.04Odisha 98,21,287 14,73,785 83,47,502 4.35 3.49 4.55Puducherry 1,18,241 42,733 75,508 0.05 0.1 0.04Punjab 61,79,286 16,05,249 45,74,037 2.74 3.8 2.49Rajasthan 136,45,439 15,50,554 120,94,885 6.04 3.67 6.59Sikkim 1,26,671 47,730 78,941 0.06 0.11 0.04Tamil Nadu 97,24,011 27,89,047 69,34,964 4.31 6.6 3.78Tripura 6,64,515 2,08,000 4,56,515 0.29 0.49 0.25Uttar Pradesh 357,81,913 35,80,051 322,01,862 15.84 8.47 17.54Uttarakhand 23,14,424 5,42,993 17,71,431 1.02 1.29 0.96West Bengal 169,46,335 28,40,261 141,06,074 7.5 6.72 7.68India 2258,25,490 422,47,144 1835,78,346 100 100 100
*: Percentage of total migrants.Source: www.censusindia.gov.in.

92 Rural Development Statistics
F. INDEBTEDNESS AND WAGESTable 2.36: Distribution of Indebted Rural Households
by Purpose (2004-05)(%)
S.No. Purpose of DebtHouseholds
With Cultivated Land
Without Cultivated Land
All House-holds
1. Household Consumption 23.5 34.5 29.4
2. Marriages and Other Ceremonial Expenses
22.1 21.1 21.6
3. Purchase of Land and Construc-tion of Building
16.6 19.9 18.4
4. Productive Purposes 27.2 17.5 22.0
5. Repayment of Debt 3.1 2.5 2.8
6. Other Purposes 7.5 4.5 5.8
Total 100.0 100.0 100.0
Source : GOI, Ministry of Labour and Employment, Report on Indebtedness among Rural Labour Households, 2004-05.
2.36 (a): Incidence of Indebtedness (IOI) to Institutional and Non-institutional Credit Agencies by Household Asset Holding Class: All-India - 2012
Decile Class of HH Asset
Holding
Incidence of Indebtedness (%)
Rural Urban
Institutional Non-inst. All Institutional Non-inst All
(1) (2) (3) (4) (5) (6) (7)
1 7.9 14.0 19.6 3.4 605 9.3
2 7.4 17.1 22.3 6.2 10.1 14.6
3 10.8 19.1 27.1 10.6 11.9 20.2
4 12.4 18.2 27.5 12.5 14.4 24.2
5 13.0 21.9 30.9 12.1 12.6 21.7
6 16.9 21.6 33.0 14.0 12.7 23.4
7 19.1 19.3 32.7 15.7 11.6 23.8
8 22.2 21.6 37.3 18.9 10.1 25.4
9 29.2 22.1 42.6 25.6 7.1 29.4
10 32.6 15.3 41.3 29.1 5.7 31.7
all 17.2 19.0 31.4 14.8 10.3 22.4
Source : NSSO, Key Indicators of Debt and Investment in India, 70th Round, January-December, 2013.

Socio-Economic Characteristics 93
2.36 (b): Incidence of Indebtedness (IOI) of Households by Terms of Interest : 2002-2012
Terms of Interest
Incidence of Indebtedness (%)
Rural Urban
2002 2012 2002 2012
(1) (2) (3) (4) (5)
Interest-free 4.6 6.5 4.7 4.4
Simple 17.7 20.3 11.3 13.4
Compound 5.2 6.3 2.4 5.9
Concessional 0.6 1.3 0.4 0.5
Source : NSSO, Key Indicators of Debt and Investment in India, 70th Round, January-December, 2013.
Table 2.37: Distribution of Indebted Rural Labour Households by Source of Debt (2004-05)
(%)
S.No. Source of DebtHouseholds
With CultivatedLand
Without Cultivated Land All
1 Government 3.63 2.78 3.17
2 Cooperative Societies 13.51 5.67 9.27
3 Banks 21.63 12.10 16.47
4 Employers 3.86 6.61 5.35
5 Moneylenders 36.96 50.42 44.24
6 Shop-keepers 6.06 6.06 6.06
7 Relatives/Friends 12.55 12.97 12.78
8 Other Sources 1.80 3.39 2.66
Total 100.00 100.00 100.00
Source : GOI, Ministry of Labour and Employment, Report on Indebtedness among Rural Labour Households, 2004-05.

94 Rural Development Statistics
Table 2.38: Estimated Number of Rural Households, Total and Indebted Farmer Households in States– 2003
State
Estimated Number of Rural
Households (‘00)
Estimated Number
of Farmer House-
holds(‘00)
Estimated Number of In-debted Farmer
Households (‘00)
% of Farmer House-holds
Indebted
Average Amount of Outstanding
Loan per Indebt-ed Household (`)
Andhra Pradesh 142512 60339 49493 82 23965
Arunachal Pradesh 15412 1227 72 5.9 493
Assam 41525 25040 4536 18.1 813
Bihar 116853 70804 23383 33 4476
Chhattisgarh 36316 27598 11092 40.2 4122
Gujarat 63015 37845 19644 51.9 15526
Haryana 31474 19445 10330 53.1 26007
Himachal Pradesh 11928 9061 3030 33.4 9618
Jammu & Kashmir 10418 9432 3003 31.8 1903
Jharkhand 36930 28238 5893 20.9 2205
Karnataka 69906 40413 24897 61.6 18135
Kerala 49942 21946 14126 64.4 33907
Madhya Pradesh 93898 63206 32110 50.8 14218
Maharashtra 118177 65817 36098 54.8 16973
Manipur 2685 2146 533 24.8 2269
Meghalaya 3401 2543 103 4.1 72
Mizoram 942 780 184 23.6 1876
Nagaland 973 805 294 36.5 1030
Odisha 66199 42341 20250 47.8 5871
Punjab 29847 18442 12069 65.4 41576
Rajasthan 70172 53080 27828 52.4 18372
Sikkim 812 531 174 38.8 2053
Tamil Nadu 110182 38880 28954 74.5 23963
Tripura 5977 2333 1148 49.2 2977
Uttar Pradesh 221499 171575 69199 40.3 7425
Uttarakhand 11959 8962 644 7.2 1108
West Bengal 121667 69226 34696 50.1 5237
UTs 2325 732 372 50.8 10931
All India 1478988 893504 434242 48.6 12585
Source : GOI, NSSO, Situation Assessment Survey of Farmers: Indebtedness of Farmer Households, National Sample Survey 59th Round (January-December 2003), Report No. 498(59/33/1).

Socio-Economic Characteristics 95
Table 2.39: Incidence of Indebtedness Among Rural Labour Households (2004-05) (%)
States/ Union Territories
Percentage of Indebted Households AmongAll Classes ofHouseholds
Scheduled CastesHouseholds
Scheduled TribesHouseholds
Other BackwardClasses Households
1999-2000
2004-05
1999-2000
2004-05
1999-2000
2004-05
1999-2000
2004-05
1 2 3 4 5 6 7 8 9Major StatesAndhra Pradesh 37.30 66.60 38.20 65.70 43.60 77.70 36.00 63.90Assam 37.74 59.30 33.30 58.50 40.50 65.00 30.20 67.50Bihar 16.70 34.60 17.10 37.24 21.80 25.50 13.70 33.40Gujarat 35.70 56.00 44.80 62.95 32.90 60.10 29.30 50.70Haryana 41.00 51.10 44.10 50.70 - - 41.50 55.20Karnataka 19.60 35.40 23.90 30.20 19.70 44.50 15.00 40.60Kerala 42.90 64.30 44.20 67.20 21.10 50.40 43.30 62.34Maharashtra 16.00 34.20 20.60 43.40 14.90 31.92 15.00 28.85Odisha 22.30 42.00 22.00 36.00 23.50 31.30 21.10 45.74Punjab 17.00 29.30 15.90 35.70 12.00 20.60 21.30 33.70Rajasthan 39.70 46.90 40.10 53.00 52.70 14.30 33.00 31.10Tamil Nadu 26.90 38.80 20.90 37.20 40.40 46.42 16.10 31.20Uttar Pradesh 19.20 53.00 19.10 55.00 38.90 30.10 19.30 52.10 West Bengal 18.20 42.90 20.20 42.60 23.10 14.00 17.00 43.70
34.00 61.50 27.60 62.11 27.70 39.50 27.10 54.90Other States/UTsArunachal Pradesh - 13.10 - - - 38.50 - -Chhattisgarh 18.40 41.00 23.60 48.50 13.10 32.41 19.40 43.00Goa 9.40 38.00 8.30 82.60 - - - 4.30H.P 19.80 36.00 16.60 40.20 - 43.50 19.70 42.00Jammu & Kashmir 36.40 53.90 29.00 55.50 100.00 - 27.80 35.40Jharkhand 11.70 18.70 12.50 16.80 15.40 15.70 9.40 23.60Manipur 7.00 52.90 - 100.00 - - 31.90 56.60Meghalaya - 15.80 - - - 16.92 - -Mizoram 4.30 17.10 - - 4.30 17.10 - -Nagaland 3.10 23.30 - - 3.40 23.30 - -Sikkim 20.00 71.40 31.30 73.20 5.40 74.80 28.00 75.90Tripura 13.50 62.90 8.90 57.00 13.00 70.90 9.40 60.00Uttarakhand 32.30 27.00 38.10 37.80 - 23.53 39.20 21.70A & N Islands 11.70 60.20 34.90 - 1.80 100.00 - -Chandigarh 37.20 41.00 46.90 66.90 - - 48.60 -D & N Haveli 80.30 59.50 100.00 - 76.00 67.90 100.00 31.70Daman & Diu 73.20 81.90 100.00 - 80.40 100.00 64.70 25.10Delhi - - - - - - - -Lakshadweep 30.50 29.70 - - 16.80 41.20 100.00 -Puducherry 19.80 62.60 13.90 55.50 48.10 - 22.60 71.40All-India 25.00 47.30 25.30 48.04 22.90 39.39 22.60 46.67
Source : GOI, Ministry of Labour and Employment, Report on Indebtedness among Rural Labour Households, 2004-05.

96 Rural Development Statistics
Table 2.40: Extent of Indebtedness Among Rural Labour Households (`)
S. No. States/ Union Territories
All Classes of HouseholdsAverage Debt Per
HouseholdAverage Debt Per
Indebted Household1999-2000 2004-05 1999-2000 2004-05
1 2 3 4 5 6Major States
1 Andhra Pradesh 2383 8906 6400 133662 Assam 215 544 577 9183 Bihar 434 951 2591 27514 Gujarat 1805 2977 5055 53145 Haryana 5209 10352 12695 202476 Karnataka 1137 2578 5795 72797 Kerala 5775 25050 13472 389398 Madhya Pradesh 1182 2461 7409 71929 Maharashtra 1912 4363 8560 10392
10 Odisha 596 1137 3510 387911 Punjab 2408 6944 6070 1480012 Rajasthan 1928 5523 7160 1424313 Tamil Nadu 1676 5870 8715 1107614 Uttar Pradesh 1135 4242 6241 987915 West Bengal 532 1749 1567 2843
Other States/UTs - 172 - 131216 Arunachal Pradesh 924 2695 5027 657317 Chhattisgarh 626 5532 6678 1454218 Goa 1139 2974 5756 826819 Himachal Pradesh 965 1072 2651 198720 Jammu & Kashmir 221 550 1885 295121 Jharkhand 141 1698 2022 321022 Manipur - 450 - 284423 Meghalaya 1865 2292 43077 1338724 Mizoram 47 577 1500 247825 Nagaland 166 572 825 80026 Sikkim 689 1310 5115 208327 Tripura 1532 2256 4745 836428 Uttarakhand 416 6423 3559 1066329 A & N Islands 2624 61 7054 15030 Chandigarh 770 1066 958 179231 D & N Haveli 3730 2316 5097 282832 Daman & Diu Delhi - - - -33 Lakshadweep 4814 446 15768 150034 Puducherry 1484 13295 7487 21247
All-India 1515 4852 6049 10259Source : GOI, Ministry of Labour and Employment, Report on Indebtedness among Rural Labour Households, 2004-05.

Socio-Economic Characteristics 97
Table 2.41: Daily Rates of Minimum Wages for Agricultural Workers -States/UTs Under the Minimum Wages Act.,1948 (2014)
S.No.
Appropriate Governments Category Minimum Wages for Agricultural
Workers (in Rupees per day) Central Sphere Unskilled 204.00-226.00
Semi-skilled 209.00-247.00Skilled 227.00-269.00Highly Skilled 247.00-298.00
States/UTs1 Andhra Pradesh Lowest 221.25
Highest 309.342 Arunachal Pradesh Unskilled 150-170
Skilled 170-1903 Assam Unskilled 177.84
Semi-skilled 205.20Skilled 284.55
4 Bihar 186.00-257.885 Chhattisgarh Unskilled 148.966 Goa Unskilled 225-2677 Gujarat 150.008 Haryana Unskilled 22.56
Semi-skilled 228.56-233.56Skilled 238.56-243.56Highly Skilled 248.56
9 Himachal Pradesh Unskilled 170.0010 Jammu & Kashmir Unskilled 110.00
Semi-skilled 150.00Skilled 200.00Supervisor 175.00
11 Jharkhand Tractor Driver and Pump Operator 255.91Chowkidar 200.43All Other Agricultural Operations 187.43
12 Karnataka 288.6613 Kerala For Light Work 150.00
For Hard Work 200.0014 Madhya Pradesh Unskilled 186.5315 Maharashtra 191.0116 Manipur Unskilled 122.10
Semi-skilled 129.97Skilled 132.60
17 Meghalaya Unskilled 160.00Semi-skilled 170.00Skilled 180.00
18 Mizoram Unskilled 220.00Semi-skilled 250.00Skilled-II 310.00Skilled-I 380.00
(Contd...)

98 Rural Development Statistics
S.No.
Appropriate Governments Category Minimum Wages for Agricultural
Workers (in Rupees per day)19 Nagaland Unskilled 115.00
Semi-skilled 125.00Skilled 135.00
20 Odisha Unskilled 150.00Semi-skilled 273.95Skilled 189.00Highly Skilled 199.00
21 Punjab Unskilled 209.0022 Rajasthan Unskilled 259.00
Semi-skilled 146.00Skilled 250.00Highly Skilled 174.00
23 Tamil Nadu Women Workers (5 hours) 161.00Men Workers (6 Hours) 200.00
24 Tripura Adult 216.00Young 238.00
25 Uttar Pradesh Unskilled 261.0026 Uttarakhand Unskilled 269.00-280.0027 West Bengal Unskilled 281.00-289.00
Semi-skilled 294.00-311.00Skillled 315.00-333.00
28 Andaman & Nicobar Unskilled 306.19Semi-skilled 312.00-316.00Skilled 321.00-332.15Highly Skilled 348.00
29 Chandigarh Unskilled 220.80Semi-skilled 385.00Skilled 423.00Highly Skilled 348.00
30 Dadra & Nagar Haveli
Unskilled 385.00
Semi-skilled 423.00Skilled 70.00 & 80.00
31 Delhi Unskilled 55.00Semi-skilled 363.00Skilled 399.00
32 Puducherry Light Work 100.00Hard Work 150.00
Source : GOI, Ministry of Agriculture, Directorate of Economics & Statistics, Statistics at a Glance, 2015.
Table 2.41: (Contd...)

Socio-Economic Characteristics 99
Table 2.42: Average Wage / Salary Earnings Per Day Received by Casual Labour of Age 15-59 Years Engaged in Public Works other than
MGNREGA Public Works (2009-10)(Rural) (`)
S.No. State/ UT Male Female Persons1. Andhra Pradesh 91.28 85.44 88.062. Arunachal Pradesh 95.00 85.71 94.853. Assam 95.47 85.71 95.424. Bihar 103.32 102.33 103.305. Chhattisgarh 88.89 82.57 86.036. Delhi -- -- --7. Goa -- -- --8. Gujarat 90.51 87.23 88.029. Haryana 104.84 110.40 107.40
10. Himachal Pradesh 114.62 113.82 114.4111. Jammu & Kashmir 106.18 0.00 106.1812. Jharkhand 119.28 84.72 112.3513. Karnataka -- -- --14. Kerala 125.44 125.47 125.4715. Madhya Pradesh 80.88 70.54 73.9316. Maharashtra 94.98 100.00 98.3317. Manipur 97.16 84.27 89.9718. Meghalaya 84.97 73.38 81.4719. Mizoram 118.83 107.34 115.7620. Nagaland 124.90 119.18 121.0321. Odisha 83.42 0.00 83.4222. Punjab 153.97 102.00 152.3923. Rajasthan 104.87 92.57 97.3824. Sikkim 107.80 99.13 104.3625. Tamil Nadu 74.52 77.84 77.4526. Tripura 99.54 100.76 99.9827. Uttarakhand 97.98 100.00 98.0828. Uttar Pradesh 103.73 100.00 103.5729. West Bengal 88.61 82.81 87.0030. A & N Islands 150.00 -- 150.0031. Chandigarh -- -- --32. D & N Haveli -- -- --33. Daman & Diu -- -- --34. Lakshadweep -- -- --35. Puducherry -- 80.00 80.00
All India 98.33 86.11 93.11
Source : GOI, NSSO, Employment and Unemployment Situation in India, 66th Round (July 2009 – June 2010).

100 Rural Development Statistics
G. CONSUMPTION AND POVERTYTable 2.43: Average Quantity and Value of Cereals Consumed - Rural India
(Per capita per month)
ItemQuantity (Kg.)
43rd Round
47th Round
48th Round
49th Round
50th Round
51st Round
53rd Round
55th Round
61st Round
63rd Round
66th Round
Rice 7.1 7.1 7.2 7.2 7.0 7.1 6.7 6.78 6.55 6.56 6.14
Wheat 4.9 4.6 4.5 4.5 4.4 4.3 4.5 4.55 4.29 3.97 4.36
Jowar 1.2 0.8 0.8 0.8 0.8 0.7 0.7 0.50 0.43 0.42 0.29
Bajra 0.5 0.5 0.5 0.5 0.5 0.4 0.4 0.38 0.39 0.35 0.26
Maize 0.3 0.4 0.4 0.3 0.4 0.3 0.3 0.32 0.31 0.27 0.20
Total Cereal 14.4 13.8 13.8 13.6 13.4 13.2 12.8 12.7 12.1 11.7 11.3
Value (`)
Item 43rd Round
47th Round
48th Round
49th Round
50th Round
51st Round
53rd Round
55th Round
61st Round
63rd Round
66th Round
Rice 25.0 35.6 40.0 40.5 43.5 48.2 52.2 66.24 61.37 67.06 84.76
Wheat 11.4 16.0 17.9 16.6 18.3 19.3 26.6 32.39 31.41 38.71 50.36
Jowar 2.2 2.7 3.2 2.5 2.5 3.1 3.4 3.56 2.90 3.33 3.42
Bajra 1.1 1.8 1.8 1.5 1.7 1.8 2.2 2.56 2.39 2.71 2.64
Maize 0.7 1.2 1.1 0.9 1.2 1.2 1.2 1.90 1.72 2.08 2.10
Total Cereal 41.3 58.2 65.1 63.0 68.1 75.1 86.5 107.75 100.68 114.80 144.44
43rd Round: July 1987 - June 1988 47th Round: July - December 1991
48th Round: January - December 1992 49th Round: January - June 1993
50th Round: July 1993 - June 1994 51st Round: July 1994 - June 1995
52nd Round: July 1995 - June 1996 53rd Round: January - December 1997
54th Round: January - June 1998 55th Round: July 1999 - June 2000
61st Round: July 1993 - June 1994 63rd Round : July 2006 - June 2007
66th Round: July 2009 - June 2011
Source : GOI, NSSO, Household Consumer Expenditure in India 2009 - 2010, 66th Round, December 2011, Report No. 538.

Socio-Economic Characteristics 101
Table 2.44: Average Monthly Consumer Expenditure per Person on Food and Non-Food Items - Rural (July 2011 – June 2012)
(PCPM)
S.No. State Consumer Expenditure (`)Food Non-Food Total
1 All India 621.96 656.98 1278.942 Andhra Pradesh 717.10 816.10 1533.203 Arunachal Pradesh 625.57 958.33 1583.904 Assam 597.50 445.53 1043.035 Bihar 524.98 480.00 1004.986 Chhattisgarh 434.56 446.48 881.047 Goa 1005.04 1453.20 2458.248 Gujarat 713.67 746.95 1460.629 Haryana 960.12 921.90 1882.02
10 Himachal Pradesh 785.60 1073.93 1858.5211 Jammu & Kashmir 788.22 794.33 1582.5512 Jharkhand 494.39 403.50 897.8913 Karnataka 634.98 764.68 1399.6614 Kerala 889.11 1620.81 2509.9215 Madhya Pradesh 498.24 546.54 1044.7816 Maharashtra 671.13 762.53 1433.6617 Manipur 618.25 662.67 1280.9218 Meghalaya 635.30 635.33 1270.6219 Mizoram 651.00 667.96 1318.9620 Nagaland 819.21 906.14 1725.3521 Odisha 470.30 409.94 880.2422 Punjab 894.22 1182.21 2076.4323 Rajasthan 689.68 742.88 1432.5524 Sikkim 717.44 670.77 1388.2125 Tamil Nadu 693.77 811.04 1504.8226 Telangana27 Tripura 631.05 478.93 1109.9728 Uttarakhand 735.41 818.34 1553.7629 Uttar Pradesh 530.52 516.29 1046.8130 West Bengal 639.92 503.26 1143.1831 A & N Islands 1175.67 1281.59 2457.2732 Chandigarh 966.43 1402.49 2368.9333 D & N Haveli 486.77 495.76 982.5334 Daman & Diu 986.41 1291.24 2277.6535 Delhi 1032.28 1316.47 2348.7636 Lakshadweep 1329.21 1596.82 2926.0337 Puducherry 990.93 1296.68 2287.61
PCPM: Per Capita per Month.Source : GOI, NSSO, Level and Pattern of Consumer Expenditure in India July 2011 – June 2012, 68th Round, Report No. 538.

102 Rural Development Statistics
Table 2.45: Average Consumer Expenditure per Person on Cereals and Food and their Percentage Shares in Total Consumer Expenditure in 2009-10 - Major States-Rural
S.No. State
Monthly PCE on Cereals
(`)
MonthlyPCE on Food
(`)
Share of Cereals in Total Exp
(%)
Share of Food in Total Exp
(%)
1 Andhra Pradesh 168.36 716.52 13.65 58.08
2 Assam 207.31 646.38 20.66 64.43
3 Bihar 166.21 504.81 21.30 64.71
4 Chhattisgarh 120.48 456.04 15.38 58.20
5 Gujarat 118.33 640.10 10.66 57.68
6 Haryana 110.52 815.20 7.32 53.99
7 Jharkhand 158.13 502.81 19.16 60.94
8 Karnataka 125.63 576.61 12.31 56.51
9 Kerala 146.42 843.00 7.98 45.93
10 Madhya Pradesh 122.38 503.58 13.56 55.78
11 Maharashtra 129.79 622.62 11.26 54.01
12 Odisha 152.58 506.75 18.64 61.91
13 Punjab 113.96 795.01 6.91 48.21
14 Rajasthan 141.37 646.55 11.99 54.82
15 Tamil Nadu 104.44 634.52 9.01 54.71
16 Uttar Pradesh 136.91 520.82 15.23 57.93
17. West Bengal 174.32 604.20 18.30 63.45
All India 144.44 600.36 13.71 56.98
Source : GOI, NSSO, Household Consumer Expenditure in India, 66th Round, July 2009-June 2010, Report No.538.

Socio-Economic Characteristics 103
Table 2.46 (a): Average Consumer Expenditure per Person in MPCE Different Decile Classes 2011-12 – (All-India-Rural)
S.No. MPCE Decile Class (%) Monthly PCE-URP (`)1 0-5 521.442 5-10 665.843 10-20 783.244 20-30 904.575 30-40 1017.86 40-50 1135.977 50-60 1266.088 60-70 1426.769 70-80 1645.36
10 80-90 2007.4611 90-95 2556.3312 95-100 4481.18
All India 1429.96
URP: Uniform Reference Period. MRP: Mixed Reference Period.
MMRP: Modified Mixed Reference Period. Source: GOI, NSSO, Key Indicators of Household Consumer Expenditure in India, 68th Round, July 2010-June 2011.
Table 2.46 (b): Share of Consumer Expenditure for Different Fractile Classes 2011-12 – (All-India-Rural)
S.No. MPCE Decile Class (%)Share of Food in Consumer
Expenditure (%)URP MRP MMRP
1 0-5 62.4 57.2 60.62 5-10 61.0 57.1 60.23 10-20 60.3 56.6 60.34 20-30 59.2 55.5 59.25 30-40 57.8 55.1 58.96 40-50 56.5 54.2 58.07 50-60 54.6 53.1 57.08 60-70 53.5 51.5 55.79 70-80 51.3 49.7 54.2
10 80-90 47.4 46.4 51.811 90-95 43.4 42.5 47.612 95-100 28.1 33.3 39.5
All India 48.6 48.3 52.9
URP : Uniform Reference Period. MRP: Mixed Reference Period.MMRP : Modified Mixed Reference Period. Source : GOI, NSSO, Key Indicators of Household Consumer Expenditure in India, 68th Round, July 2010-June 2011.

104 Rural Development Statistics
Table 2.47: Monthly Average Quantity of Consumption of Different Cereals Per Person-States / UTs (2009-10)
(Rural)
S. No. State/ UTsPer Capita Consumption of Cereals (Kg./Month)
Rice Wheat Jowar Bajra Maize Other Cereals
Total Cereals
1. Andhra Pradesh 10.67 0.32 0.30 0.01 0.01 0.16 11.482. Arunachal Pradesh 12.32 0.42 0.00 0.01 0.43 0.48 13.673. Assam 12.38 0.51 0.00 0.00 0.00 0.00 12.894. Bihar 6.38 5.55 0.00 0.00 0.29 0.00 12.235. Chhattisgarh 11.18 0.88 0.01 0.00 0.04 0.02 12.136. Delhi 2.06 5.74 0.00 0.00 0.00 0.00 7.797. Goa 7.36 1.74 0.08 0.00 0.00 0.00 9.198. Gujarat 1.74 4.19 0.35 1.71 1.17 0.06 9.219. Haryana 0.70 8.91 0.00 0.17 0.03 0.01 9.81
10. Himachal Pradesh 4.09 6.35 0.00 0.00 0.78 0.02 11.2411. Jammu & Kashmir 8.60 3.82 0.00 0.01 0.41 0.02 12.8512. Jharkhand 8.54 3.09 0.00 0.00 0.12 0.01 11.7713. Karnataka 5.66 1.10 1.80 0.03 0.00 1.45 10.0314. Kerala 7.69 1.01 0.00 0.00 0.00 0.01 8.7115. Madhya Pradesh 2.17 8.13 0.27 0.07 0.60 0.07 11.3016. Maharashtra 3.25 4.25 2.13 0.51 0.03 0.06 10.2417. Manipur 14.05 0.06 0.00 0.00 0.03 0.01 14.1418. Meghalaya 10.27 0.21 0.00 0.00 0.05 0.01 10.5719. Mizoram 12.79 0.15 0.00 0.00 0.08 0.00 13.0220. Nagaland 13.09 0.42 0.00 0.00 0.05 0.00 13.3021. Odisha 13.16 0.63 0.00 0.00 0.00 0.08 13.8722. Punjab 0.79 8.43 0.01 0.00 0.11 0.00 9.3523. Rajasthan 0.24 8.65 0.03 1.94 0.95 0.01 11.8224. Sikkim 9.52 0.88 0.00 0.00 0.29 0.07 10.7625. Tamil Nadu 9.15 0.62 0.00 0.01 0.00 0.20 9.9826. Tripura 13.55 0.26 0.00 0.00 0.00 0.00 13.8127. Uttar Pradesh 4.27 7.66 0.00 0.08 0.03 0.00 12.0428. Uttarakhand 4.49 5.44 0.00 0.00 0.01 0.22 10.1729. West Bengal 10.26 1.16 0.00 0.00 0.01 0.00 11.4330. A & N Islands 9.20 1.16 0.00 0.00 0.00 0.00 10.3631. Chandigarh 2.02 7.36 0.00 0.00 0.00 0.00 9.3832. D & N Haveli 6.82 2.04 0.20 0.00 0.00 0.06 9.1233. Daman & Diu 5.27 2.64 1.44 0.00 0.00 0.00 9.3534. Lakshadweep 7.53 1.34 0.00 0.00 0.00 0.02 8.8935. Puducherry 9.84 0.68 0.00 0.00 0.00 0.07 10.59
All India 6.14 4.36 0.29 0.26 0.20 0.11 11.35
Source : GOI, NSSO, Household Consumer Expenditure in India, 66th Round, July 2009-June 2010, Report No.538.

Socio-Economic Characteristics 105
Table 2.48: Trends in Average Per Capita Cereal Consumption (Kgs) in Major StatesRURAL
YearPer Capita Cereal Consumption (Kg./Month)
AP ASM BHR* GUJ HAR KTK KRL MP#
1993-94 13.3 13.2 14.3 10.7 12.9 13.2 10.1 14.2
1999-2000 12.65 12.63 13.75 10.19 11.37 11.53 9.89 12.94
2004-05 12.07 13.04 13.08 10.07 10.66 10.73 9.53 12.16
2009-10 11.55 12.64 12.09 9.46 9.87 10.04 8.79 11.5
MAH ORS PUN RAJ TN UP^ WB INDIA
1993-94 11.4 15.9 10.8 14.9 11.7 13.9 15.0 13.4
1999-2000 11.32 15.09 10.58 14.19 10.66 13.62 13.59 12.72
2004-05 10.50 13.98 9.92 12.68 10.89 12.87 13.18 12.12
2009-10 10.38 13.75 9.44 11.71 10.06 11.85 11.49 11.35
* Includes Jharkhand # Includes Chhattisgarh ^ Includes UttarakhandSource : GOI, NSSO, Household Consumer Expenditure in India, 66th Round, July 2009-June 2010, Report No.538.

106 Rural Development Statistics
Table 2.49: Lorenz Ratio of Distribution of MPCE for State/UTs and All-India (2009-10)-Rural
State/UTLorenz Ratio of Distribution of Persons by
MPCE (URP) MPCE (MRP) MPCE (MMRP)Andhra Pradesh 0.278 0.269 0.261Arunachal Pradesh 0.333 0.293 0.313Assam 0.244 0.219 0.219Bihar 0.225 0.215 0.206Chhattisgarh 0.276 0.234 0.234Delhi 0.253 0.247 0.271Goa 0.215 0.220 0.195Gujarat 0.254 0.252 0.236Haryana 0.301 0.277 0.272Himachal Pradesh 0.306 0.282 0.262Jammu & Kashmir 0.234 0.218 0.216Jharkhand 0.240 0.212 0.224Karnataka 0.234 0.232 0.241Kerala 0.417 0.350 0.318Madhya Pradesh 0.292 0.276 0.277Maharashtra 0.268 0.244 0.232Manipur 0.173 0.159 0.158Meghalaya 0.201 0.170 0.178Mizoram 0.237 0.195 0.198Nagaland 0.186 0.183 0.172Odisha 0.261 0.248 0.249Punjab 0.289 0.285 0.284Rajasthan 0.225 0.213 0.242Sikkim 0.275 0.260 0.256Tamil Nadu 0.264 0.256 0.255Tripura 0.204 0.197 0.206Uttar Pradesh 0.263 0.231 0.229Uttarakhand 0.356 0.438 0.421West Bengal 0.238 0.220 0.221A & N Islands 0.244 0.254 0.246Chandigarh 0.187 0.343 0.193Dadra & N. Haveli 0.205 0.218 0.220Daman & Diu 0.304 0.301 0.239Lakshadweep 0.327 0.322 0.237Puducherry 0.308 0.252 0.212All India 0.291 0.276 0.270
MPCE: Monthly per Capita Expenditure.URP: Uniform Recall Period; MRP: Mixed Recall Period;MMRP: Modified Mixed Reference Period.Source : GOI, NSSO, Household Consumer Expenditure in India, 66th Round, July 2009-June 2010, Report No.538.

Socio-Economic Characteristics 107
Table 2.50 (a): Consumer Price Index Numbers (General) for Agricultural And Rural Labourers – 2016 (Base 1986-87=100)
S.No. State
Agricultural Labourers Aug. 2016
Agricultural Labourers Sept. 2016
Rural Labourers Aug. 2016
Rural Labourers Sept. 2016
1 Andhra Pradesh 950 952 945 948
2 Assam 802 816 812 826
3 Bihar 721 721 725 724
4 Gujarat 873 882 874 883
5 Haryana 972 972 967 968
6 Himachal Pradesh 724 724 767 767
7 Jammu & Kashmir 826 825 829 825
8 Karnataka 1027 1040 1018 1030
9 Kerala 944 941 949 947
10 Madhya Pradesh 782 780 807 805
11 Maharashtra 937 940 932 935
12 Manipur 838 837 841 841
13 Meghalaya 841 843 844 845
14 Odisha 733 735 735 737
15 Punjab 940 943 939 943
16 Rajasthan 961 956 948 944
17 Tamil Nadu 964 981 956 972
18 Tripura 754 757 748 752
19 Uttar Pradesh 789 785 791 787
20 West Bengal 765 774 778 786
All India 866 870 872 876
Source : http://labourbureau.nic.in/indnum.htm.

108 Rural Development Statistics
Tabl
e 2.
50 (b
): St
ate-
wis
e Co
nsum
er P
rice
Inde
x Nu
mbe
rs fo
r Agr
icul
tura
l Lab
oure
rs(B
ase
Year
: 198
6-87
= 1
00)
S. No.
Stat
e20
07-0
820
08-0
920
09-1
020
10-1
120
11-1
2
Gen
eral
Food
Gen
eral
Food
Gen
eral
Food
Gen
eral
Food
Gen
eral
Food
1.An
dhra
Pra
desh
422
431
471
488
526
545
575
599
654
664
2.As
sam
409
399
441
438
498
499
546
551
609
608
3.Bi
har
403
400
437
434
481
474
549
503
545
519
4.G
ujar
at42
143
144
745
651
152
656
359
861
263
45.
Hary
ana
435
457
485
516
551
597
616
663
675
706
6.Hi
mac
hal P
rade
sh37
538
739
841
043
645
447
249
650
151
67.
Jam
mu
& Ka
shm
ir40
841
944
045
649
551
654
257
759
763
38.
Karn
atak
a39
839
444
545
150
952
155
357
364
965
79.
Kera
la39
238
244
444
247
647
252
653
359
459
310
.M
adhy
a Pr
ades
h40
341
144
645
950
452
354
456
260
259
911
.M
ahar
asht
ra42
343
746
448
453
055
758
361
567
670
412
.M
anip
ur35
134
039
537
343
741
948
647
957
855
013
.M
egha
laya
431
427
470
477
528
544
551
560
617
619
14.
Odi
sha
390
380
429
421
477
471
514
506
553
528
15.
Punj
ab43
744
948
851
055
559
060
264
460
669
816
.Ra
jast
han
432
430
475
475
546
559
584
596
653
633
17.
Tam
il Nad
u39
335
844
441
549
045
453
550
459
453
818
.Tr
ipur
a40
239
142
542
345
745
947
848
253
354
419
.Ut
tar P
rade
sh42
643
646
046
651
453
454
556
758
658
520
.W
est B
enga
l38
536
842
441
147
145
253
752
658
355
1Al
l-Ind
ia40
940
645
045
250
545
155
055
861
160
2
Sour
ce: G
OI,
CSO
, Mon
thly
Abst
ract
of S
tatis
tics,
Vol
ume
65, J
uly-
Dece
mbe
r 201
2.
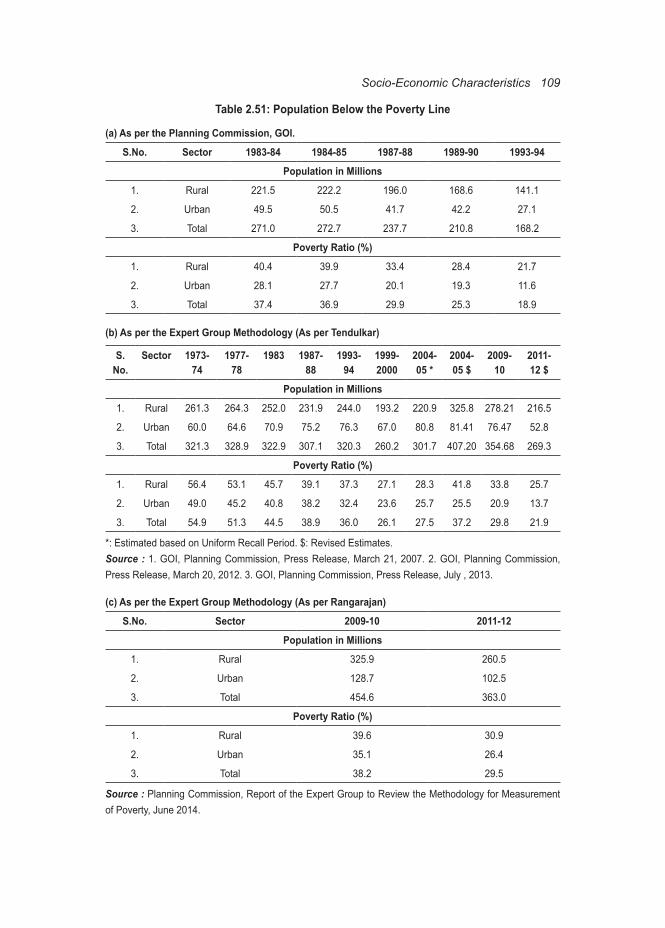
Socio-Economic Characteristics 109
Table 2.51: Population Below the Poverty Line
(a) As per the Planning Commission, GOI.
S.No. Sector 1983-84 1984-85 1987-88 1989-90 1993-94
Population in Millions
1. Rural 221.5 222.2 196.0 168.6 141.1
2. Urban 49.5 50.5 41.7 42.2 27.1
3. Total 271.0 272.7 237.7 210.8 168.2
Poverty Ratio (%)
1. Rural 40.4 39.9 33.4 28.4 21.7
2. Urban 28.1 27.7 20.1 19.3 11.6
3. Total 37.4 36.9 29.9 25.3 18.9
(b) As per the Expert Group Methodology (As per Tendulkar)
S.No.
Sector 1973-74
1977-78
1983 1987-88
1993-94
1999-2000
2004-05 *
2004-05 $
2009-10
2011-12 $
Population in Millions
1. Rural 261.3 264.3 252.0 231.9 244.0 193.2 220.9 325.8 278.21 216.5
2. Urban 60.0 64.6 70.9 75.2 76.3 67.0 80.8 81.41 76.47 52.8
3. Total 321.3 328.9 322.9 307.1 320.3 260.2 301.7 407.20 354.68 269.3
Poverty Ratio (%)
1. Rural 56.4 53.1 45.7 39.1 37.3 27.1 28.3 41.8 33.8 25.7
2. Urban 49.0 45.2 40.8 38.2 32.4 23.6 25.7 25.5 20.9 13.7
3. Total 54.9 51.3 44.5 38.9 36.0 26.1 27.5 37.2 29.8 21.9
*: Estimated based on Uniform Recall Period. $: Revised Estimates. Source : 1. GOI, Planning Commission, Press Release, March 21, 2007. 2. GOI, Planning Commission, Press Release, March 20, 2012. 3. GOI, Planning Commission, Press Release, July , 2013.
(c) As per the Expert Group Methodology (As per Rangarajan)
S.No. Sector 2009-10 2011-12
Population in Millions
1. Rural 325.9 260.5
2. Urban 128.7 102.5
3. Total 454.6 363.0
Poverty Ratio (%)
1. Rural 39.6 30.9
2. Urban 35.1 26.4
3. Total 38.2 29.5
Source : Planning Commission, Report of the Expert Group to Review the Methodology for Measurement of Poverty, June 2014.

110 Rural Development Statistics
Ta
ble
2.52
: Sta
te-s
peci
fic P
over
ty L
ines
– R
ural
( ` P
er C
apita
Per
Mon
th)
S.No
.St
ate/
UT19
73-7
419
8319
93-9
419
99-2
000
2004
-05
2004
-05
$20
09-1
020
11-1
2 *
2011
-12
@
1.An
dhra
Pra
desh
41.7
72.7
163.
0226
2.94
292.
2543
3.43
693.
8086
0.00
1031
.74
2.Ar
unac
hal P
rade
sh49
.898
.323
2.05
365.
4338
7.64
547.
1477
3.70
930.
0011
51.0
1
3.As
sam
49.8
98.3
232.
0536
5.43
387.
6447
8.00
691.
7082
8.00
1006
.66
4.Bi
har
57.7
97.5
212.
1633
3.07
354.
3643
3.43
655.
6077
8.00
971.
28
5.G
oa50
.588
.219
4.94
318.
6336
2.25
608.
7693
1.00
1090
.00
1200
.60
6.Ch
hatti
sgar
h--
----
--32
2.41
398.
9261
7.30
738.
0091
1.80
7.G
ujar
at47
.183
.320
2.11
318.
9435
3.93
501.
5872
5.90
932.
0011
02.8
3
8.Ha
ryan
a50
.088
.623
3.79
362.
8141
4.76
529.
4279
1.60
1015
.00
1127
.82
9.Hi
mac
hal P
rade
sh50
.088
.623
3.79
367.
4539
4.28
520.
4070
8.00
913.
0010
66.6
0
10.
Jam
mu
& Ka
shm
ir46
.691
.821
3.83
367.
4539
1.26
522.
3072
2.90
891.
0010
44.4
8
11.
Jhar
khan
d--
----
--36
6.56
404.
7961
6.80
748.
0090
4.02
12.
Karn
atak
a47
.283
.318
6.63
309.
5932
4.17
417.
8462
9.40
902.
0097
5.43
13.
Kera
la51
.799
.424
3.84
374.
7943
0.12
537.
3177
5.30
1018
.00
1054
.03
14.
Mad
hya
Prad
esh
50.2
83.6
193.
1031
1.34
327.
7840
8.41
631.
9077
1.00
941.
70
15.
Mah
aras
htra
50.5
88.2
194.
9431
8.63
362.
2548
4.89
743.
7096
7.00
1078
.34
16.
Man
ipur
49.8
88.3
232.
0536
5.43
387.
6457
8.11
871.
0011
18.0
011
85.1
9
17.
Meg
hala
ya49
.888
.323
2.05
365.
4338
7.64
503.
3268
6.90
888.
0011
10.6
7
18.
Mizo
ram
49.8
88.3
232.
0536
5.43
387.
6463
9.27
850.
0010
66.0
012
31.0
3
19.
Naga
land
49.8
88.3
232.
0536
5.43
387.
6468
7.30
1016
.80
1270
.00
1229
.83
20.
Odi
sha
46.9
106.
319
4.03
323.
9232
5.79
407.
7856
7.10
695.
0087
6.42
(Con
td...
)

Socio-Economic Characteristics 111
S.No
.St
ate/
UT19
73-7
419
8319
93-9
419
99-2
000
2004
-05
2004
-05
$20
09-1
020
11-1
2 *
2011
-12
@
21.
Punj
ab50
.088
.623
3.79
362.
6841
0.38
543.
5183
0.00
1054
.00
1127
.48
22.
Raja
stha
n51
.080
.221
5.89
344.
0337
4.57
478.
0075
5.00
905.
0010
35.9
7
23.
Sikk
im49
.898
.323
2.05
365.
4338
7.64
531.
5072
8.90
930.
0011
26.2
5
24.
Tam
il Nad
u45
.196
.219
6.53
307.
6435
1.86
441.
6963
9.00
880.
0010
81.9
4
25.
Trip
ura
49.8
98.3
232.
0536
5.43
387.
6445
0.49
663.
4079
8.00
935.
52
26.
Utta
rakh
and
----
----
478.
0248
6.24
719.
5088
0.00
1014
.95
27.
Utta
r Pra
desh
49.8
83.9
213.
0133
6.88
365.
8443
5.14
663.
7076
8.00
889.
82
28.
Wes
t Ben
gal
54.5
105.
622
0.74
350.
1738
2.82
445.
3864
3.20
783.
0093
4.10
UTs
29.
A &
N Is
land
s45
.196
.219
6.53
307.
64--
----
880.
0013
14.9
8
30.
Chan
diga
rh51
.810
1.4
253.
6138
8.15
----
--10
54.0
013
03.1
7
31.
D &
N Ha
veli
--88
.219
4.94
318.
6336
2.35
----
967.
0010
08.3
9
32.
Dam
an &
Diu
50.5
88.2
194.
9431
8.63
----
--10
90.0
012
00.6
0
33.
Delh
i50
.088
.623
3.79
362.
68--
541.
3974
7.80
1145
.00
1492
.46
34.
Laks
hadw
eep
51.7
99.4
243.
8437
4.79
----
--10
18.0
013
27.7
7
35.
Pudu
cher
ry45
.196
.219
6.53
307.
64--
385.
4564
1.00
1301
.00
1130
.10
All-I
ndia
*49
.63
89.5
205.
8432
7.56
356.
3044
6.68
672.
8081
6.00
972.
00
$: R
evise
d Es
timat
es. *
: Ten
dulka
r Com
mitt
ee @
: Ran
gara
jan
Com
mitt
eeSo
urce
: Pl
anni
ng C
omm
issio
n, R
epor
t of t
he E
xper
t Gro
up to
Rev
iew
the
Met
hodo
logy
for M
easu
rem
ent o
f Pov
erty,
Jun
e 20
14
Tabl
e 2.
52: (
Cont
d..)

112 Rural Development Statistics
Tabl
e 2.
53: S
tate
-wis
e Nu
mbe
r and
Per
cent
age
of P
opul
atio
n Be
low
Pov
erty
Lin
e (R
anga
raja
n M
etho
dolo
gy) i
n In
dia
(201
1-12
)
Stat
e/UT
Rura
lUr
ban
Com
bine
d%
Age
of
Per
sons
No. o
f Poo
r Pe
rson
s (L
akhs
)%
Age
of
Per
sons
No. o
f Poo
r Pe
rson
s (L
akhs
)%
Age
of
Pers
ons
No. o
f Poo
r Pe
rson
s (L
akhs
)An
dhra
Pra
desh
12.7
71.5
15.6
45.7
13.7
117.
3Ar
unac
hal P
rade
sh39
.34.
330
.91.
037
.45.
3As
sam
42.0
114.
134
.215
.440
.912
9.5
Biha
r40
.137
6.8
50.8
61.4
41.3
438.
1Ch
hatti
sgar
h49
.297
.943
.726
.947
.912
4.8
Delh
i11
.90.
515
.726
.315
.626
.7G
oa1.
40.
19.
10.
86.
30.
9G
ujar
at31
.410
9.8
22.2
58.9
27.4
168.
8Ha
ryan
a11
.018
.415
.314
.012
.532
.4Hi
mac
hal P
rade
sh11
.16.
98.
80.
610
.97.
5Ja
mm
u &
Kash
mir
12.6
11.7
21.6
7.6
15.1
19.3
Jhar
khan
d45
.911
7.0
31.3
25.5
42.4
142.
5Ka
rnat
aka
19.8
74.8
25.1
60.9
21.9
135.
7Ke
rala
7.3
12.3
15.3
26.0
11.3
38.3
Mad
hya
Prad
esh
45.2
241.
442
.186
.344
.332
7.8
Mah
aras
htra
22.5
139.
917
.088
.420
.022
8.3
Man
ipur
34.9
6.7
73.4
6.3
46.7
12.9
Meg
hala
ya26
.36.
416
.71.
024
.43.
1M
izora
m33
.71.
821
.51.
227
.42.
8Na
gala
nd6.
10.
832
.11.
914
.019
5.0
Odi
sha
47.8
169.
036
.326
.045
.931
.6Pu
njab
7.4
12.9
17.6
18.7
11.3
151.
5 (Con
td...
)

Socio-Economic Characteristics 113
Stat
e/UT
Rura
lUr
ban
Com
bine
d%
Age
of
Per
sons
No. o
f Poo
r Pe
rson
s (L
akhs
)%
Age
of
Per
sons
No. o
f Poo
r Pe
rson
s (L
akhs
)%
Age
of
Pers
ons
No. o
f Poo
r Pe
rson
s (L
akhs
)Ra
jast
han
21.4
112.
022
.539
.521
.71.
1Si
kkim
20.0
0.9
11.7
0.2
17.8
163.
9Ta
mil N
adu
24.3
91.1
20.3
72.8
22.4
9.3
Trip
ura
22.5
6.1
31.3
3.2
24.9
809.
1Ut
tara
khan
d12
.68.
929
.59.
417
.818
.4Ut
tar P
rade
sh38
.160
0.9
45.7
208.
239
.880
9.1
Wes
t Ben
gal
30.1
188.
629
.086
.829
.727
5.4
Pudu
cher
ry5.
90.
28.
60.
77.
71.
0An
dam
an &
Nico
bar I
sland
s6.
60.
24.
90.
16.
00.
2Ch
andi
garh
12.0
0.0
21.5
2.3
21.3
2.3
Dadr
a &
Naga
r Hav
eli
55.2
1.0
15.3
0.3
35.6
1.3
Dam
an &
Diu
0.0
0.0
17.6
0.4
13.7
0.4
Laks
hadw
eep
0.6
0.0
7.9
0.0
6.5
0.0
Indi
a30
.926
05.2
26.4
1024
.729
.536
29.9
Note
:1.
Po
pula
tion
as o
n 1st
Mar
ch 2
012
has
been
use
d fo
r est
imat
ing
num
ber o
f per
sons
bel
ow p
over
ty lin
e (2
011
Cens
us p
opul
atio
n ex
trapo
late
d).
2.
Pove
rty L
ine
Tam
il Nad
u ha
s be
en u
sed
for A
ndam
an a
nd N
icoba
r Isla
nd.
3.
Urba
n Po
verty
Lin
e of
Pun
jab
has
been
use
d fo
r bot
h ru
ral a
nd u
rban
are
as o
f Cha
ndig
arh.
4.
Po
verty
Lin
e of
Mah
aras
htra
has
bee
n us
ed fo
r Dad
ra a
nd N
agar
Hav
eli.
5.
Pove
rty L
ine
of G
oa h
as b
een
used
for D
aman
and
Diu
.6.
Po
verty
Lin
e of
Ker
ala
has
been
use
d fo
r Lak
shad
weep
.So
urce
: Pl
anni
ng C
omm
issio
n, R
epor
t of t
he E
xper
t Gro
up to
Rev
iew
the
Met
hodo
logy
for M
easu
rem
ent o
f Pov
erty,
Jun
e 20
14.
Tabl
e 2.
53: (
Cont
d...)

114 Rural Development Statistics
Tabl
e 2.
54: S
tate
-wis
e Nu
mbe
r and
Per
cent
age
of P
opul
atio
n Be
low
Pov
erty
Lin
e (T
endu
lkar
Met
hodo
logy
) in
Indi
a (2
011-
12)
Stat
e/UT
Rura
lUr
ban
Com
bine
d%
Age
of
Pers
ons
No. o
f Poo
r Pe
rson
s (L
akhs
)%
Age
of
Pers
ons
No. o
f Poo
r Pe
rson
s (L
akhs
)%
Age
of
Pers
ons
No. o
f Poo
r P
erso
ns (L
akhs
)An
dhra
Pra
desh
10.9
661
.80
5.81
16.9
89.
2078
.78
Arun
acha
l Pra
desh
38.9
34.
2520
.33
0.66
34.6
74.
91As
sam
33.8
992
.06
20.4
99.
2131
.98
101.
27Bi
har
34.0
632
0.40
31.2
337
.75
33.7
435
8.15
Chha
ttisg
arh
44.6
188
.90
24.7
515
.22
39.9
310
4.11
Delh
i12
.92
0.50
9.84
16.4
69.
9116
.96
Goa
6.81
0.37
4.09
0.38
5.09
0.75
Guj
arat
21.5
475
.35
10.1
426
.88
16.6
310
2.23
Hary
ana
11.6
419
.42
10.2
89.
4111
.16
28.8
3Hi
mac
hal P
rade
sh8.
485.
294.
330.
308.
065.
59Ja
mm
u &
Kash
mir
11.5
410
.73
7.20
2.53
10.3
513
.27
Jhar
khan
d40
.84
104.
0924
.83
20.2
436
.96
124.
33Ka
rnat
aka
24.5
392
.80
15.2
536
.96
20.9
112
9.76
Kera
la9.
1415
.48
4.97
8.46
7.05
23.9
5M
adhy
a Pr
ades
h35
.74
190.
9521
.00
43.1
031
.65
234.
06M
ahar
asht
ra24
.22
150.
569.
1247
.36
17.3
519
7.92
Man
ipur
38.8
07.
4532
.59
2.78
36.8
910
.22
Meg
hala
ya12
.53
3.04
9.26
0.57
11.8
73.
61M
izora
m35
.43
1.91
6.36
0.37
20.4
02.
27Na
gala
nd19
.93
2.76
16.4
81.
0018
.88
3.76
Odi
sha
35.6
912
6.14
17.2
912
.39
32.5
913
8.53
Punj
ab7.
6613
.35
9.24
9.82
8.26
23.1
8 (Con
td...
)

Socio-Economic Characteristics 115
Stat
e/UT
Rura
lUr
ban
Com
bine
d%
Age
of
Pers
ons
No. o
f Poo
r Pe
rson
s (L
akhs
)%
Age
of
Pers
ons
No. o
f Poo
r Pe
rson
s (L
akhs
)%
Age
of
Pers
ons
No. o
f Poo
r P
erso
ns (L
akhs
)Ra
jast
han
16.0
584
.19
10.6
918
.73
14.7
110
2.92
Sikk
im9.
850.
453.
660.
068.
190.
51Ta
mil N
adu
15.8
359
.23
6.54
23.4
011
.28
82.6
3Tr
ipur
a16
.53
4.49
7.42
0.75
14.0
55.
24Ut
tara
khan
d11
.62
8.25
10.4
83.
3511
.26
11.6
0Ut
tar P
rade
sh30
.40
479.
3526
.06
118.
8429
.43
598.
19W
est B
enga
l22
.52
141.
1414
.66
43.8
319
.98
184.
98Pu
duch
erry
17.0
60.
696.
300.
559.
691.
24An
dam
an &
Nico
bar I
sland
s1.
570.
040.
000.
001.
000.
04Ch
andi
garh
1.64
0.00
422
.31
2.34
21.8
12.
35Da
dra
& Na
gar H
avel
i62
.59
1.15
15.3
80.
2839
.31
1.43
Dam
an &
Diu
0.00
0.00
12.6
20.
269.
860.
26La
ksha
dwee
p0.
000.
003.
440.
022.
770.
02In
dia
25.7
021
66.5
813
.70
531.
2521
.92
2697
.83
Note
:1.
Po
pula
tion
as o
n 1st
Mac
h 20
12 h
as b
een
used
for e
stim
atin
g nu
mbe
r of p
erso
ns b
elow
pov
erty
line
(201
1 Ce
nsus
pop
ulat
ion
extra
pola
ted)
.2.
Po
verty
Lin
e Ta
mil N
adu
has
been
use
d fo
r And
aman
and
Nico
bar I
sland
.3.
Ur
ban
Pove
rty lin
e of
Pun
jab
has
been
use
d fo
r bot
h ru
ral a
nd u
rban
are
as o
f Cha
ndig
arh.
4.
Po
verty
Lin
e of
Mah
aras
htra
has
bee
n us
ed fo
r Dad
ra a
nd N
agar
Hav
eli.
5.
Pove
rty L
ine
of G
oa h
as b
een
used
for D
aman
and
Diu
.6.
Po
verty
Lin
e of
Ker
ala
has
been
use
d fo
r Lak
shad
weep
.So
urce
: G
OI,
Plan
ning
Com
miss
ion.
, Jul
y 20
13.
Tabl
e 2.
54: (
Cont
d...)

116 Rural Development Statistics
Table 2.55: State-wise Number and Percentage of Population Below Poverty Line in India (2009-10) (Tendulkar Methodology)
State/UT
Rural Urban Combined% Age
of Persons
No. of Poor Persons (Lakhs)
% age of
Persons
No. of Poor Persons (Lakhs)
% Age of
Persons
No. of Poor Persons (Lakhs)
Andhra Pradesh 22.8 127.9 17.7 48.7 21.1 176.6Arunachal Pradesh 26.2 2.7 24.9 0.8 25.9 3.5Assam 39.9 105.3 26.1 11.2 37.9 116.4Bihar 55.3 498.7 39.4 44.8 53.5 543.5Chhattisgarh 56.1 108.3 23.8 13.6 48.7 121.9Delhi 7.7 0.3 14.4 22.9 14.2 23.3Goa 11.5 0.6 6.9 0.6 8.7 1.3Gujarat 26.7 91.6 17.9 44.6 23.0 136.2Haryana 18.6 30.4 23.0 19.6 20.1 50.0Himachal Pradesh 9.1 5.6 12.6 0.9 9.5 6.4Jammu & Kashmir 8.1 7.3 12.8 4.2 9.4 11.5Jharkhand 41.6 102.2 31.1 24.0 39.1 126.2Karnataka 26.1 97.4 19.6 44.9 23.6 142.3Kerala 12.0 21.6 12.1 18.0 12.0 39.6Madhya Pradesh 42.0 216.9 22.9 44.9 36.7 261.8Maharashtra 29.5 179.8 18.3 90.9 24.5 270.8Manipur 47.4 8.8 46.4 3.7 47.1 12.5Meghalaya 15.3 3.5 24.1 1.4 17.1 4.9Mizoram 31.1 1.6 11.5 0.6 21.1 2.3Nagaland 19.3 2.8 25.0 1.4 20.9 4.1Odisha 39.2 135.5 25.9 17.7 37.0 153.2Punjab 14.6 25.1 18.1 18.4 15.9 43.5Rajasthan 26.4 133.8 19.9 33.2 24.8 167.0Sikkim 15.5 0.7 5.0 0.1 13.1 0.8Tamil Nadu 21.2 78.3 12.8 43.5 17.1 121.8Tripura 19.8 5.4 10.0 0.9 17.4 6.3Uttar Pradesh 39.4 600.6 31.7 137.3 37.7 737.9Uttarakhand 14.9 10.3 25.2 7.5 18.0 17.9West Bengal 28.8 177.8 22.0 62.5 26.7 240.3Andaman & Nicobar Islands
0.4 0.01 0.3 0.004 0.4 0.01
Chandigarh 10.3 0.03 9.2 0.92 9.2 0.95Dadra & Nagar Haveli 55.9 1.02 17.7 0.25 39.1 1.27Daman & Diu 34.2 0.22 33.0 0.54 33.3 0.75Lakshadweep 22.2 0.03 1.7 0.01 6.8 0.04Puducherry 0.2 0.0 1.6 0.1 1.2 0.1India 33.8 2782.1 20.9 764.7 29.8 3546.8
Source : GOI, Planning Commission, Press Release, March 20, 2012.

Socio-Economic Characteristics 117
Table 2.56: State-wise Number and Percentage of Population Below Poverty Line (Tendulkar Methodology) in India (2004-05)
State/UT
Rural Urban Combined% Age
of Persons
No. of Poor Persons (Lakhs)
% Age of
Persons
No. of Poor Persons (Lakhs)
% Age of
Persons
No. of Poor Persons (Lakhs)
Andhra Pradesh 32.3 180 23.4 55 29.6 235.1Arunachal Pradesh 33.6 3.2 23.5 0.6 31.4 3.8Assam 36.4 89.4 21.8 8.3 34.4 97.7Bihar 55.7 451 43.7 42.8 54.4 493.8Chhattisgarh 55.1 97.8 28.4 13.7 49.4 111.5Delhi 15.6 1.1 12.9 18.3 13.0 19.3Goa 28.1 1.8 22.2 1.7 24.9 3.4Gujarat 39.1 128.5 20.1 42.9 31.6 171.4Haryana 24.8 38.8 22.4 15.9 24.1 54.6Himachal Pradesh 25.0 14.3 4.6 0.3 22.9 14.6Jammu & Kashmir 14.1 11.6 10.4 2.9 13.1 14.5Jharkhand 51.6 116.2 23.8 16.0 45.3 132.1Karnataka 37.5 134.7 25.9 51.8 33.3 186.5Kerala 20.2 42.2 18.4 19.8 19.6 62.0Madhya Pradesh 53.6 254.4 35.1 61.3 48.6 315.7Maharashtra 47.9 277.8 25.6 114.6 38.2 392.4Manipur 39.3 6.7 34.5 2.3 37.9 9.0Meghalaya 14.0 2.9 24.7 1.2 16.1 4.1Mizoram 23.0 1.1 7.9 0.4 15.4 1.5Nagaland 10.0 1.5 4.3 0.2 8.8 1.7Odisha 60.8 198.8 37.6 22.8 57.2 221.6Punjab 22.1 36.7 18.7 16.9 20.9 53.6Rajasthan 35.8 166.4 29.7 43.5 34.4 209.8Sikkim 31.8 1.5 25.9 0.2 30.9 1.7Tamil Nadu 37.5 134.4 19.7 59.7 29.4 194.1Tripura 44.5 11.9 22.5 1.5 40.0 13.4Uttar Pradesh 42.7 600.5 34.1 130.1 40.9 730.7Uttarakhand 35.1 23.1 26.2 6.6 32.7 29.7West Bengal 38.2 227.5 24.4 60.8 34.2 288.3Andaman & Nicobar Islands
4.1 0.1 0.8 0.01 3.0 0.11
Chandigarh 34.7 0.2 10.1 0.9 11.6 1.1Dadra & Nagar Haveli 63.6 1.11 17.8 0.14 49.3 1.26Daman & Diu 2.6 0.02 14.4 0.13 8.8 0.15Lakshadweep 0.4 0.001 10.5 0.04 6.4 0.04Puducherry 22.9 0.8 9.9 0.7 14.2 1.5India 42.0 3258.10 25.5 814.10 37.20 4072.20
Source : GOI, Planning Commission, Press Release, March 21, 2007, Tendulkar’s Group Report, November 2009.

118 Rural Development Statistics
Table 2.57: State Human Development Index (HDI)-1999-2000 and 2007-08
S.No. State HDI 1999-2000
HDI 2007-08
Rank 1999-2000
Rank 2007-08
1. Kerala 0.677 0.790 2 12. Delhi 0.783 0.750 1 23. Himachal Pradesh 0.581 0.652 4 34. Goa 0.595 0.617 3 45. Punjab 0.543 0.605 5 56. NE (Excluding Assam) 0.473 0.573 9 67. Maharashtra 0.501 0.572 6 78. Tamil Nadu 0.480 0.570 8 89. Haryana 0.501 0.552 7 9
10. Jammu & Kashmir 0.465 0.529 11 1011. Gujarat 0.466 0.527 10 1112. Karnataka 0.432 0.519 12 1213. West Bengal 0.422 0.492 13 1314. Uttarakhand 0.339 0.490 16 1415. Andhra Pradesh 0.368 0.473 15 1516. Assam 0.336 0.444 17 1617. Rajasthan 0.387 0.434 14 1718. Uttar Pradesh 0.316 0.380 18 1819. Jharkhand 0.268 0.376 23 1920. Madhya Pradesh 0.285 0.375 20 2021. Bihar 0.292 0.367 19 2122. Odisha 0.275 0.362 22 2223. Chhattisgarh 0.278 0.358 21 2324. All India 0.387 0.467 - -
Source : GOI, Planning Commission, India Human Development Report 2011.
Table 2.58: Distribution of Households by Availability of Two Square Meals a Day (%)
S.No.
Members of the HHs getting two square meals a day
Rural
50th Round (1993-94)
55th Round (1999-2000)
61st Round (2004-05)
66th Round (2009-10)
1. Throughout the year 94.5 96.2 97.4 98.9
2. Only some months of the year 4.2 2.6 2.0 0.9
3. In no month 0.9 0.7 0.4 0.2
3. Not Reported 0.4 0.5 0.2 -
4. All 100.0 100.0 100.0 100.0
5. Proportion of HHS reported inadequacy of food
69206 71385 79298 59097
Source : GOI, NSSO, Perceived Adequacy of Food Consumption in Indian Households, 2009-10 (July 2009 – June 2010), Report No. 547.

Socio-Economic Characteristics 119
Tab
le 2
.59:
Inci
denc
e of
Hun
ger i
n Ru
ral A
reas
– 2
009-
10 –
Sta
te-w
ise
(%)
S. No.
Stat
e/UT
s
Mem
bers
of t
he H
Hs g
ettin
g tw
o sq
uare
mea
ls e
very
day
2004
-05
2009
-10
Thro
ugho
ut
the
year
Onl
y so
me
mon
ths
of th
e ye
arNo
t eve
n so
me
mon
ths
Not
repo
rted
Thro
ugho
ut
the
year
Onl
y So
me
mon
ths
of th
e ye
arIn
no
mon
thAl
l(In
cl. N
R)
1.An
dhra
Pra
desh
99.3
0.60
0.00
0.10
99.5
0.5
0.1
100.
0
2.As
sam
94.0
1.70
3.60
0.60
98.7
1.2
0.1
100.
0
3.Bi
har
96.7
2.00
0.80
0.60
97.9
1.1
0.8
100.
0
4.Ch
hatti
sgar
h97
.42.
600.
000.
0099
.11.
00.
010
0.0
5.G
ujar
at99
.80.
300.
000.
0099
.90.
10.
010
0.0
6.Ha
ryan
a10
0.0
0.00
0.00
0.00
100.
00.
00.
010
0.0
7.Jh
arkh
and
99.3
0.60
0.10
0.00
99.6
0.2
0.0
100.
0
8.Ka
rnat
aka
99.7
0.30
0.00
0.00
99.9
0.1
0.0
100.
0
9.Ke
rala
97.5
2.20
0.30
0.10
99.5
0.5
0.0
100.
0
10.
Mad
hya
Prad
esh
97.9
1.50
0.50
0.00
99.1
0.4
0.0
100.
0
11.
Mah
aras
htra
99.0
1.00
0.00
0.00
99.5
0.2
0.3
100.
0
12.
Odi
sha
93.4
4.80
1.30
0.50
96.0
3.9
0.2
100.
0
13.
Punj
ab99
.10.
800.
100.
0099
.60.
40.
010
0.0
14.
Raja
stha
n99
.90.
000.
000.
0099
.80.
10.
010
0.0
15.
Tam
il Nad
u99
.80.
100.
100.
0010
0.0
0.0
0.0
100.
0
16.
Utta
r Pra
desh
98.1
1.40
0.30
0.30
99.3
0.6
0.0
100.
0
17.
Wes
t Ben
gal
88.0
10.6
1.30
0.20
95.4
3.8
0.6
100.
0
All I
ndia
97.4
2.0
0.4
0.2
98.9
0.9
0.2
100.
0
Sour
ce :
GO
I, NS
SO, P
erce
ived
Adeq
uacy
of F
ood
Cons
umpt
ion
in In
dian
Hou
seho
lds,
200
9-10
(Jul
y 20
09 –
Jun
e 20
10),
Repo
rt No
. 547
.