Embed Size (px)
Citation preview

Section 1
Introductions and Background

Section 2
Begin with the End in Mind
Create Your Personal Vision

Section 3
The Reliability Maturity Continuum
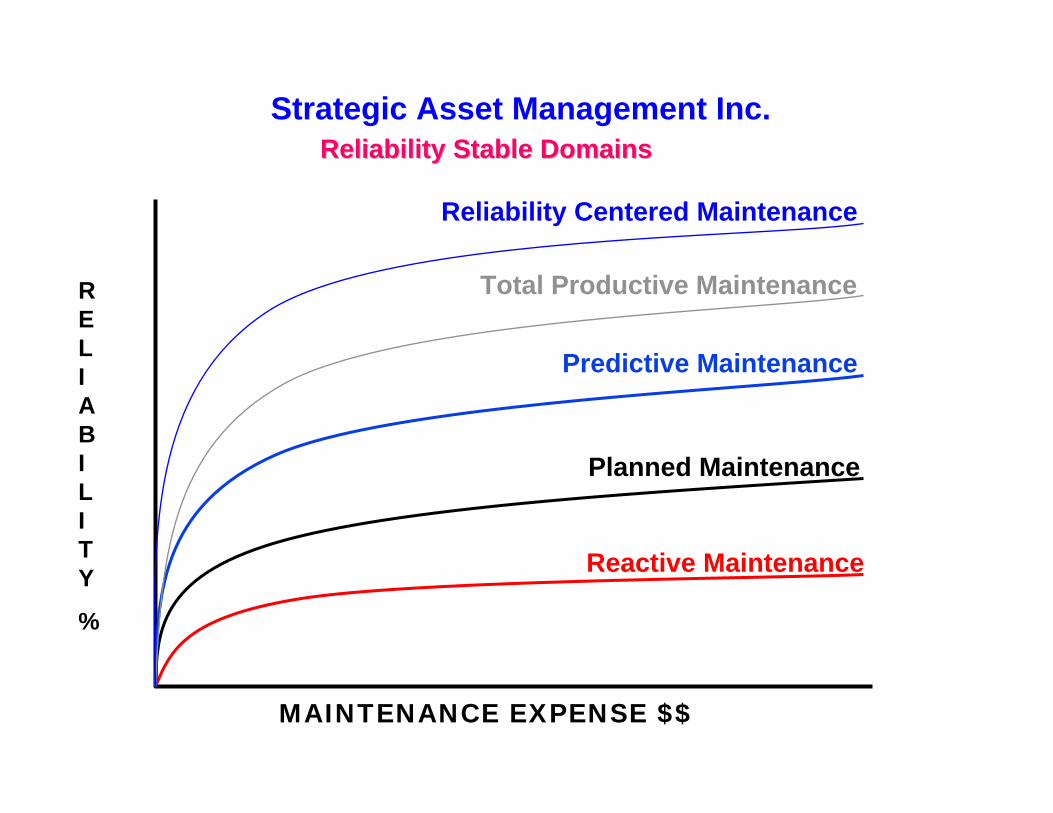
RELIABILITY
%
MAINTENANCE EXPENSE $$
Reactive Maintenance
Planned Maintenance
Predictive Maintenance
Reliability Centered Maintenance
Strategic Asset Management Inc.Reliability Stable DomainsReliability Stable Domains
Total Productive Maintenance

A Roadmap to Lasting Success . . . A Roadmap to Lasting Success . . . the Operational Reliability Maturity Continuum the Operational Reliability Maturity Continuum
•• Low PerformingLow Performing CompetentCompetent High PerformingHigh Performing• “Fires” determine priorities• Breakdowns frequent• Maintenance equates to repair• No work orders, plans, controls• Stores service levels low• Poor operator/maintenance relationships• Poor customer service levels
• Most work planned, scheduled• Preventive maintenance implemented• Trades competent at most repairs• Computerized work order system• Stores service levels fair• Operators prep for repairs• Expedited orders infrequent
• All work prioritized• PM hours and W.O.s exceed repairs• Maint. Mgmt. System utilized, integrated with
Purchasing, Stores• JIT Stores; 2x minimum turns• Operators inspect, create WOs• Turnarounds well planned, executed
• Condition-monitoring equipment purchased, installed
• Little analysis performed on data• No preventive action taken• No analysis done to identify candidate equipment• Benefit tracking anecdotal
• Condition-monitoring equipment installed, readings taken regularly
• Information analyzed, work orders created• Candidate equipment has high value to production• Rational cost/benefit analysis
• Condition-monitoring intervals based on risk analysis
• Predictive techniques minimize repair, out-of-service cost and time
• Proactive techniques employed (e.g., high quality filtration)
• PDM data integrated with CMMS
• Training emphasis disconnected from real work practices
• Quality Program ineffective in changing work behaviors
• “Team” implementation creates chaos• Anarchy replaces hierarchy
• Natural Work Teams perform most daily maintenance effectively
• Operators perform TPM activities• Some program integration (e.g., Quality, PSM, EPA,
ISO, RCare)• Crafts flexibility high priority• MX philosophy adopted (e.g., TPM)
• Work teams flexible, self-directed• Continuous improvement process embraced,
understood, working• Programs rationalized, integrated• Reward/Recognition support best results• Skills predominate over functions• All staff systems competent
• RCM implementation creates confusion, increased downtime
• Functional divisions prevent successful pooling of talent
• Pedantic rigor creates paralysis through analysis• Vendor reduction — lower service levels
• Failure analysis routine activity• High-value production processes assessed via RCM
techniques• Maintenance routines changed to increase value
impact• Reliability becomes focus — not maintenance
• Concurrent engineering employed to ensure lifecycle, maintainability
• Reporting systems tie reliability to financial results through OUE
• Complete equipment histories are used to trend and predict failures
• Vendors participate in reliability
• Executive and plant management fail to align and implement goals
• Market pressures make short-term decisions predominate
• Union recalcitrance makes high performance organization impossible
• Clear organizational alignment• Operational reliability is cross-functional
responsibility. Reliability built into purchasing, production, engineering
• Activity-based management implemented• Market impact of reliability valued
• Monitoring, process control, and information systems integrated. Automated, self-correcting process/equipment
• Life expectancy analysis, lifecycle extension reengineering done
• Automated, demand-driven plant production balancing implemented
StageStageClassClass
Stage 1Stage 1DailyDaily
MaintenanceMaintenance
Stage 2Stage 2ProactiveProactive
MaintenanceMaintenance
Stage 3Stage 3OrganizationalOrganizational
ExcellenceExcellence
Stage 4Stage 4EngineeredEngineeredReliabilityReliability
Stage 5Stage 5OperationalOperationalExcellenceExcellence

Planned Maintenance is the Foundation of Asset Management Excellence
Operational Operational ExcellenceExcellence
RCMRCM Equipment Equipment Simplification/Simplification/
StandardizationStandardization
ReliabilityReliabilityFocusFocus
Concurrent Concurrent Engineering Life Engineering Life
Cycle Cost Cycle Cost AnalysisAnalysis
Equipment Equipment AcquisitionAcquisitionReliabilityReliabilityAnalysisAnalysis
Craft Craft FlexibilityFlexibility
Maintenance/Maintenance/OperationsOperationsIntegrationIntegration
ExternalExternalversusversusInternalInternal
BenchmarkingBenchmarking
TPMTPMOperatorOperatorPerformedPerformedMaintenanceMaintenance
PreventivePreventiveMaintenanceMaintenance
Craft Skills Craft Skills EnhancementEnhancement
Computerized Computerized Maintenance Maintenance
Management SystemManagement System
Materials ManagementMaterials ManagementWork Initiation/Work Initiation/PrioritizaitonPrioritizaiton Planning & SchedulingPlanning & Scheduling Work Execution/ReviewWork Execution/Review
Equipment HistoryEquipment History
Stage1
Stage2
Stage3
Stage4
Stage5
Failure Mode AnalysisFailure Mode Analysis Proactive Proactive MaintenanceMaintenance
Condition Monitoring/Condition Monitoring/Failure PredictionFailure Prediction
PdM / CMMS IntegrationPdM / CMMS Integration
Work Management ProcessesWork Management ProcessesWork Management ProcessesWork Management Processes
Overall UnitOverall UnitEffectivenessEffectiveness
Customer Customer Reliability MarketingReliability Marketing

Typical Measures and Values of Vary with Each Stage Typical Measures and Values of Vary with Each Stage of Attainment of Reliability Maturityof Attainment of Reliability Maturity
Return on Return on Invested CapitalInvested Capital
> 14%> 14%
Failure Failure AnalysisAnalysis
80%80%OUE>80%OUE>80%
ReworkRework<10%<10%
First Pass First Pass Quality 99+%Quality 99+%
Maint Maint BudgetBudget
/RAV 2%/RAV 2%
MaintMaintHrlyHrly/ to / to
SupervisorSupervisor15:115:1
Operator Operator PerformedPerformed
MaintenanceMaintenance2020--40%40%
Average Average NumberNumber
of Tradesof Trades22--44
MaintMaintBudget/Budget/RAVRAV< 2.5< 2.5
Maintenance Budget/RAVMaintenance Budget/RAV33--4%4%
Work Order PlanningWork Order Planning70%70%--80%80%
Inventory TurnsInventory Turns11--22
RAV Maintained by CraftsmanRAV Maintained by Craftsman$4$4--6MM6MM
Work Order Ready BacklogWork Order Ready Backlog44--6 Weeks6 Weeks
Wrench TimeWrench Time44--5 Hours5 Hours
Preventive MaintenancePreventive Maintenance3030--40% of Work Hours40% of Work Hours
Preventive/Predictive Time Preventive/Predictive Time 40%40%
STAGE1
STAGE2
STAGE3
STAGE4
STAGE5
Estimating AccuracyEstimating Accuracy80% +/80% +/-- 10%10%
PM/PdM Schedule CompliancePM/PdM Schedule Compliance9090--95%95%
OvertimeOvertime55--10%10%
Maintenance Budget/RAVMaintenance Budget/RAV2.52.5--3%3%
Failure AnalysisFailure Analysis3030--50%50%

Operational Reliability Maturity Continuum Operational Reliability Maturity Continuum —— Self AssessmentSelf Assessment
•• Low PerformingLow Performing CompetentCompetent High PerformingHigh PerformingStageStageClassClass
Stage 1Stage 1DailyDaily
MaintenanceMaintenance
Stage 2Stage 2ProactiveProactive
MaintenanceMaintenance
Stage 3Stage 3OrganizationalOrganizational
ExcellenceExcellence
Stage 4Stage 4EngineeredEngineeredReliabilityReliability
Stage 5Stage 5OperationalOperationalExcellenceExcellence

Section 4
What is Asset Management?

Background
Industry is faced with unprecedented challenges. Commodity markets have been unable to raise prices for years, and all producers continue to lower fixed costs through technology and reengineering. Offshore competitors often have lower cost of capital, lower wages, newer plants and lower materials costs.
An Asset Management Strategy to maximize the value from physical assets will help heavy industry compete in this new environment
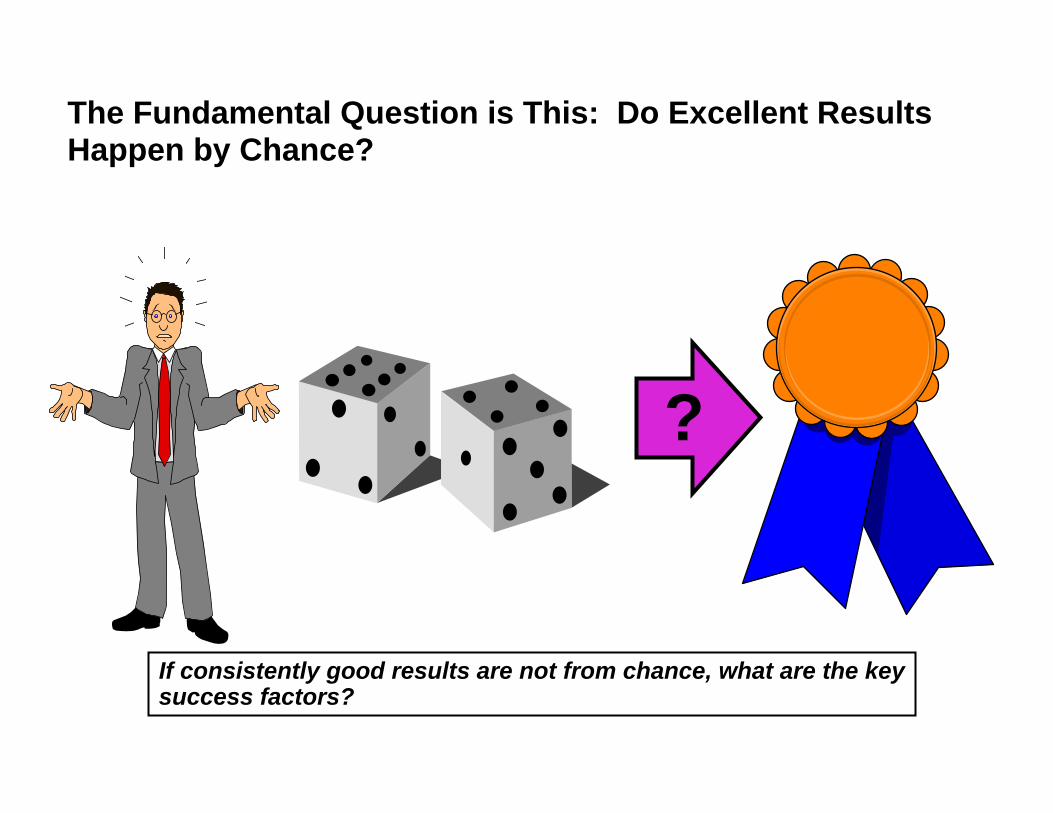
The Fundamental Question is This: Do Excellent Results Happen by Chance?
?
If consistently good results are not from chance, what are the keysuccess factors?

Functional Excellence Model
• Operations owns production, maintenance ownsequipment
• Maintenance excellence means efficient service(e.g. repairs) to production. A customer servicemodel dominated by operations. Most work isinside planning time horizon
• Repair efficiency is the best measure ofmaintenance performance. No time to do itright, but hope there is time to do it over
• Production runs at any cost. Don’t turnequipment over to maintenance as scheduled.
• Goals are set by functional managers, resulting incontradictory and self-defeatingreward/recognition practices. Most measure arelagging indicators, demonstrating past results
• Purchasing excellence means having the lowestcost of items available
• Pressure is on individuals to do better. Nogauges or tools of “better” exist
Asset Management Excellence Model
• Operations owns equipment and is responsible forequipment health
• Maintenance is a partnership with operations toidentify and work ways to improve equipment health
• Breakdowns represent an unacceptable managementsystem failure, and require failure analysis ofequipment and process
• Production insists on and participates in assuringprevention and improvement activities
• Goals are developed top-down in a cascaded fashion.Functions share lagging indicator goals (e.g. monthlyproduction), and have unique leading indictor goalsthat support activities (e.g. % of PM’s performed toschedule)
• Purchasing and inventory management’s highest goalis parts service level and MTBF is purchased parts
• Each piece of equipment has an operatingperformance specification, and gets the attentionnecessary for it

Asset Management Provides the Linkage Between An Organizations Objectives & the Activities to Achieve Them
Business Objectives• ROI/Profitability• Growth Objectives• Investment Plans• Changing Conditions• Markets
Current Operations• Assets & Condition• Operating Costs• Organization• Culture & Skills• Existing Systems
Facility Objectives
ProcessingUnit
Objectives
System Specifications
Sub-system Specifications
OperatingCost
Objectives
Reliability, Cost and Maintenance Strategies

What Is the Elements of the Asset Management Plan?Asset
ClassificationDevelop Training Programs:- Criticality- RCFA- Tap Root
Level of Maintenance Model
Maintenance StrategyEvaluation Model
Cost & Criticality System Model
Priority System Model
Asset Class Data Model
Measurement & AuditProcess
EEEllleeemmmeeennntttsss ooofffTTToootttaaalll AAAsssssseeettt
MMMaaannnaaagggeeemmmeeennnttt®MMM ooodddeeelll

The Essential Part of Asset Management is Implementation at the Unit or Production Level
Business Objectives• ROI/Profitability• Growth Objectives• Investment Plans• Changing Conditions• Markets
Current Operations• Assets & Condition• Operating Costs• Organization• Culture & Skills• Existing Systems
Facility Objectives
ProductionUnit
Objectives
System Specifications
Sub-system Specifications
OperatingCost
Objectives
Reliability, Cost and Maintenance Strategies
Unit Asset Management Plan

Total Asset Management Total Asset Management RR Process FlowProcess Flow
Prepare / UpdateAnnual
BusinessPlan
Prepare / UpdateAnnual
BusinessPlan
Prepare Units’Asset Mgmt
Model
Prepare Units’Asset Mgmt
Model
Prepare/ UpdateAnnual
Unit Objectives
Prepare/ UpdateAnnual
Unit Objectives
ReviseProduction
Targets
ReviseProduction
Targets
ContinuouslyManage
Work
ContinuouslyManage
Work

Prepare UnitsPrepare Units’’ Asset Management ModelAsset Management Model
Establish AssetHierarchy
Establish AssetHierarchy
EquipmentHierarchy
EquipmentHierarchy
Classify Process& Asset CriticalityClassify Process& Asset Criticality
Asset Criticality &Probability Classification
(Process & Equipment)
Asset Criticality &Probability Classification
(Process & Equipment)
AssetCriticality
Model
AssetCriticality
Model
EvaluatePriority
EquipmentCondition
EvaluatePriority
EquipmentCondition
Apply Maintenance
Strategy (Triage)
Apply Maintenance
Strategy (Triage)
EquipmentCondition
EquipmentCondition Reliability Problem
Solving MatrixReliability Problem
Solving Matrix
Levels of Maintenance
Model
Levels of Maintenance
Model

Enhance WorkerSkills
Enhance WorkerSkills
Continuously Manage Work
Operate Unit& PerformScheduled
Maintenance& Reliability
Tasks
Operate Unit& PerformScheduled
Maintenance& Reliability
Tasks
Measure Results (System
To TargetPlan)
Measure Results (System
To TargetPlan)
CMMSScheduleCMMS
Schedule
EvaluateResults,
Identify Gaps& Problem
Solve
EvaluateResults,
Identify Gaps& Problem
Solve
PerformMOC/MORPerform
MOC/MOR
MaintenanceActivities
MaintenanceActivities
CapitalPlan
CapitalPlan
OutageScheduleOutage
Schedule

Revise Production TargetsRevise Production Targets
PlantConditions Requiring
MOC/MOR
PlantConditions Requiring
MOC/MOR
RevisedMonthlyTarget
RevisedMonthlyTarget
RunReliability
Model
RunReliability
Model
RunLinear
Program
RunLinear
Program

Functional Excellence Model
• Operations owns production, maintenance ownsequipment
• Maintenance excellence means efficient service(e.g. repairs) to production. A customer servicemodel dominated by operations. Most work isinside planning time horizon
• Repair efficiency is the best measure ofmaintenance performance. No time to do itright, but hope there is time to do it over
• Production runs at any cost. Don’t have time toturn equipment over to maintenance asscheduled.
• Goals are set by functional managers, resulting incontradictory and self-defeatingreward/recognition practices. Most measure arelagging indicators, demonstrating past results
• Purchasing excellence means having the lowestcost of items available
• Pressure is on individuals to do better. Nogauges or tools of “better” exist
Asset Management Excellence Model
• Operations owns equipment and is responsible forequipment health
• Maintenance is a partnership with operations toidentify and work ways to improve equipment health
• Breakdowns represent an unacceptable managementsystem failure, and require failure analysis ofequipment and process
• Production insists on and participates in assuringprevention and improvement activities
• Goals are developed top-down in a cascaded fashion.Functions share lagging indicator goals (e.g. monthlyproduction), and have unique leading indictor goalsthat support activities (e.g. % of PM’s performed toschedule)
• Purchasing and inventory management’s highest goalis parts service level and MTBF is purchased parts
• Each piece of equipment has an operatingperformance specification, and gets the attentionnecessary for it

Section 5
Developing the Strategic Plan

Asset Management Strategy is Documented in a Plan, with These Characteristics
• Documents a shared vision of future state. Creates shared ownership.
• Identifies current situation.
• Identifies desired outcomes —quantitative/qualitative.
• Outlines business case.
• Outlines series of initiatives/projects over several years with approximate costs.
• Identifies structure, accountability, and responsibility.
• Contains specific targets in lead and lag indicators.
Strategic Plan
for Asset
Management
The only lasting value of a Strategic Plan for Asset Management is if it guides the change process successfully--leading to new behaviors by all.
The only lasting value of a Strategic Plan for Asset Management The only lasting value of a Strategic Plan for Asset Management is if it guides the is if it guides the change process successfullychange process successfully----leading to new behaviors by all.leading to new behaviors by all.

What Are the Critical Success Factors in Plan Development?
•• PeoplePeople MeasuresMeasures ProcessProcess
• Wide participation in development
• Ownership by all functions and management
• Understanding by each function of roles and contributions
• Crafts and operators understand and are measured on contribution
• Cascaded and aligned annual goals
• Lead and lag indicators
• Practical, useful, simple
• Change over time
• Clear benefits, with tracking and accountability
• Sponsorship and visibility at highest level
• Structure
• Accountability
• Integration with annual plan
Critical success factors include:Critical success factors include:
An additional success factor is to follow a proven model for growth--The Operational Reliability Maturity Continuum
An additional success factor is to follow a proven model for groAn additional success factor is to follow a proven model for growthwth----
The Operational Reliability Maturity ContinuumThe Operational Reliability Maturity Continuum

Some Approaches Tend to Work--and Others Tend Toward Failure!
Management must lead the planning effort..that way it will be understood, owned, and have the best chances of implementation.
Management must lead the planning effort..that way it will be unManagement must lead the planning effort..that way it will be understood, owned, derstood, owned, and have the best chances of implementation.and have the best chances of implementation.

A Management Steering Committee Participates in Plan Development in These Ways...
Learn what theLearn what theleaders are doing...leaders are doing...
Pick the best Pick the best strategies...strategies...
Identify the ValueIdentify the Valueof Change...of Change...
Strategic
Plan
Create the Plan...Create the Plan...
Lead the Change...Lead the Change... And Remember..TimeAnd Remember..TimeWaits for No Man...Waits for No Man...

The Strategic Plan Might Look Like This
Asset Management PlanAsset Management Plan
1. Summary• Activities• Findings• Opportunities• Costs• Proposal
2. Current Assessment3. Future Operations Vision for Our
Plant
4. InitiativesA. Work Process ImprovementB. Maintenance System
ImplementationC. PM/PdMD. Skills Development
5. Business Case
6. Plan and Resources Required
7. Structure, Accountability, Measures
8. Next Steps

Results of the Strategic Plan--We Identify Where We Are on the Reliability Maturity Continuum
LowLow CompComp HighHigh
11
22
33
44
55
A Stage I Competent PlantA Stage I Competent Plant
XX

We Set Out a Long-Range Plan of Action
With a FiveWith a Five--Year Asset Management PlanYear Asset Management Plan
1.1. Daily MaintenanceDaily Maintenance
19981998 19991999 2000 2000 20012001 20022002
2.2. Proactive MaintenanceProactive Maintenance
3.3. Organizational ExcellenceOrganizational Excellence
4.4. Reliability EngineeringReliability Engineering
5.5. Operational ExcellenceOperational Excellence XX XX XX XX
XX XX XX
XX
XX
XX XX XX XX
XX XX
XX XX XX XX
XX

Section 6
Developing the Business Case

One of the Critical Steps in the Plan is the Business Case--Identifying Costs and Benefits Available Through Improvement
••LaborLabor
••PrioritiesPriorities••OvertimeOvertime••Wrench TimeWrench Time••Capital Capital ProjectsProjects••Work Order Work Order ProcessProcess
ContractorsContractors
UseUseQualityQualityPerformancePerformanceAdministration Administration CostsCosts
StoresStores
Service LevelsService LevelsObsolete/SlowObsolete/SlowOrdering PolicyOrdering PolicyUsage AnalysisUsage AnalysisOrder Lead TimeOrder Lead TimeEquipment Equipment StandardsStandards
StructureStructure
Management Management LevelsLevelsRole/Resp.Role/Resp.DefinitionDefinitionSkills AdequacySkills AdequacySpan of ControlSpan of ControlVisionVision
CapacityCapacity
DowntimeDowntime•• ScheduledScheduled•• UnscheduledUnscheduledPMs/PdMsPMs/PdMsRevenue LossRevenue LossExcess WIP/FGExcess WIP/FG
OutagesOutages
Planning/PrepPlanning/Prep•• DurationDuration•• ExpenseExpenseExcess RebuildsExcess Rebuilds

The Plan Identifies the Opportunities We Intend to Capture
1.1. LaborLabor $ 2.00
2.2. ContractorsContractors 2.00
3.3. Parts & SuppliesParts & Supplies 0.75
4.4. Product Unit 1Product Unit 1 9.00
5.5. Product Unit 2Product Unit 2 16.50
$ 30.25M$ 30.25M
$30 million in benefits over 36 months$30 million in benefits over 36 months
OpportunitiesOpportunities(in $ millions)(in $ millions)

...As Well as the Costs and Bottom-Line Results
••Total BenefitsTotal Benefits•Costs ($M)
• 1. Equipment Upgrades
• 2. Consulting Services
• 3. Training
• 4. Restructuring
• 5. CMMS/PdM
••Total CostsTotal Costs
• Total Net BenefitsTotal Net Benefits
•Annual Return
19981998 19991999 20002000 TotalTotal
$ 6.3M$ 6.3M $ 9.85M$ 9.85M $ 14.1M$ 14.1M $ 30.25M$ 30.25M
.6 2.5 .8 3.9
1.2 .3 .3 1.8
.3 .3 .3 .9
.4 -- -- .4
.3 .6 .3 1.2
$$ 2.8M2.8M $ 3.7M$ 3.7M $ 1.7M$ 1.7M $ 8.2M$ 8.2M
$ 3.5M$ 3.5M $ 6.15M$ 6.15M $ 12.4M$ 12.4M $ 21.95M$ 21.95M
2.2:1 2.7:1 8.3:1 3.7:1

We Spread the Financial Gains into Achievable Goals for Each Year
•• Cost Reduction ($M)Cost Reduction ($M)
• Labor
• Contractors
• MRO
• Cost Reduction
•• Additional ProductAdditional Product
• Unit 1
– KLBS
– Profits ($ 0.20)
• Unit 2
– KLBS Cap
– Profits ($ 0.60)
Total BenefitsTotal Benefits
19981998 19991999 20002000 TotalTotal
$ 0.75 $ 1.00 $ 0.25 $ 2.00
$ 1.00 $ 0.50 $ 0.50 $ 2.00
($ 0.25) $ 0.75 $ 0.25 $ 0.75
$ 1.50M $ 2.25M $ 1.00M $ 4.75M
9,000 14,000 22,000 45,000
$ 1.8M $ 2.8M $ 4.4M $ 9.0M
5,000 8,000 14,500 27,500
$ 3.0M $ 4.8M $ 8.7M $ 16.5M
$ 6.3M$ 6.3M $ 9.85M$ 9.85M $ 14.1M$ 14.1M $ 30.25M$ 30.25M

Planned BenefitsPlanned Benefits
And Outline Annual Plans and Projects to Achieve our Financial Goals
Maintenance Management ProcessMaintenance Management Process ($0.25M) $0.2M
Equipment ManagementEquipment Management $4.8M (0.6+0.3+0.3) = 1.2M
ContractorsContractors $1.0M $0.10M
Work ManagementWork Management $0.75M $0.4M
Mobilization/Communications/TrainingMobilization/Communications/Training $0.0M (0.3 + 0.4 + 0.2) = $0.9M
TotalTotal $6.3M$6.3M $2.8M$2.8M
CostsCosts1998

For Greatest Credibility, You Employ a Structured and Auditable Approach to Identify Benefits
• LABOR
TypicalAnalysis Probe
BenefitsCategory
BenefitsSubcategory
BenefitsSource
BenefitsBenchmark
• Efficiency• Effectiveness• Workload Red’n• Mgt Structure
ImprovementMethods
• MATERIALS/ ENERGY
• Rationalization• Prevention• Vendor Stocking
• CONTRACTOR USAGE
• Routine Maint• Projects
• CAPACITY• Imp. Throughput• Reduced Waste• Reduced Time
Outage & T/A
•Hands-on-tools time•Operator Performed Maint.•Rework/Scrap Reduction
•PM/PdM Effects•Reduction in Crew Size
•Supervisor Ratio
•Decrease MRO Inv. Value
• 5-6 Hours/Day• 20% of Routine Maint.• Rework <10%, Scrap<3%
•“E” Reduction by 50-75%• Decrease .25 FTE/W.O.
• 12-15:1
•Decreased Usage
•Reduced Carrying Cost
• Two Turns / Year
• 10-30% Reduction
• 10-30% Reduction
• DILO, Permits, Parts• WO Proc. Brownpaper• DILO--W.O. Review
• W.O. Review -- %PPM• DILO--W.O. Review
• Org. Chart Review
• MRO Utilization Rvw
• W.O. Review -- %PPM• Preventable Mx Review
• Utilization Review
• Incr.. Avail, Rate, Quality
•Better Planning&Execution
• 5-15% Reduction
• 10-40% Reduction
• Billing/Activity Review• Admin. Process Rvw
• Planning/Mgt Rvw
• Decr Raw Materials
• Increased Availability
•Improved Mgt/Utilization
• 70%-90%, Ind. Specific
• 1-5%, Ind. Specific• Process Dependent
• 10-50% over 3-5 years
• 70%-90%, Ind.. Specific
• Ops Report Review• Fishbone Analysis
• Planning/Mgt Review• Ind.. Benchmark Rvw
• Reeng. W.O. Process• OPM Program• Job Planning, Skills
• Impl. PM/PdM Proc.• Safety Stds, Planning
• R/R Def’n, Training
• Analysis, Restocking
•Impl. PM/PdM
• Impl. Vendor Stocking
• Value-Added Analysis• New Admin. Process
• PM/PdM• Bad Actor Analysis• Dec. Unpl. Stoppages• Process, Mgt Practices
• Improve Planning• Predictive Maintenance• Reliability Engineering
• Planning/Mgt Process

Exercise: Calculate the Benefits Available for Your Plant
• LABOR
Est. Current
ValueBenefitsCategory
BenefitsSubcategory
BenefitsSource
• Efficiency
• Effectiveness• Workload Red’n• Mgt Structure
Benefit Value $
• MATERIALS/ ENERGY
• Rationalization• Prevention• Vendor Stocking
• CONTRACTOR USAGE
• Routine Maint• Projects
• CAPACITY• Imp. Throughput• Reduced Waste• Reduced Time
Outage & T/A
•Hands-on-tools time
•Operator Performed Mx
•Rework/Scrap Reduction
•PM/PdM Effects
•Supervisor Ratio
•Decrease MRO Inv. Value
•Decreased Usage
•Reduced Carrying Cost
• Incr. Avail, Rate, Quality
•Better Planning&Execution
• Decr. Raw Materials
• Increased Availability
•Improved Mgt/Utilization
ImprovedValue
• Add’l Hrs* #Crafts*$/Hr
• % Work*Maint Labor Cost
Calculation
•# Scrap * Unit Value * %
• Ann Repair Costs * %
•Ann Parts Cost * % Red’n
•Ann. Contr Labor $ * % Red’n
•# Add’l Units * Unit Margin
• Ann Repair $ * % RW * %Red’n
•# Days Red’n * Unit Prod. Value / Day

Section 7
Performing the Plant Assessment

The Strategic Plan is Only the First Step in the Journey, However
1. Strategic Plan for Asset Management1. Strategic Plan for Asset Management
2. Plant 2. Plant AssessmentAssessment
3. Implementation of 3. Implementation of ChangeChange

• Build an “As Is” model of relevant processes and procedures
• Determine performance improvement opportunities
• Develop a Business Case to support implementation of improvements
• Design an integrated implementation approach/plan
• Build organizational commitment to address opportunities
• Jointly implement plan
• Jointly deliver results
• Transfer change acceleration skills
Objectives Objectives
January 8 February 115 Weeks 11 months
Phase IIResults Delivery
Phase IAssessment
The Assessment is The First Phase of a Two Phased Program to Improve Operational Reliability

Project Design and Business Case
The Assessment Covers These Areas, With the Goal of Touching as Many People as Possible
OPERATIONAL RELIABILITY
OPERATIONAL OPERATIONAL RELIABILITYRELIABILITY
Business Process Reviews
/ Brownpapers
CMMS Capability
Executive Updates
Organizational Assessment
Communication and Mobilization
Focus Interviews
Maintenance Systems Surveys
and Probes
200
People Touched
160
Financial Analysis

Interviews and Surveys Help Surface People’s Perceptions of Issues
• What is the existing level of consensus in the organization around the future; will a significant consensus building effort need to be launched?
• What is the sense of urgency in the organization; what degree of mobilization is necessary?
• Does the organization understand the scope, scale and difficulty of change; will a massive management effort be required?
• What are the major barriers to success for the path forward; what must be done to overcome these barriers?
• Does the organization feel confident in the future; does accountability still need to be built?
Feel Do
Path ForwardBusiness Case
How
0% 20% 40% 60% 80% 100%
Communication
Sys. & Proc.
Cooperation
Serv. Del. Process
Sales & Mktg.
Strategy
Org. Structure
Better-Trnd. People
Sup./Mgmt. Skills
R & Rs
Mgmt. Control Sys
Environment
Other
Not used
Not used
Not used
80%
58%
48%
44%
44%
43%
41%
40%
36%
32%
28%
18%
1%
0%
0%
0%
Need
Analysis Activities
What
ProjectApproach
andBusiness
Case
ProjectApproach
andBusiness
Case
Focus Interviews
Market-FocusAssessment
Refining Assessment
Executive Workshops
Information Assessment
Corporate Services Assessment
Value Chain and ABC Co.
Processes Analysis
Organization Mapping
Current Initiatives Review
Culture/Change Assessment
Financial Analysis
Focus InterviewsMaintenance Survey
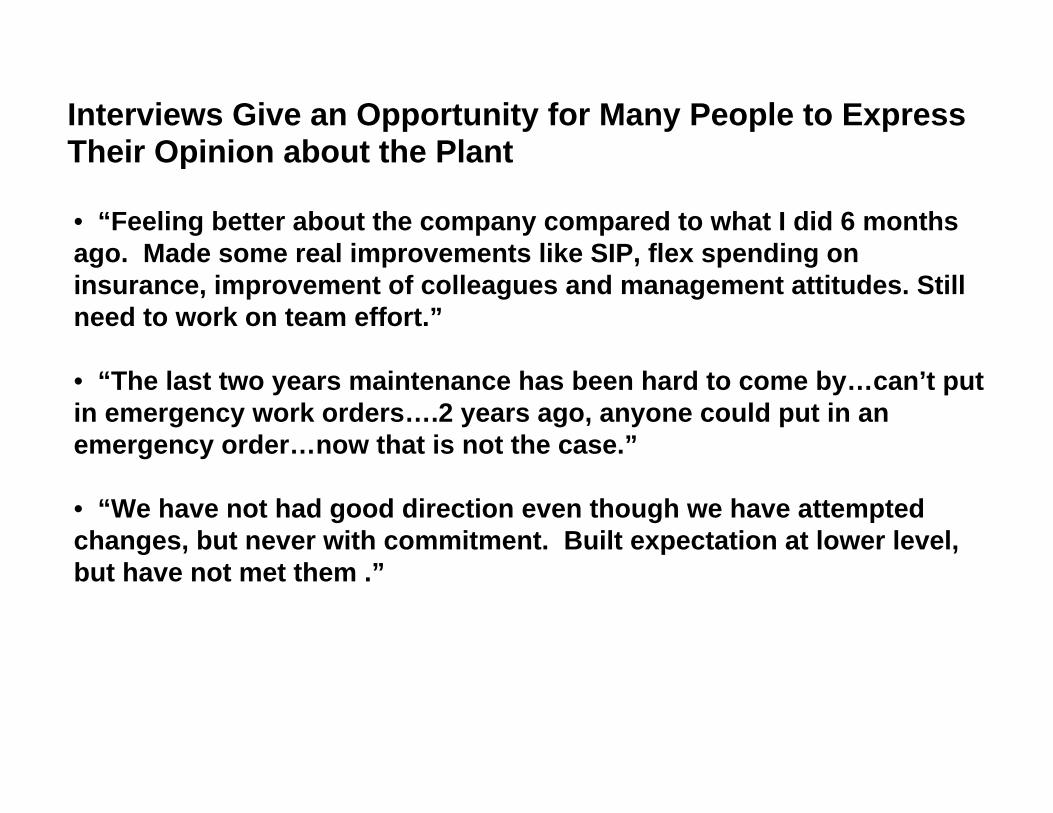
Interviews Give an Opportunity for Many People to Express Their Opinion about the Plant
• “Feeling better about the company compared to what I did 6 monthsago. Made some real improvements like SIP, flex spending on insurance, improvement of colleagues and management attitudes. Still need to work on team effort.”
• “The last two years maintenance has been hard to come by…can’t put in emergency work orders….2 years ago, anyone could put in an emergency order…now that is not the case.”
• “We have not had good direction even though we have attempted changes, but never with commitment. Built expectation at lower level, but have not met them .”

What Are the Most Critical Issues Facing the Plant Today?
•“Work order planning and scheduling not working well. Too many changes that don’t accomplish anything “
•“Problem with balance of craft assignment to 12 hour shifts. Trouble keeping adequate coverage with department techs”
•“Communication at all levels”
•“Training - Need more formal training; politics gets in the way of training. We try to do in-house training but do not get cooperation”
•“Maintain a union free environment”

What Three Things Could the Plant Do to Most Significantly Improve Maintenance Effectiveness?
• “Improve communication”
• “Institute accountability for the equipment and job performance (maintenance and operations)”
• “Consolidate control over all maintenance technicians”

What Three Things Could Your Department Differently To Contribute to Improved Maintenance?• “Do more root cause analysis to solve recurring problems”
• “Make the planning system more efficient”
• “Operators try to take care of equipment”

Where Do You Consider the Greatest Opportunities for Cost Improvement in Maintaining Production Equipment?• “Make people accountable”
• “Operator ownership of the equipment”
• “Good PM minimizes major breakdowns and lost productivity…increase uptime”
• “Cleanliness of the equipment”
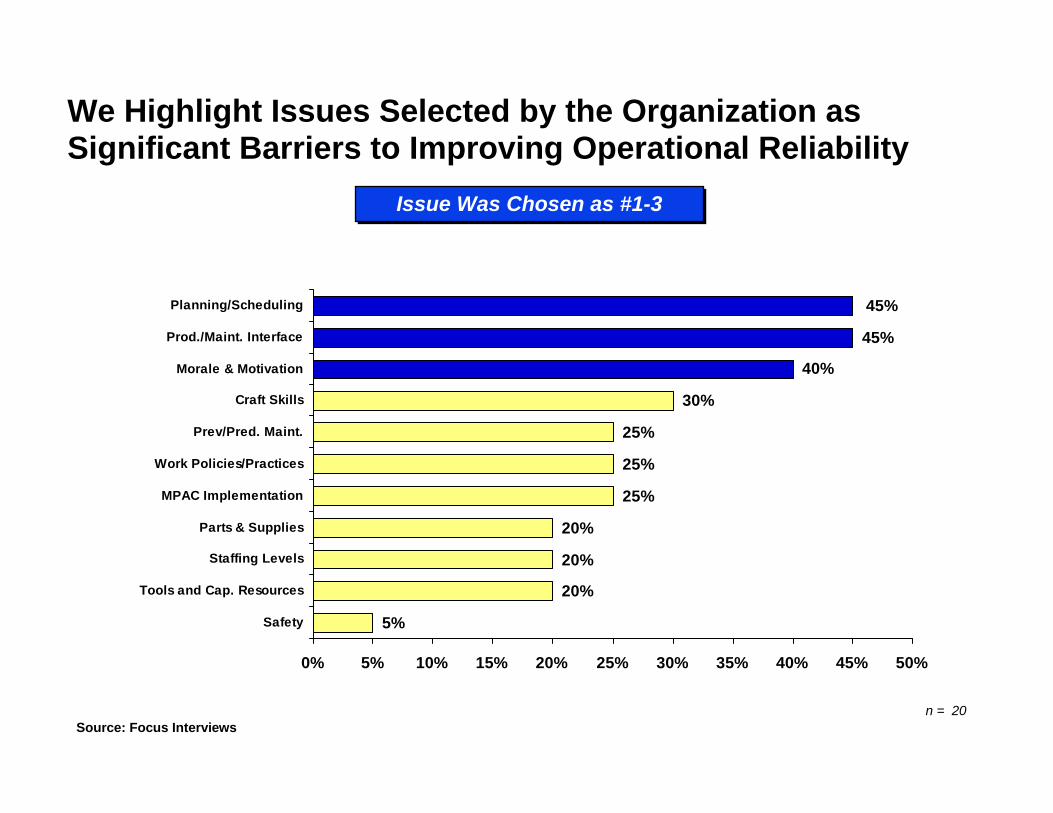
n = 20
Issue Was Chosen as #1-3Issue Was Chosen as #1-3
We Highlight Issues Selected by the Organization as Significant Barriers to Improving Operational Reliability
5%
20%
20%
20%
25%
25%
25%
30%
40%
45%
45%
0% 5% 10% 15% 20% 25% 30% 35% 40% 45% 50%
Safety
Tools and Cap. Resources
Staffing Levels
Parts & Supplies
MPAC Implementation
Work Policies/Practices
Prev/Pred. Maint.
Craft Skills
Morale & Motivation
Prod./Maint. Interface
Planning/Scheduling
Source: Focus Interviews

In the Maintenance Survey We Determine Perceptions:Is The Initiation/Authorization Process Used Correctly?
Never Half theTime
Alw ays0%
10%
20%
30%
40%
50%
Never Half theTime
Alw ays
Maintenance
Never Half theTime
Alw ays0%
10%
20%
30%
40%
50%
Never Half theTime
Alw ays
Production
• “We create formal work orders for all work” Operations= 2.3
• “All work is entered into CMMS” Average= 4.2
• “Our CMMS helps to identify the equipment & problem” Maintenance= .9 higher than production
• “CMMS terminals are easily accessible for all staff” Average= 4.0
• “W/R’s are reviewed/authorized within 24 hours” Operations= 2.2
Maintenance Avg.=3.2 Combined Avg.=3.2 Production Avg.=3.3

Do We Pay Attention to Reliability and Downtime ?
Never Half theTime
Alw ays0%
10%
20%
30%
40%
50%
Never Half theTime
Alw ays
Maintenance
Never Half theTime
Alw ays0%
10%
20%
30%
40%
50%
Never Half theTime
Alw ays
Production
• “Sources & causes of downtime are classified & reported” Production= 3.7
• “We have formal failure analysis process” Production= .9 over Maintenance
• MTBF records are kept & reported for major equipment” Maintenance= 2.3
• All staff understand the capacity of each unit” Maintenance= 2.4
Maintenance Avg.=2.8 Combined Avg.=3.0 Production Avg.=3.3

“% Possible Improvement”“% Possible Improvement”
We Ask About Improvement Opportunities, to Gauge Enthusiasm for Change
10% 20% 30% 40% 50+ %0%
5%
10%
15%
20%
25%
30%
35%
40%
45%
10% 20% 30% 40% 50+ %
EquipmentReliability(downtime)Labor Productivity
Communications(OrganizationalEffectiveness)

Capacity Analysis (Preliminary) Identifies Potential Bottlenecks and Shortfalls From Potential Production (lbs/hr)
Process 1 Process 6Process 2 Process 3 Process 4 Process 5
Permit MaxTheor. CapacityBest Month95-96 Avg. RateAdj. Best MoGain/Loss FactorEquiv. Adj. Cap.
17,540
14,986
14,986*
14,986
12,90513,57212,31610,82213,855-10.0%13,855
21,84211,6489,94821,842*
+10.5%24,026
13,21813,92412,58511,06314,158-6.2%12,671
12,45013,76311,79110,28513,265-4.5%14,087
58,42226,06520,61226,065*
27,238
12,338
Theor-Best Mo.Theor.-Avg.Best Mo-Avg.Adj Best Mo-Avg.
5,202
2,648
1,2562,7501,4943,033
11,8941,70011,894
1,3392,8611,5223,095
1,9723,4781,5062,980
37,8105,4535,4532,648
Performance
2,554 10,194 32,357
While this analysis need discussion and refinement, it can serve to identify the plantsopportunity for additional production.
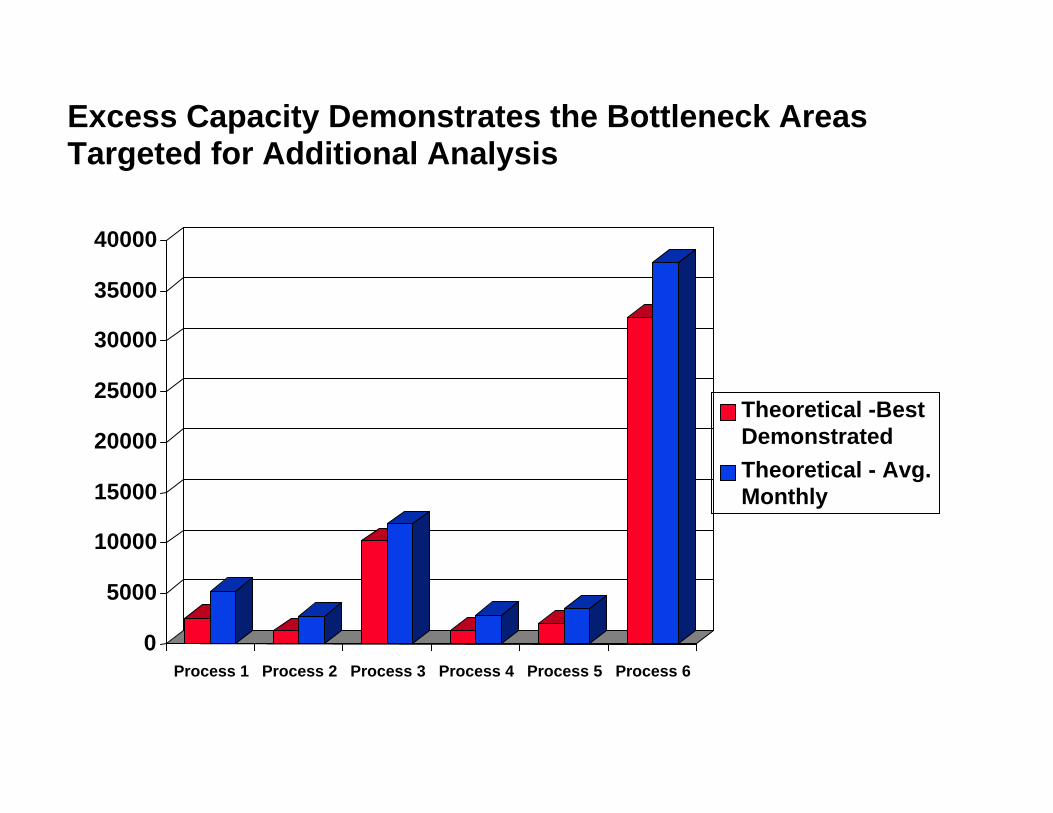
Excess Capacity Demonstrates the Bottleneck Areas Targeted for Additional Analysis
0
5000
10000
15000
20000
25000
30000
35000
40000
Process 1
Theoretical -BestDemonstratedTheoretical - Avg.Monthly
Process 2 Process 3 Process 4 Process 5 Process 6

1997 Equipment Downtime Process 4
Actual
Production
240 Turnaround
No-Load
Emergency Breakdowns.18% 213 hrs.
KDAC Interface.47% 555 Hrs
PM’s
6037 Hrs.
1103 Hrs.
877 Hrs.
109,772 Hrs.
5.09 %
.93 %
.74 %
92.55%
D O
W N
T I
M E
Annual Available Hours100% 118,608
Hrs
Maintenance
Misc./Contr Hrs.
818 Hrs..69 %
Repair / Mods1.62 %

Establishing an Effective Measurement System Is Fundamental to Improving the Maintenance Management Process
Leading Indicators
• Work request quality• Work approval effectiveness• Priority system effectiveness• Planned work ratio• Job estimating accuracy• Inventory accuracy• Maintenance work conducted by
operators ratio• Craft to supervisor ratio• Total backlog• Preventive and predictive ratio• Failure analysis
Lagging Indicators
• Maintenance cost / replacement asset value ratio
• Wrench time
• Emergency work ratio
• Equipment availability
• Re-work
• Equipment history quality
• Material / equipment stock-outs
• Inventory turn-over

Maintenance Management Leading Indicators
Performance Indicators Measurement Your PlantBest in Class1 SAMI Experience2
Inventory Accuracy Percent of Items Actually Found During Physical Inventory 90 - 95%99% 98.83%
W/O Count of Maintenance Work Done by Operators
Maintenance Work Conducted by Operators Ratio
15%>25%Total Maintenance W/O
7.04%
Craft to Supervisor Ratio# Maintenance Hourly
# of Maintenance Supervisors11.1 : 115 : 1 10 - 15 : 1
Total BacklogNumber of Calendar Weeks to
Complete All Planned Maintenance Work Using Straight
Time10.5 Weeks5 Weeks 5 Weeks
Preventive and Predictive Maintenance Ratio
Maintenance Hours Worked onPM/PDM Work
Total Completed Work Order Hours42.7%40% 30-35%
Failure Analysis Percent Work Orders Reviewed for Root Cause
Not Performed on A routine Basis
60 - 70% 40 - 50%
1. International Benchmarking Clearinghouse and SAMI experience in continuous process industry2. SAMI experience after re-engineering when a ‘steady’ state achieved3. Most measures not tracked. ABC Co. estimates based on first three weeks of A&D diagnostics and interviews

49
28
304
1-20%21-50%51-150%>150%
We Review Job Estimating Accuracy to Determine What Portion of Workorders are Inaccurately Estimated

Analysis of Open Work Orders and Request Identifies Age Distribution
0
100
200
300
400
500
600
700
800
900
1000
Open W.O W.O. Requests Total Requests
1 Day Old2 Days - 1 Week1 Week - 1 Month1 Month - 5 Months> 5 Months
Ability to service work in a timely manner is critical to reliability and faith in the maintenance process by operations
Ability to service work in a timely manner is critical to reliability and faith in the maintenance process by operations
Number of work orders in the system at of 1/28/97 Safety& PM workrepresent over 83%of 1 month or greateraged backlog

In Many Cases Work Orders Are Ineligible for Real Planning1
Do Today
Do by Tomorrow
Schedule this WeekSchedule as Manpower is Available
Schedule During Shutdown
Preventive MaintenancePM 26.3
Emergency – Do Now
Best-in-Class Maintenance
Less than 10%
1. Planned = Determine job content, develop work plan, estimate job, plan and order parts and materials, plan special equipment and tools, identify workers with unique skills, assign cost accounts, establish backlog
Source: Analysis of work orders completed during 1996
CategoriesCode% of Work
Order Hours
Shifting the balance from emergency and high priority work orders to preventive/predictive maintenance will yield big gains in operational reliability
Shifting the balance from emergency and high priority work orders to preventive/predictive maintenance will yield big gains in operational reliability
34.9
38.8

Over 1 Hour’s worth of activity resulted in a half hour of wrench time and six idle trips to spares or production
Over 1 Hour’s worth of activity resulted in a half hour of wrench time and six idle trips to spares or production
7:04 am Mobile technician picks PM work order7:10 am Is told that equipment is unavailable for PM7:14 am Technician chooses another w/o7:20 am This piece of equipment is also occupied7:28 am Technician finds an unoccupied forklift,
forklift is brought to shop7:31 am Technician gets parts necessary for w/o from
warehouse, using MPAC7:33 am Technician begins engine tune7:39 am Technician is asked to open tool crib for other
workers7:41 am Returns to PM8:17 am W/O is completed
ProductionProduction
MRO/SparesMRO/Spares
1
24
5
6
8
9
10 How effectively was the
technician’s time used?
7
3
1
2
3
4
5
6
7
8
9
10
Step Time Activity
DILO of a Mobile Technician•
Diesel
Forklift
‘I’
10,00
0 Pound
Capac
ity C
aterp
illar
•Oil a
nd filter
chan
ge. Stea
m
Clean en
gine, driv
e
train, &
body
WO# 97-0
0311
-00
Maintenance
“Maintenance Technician Seeks a Machine That Production Will Allow Him to Service
Daytime 984-6294/ Evening 872-8349”

Poor Planning Continues to HamperOur Maintenance Technician
8:31 am Mobile technician picks PM work order8:34 am Locates sweeper, drives it to shop8:41 am Washes sweeper. At this time, technician’s
partner alerts him that the same PM was attempted last week by the partner, but parts had not been available
8:51 am MPAC reveals that parts are still unavailable, while technician is at terminal, he is asked to open tool crib
8:57 am Break9:20 am Technician returns to sweeper, closes engine,
and returns it to 2209:32 am Technician locates another machine to be
serviced
1
2
3
4
5
6
7
Step Time Activity
•Riding Powerb
oss,
Diesel
Powered,
Ride-On, S
treet
Sweeper
•Chan
ge Engine O
il
& Filter, C
hange A
ir
Filter, e
tc..
WO# 96-2
3690
-00
DILO of a Mobile Technician
Responsibility for the w/o is beingvolleyed like a tennis ball!

Our Maintenance Technician Changes His Schedule to Fix Growing Problems
9:50 am Mobile technician picks PM work order9:56 am After searching, technician locates Bobcat at
1109:59 am Operator is finished with vehicle, technician
drives it to shop, and begins Tune-Up10:21 am Technician has discovered that lift bucket has
a tear, and is therefore unusable. He enters office get W.O. that his partner had entered as a work request a week ago
10:24 am Technician cannot find planner, but secures wo, returns to execute maintenance
10:25 am Technician realizes that a brake light has been broken off, also. Rather than wait another week+ for an order, he gets brake light from spares, and replaces broken one
10:44 am Technician’s partner shows him on MPAC that the same PM he had carried out earlier today had been closed 9 days ago.
10:45 am Technician begins welding bucket. His partner comments that the rip in the bucket has considerably worsened since last week, meaning at least an extra hour of work
10:57 am His efforts are interrupted by a request that he open the tool crib
11:01 am He returns to welding
•Fro
nt End C
ase
Uniload
er 18
45C,
Skid Stee
r, with
73
Inch Utili
ty Buck
et
•Stea
m Clea
n, Chec
k
Fluid Levels
, Belt
s,
Hoses a
nd Filters.
Proce
ss a
W.O. F
or
Neces
sary
Repair
s
WO# 665
52
DILO of a Mobile Technician
Progress is really slow, like a turtle!
1
2
3
4
5
6
7
Step Time Activity
8
9
10

We Review Emergency Work Orders to Identify Those Which are Preventable/Avoidable
OperatorCraftsPM/PdMEngineerMgmtNot Prev.
23%
32%
6%22%
9%
8%
* Percent of 112 work orderssurveyed

We Review the Organization to Determine Its Fit with Overall Plant Goals
OPERATIONS MANAGER
SI-OperationsArea 1
SI-OperationsArea 2
ProductionFacilitators
6
Facilitators2
ProductionColleagues
Production & Maintenance Colleagues
12
SI-OperationArea 3
MaintenanceFacilitators
3Planners
4
Maintenance Colleagues
20
During Results Delivery we will study whether organizational realignment is necessary to make it more effective
SI: Superintendent

We Examine How Time is Spent, and How Much is Available for Value-Added Work
0
100
200
300
400
500
600
A B C D E F G H I J K L M N O
A- TBWB- MeetingsC- Clean UpD- SicknessE- TardyF- TravelG- VacationH- Tool CribI- TrainingJ- CoordinatorK- PdM CollectionL- PdM AnalysisM- AdministrationN- Production AssistanceO- Other
Hours Dedicated to Overhead Tasks

We Also Create a Project Structure That Emphasizes Involvement and Ownership
••Executive Executive Management Management CommitteeCommittee
Plant Leadership Plant Leadership CommitteeCommittee
EVP Mfg.EVP Mfg.
Plant ManagerPlant Manager
Project ManagerProject Manager
HR Mgr.HR Mgr. Mx Mgr.Mx Mgr. Eng. Mgr.Eng. Mgr. Ops Mgr.Ops Mgr. Ops/Mx Mgr.Ops/Mx Mgr.
Project SponsorProject Sponsor
Project OwnerProject Owner
Overall Overall CoordinatorCoordinator
Mob./CMob./Comm. omm. TeamTeam
Work Work Mgmt.Mgmt. Contractor Contractor
Mgmt.Mgmt.Mx Mgmt. Mx Mgmt. ProcessProcess
Equip.Equip.Mgmt.Mgmt.
TEAMS TEAMS
STREAMSTREAMLEADSLEADS
Sub-Streams

In Most Cases We Find the First Project is to Bolster Planned Maintenance, our Stage I Goal
MRO Materials Management MRO Materials Management
Work InitiationWork Initiation PrioritizationPrioritization Planning and SchedulingPlanning and Scheduling
Work Execution & History
Work Execution & History
Measures & Follow-upMeasures & Follow-up
Emergency WorkEmergency Work ApprovalApproval
Backlog Management
Backlog Management
ContractorManagement
ContractorManagement
Preventive & Predictive Maintenance
Preventive & Predictive Maintenance
Integrated T/A Planning & Execution
Integrated T/A Planning & Execution Failure AnalysisFailure Analysis

In the Assessment We Develop a Detailed Annual Plan to Guide our Work and to Monitor our Progress
Activities and TasksI. Complete Plant AssessmentII. Implementation Project ManagementIII. Daily Maintenance
-Develop To-Be Process-Prepare Policies/Procedures-Pilot New Processes-Train & Implement Plant-Wide
IV. Automation/Equipment Management-Purify Existing Database Files-Expand Use of Materials Module-Expand Use of Maintenance Module-Create Equipment Care Process (PM ‘s)
V. Autonomous MaintenanceVI. Performance Management
-Develop & Implem. Meas’t Systems-Align Reward/Recognition Systems
VII. Develop Strategic Asset Mgt Plan
J F M A M J J A S O N D
Quality Assurance Reviews

Exercise: Estimate Your Own KPI’s
Performance Indicators Measurement Your PlantBest in Class1 SAMI Experience2
Inventory Accuracy Percent of Items Actually Found During Physical Inventory 90 - 95%99%
W/O Count of Maintenance Work Done by Operators
Maintenance Work Conducted by Operators Ratio
15%>25%Total Maintenance W/O
Craft to Supervisor Ratio# Maintenance Hourly
# of Maintenance Supervisors15 : 1 10 - 15 : 1
Total BacklogNumber of Calendar Weeks to
Complete All Planned Maintenance Work Using Straight
Time5 Weeks 5 Weeks
Preventive and Predictive Maintenance Ratio
Maintenance Hours Worked onPM/PDM Work
Total Completed Work Order Hours40% 30-35%
Failure Analysis Percent Work Orders Reviewed for Root Cause 60 - 70% 40 - 50%
1. International Benchmarking Clearinghouse and SAMI experience in continuous process industry2. SAMI experience after re-engineering when a ‘steady’ state achieved3. Most measures not tracked. ABC Co. estimates based on first three weeks of A&D diagnostics and interviews

Section 8
Implementing Your Plan

Section 9
Characteristics of Excellence

Section 10
Overcoming Our Barriers

Should You Consider Outside Help?
•• Guide you through the discovery Guide you through the discovery processprocess•• Help structure your thinking and your Help structure your thinking and your work, avoiding blind alleyswork, avoiding blind alleys•• Bring a wealth of experience in Bring a wealth of experience in improving culture and practicesimproving culture and practices•• Provide benchmarking data Provide benchmarking data •• Teach new skillsTeach new skills•• Identify models of excellenceIdentify models of excellence•• Help you stay focusedHelp you stay focused•• Enable you to achieve your goalsEnable you to achieve your goals