Embed Size (px)
Citation preview

(1)
SECTION - 1
INTRODUCTION
Globalisation has been defined in different ways. These range from a narrow focus on
the global production and marketing of goods by multi national enterprises and the
accompanying foreign direct investment to the broader perspective on the political, technological
and cultural aspects of globalisation as well as its economic causes and consequences. At a
minimum, globalisation involves the creation of a world economy which is not merely the sum
of its national economies, but rather a powerful independent reality, created by the international
division of labour and the world market which in the present epoch predominates over national
markets. Large-scale, long-term flows of capital, commodities, technology and labour across
national boundaries define the process of globalisation (Petras:1999). It is important to recognise
that when we talk about globalisation, we refer to a process and not a state of being. It is
a move or a series of moves towards what may be described as a global economy (Shroff
:1999). Globalisation, in its broader sense, refers also to the situation where ordinary human
beings experience and get enriched by influence emanating from all over the world. In this
sense, it is said to have existed throughout human history. If it is taken in the narrower sense
of peoples of all continents and regions becoming aware of one another and trading objects
and commodities, plants and techniques with one another, then it can be said to have existed
since the sixteenth century and the contemporary globalisation process can be said to have
started in the 1970�s, since when there were drastic changes in the rules of the game
(Bagchi:2004).
The official declaration of the New Economic Policy in 1991 is generally regarded as the
beginning of the present phase of globalisation in the country although some of those policy
prescriptions came under force since the mid eighties This phase of globalisation differs from
the earlier ones because of the special policy prescriptions for trade liberalisation triggered by
the World Bank and the IMF (Bannerjee:2004). These policies were introduced with the
expectation that these will contribute to a faster growth of the economy because such policies
proved to be successful in many other developing economies.
It has however been evident that women in the developing countries, both as consumers
and producers are placed at a disadvantage under the new regime of globalisation The incidence

(2)
of income poverty among women is said to be increasing compared to that among men.
Globalisation has been blamed to have increased the incidence of unemployment and under
employment among women and also have given rise to many forms of discriminations in the
labour market. Some women might have gained better access to the labour market but the
majority of them are staying locked in at relatively low levels of pay and skills, becoming
increasingly discriminated against. Globalisation also has the scope of widening the wage gap
between men and women and also increase inequalities of income. (Shiva: 1989,Elson:1996,
Hale:1999, Bannerjee:2004, Sudersan:2004, Bagchi:2004, )
Globalisation has been identified also as a contributor to the feminisation of international
migration as well as migration from rural to urban areas in search of jobs.
The impact of globalisation on health has proved to be different for the rich and the poor
countries and people, because the rich have greater resources to take advantage of opportunities
and defend themselves from health risks. Women in the developing countries being already at
a disadvantage in relation to their access to health services have become still more vulnerable.
The impact of globalisation upon health are complex often acting upon the underlying
determinants of health. It is therefore important to attempt to define how each process of
globalisation affects health and in particular the health of the women.
If the developing countries have to face a threat in the international market due to the
globalisation process, within the country, the disadvantaged regions are more at stake. Assam,
a far eastern state of India, had many disadvantages even at the beginning of the globalisation
era. Its low infrastructure, geographical and topographical conditions, inadequate communication
facilities etc. always leaves it far behind the rest of the country. The state had experienced the
perennial problem of floods and the large bouts of immigration for a long period. On the top
of all this, there has also been political turmoil in the state. In the era of globalisation where
the market rules and competition prevails, these obstacles to the free movement of goods and
services will obviously have very adverse impact. This has been reflected in the state economy
which did not fare well during the last one decade. In this perspective, how did the women do?
Did they have any impact of globalisation? Has their plight improved or deteriorated during the
period?
1.1. To assess the situation, the present study is being done with the broad objectives of
finding out the impact of globalistion on the lives of women in the state with respect to
their development and well being.
The specific objectives are to find out the changes in
(3)
i. the consumption pattern
ii. employment and wages.
iii. poverty
iv. access to different forms of resources including education and health and
v. participation in public life.
1.2. The study is basically analytical and descriptive.
Both primary and secondary sources of data have been explored. The secondary sources
of data are the Census reports and NSS reports and also the Statistical handbooks and
other statistical publications of the government. Published and unpublished books/theses
and the internet sources have been used for the background materials.
Focus Group Discussions, in �depth interviews and sample surveys have been employed
for collecting the primary data.
A multi stage mixed sampling procedure has been followed in selecting the sample. The
number of villages selected from each block has not been uniform because attempt was
made to include women from different occupations.
1.3. The study has covered 450 women in 16villages spread over 9blocks in four districts of
Assam and 150 urban women spread over these four districts, 75 from Guwahati in
Kamrup district and 75 from the other 3 districts taking 25 from each. The list of villages
included is given in Chart1.
Among the four districts selected, three, viz., Dhubri, Kamrup and Lakhimpur are from
the Brahmaputra Valley and one, i.e., Hailakandi is from the Barak Valley. Three districts
have been selected on the basis of Female Work Participation Rates (FWPR). Lakhimpur
has the highest FWPR among the 23 districts of the State and Dhubri has the lowest,
while Hailakandi has the highest FWPR among the districts in the Barak Valley. Kamrup
has been selected as Guwahati, the capital city of the State and gateway to the North
East, is in this district, it also has the largest urban population. The blocks and villages
have been selected on the basis of a�priori information regarding the demographic
composition and occupational pattern of the villages.

(4)
Chart 1 : The distribution of the selected villages by districts and blocks
Name of the District Name of the Block Name of the Village
Dhubri Dharmasala Bogulamari
Debitola Asarikandi
Rupsi Phulkumari
Saraldanga
Hailakandi Katlichera Rangpur
Rangabag
Lala Dhanipur
Lalapur
Lakhimpur Dhakuakhana Jalbhari
Naobaicha Hiloidhari
Karunabari No. 2
Lakhimeegaon
Kamrup Rani Sajjanpara
Soalkuchi Pub-Soalkuchi
Madhya-Soalkuchi
Paschim-Soalkuchi
Bongshor

(5)
SECTION - 2
THE ECONOMY OF ASSAM IN THE CONTEXT OF GLOBALISATION
The economy of the State provides the background for the well being of both men and women
residing there. In this section, we analyse the trend in the State economy in the post liberalisation
era.
The trend in the per capita State Income both at current and constant prices for 1980-81 to
2000-01 shows that the per capita State Income in Assam continued to be lower than the all India
average per capita incime in both the pre and post liberalisation period. It is visible that in the pre-
liberalisation decade of 1980-81 to 1990-91, there was a definite reduction in the gap between the
per capita income in the State and the all India average per capita income. In 1992-93, the
difference was only of Rs.198.00, the all India average per capita income being only 9.81 per cent
higher than the per capita income in Assam. In the post liberalisation decade, the difference widened
so much that in 2000-01, an average person in the rest of India has been found to be enjoying a
per capita income of Rs. 16,487.0 against Rs. 10,198.0 in Assam at current prices and Rs. 10,254.0
against Rs.6,157.0 in Assam at constant prices. The all India per capita income at current prices
is Rs.61.67 per cent higher than the per capita income in Assam and at constant prices, it is 66.54
per cent higher. This only shows the growing economic distance between the state and the rest of
the country.
Agriculture is the mainstay of more than 70 per cent of the State�s population. As such, the
performance of this sector contributes to the well being of the masses. Can we observe any
perceptible improvement in the agricultural sector in the nineties which may be regarded as a gift
of globalisation? The State of Assam comprising 21 plains and districts and 2 hill districts fall under
high potential zone for increasing agricultural productivity. In the fifties, the share of agriculture in
State Income was approximately 60%, in the eighties it declined to about 50-55%. In the nineties,
that is in the post liberalisation period, it has been only around 35%.In the first two years of the
present decade, however, the share of agriculture in the State Income has once again moved up to
40-41%. The annual production of rice has maintained an upward trend but the total production was
far less than the amount required for providing food security to the people.

(6)
The production of food grains, oilseeds and other important crops in the State has been
reported to be far below the targeted level during the 9th plan period. The productivities of the food
grains were lower than the all India average rates also. Inadequate irrigation facilities, floods and
traditional agricultural practices are identified as the major causes of low production and productivity
in agriculture in the State (Planning and Development Department, Govt. of Assam: Draft Tenth Five
Year Plan & Annual Plan: 2002-2003)
The State which is always regarded as having the potential for industrial development has not
been able to make much headway even in this sector. In the industrial map of the country is
abysmally low. The total number of factories in the State account for only 1.23 percent of the
country�s total. The total value added by the factories is only 0.9 percent of the total value added
by the same sector at the all India level.
No perceptible improvement has been observed even in the nineties. While the number of
factories increased by 5.5 per cent between 1993�94 and 1994-95, and there is also an increase
in fixed, working and invisible capital, the overall scenario is bleak as there is a negative turn in
the net income accompanied by a very high rate of increase in the outstanding loan.
Whether the liberalisation process has aggravated the problem of poverty or has contributed
to its amelioration is a debatable topic. According to the Planning Commission estimates, in 1999-
2000, the percentage of people below poverty line in India was 26.10 and the percentage was10
points higher in Assam with 36.09. Assam being the fourth State in terms of poverty ratio, next only
to Orissa, Bihar and Madhya Pradesh. This is however a reduction compared to the estimates as
per the 50th round of NSSO in 1993-94, which was 45.01 against 40.86 for the Country as a whole
As reported in the Draft Tenth Plan of the State, the incidence of poverty in the State is even
higher. It is stated that as per report prepared by the Directorate of Economics and Statistics on
the basis of a Census on people below poverty line, conducted during the year 1998, 59.43 per cent
of the total rural households of Assam was living below the poverty line. On the basis of this figure,
the total number of people living below poverty line in Assam has been estimated at 111.54 lakh,
which is 49.77 Per cent of the total population of the State.
According to the latest estimates published by the Department of Panchayat and Rural
Development, Government of Assam, Goalpara with 75.25 per cent has the highest PC of BPL
families in the State, followed by Dhubri with 75.03 per cent. Jorhat and Tinsukia prove to be the
two richest districts with 41.00 per cent and 41.31 per cent persons below poverty line respectively,
although these figures also are alarming.
It is to be noted that there has been a decrease in the incidence of urban poverty in the State
over time and it has also been lower than the all India average, but the incidence of rural poverty

(7)
continues to be higher than the all India average and has not also shown any sign of improvement
over time.
Other indicators of poverty like Monthly per capita consumer expenditure, the proportion of
expenditure on food to total expenditure and level of food security also place Assam at a much lower
level than the all India average.
According to NSSO 58th Round data, the average monthly per capita consumer expenditure
in Assam is marginally higher than the all India average but is the lowest among the North �Eastern
States. For rural Assam it is Rs.532.00 as against the all India average of Rs. 531.00 and an average
of Rs. 628.00 for the North Eastern States.
For Urban Assam, the average monthly per capita consumer expenditure with Rs.947.00 is
much lower than both the national average and the average for the N. E. States, the two figures
being respectively Rs. 1,012.00 and Rs.1,069.00
Generally, the proportion of expenditure on food to total expenditure is higher among the low
income groups. As per the NSSO 58th Round figure, Assam has a much higher percentage of
expenditure on food to total expenditure than the average all India percentage both in the rural
(Assam: 64.13, India: 54.99) and urban (Assam : 49.21, India: 42.47) areas, the percentage being
higher in the rural areas.
As per the NSSO 58th Round figures, the food availability status in rural Assam is the lowest
among all the states of India with only 943 households per thousand getting enough food throughout
the year against the all India average figure of 982. The number of households not having enough
food in no month of the year is also highest in Assam with 46 per thousand. The all India average
in this category is as low as 5. In the case of urban Assam, however, all the sample households
reported to be having enough food throughout the year, while the all India average is lower than
that of Assam, with 995 per thousand.
The poverty scenario in the State thus shows a gloomy picture especially in the rural areas.
The seriousness of the problem can be better appreciated if we also look into the employment-
unemployment situation in the state.
As per Census data, the percentage of total workers to total population shows a slight decline
from 36.1 in 1991 to 35.9 per cent in 2001. This trend is more significant in case of main workers,
which show a decline from 31.2 percent in 1991 to 26.6 percent in 2001. The percentage of main
workers has decreased among all groups except in the case of urban female. The percentage of rural
female main workers decreased from 13.3 to 9.9, while that of men decreased from 48.1 to 41.5.
There has however been an increase in the percentage of marginal workers among both men and

(8)
women. This is true for both rural and urban areas. The percentage of rural male marginal workers
increased from 1.2 to 8.3, while that of female from 10.0 to 12.4. This phenomenon is but a
reflection of casualisation and informalisation of labour under globalisation, which has been
experienced by all those countries that have undergone the process of globalisation. This phenomenon
has been observed at the all India level as well.
The incidence of unemployment continued to be higher than the all India average and increased
considerably between 1983 and 1993-94, i.e., in the first phase of liberalisation. Between 1993-94
and 1999-2000, the incidence of unemployment showed a decline, but continued to be higher than
the pre-liberalisation rate. The growth rate of employment of the rural female in the State slowed
down in the period between 1993-94 to 1999-2000 but for the urban female it was somewhat better.
(NSS 55th round).
It is evident from the trend in the macro economic indicators discussed above that the economy
of the state did not gain from the globalisation. The expected changes in the industrial scenario or
in the case of food production did not take place, rather, some negative impacts like casualisation
of labour, slow or declining growth rate of employment, increased food insecurity and increased
poverty could only be perceived.
Globalisation brings with it consumerism and aspirations for an ever improving standard of
living, changes in the lifestyles etc. a fall out of this is a sense of frustration that lead to suicide
and domestic violence like rape and dowry deaths, etc. As such, the increased incidence of crime
against women in the state can, to a great extent also be attributed to globalisation. The crime rates
in the state have increased by nearly 36 per cent between 1997 and 2002(NCW:2005).

(9)
SECTION - 3
PROFILE OF THE DISTRICTS
The districts selected for the present study together comprise more than 35 percent of the
total population of the State, showing a marginal increase between 1991(36.35 per cent) and 2001
(36.65 per cent). Each of the four districts are more populous than the State average as is evident
from the figures of density of population. While Kamrup has the highest share in the State population
(12.78 per cent), Dhubri has the maximum density (584 per sq. Km.)
The rate of growth of population had shown fluctuations in each of the selected districts. On
an average, it had an increasing trend between 1951 and 1991. The trend decelerated in the last
decade. Three of the four districts, viz., Dhubri, Hailakandi and Kamrup continued to have a higher
rate of growth than the State average even in the last decade.
The sex ratio in the State showed an upward trend between 1991 and 2001 Census. All the
districts under survey, except Dhubri, also showed upward trends in the sex ratio, with the rate of
improvement in urban Lakhimpur being commendable, 801 to 879. In Dhubri, although the urban
sex ratio has improved, there was a decline in the rural sex ratio, from 953 to 945, which also pulled
down the total sex ratio.
Between 1991 and 2001, in the State, the child sex ratio declined by 1.1 percent. In the
selected districts also, except in rural Dhubri and Urban Hailakandi, the child sex ratios had gone
down. The decline is very significant in rural Hailakandi with 8.9 percent followed by urban Kamrup
(5.9 per cent). This phenomenon might be the result of the modern reproductive technology, which
is a part of the globalisation process.
Cent per cent literacy is yet to be achieved in the State with a literacy percentage of only
64.28, which is anyhow only 1.10 per cent lower than the national average rate. The male female
literacy gap in the State is lower than that of the all India average. Among the districts covered,
Dhubri happens to be the least literate district with lower levels of both male and female literacy
compared to the State average. The literacy rates in the district have improved between 1991 and
2001. This has reduced the distance from the State average literacy rates and also narrowed the
gap between male and female literacy. As per 2001 Census figures the male female gap in literacy

(10)
rate in Dhubri is below the State average. The other districts have higher literacy rates than the State
average, but the male female gap persists, which is more in the rural areas. This is a vulnerable
point for rural areas. To gain from the changes that are coming with globalization, literacy is
indispensable. Low literacy leads to low access to information. Incomplete information results in
market failure. In the case of Hailakandi, the literacy rate improved between 1991 and 2001, but
it fell below the State average in 2001 whereas it was above the State average in 1991. This may
be because, Hailakandi was not under any special literacy campaign as it had a good literacy level
earlier and left to automatic forces, the literacy rate could not keep pace with the other districts
of the State which had special literacy programmes. The health sector is facing tremendous changes
and further changes are awaited with the progress in the process of globalisation. The existing health
infrastructure in the State is not sufficient to provide a safety net to the people. There is less than
one hospital per lakh of population in the State and also in three out of the four districts covered,
viz., Dhubri, Hailakandi and Lakhimpur. Only Kamrup has more than 151 hospital beds per lakh of
population, the State average being only 48.38 and for the other three districts it is even less.
Female work participation rates have increased in all the four districts, between 1991 and
2001.The ranks of the districts in terms of FWPR remained the same in the two years for three
districts with Dhubri at the 23rd, Kamrup at the 18th and Lakhimpur at the first position. Hailakandi
slipped down to the 20th position in 2001 from the 15th in 1991 As in the case of the state,
Hailakandi experienced an increase in the percentage of both male and female marginal workers in
both rural and urban areas. But, at the same time, there was also an increase in the percentage
of both rural and urban main workers.In urban Lakhimpur, female main workers increased but female
marginal workers decreased. In urban Kamrup and urban Dhubri, both main and marginal female
workers increased but in rural Kamrup and rural Dhubri, female main workers increased and marginal
workers decreased. During the same period, male marginal workers increased in all the four districts
and percentage of male main workers decreased in all the four districts except in urban Lakhimpur.
For competing with the market that has been opened up, one has to be well equipped. The
status of the State and also the districts under consideration in terms of the basic amenities of life
is extremely poor. As many as 34.75 per cent of the population in the State did not have either
electricity, safe drinking water or toilet facilities and in the rural areas it was still higher at 38.85
per cent. In rural Lakhimpur, 53.57 per cent of the population did not have any of these facilities
in 1991. The other three districts are in better position than the State average but rural areas are
worse off than the urban areas in each of the district.

(11)
SECTION - 4
SURVEY FINDINGS
General Observations : This section analyses the survey findings. The analysis starts with a few
general observations regarding the sample respondents and then proceeds to analyse the findings
by districts.
It has been mentioned in the case of secondary information that there has been an increase
in the number of women in paid occupations in all the four districts surveyed. During the survey,
it was observed that the women have become very much visible in public spaces, particularly at work
places. Female workers can be seen equally in the fields and on roads and in factories. However,
majority of them were in low paid occupations. The distribution of the respondents by occupation
and income shows that they are mostly engaged in low paid occupations in farms,
handloom,sericulture, factories, jute craft, terracotta and pottery, pith craft, brick kiln, silk industry
and sometimes as petty traders, vendors and saleswomen. Thus it can be observed that women are
still in traditional occupations like agriculture and allied activities although there is an increase in
the number of women factory workers. Women wage earners are increasing, but they do not have
control over the process of production, number of self employed female being very low.
The women get employment in the avenues which are abandoned by the men. For example,
in Soalkuchi, a weavers� village established under the sponsorship of the Ahom Kings, unlike in other
places of Assam, men rather than women used to sit in the looms. All members of the household
including women and children are engaged in different activities related to weaving. With development
and change, men are increasingly going out of the village in search of other occupations and also
taking up white collared jobs even within the village. This has paved the way for more women from
different parts of the State to get employment in the industry. The inflow of the tribal women, who
are skilled weavers in traditional looms but were not used to weaving the silk yarn thronged into
the village since the days of the Assam movement and soon mastered the art. Now, these women
form the majority of the weavers in Soalkuchi, although for some local boys and girls also this is
the sole and/or subsidiary source of sustenance.
In the urban areas however, women can be seen to have entered into quite a few non-
traditional occupations like that of beauty parlour, computer works, PCOs, photostat centres, tailoring
etc. Even in these occupations, gender difference in the role division still exists. Women are mostly

(12)
engaged in typing, data entry etc. while men are doing the hardware related works. The ownership
of business establishments lies with men and women only work under them.
Women who own beauty parlours or are engaged as tailors in the urban areas are reported
to be making profits in all the districts covered. This is an instance of traditional male activity being
taken over by women, which can be said to be a direct impact of the changing market conditions
due to the liberalisation process. This speaks of not only the changes that are occurring in the
occupational pattern between the man and the women, but also is reflective of the lifestyle changes
and changes in the attitude due to globalisation. Traditionally, there used to be religious taboos even
for men in going to the barber�s shop for a hair cut, but now this has become commonplace even
for girls to queue in the beauty parlour to get a hair cut and she can also be the one who cuts
the hair. Increased number of tailoring houses, run by women also shows the vast changes that has
ocurred in the cultural pattern in our society. If sewing, embroidery etc. were regarded as ornamental
virtues of a women, now these are but earthly needs that can provide her a living, at the same time,
it is also true that it is the market which had triggered such changes. A modern woman no more
is satisfied with the traditional home made dtreses. In the context of Assam, this bears particular
significance. Traditionally, weaving happened to be a household activity for every woman in Assam.
She used to weave the clothes for day to day use for herself as well as the other members of the
family. The dress pattern happened to be such that after weaving, the dresses did not need much
stitching, which could even be done at home. This was specially true of women�s clothes. It is obvious
that interaction with different cultures impacts upon the dress patterns, but the rapid change in the
dress code of the young generation particularly the girls in the recent years created a demand for
more tailoring houses. If women in yesteryears did their tailoring and embroidery within the four walls
for themselves and their families and some also to earn a living or as hobby but within one�s own
premises, these days the business is coming up more visibly. This trend is also increasing the market
for milled clothes.
The number of women is also on the rise in the home based works like small scale catering,
computer related works, tailoring, embroidery and allied works like button stitching, stitching saree
falls etc. which are outsourced on contractual basis by established business concerns.
In more ways than one, lives of women are getting affected by the changes triggered off by
globalisation. They are getting exposed to the sudden changes unaware. The women who are getting
wage employment are unaware that they are employed on casual and informal basis and may have
to lose the job as and when the employer so desires. Although there is an increasing number of
women in paid occupations, this does not seem to ensure their well being and an improvement of
quality of life. Women are being used only as a source of cheap labour. In these new types of
employment, the burden on the women get multiplied. They do not even have the trade union rights.

(13)
1. DHUBRI
In Dhubri, three blocks Viz., Debitola,Dharmasala and Rupsi were covered Data were collected
from four villages viz., Bogulamari, Asarikandi, Phulkumari and Saraldanga and 25 households were
selected at random from urban areas
Work participation rate
Contrary to the secondary information regarding the Female work participation rate in hubri,
the total work participation rate among the sample respondents in Dhubri has been quite high with
93.9%. The female work participation rate is higher than the male work participation rate of 82.9
per cent.
Occupation, Nature of work and Income
In rural Dhubri, the sample respondents included daily wage earners, workers in the incense
factory, jute craft, terracotta and pottery, Brick kiln, agriculture and allied including farm labour, while
in urban Dhubri, respondents were service holders, petty traders, pith craft workers, terracotta artisans
and pottery makers. Pith craft, terracotta works etc. are regarded as household enterprises and the
head of the household is the producer and the owner. The others including the women members in
the family are also involved in the activity, but not regarded as workers. As such women engaged
in these activities are not reported as workers but only as helpers. Of course, a few households could
provide a rough estimate of a woman�s average earning.
Even in the case of factory workers and construction workers, all members, sometimes the
children also work in the same factory /work site. These groups could provide information on their
wages.
In Dhubri, bidi making is the main occupation among some immigrant Muslim population. Bidi
making is done by the women and children. As such, the incidence of child labour is also quite high
among them. They have regular earnings as bidis have a ready market. They get the raw material
from the local market and the finished product is collected by the traders from home. They feel that
although they get regular earnings, the profit margin has reduced because the prices of raw materials
have increased more than in proportion to the increase in the price of the finished product.
There is an increased difference in the prices paid and prices received by these poor artisans.
The disproportionate increase in the price of raw materials has reduced the profit margin also
of other home based products like hand woven clothes, handicrafts etc.
Some households especially in the urban areas depend solely on pension for sustenance (mainly
those households which are headed by widows) while some others in both rural and urban areas earn

(14)
rent income. Few households have agriculture as their main occupation though the number of women
cultivators is very small.
The women who reported their income separately, earned, on an average between Rs. Rs.800
and 1,000, while in urban areas, the range of income is Rs. 1,000-1,500/-. The income earnings
are marginally higher in the case of the service holders and those who are self employed in some
business crossed this limit. In the households where more than one person earns, the household
income goes up. This means that all the female headed households, the women being the only
earning member, are living below poverty line. The incidence of such households is on the increase.
In fact, to earn even a hand to mouth living in the face of growing prices, the entire household
including the children join one or the other paid work
In rural Dhubri, most of the workers are casual workers except in the incense factory where
a majority of the workers are regular. Jute craft, Terracota and pottery comprise both casual and
regular workers, the percentage of casual workers being higher than the regular workers. For other
working groups mentioned, majority are casual labourers. The wage rate structure is reportedly same
for both men and women in incense factory, jute craft, terracotta and pottery but is biased in favour
of males for brick kiln workers, other daily wage workers etc.
As compared to the past, 5 years back, income of almost all workers engaged in different
types of work mentioned, has increased. In female headed households, where the head of the
household is a widow or is divorced or separated, the household income has shown a decline.
The working condition of the labour in incense factory is better than that of the other workers,
though on absolute terms, the condition is not at all encouraging. The state of working conditions
of the brick kiln workers is pitiable. They are neither provided any kind of exemption from work nor
do they get medical expenses even in case of accidents at their place of work. In cases of such
unforeseen expenditure, they have to borrow the required money from the contractor and repay with
interest.
The brick kilns, growing in number with the building boom in the urban areas, are posing
another threat to the rural areas. These brick kilns encroach upon agricultural land. Poverty, increased
prices, ever increasing consumer needs etc. lure the poor peasant to sell their agricultural land to
get petty cash. In return, they not only are rendered landless but also become unemployed, because
these agricultural workers are not always hired for work in the brick kilns, the type of work being
very different from the work in the fields. These brick kilns also lower the fertility level of the
agricultural land around.
In the urban areas in Dhubri, the average monthly household income of pith craft workers,
pottery makers and terracotta artisans is more or less the same. The household earns on an average

(15)
Rs. 1500 to 2500 or 3000 depending on the number of persons employed per household. Majority
among them are casual workers.
Other groups comprising maid servants, vendors etc also earn on an average Rs. 800 to 1000
monthly. Domestic help (or maid servants) is exclusively a woman�s profession. Those engaged in petty
business or other private services are financially a little better off than the above mentioned working
groups.
Those engaged in govt services or have been able to expand their business recently have
relatively higher incomes.
Self employed women who own beauty parlours or are engaged as tailors or in embroidery work
in the urban areas are reported to be making profits.
A few housewives interviewed in Dhubri, reported to be facing crises due to ever increasing
prices, particularly the cost of education and health.
In Dhubri, family planning programmes are said to have shown much success, the low family
size in both rural and the urban areas which is respectively 3.5 and 3.2, proves the fact. This has
contributed also to the improvement of other aspects of life like literacy, women� participation in
income earning activities etc.
Land and assets
In Dhubri a large number of households among factory workers, jute craft workers and
terracotta workers are reported to be having their own land though the land area is on an average
is just around 1 to 2 kathas. The daily wage labourers and brick kiln workers are landless.
In urban areas many of those engaged in services, pith craft workers, earthen ware makers
possess their own land but the size of land holdings is very small � 1 katha or less.
The maid servants or vendors and other daily wage earners do not report to be having their
own land or even other assets., not even in the place of their residence.
Even those households who own land seldom the ownership is in the women�s name.
The access to media of the sample workers both in rural and urban areas is nearly nil. Their
illiteracy and poverty come on the way. They cannot read newspapers and cannot afford TV, VCR
etc. As such, the world outside is totally closed for them. Not only TV, VCR etc. these people do
not even possess any other asset like that of a bi-cycle.
Consumption and savings
In the rural areas, in Dhubri, the respondents are grossly dependent on the market for the
commodities of their day to day use. Paddy, mustard oil etc of the local variety are available in the

(16)
market. The branded varieties of cosmetics -powder, cream etc are however available and are
purchased by the rural consumers. They could not specify the brands of the products they use. They
purchase whatever the shopkeeper gives..
The shopkeepers even in rural areas and the young teen aged girls are aware of most of the
brands like Amway, Fair and Lovely etc. The fairness creams are the most popular product among
the young girls. In fact, the consumption choices and the lifestyles getting determined not by
requirements set by cultural or physical needs, but are directed by the market.
In urban areas however, the respondents were found to be aware about the brands they were
using. The branded articles of consumption specified are KRT rice, Tata salt, Annapurna Atta, Kisan
Atta, Lux soap, Surf Excel washing powder, Pepsodent, Neem toothpastes, Ponds powder and cream.
Some households with relatively higher incomes in the urban areas purchase Amway products also.
Modern consumer items, posters announcing admission into MBA, spoken English and other
professional courses can be seen even in remote villages.
In rural areas, the overall habit of savings is observed to be quite low among all the
respondents. In majority of the households, the expenditure surpasses income. The habit of savings
is observed to some extent among jute craft workers terracotta and pottery makers. Those who save,
generally save in SHG�s. However, they reported that they can save only small amounts as it is
difficult to save in the face of increasing prices.
As regards the urban areas, households engaged in private or government services or those
engaged in some sort of business generally save in banks, post offices etc. In spite of being in the
urban area, the habit of savings among workers in pith craft and earthen ware making is rarely
reported. They reported that they cannot manage to save as they earn very little and the prices of
the items they require are soaring up.
Indebtedness
Majority of the rural households are indebted. In rural areas loans were mainly taken from
village shops, money lenders or contractors for treatment, social functions and sometimes to meet
consumption expenditures.
Health and Wellbeing
Health gets neglected because of poverty. Although doctors, generally the allopathic
practitioners,in the Health Sub-centres or pharmacies within/near the village are approached whenever
necessary, it is not always possible to complete the treatment. In rural areas, all prescribed medicines
are not always available and majority of the respondents opined that medicines have become costly
and they cannot afford to undergo the full course of treatment.

(17)
On the other hand, in the urban areas, usually medicines prescribed are available but
households undertook the full course of the treatment only sometimes. Many could not afford and
others tend to neglect once the severity of the ailment reduces.
Participation in Public Life
Participation in public life among women is observed to be very less in both rural and urban
areas in Dhubri. In the urban areas participation is in fact hardly present while in rural areas women
involved in jute craft and Terracota and Pottery making are members of SHG�s. Other women workers
in Dhubri do not have any such forum of support. Women as members of Mahila Samity or other
such organizations were not found among the respondents.
Literacy and Education
The literacy rate is lower in the rural areas than in the urban areas and the overall literacy
rate is as low as 47%. This is even below the average literacy level of the district (49.9%). Among
the respondents interviewed, the literacy rate is the lowest among daily wage earners and brick Kiln
women workers in the villages of Phulkumari and Saraldanga. Most of them are illiterate or at the
most read up to the primary level. In Bogulamari and Asarikandi villages, among workers in the dhoop
(incense) factory, jute craft and terracota and pottery workers, the level of literacy is relatively high
with many of them having read up to HSLC level.
It has been observed that, the sample figures of male literacy rate of 35% is below than the
State male literacy rate of 50.6%.,but that the female literacy rate of 51% is higher than the district
figure of female literacy rate which is 42.6%. As per the sample, the female literacy rate is higher
than the male literacy rate. According to the secondary information, the female literacy rate is lower
than that of the male. However, the census figures are for the 2001 Census and the present survey
was conducted between June and September, 2004, a gap of three years. This may be the result
of an increase in female literacy rate, that might have happened due to government intervention or
the impact of the literacy programmes with special emphasis on women/girls, Dhubri being one of
the target districts of DPEP, Asom Mahila Samakhya etc. The literacy drives are a part of the
governmental effort to improve the quality of life of the people, taken up in the wake of globalisation.
The low male literacy rate is however alarming and can at best be attributed to the fact that the
sample consists mostly of the immigrant labour class where literacy levels remain low. Moreover,
special literacy drives target women more specifically and as such the male illiteracy continue to
remain so. The highest level of education attained by a male or female member in the rural areas
in various occupations mentioned above is generally high school. Most of them have read upto the
primary level or are illiterates Even in the urban areas majority of the women engaged in pith craft,
earthen ware making, maid servants etc are either illiterates or have studied only upto primary level.

(18)
In the urban areas, the highest level of education attained is expectedly higher. Among both
males and females, graduation was found to be the highest level.
Crimes against women
In the group discussions among different groups of women, a few issues emerged. They
complained that the liquor menace is making their lives miserable. Earlier, people feared to take the
liquor made within the village as there were some restrictions. Now that the indigenous liquor
production has been given permission, liquor is openly used. The incidence of wife battering is
increasing. The men not only waste their own earnings in liquor but sometimes also make the women
pay for that. For the women who do not earn, it is becoming difficult to run the home.
Another problem coming up more visibly in the recent years is dowry. Whereas dowry was not
there earlier, these days, heavy sums are demanded as dowry.
A number of property related disputes,scandals and trafficking of girls were also reported. They
feel that all this are on the rise.
2. HAILAKANDI
In Kamrup, two blocks viz Lala and Katlichera have been covered. Data were collected from
four villages viz., Rangpur, Rangabag, Dhanipur and Lalapur.25 households from urban areas were
also selected.
Work Participation Rate
Among the four districts surveyed, work participation rate among the sample population is the
lowest in Hailakandi which is only 51.4%. The male work-participation rate in Hailakandi (69.6%)
is way above the female work-participation rate (32.6%). These low average female work participation
rate is because the sample covers two blocks with very different characteristics. Of the two blocks
Lala and Katlicherra, the Lala block is more affluent. In this Muslim dominated block, the purdah
system prevails and the women remain within the confines of the house and the man is the main
bread earner of the family. Therefore the work-participation of females under the Lala block is
minimal. This explains the low female work participation rate among the sampled respondents in
Hailakandi.
Occupation, Nature of Work And Income
In Hailakandi, two distinct income groups emerge from the sample in the rural areas. In the
villages, Rangpur and Rangabak under Katlicherra block, the households are very poor living on a
hand to mouth existence while in other two villages, Lalapur and Dhanipur under Lala block, the
economic condition of the people is comparatively good.

(19)
In the urban areas the economic condition of the people is quite high as compared to their
rural counterparts.
Main occupational categories in the rural areas included in the sample are Daily Wage Labour,
Agricultural labour, Cultivators and Business while in the urban areas the sampled occupation
categories are Services, business and �others � which including rickshaw pullers, porters, pension
holders, teachers, tailors etc.
In the two villages under Katlicherra block, most of the women work both as daily wage labour
and agricultural labour. They live in abject poverty and also get a raw deal in terms of wages. The
wage rate structure is biased in favour of males and they work on a purely casual basis. The average
income of the households is around Rs.1000. A few, who have their own land and work as cultivators,
or are engaged in some kind of petty business have incomes higher than these casual workers group.
In the case of cultivation and business, however, the income is not shown separately for individuals
and shown only as household incomes of which the headship is with male members. The average
income of cultivator households is around Rs. 2000 but the income varies with the size of cultivated
area. Those in business generally have an average income of Rs.3000. In the other two villages under
Lala Block, most of the households are engaged in business. The income of the households from
business or cultivation is usually higher than in the Katlicherra block. Some of the households having
their own business earn Rs. 5000 to Rs. 8,000. The households have relatively higher income than
in Katlicherra block but not a single woman was found to be engaged in income earning work. They
remain in purdah and do not work outside. Even among the fhh, the head of the household remain
within the confines of the house while male members work. In the Katlicherra block, however, no
such system exists even among muslim community. They are engaged as daily wage labour and
agricultural labour.
In the urban areas, most of the women in the sample are engaged in services (both govt and
private). Those women engaged in govt services generally earn much higher than women in private
services. A few housewives were also included in the sample, who are not engaged in any sort of
income earning activity. Few women are engaged in business but the number is very low as compared
to men engaged in business activity. The average income of households where the main source of
income is business activity is around 3000 to 3500. Women engaged in business are generally
engaged in petty business and earn lower than the average business income specified.
Though pension is not considered as income some fhh thrive solely on their pension.
The average household size in rural Hailakandi is 6.2 and in urban Hailakandi is 3.5,
whereas very few families have more than one worker. Hence the per capita income in Hailakandi
happens to be the lowest among the four districts surveyed.

(20)
Another notable feature in Hailakandi is the striking inequality of income and well beng even
within the rural areas. This inequality will continue to rise as the process of globalisation advances,
if proper care is not taken. Because, if market forces are allowed to function on its own, the rich
and the advantaged gain, while the poor and the ignorant get marginalised.
Land and Assets
In the rural areas, under Katlicherra block very few households have their own land. Most of
them are landless casual labourers. The average size of land holdings in Katlicherra was around 1.25
to 1.5 kathas, while in Lala, it was 2.5 kathas.
In the urban areas most of the households were found to be having their own land with the
average size of land holdings being 2 to 2.5 Kathas
The poor casual labour in the rural areas did not posses any valuables or assets. Some
households which were a little better off possessed a television or a bicycle.
In the urban areas TV was very commonly found while some households also possessed
refrigerator, bikes, other valuables like jewellery etc. The access to media is limited only to the
affluent section only.
Consumption and Savings
All the households in both rural and urban areas were unanimous in their observation that
expenditure has increased over the last five years and items of consumption have become costlier.
It has become difficult even to purchase the educational requirements of the children. Medicines also
have become costlier.
In rural Hailakandi under the Katlicherra block the women are not aware of modern consumer
items. They still do not use even toothpaste and other commercial products of daily use, for majority
of them cannot expend for such things or have not even heard of those. In Lala block in Hailakandi,
where the people are somewhat better off, the purdah system prevails and the women could not
provide any information about their consumption details. They could only say that they use face
cream, powder etc but could not give details.
In the urban areas all households consumed branded articles like KRT rice, sunflower oil (not
specified), Tata salt, Surf excel washing powder, Dove, breeze soap, Sunsilk and other brands of
Shampoo etc.
In the two villages of Rangpur and Rangabak under Katlicherra block, instances of rural savings
is almost nil. SHGs or other credit and thrift societies also do not function here. In Dhanipur and
Lalapur villages under Lala block however, households save in SHG�s banks, postoffices,. Some of
them have also started depositing their savings in �Sahara�.

(21)
In the urban areas also saving is commonly done in banks, post offices and Sahara, LIC
policies etc.
Indebtedness
As observed, among the four districts surveyed, rural indebtedness is the highest in Hailakandi.
Most of the daily wage labour and casual agricultural labour thrive on loans taken from local
shopkeepers for running their daily household expenditure.
In the urban areas, loans were generally taken for purchasing land or other consumer durables.
Health and Wellbeing
In the rural areas it was reported that in the case of ailments, the nearby pharmacy or the
sub-centre is approached but all prescribed medicines are not always available and the full course
of the treatment can seldom be completed, especially among casual labourers. In the urban areas,
medicines were more or less available and the full course of treatment pursued. In the rural areas
in Hailakandi, malnutrition is very common among children and T.B poses a serious problem among
the adults. Other ailments include fever, hepatitis B, diarrhoea etc. The picture of state supported
health amenities, as is mentioned above (SecIII) is dismal in all the districts, with Hailakandi being
the worst affected.
Participation in Public Life
Participation in public life is minimal among rural women and almost nil among urban women.
Under Katlichera block, women�s participation in public life is very poor. Presence of SHG�s is not
significantly felt in the villages and women are also not members of other women�s organization
except in some stray cases. However, in Lala block, the SHG�s are quite vibrant.
Literacy and Education
The rural literacy of the sample is shown as 77% which is not bad as compared to the district
average. If the literacy figures are disggregated by blocks/villages, stark inequalities in the rates can
be perceived. In Rangpur and Rangabak villages under Katlicherra block, most of members are
illiterates followed by those read up to the ME or primary level both among men and women. In
Lalapur and Dhanipur under Lala block, both males and females in every household are literate. The
highest level of education attained is graduation. School enrolment of both girls and boys is universal
in Lala, but not in Katlichera. As to the education of the children, the respondents in Katlichera told
that they can never dream of sending their children to school as it is very expensive. On the other
hand, the respondents from Lala block informed that they send both girls and boys to school, they
donot want their children to remain iliterate and/or uneducated like themselves. This reflects that
(22)
with globalisation education has become too costly a commodity to be consumed by the poor, now
education is only for the rich and the advantaged.
In the urban areas, most of the members are literates and the highest level of education
attained is Post Graduation. Some men have also undertaken professional degree or diploma courses.
No women were reported to have completed any such course.
In Hailakandi, The sample male literacy rate of 79.3% is above the district figure of 68.5%.
Again in case of female literacy too, the sample figure of 70.2% is way above the corresponding
district figure of 50.7%. But for both the sample figures and the district figures, the male literacy
rate is higher than the female literacy rate. The difference between the sample and the district figures
is seen primarily because the present study takes a small sample and the district figures are based
on Census data, that too published before three years. Again literacy among both men and women
in one of the blocks is much higher than in the other block.
The specific problems in Hailakandi were the abject poverty and illiteracy among the casual
labourers and non participation of women in public life in all the areas, a high incidence of
malnutrition and TB among the poor casual labourers only prove that the district has not experienced
any positive impact of globalisation. All the prevailing characteristics only point out the negative
impacts.
3. KAMRUP
In Kamrup, two blocks viz Sualkuchi and Rani have been covered. Data were collected from
five villages in Kamrup viz., Pub- Soalkuchi, Madhya- Soalkuchi, Paschim- Soalkuchi Bongshor and
Sajjanpara.
Since Kamrup is the most urbanized of the four districts, 75 households from urban areas were
selected.
Work Participation Rate
Among the sample households in Kamrup, the total work-participation rate is 62.1%. The male
work-participation rate of 77.3% is higher than the female work-participation rate of just 47.4%.
Occupation, Nature of Work And Income
Main occupations in the sample are Weaving & weaving related work, Cultivation, Daily wage
earner, farm labour, service, factory workers, vendors, shop keepers, domestic servants and educated
women working as casual workers.
Sualkuchi being the hub of the silk industry of Assam, weaving and weaving related activities
are common among women there. Traditionally, The average income of a hired weaver has been

(23)
reported to be around Rs. 3000per month, depending on volume of work done, the quality, design
and markertability of the product. Some weavers can earn even more. Although weavers are hired,
silk industry is basically a household enterprise with ownership lying with the household head, mostly
men. Monthly income of some of these household is even above Rs 10,000. In such situations,
women�s labour goes unpaid although they are entitled to the benefits as a member of the household.
People associated with the silk industry in Sualkuchi reported that during the last five years, there
has been a fluctuating increase in their sales. These days sales are good as the people spend a lot
of money on dresses during festivals and other ceremonies. However, the wages and working
conditions of the workers do not reflect the fact. Weaving is also done in a small scale in Sajjanpara
(Rani Block) but most of the households do it at a subsistence level.
Among the cultivators in Sajjanpara, the average income is around Rs.2,500 but many
households are subsistence farmers,who cultivates their own land but do not sell their produce. They
were not able to give an estimate of the imputed earnings. Those among them who owned large
areas of land reaped profits selling their produce. Some say that the rate of profits has increased
as compared to the past while others give a contrary view altogether.
Women also work as daily wage and farm labour only for certain months of the year and earn
an average monthly income of around Rs. 800 to 1000 depending on the volume of work done, land
area sown etc.
In Sajjanpara village under Rani block, a cold drink plant has been set up which is an
important avenue of employment for the poor villagers. Both men and women are employed there,
majority being men and women
In both rural and sub-the urban areas, there are a large number of women factory workers.
They get casual employment. The workers working even upto 6/7 years are not given permanent
status. Their average income is around Rs.1,000 to 1,500 per month per person. In the case of leave
even due to ailments, there is wage cut. Hence, there is no certainty about the actual amount of
monthly wage. Gender division of work and wage disparities are common and the women accept that
as natural. In the factories, the wage difference between a man and a woman is Rs. 15-20 per day.
Such wage differences exist also in the case of construction workers.
In a few exceptional cases, women have been able to successfully fight for equal wages. To
cite an example, one women, who was working as helper to a mason, mastered the art of masonry
and constructed her own house all by herself. While working with the master mason, she does not
confine herself to the works likwe carrying ricks, water etc. which are commonly assigned to women,
but shares the work done by the male labourers. Inspite of that, initially she also used to earn less
than that of the men, but now she claims and gets the same rate.

(24)
In the case of domestic servants, (This occupation being exclusively women dominated) in the
urban areas the range of income is between 200-2,000, average monthly income being around 1,200.
Vendors, earn around Rs.1,500 on an average.
One of the most vulnerable groups of women that has emerged of late in the urban areas
is the large educated (often in non-technical disciplines) unemployed and casually employed women
workers. They are usually employed in low paid jobs and often work below their potential and
capacity. Their mean income ranges between 1,500 and 2,500 and no state sponsored support system
exists for meaningful sustenance of these women. Those who save among them save in banks.
Among the sample respondents, family size in urban Kamrup with 4.9 is higher than in rural
Kamrup with 4.3. This is mainly because here urban Kamrup is represented by Guwahati, the capital
city of Assam, where the density of population is very high.
Land and Assets
In the rural areas under Sualkuchi block, the size of land holding is usually quite small.
Households own small plots of land but the average size varies from 1 to 2.5 kathas.
Under the Rani block in Sajjanpara village, the average size of land holdings is around 5 to
10 kathas. Moreover many households were found having much larger size of land holdings, almost
15 to 20 bighas, but the land lies fallow because of the menace caused by elephants.
Some factory workers in sub-urban areas live in occupied government land and some own land
between 1.5- 2.5 kathas. The domestic servants, hired weavers etc. and vendors seldom own land.
Among the educated class of women some own plots of land, even in their own names, while others
live in rented houses.
In the rural areas, assets comprise looms, livestock, bicycle and other consumer durables etc
while in the urban areas assets comprise of Television, Refrigerator, bikes, cars etc. Women in kamrup
have better access to media than in the other three districts. The electronic media is more popular
among the educated. The working class in rural areas enjoy the mobile theatres.
Consumption and Savings
All the households in both rural and urban areas agreed that expenditure has increased over
the last five years and items of consumption have become costlier.
The sample respondents in both rural and urban Kamrup purchase almost all products from
the market and were aware of the brands they bought. In the rural areas, the brands specified are
Tata salt, Punjab rice, Lux soap, surf excel washing powder, Anupam Mustard oil, Colgate, Babool
toothpastes, Ponds� powder and Fair and Lovely cream. In fact, they purchase whatever is available
in the market and suits their pockets.
(25)
In the urban areas households were generally found to be more brand conscious articles like
KRT rice, sunflower oil (not specified), Anupam, Dhara Mustard oil, Tata salt, surf excel washing
powder, Dove, breeze soap, Sunsilk, Clinic plus shampoo etc Lakme, Amway products Lotus and other
herbal products are commonly used. A growing tendency towards buying consumer durables,
particularly kitchen gadgets, latest varieties of luxury items and cosmetics is seen among the
economically better off households in the urban areas.
Expenditure on food taken outside the home has been on the increase. This is because people
have to go long distances to their workplaces, both men and women work outside. Quite often, this
is also because of the change in the lifestyle of some sections of the population particularly the
youngsters.
Even in rural areas, the women are conscious about savings but reported that they cannot
afford to save as their expenditures are higher than their incomes. Those who save, save mostly in
the post offices, informal women�s groups, which they call a �Society�. Some of them also households
also save with SHG�s. Through SHGs, women also explore new business ventures to sustain
themselves.
In urban areas, those women who can save generally save in banks. Some also make insurance
policies. Some maid servants, hired weavers and other hired workers save with their employers.
Indebtedness
Rural indebtedness was much less pronounced in Kamrup than in Hailakandi or Dhubri district.
Some of them were found to have borrowed money locally, either from their employer or from some
other person in the vicinity.
Health and Wellbeing
In the rural areas, households on an average said that prescribed medicines were sometimes
available in the local chemist�s shop but very few of them have ever completed the full course of
the treatment. In fact villagers in Sajjanpara opined that doctors were rarely available in dispensaries
and they had to rush to the city even in case of emergencies. Only of late, with the efforts of Bharat
Sevashram Sangha one doctor made weekly visits in the local dispensary (mobile Chikitsya Sewa).
Sualkuchi- In rural Kamrup malaria, jaundice etc are the common diseases. The occurrence of
diseases are reportedly increasing day by day in and around Sualkuchi. In Sajjanpara in Kamrup, also
the same diseases are found though of late, the incidence of malaria is said to have decreased
because of the installation of the water treatment plant nearby.
Now people of Sajjanpara have some access to clean water. The sub-urban areas are also
prone to malaria. The women in these areas generally depend on the Sub�centre or sometimes on

(26)
Guwahati Medical College and other Government hospitals in the City. They also find it difficult to
pursue the full course of the treatment.
In the urban areas, prescribed medicines were always available and a greater percentage
pursued the full course of the treatment as compared to rural areas.
Participation in public life
The state of participation in public life reflects almost the same picture in all districts. The
married and the elderly women are members of Mahila Samities and Credit and Thrift societies. In
rural areas women participate to some extent by organizing themselves as members of SHGs, some
are also members of Mahila Samities and Panchayats. In some of the SHGs, adolescent girls are
also members. Otherwise, there is no public participation of these younger groups of women. In the
urban areas, not only the adolescent girls but the educated young women also are absent from public
participation.
As to the literay rates among the sample respondents,the rural literacy rate in Kamrup has
been higher than the urban literacy rate. This is because, the sample comprises mostly the illiterate
factory workers and wage earners in urban areas. In Sualkuchi block most of the members among
both men and women are literates. Most of them are educated upto the HSLC or HS level but they
do not study further. A few of the respondents are also Graduates. In Sajjanpara, the percentage
of illiterates is higher than in Sualkuchi. Majority of the women have read upto the primary level
while the maximum level of education among the women being HS and among men Graduation and
Post graduation.
In the urban areas, the largest percentage of illiterates has been found among maid servants.
Some of them have read upto the primary level, the maximum level of education being read upto
the HS standard. Among the class of educated urban women the highest level of Education was post
A number of graduate and post graduate degree holders were also among the respondents in urban
areas.
Literacy and Education
The total literacy of the sample has been estimated at 78% while for the district it is 74.7%.
The sample male literacy rate of 80.5% is slightly lower than the district male literacy rate of 81.3%.
In case of the female literacy rate too, the sample figure of 66.5% is slightly lower than the district
figure of 67.3%. Both the sample figures and the district figures show that male literacy in Kamrup
is much higher than the female literacy.
4. LAKHIMPUR
In Lakhimpur, two blocks viz Dhakuakhana and Naobaicha were covered. Data were collected
from four villages viz., Jalbhari,Hiloidhari,Karunabari No.2 and Lakhimeegaon. 25 households from
urban areas were selected.
(27)
Work-Participation Rate
Among the sample respondents in Lakhimpur, the total work-participation rate is 62.2%. The
male work-participation rate of 71.5% is higher than the female work-participation rate (48.5%)
Quite a number of women are engaged in unpaid agricultural activities hidden as household
work.
Occupation, Nature of work and Income
In the rural areas of Lakhimpur, the average income earned by daily wage labour and the farm
labourers is around 1000. Women are also engaged as daily wage labour here and the wage rate
is reportedly same. Among the daily wage labour, no gender disparity in wage rates has been
reported, but in the case of farm labour, such biases exist. The nature of work, in both ncases, is
mainly casual
It has been observed from the data obtained that average income of cultivators is quite high
in Lakhimpur. Some of the cultivators with large areas of land earn monthly income upto Rs. 6000
to 7000 per month.
Petty businessmen in rural areas earn an average monthly income of around Rs. 2000.
Weaving and sericulture are practiced as household activities by many women and the earnings
of such households range between 2000 and 3000. Weaving is exclusively done by women though
sericulture is practised by both men and women. These women did these activities in addition to
household work so these activities are often referred to as sub occupation by them.
In the urban areas, both men and women are engaged in both govt and private services. The
average income from services is around 4000 though the income from private services is relatively
lower than in govt services.
In the urban areas, most women who do not go out to work do not also take up any activity
like weaving in the house.
Business activity is dominated by men though few women are engaged in business. The average
income earned from business activity is around Rs.3000 per month.
The daily wage labour earn around 1200 to 1500 though these rates differ from person to
person.
The family size among the sampled respondents in rural Lakhimpur is 5.4 and in urban areas
it is 4.8. This lowers the per capita income.

(28)
Land and Assets
From the data in the sample it is observed that most of the households possess their own land
in both rural and urban areas. In rural areas, the average size of land holding is around 3 bighas
Some of the households posses land area measuring upto 15-20 bighas.
In urban areas also most of the households in the sample possess land though the average
size of land holdings is comparatively small. Land and Assets are in the name of the head of the
household, i.e., a male.
Consumption and Savings
In rural Areas, people use to depend on home grown or locally available food products like
rice, vegetables and fish and as such are not completely dependent on the market for such items.
However, for other household goods they have to depend on the market and reported that the prices
of all such items have increased during the last few years. For selling their home produced woven
items, they also have to depend on local purchasers, NGOs or other midddlemen.
In the urban areas, people normally save in banks while in the rural areas, people save with
SHG�s. In Lakhimpur SHG�s are reported to be quite actively engaged in development works. Also
the rate of savings of most of the households in the rural areas is said to have increased.
Indebtedness
Instances of indebtedness are not commonly reported. Some cases which have actually been
reported show that loans have been taken primarily for treatment purposes.
Health and wellbeing
In the rural areas, doctors in the nearby areas are generally approached, the well todo take
their patients to Guwahati or elsewhere. The medicines prescribed by the doctors are not always
available in the local market, but majority of the households reported that that they pursue the full
course of the treatment. In the urban areas medicines are generally available and they pursue the
full course of the treatment.
Participation in public life
In the rural areas women�s participation in public life was more prevalent than in other districts
primarily under the Dhakuakhana block. Women were involved in decision making collectively by being
actively involved in SHG�s. Some women were also members of Women�s organizations and some
credit and Thrift societies.

(29)
Literacy and Education
Rural Lakhimpur occupies an enviable position with 80% literacy rate among the sample
respondents. The highest level of education is also quite A few of the women respondents were also
graduates while the majority was educated upto higher secondary or HSLC level.
Urban areas of Lakhimpur has been even better with 94.2 per cent literacy rate among the
sample respondents. There wer also a few post graduates among the respondents.
Comparing the sample literacy rates and district literacy rates of Lakhimpur it is observed that
the total literacy of the sample (81.8%) is higher than the district total literacy rate (69.6%). Both
the male literacy rates (83.9%) and the female literacy rates (76.3%) of the sample are higher than
the average district male literacy rate (78.3%) and female literacy rate (60.5%). In both the,i.e., for
both the district and the sample the male literacy rates are higher than the corresponding female
literacy rates.

(31)
SECTION - V
A FEW CASES
● One woman, who was working as helper to a mason, mastered the art of masonry and
constructed her own house all by herself. While working with the master mason, she shares
the work done by the men. Initially she also used to earn less than that of the men, but now
she claims and gets the same rate.
● A designed cloth produced in the handloom that sells for Rs.150/-, yarn worth Rs.100/- and
the weaver has to work for 2 and a half days. The producer doesnot know that the value of
her labour is also to be calculated to arrive at the actual cost of production. She takes fifty
rupees to be her profit, whereas she actually sells the product at loss.
● Sajjanpara is a tribal dominated village under Rani Block in Kamrup district. The inhabitants
here are basically dependent on agriculture but very few of them have landed property. In
Sajjanpara, a member from an SHG narrated a story about their survival strategy in the face
of crises.She is a member of a Self Help Group. The group consists of 11 members. They had
taken a loan from the Central Bank for piggery. As it took quite some time to get the loan,
they had already purchased the pigs with their own collected funds. With the loan amount,
they helped build the infrastructure of piggery, cover expenses of fodder and also helped a
cultivator to purchase land. They sold the pigs at a profit and rendered their physical help in
sowing in the land purchased by the cultivator with their funds. In exchange, arrangements were
made with the land owner to supply them with paddy grown in the land. Now they are
repaying the bank loan regularly.
● In Dhubri, one woman, read upto high school level and married to a daily wage earner, joins
a Self Help Group. After some time, she borrowed some money from the self help group and
purchased a rickshaw for her husband. Now she sends her children to school. Being a little
educated, can also teach her little children at home. She is now repaying the loan regularly.
● In every place, in the group discussions with women, a common problem that emerged was
the liquor menace. Liquor being easily available, the men folk, the young and the old alike,
drink freely, waste their hard earned money, sometimes even exercises force to extract whatever
little the womenfolk earn.

(32)
● The liquor menace has also increased the incidence of wife battering. The dowry problem is
also reported to have increased in the recent years. Elderly women from different areas
particularly in Dhubri complained that these days people have started to demand dowry openly
● Brick kilns are posing environmental as well as economic threat. These brick kilns are taking
over agricultural land, destroying the fertility of vast agricultural areas.They donot provide any
security to their labour and employ only on casual and informal basis.
● They donot get medical check up of their workers regularly and hence pose the threat of
spreading diseases.
● In a number of sub-urban areas, environmental hazards posed by the establishment of different
factories have been mentioned. While at one place, the complaint was that the ground water
level has gone down, their wells are getting dried, at another place, the compliant was that
grow vegetables or keep pet animals due to the pollution created by these factories and are
suffering from lung problems more frequently.
● At the same time, those factories also get support from some inhabitants as those factories
happen ro be the only avenue of employment for the inhabitants in the vicinity.
● Some had also observed that with the renovation of the highways, the residential areas/villages
in the vicinity have started getting inundated in the rainy season.
● Increasing vehicular traffic is also posing a threat to the common people.
● Unplanned construction of walls and buildings, fly- overs being made, multistorey buildings etc.
have increased health hazards and also many localities fall under the grip of artificial floods
because of these. These construction activities donot even create adequate employment avenues
as most of the works are done by machines
● The less educated girls working as vendors and/or marketing agents for different companies
and also the highly educated (often in non-technical disciplines) young women also haveto work
at low rates on casual and informal basis. The first group is extremely low paid, have to work
on commission basis and are mostly employed on casual basis. The other group is mostly
unemployed and/or underemployed. They, being skilled by virtue of their education and training
are hired by employers but appointments are casual and informal. One such respondent, who
happened to have a good MBA degree holder told that she was asked to work in a prestigious
and expensive school in the city and was also told that she will be given permanence if her
work is found satisfactory, but she could never procure any appointment letter from the
authorities. One such respondent had to leave a better job in a prestigious concern and opt
for a lower category job at another place as it became impossible for her to continue in the
former concern for the sexual harassment meted to her by some of the colleagues. They are
usually employed in low paid jobs and often work below their potential and capacity.

(33)
Section - VI
Summary of findings and concluding observations
The analysis of the impact of globalisation in Assam with respect to four districts, viz., Dhubri,
Hailakandi, Kamrup and Lakhimpur has been done after giving the condition of the State economy
during the post liberalisation era and also a profile of the four districts. The findings are summarised
below:
● The performance of the State economy is not encouraging during the post liberalisation period.
● The density of population in all the four districts is higher than the state average.
● The decadal growth rate of population is also higher than the State average in all the districts
except Lakhimpur.
● The sex ratios in each of the 4 districts have improved between 1991 and 2001. In 2001, the
sex ratio in Kamrup in both rural and urban areas and in rural Hailakandi has been lower than
the State average.
● The child sex ratio in the state declined from 975 in 1991 to 964 in 2001.Perceptible decrease
in child sex ratio has been observed also in urban Dhubri, rural Hailakandi, both rural and
urban Kamrup and rural and urban Lakhimpur. In rural Hailakandi the sex ratio decreased by
89 points.
● The literacy rate in the State as well as in all the 4 districts improved over the last one
decade.
● Female literacy rate is the lowest in rural Dhubri, followed by rural Hailakandi.
● Health infrastructure is very poor all over the state. In terms of hospitals, primary health
centres dispensaries and hospital beds per lakh of population, Hailakandi is the poorest among
all the four districts, followed by Dhubri, both the districts being below the State average. In
terms of rural family health centres per lakh of population, all the four districts are below the
state average, with Lakhimpur at the lowest position. Sub-centres per lakh of population is the
lowest in Dhubri, which is lower than the state average, the other districts are better than the
state average.

(34)
● Lakhimpur has the highest female work participation rate (fwpr) and is far above the other
districts.
● The fwpr increased between 1991 and 2001 in all the four districts.
● There has been an increase in the percentage of marginal workers in all the districts except
in rural Dhubri and rural Kamrup, where there is a marginal increase in the percentage of main
workers. In Lakhimpur, there has been significant increase in both main and marginal workers.
● In the state, there has been an upward trend in the unemployment rate of women between
1983-84 and 1993-94, but there was a marginal decline after that, although the unemployment
rate remained higher than the 1983-84 level. The intensity of the problem has been more
pronounced in the urban areas.
● The consumption pattern in the rural areas showed that nearly all the households are spending
more than they earn. In other words, all are in debt.
● There is a tendency to purchase newly introduced consumer products, fast food, soft
drinks,cosmetics etc.
● In rural Hailakandi, the women donot use even tooth paste and other commercial products of
daily use, for majority of them cannot afford such things or have not even heard of those.
● In Lala block in Hailakandi, where the people are somewhat better off, the purdah system
prevails.
● In the case of the urbanites, the branded articles get preference. A lot of new items of
consumption, hitherto unknown have entered into the consumption basket of the urbanites.
● Expenditure on food taken outside the home has been on the increase.
● Most people have to depend on the market for consumption goods as they either do not have
land for growing those, or they cannot cultivate anything due to pollution and/or floods etc.
● The general comment about consumer expenditure is that it has increased considerably during
the last few years.
● Education and medicines have become costlier. Prescribed medicines are not always available
in the local market.
● Majority of the respondents do not have the habit of savings as they do not have sufficient
income to save.
● Nearly in every household, one or the other women is working outside the home and/or for
payment.
(35)
● Although there is an increasing supply of women workers, the demand is not commensurate
with the same. Hence, most women can find employment only on casual and informal basis.
● Baring a few, other factories donot provide good working conditions to the workers.
● The jute craft factory comprises both regular and casual workers with no great difference of
income between the two.
● There is no significant difference in wages among regular and casual workers, but wage gap
exists between men and women.
● The gender disparity in the wage rate structure still persists in a number of occupations.
● The condition of brick kiln workers is very bad. They are not provided any kind of benefit like
leave, medical allowance etc.
● SHGs have become popular in all the four districts but in different degrees.
● SHGs have enabled many poor women to evolve survival strategies to suit their needs.
● With the application of new technology in road construction and related works, scope for
employment has decreased.
● The less educated girls working as vendors and/or marketing agents for different companies
and also the highly educated (often in non-technical disciplines) young women also have to
work at low rates on casual and informal basis
● Nearly all the women respondents except the service holders and a few women engaged in
the silk industry in Soalkuchi, self employed in Emroidery, knitting etc. live in abject poverty.
● The workers in the informal sector have only a hand to mouth living. In fact many of the
respondents could not provide information about any visible source of income.
● Majority of them donot possess any consumer durables or any other asset in their names and/
or in the household.
● But for a minimal few, that too mostly widows or single, none of the women own any resource
in their own names.
● Sub-urban areas are facing environmental problems due to the pollution emitted by some
factories.
● With more and more walls getting erected, highways and fly- overs being made, multistorey
buildings being constructed, many localities fall under the grip of artificial floods and have other
environment related problems.

(36)
● On an average, Participation in public life is low. SHGs are becoming popular among some
women while many of them are still ignorant about it. Mahila samities also give an opportunity
for women to participate in public life.
● The Self Help Groups are giving an opportunity to form women�s collectives but the treatment
meted to them by the representatives of power is not always conducive.
● The SHGs are engaged in different types of economic activities but in small scale. They do
not have information about the market and hence no control over it.
● Segregating the data according to head-ship of households, incidence of fhh have been found
to be quite high in the three districts of Dhubri, Hailakandi and Kamrup.
● Sexual harassment at work place is very much alien to the villagers and no such report was
received from any respondent from rural areas.
● Wife battering is but a common problem faced by the domestic workers and also by other
workers in the informal sector. They consider liquor to be the main cause of all this.
In conclusion, it can be said that, the impact of globalisation on the lives of women in Assam
is becoming increasingly visible. Changes have been observed in
● Increased female work participation rate
● Entry of more women into private, low- paid, informal and casual types of jobs.
● Educated women in non- technical subjects emerging as a socially vulnerable group.
● Move towards consumerism leading to popularity of non sustainable modes of consumption and
production.
● Unusual rise in the price level resulting in increased comsumer expenditure and decreased
savings.
● Emergence of new types of work avenues for women like that of beauty parlour, fast food
restaurants, front office jobs, work in the electronic media etc.
● Weakening of traditional avenues of employment, particularly the agriculture and allied sector.
● Environment related problems.
● Increase in the cost of educational and health.
● Emergence of a new working class women who do not have control over the process of
production, no security and safety.

(37)
● Emergence of Self Help Groups.
● Expansion of home based work avenues for women may eventually work as the withdrawal of
women from the social domain, which may pave the way for further exploitation of women.
Recommendation:
A number of recommendations emerge from the above analysis. The most urgent ones are:
❖ Identification of gender issues in the process of globalisation and negotiating with the
concerened parties.
❖ A well formulated State Policy for Women.

(38)
TABLE II.1 : Per Capita Income of Assam and India (in Rupees): 1980-81 to1992-93
Year At Current Prices At Constant (1980-81) Prices
Assam India Difference Difference Assam India Difference Difference
(India- in per cent (India- in per cent
Assam) Assam)
(1) (2) (3) (4) (5)= (6) (7 (8) (9)=
(4)/(2)*100 (8)/(6)*100
1980-81 1200 1630 430 35.83 1200 1630 430 35.83
1981-82 1474 1681 207 14.04 1307 1693 386 29.53
1982-83 1641 2004 363 22.12 1367 1691 324 23.70
1983-84 1777 2304 527 29.66 1375 1760 385 28.0
1984-85 2182 2504 322 14.76 1457 1811 354 24.30
1985-86 2313 2730 417 18.03 1483 1841 358 24.14
1986-87 2520 2962 442 17.54 1474 1871 397 26.93
1987-88 2589 3285 696 26.88 1521 1901 380 24.98
1988-89 2772 3842 1070 38.60 1516 2059 543 35.82
1989-90 3179 4354 1175 36.96 1650 2160 510 30.91
1990-91 3932 4964 1032 26.25 1719 2213 494 28.74
1991-92 4230 5582 1352 31.96 1915 2167 252 13.16
1992-93 5310 6249 939 17.68 2018 2216 198 9.81
Source: (i) GOI: Economic Survey, 1993-94 (ii) C.S.O. and (iii) GOA: Statistical Handbook(s)

(39)
TABLE II.2 : Per Capita Income of Assam and India (in Rupees): 1993-94 to 2000-01
Year At Current Prices At Constant (1993-94) Prices
Assam India Difference Difference Assam India Difference Difference
(India- in per cent (India- in per cent
Assam) Assam)
(1) (2) (3) (4) (5)= (6) (7) (8) (9)=
(4)/(2)*100 (8)/(6)*100
1993-94 5,715.0 7,698.0 1,983.00 34.70 5,715.0 7,698.0 1,983.00 34.70
1994-95 6,493.0 8,876.4 2,383.40 36.70 5,737.0 8,087.6 2,350.60 40.97
1995-96 7,001.0 10,160.3 3,159.30 45.13 5,760.0 8,498.5 2,738.50 47.54
1996-97 7,394.0 11,600.9 4,206.90 56.88 5,793.0 9,035.9 3,242.90 55.99
1997-98 7,966.0 12,771.5 4,805.50 60.33 5,796.0 9,287.9 3,491.90 60.25
1998-99 8,826.0 14,712.4 5,886.40 66.69 5,664.0 9,733.1 4,069.10 71.84
1999-2000 9,720.0 15,562.0 5,842.00 60.10 5,978.0 10,067.0 4,089.00 68.40
2000-01 10,198.0 16,487.0 6,289.00 61.67 6,157.0 10,254.0 4,097.00 66.54
Source: Government of Assam: Economic Survey, 2001-2002

(40)
TABLE II.3 : Percentage of total Workers, main workers and marginal workers to total workers
by residence and sex: Assam1991 and 2001
State/ Total/ Persons/ Percentage to total population
District Rural/ Male/ Workers
Urban Female Total Workers Main Workers Marginal Workers
1991 2001 1991 2001 1991 2001
Persons 36.1 35.9 31.2 26.6 4.9 9.3
Total Male 49.4 49.9 48.4 42.3 1.1 7.6
Female 21.6 20.8 12.6 9.7 9.0 11.1
Persons 36.7 36.4 31.3 26.1 5.4 10.3
Assam Rural Male 49.3 49.8 48.1 41.5 1.2 8.3
Female 23.3 22.3 13.3 9.9 10.0 12.4
Persons 30.9 32.0 30.4 29.6 0.5 2.4
Urban Male 50.5 51.0 50.2 48.2 0.3 2.8
Female 7.5 10.3 6.7 8.4 0.8 1.9
Source: Census of India 2001. Assam Provisional Population Totals. Paper-3 of 2001
TABLE II.4 : Incidence of Unemployment Assam and India: By area (As a percentage of labour force)
States/UTs 1983 1993-94 1999-2000
Male Female Persons Male Female Persons Male Female Persons
(1) (2) (3) (4) (5) (6) (7) (8) (9) (10)
Assam Rural 1.9 1.9 1.9 4.5 8.1 5.3 3.2 6.6 3.9
Assam Urban 4.2 10.8 4.8 5.5 27.8 8.7 7.7 18.9 9.7
All India Rural 1.4 0.7 1.1 1.5 0.8 1.2 1.7 1.0 1.5
All India Urban 5.0 5.2 5.1 4.1 6.6 4.6 4.5 5.7 4.7
Source: The 38th and the 50th Rounds of the NSSO Report on Employment and Unemployment Situation
in India.
As presented in NATIONAL HUMAN DEVELOPMENT REPORT, 2001
NSSO Report on Employment and Unemployment Situation in India 55th Round, Report No.458(55/10/
2)

(41)
Table III.1 : Size of Population by Districts : 1991-2001
Districts 1991 2001 Density per Sq. Km.,
Population Population 2001
1. Dhubri* 1324404 (12.31) 1634589 (12.72) 584
2. Hailakandi 449048 (4.17) 542978 (4.23) 409
3. Kamrup 1385659 (12.88) 1642420 (12.78) 579
4. Lakhimpur 751517 (6.99) 889325 (6.92) 391
Assam 10,756,333 (100.00) 12,850,608 (100.00) 340
Note: figures in brackets indicate percentage to total State population.
Source: Census figures
Table III.2 : Decadal Growth rate of Population
Sl. Districts/State Decadal Growth Rate
No. 1901-11 1911-21 1921-31 1931-41 1941-51 1951-61 1961-71 1971-91 1991-01
(1) (2) (3) (4) (5) (6) (7) (8) (9) (10) (11)
1 Dhubri * +29.97 +26.92 +15.76 +14.83 +9.25 +27.44 +40.45 +56.47 +23.42
2 Hailakandi +16.09 +7.59 +7.08 +10.29 +17.48 +27.23 +23.61 +45.94 +20.92
3 Kamrup +11.10 +7.06 +9.38 +19.21 +17.17 +37.73 +38.80 +65.72 +25.75
4 Lakhimpur +26.29 +34.07 +23.91 +22.70 +17.95 +50.46 +43.39 +56.29 +18.34
Assam +16.99 +20.48 +19.91 +20.40 +19.93 +34.98 +34.95 +53.26 +18.85
Source: Census figures

(42)
TABLE III.3 : TREND IN THE SEX RATIO: By DISTRICTS 1971-2001.
(Per 1000 males)
State/Districts Area 1971 1991 2001
TOTAL 896 923 932
ASSAM RURAL 912 934 940
URBAN 744 838 878
Total 930 950 944
1. Dhubri Rural 944 953 945
Urban 824 927 942
Total 855 879 894
2. Kamrup Rural 898 925 929
Urban 706 791 835
Total 923 929 933
3. Hailakandi Rural 924 928 931
Urban 906 944 954
Total 895 931 952
4. Lakhimpur Rural 910 941 958
Urban 656 801 879
1981 census was not conducted in Assam
@ Worked out on the basis of interpolated figures of Assam
SOURCE: Census of India 2001: Assam: Provisional Population Totals. Rural-Urban Distribution. Paper-
2 of 2001. Census of India 1991: Assam State District Profile 1991.

(43)
TABLE III.4 : Child Sex ratio:By districts : 1991-2001
State/Districts Area Sex ratio of child population (0-6) age group.
(Per 1000 Male Child)
1991 2001 Gain(+)/loss(-)
1. Dhubri Rural 979 986 +7
Urban 968 956 -12
2. Hailakandi Rural 989 900 -89
Urban 948 959 +11
3. Kamrup Rural 978 959 -19
Urban 947 888 -59
4. Lakhimpur Rural 974 965 -9
Urban 947 921 -26
Source: Census of India 2001; Assam; Provisional Population Totals; Rural Urban Distribution ; PAPER-
2 of 2001.
TABLE III.5 : Literacy Rates by Sex in India and Assam (1961-2001)
State/ Assam India Male Female Gap
India Male Female Total Male Female Total Assam India
1991 61.87 43.03 52.89 64.13 39.29 52.21 18.84 24.84
2001 71.93 56.03 64.28 75.85 54.16 65.38 15.9 21.70
Source: Census Reports

(44)
TABLE III.6 : Literacy Rates by sex: by districts (1981-2001)
Districts Area 1991 2001
Person Male Female Person Male Female
(1) (2) (3) (4) (5) (6) (7) (8)
Total 38.36 47.38 28.79 49.86 56.61 42.64
(-14.53) (-18.59) (-14.42) (-13.97)
1. Dhubri Rural 33.55 42.74 23.82 45.73 52.52 38.46
(-18.92) (-14.06)
Urban 69.36 76.75 61.31 78.20 84.77 71.21
(-15.44) (-13.56)
Total 53.07 64.08 41.04 59.84 68.47 50.65
(0.18) (23.04) (-4.44) (-17.82)
2. Hailakandi Rural 50.19 61.80 37.47 57.10 66.22 47.38
(-24.33) (-18.84)
Urban 85.30 89.96 80.35 87.34 91.31 83.17
(-9.61) (-8.14)
Total 65.04 73.67 55.01 74.69 81.24 67.31
(12.15) (-18.66) (10.41) (-13.03)
3. Kamrup Rural 56.88 66.95 45.83 67.68 75.77 58.92
(-21.12) (-16.85)
Urban 80.57 85.51 74.16 86.61 90.07 82.43
(-11.35) (-7.64)
Total 58.96 68.28 48.85 69.59 78.26 60.47
(6.07) (-19.43) (5.31) (-17.79)
4. Lakhimpur Rural 57.74 67.29 47.51 68.67 77.64 59.29
(-19.78) (-18.35)
Urban 75.46 80.57 68.87 80.78 85.40 75.50
(-11.7) (-9.9)
Note: (i) figures in brackets in col nos. (3) and (6) represent the gap (+/-) between the literacy rate
in the district and the State
(ii) figures in brackets in col nos. (5) and (8) represent the gap(+/-) between the male and
female literacy rates
Source: Census Reports
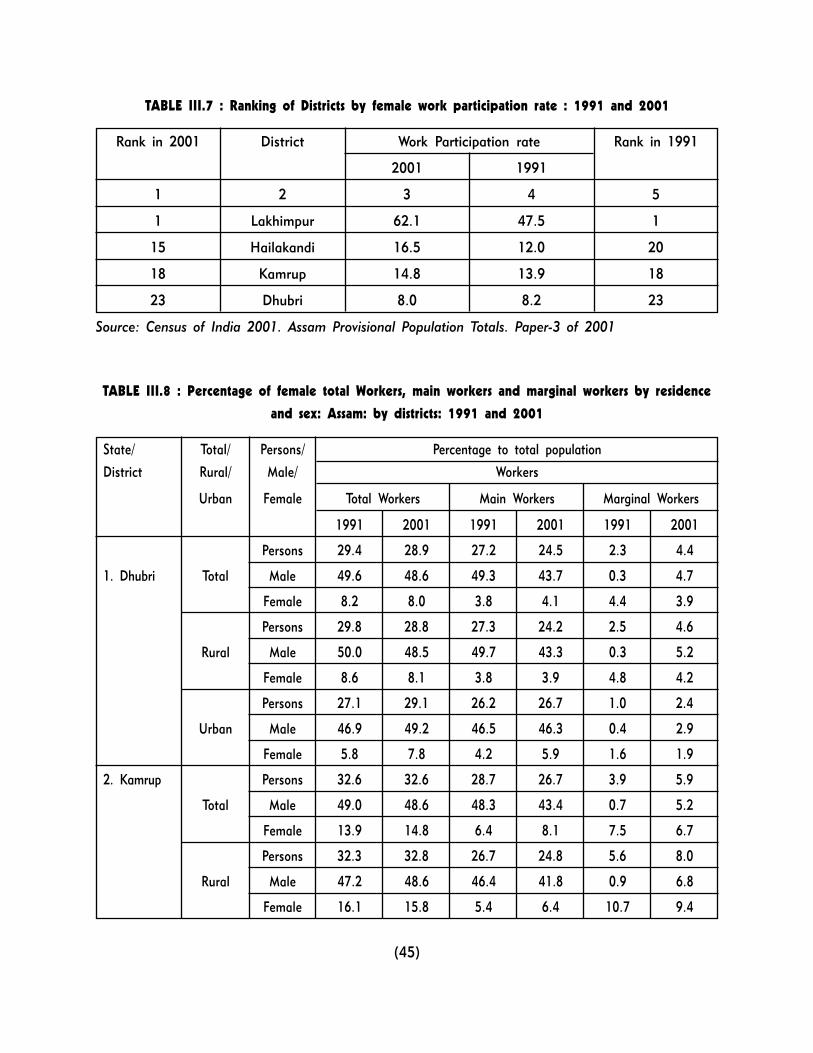
(45)
TABLE III.7 : Ranking of Districts by female work participation rate : 1991 and 2001
Rank in 2001 District Work Participation rate Rank in 1991
2001 1991
1 2 3 4 5
1 Lakhimpur 62.1 47.5 1
15 Hailakandi 16.5 12.0 20
18 Kamrup 14.8 13.9 18
23 Dhubri 8.0 8.2 23
Source: Census of India 2001. Assam Provisional Population Totals. Paper-3 of 2001
TABLE III.8 : Percentage of female total Workers, main workers and marginal workers by residence
and sex: Assam: by districts: 1991 and 2001
State/ Total/ Persons/ Percentage to total population
District Rural/ Male/ Workers
Urban Female Total Workers Main Workers Marginal Workers
1991 2001 1991 2001 1991 2001
Persons 29.4 28.9 27.2 24.5 2.3 4.4
1. Dhubri Total Male 49.6 48.6 49.3 43.7 0.3 4.7
Female 8.2 8.0 3.8 4.1 4.4 3.9
Persons 29.8 28.8 27.3 24.2 2.5 4.6
Rural Male 50.0 48.5 49.7 43.3 0.3 5.2
Female 8.6 8.1 3.8 3.9 4.8 4.2
Persons 27.1 29.1 26.2 26.7 1.0 2.4
Urban Male 46.9 49.2 46.5 46.3 0.4 2.9
Female 5.8 7.8 4.2 5.9 1.6 1.9
2. Kamrup Persons 32.6 32.6 28.7 26.7 3.9 5.9
Total Male 49.0 48.6 48.3 43.4 0.7 5.2
Female 13.9 14.8 6.4 8.1 7.5 6.7
Persons 32.3 32.8 26.7 24.8 5.6 8.0
Rural Male 47.2 48.6 46.4 41.8 0.9 6.8
Female 16.1 15.8 5.4 6.4 10.7 9.4

(46)
State/ Total/ Persons/ Percentage to total population
District Rural/ Male/ Workers
Urban Female Total Workers Main Workers Marginal Workers
1991 2001 1991 2001 1991 2001
Persons 33.3 32.4 32.9 30.3 0.4 2.1
Urban Male 52.3 48.6 52.0 46.1 0.3 2.5
Female 9.2 12.9 8.7 11.3 0.6 1.6
Persons 42.9 56.1 32.1 32.3 10.7 23.8
Total Male 47.5 62.1 45.3 45.1 2.3 17.0
Female 37.8 49.9 18.0 19.0 19.8 30.9
Persons 43.3 57.7 32.2 32.3 11.4 25.4
3. Lakhimpur Rural Male 47.4 62.6 45.0 44.5 2.4 18.1
Female 39.7 52.5 18.7 19.6 21.0 32.9
Persons 31.3 36.6 30.8 33.1 0.5 3.5
Urban Male 49.7 55.3 49.4 52.3 0.3 3.0
Female 8.4 15.3 7.7 11.3 0.7 4.0
Persons 31.5 33.3 29.1 25.4 2.4 7.9
Total Male 49.6 49.0 48.9 41.6 0.7 7.4
Female 12.0 16.5 7.8 8.1 4.2 8.4
Persons 31.8 33.7 29.2 25.3 2.5 8.4
4. Hailakandi Rural Male 49.8 49.0 49.1 41.2 0.7 7.8
Female 12.3 17.2 7.8 8.2 4.5 9.0
Persons 28.3 29.8 27.5 26.8 0.8 3.0
Urban Male 47.2 48.7 46.8 45.2 0.4 3.5
Female 8.2 10.0 7.0 7.4 1.2 2.6
Source: Census of India 2001. Assam Provisional Population Totals. Paper-3 of 2001

(47)
TABLE III.9 : Health Infrastructure (Per lakh of population): by Districts, 2000-2001
Assam/Districts Hospitals Primary Dispensaries Beds Rural Family Sub Centres
Health Welfare
Centres Planning
Centres
(1) (2) (3) (4) (5) (6) (7)
1. Dhubri 0.67 1.41 0.73 33.71 0.43 18.54
2. Hailakandi 0.37 1.47 0.37 14.73 0.74 20.63
3. Kamrup 1.16 3.11 2.56 151.43 0.79 30.44
4. Lakhimpur 0.79 2.59 0.67 35.53 0.45 19.79
Assam Total Per
lakh of population 0.60 2.29 1.21 48.38 1.01 19.21
Note: Last row estimated from the totals for Assam
Source: Statistical Handbook Assam, 2002

(48)
TABLE III.10 : Availability of electricity, Safe Drinking Water and Toilet Facilities to Households,
1991 : Assam : By Districts
Assam/Districts Total/ Total No. Percent Households Having
Rural/ of Electricity Safe Toilet All The None of
Urban Households Drinking Three The Three
Water Facilities Facilities
TOTAL 3798360 18.74 45.86 37.43 9.25 34.75
ASSAM RURAL 3326700 12.44 43.28 30.53 4.50 38.85
URBAN 471660 63.21 64.07 86.06 42.69 5.90
Total NA 11.77 56.10 29.64 5.43 32.22
1. Dhubri Rural NA 6.67 56.28 23.79 2.36 34.86
Urban NA 47.64 54.84 70.77 27.09 13.62
Total 77925 19.03 18.54 60.97 8.73 32.10
2. Hailakandi Rural 71915 14.50 13.48 58.17 4.19 34.57
Urban 6010 73.21 79.12 94.59 63.06 2.50
Total 345685 33.82 57.71 49.76 18.58 20.30
3. Kamrup Rural 217800 13.82 58.82 26.40 5.40 29.59
Urban 127885 67.83 55.82 89.47 40.98 4.48
Total 119950 13.83 29.03 24.88 2.66 49.84
4. Lakhimpur Rural 110255 10.18 29.14 19.44 1.60 53.57
Urban 9695 55.31 27.84 86.80 14.74 7.42
Note NA � Data not available,Source: Census of India 1991: Assam State District Profile 1991
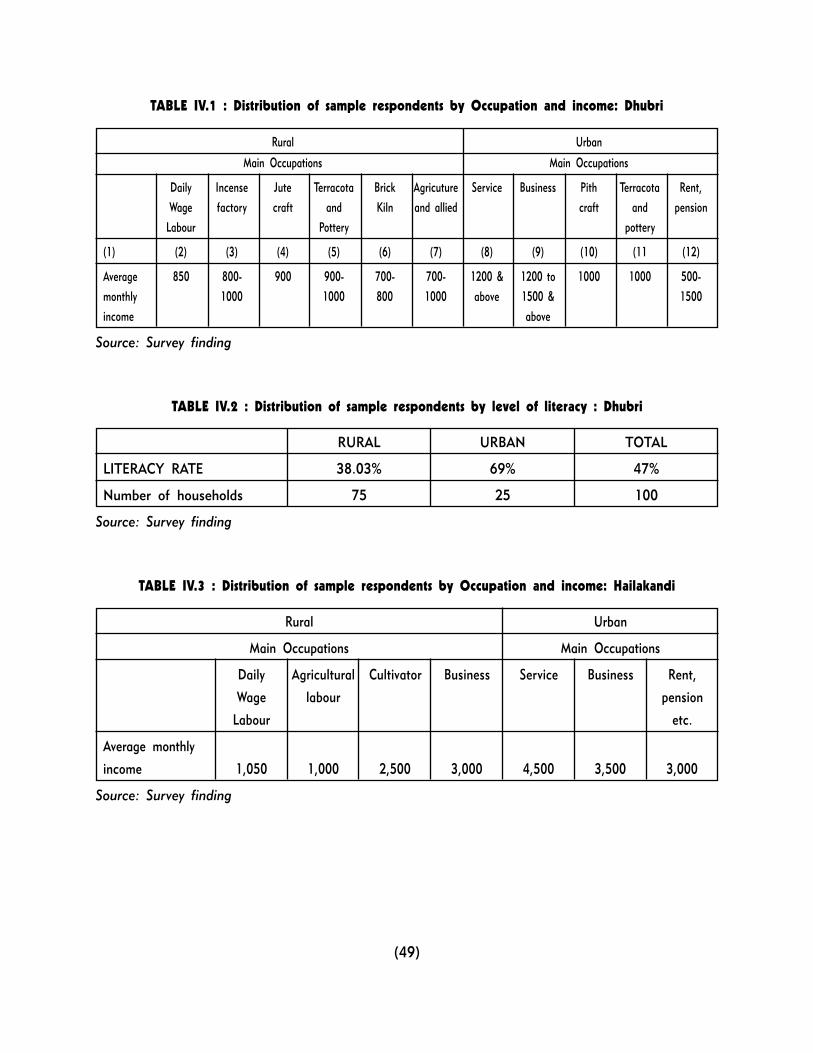
(49)
TABLE IV.1 : Distribution of sample respondents by Occupation and income: Dhubri
Rural Urban
Main Occupations Main Occupations
Daily Incense Jute Terracota Brick Agricuture Service Business Pith Terracota Rent,
Wage factory craft and Kiln and allied craft and pension
Labour Pottery pottery
(1) (2) (3) (4) (5) (6) (7) (8) (9) (10) (11 (12)
Average 850 800- 900 900- 700- 700- 1200 & 1200 to 1000 1000 500-
monthly 1000 1000 800 1000 above 1500 & 1500
income above
Source: Survey finding
TABLE IV.2 : Distribution of sample respondents by level of literacy : Dhubri
RURAL URBAN TOTAL
LITERACY RATE 38.03% 69% 47%
Number of households 75 25 100
Source: Survey finding
TABLE IV.3 : Distribution of sample respondents by Occupation and income: Hailakandi
Rural Urban
Main Occupations Main Occupations
Daily Agricultural Cultivator Business Service Business Rent,
Wage labour pension
Labour etc.
Average monthly
income 1,050 1,000 2,500 3,000 4,500 3,500 3,000
Source: Survey finding

(50)
TABLE IV.4 : Distribution of respondents by level of literacy- HAILAKANDI
RURAL URBAN TOTAL
LITERACY RATE 77.4% 94.3% 80.2%
Number of households 75 25 100
Source: Survey finding
TABLE IV.5 : Distribution of sample respondents by Occupation and household income: Kamrup
Rural Urban
Main Occupations Main Occupations
Weaving Cultivator Daily wage Service Vendors tailors Factory Vendors Educated Domestic
& and farm and workers and women Servants
weaving labour shopkeepers, shopkeepers working
related pension as casual
holders workers
Average
monthly
income 3,200 2500 1000 1,300 1,200 1,300 1500 1000 2,400 1,500
Source: Survey finding
Table IV.6 : Distribution of sample respondents by level of Literacy: Kamrup
RURAL URBAN TOTAL
LITERACY RATE 79.6% 72.8% 78%
Number of households 75 75 150
Source: Survey finding

(51)
TABLE IV.7 : Distribution of sample respondents by Occupation and household income : Kamrup
Rural Urban
Main Occupations Main Occupations
Weaving Cultivator Daily wage Service Vendors tailors Factory Vendors Educated Domestic
& and farm and workers and women Servants
weaving labour shopkeepers, shopkeepers working
related pension as casual
holders workers
Average
monthly
income 3,200 2500 1000 1,300 1,200 1,300 1500 1000 2,400 1,500
Source: Survey finding
Table IV.8 : Distribution of sample respondents by level of Literacy: Kamrup
RURAL URBAN TOTAL
LITERACY RATE 79.6% 72.8% 78%
Number of households 75 75 150
Source: Survey finding

(52)
TABLE IV.9 : Distribution of respondents by Occupation and Income: LAKHIMPUR
Rural Urban
Main Occupations Main Occupations
Daily Agricultural Cultivator Business Teaching, Service Business Teaching,
Wage labour other govt. other govt.
Labour and private and private
services services
Average 1000 1000 3000 2000 900-6000 4000 3000 to 1000-6000
monthly 3500
income
Source: Survey finding
TABLE IV.10 : Distribution of respondents by level of literacy: Lakhimpur
RURAL URBAN TOTAL
LITERACY RATE 80% 94.2% 81.8%
Number of households 75 25 100
Source: Survey finding

IMPACT OF GLOBALISATION ON THE
WOMEN OF ASSAM
Study conducted by
DR. ARCHANA SHARMAReader in Economics
and Director I/C
NATIONAL COMMISSION FOR WOMENNEW DELHI

CONTENTS
Foreword (i)
Preface (iii)
References (v)
Section-I Introduction 1
Section-II The economy of assam in the context of globalisation 5
Section-III Profile of the Districts 9
Section-IV Survey Findings 11
Section-V A Few Cases 31
Section-VI Summary of findings and concluding observations 33
Tables 38
FOREWORD
The Government of India announced its New Economic Policy in 1991. That paved the way for
globalisation. This was done with the main objective of achieving trade linked growth. The policy
objectives also include improvement of the quality of life of the poor and the marginalised and particularly
women. However, the globalisation process has seemed to have made contradictory impacts on the lives
of women. Export augmentation, modernisation of agriculture through technological inputs and the free
play of MNC�s have adversely affected women�s lives. Their livelihood strategies, employment opportunities
and health are under threat. The increased consumerism and changed lifestyles accompanying the
globalisation process have been found to have pressurised women�s lives and also are exposing them
more to violence. At the same time, more women are getting the opportunity and the freedom to
participate in paid activities and in public life.
To ensure the well being of the women in the face of the threats coming with globalisation,it is
essential to ensure policies that can National Commission for Women, in collaboration with various
organisations conducted a few public hearings in Karnataka, West Bengal, Punjab and Uttar Pradesh.
The public hearings were aimed at documenting the experience of rural women in the background of
globalisation and WTO agreement. The public hearings also aimed at mobilising the solutions from
among the affected women themselves, which could constitute an important input for formulating pro-
women agricultural development policies. In those public hearings, the rural women voiced their grievances
arising out of the provisions of WTO. They narrated their sufferings that had occurred due to the
imposition of certain norms by the MNCs. The State also could not do anything to protect these women
as the policies are centrally formulated and implemented.
In Assam, no such public hearing could be conducted. However, the present study proposed by
Dr. Archana Sharma was supported by the NCW. This study is based on primary data collected from
four different districts viz., Dhubri, Hailakandi, Kamrup and Lakhimpur. The four districts have varied
characteristics and hence could represent the conditions of women in different occupations.
Dr. Poornima Advani
Place : New Delhi Chairperson
Dated : January, 2005 National Commission for Women
(i)

PREFACE
More than a decade has elapsed since the process of Liberalisation, Privatisation and Globalisation
was formally launched in the country through the New Economic Policy. Now the country is on the
verge of the next phase of globalisation. I am grateful to the National Commission for Women and
its Chairperson Dr. Poornima Advani for sponsoring this research study at this crucial point of time.
I thank all those who were associated with the study including the investigators who were
engaged for collection of the field data. Ms. Debabani Chakravorty helped me through the analysis of
the data, I gratefully acknowledge her contribution. I take this opportunity also to offer my deep
gratitude to all the respondents in the study without whose co-operation this study would never have
taken shape.
Globalisation is an ongoing process and it has its impact on different aspects of life also is
spread over time and space. As such, it is not possible to assess the impact of globalisation completely
within the limitation of a time bound study. However, attempts have been made, in the present study,
to get an idea of the type of the impact so far felt by the women in Assam. I have tried to avoid errors
and omissions in each stage of the study and beg apology for any undesired flaws that might have
crept in unknowingly.
I hope this report motivates the policy makers to adopt some more gender friendly policies in
the next phase of reforms. Such policies are required to create an enabling atmosphere for the women
to take the opportunities and face the challenges of globalisation.
Place : Guwahati Archana Sharma
Dated : 25.12.2004
(iii)

REFERENCES
Bhattacharya, Malini (ed) 2004 Globalization: Perspectives in Women�s Studies Tulika Books, New Delhi
in association with School of Women�s Studies, Jadavpur University
Munck Ronald : 2002 Globalisation and Labour: The new �Great Transformation� Madhyam Books,Delhi.
Bagchi Amiya Kumar 1999Globalisation, Liberalisation and Vulnerability India and Third World EPW
Special Articles November 6,
Bharucha Rustom 1999 Politics of Culturalisms in an Age of Globalisation Discrimination, Discontent
and Dialogue EPW Special Articles February 20-26,
Kurien C T 1999Globalisation : A Cautionary Note EPW Perspectives December 25, National
Commission for Women 2005: Situational Analysis of Women in Assam Petras James 1999
Globalisation: A Socialist Perspective EPW Perspectives February 20-26,
Srinivasan T N1998 : Developing Countries and the Multilateral Trading System: From the GATT to
the Uruguay Round and the Future Oxford University Press, Delhi.
Shroff Manu 1999 Globalisation : A Stock-Taking EPW Perspectives October 2
(v)