Embed Size (px)
Citation preview

Section 1:
Charts and Graphs
2019 City of Fairway Community Survey: Findings Report
ETC Institute (2019) Page 1

63%
45%
52%
45%
56%
40%
44%
34%
30%
31%
31%
46%
37%
43%
31%
44%
39%
40%
43%
36%
3%
7%
10%
10%
11%
11%
11%
17%
22%
22%
2%
2%
2%
3%
3%
5%
6%
10%
6%
11%
Overall quality of police services
Overall quality of services provided by the City
Overall quality of parks & rec programs/facilities
Overall effectiveness of communication with public
Overall quality of customer service
Overall quality of solid waste services
Overall maint. of streets/buildings/facilities
Overall flow of traffic & congestion management
Overall enforcement of codes & ordinances
0% 20% 40% 60% 80% 100%
Very Satisfied (5) Satisfied (4) Neutral (3) Dissatisfied (2/1)
Q1. Satisfaction With Major Categories of City Services
Source: ETC Institute (2019 - City of Fairway, KS)
by percentage of respondents (excluding “don't know”)
Overall effectiveness of community planning & development
70%
68%
36%
17%
17%
17%
16%
11%
9%
5%
Overall quality of police services
Overall maint. of streets/buildings/facilities
Overall quality of solid waste services
Overall enforcement of codes & ordinances
Overall quality of parks & rec programs/facilities
Overall flow of traffic & congestion management
Overall quality of services provided by the City
Overall effectiveness of communication with public
Overall quality of customer service
0% 20% 40% 60% 80% 100%
1st choice 2nd choice 3rd choice
Q2. City Services That Residents Think Are Most Important for the City to Provide
by percentage of respondents who selected the item as one of their top three choices
Source: ETC Institute (2019 - City of Fairway, KS)
Overall effectiveness of community planning & development
2019 City of Fairway Community Survey: Findings Report
ETC Institute (2019) Page 2

64%
61%
65%
47%
35%
32%
34%
30%
43%
43%
4%
4%
5%
6%
17%
1%
1%
0%
3%
6%
Overall quality of life in the City
Overall image of the City
Overall feeling of safety in the City
Overall appearance of the City
Overall value for City tax dollars & fees
0% 20% 40% 60% 80% 100%
Very Satisfied (5) Satisfied (4) Neutral (3) Dissatisfied (2/1)
Q3. Satisfaction With Items That Influence Residents’ Perceptions of the City
by percentage of respondents (excluding “don't know”)
Source: ETC Institute (2019 - City of Fairway, KS)
49%
55%
34%
39%
40%
35%
35%
32%
42%
28%
42%
37%
31%
34%
34%
28%
8%
15%
21%
21%
27%
25%
27%
36%
2%
2%
2%
3%
2%
6%
4%
4%
Maintenance of City parks
City swimming pool
City special events and festivals
Ease of registering for programs
Youth recreation programs
Fees charged for recreation programs
Adult recreation programs
Senior recreation programs
0% 20% 40% 60% 80% 100%
Very Satisfied (5) Satisfied (4) Neutral (3) Dissatisfied (2/1)
Q4. Satisfaction With Parks and Recreation
Source: ETC Institute (2019 - City of Fairway, KS)
by percentage of respondents (excluding “don't know”)
2019 City of Fairway Community Survey: Findings Report
ETC Institute (2019) Page 3

75%
64%
31%
31%
14%
10%
9%
5%
Maintenance of City parks
City swimming pool
City special events and festivals
Youth recreation programs
Fees charged for recreation programs
Senior recreation programs
Adult recreation programs
Ease of registering for programs
0% 20% 40% 60% 80% 100%
1st choice 2nd choice 3rd choice
Q5. Parks and Recreation Services That Residents Think Are Most Important for the City to Provide
by percentage of respondents who selected the item as one of their top three choices
Source: ETC Institute (2019 - City of Fairway, KS)
56%
30%
27%
26%
21%
15%
3%
A desire to be outdoors
Playground equipment
Family or social gathering
Physical fitness
Cultural activities (festivals, fairs, concerts)
A place to reflect and contemplate
Hobbies
0% 20% 40% 60% 80% 100%
1st choice 2nd choice
Q7. Top Reasons for Visiting a Parkby percentage of respondents who selected the item as one of their top two choices
Source: ETC Institute (2019 - City of Fairway, KS)
2019 City of Fairway Community Survey: Findings Report
ETC Institute (2019) Page 4

66%
61%
55%
56%
44%
44%
28%
32%
36%
35%
41%
36%
5%
6%
8%
6%
13%
13%
1%
2%
1%
3%
3%
6%
How quickly police respond to emergencies
Overall quality of police services
The City's efforts to prevent crime
The visibility of police in neighborhoods
The visibility of police in commercial/retail area
Enforcement of local traffic laws
0% 20% 40% 60% 80% 100%
Very Satisfied (5) Satisfied (4) Neutral (3) Dissatisfied (2/1)
Q8. Satisfaction With Public Safety Servicesby percentage of respondents (excluding “don't know”)
Source: ETC Institute (2019 - City of Fairway, KS)
56%
50%
43%
14%
13%
7%
The visibility of police in neighborhoods
How quickly police respond to emergencies
The City's efforts to prevent crime
Overall quality of police services
Enforcement of local traffic laws
The visibility of police in commercial/retail area
0% 20% 40% 60% 80% 100%
1st choice 2nd choice
Q9. Public Safety Services That Residents Think Are Most Important for the City to Provideby percentage of respondents who selected the item as one of their top two choices
Source: ETC Institute (2019 - City of Fairway, KS)
2019 City of Fairway Community Survey: Findings Report
ETC Institute (2019) Page 5

76%
67%
65%
55%
54%
54%
20%
28%
30%
36%
36%
36%
3%
5%
5%
8%
8%
10%
1%
0%
0%
2%
2%
1%
In neighborhoods during the day
In commercial and retail areas during the day
Overall feeling of safety in Fairway
In neighborhoods at night
In commercial and retail areas at night
In City parks
0% 20% 40% 60% 80% 100%
Very Safe (5) Safe (4) Neutral (3) Unsafe (2/1)
Q10. Perceptions of Safetyby percentage of respondents (excluding “don't know”)
Source: ETC Institute (2019 - City of Fairway, KS)
28%
25%
24%
23%
20%
50%
41%
39%
37%
38%
19%
20%
23%
21%
24%
3%
14%
13%
19%
18%
Enforcing exterior maint. of business property
Enforcing mowing/cutting of weeds/tall grass
Overall quality of the building and permit process
Enforcing clean-up of debris on private property
Enforcing exterior maint. of residential property
0% 20% 40% 60% 80% 100%
Very Satisfied (5) Satisfied (4) Neutral (3) Dissatisfied (2/1)
Q11. Satisfaction With Code Enforcementby percentage of respondents (excluding “don't know”)
Source: ETC Institute (2019 - City of Fairway, KS)
2019 City of Fairway Community Survey: Findings Report
ETC Institute (2019) Page 6

49%
46%
36%
21%
19%
Enforcing exterior maint. of residential property
Enforcing clean-up of debris on private property
Enforcing mowing/cutting of weeds/tall grass
Overall quality of the building and permit process
Enforcing exterior maint. of business property
0% 10% 20% 30% 40% 50% 60%
1st choice 2nd choice
Q12. Code Enforcement Activities That Residents Think Are Most Important for the City to Provide
by percentage of respondents who selected the item as one of their top two choices
Source: ETC Institute (2019 - City of Fairway, KS)
74%
73%
50%
48%
38%
48%
37%
34%
36%
24%
24%
41%
41%
46%
34%
43%
38%
36%
1%
2%
6%
8%
11%
10%
11%
16%
18%
0%
1%
3%
3%
5%
7%
9%
11%
10%
Snow removal on major city streets
Snow removal on neighborhood streets
Overall cleanliness of city streets/public areas
Mowing/trimming along city streets/public areas
Maintenance of major city streets
Limb removal after city-wide storm damage
Maintenance of neighborhood streets
Tree trimming/urban forestry
Adequacy of city street lighting
0% 20% 40% 60% 80% 100%
Very Satisfied (5) Satisfied (4) Neutral (3) Dissatisfied (2/1)
Q13. Satisfaction With City Maintenance Servicesby percentage of respondents (excluding “don't know”)
Source: ETC Institute (2019 - City of Fairway, KS)
2019 City of Fairway Community Survey: Findings Report
ETC Institute (2019) Page 7

49%
44%
38%
35%
29%
24%
17%
17%
9%
Maintenance of neighborhood streets
Maintenance of major city streets
Snow removal on neighborhood streets
Snow removal on major city streets
Overall cleanliness of city streets/public areas
Limb removal after city-wide storm damage
Adequacy of city street lighting
Tree trimming/urban forestry
Mowing/trimming along city streets/public areas
0% 10% 20% 30% 40% 50% 60%
1st choice 2nd choice 3rd choice
Q14. City Maintenance Services That Residents Think Are Most Important for the City to Provide
by percentage of respondents who selected the item as one of their top three choices
Source: ETC Institute (2019 - City of Fairway, KS)
47%
49%
35%
40%
35%
32%
8%
10%
17%
6%
6%
16%
Residential curbside trash & recycling collection
Residential curbside yard waste collection
Residential curbside bulk item collection
0% 20% 40% 60% 80% 100%
Very Satisfied (5) Satisfied (4) Neutral (3) Dissatisfied (2/1)
Q15. Satisfaction With Trash and Recycling Servicesby percentage of respondents (excluding “don't know”)
Source: ETC Institute (2019 - City of Fairway, KS)
2019 City of Fairway Community Survey: Findings Report
ETC Institute (2019) Page 8

64%
55%
51%
11%
7%
City website
City email program
Recreation brochure
City Facebook page
Public meetings
0% 20% 40% 60% 80% 100%
Q16. Sources of Information About the Cityby percentage of respondents (multiple selections could be made)
Source: ETC Institute (2019 - City of Fairway, KS)
33%
38%
38%
35%
27%
24%
26%
51%
46%
41%
44%
42%
36%
33%
13%
15%
19%
16%
26%
32%
39%
2%
1%
2%
5%
5%
8%
2%
Availability of info about City programs/services
The content of the City’s newsletter
The content of the City e-mail program
City efforts to inform about local issues
The usefulness of the City's web page
Public involvement in local decision making
Information provided through City’s Facebook page
0% 20% 40% 60% 80% 100%
Very Satisfied (5) Satisfied (4) Neutral (3) Dissatisfied (2/1)
Q17. Satisfaction With City Communicationby percentage of respondents (excluding “don't know”)
Source: ETC Institute (2019 - City of Fairway, KS)
2019 City of Fairway Community Survey: Findings Report
ETC Institute (2019) Page 9

Yes52%
No48%
Q18. Have you contacted the City with a question, problem, or complaint during the past year?
Source: ETC Institute (2019 - City of Fairway, KS)
by percentage of respondents
72%
65%
61%
59%
55%
19%
24%
22%
21%
14%
4%
9%
10%
13%
16%
4%
3%
8%
8%
16%
They were courteous and polite
They were easy to contact
Did what they said they would do in timely manner
They gave prompt, accurate & complete answers
They helped resolve an issue
0% 20% 40% 60% 80% 100%
Always (5) Usually (4) Sometimes (3) Seldom/Never (2/1)
Q18b. How Often City Employees Have Displayed the Following Behaviors
by percentage of respondents who contacted the City during the past year (excluding “don't know”)
Source: ETC Institute (2019 - City of Fairway, KS)
2019 City of Fairway Community Survey: Findings Report
ETC Institute (2019) Page 10

17%
13%
27%
20%
33%
37%
24%
30%City should pursue expanded areas for office and/o
0% 20% 40% 60% 80% 100%
Strongly Agree (5) Agree (4) Neutral (3) Disagree (2/1)
Q19. Agreement With the Following Statements Regarding Development in the City of Fairway
by percentage of respondents (excluding “don't know”)
City should pursue expanded areas for office and/or retail economic development
Source: ETC Institute (2019 - City of Fairway, KS)
City should pursue mixed use development within existing business footprint
Q20. In your opinion, what is the best potential use of the southeast corner of Shawnee Mission Parkway and
Mission Road?
Business or retail21%
Greenspace65%
Keep it as it is14%
by percentage of respondents (excluding “not provided”)
Source: ETC Institute (2019 - City of Fairway, KS)
2019 City of Fairway Community Survey: Findings Report
ETC Institute (2019) Page 11

Q21. [Part 1] Importance of Various Reasons in Deciding Where to Live
by percentage of respondents (excluding "not provided”)
Source: ETC Institute (2019 - City of Fairway, KS)
88%
76%
60%
64%
59%
74%
48%
54%
46%
39%
10%
19%
32%
27%
32%
15%
34%
24%
31%
37%
1%
2%
6%
5%
3%
2%
8%
8%
7%
16%
2%
2%
3%
3%
6%
9%
11%
15%
16%
8%
Safety and security
Types of housing
Sense of community
Quality of services provided by the City
Quality of public schools
Affordability of housing
Proximity to jobs/employment
Family and friends are nearby
Level of City taxation
0% 20% 40% 60% 80% 100%
Very Important (4) Somewhat Important (3) Not Sure (2) Unimportant (1)
Access to restaurants/entertainment/cultural activities
94%
93%
93%
89%
88%
87%
87%
84%
78%
67%
Safety and security
Quality of public schools
Quality of services provided by the City
Types of housing
Family and friends are nearby
Sense of community
Proximity to jobs/employment
Affordability of housing
Level of City taxation
0% 20% 40% 60% 80% 100%
Yes
Q21. [Part 2] Are the following needs being met in Fairway?
by percentage of respondents who answered "yes”
Source: ETC Institute (2019 - City of Fairway, KS)
Access to restaurants/entertainment/cultural activities
2019 City of Fairway Community Survey: Findings Report
ETC Institute (2019) Page 12

62%
69%
66%
50%
47%
48%
21%
13%
6%
33%
26%
28%
41%
40%
33%
36%
31%
18%
4%
5%
5%
6%
8%
14%
16%
34%
24%
1%
0%
1%
2%
5%
4%
28%
22%
52%
My neighborhood is safe
I am proud to tell others where I live
School district is a benefit to my neighborhood
I expect value of my home to go up in next 5 yrs.
I am optimistic about future of my neighborhood
Some housing in my neighborhood needs to be better
In general, my neighborhood needs to be improved
0% 20% 40% 60% 80% 100%
Strongly Agree (5) Agree (4) Neutral (3) Disagree (2/1)
Q22. Agreement With the Following Statements Regarding Residential Issues in Fairway
by percentage of respondents (excluding “don't know”)
Source: ETC Institute (2019 - City of Fairway, KS)
Promoting sustainable practices is important tocommunity's future
Rental properties in neighborhood are well-maintained
68%
51%
41%
36%
25%
12%
10%
7%
6%
My neighborhood is safe
I expect value of my home to go up in next 5 yrs.
School district is a benefit to my neighborhood
I am optimistic about future of my neighborhood
I am proud to tell others where I live
Some housing in my neighborhood needs to be better
In general, my neighborhood needs to be improved
0% 20% 40% 60% 80% 100%
1st choice 2nd choice 3rd choice
Q23. Residential Issues That Will Have the Most Impact on Decision to Stay in Fairway for the Next
10 Yearsby percentage of respondents who selected the item as one of their top three choices
Source: ETC Institute (2019 - City of Fairway, KS)
Promoting sustainable practices is important tocommunity's future
Rental properties in neighborhood are well-maintained
2019 City of Fairway Community Survey: Findings Report
ETC Institute (2019) Page 13

5 years or less22%
6 to 10 years17%
11 to 15 years11%
15 to 20 years11%
21 to 30 years19%
31+ years20%
Q26. Demographics: Approximately how many years have you lived in the City of Fairway?
by percentage of respondents (excluding “not provided”)
Source: ETC Institute (2019 - City of Fairway, KS)
Rent7%
Own93%
Q27. Demographics: Do you rent or own your current residence?
Source: ETC Institute (2019 - City of Fairway, KS)
by percentage of respondents (excluding “not provided”)
2019 City of Fairway Community Survey: Findings Report
ETC Institute (2019) Page 14

Single family home78%
Apartment2%
Townhome/duplex9%
Condo11%
Q28. Demographics: If you were to move to another residence in Fairway, what type of home would you
be looking to rent or purchase?by percentage of respondents (excluding “not provided”)
Source: ETC Institute (2019 - City of Fairway, KS)
$200K to $249,99913%
$250K to $299,9999%
$300K to $349,99910%
$350K to $399,9999%
$400K to $449,9997%
$450K to $499,9997%
$500K to $549,99912%
$550K to $799,99918%
$800K+16%
Q29. Demographics: If you were to move to another residence in Fairway, what would be the price point of
the home you would be looking to purchase?by percentage of respondents (excluding “not provided”)
Source: ETC Institute (2019 - City of Fairway, KS)
2019 City of Fairway Community Survey: Findings Report
ETC Institute (2019) Page 15

Yes96%
No4%
Q30. Demographics: Are you planning to live in Fairway for the next 5 years?
Source: ETC Institute (2019 - City of Fairway, KS)
by percentage of respondents (excluding “not provided”)
91%
2%
1%
0%
White
Asian/Pacific Islander
Hispanic
American Indian/Eskimo
0% 20% 40% 60% 80% 100%
Q31. Demographics: Race/Ethnicityby percentage of respondents (multiple selections could be made)
Source: ETC Institute (2019 - City of Fairway, KS)
2019 City of Fairway Community Survey: Findings Report
ETC Institute (2019) Page 16

Under 3517%
35 to 4418%
45 to 5420%
55 to 6423%
65+22%
Q32. Demographics: What is your age?by percentage of respondents (excluding “not provided”)
Source: ETC Institute (2019 - City of Fairway, KS)
Under age 54%
Ages 5-98%
Ages 10-148%
Ages 15-194%
Ages 20-244%
Ages 25-348%
Ages 35-4413%
Ages 45-5413%
Ages 55-6417%
Ages 65-7413%
Ages 75+8%
Q33. Demographics: Including yourself, how many people in your household are:
by percentage of persons in the household
Source: ETC Institute (2019 - City of Fairway, KS)
2019 City of Fairway Community Survey: Findings Report
ETC Institute (2019) Page 17

Male49%
Female51%
Q34. Demographics: Gender
Source: ETC Institute (2019 - City of Fairway, KS)
by percentage of respondents (excluding “not provided”)
Q35. Demographics: Total Household Income
Under $30,0003%
$30K - $59,9998%
$60K - $99,99915%
$100,000 - $129,99913%
$130K+50%
Not provided12%
by percentage of respondents
Source: ETC Institute (2019 - City of Fairway, KS)
2019 City of Fairway Community Survey: Findings Report
ETC Institute (2019) Page 18

Ward 125%
Ward 223%
Ward 330%
Ward 423%
Q36. Demographics: Ward
Source: ETC Institute (2019 - City of Fairway, KS)
by percentage of respondents (excluding “not provided”)
2019 City of Fairway Community Survey: Findings Report
ETC Institute (2019) Page 19

Section 2:
Benchmarking Analysis
2019 City of Fairway Community Survey: Findings Report
ETC Institute (2019) Page 20

Benchmarking Analysis
Benchmarking Summary Report Fairway, Kansas
Overview
ETC Institute's DirectionFinder® program was originally developed in 1999 to help community leaders across the United States use statistically valid community survey data as a tool for making better decisions. Since November 1999, the survey has been administered in more than 300 cities and counties in 43 states.
This report contains benchmarking data from two sources. The first source is from a national survey that was administered by ETC Institute during the summer of 2018 to a random sample of over 4,000 residents in the continental United States. The second source is from a regional survey administered to a random sample of 370 Kansas and Missouri residents during the summer of 2018.
The “U.S. Average” shown in the charts reflects the overall results of ETC Institute’s national survey of more than 4,000 residents; the “Kansas/Missouri” average shown in the charts reflects the results of the survey of 370 residents in Kansas and Missouri.
2019 City of Fairway Community Survey: Findings Report
ETC Institute (2019) Page 21

91%
89%
88%
87%
84%
83%
74%
67%
45%
66%
47%
52%
62%
40%
48%
50%
50%
63%
48%
45%
67%
41%
52%
54%
Overall quality of services provided by the City
Overall quality of parks & rec programs/facilities
Overall effectiveness of communication with public
Overall quality of customer service
Overall quality of solid waste services
Overall maint. of streets/buildings/facilities
Overall flow of traffic & congestion management
Overall enforcement of codes & ordinances
0% 20% 40% 60% 80% 100%
Fairway KS/MO U.S.Source: 2019 ETC Institute
Satisfaction with Major Categories of City ServicesFairway vs. KS/MO vs. the U.S.
by percentage of respondents who rated the item 4 or 5 on a 5-point scale where 5 was "very satisfied" and 4 was "satisfied" (excluding don't knows)
2019 City of Fairway Community Survey: Findings Report
ETC Institute (2019) Page 22

96%
95%
95%
90%
78%
67%
59%
62%
56%
41%
75%
64%
67%
63%
38%
Overall quality of life in the City
Overall image of the City
Overall feeling of safety in the City
Overall appearance of the City
Overall value for City tax dollars & fees
0% 20% 40% 60% 80% 100%
Fairway KS/MO U.S.
Source: 2019 ETC Institute
Satisfaction with Issues that Influence Perceptions of the City
Fairway vs. KS/MO vs. the U.S.by percentage of respondents who rated the item 4 or 5 on a 5-point scale where 5 was "very satisfied"
and 4 was "satisfied" (excluding don't knows)
91%
83%
76%
71%
69%
75%
41%
64%
59%
52%
70%
35%
63%
61%
54%
Maintenance of City parks
City swimming pool
Ease of registering for programs
Youth recreation programs
Adult recreation programs
0% 20% 40% 60% 80% 100% 120%
Fairway KS/MO U.S.
Overall Satisfaction with Parks and RecreationFairway vs. KS/MO vs. the U.S.
Source: 2019 ETC Institute
by percentage of respondents who rated the item 4 or 5 on a 5-point scale where 5 was "very satisfied" and 4 was "satisfied" (excluding don't knows)
2019 City of Fairway Community Survey: Findings Report
ETC Institute (2019) Page 23

94%
93%
91%
91%
85%
80%
64%
64%
55%
59%
60%
70%
64%
70%
54%
59%
60%
64%
How quickly police respond to emergencies
Overall quality of police services
The City's efforts to prevent crime
The visibility of police in neighborhoods
The visibility of police in commercial/retail area
Enforcement of local traffic laws
0% 20% 40% 60% 80% 100%
Fairway KS/MO U.S.
Overall Satisfaction with Public SafetyFairway vs. KS/MO vs. the U.S.
Source: 2019 ETC Institute
by percentage of respondents who rated the item 4 or 5 on a 5-point scale where 5 was "very satisfied" and 4 was "satisfied" (excluding don't knows)
78%
66%
60%
58%
53%
41%
41%
44%
51%
39%
43%
42%
Enforcing exterior maint. of business property
Enforcing mowing/cutting of weeds/tall grass
Enforcing clean-up of debris on private property
Enforcing exterior maint. of residential property
0% 20% 40% 60% 80% 100%
Fairway KS/MO U.S.
Overall Satisfaction with Code EnforcementFairway vs. KS/MO vs. the U.S.
by percentage of respondents who rated the item 4 or 5 on a 5-point scalewhere 5 was "very satisfied" and 1 was "very dissatisfied" (excluding don't
knows)
Source: 2019 ETC Institute
2019 City of Fairway Community Survey: Findings Report
ETC Institute (2019) Page 24
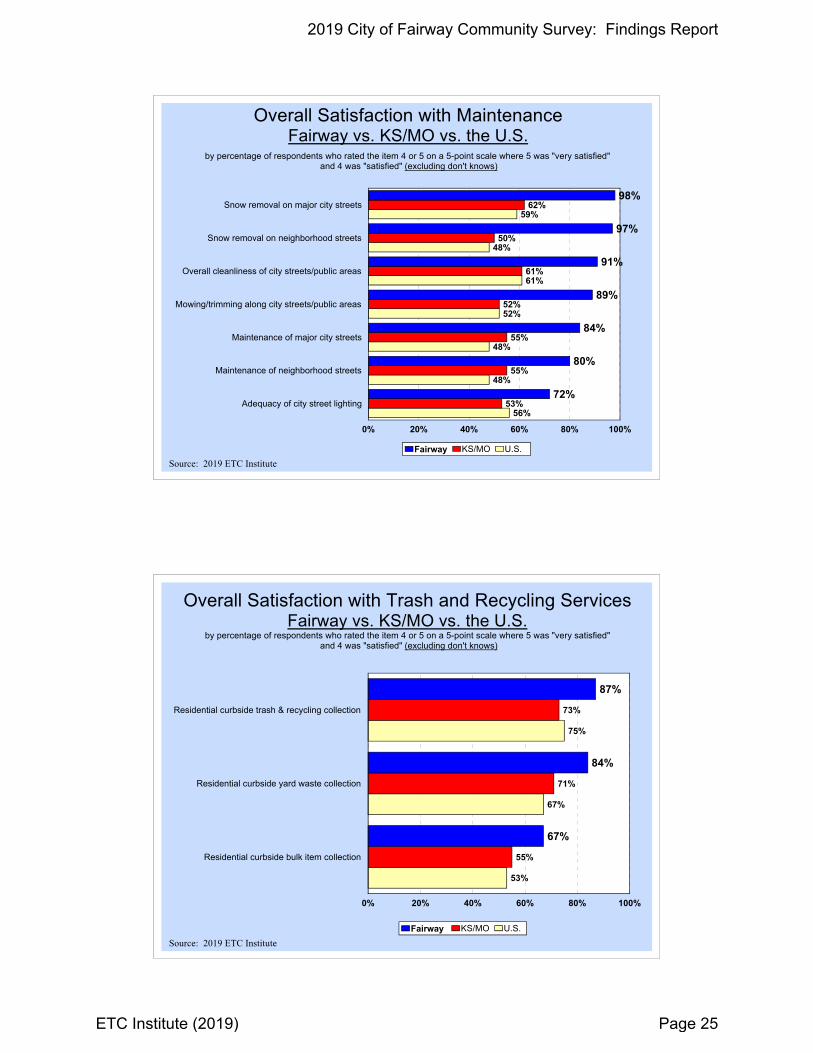
98%
97%
91%
89%
84%
80%
72%
62%
50%
61%
52%
55%
55%
53%
59%
48%
61%
52%
48%
48%
56%
Snow removal on major city streets
Snow removal on neighborhood streets
Overall cleanliness of city streets/public areas
Mowing/trimming along city streets/public areas
Maintenance of major city streets
Maintenance of neighborhood streets
Adequacy of city street lighting
0% 20% 40% 60% 80% 100%
Fairway KS/MO U.S.
Overall Satisfaction with MaintenanceFairway vs. KS/MO vs. the U.S.
Source: 2019 ETC Institute
by percentage of respondents who rated the item 4 or 5 on a 5-point scale where 5 was "very satisfied" and 4 was "satisfied" (excluding don't knows)
87%
84%
67%
73%
71%
55%
75%
67%
53%
Residential curbside trash & recycling collection
Residential curbside yard waste collection
Residential curbside bulk item collection
0% 20% 40% 60% 80% 100%
Fairway KS/MO U.S.
Overall Satisfaction with Trash and Recycling ServicesFairway vs. KS/MO vs. the U.S.
Source: 2019 ETC Institute
by percentage of respondents who rated the item 4 or 5 on a 5-point scale where 5 was "very satisfied" and 4 was "satisfied" (excluding don't knows)
2019 City of Fairway Community Survey: Findings Report
ETC Institute (2019) Page 25

84%
79%
69%
60%
59%
50%
57%
59%
35%
54%
45%
45%
60%
32%
55%
Availability of info about City programs/services
City efforts to inform about local issues
The usefulness of the City's web page
Public involvement in local decision making
Information provided through City’s Facebook page
0% 20% 40% 60% 80% 100%
Fairway KS/MO U.S.
Overall Satisfaction with CommunicationFairway vs. KS/MO vs. the U.S.
Source: 2019 ETC Institute
by percentage of respondents who rated the item 4 or 5 on a 5-point scale where 5 was "very satisfied" and 4 was "satisfied" (excluding don't knows)
91%
89%
83%
80%
69%
73%
73%
57%
64%
42%
69%
65%
60%
58%
51%
They were courteous and polite
They were easy to contact
Did what they said they would do in timely manner
They gave prompt, accurate & complete answers
They helped resolve an issue
0% 20% 40% 60% 80% 100%
Fairway KS/MO U.S.
How Often City Employees Displayed the Following Behaviors
Fairway vs. KS/MO vs. the U.S.by percentage of respondents who contacted the City in the past year and rated the item 4 or 5 on a 5-point scale
where 5 was "always" and 4 was "usually" (excluding don't knows)
Source: 2019 ETC Institute
2019 City of Fairway Community Survey: Findings Report
ETC Institute (2019) Page 26