Embed Size (px)
Citation preview

SECTION 1:ANALYSIS OF SUPERMARKETS, RESTAURANTS, CATERERS AND WHOLESALERS

2
Plating Up Progress 2021 ● SECTION 1: ANALYSIS OF SUPERMARKETS, RESTAURANTS, CATERERS AND WHOLESALERS
SECTION 1: Analysis of supermarkets, restaurants, caterers and wholesalers
WHO SHOULD READ THIS?Anyone interested in gaining an understanding of how different food businesses are performing in terms of setting targets and reporting on progress for health, environmental and social inclusion issues.
WHAT THIS SECTION INCLUDESThis section provides an overview of the findings from the Plating Up Progress (PUP) dashboard, summarising the key sector trends in reporting on healthy and sustainable food sales and supply chain commitments. A comparison is provided between the different food sectors, some examples of leadership are provided, and analysis is included that shows whether the industry is focusing on healthy and sustainable products, supply chain issues, and both human and natural capital issues.
WHERE CAN YOU FIND OUT MORE?Explore our full analysis on the PUP dashboard HERE.
PROJECT CONTACT: Will Nicholson, Project lead – Plating Up Progress, [email protected]

3
Plating Up Progress 2021 ● SECTION 1: ANALYSIS OF SUPERMARKETS, RESTAURANTS, CATERERS AND WHOLESALERS
2021 SCOPE AND METHODOLOGY
This report is the Plating Up Progress third annual assessment of the food industry in the UK, building on the sector overview in 2019 and the more detailed company analysis of 2020. The methodology used to assess the food companies on multiple health, societal and environmental issues is mainly consistent with that used in 2020, with minor changes to the wording of some metrics to align better with the World Benchmarking Alliance's Food and Agriculture Benchmark indicators, and more substantial developments in the metrics used for sustainable water use in supply chains, customer food waste and supply chain food losses. The 2021 methodology can be found HERE.
Our focus remains on UK-operating supermarkets, caterers, and both quick service and casual dining restaurant chains. These sectors provide important snapshots into the industry due to their unique influence on both the required transitions in consumption and production, being gate keepers to our diets and the funnel through which most commercially produced food is channelled. Additionally, this year we included the two largest food wholesalers (Bidfood UK and Brakes) due to their strong market position as suppliers to many in the catering and restaurant sector. In all, we assessed 29 food businesses:
11
6
5
22
2
5
SUPERMARKETS
CONTRACT CATERERS
WHOLESALERS
FROM THE FAST FOOD OR QUICK SERVICE RESTAURANT SECTOR
FROM THE CASUAL DINING RESTAURANT SECTOR
PUBLICLY LISTED OR OWNED BY PUBLICLY LISTED PARENT COMPANIES
“ The methodology assesses food companies on multiple health, societal and environmental issues, aligned with the World
Benchmarking Alliance's Food and Agriculture Benchmark indicators."

4
Plating Up Progress 2021 ● SECTION 1: ANALYSIS OF SUPERMARKETS, RESTAURANTS, CATERERS AND WHOLESALERS
FOOD INDUSTRY PROGRESS SINCE 2020The following section summarises the developments we have seen in 2021, compared to our analysis from 2020.
SupermarketsFive out of eleven supermarkets now have targets for sales of healthy or healthier food: Tesco, Sainsbury’s, M&S, Lidl and Aldi (own brand) compared to two this time last year.
Two supermarkets now report on the percentage of their protein sales that come from plant-based products (Tesco and Sainsbury’s with 12% and 10% respectively) compared to no supermarkets last year. Tesco also has a target to increase sales of plant-based alternatives by 300% by 2025.
One supermarket now has a public target to increase sales of fruit and vegetables (Lidl), with another having a public target to increase the proportion of total sales tonnage that comes from vegetables (Sainsbury’s), compared to no supermarkets last year.
Greggs has set a new target for 30% of the items on our shelves to be healthier choices by 2025 and within the catering sector we find various targets that relate to the percentage of sites that serve healthy options, percentage of menus that are plant-based and so on. We find fewer such commitments in the casual dining and quick service sectors.
Like the supermarket sector, the these sectors lack agreement and consistency on the methodologies and metrics should be used.
Climate change on the agendaAll supermarkets and thirteen out of eighteen restaurants, caterers and wholesalers now have either net zero climate change targets that include scope 3 greenhouse gas emissions or have started (or committed to start) measuring their scope 3 greenhouse gas emissions. This is important because scope 3 emissions are by far the most significant source of greenhouse gas emissions related to these sectors. While there is plenty of work to do, it does represent progress on one of the crucial issues of concern in the same year as the COP26 climate change talks in Glasgow. Despite the commitments, few companies are actually reporting on their scope 3 emissions yet, and as already shown only two companies (Sainsbury’s and Tesco) disclose on their protein sales. Only one company (Tesco) has a target for increasing sales of plant-based proteins, and no company has a target for reducing sales of animal-based proteins. This suggests that much of the implementation for reducing scope 3 emissions is yet to be worked out. Making progress here and connecting scope 3 targets to sales of proteins and issues relating to deforestation and land use conversion in supply chains is going to be crucial.
However, across these metrics, not all retailers are using the same methodologies to set targets and measure progress. This will need to be addressed for comparability.
Restaurants, caterers and wholesalersWe find limited change in commitments and performance on sales of healthy and sustainable food in the restaurant, catering and wholesale sectors, although four out of eighteen have a commitment to increase sales of vegetables (Compass Group, Sodexo, ISS and Greggs, with UK-focused commitments already in place in 2020 and Compass Group with a global KPI for the percentage of spend that is on vegetables).
Sector comparisonConsistent with our 2020 assessment, we find the supermarket sector to be outperforming other sectors (see Figure 1).
While the difference in pace of change between the sectors could be at least partially attributed to the ways in which Covid-19 has significantly impacted the restaurant and catering sectors economically1, the reality is that the supermarket sector remains more advanced in the scope and extent of reporting.
For the full analysis of the different sectors and companies, see our PUP dashboard.

5
Plating Up Progress 2021 ● SECTION 1: ANALYSIS OF SUPERMARKETS, RESTAURANTS, CATERERS AND WHOLESALERS
FIGURE 1: AVERAGE AND LEADERSHIP PROFILES
Water useFood loss & waste
Plastics
Animal welfare & antibiotics
Human rights
Healthy & sustainable food sales
Encouraging healthy diets
Climate change
Biodiversity
Sustainable food practices
Water useFood loss & waste
Plastics
Animal welfare & antibiotics
Human rights
Healthy & sustainable food sales
Encouraging healthy diets
Climate change
Biodiversity
Sustainable food practices
Water useFood loss & waste
Plastics
Animal welfare & antibiotics
Human rights
Healthy & sustainable food sales
Encouraging healthy diets
Climate change
Biodiversity
Sustainable food practices
Water useFood loss & waste
Plastics
Animal welfare & antibiotics
Human rights
Healthy & sustainable food sales
Encouraging healthy diets
Climate change
Biodiversity
Sustainable food practices
Water useFood loss & waste
Plastics
Animal welfare & antibiotics
Human rights
Healthy & sustainable food sales
Encouraging healthy diets
Climate change
Biodiversity
Sustainable food practices
FIGURE 1 EXPLANATIONHere we present the summary profiles comparing the average sector profile to the 2021 Leadership profile. Leadership profiles are calculated from the best score from any company on each individual metric. You can see how we score each metric HERE and how each individual company is scored on our dashboard page for each section HERE.
The outer ring of each spider diagram indicates that, for the relevant topic, a company has both clear targets and is reporting data against those targets. The inner ring indicates that a company lacks clear targets or even data on their performance on that topic.
For the wholesale sector, we only assess two companies so have not included a leadership profile.
SUPERMARKETS
CASUAL DININGQUICK SERVICE RESTAURANTS
CATERERS
WHOLESALERS
❙ Average ❙ Leadership
❙ Average ❙ Leadership
❙ Average ❙ Leadership
❙ Average ❙ Leadership
00
11
22
33

6
Plating Up Progress 2021 ● SECTION 1: ANALYSIS OF SUPERMARKETS, RESTAURANTS, CATERERS AND WHOLESALERS
0 1.5 3
Product
0
1.5
3
Supp
ly
Comparing companies’ focus on products and supply chainsOur analysis finds that supermarkets are also ahead of other sectors when assessing commitments and reporting against metrics that relate to healthy and sustainable products (targeting shifts in consumption) and metrics that relate to sustainable supply chains (targeting shifts in the way we produce food). Figure 2 shows that supermarkets score more highly on both product scores and supply chain scores compared to companies in other sectors.
Regarding sustainable supply chains, as noted earlier, most companies now acknowledge the importance of scope 3 emissions within their commitments for climate change. Supermarkets remain more advanced on biodiversity commitments around commodities such as palm oil, soy and beef, although reporting is limited to own-brand products. We find that the most progress on sustainable water management in supply chains is coming from collaborative initiatives (see our later section on recommendations for businesses for further information on collaborative initiatives).
The overall pattern across sectors does imply that, in the main, companies that are performing well on products are also performing well on supply chains (with a few outliers – see the specific data on our PUP dashboard). We believe this is a strong indication of the need for more cross-sector and peer-to-peer learning, knowledge sharing and collaboration.
FIGURE 2 EXPLANATIONHere we present companies’ average scores on metrics that relate to healthy and sustainable products (the x-axis) and scores on metrics that relate to sustainable supply chains (the y-axis).
Being in the top right corner indicates that a company is focusing on both products and supply chains. Being in the bottom left corner indicates that a company is performing poorly on both. Diversion from the line running from bottom left to top right indicates a prioritisation of either products or supply chains.
FIGURE 2: PRODUCT VS. SUPPLY CHAIN SCORES FOR ALL COMPANIES (A TOP-RIGHT POSITION INDICATES BETTER PERFORMANCE)
● Caterers Wholesalers QSR Casual ▲ Supermarket

7
Plating Up Progress 2021 ● SECTION 1: ANALYSIS OF SUPERMARKETS, RESTAURANTS, CATERERS AND WHOLESALERS
0 1.5 3
Product
0
1.5
3
Supp
ly
The evolution of supermarket sector reporting is illustrated in Figure 3, comparing supermarket scores in 2020 to 2021, and showing how supermarkets now score more highly on metrics relating to their products and food sales (a higher score on the horizontal axis) in 2021 than in 2020. In contrast, the scores have remained much the same on metrics relating to their supply chains (the vertical axis). This implies that there is now stronger recognition among supermarkets of the importance of their role in changing what we actually eat (as evidenced through their products and sales), in addition to how food is produced (as evidenced through their supply chains).
FIGURE 3 EXPLANATIONHere we present companies’ average scores on metrics that relate to healthy and sustainable products (the x-axis) and scores on metrics that relate to sustainable supply chains (the y-axis).
Being in the top right corner indicates that a company is focusing on both products and supply chains. Being in the bottom left corner indicates that a company is performing poorly on both. Diversion from the line running from bottom left to top right indicates a prioritisation of either products or supply chains.
FIGURE 3: SUPERMARKETS’ PRODUCTS VS. SUPPLY CHAIN COMPARISON 2020 TO 2021 (A TOP-RIGHT POSITION INDICATES BETTER PERFORMANCE)
▲ 2021 ▲ 2020

8
Plating Up Progress 2021 ● SECTION 1: ANALYSIS OF SUPERMARKETS, RESTAURANTS, CATERERS AND WHOLESALERS
0 1.5 3
Human Capital
0
1.5
3
Nat
ural
Cap
ital
Comparing companies’ focus on human and natural capitalIn recent years there has been a growth in attention on the hidden costs, sometimes referred to the true costs, of our food system and an increase in our understanding of the impact our food system has on non-financial capitals such as human and natural capital. This is beginning to gain traction in both government, as seen in the recent report The Economics of Biodiversity: The Dasgupta Review2 and the business world where more industry-focused frameworks are being developed for calculating non-financial impacts of business operations3. The recent National Food Strategy report highlighted how estimates of the hidden cost of the food system in England range from £40 billion to £94 billion per year. While the estimates for these total costs, and how they impact humans and nature, vary considerably, the message is clear: the impacts of our food system on both humans and nature are significant.
In order to better understand whether food companies are focusing on humans or nature, we categorised each of our metrics as primarily related to either human impacts ((health, livelihoods, food poverty) or natural impacts (climate change, biodiversity loss and so on). We acknowledge that all metrics ultimately have human impacts, but in this analysis we have focused on the more immediate and direct impacts on humans vs. nature (although we have categorised food waste as impacting both humans and nature).
We find that high scores on one dimension tend to be accompanied by high scores in the other, although with an apparent tendency towards protecting natural capital rather than human capital (Figure 4). In other words, most companies appear to be considering their impacts on both humans and nature, but slightly more progress has been made for nature. Again, significant differences are seen between companies with the higher scores coming from the supermarket sector.
FIGURE 4 EXPLANATIONHere we present companies’ average scores on metrics that relate to impacts on people (the x-axis) and scores on metrics that relate to impacts on the environment (the y-axis).
Being in the top right corner indicates that a company is focusing on both people and the environment. Being in the bottom left corner indicates that a company is performing poorly on both. Diversion from the line running from bottom left to top right indicates a prioritisation of either people or the environment.
FIGURE 4: COMPARING COMPANIES’ FOCUS ON ISSUES IMPACTING HUMANS AND NATURE (A TOP-RIGHT POSITION INDICATES BETTER PERFORMANCE)
● Caterers Wholesalers QSR Casual ▲ Supermarket
9
Plating Up Progress 2021 ● SECTION 1: ANALYSIS OF SUPERMARKETS, RESTAURANTS, CATERERS AND WHOLESALERS
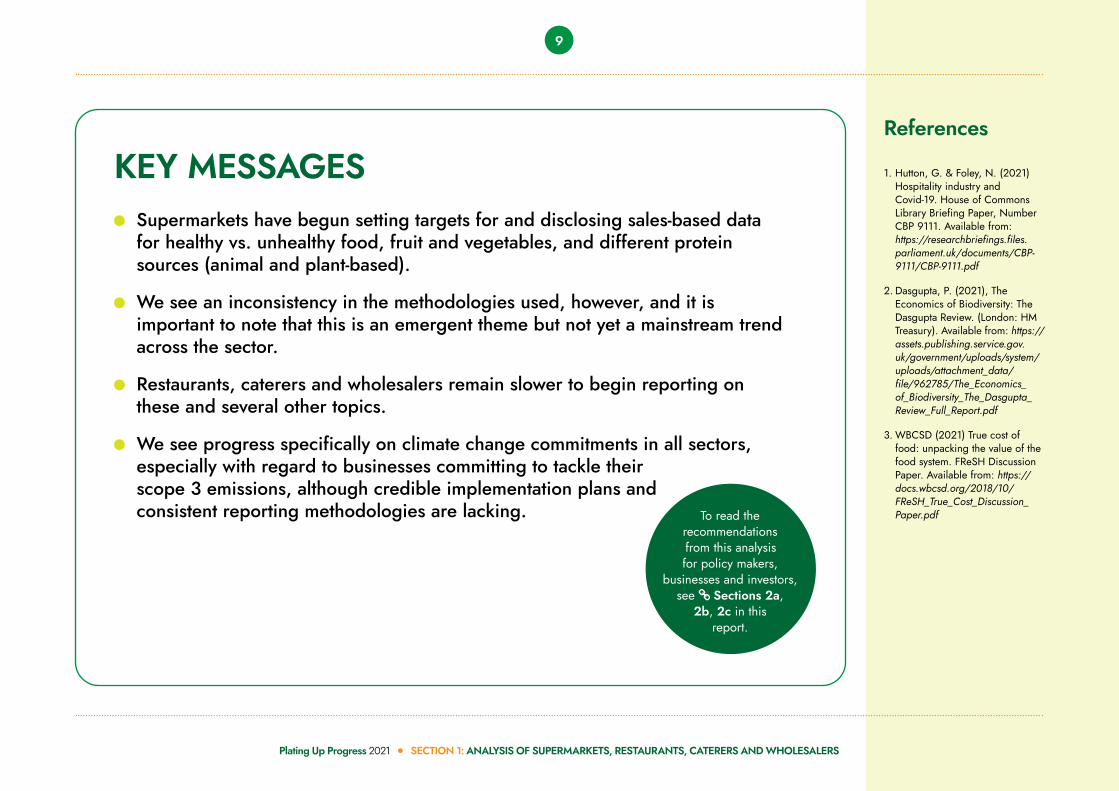
Supermarkets have begun setting targets for and disclosing sales-based data for healthy vs. unhealthy food, fruit and vegetables, and different protein sources (animal and plant-based).
We see an inconsistency in the methodologies used, however, and it is important to note that this is an emergent theme but not yet a mainstream trend across the sector.
Restaurants, caterers and wholesalers remain slower to begin reporting on these and several other topics.
We see progress specifically on climate change commitments in all sectors, especially with regard to businesses committing to tackle their scope 3 emissions, although credible implementation plans and consistent reporting methodologies are lacking.
KEY MESSAGESReferences
1. Hutton, G. & Foley, N. (2021) Hospitality industry and Covid-19. House of Commons Library Briefing Paper, Number CBP 9111. Available from: https://researchbriefings.files.parliament.uk/documents/CBP-9111/CBP-9111.pdf
2. Dasgupta, P. (2021), The Economics of Biodiversity: The Dasgupta Review. (London: HM Treasury). Available from: https://assets.publishing.service.gov.uk/government/uploads/system/uploads/attachment_data/file/962785/The_Economics_of_Biodiversity_The_Dasgupta_Review_Full_Report.pdf
3. WBCSD (2021) True cost of food: unpacking the value of the food system. FReSH Discussion Paper. Available from: https://docs.wbcsd.org/2018/10/FReSH_True_Cost_Discussion_Paper.pdfTo read the
recommendations from this analysis for policy makers,
businesses and investors, see Sections 2a,
2b, 2c in this report.

About Plating Up ProgressThis report is an output of Plating Up Progress, a Food Foundation project. The project has two aims. First, to forge a consensus on metrics and reporting mechanisms that allow assessment of food industry progress in transitioning to sustainable and healthy diets. Second, to engage stakeholders to advance the uptake of these metrics and track progress in the industry.
The Food Foundation CIOc/o Spayne Lindsay & Co. LLP; 55 Strand, London, WC2N 5LR+44(0)20 3086 9953foodfoundation.org.uk @Food_Foundation
©Food Foundation. All rights reserved. Reproduction in part or in whole is prohibited without prior agreement with the Food Foundation. Charity number: 1187611.
Acknowledgements We would like to thank our funders the Children’s Investment Fund Foundation and the Joseph Rowntree Charitable Trust.