Embed Size (px)
Citation preview

GoalTo demonstrate method performance for the per- and polyfluorinated alkyl substances (PFAS) analysis using Orbitrap™ high-resolution mass spectrometry as an alternative to conventional triple quadrupole instruments for determination of PFAS in drinking water matrices using EPA Method 537.1.
IntroductionWithin the last decade, liquid chromatography-tandem mass spectrometry (LC-MS/MS) sensitivity has increased by at least a factor of ten and is therefore sensitive enough for quantitation of targeted compounds for validated methods. The ease of use for detecting polar compounds makes LC-MS/MS the technique of choice for analysis of compounds of emerging concern (CECs) in environmental samples. However, with the development of high-resolution accurate mass (HRAM) spectrometers, sensitivity rivals that of triple quadrupole MS instruments and, in addition, mass resolution provides the added benefits of accurate quantitation along with unknown screening capabilities. HRAM using Orbitrap technology combines the sensitivity of a triple quadrupole analyzer for quantitation with the confidence of full scan data for quantitative identification and confirmation similar to MS/MS instruments that participated in a method validation study.
Authors Ali Haghani, Andy Eaton, Eurofins Eaton, Monrovia, CA
Richard Jack, Maciej Bromirski, Thermo Fisher Scientific, San Jose, CA
Keywords High-resolution accurate mass spectrometry, PFOS, PFOA, GenX, ADONA, PFASs, emerging contaminants, EPA 537.1, Orbitrap, AutoTrace
Secondary validation study for EPA Method 537.1 using automated SPE followed by LC-Q Exactive Orbitrap MS
APPLICATION NOTE 65499

2
This application note highlights the Thermo Scientific™ Q Exactive™ Hybrid Quadrupole-Orbitrap™ mass spectrometer used as one of the outside laboratory validations for updating EPA Method 537 r1.1 - Determination of Selected Per- and Polyfluorinated Alkyl Substances in Drinking Water by Solid Phase Extraction and Liquid Chromatography/Tandem Mass Spectrometry (LC-MS/MS).
EPA 537 Rev. 1.1, first published in 2009 to determine 14 different PFAS in drinking water, has been updated to EPA Method 537.1 and includes four more PFAS. These new PFAS that have been replacing PFOA and PFOS in manufacturing processes are GenX chemicals, specifically the hexafluoropropylene oxide dimer acid, as well as 11-chloroeicosafluoro-3-oxaundecane-1-sulfonic acid (11Cl-PF3OUdS), 9-chlorohexadecafluoro-3-oxanone-1-sulfonic acid (9Cl-PF3ONS), and 4,8-dioxa-3H-perfluorononanoic acid (ADONA). EPA Method 537.1 can be used by EPA’s Regions and other government and commercial environmental laboratories to measure PFAS in finished drinking water.
Table 1. List of PFAS compounds included in this method
ExperimentalThis application note describes the quantitation of selected PFAS reagent and drinking water using EPA Method 537.1. The list of PFAS included in this study is shown in Table 1.
Sample preparationPFAS standard solutionsTarget, internal, and surrogate PFAS standard mixtures were provided by the EPA. These were originally purchased from Wellington Laboratories for the four new compounds plus the isotopically labeled targeted compounds added to EPA Method 537.1. Legacy PFAS analytes were obtained from AccuStandard. A stock solution of 18 target PFAS compounds was prepared in methanol/water 96/4 (v/v) at a concentration of 2 μg/mL prior to shipment to the three outside laboratories involved in the secondary validation study. Calibration solutions, with concentrations of 0.1–40 ng/L (ppt), were prepared by serial dilutions of the stock solution in 96:4 (v/v) methanol/water and appropriate internal standards and surrogate were added according to the method.
Analyte Acronym CASRN
Perfluorobutanesulfonic acid PFBS 375-73-5
Perfluorohexanoic acid PFHxA 307-24-4
Hexafluoropropylene oxide dimer acid GenX 13252-13-6
Perfluorohexanesulfonic acid PFHxS 355-46-4
Perfluoroheptanoic acid PFHpA 375-85-9
4,8-dioxa-3H-perfluorononanoic acid ADONA 919005-14-4
Perfluorooctanoic acid PFOA 335-67-1
Perfluorooctanesulfonic acid PFOS 1763-23-1
Perfluorononanoic acid PFNA 375-95-1
9-chlorohexadecafluoro-3-oxanone-1-sulfonic acid 9Cl-PF3ONS 756426-58-1
Perfluorodecanoic acid PFDA 335-76-2
N-methyl perfluorooctanesulfonamidoacetic acid NMeFOSAA 2355-31-9
Perfluoroundecanoic acid PFUnA 2058-94-8
N-ethyl perfluorooctanesulfonamidoacetic acid NEtFOSAA 2991-50-6
Perfluorododecanoic acid PFDoA 307-55-1
Perfluorotridecanoic acid PFTrDA 72629-94-8
Perfluorotetradecanoic acid PFTA 376-06-7
11-chloroeicosafluoro-3-oxaundecane-1-sulfonic acid 11Cl-PF3OUdS 763051-92-9

3
Sample and extracted QC preparationA 250 mL water sample was preserved with Trizma®, fortified with surrogate standards, and passed through a solid phase extraction (SPE) cartridge containing SDVB to extract the method analytes and surrogates using a semi-automated Thermo Scientific™ Dionex™ AutoTrace™ 280 Solid-Phase Extraction instrument. The compounds were eluted from the solid phase with a small amount of methanol. The extract was concentrated to dryness with nitrogen in a heated water bath, and then adjusted to a 1 mL volume with 96%/4% (v/v) methanol/water after adding the internal standards.
Drinking water matrix for LFSM Monrovia, California, tap water, a finished drinking water from a combined ground and surface water source, was collected and preserved according to EPA Method 537.1. This matrix served as the laboratory fortified sample matrix (LFSM).
LC-MS/MS analysisSince the required limits of detection are in the low ng/L range, careful selection of reagents and consumables is necessary to ensure they are PFAS-free. The LC-MS/MS system, composed of a Thermo Scientific™ UltiMate™ 3000 UHPLC and a Q Exactive mass spectrometer equipped with a H-ESI II ionization probe, also included an isolator column installed after the LC pump and prior to the injection valve. The isolator column offsets background contaminants from the LC pump, degasser, and mobile phases.
LC conditions
Analytical column: Waters™ Atlantis™ dC18 2.1 x 150 mm column packed with 5.0 μm particles
Isolator column: Thermo Scientific™ Hypersil™ C18, 5 μm, 2.1 x 50 mm (P/N 28105-052130)
Column temp.: 25 °C
Flow rate: 0.5 mL/min
Solvent A: Water containing 20 mM ammonium acetate
Solvent B: Methanol
Injection volume: 10 µL
MS conditionsThe H-ESI II source was used in the negative ionization mode and the optimized MS parameters were as follows: spray voltage at 2.5 kV; sheath gas at 60; auxiliary gas at 12; probe heater temperature at 437 °C, and capillary temperature at 269 °C.
Both EPA Method 537 Rev. 1.1 and Method 537.1 require MS/MS for the method analytes within specified retention time segments and a minimum of 10 scans across the chromatographic peak for adequate precision.
EPA Method 537.1 measures precursor and product ion transitions, termed Selected Reaction Monitoring (SRM). Similarly, the Q Exactive mass spectrometer performs MS/MS in Parallel Reaction Monitoring (PRM) mode. In PRM mode, a list of targeted precursor ions, retention times, and collision energies can be included in the method (Table 2). When detecting a targeted ion, the system isolates that precursor ion in the quadrupole and triggers the MS/MS, generating MS/MS spectra that can be used for both quantitation and qualitative identification. Both the quantitation and identification are performed taking into account product ions generated after the isolation of a specific precursor ion. This operating mode is similar to SRM (also called MRM) using a triple quadrupole instrument.
In PRM, the third quadrupole of a triple quadrupole instrument is substituted with the HRAM mass analyzer to permit the parallel detection of all target product ions in one concerted high-resolution mass analysis. Thus, instead of serially monitoring target transitions over several ion injections and low-resolution mass measurement periods as in SRM, PRM monitors all product ions of a mass-selected targeted compound in parallel with one ion injection and full mass range Orbitrap mass analysis (Figure 1).
LC gradient
Time (min) % Methanol
0 30
0.63 30
15 90
16.3 90
16.4 30
21 30

4
Table 2. Monitored PRM transitions details and instrument parameter: S-lens is set at 50 for all compounds.
CompoundRetention Time
(min)Precursor
(m/z)Quant. Product
(m/z)Normalized Collision
Energy (NCE) PFBS 7.5 298.9430 79.9561 60
PFHxA 9.2 312.9728 268.9829 20
GenX 9.8 284.9779 168.9884 20
PFHpA 10.8 362.9696 318.9794 20
PFHxS 10.8 398.9366 79.9560 60
ADONA 10.9 376.9689 250.9761 35
PFOA 12.0 412.9664 368.9767 20
PFOS 12.9 498.9302 79.9560 60
PFNA 13.0 462.9632 418.9737 20
9Cl-PF3ONS 13.4 530.8956 350.9454 35
PFDA 13.8 512.9600 468.9703 20
NMeFOSAA 14.2 569.9673 418.9736 20
PFUnA 14.5 562.9568 168.9886 20
NEtFOSAA 14.5 583.9830 418.9738 20
11CL-PF3OUdS 14.8 630.8892 450.9390 35
PFDoA 15.1 612.9537 168.9883 20
PFTrDA 15.6 662.9504 168.9887 20
PFTA 16.1 712.9473 168.9886 20
13C2-PFDA 13.8 514.9667 469.9735 20
13C2-PFHxA 9.2 314.9795 269.9864 20
13C3-GenX 9.8 286.9849 168.9884 20
d5-NEtFOSAA 14.5 589.0143 418.9735 35
13C2-PFOA 12.0 414.9652 369.9800 20
13C4-PFOS 12.9 502.9436 79.9560 60
d3-NMeFOSAA 14.2 572.9861 418.9735 35
Figure 1. SRM and PRM

5
The number of scans across the chromatographic peak is dependent on the cycle time of the instrument and therefore on the set of conditions used (e.g. resolving power). These conditions can be optimized depending on the objectives of the analysis, in this case, accurate quantitation as well as unambiguous identification. The optimized conditions listed below produce >10 MS2 scans using a resolution setting of 17,750 (full width at half maximum (FWHM)) at m/z 200.
Another important feature of the Q Exactive mass spectrometer is the ability to fill the C-trap in parallel to detection in the Orbitrap analyzer. This presents an enormous time savings so that more than 90% of the entire analysis time is spent on filling the C-trap, enhancing the sensitivity and selectivity. To make the most effective use of the duty cycle at 17,750 resolution setting, the Ion Transmission (IT) was set at 55 ms, and the Automatic Gain Control (AGC) at 2E5 for best sensitivity. With these settings, the EPA Method 537.1 requirement of >10 scans for all compounds was easily met. Figure 2 shows PFNA with >30 scans even though it is at the most overlapping scan window for the other nearby compounds.
to prove ruggedness of the new method by completing an initial demonstration of capability (IDC) and perform a lowest concentration minimum reporting limit (LCMRL) study for determination of Minimum Reporting Limit (MRL). The requirements are:
1. Demonstration of low background <1/3 of minimum reporting limit (MRL)
2. Demonstration of precision by analyzing four to seven extracted laboratory reagent waters (LFBs) near mid-level to obtain RSD of <20%
3. Demonstration of accuracy from 4–7 laboratory fortified blanks (LFBs) with recovery of 70–130%
4. Demonstration of precision and accuracy (P&A) for mid-level laboratory fortified sample matrix and laboratory fortified sample matrix duplicates (LFSM/LFSMD) with recovery of 70–130% and RSD of <30%
5. Determination of the LCMRL. The LCMRL is the lowest spiking concentration where the probability of spike recovery in the 50% to 150% range is at least 99%. It differs from MDL studies because it also accounts for accuracy beside precision. LCMRL procedures require, at a minimum, four replicates at each of seven fortification levels plus blanks to calculate MRL.
All the requirements listed above must be processed through the entire method from extraction to analysis.
Results and discussionLinearity and sensitivityExcellent linearity and quantitative accuracy were achieved over the range of 0.1 to 40 ng/L, with correlation coefficients greater than 0.995 for all transitions using unweighted linear regression and forced to zero. The respective residuals were less than 30% of the nominal values. Representative calibration curves for PFOS and PFOA are shown in Figure 3, with correlation coefficients of 0.9998 and 0.9998, respectively. Figure 4 also shows chromatograms of quantitation ions injected at 0.1 ng/L demonstrating the high sensitivity achieved with the Q Exactive mass spectrometer for the quantitation of PFAS at ultra-low levels (sub-ppt range) for four new compounds added to EPA Method 537.1.
Figure 2. Greater than 30 scans for PFNA
Data processingThermo Scientific™ TraceFinder™ Chromatography Data System software, version 4.1 was used.
Secondary laboratory validation study requirementPrior to publishing a new method such as EPA 537.1, laboratories involved in the inter-laboratory studies need
0
80
70
60
50
40
30
20
10
90
100
12.4 13.413.313.213.113.012.912.812.712.6 13.512.5Time (min)
RT: 12.95

6
Figure 4. Calibration and 0.1 ppt level for (A) GenX, (B) 11CL-PF3OUdS, (C) ADONA, and (D) 9Cl-PF3ONS. All correlation coefficients were >0.998.
Figure 3. Calibration and chromatogram of 0.1 ppt the lowest calibration point used for this study for PFOA (left) and PFOS (right)
PFOSPFOA
DC
BA

7
Peak asymmetryOne of the method’s requirements is to have a peak asymmetry factor (AF) of >0.8 and <1.5 for the first
Figure 5. Asymmetry for PFBS (top) and PFHxA (bottom)
Initial demonstration of capability1. Low system background was measured. All method blanks exhibited very low levels of contamination compared to
the lowest calibration level at 0.1 ppt for all analytes (Table 3).
Extract11CL-PF3OUdS
(ng/L)9Cl-PF3ONS
(ng/L)ADONA (ng/L)
GenX (ng/L)
NEtFOSAA (ng/L)
NMeFOSAA (ng/L)
PFBS (ng/L)
PFDA (ng/L)
PFDoA (ng/L)
Method blank -1 0 0.002 0.004 0 0 0 0 0 0.005
Method blank -2 0 0.003 0.074 0 0.035 0.009 0.001 0 0.01
Method blank -3 0 0.005 0.111 0 0 0.011 0.002 0 0.025
Method blank -4 0 0.007 0.129 0 0 0.013 0 0 0.04
ExtractPFHpA (ng/L
PFHxA (ng/L
PFHxS (ng/L
PFNA (ng/L
PFOA (ng/L
PFOS (ng/L
PFTA (ng/L
PFTrDA (ng/L
PFUnA (ng/L
Method blank -1 0.003 0.038 0 0 0.019 0.052 0.008 0 0.009
Method blank -2 0.005 0.039 0.001 0.007 0.024 0.055 0.013 0.009 0.011
Method blank -3 0 0.04 0 0 0.025 0.059 0.029 0.013 0.023
Method blank -4 0 0.054 0 0 0.031 0.069 0.036 0.016 0.059
Table 3. Low system background in extracted method blanks. Levels shown below LCMRL calculated levels shown in Table 6 should be considered only as an estimate.
eluting peaks, PFBS and PFHxA, at mid-point calibration standard concentration as shown in Figure 5.

8
Table 5. (part 1) Showing data for precision and accuracy for four laboratory fortified sample matrix
2. The initial demonstration of precision and accuracy was met by analyzing seven LFBs extracted over three days spiked at 25 ng/L <20% RSD and ±30 difference achieved (Table 4).
3. Monrovia, CA, tap water was spiked at 25 ng/L extracted over two batches in duplicates and analyzed. Results are shown in Table 5. The %RSD of less than 30% and recoveries of ±30% of spike amount were met.
CompoundAverage
Concentration (ng/L)
Theoretical Concentration
(ng/L)% Difference % Recovery Limit % RSD
PFBS 26.719 25.000 6.87 107% 70-130% 4.76
PFHxA 26.166 25.000 4.66 105% 70–130% 3.59
GenX 25.459 25.000 1.83 102% 70–130% 4.61
PFHxS 25.739 25.000 2.95 103% 70–130% 2.13
PFHpA 24.744 25.000 -1.02 99% 70–130% 2.77
ADONA 22.629 25.000 -9.48 91% 70–130% 5.52
PFOA 28.394 25.000 13.57 114% 70–130% 3.24
PFOS 27.329 25.000 9.32 109% 70–130% 2.89
PFNA 26.596 25.000 6.39 106% 70–130% 4.60
9Cl-PF3ONS 25.982 25.000 3.93 104% 70–130% 5.49
PFDA 25.791 25.000 3.16 103% 70–130% 5.08
11CL-PF3OUdS 24.883 25.000 -0.47 100% 70–130% 5.49
NMeFOSAA 25.722 25.000 2.89 103% 70–130% 5.36
PFUnA 27.007 25.000 8.03 108% 70–130% 5.64
NEtFOSAA 25.534 25.000 2.14 102% 70–130% 6.66
PFDoA 26.028 25.000 4.11 104% 70–130% 5.36
PFTrDA 24.620 25.000 -1.52 98% 70–130% 5.13
PFTA 25.489 25.000 1.96 102% 70–130% 3.70
Table 4. Data for precision and accuracy for six laboratory fortified blanks
Spike (ng/L) LFSM LFSM LFSM LFSM Average STDEV %REC. %RSD
PFBS 25 19.8 21.4 25.1 25.5 23.0 2.8 91.9% 12%
11CL-PF3OUdS 25 21.1 22.7 24.2 24.8 23.2 1.7 92.9% 7%
9Cl-PF3ONS 25 22.0 22.1 26.7 25.9 24.2 2.5 96.6% 10%
ADONA 25 18.2 19.8 19.4 19.6 19.2 0.7 77.0% 4%
GenX 25 22.0 23.0 24.4 24.4 23.4 1.2 93.8% 5%
NEtFOSAA 25 21.2 21.8 24.2 24.4 22.9 1.6 91.6% 7%
NMeFOSAA 25 20.6 22.4 24.3 26.0 23.3 2.3 93.3% 10%
PFDA 25 21.7 22.7 24.6 25.7 23.7 1.8 94.7% 8%
PFDoA 25 21.6 24.0 24.8 26.0 24.1 1.9 96.3% 8%
PFHpA 25 19.6 21.3 24.0 24.2 22.3 2.2 89.1% 10%
PFHxA 25 20.9 22.0 24.4 25.1 23.1 2 92.3% 9%
PFHxS 25 20.6 22.2 23.5 23.5 22.5 1.4 89.8% 6%
PFNA 25 23.5 23.5 25.9 26.2 24.8 1.5 99.2% 6%
PFOA 25 22.0 23.1 24.8 25.3 23.8 1.5 95.2% 6%
PFOS 25 22.5 24.0 25.6 26.2 24.6 1.7 98.3% 7%
PFTA 25 21.9 23.2 26.9 28.0 25.0 2.9 100.0% 12%
PFTrDA 25 21.3 23.1 25.5 25.4 23.8 2 95.3% 9%
PFUnA 25 22.2 24.8 26.1 26.5 24.9 1.9 99.5% 8%
©2019 Thermo Fisher Scientific Inc. All rights reserved. All trademarks are the property of Thermo Fisher Scientific and its subsidiaries unless otherwise specified. Waters and Atlantis are trademarks of Waters Corporation. Trizma is a registered trademark of Sigma-Aldrich Co. This information is presented as an example of the capabilities of Thermo Fisher Scientific products. It is not intended to encourage use of these products in any manners that might infringe the intellectual property rights of others. Specifications, terms and pricing are subject to change. Not all products are available in all countries. Please consult your local sales representatives for details. AN65499-EN 0719S
Find out more at thermofisher.com
Spike (ng/L) LFSM LFSM LFSM LFSM
Surrogate:
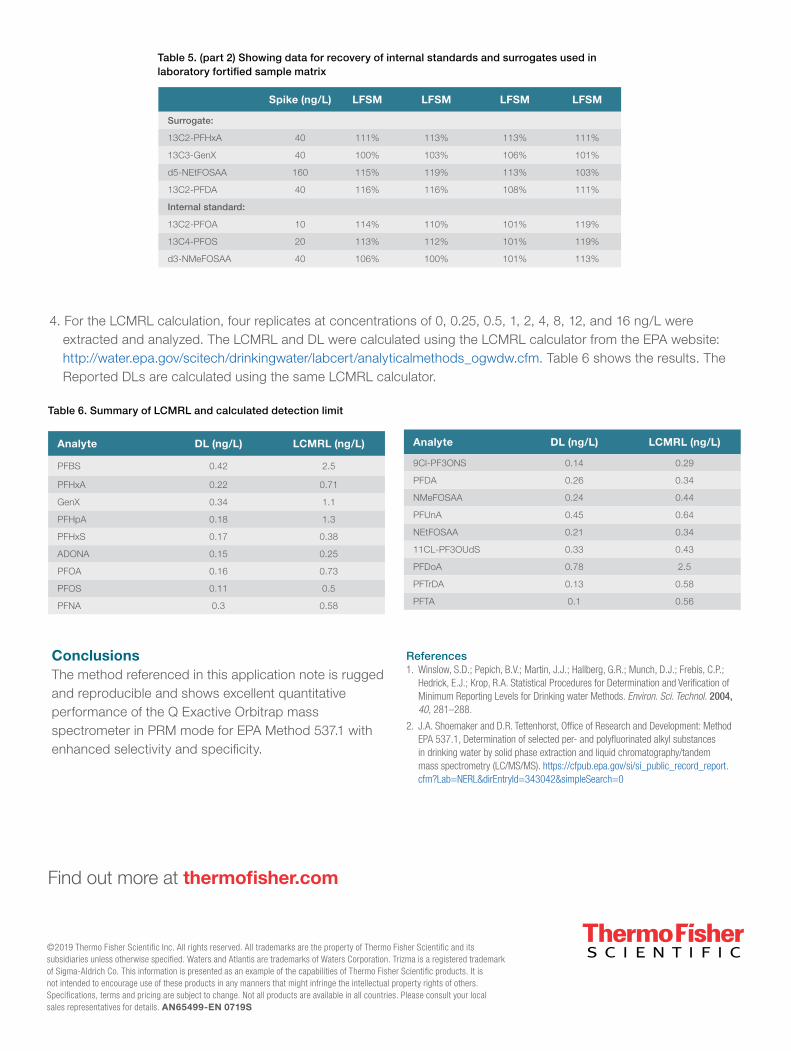
13C2-PFHxA 40 111% 113% 113% 111%
13C3-GenX 40 100% 103% 106% 101%
d5-NEtFOSAA 160 115% 119% 113% 103%
13C2-PFDA 40 116% 116% 108% 111%
Internal standard:
13C2-PFOA 10 114% 110% 101% 119%
13C4-PFOS 20 113% 112% 101% 119%
d3-NMeFOSAA 40 106% 100% 101% 113%
Table 5. (part 2) Showing data for recovery of internal standards and surrogates used in laboratory fortified sample matrix
4. For the LCMRL calculation, four replicates at concentrations of 0, 0.25, 0.5, 1, 2, 4, 8, 12, and 16 ng/L were extracted and analyzed. The LCMRL and DL were calculated using the LCMRL calculator from the EPA website: http://water.epa.gov/scitech/drinkingwater/labcert/analyticalmethods_ogwdw.cfm. Table 6 shows the results. The Reported DLs are calculated using the same LCMRL calculator.
Analyte DL (ng/L) LCMRL (ng/L)
PFBS 0.42 2.5
PFHxA 0.22 0.71
GenX 0.34 1.1
PFHpA 0.18 1.3
PFHxS 0.17 0.38
ADONA 0.15 0.25
PFOA 0.16 0.73
PFOS 0.11 0.5
PFNA 0.3 0.58
Table 6. Summary of LCMRL and calculated detection limit
ConclusionsThe method referenced in this application note is rugged and reproducible and shows excellent quantitative performance of the Q Exactive Orbitrap mass spectrometer in PRM mode for EPA Method 537.1 with enhanced selectivity and specificity.
Analyte DL (ng/L) LCMRL (ng/L)
9Cl-PF3ONS 0.14 0.29
PFDA 0.26 0.34
NMeFOSAA 0.24 0.44
PFUnA 0.45 0.64
NEtFOSAA 0.21 0.34
11CL-PF3OUdS 0.33 0.43
PFDoA 0.78 2.5
PFTrDA 0.13 0.58
PFTA 0.1 0.56
References1. Winslow, S.D.; Pepich, B.V.; Martin, J.J.; Hallberg, G.R.; Munch, D.J.; Frebis, C.P.;
Hedrick, E.J.; Krop, R.A. Statistical Procedures for Determination and Verification of Minimum Reporting Levels for Drinking water Methods. Environ. Sci. Technol. 2004, 40, 281–288.
2. J.A. Shoemaker and D.R. Tettenhorst, Office of Research and Development: Method EPA 537.1, Determination of selected per- and polyfluorinated alkyl substances in drinking water by solid phase extraction and liquid chromatography/tandem mass spectrometry (LC/MS/MS). https://cfpub.epa.gov/si/si_public_record_report.cfm?Lab=NERL&dirEntryId=343042&simpleSearch=0