Embed Size (px)
Citation preview
SECOND QUARTERLY
PROJECT TRACKING
REPORT 2017 April 2017

Southwest Power Pool, Inc.
CONTENTS
Executive Summary ................................................................................................................................................................ 3
NTC Project Summary ........................................................................................................................................................... 5
NTC Issuance................................................................................................................................................................................................ 7
NTC Withdraw ............................................................................................................................................................................................. 8
Completed Projects ................................................................................................................................................................................... 9
Project status summary ........................................................................................................................................................................ 10
Balanced Portfolio ................................................................................................................................................................. 12
Priority Projects ..................................................................................................................................................................... 14
Out-of-Bandwidth Projects ................................................................................................................................................ 16
Responsiveness Report ....................................................................................................................................................... 17
Appendix 1 ............................................................................................................................................................................... 19

Southwest Power Pool, Inc.
Q2 2017 Project Tracking Report 3
EXECUTIVE SUMMARY
SPP actively monitors and supports the progress of transmission expansion projects, emphasizing
the importance of maintaining accountability for areas such as regional grid reliability standards,
firm transmission commitments, and Tariff cost recovery.
SPP staff solicits quarterly feedback from the project owners to determine the progress of each
approved transmission project. This quarterly report charts the progress of all SPP Transmission
Expansion Plan (STEP) projects approved by the SPP Board of Directors (Board) or through a FERC
filed service agreement under the SPP Open Access Transmission Tariff (OATT).
The reporting period is November 1, 2016 through January 31, 2017. Table 1 provides a summary
of all projects in the current Project Tracking Portfolio (PTP), which includes all Network Upgrades
in which construction activities are ongoing, or construction has completed but not all the close-out
requirements have been fulfilled in accordance with Section 13 of Business Practice 7060. The PTP
includes all active Network Upgrades including transmission lines, transformers, substations, and
devices.
Table 1 below summarizes the PTP for this quarter. Figures 1 reflects the percentage cost of each
upgrade type in the PTP. Figure 2 shows the percentage cost of each project status in the PTP.
Table 1: Q2 2017 Portfolio Summary
Upgrade Type No. of Upgrades Estimated CostMiles of
New
Miles of
Rebuild
Miles of
Voltage
Conversion
Balanced Portfolio 0 $0 0.0 0.0 0.0
Economic 23 $73,158,088 1.2 0.0 28.8
High Priority 61 $1,149,286,431 757.7 5.1 0.0
Regional Reliability 313 $3,147,319,404 1549.3 377.9 449.1
Transmission Service 19 $91,158,550 12.9 15.3 0.0
Zonal Reliability 9 $147,436,190 34.7 26.9 0.0
NTC Projects Subtotal 425 $4,608,358,663 2355.8 425.1 477.9
Generation Interconnection 86 $283,692,302 0.0 0.0 0.0
Regional Reliability - Non OATT 1 $7,107,090 0.0 0.0 0.0
TO - Sponsored 3 $15,977,001 10.7 0.0 0.0
Non-NTC Projects Subtotal 90 $306,776,393 10.7 0.0 0.0
Total 515 $4,915,135,056 2366.5 425.1 477.9

Southwest Power Pool, Inc.
Q2 2017 Project Tracking Report 4
Figure 1: Percentage of Project Type on Cost Basis
Figure 2: Percentage of Project Status on Cost Basis
1.5%
6%
23%
64%
2% 3%
Economic
GenerationInterconnectionHigh Priority
Regional Reliability
Transmission Service
Zonal Reliability
0.0%
33.0%
28.8%0.6%
36.2%
0.0%0.2%
0.2%
Closed Out
Complete
On Schedule < 4
On Schedule > 4
Delay - Mitigation
Suspended
NTC - Commitment Window
Re-evaluation

Southwest Power Pool, Inc.
Q2 2017 Project Tracking Report 5
NTC PROJECT SUMMARY
In adherence to the OATT and Business Practice 7060, SPP issues Notifications to Construct (NTCs)
to Designated Transmission Owners (DTOs) to begin work on Network Upgrades that have been
approved or endorsed by the SPP Board to meet the construction needs of the STEP, OATT, or
Regional Transmission Organization (RTO).
Figure 3 reflects project status within each source study, and Table 2 provides the supporting data.
Figure 4 shows the amount of estimated cost by in-service year for all Network Upgrades that have
been issued an NTC or Notifications to Construct with Conditions (NTC-C). Note: Figures 3 and 4,
and Table 2 provide data for all projects for which SPP has issued an NTC or NTC-C,
regardless of completion date, and therefore include data from Network Upgrades no longer
included in PTP.
Figure 3: Project Status by NTC Source Study
$0.00
$200.00
$400.00
$600.00
$800.00
$1,000.00
$1,200.00
$1,400.00
On Schedule
Suspended
Delayed
Complete$ M
illi
on

Southwest Power Pool, Inc.
Q2 2017 Project Tracking Report 6
Source Study Complete Delayed Suspended On Schedule Total
2006 STEP $202,372,436 $0 $0 $0 $202,372,436 2007 STEP $499,918,131 $1,050,000 $0 $0 $500,968,131 2008 STEP $415,126,157 $0 $0 $0 $415,126,157 Balanced Portfolio $834,724,320 $0 $0 $0 $834,724,320 2009 STEP $533,469,214 $1,441,050 $0 $0 $534,910,264 Priority Projects $1,098,163,516 $185,751,250 $0 $76,500,000 $1,360,414,766 2010 STEP $109,968,783 $4,041,273 $0 $0 $114,010,056 2012 ITPNT $182,110,561 $6,267,544 $0 $0 $188,378,105 2012 ITP10 $105,901,240 $342,148,981 $0 $349,533,784 $797,584,005 2013 ITPNT $308,160,510 $156,573,802 $0 $41,462,612 $506,196,924 2014 ITPNT $148,805,523 $333,441,181 $0 $104,460,095 $586,706,799 HPILS $222,670,305 $82,435,100 $0 $375,416,679 $680,522,083 2015 ITPNT $74,216,215 $138,043,914 $0 $6,976,873 $219,237,001 2015 ITP10 $0 $0 $0 $50,456,697 $50,456,697 IS Integration Study $223,284,902 $38,000,000 $0 $111,000,000 $372,284,902 2016 ITPNT $75,638,261 $427,408,902 $0 $58,833,456 $561,880,619 2017 ITP10 $0 $0 $0 $10,956,278 $10,956,278 Ag Studies $689,925,798 $94,155,412 $0 $84,141,193 $868,222,403 DPA Studies $179,911,397 $4,608,805 $0 $16,842,293 $201,362,495 GI Studies $607,025,143 $20,000 $0 $171,181,204 $778,226,347
Total $6,511,392,412 $1,815,387,213 $0 $1,457,761,162 $9,784,540,787
Table 2: Project Status by NTC Source Study
Figure 4: Estimated Cost for NTC Project per In-Service Year
$0
$200
$400
$600
$800
$1,000
$1,200
$1,400
$1,600
$1,800
2006 2007 2008 2009 2010 2011 2012 2013 2014 2015 2016 2017 2018 2019 2020 2021
$58 $59$186
$340 $391 $348
$979
$547
$1,751
$738
$1,426
$678
$1,189
$702
$324
$29
New Q1 2017 NTC
Modified Q1 2017 NTC
Previous NTC
$ M
illi
on

Southwest Power Pool, Inc.
Q2 2017 Project Tracking Report 7
NTC ISSUANCE Sixteen new NTCs were issued since the last quarterly report totaling an estimated $77.7 million.
Six new NTCs were issued as a result of Aggregate Studies 2015-AG1-AFS-6, 2015-AG2-AFS-3, and
2016-AG1-AFS-3. Total estimated costs for upgrades resulting from those NTCs was $47.5 million.
Eight new NTCs were issued as a result of the Board’s approval of the 2017 Integrated
Transmission Planning 10-Year Assessment (ITP10). Total estimated cost of upgrades described in
those NTCs was $9.6 million.
One new NTC was issued as a result of the Board approval of the 2017 Integrated Transmission
Planning Near-Term Assessment (ITPNT). Total estimated cost of the Network Upgrades described
in this NTC is $23.1 million.
NTC ID Owner NTC
Issue Date
Upgrade Type
Source Study
No. of Upgrades
Estimated Cost of New Upgrades
Estimated Cost of Previously
Approved Upgrades
200422 WR 1/11/17 Regional
Reliability 2016-AG1-
AFS-3 1 $ 23,683,317
200421 SPS 1/12/17 Regional
Reliability 2015-AG2-
AFS-3 1 $ 3,790,207
200420 SPS 1/12/17 Regional
Reliability 2015-AG1-
AFS-6 5 $ 5,778,860
200423 OGE 1/12/17 Regional
Reliability 2016-AG1-
AFS-3 1 $ 37,638
200426 BEPC 1/16/17 Regional
Reliability 2016-AG1-
AFS-3 2 $ 11,557,720
200437 MIDW 2/8/17 Regional
Reliability 2015-AG2-
AFS-3 1 $ - $ 2,663,963
200430 WR 2/21/17 Economic 2017 IPT10
2 $ 350,010
200434 OGE 2/21/17 Economic 2017 IPT10
1 $ 16,000
200433 WFEC 2/21/17 Economic 2017 IPT10
1 $ 100,000
200431 AEP 2/21/17 Economic 2017 IPT10
1 $ 4,780,000
200432 GRDA 2/21/17 Economic 2017 IPT10
1 $ 279,400
200429 MIDW 2/22/17 Economic 2017 IPT10
3 $ 3,306,360
200428 KCPL 2/22/17 Economic 2017 IPT10
1 $ 500,000
200444 SPS 2/22/17 Economic 2017 IPT10
5 $ 356,757
200436 SPS 2/22/17 High
Priority 2017
ITPNT 2 $ 20,502,997
Total 28 $54,536,269 $23,166,960
Table 3: Q2 2017 NTC Issuance Summary

Southwest Power Pool, Inc.
Q2 2017 Project Tracking Report 8
NTC WITHDRAW Seven NTCs were withdrawn for four Network Upgrades since the last quarterly report, totaling an
estimated $37.7 million.
Upgrades included in NTCs listed in Table 4 were determined to no longer be needed as a part of
the 2017 ITPNT Assessment. The Board approved the withdrawals at its January 2017 meeting.
Table 4 lists the NTC Withdraw activity from January 1, 2017 through March 31, 2017. NTC ID
values in bold font indicate NTC-Cs.
NTC ID Owner NTC
Withdraw Date
Upgrade Type Source Study No. of
Upgrades
Estimated Cost of Withdrawn Upgrades
200435 SPS 2/22/17 Regional Reliability 2017 ITPNT 5 $ 5,362,750
200436 SPS 2/22/17 High Priority 2017 ITPNT 4 $ 26,708,255
200443 GRDA 2/22/17 Regional Reliability 2017 ITPNT 2 $ 295,000
200442 OPPD 2/22/17 Regional Reliability 2017 ITPNT 1 $ 3,141,600
200440 WR 2/22/17 Zonal Reliability 2017 ITPNT 1 $ 1,390,166
200439 WR 2/22/17 Zonal Reliability 2017 ITPNT 1 $ 767,165
200438 SPS 2/22/17 Regional Reliability 2017 ITPNT 1 Costs included in
PID 30914
Total 15 $ 37,664,936
Table 4: Q2 2017 NTC Withdraw Summary

Southwest Power Pool, Inc.
Q2 2017 Project Tracking Report 9
COMPLETED PROJECTS Seven Network Upgrades with NTCs and four Generation Interconnection Network Upgrades were verified as completed during the reporting period, totaling an estimated $342.5 million.
Table 5 lists the Network Upgrades reported and confirmed as completed during the reporting
period. Table 6 summarizes the completed projects over the previous year, including Network
Upgrades not yet confirmed as completed. Figure 5 reflects the completed projects by upgrade type
on a cost basis for the current year and the following year based on current projected in-service
dates. Tables 7 and 8 summarize all Network Upgrades that include construction of transmission
lines, both for the current year and the following year. Note: Previous quarter’s updated results
are listed as the Transmission Owners may make adjustments to final costs and status of
projects completed during the year.
UID Network Upgrade Name Owner NTC Source
Study Cost Estimate
11238 Sibley - Mullin Creek 345 kV TSMO Priority Projects $ 173,500,000
11240 Nebraska City - Mullin Creek 345 kV (OPPD) OPPD Priority Projects $ 70,361,776
50429 Elm Creek - Summit 345 kV Ckt 1 (WR) WR 2012 ITP10 $ 52,996,990
50520 Mingo 345/115 kV Ckt 2 Transformer SEPC 2015 ITPNT $ 8,229,189
51117 Darlington - Roman Nose 138 kV Ckt 1 (OGE) OGE HPILS $ 12,701,091
51180 Mingo 345 kV Terminal Upgrades SEPC 2015 ITPNT $ 4,151,656
51345 GRDA3 345kV - Tonnece Relays GRDA GI Studies Costs included in
UID 51343
51363 Terry Road 345kV Station (TOIF) AEP GI Studies $ 1,869,249
51364 Terry Road 345kV Station (NU) AEP GI Studies $ 13,026,889
51524 Comanche Tap - Tosco 69 kV Ckt 1 Rebuild AEP 2016 ITPNT $ 4,365,864
51575 Tap Wichita - Thistle 345 kV Ckt 1 & 2 - GEN-2015-024 Addition (TOIF)
WR GI Studies $ 1,261,334
Total $ 342,464,038
Table 5: Q2 2017 Completed Network Upgrades
Upgrade Type Q2 2016 Q3 2016 Q4 2016 Q1 2017 Total
Regional Reliability 18 14 14 10 56
Regional Reliability $169,506,516 $171,496,818 $166,199,657 $102,742,394 $609,945,385
Transmission Service 1 1 2 0 4
Transmission Service $146,944 $6,072,000 $561,758 $0 $6,780,702
Balanced Portfolio 0 0 0 0 0
Balanced Portfolio $0 $0 $0 $0 $0
High Priority 4 4 0 8 16
High Priority $19,711,656 $22,480,119 $0 $534,020,371 $576,212,146
Economic 0 0 0 0 0
Economic $0 $0 $0 $0 $0
Zonal Reliability 0 0 0 0 0
Zonal Reliability $0 $0 $0 $0 $0
Generation Interconnection 2 4 19 13 38
Generation Interconnection $360,000 $19,938,164 $64,322,751 $41,189,932 $125,810,847
Table 6: Completed Project Summary as of 2nd Quarter 2017

Southwest Power Pool, Inc.
Q2 2017 Project Tracking Report 10
Figure 5: Completed Upgrades by Type per Quarter
Voltage
Class Number of Upgrades New
Rebuild/ Reconductor
Voltage Conversion Estimated Cost
69 5 5.2 25.2 69.0 $ 18,591,627.87
115 9 111.7 11.4 0.0 $ 109,335,042.80
138 7 53.8 26.2 21.8 $ 63,173,447.37
161 0 0.0 0.0 0.0 $ -
230 0 0.0 0.0 0.0 $ -
345 7 376.7 0.0 0.0 $ 645,787,970.00
Total 28 547.4 62.7 90.8 $ 836,888,088.04
Table 7: Line Upgrade Summary for Previous 12 Months
Voltage
Class Number of Upgrades New
Rebuild/ Reconductor
Voltage Conversion Estimated Cost
69 5 4.7 23.9 0.0 $ 43,541,651.00
115 23 157.9 54.6 6.0 $ 207,764,258.95
138 4 26.8 16.5 138.0 $ 42,958,424.97
161 1 0.0 11.1 0.0 $ 12,705,537.22
230 3 48.8 0.0 0.0 $ 73,100,000.00
345 1 58.0 0.0 0.0 $ 86,000,000.00
Total 37.0 296.3 106.1 144.0 $ 466,069,872.14
Table 8: Line Upgrade Projections for Next 12 Months
PROJECT STATUS SUMMARY SPP assigns a project status to all Network Upgrades based on the projected in-service dates
provided by the DTOs relative to the Need Date determined for the project. Project status
definitions are provided below:
$0.0
$50.0
$100.0
$150.0
$200.0
$250.0
$300.0
$350.0
$400.0
Q2 2016 Q3 2016 Q4 2016 Q1 2017 Q2 2017Projected
Q3 2017Projected
Q4 2017Projected
Q1 2018Projected
Generation InterconnectionZonal ReliabilityEconomicHigh PriorityBalanced PortfolioTransmission ServiceRegional Reliability
$ M
illi
on
Southwest Power Pool, Inc.
Q2 2017 Project Tracking Report 11
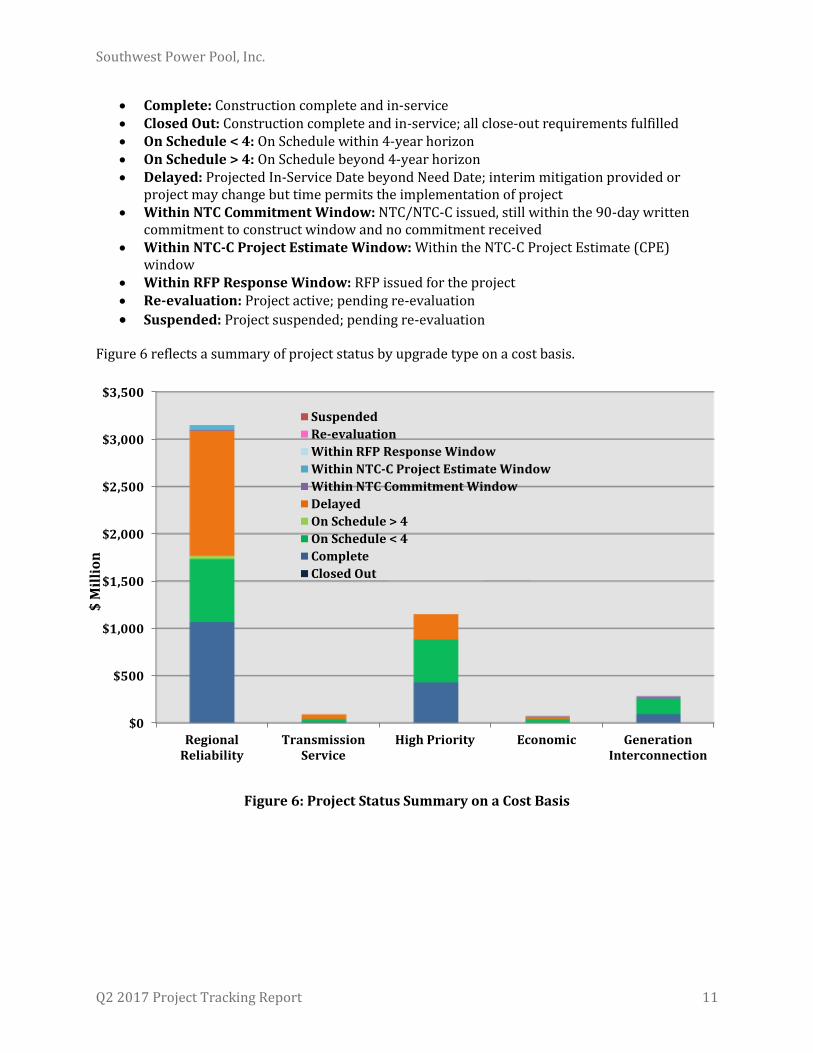
Complete: Construction complete and in-service Closed Out: Construction complete and in-service; all close-out requirements fulfilled On Schedule < 4: On Schedule within 4-year horizon On Schedule > 4: On Schedule beyond 4-year horizon Delayed: Projected In-Service Date beyond Need Date; interim mitigation provided or
project may change but time permits the implementation of project Within NTC Commitment Window: NTC/NTC-C issued, still within the 90-day written
commitment to construct window and no commitment received Within NTC-C Project Estimate Window: Within the NTC-C Project Estimate (CPE)
window Within RFP Response Window: RFP issued for the project Re-evaluation: Project active; pending re-evaluation
Suspended: Project suspended; pending re-evaluation
Figure 6 reflects a summary of project status by upgrade type on a cost basis.
Figure 6: Project Status Summary on a Cost Basis
$0
$500
$1,000
$1,500
$2,000
$2,500
$3,000
$3,500
RegionalReliability
TransmissionService
High Priority Economic GenerationInterconnection
Suspended
Re-evaluation
Within RFP Response Window
Within NTC-C Project Estimate Window
Within NTC Commitment Window
Delayed
On Schedule > 4
On Schedule < 4
Complete
Closed Out
$ M
illi
on

Southwest Power Pool, Inc.
Q2 2017 Project Tracking Report 12
BALANCED PORTFOLIO
Approved in April 2009, the Balanced Portfolio was an initiative to develop a group of economic
transmission upgrades that benefit the entire SPP region, and to allocate those project costs
regionally. The projects that were issued NTCs as a result of the study include a diverse group of
projects, estimated to add approximately 702 miles of new 345 kV transmission line to the SPP
system.
The total cost estimate of $831.4 million for the projects making up the Balanced Portfolio did not
change from the previous quarter’s total.
All the projects making up the Balanced Portfolio have been completed and placed into service. A
final reallocation of Revenue Requirements for deficient Zone(s) will be performed once all actual
costs have been reported.
Figure 7 below depicts a historical view of the total estimated cost of the Balanced Portfolio. Table 9
provides a project summary of the projects making up the Balanced Portfolio.
As of this report, all Balanced Portfolio upgrades are completed and have been closed out. This
section will not be carried forward in future reports.
Figure 7: Balanced Portfolio Cost Estimate Trend
$691.2
$832.3
$903.0
$810.5
$831.4
$831.4
$650.0
$700.0
$750.0
$800.0
$850.0
$900.0
$950.0
BP
Rep
ort
6/0
9
Ori
gin
al N
TCs
2009
Q3
Q4
2010
Q1
Q2
Q3
Q4
2011
Q1
Q2
Q3
Q4
2012
Q1
Q2
Q3
Q4
2013
Q1
Q2
Q3
Q4
2014
Q1
Q2
Q3
Q4
2015
Q1
Q2
Q3
Q4
2016
Q1
Q2
Q3
Q4
2017
Q1
FERC Filing $896.7
$ M
illi
on

Southwest Power Pool, Inc.
Q2 2017 Project Tracking Report 13
Project ID(s)
Project Owner(s)
Project Name Line
Length Study
Estimates Q4 2016 Cost
Estimates Q1 2017 Cost
Estimates Var. %
705/709 WFEC/OGE Gracemont Substation 345 kV
N/A $8,000,000 $14,859,014 $14,859,014 0.0%
707/708 ITCGP/NPPD Spearville - Post Rock - Axtell 345 kV
226.9 $236,557,015 $206,798,467 $206,798,467 0.0%
698/699 OGE/GRDA Sooner - Cleveland 345 kV
36 $33,530,000 $50,269,871 $50,269,871 0.0%
702 KCPL Swissvale - Stilwell Tap 345 kV
N/A $2,000,000 $2,875,727 $2,875,727 0.0%
700 OGE Seminole - Muskogee 345 kV
118 $129,000,000 $163,456,250 $163,456,250 0.0%
701/704 OGE/SPS Tuco – Woodward 345 kV
290.1 $227,727,500 $330,158,871 $330,158,871 0.0%
703 GMO/KCPL Iatan – Nashua 345 kV
30.9 $54,444,000 $62,949,252 $62,949,252 0.0%
Total 701.9 $691,258,515 $831,367,452 $831,367,452 0.0%
Table 9: Balanced Portfolio Cost Summary

Southwest Power Pool, Inc.
Q2 2017 Project Tracking Report 14
PRIORITY PROJECTS
In April 2010, the Board and Members Committee approved for construction a group of "priority"
high voltage electric transmission projects estimated to bring benefits of at least $3.7 billion to the
SPP region over 40 years. The projects issued NTCs as a result of the study were estimated to add
291 miles of new single circuit 345 kV transmission line and 435 miles of double circuit 345 kV
transmission to the SPP region.
In October 2010, the Board approved an overall cost increase for the Priority Projects due to line
rerouting and addition costs for reactive compensation. The total cost estimate for the Priority
Projects after the variances were approved was $1.42 billion.
The total cost estimate of $1.37 billion for the projects included in the Priority Projects report
increased by 4.4% from the previous quarter’s total.
Figure 8 below depicts a historical view of the total estimated cost of the Priority Projects. Table 10
provides a project summary of the projects making up the Priority Projects. Table 11 lists
construction status updates for the Priority Projects not yet completed.
Figure 8: Priority Project Cost Estimate Trend
$1,144.9
$1,416.3
$1,449.7
$1,388.2 $1,381.0
$1,387.9
$1,316.8
$1,360.4
$1,100.0
$1,150.0
$1,200.0
$1,250.0
$1,300.0
$1,350.0
$1,400.0
$1,450.0
$1,500.0
PP
Rep
ort
4/2
010
Ori
gin
al N
TCs
6/2
010
2010
Q3
Q4
2011
Q1
Q2
Q3
Q4
2012
Q1
Q2
Q3
Q4
2013
Q1
Q2
Q3
Q4
2014
Q1
Q2
Q3
Q4
2015
Q1
Q2
Q3
Q4
2016
Q1
Q2
Q3
Q4
2017
Q1
Additional Costs Approved by Board
$1,416.3 $ M
illi
on

Southwest Power Pool, Inc.
Q2 2017 Project Tracking Report 15
Project ID(s)
Project Owner
(s) Project
Est. Line
Length
BOD Approved Estimates (10/2010)
Q4 2016 Cost Estimates
Q1 2017 Cost Estimates
Q4 v. Q1 Var.
%
937 AEP
Tulsa Power Station 138 kV Reactor
N/A $842,847 $614,753 $614,753 0.0%
940/941 SPS/OGE
Hitchland – Woodward District 345 kV Dbl Ckt
128.8 $221,572,283 $229,667,207 $229,797,229 0.1%
942/943 PW/OGE
Thistle – Woodward District 345 kV Dbl Ckt
106.6 $201,940,759 $185,315,142 $185,403,885 0.0%
945 ITCGP
Spearville – Ironwood – Clark Co. – Thistle 345 kV Dbl Ckt
122.5 $293,235,000 $316,862,107 $318,469,400 0.5%
946 PW/WR Thistle – Wichita 345 kV Dbl Ckt
77.5 $163,488,000 $119,817,694 $120,016,474 0.2%
936 AEP
Valliant – NW Texarkana 345 kV
76.3 $131,451,250 $185,751,250 $185,751,250 0.0%
938/939 OPPD/G
MO
Nebraska City – Mullin Creek – Sibley 345 kV
215 $403,740,000 $320,361,776 $320,361,776 0.0%
Total 726.7 $1,416,270,139 $1,358,389,929 $1,360,414,767 0.1%
Table 10: Priority Projects Summary
Pro
ject
ID
Pro
ject
Na
me
Pro
ject
ed
In
-Se
rvic
e
Da
te
En
gin
ee
rin
g
Sit
ing
an
d R
ou
tin
g
En
vir
on
me
nta
l S
tud
ies
Pe
rmit
s
Ma
teri
al
Pro
cure
me
nt
Co
nst
ruct
ion
C Complete
936 Valliant – NW Texarkana 345 kV 12/16/2016 C C C C C IP
IP In Progress
938 Nebraska City – Mullin Creek – Sibley 345 kV (TSMO)
12/31/2016 C C C C C IP
NS Not Started
939 Nebraska City – Mullin Creek – Sibley 345 kV (OPPD)
12/31/2016 C C C C C C
N/A Not Applicable
Table 11: Priority Projects Construction Status

Southwest Power Pool, Inc.
Q2 2017 Project Tracking Report 16
OUT-OF-BANDWIDTH PROJECTS
In adherence to the Business Practice 7060, SPP reports projects that have updated cost values that exceed their established baseline values based upon a ±20% bandwidth. Variances are determined
by total project cost.
Three projects with a cost estimate greater than $5 million were identified as having exceeded the ±20% bandwidth requirement during the reporting period.
Project Cost Working Group did not review any out-of-bandwidth projects in this reporting period.

Southwest Power Pool, Inc.
Q2 2017 Project Tracking Report 17
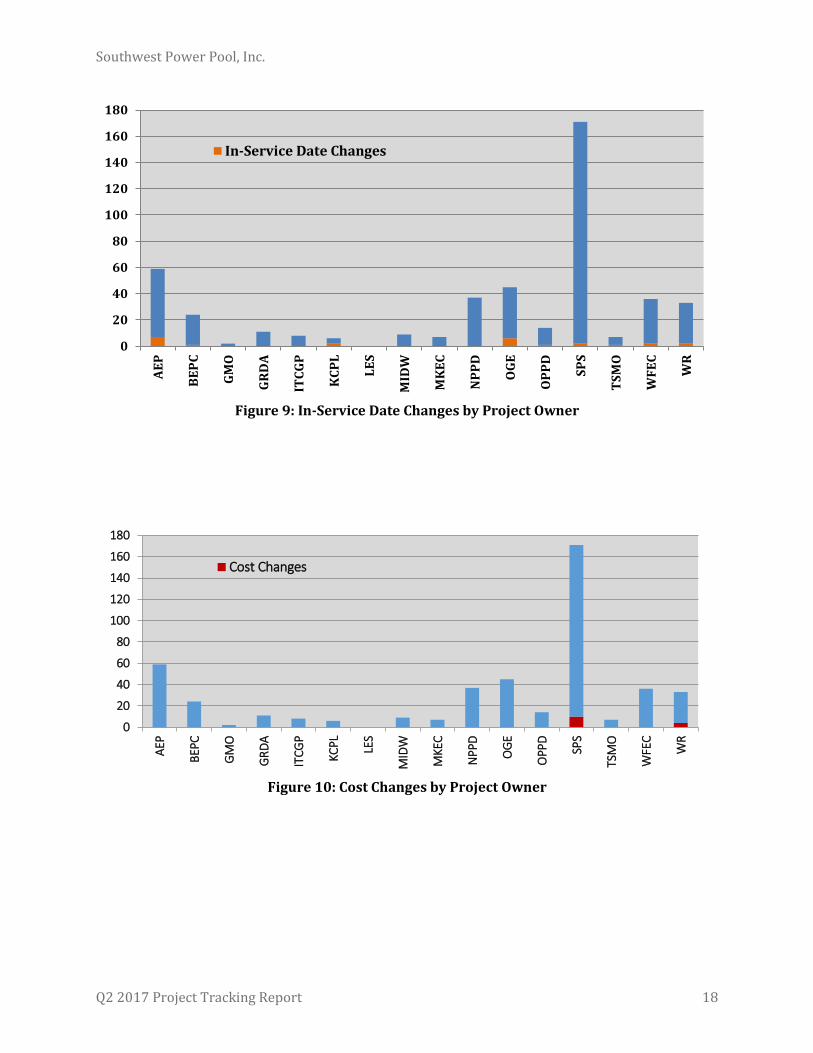
RESPONSIVENESS REPORT
Table 14 and Figures 9 and 10 provide insight into the responsiveness of DTOs constructing
Network Upgrades within SPP in the Quarterly Project Tracking Report for Q2 2017. Note:
Network Upgrades with statuses of “Suspended”, “Re-evaluation”, “Within NTC Commitment
Window”, “Within NTC-C Project Estimate Window”, and “Within RFP Response Window”
were excluded from this analysis.
Project
Owner
Number of
Upgrades
Number of
Upgrades
Reviewed
Reviewed
%
Number
of ISD
Changes
ISD Change
%
Number of
Cost
Changes
Cost
Change
%
AEP 59 59 100% 7 12% 0 0%
BEPC 24 8 33% 1 4% 0 0%
GMO 2 2 100% 0 0% 0 0%
GRDA 11 7 64% 0 0% 0 0%
ITCGP 8 0 0% 0 0% 0 0%
KCPL 6 6 100% 2 33% 0 0%
LES 0 0 0% 0 0% 0 0%
MIDW 9 0 0% 0 0% 0 0%
MKEC 7 0 0% 0 0% 0 0%
NPPD 37 20 54% 0 0% 0 0%
OGE 45 6 13% 6 13% 0 0%
OPPD 14 14 100% 1 7% 0 0%
SPS 171 169 99% 2 1% 10 6%
TSMO 7 7 100% 1 14% 0 0%
WFEC 36 2 6% 2 6% 0 0%
WR 33 33 100% 2 6% 4 12%
Total 481 335 70% 26 5% 14 3%
Table 14: Responsiveness Summary by Project Owner
Southwest Power Pool, Inc.
Q2 2017 Project Tracking Report 18
Figure 9: In-Service Date Changes by Project Owner
Figure 10: Cost Changes by Project Owner
0
20
40
60
80
100
120
140
160
180
AE
P
BE
PC
GM
O
GR
DA
ITC
GP
KC
PL
LE
S
MID
W
MK
EC
NP
PD
OG
E
OP
PD
SP
S
TS
MO
WF
EC
WR
In-Service Date Changes
0
20
40
60
80
100
120
140
160
180
AEP
BEP
C
GM
O
GR
DA
ITC
GP
KCP
L
LES
MID
W
MKE
C
NP
PD
OG
E
OPP
D
SPS
TSM
O
WFE
C
WR
Cost Changes

Southwest Power Pool, Inc.
Q2 2017 Project Tracking Report 19
APPENDIX 1
{See accompanying list of active Applicable Projects}