Embed Size (px)
Citation preview
Meeting of the Board of Directors | Q4 20192020 Strategic Plan
S E C O N D Q U A R T E R E A R N I N G S S U P P L E M E N T A LA U G U S T 5 , 2 0 2 1
1
Meeting of the Board of Directors | Q4 20192020 Strategic Plan
This presentation contains forward-looking statements, within the meaning of the Private Securities Litigation Reform Act of 1995 ("PSLRA"), which are subject to known and unknown risks, uncertainties and other important factors that may cause actual results to be materially different from the statements made herein.All statements other than statements of historical fact included in this presentation are forward-looking statements, including, but not limited to, expected financial results and operating performance for fiscal 2021, including guidance for the third quarter of 2021 and the full year of 2021, expected 2021 key financial drivers, expected development targets for fiscal 2021 and fiscal 2022, including expected Shack construction and openings, expected same-Shack sales growth and trends in the Company’s operations, the Company's licensed business, the Company's investment in its employees, the expansion of the Company’s delivery services, the Company’s digital investments and strategies, and statements relating to the effects of COVID-19 and the Company’s mitigation efforts.
Forward-looking statements discuss the Company’s current expectations and projections relating to its financial operations, plans, objectives, future performance and business. You can identify forward-looking statements by the fact that they do not relate strictly to historical or current facts. These statements may include words such as "aim," "anticipate," "believe," "estimate," "expect," "forecast," "future," "intend,"
"outlook," "potential," "project," "projection," "plan," "seek," "may," "could," "would," "will," "should," "can," "can have," "likely," the negatives thereof and other similar expressions. All forward-looking statements are expressly qualified in their entirety by these cautionary statements. Some of the factors which could cause results to differ materially from the Company’s expectations include the impact of the COVID-19 pandemic, our ability to develop and open new Shacks on a timely basis, the management of our digital capabilities and expansion into delivery, and risks relating to the restaurant industry generally. You should evaluate all forward-looking statements made in this presentation in the context of the risks and uncertainties disclosed in our Annual Report on Form 10-K for the fiscal year ended December 30, 2020 as filed with the Securities and Exchange Commission (the "SEC"). All of the Company's SEC filings are available online at www.sec.gov, www.shakeshack.com or upon request from Shake Shack Inc. The forward-looking statements included in this presentation are made only as of the date hereof. The Company undertakes no obligation to publicly update or revise any forward-looking statement as a result of new information, future events or otherwise, except as otherwise required by law.
CAUTIONARY NOTE ON FORWARD-LOOKING STATEMENTS
2
Meeting of the Board of Directors | Q4 20192020 Strategic Plan
Q2 2021 RESULTS
1. “Shack system-wide sales” is an operating measure and consists of sales from the Company's domestic Company-operated Shacks, domestic licensed Shacks and international licensed Shacks. The Company does not recognize the sales from licensed Shacks as revenue. Of these amounts, revenue is limited to licensing revenue based on a percentage of sales from domestic and international licensed Shacks, as well as certain up-front fees, such as territory fees and opening fees.
2. "Same-Shack sales" or “SSS” represents Shack sales for the comparable Shack base, which is defined as the number of domestic Company-operated Shacks open for 24 full fiscal months or longer. For Shacks that were temporarily closed, the comparative prior period was also adjusted. 3. To normalize for the 53rd week in fiscal 2020, the compare periods for both 2020 and 2019 have been shifted forward a week from the fiscal calendar in order to show a more like-for-like comparison. See Financial Details section for more information and 2021 SSS comparative periods.4. "Shack-level operating profit," a non-GAAP measure, is defined as Shack sales less Shack-level operating expenses including food and paper costs, labor and related expenses, other operating expenses and occupancy and related expenses. See Financial Details section for definition and
reconciliation to most comparable GAAP measure.5. “Adjusted EBITDA,” a non-GAAP measure, is defined as EBITDA excluding equity-based compensation expense, deferred lease costs, impairment and loss on disposal of assets, amortization of cloud-based software implementation costs, as well as certain non-recurring items that the
Company does not believe directly reflect its core operations and may not be indicative of the Company's recurring business operations. See Financial Details section for definition and reconciliation to most comparable GAAP measure.
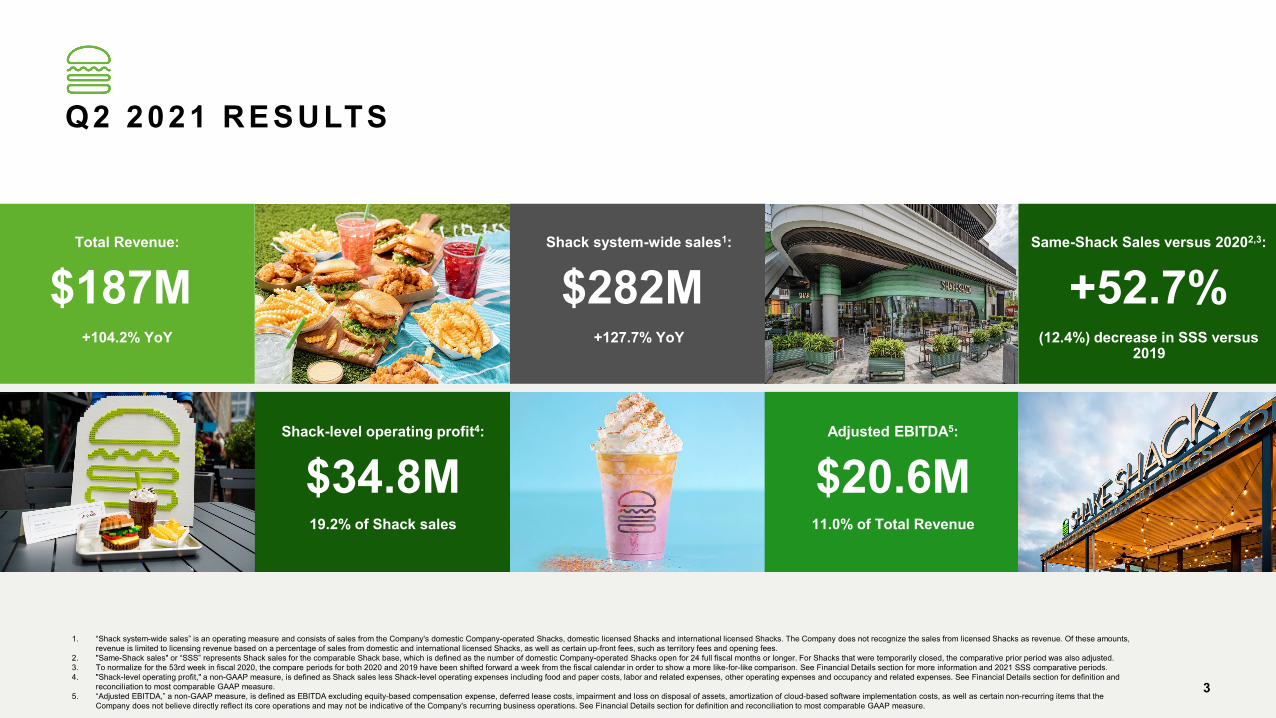
Total Revenue:
$187M +104.2% YoY
3
Shack-level operating profit4:
$34.8M19.2% of Shack sales
Shack system-wide sales1:
$282M +127.7% YoY
Adjusted EBITDA5:
$20.6M11.0% of Total Revenue
Same-Shack Sales versus 20202,3:
+52.7%(12.4%) decrease in SSS versus
2019
Meeting of the Board of Directors | Q4 20192020 Strategic Plan
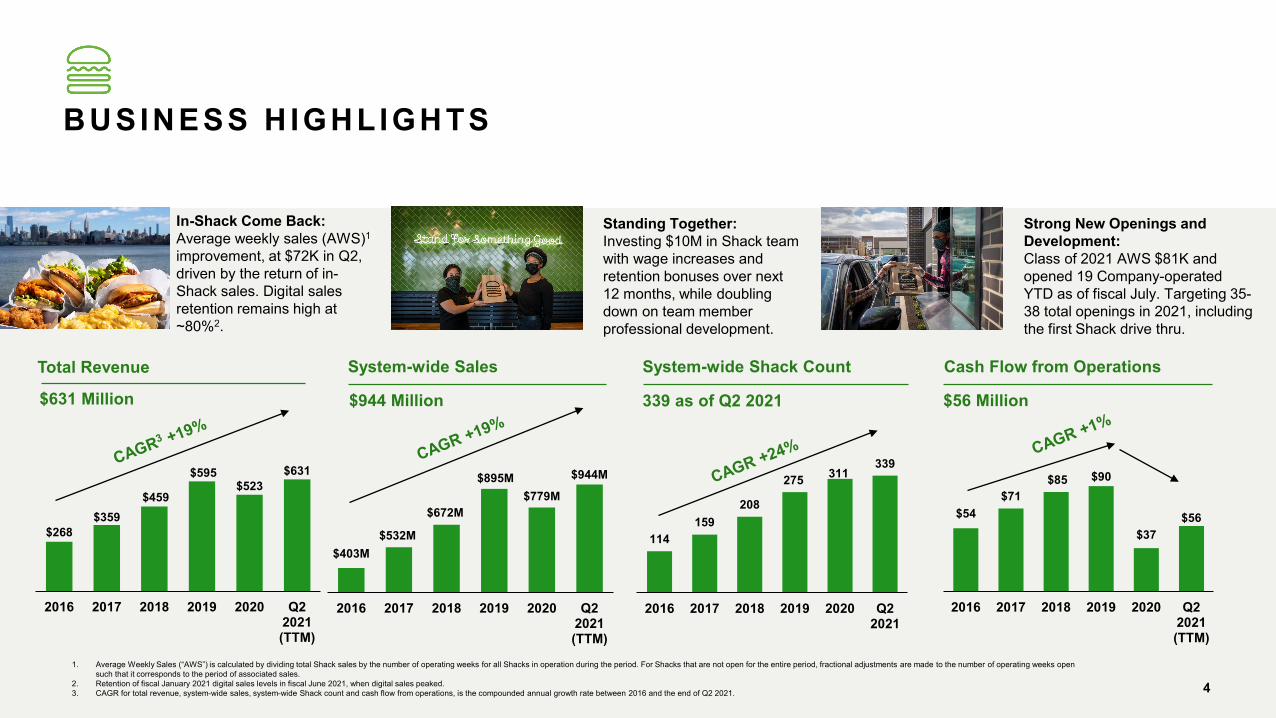
Total Revenue
$631 Million
System-wide Sales
$944 Million
System-wide Shack Count
339 as of Q2 2021
Cash Flow from Operations
$56 Million
1. Average Weekly Sales (“AWS”) is calculated by dividing total Shack sales by the number of operating weeks for all Shacks in operation during the period. For Shacks that are not open for the entire period, fractional adjustments are made to the number of operating weeks open such that it corresponds to the period of associated sales.
2. Retention of fiscal January 2021 digital sales levels in fiscal June 2021, when digital sales peaked.3. CAGR for total revenue, system-wide sales, system-wide Shack count and cash flow from operations, is the compounded annual growth rate between 2016 and the end of Q2 2021.
$268$359
$459
$595$523
$631
2016 2017 2018 2019 2020 Q22021(TTM)
$403M$532M
$672M
$895M$779M
$944M
2016 2017 2018 2019 2020 Q22021(TTM)
114159
208
275 311339
2016 2017 2018 2019 2020 Q22021
$54$71
$85 $90
$37$56
2016 2017 2018 2019 2020 Q22021(TTM)
4
Strong New Openings and Development:Class of 2021 AWS $81K and opened 19 Company-operated YTD as of fiscal July. Targeting 35-38 total openings in 2021, including the first Shack drive thru.
Standing Together:Investing $10M in Shack team with wage increases and retention bonuses over next 12 months, while doubling down on team member professional development.
In-Shack Come Back:Average weekly sales (AWS)1
improvement, at $72K in Q2, driven by the return of in-Shack sales. Digital sales retention remains high at ~80%2.
BUSINESS H IGHLIGHTS
Meeting of the Board of Directors | Q4 20192020 Strategic Plan
FISCAL JULY 2021 SNAPSHOT
1. To normalize for the 53rd week in fiscal 2020, the compare periods for both 2020 and 2019 have been shifted forward a week from the fiscal calendar in order to show a more like-for-like comparison. See Financial Details section for more information and 2021 SSS comparative periods.
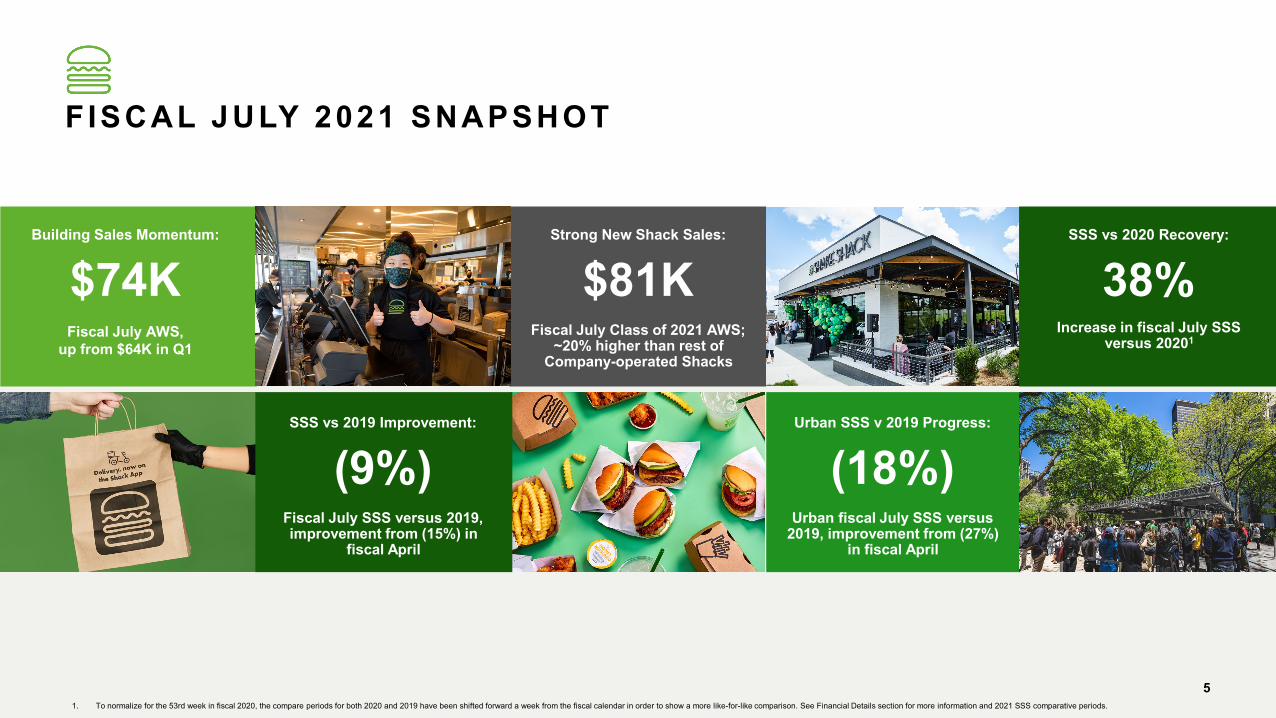
Building Sales Momentum:
$74KFiscal July AWS,
up from $64K in Q1
Urban SSS v 2019 Progress:
(18%)Urban fiscal July SSS versus
2019, improvement from (27%) in fiscal April
SSS vs 2019 Improvement:
(9%)Fiscal July SSS versus 2019, improvement from (15%) in
fiscal April
5
Strong New Shack Sales:
$81KFiscal July Class of 2021 AWS;
~20% higher than rest of Company-operated Shacks
SSS vs 2020 Recovery:
38%Increase in fiscal July SSS
versus 20201
Meeting of the Board of Directors | Q4 20192020 Strategic Plan
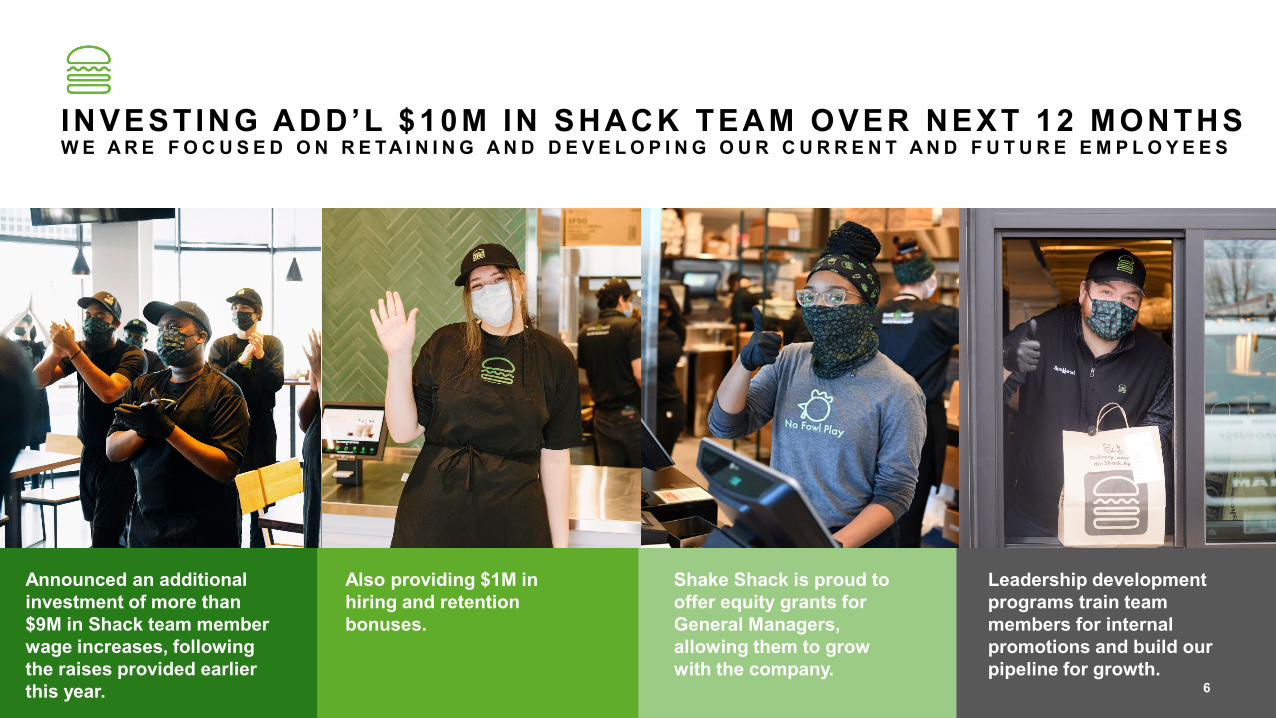
Announced an additional investment of more than $9M in Shack team member wage increases, following the raises provided earlier this year.
Also providing $1M in hiring and retention bonuses.
Shake Shack is proud to offer equity grants for General Managers, allowing them to grow with the company.
Leadership development programs train team members for internal promotions and build our pipeline for growth.
INVESTING ADD’L $10M IN SHACK TEAM OVER NEXT 12 MONTHSW E A R E F O C U S E D O N R E TA I N I N G A N D D E V E L O P I N G O U R C U R R E N T A N D F U T U R E E M P L O Y E E S
6
Meeting of the Board of Directors | Q4 20192020 Strategic Plan
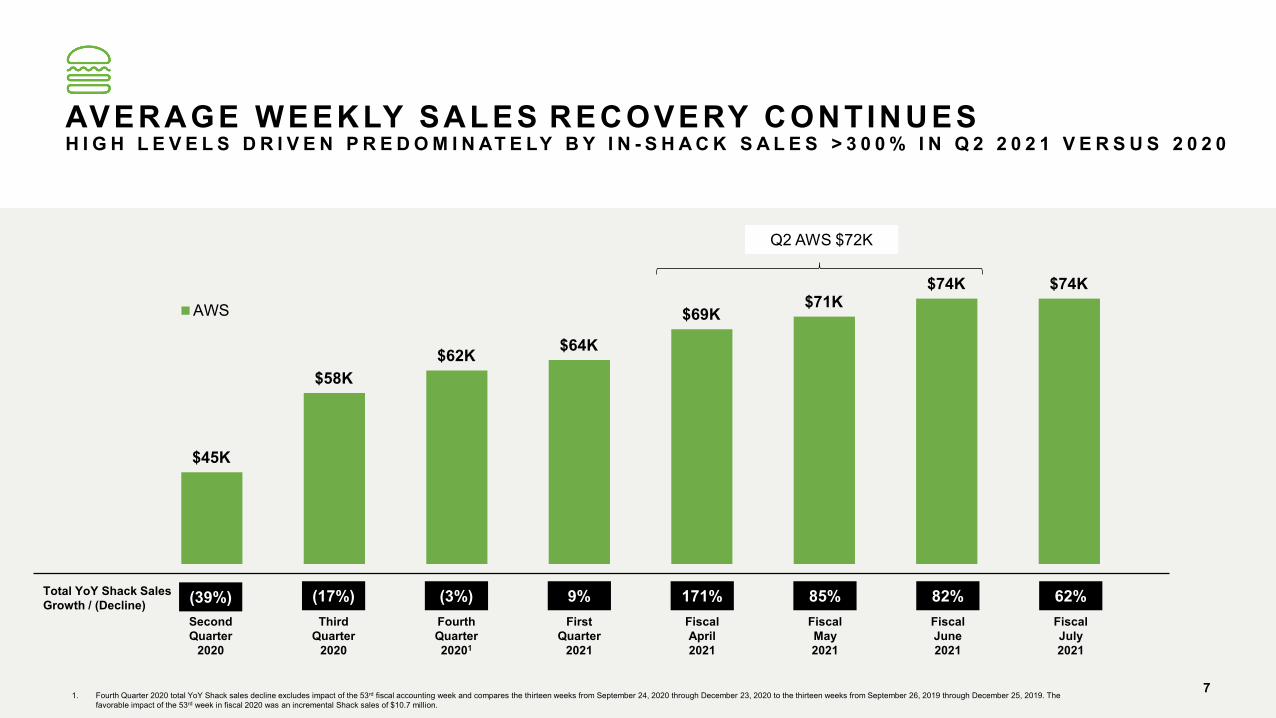
$45K
$58K$62K $64K
$69K$71K
$74K $74KAWS
Third Quarter
2020
Fourth Quarter20201
1. Fourth Quarter 2020 total YoY Shack sales decline excludes impact of the 53rd fiscal accounting week and compares the thirteen weeks from September 24, 2020 through December 23, 2020 to the thirteen weeks from September 26, 2019 through December 25, 2019. The favorable impact of the 53rd week in fiscal 2020 was an incremental Shack sales of $10.7 million.
(17%) (3%) 9%Total YoY Shack Sales Growth / (Decline)
First Quarter
2021
Second Quarter
2020
(39%)
AVERAGE WEEKLY SALES RECOVERY CONTINUESH I G H L E V E L S D R I V E N P R E D O M I N AT E LY B Y I N - S H A C K S A L E S > 3 0 0 % I N Q 2 2 0 2 1 V E R S U S 2 0 2 0
7
171%Fiscal April 2021
85%Fiscal May 2021
82%Fiscal June 2021
62%Fiscal July 2021
Q2 AWS $72K
Meeting of the Board of Directors | Q4 20192020 Strategic Plan
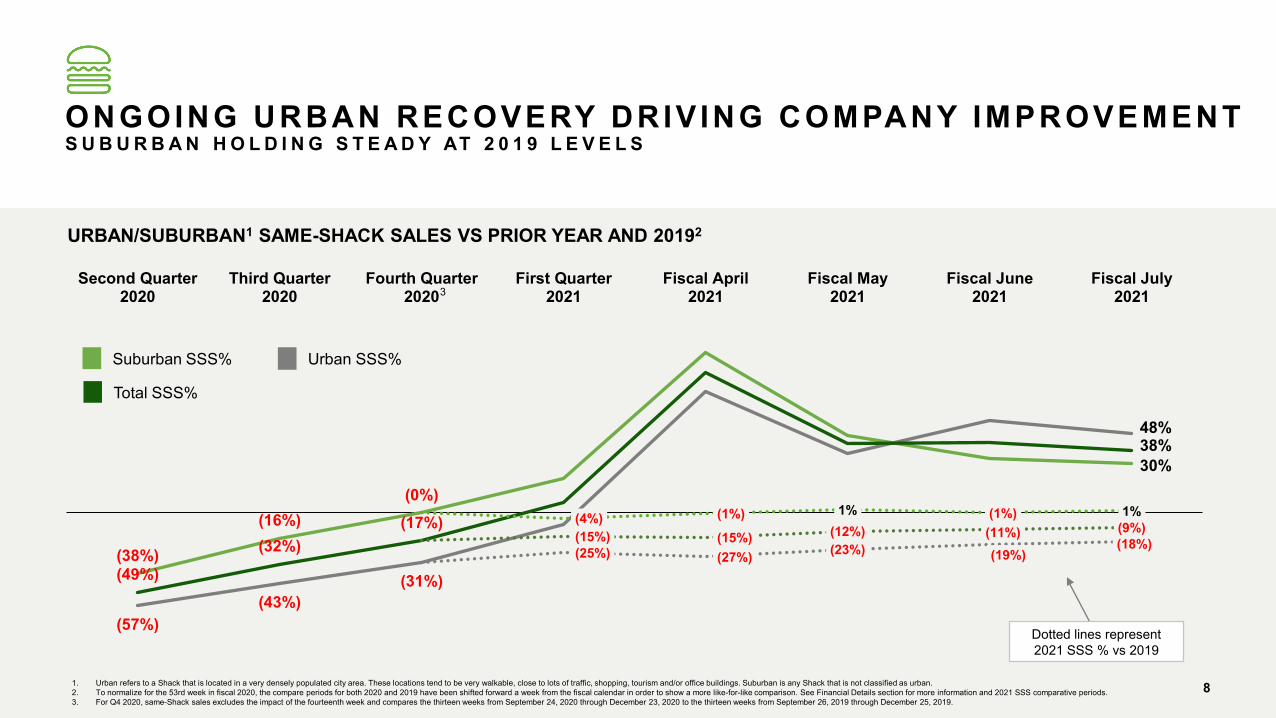
1. Urban refers to a Shack that is located in a very densely populated city area. These locations tend to be very walkable, close to lots of traffic, shopping, tourism and/or office buildings. Suburban is any Shack that is not classified as urban.2. To normalize for the 53rd week in fiscal 2020, the compare periods for both 2020 and 2019 have been shifted forward a week from the fiscal calendar in order to show a more like-for-like comparison. See Financial Details section for more information and 2021 SSS comparative periods.3. For Q4 2020, same-Shack sales excludes the impact of the fourteenth week and compares the thirteen weeks from September 24, 2020 through December 23, 2020 to the thirteen weeks from September 26, 2019 through December 25, 2019.
ONGOING URBAN RECOVERY DRIV ING COMPANY IMPROVEMENTS U B U R B A N H O L D I N G S T E A D Y AT 2 0 1 9 L E V E L S
(57%)(43%)
(31%)
48%
(38%)
(16%)(0%)
30%
(49%)(32%)
(17%)
38%
(25%) (27%) (23%) (19%)(18%)
(4%) (1%) 1% (1%) 1%
(15%) (15%) (12%) (11%) (9%)
Second Quarter2020
Third Quarter2020
Fourth Quarter2020
First Quarter2021
Fiscal April2021
Fiscal May2021
Fiscal June2021
Fiscal July2021
Urban SSS%Suburban SSS%
URBAN/SUBURBAN1 SAME-SHACK SALES VS PRIOR YEAR AND 20192
Total SSS%
3
8
Dotted lines represent 2021 SSS % vs 2019
Meeting of the Board of Directors | Q4 20192020 Strategic Plan
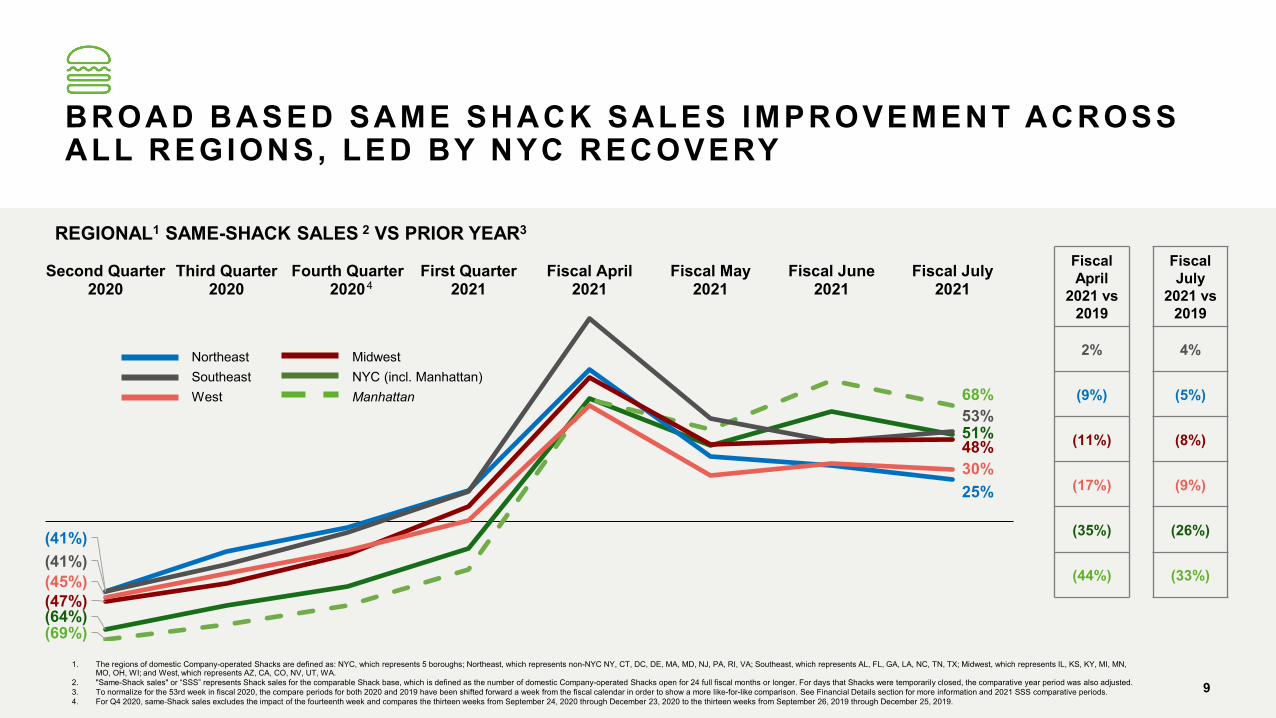
BROAD BASED SAME SHACK SALES IMPROVEMENT ACROSS ALL REGIONS, LED BY NYC RECOVERY
1. The regions of domestic Company-operated Shacks are defined as: NYC, which represents 5 boroughs; Northeast, which represents non-NYC NY, CT, DC, DE, MA, MD, NJ, PA, RI, VA; Southeast, which represents AL, FL, GA, LA, NC, TN, TX; Midwest, which represents IL, KS, KY, MI, MN, MO, OH, WI; and West, which represents AZ, CA, CO, NV, UT, WA.
2. "Same-Shack sales" or “SSS” represents Shack sales for the comparable Shack base, which is defined as the number of domestic Company-operated Shacks open for 24 full fiscal months or longer. For days that Shacks were temporarily closed, the comparative year period was also adjusted. 3. To normalize for the 53rd week in fiscal 2020, the compare periods for both 2020 and 2019 have been shifted forward a week from the fiscal calendar in order to show a more like-for-like comparison. See Financial Details section for more information and 2021 SSS comparative periods.4. For Q4 2020, same-Shack sales excludes the impact of the fourteenth week and compares the thirteen weeks from September 24, 2020 through December 23, 2020 to the thirteen weeks from September 26, 2019 through December 25, 2019.
REGIONAL1 SAME-SHACK SALES 2 VS PRIOR YEAR3
(64%)
51%
(69%)
68%
(41%)
25%
(41%)
53%
(47%)
48%
(45%)
30%
Second Quarter2020
Third Quarter2020
Fourth Quarter2020
First Quarter2021
Fiscal April2021
Fiscal May2021
Fiscal June2021
Fiscal July2021
NortheastSoutheastWest
MidwestNYC (incl. Manhattan)Manhattan
4
9
Fiscal April
2021 vs 2019
Fiscal July
2021 vs 2019
2% 4%
(9%) (5%)
(11%) (8%)
(17%) (9%)
(35%) (26%)
(44%) (33%)
Meeting of the Board of Directors | Q4 20192020 Strategic Plan
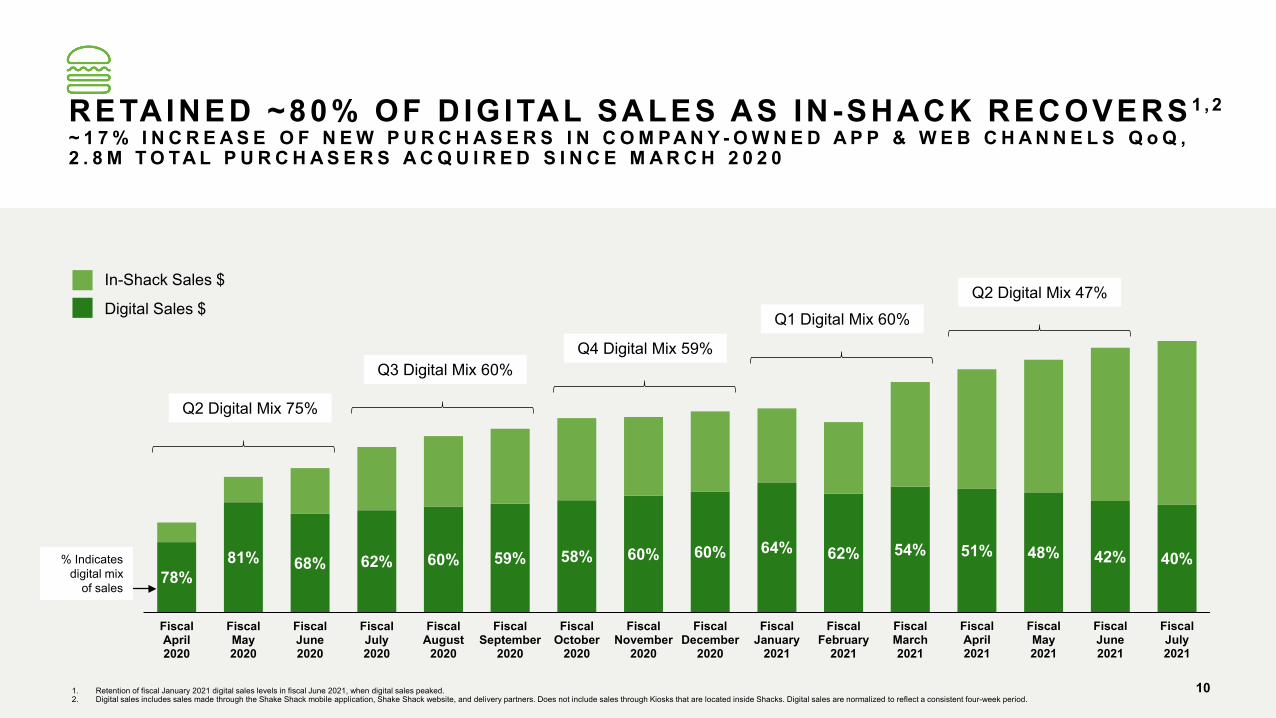
1. Retention of fiscal January 2021 digital sales levels in fiscal June 2021, when digital sales peaked.2. Digital sales includes sales made through the Shake Shack mobile application, Shake Shack website, and delivery partners. Does not include sales through Kiosks that are located inside Shacks. Digital sales are normalized to reflect a consistent four-week period.
RETAINED ~80% OF D IGITAL SALES AS IN -SHACK RECOVERS 1 , 2
~ 1 7 % I N C R E A S E O F N E W P U R C H A S E R S I N C O M PA N Y - O W N E D A P P & W E B C H A N N E L S Q o Q , 2 . 8 M T O TA L P U R C H A S E R S A C Q U I R E D S I N C E M A R C H 2 0 2 0
78%81% 68% 62% 60% 59% 58% 60% 60% 64% 62% 54% 51% 48% 42% 40%
FiscalApril2020
FiscalMay2020
FiscalJune2020
FiscalJuly2020
FiscalAugust
2020
FiscalSeptember
2020
FiscalOctober
2020
FiscalNovember
2020
FiscalDecember
2020
FiscalJanuary
2021
FiscalFebruary
2021
FiscalMarch2021
FiscalApril2021
FiscalMay2021
FiscalJune2021
FiscalJuly2021
% Indicates digital mix
of sales
In-Shack Sales $
Digital Sales $
Q3 Digital Mix 60%Q4 Digital Mix 59%
Q2 Digital Mix 75%
10
Q1 Digital Mix 60%Q2 Digital Mix 47%
Meeting of the Board of Directors | Q4 20192020 Strategic Plan
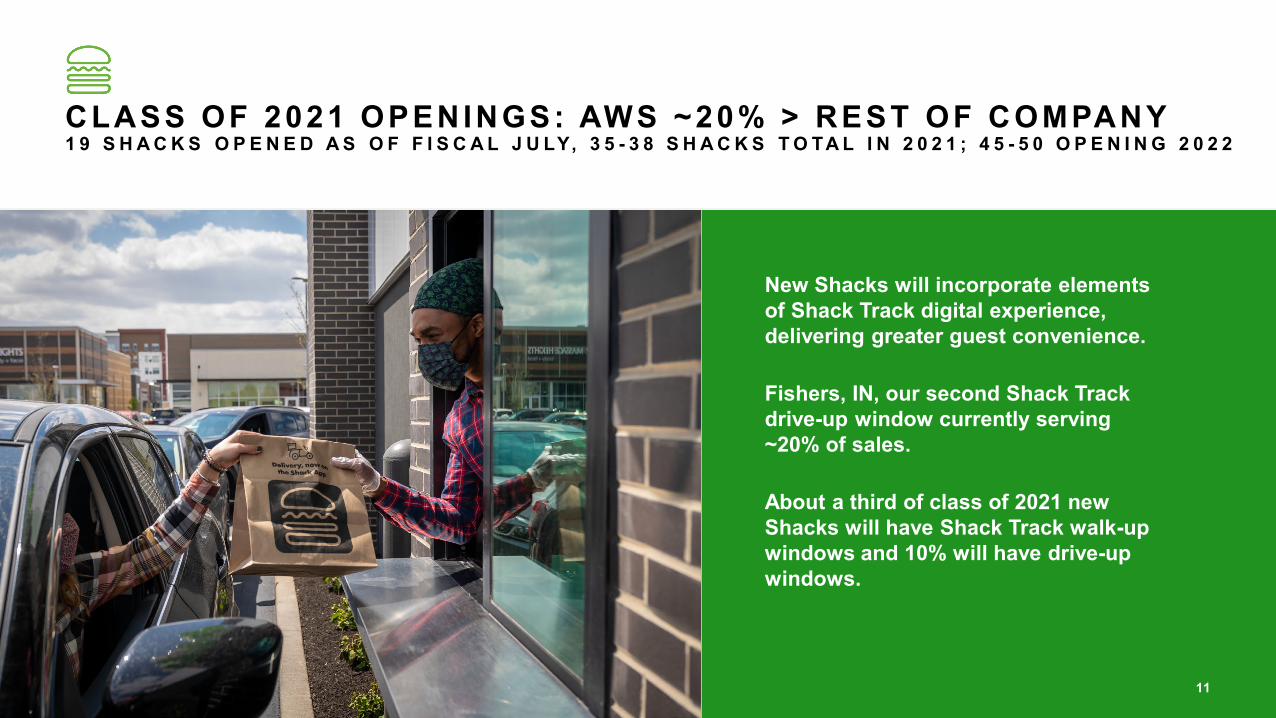
CLASS OF 2021 OPENINGS: AWS ~20% > REST OF COMPANY1 9 S H A C K S O P E N E D A S O F F I S C A L J U LY, 3 5 - 3 8 S H A C K S T O TA L I N 2 0 2 1 ; 4 5 - 5 0 O P E N I N G 2 0 2 2
11
New Shacks will incorporate elements of Shack Track digital experience, delivering greater guest convenience.
Fishers, IN, our second Shack Track drive-up window currently serving ~20% of sales.
About a third of class of 2021 new Shacks will have Shack Track walk-up windows and 10% will have drive-up windows.
Meeting of the Board of Directors | Q4 20192020 Strategic Plan
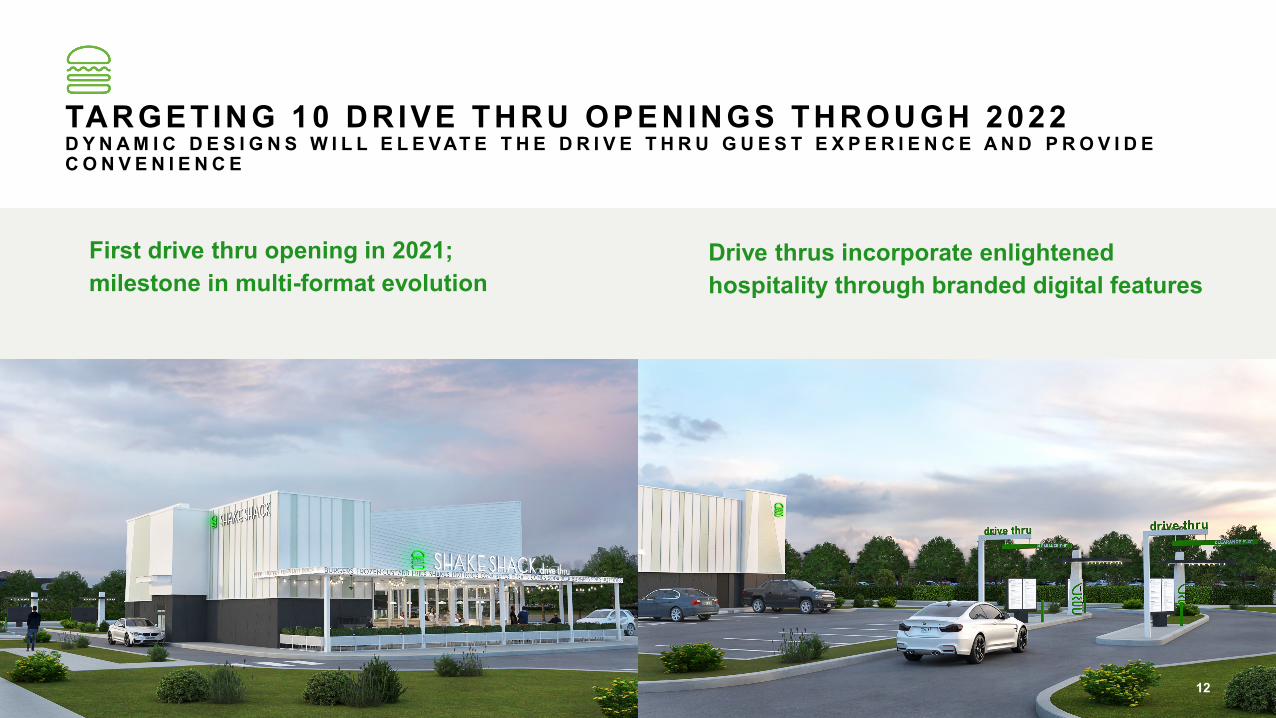
TARGETING 10 DRIVE THRU OPENINGS THROUGH 2022D Y N A M I C D E S I G N S W I L L E L E VAT E T H E D R I V E T H R U G U E S T E X P E R I E N C E A N D P R O V I D E C O N V E N I E N C E
First drive thru opening in 2021; milestone in multi-format evolution
Drive thrus incorporate enlightened hospitality through branded digital features
12
Meeting of the Board of Directors | Q4 20192020 Strategic Plan
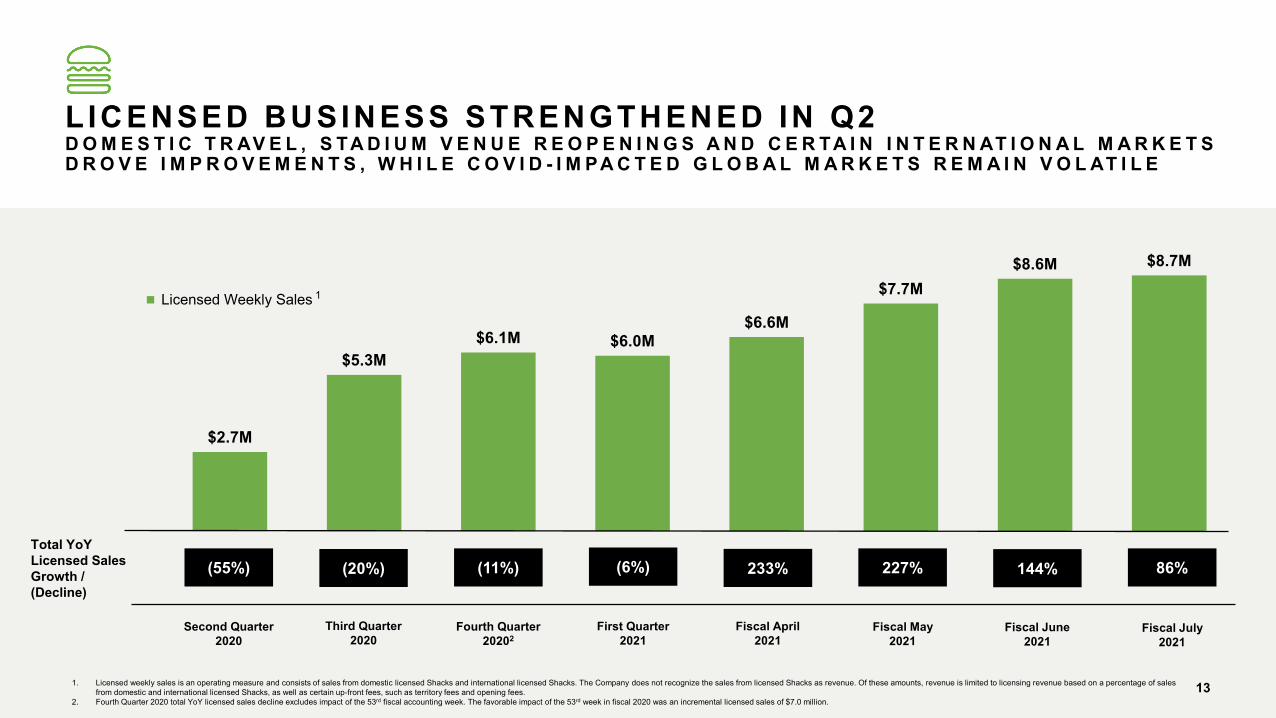
$2.7M
$5.3M$6.1M $6.0M
$6.6M
$7.7M$8.6M $8.7M
Licensed Weekly Sales
1. Licensed weekly sales is an operating measure and consists of sales from domestic licensed Shacks and international licensed Shacks. The Company does not recognize the sales from licensed Shacks as revenue. Of these amounts, revenue is limited to licensing revenue based on a percentage of sales from domestic and international licensed Shacks, as well as certain up-front fees, such as territory fees and opening fees.
2. Fourth Quarter 2020 total YoY licensed sales decline excludes impact of the 53rd fiscal accounting week. The favorable impact of the 53rd week in fiscal 2020 was an incremental licensed sales of $7.0 million. 13
L ICENSED BUSINESS STRENGTHENED IN Q2D O M E S T I C T R AV E L , S TA D I U M V E N U E R E O P E N I N G S A N D C E R TA I N I N T E R N AT I O N A L M A R K E T S D R O V E I M P R O V E M E N T S , W H I L E C O V I D - I M PA C T E D G L O B A L M A R K E T S R E M A I N V O L AT I L E
Fourth Quarter 20202
Second Quarter 2020
Fiscal April2021
Fiscal May2021
Fiscal June2021
Total YoY Licensed Sales Growth / (Decline)
(55%) (20%) (11%) (6%) 233% 227% 144%
Third Quarter 2020
First Quarter2021
Fiscal July2021
86%
1
Meeting of the Board of Directors | Q4 20192020 Strategic Plan
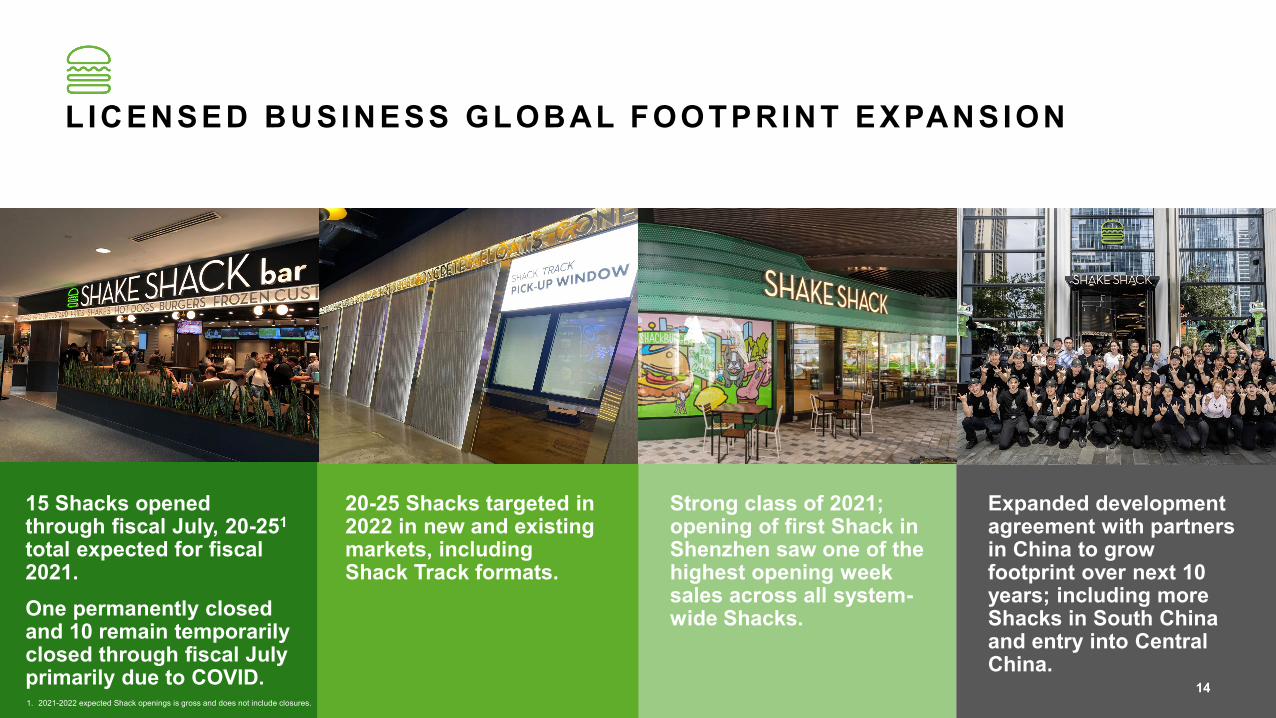
15 Shacks opened through fiscal July, 20-251
total expected for fiscal 2021.One permanently closed and 10 remain temporarily closed through fiscal July primarily due to COVID.
20-25 Shacks targeted in 2022 in new and existing markets, including Shack Track formats.
Strong class of 2021; opening of first Shack in Shenzhen saw one of the highest opening week sales across all system-wide Shacks.
Expanded development agreement with partners in China to grow footprint over next 10 years; including more Shacks in South China and entry into Central China.
L ICENSED BUSINESS GLOBAL FOOTPRINT EXPANSION
141. 2021-2022 expected Shack openings is gross and does not include closures.
Meeting of the Board of Directors | Q4 20192020 Strategic Plan
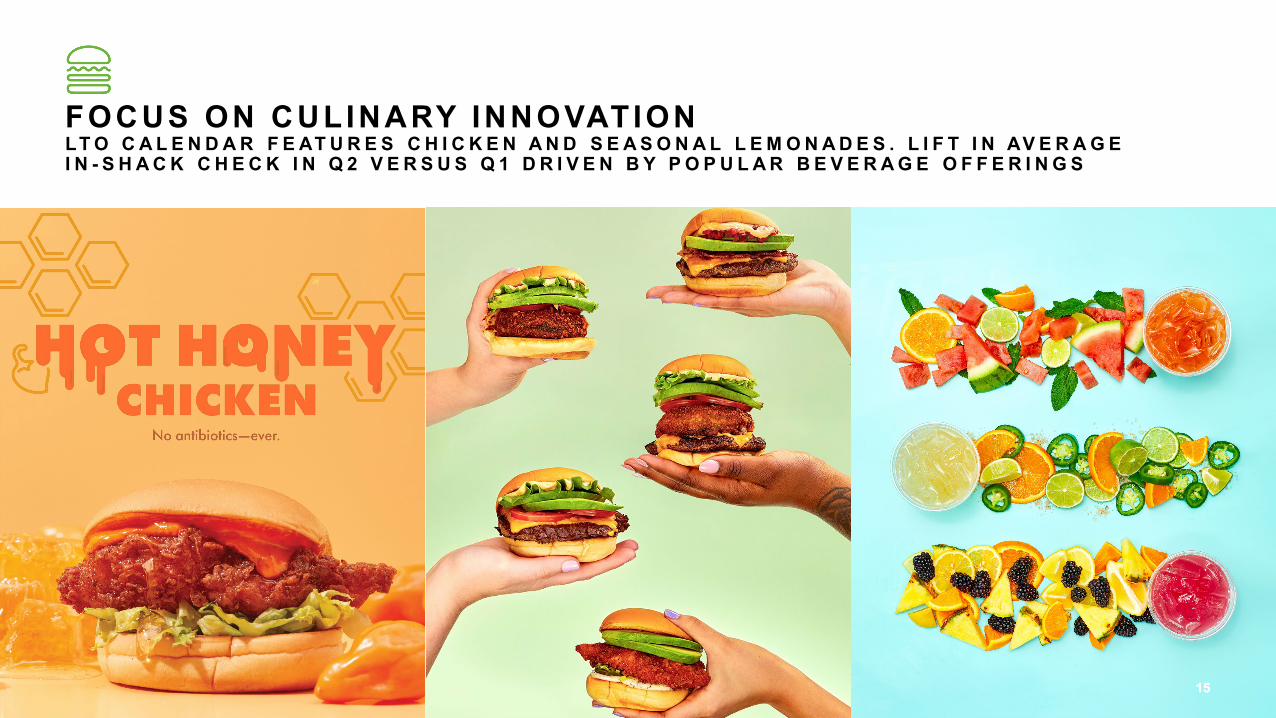
FOCUS ON CULINARY INNOVATIONLT O C A L E N D A R F E AT U R E S C H I C K E N A N D S E A S O N A L L E M O N A D E S . L I F T I N AV E R A G E I N - S H A C K C H E C K I N Q 2 V E R S U S Q 1 D R I V E N B Y P O P U L A R B E V E R A G E O F F E R I N G S
151515
Meeting of the Board of Directors | Q4 20192020 Strategic Plan
2021 OUTLOOK
1. Includes approximately $8M of the approximately $9M total Equity-based compensation.
These forward-looking projections are subject to known and unknown risks, uncertainties and other important factors that may cause actual results to be materially different from these projections. Factors that may cause such differences include those discussed in the Company's Form 10-K for the fiscal year ended December 30, 2020 and our Cautionary Note On Forward-Looking Statements herein.
These forward-looking projections should be reviewed in conjunction with the condensed consolidated financial statements and the section titled “Cautionary Note Regarding Forward-Looking Information” which form the basis of our assumptions used to prepare these forward-looking projections. You should not attribute undue certainty to these projections, and we undertake no obligation to revise or update any forward-looking information, except as required by law.
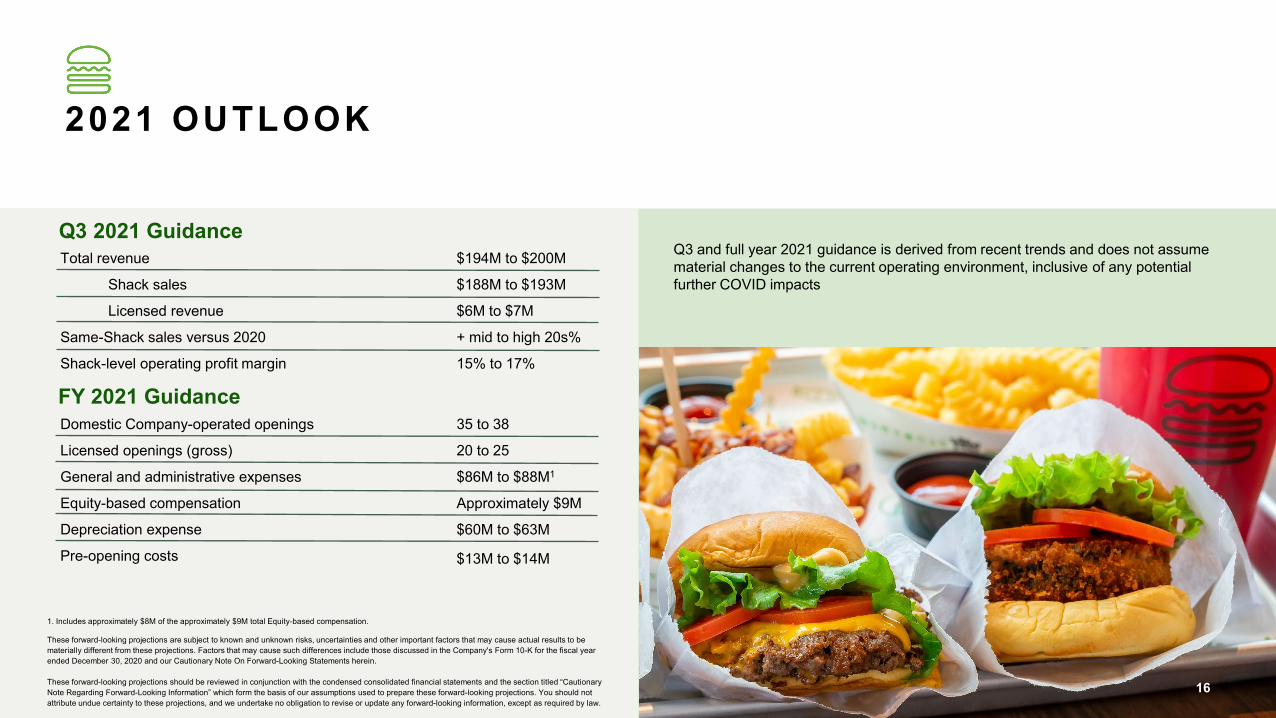
Total revenue
Shack sales
Licensed revenue
Same-Shack sales versus 2020
Shack-level operating profit margin
Domestic Company-operated openings
Licensed openings (gross)
General and administrative expenses
Equity-based compensation
Depreciation expense
Pre-opening costs
$194M to $200M
$188M to $193M
$6M to $7M
+ mid to high 20s%
15% to 17%
35 to 38
20 to 25
$86M to $88M1
Approximately $9M
$60M to $63M
$13M to $14M
Q3 and full year 2021 guidance is derived from recent trends and does not assume material changes to the current operating environment, inclusive of any potential further COVID impacts
Q3 2021 Guidance
FY 2021 Guidance
16
Meeting of the Board of Directors | Q4 20192020 Strategic Plan
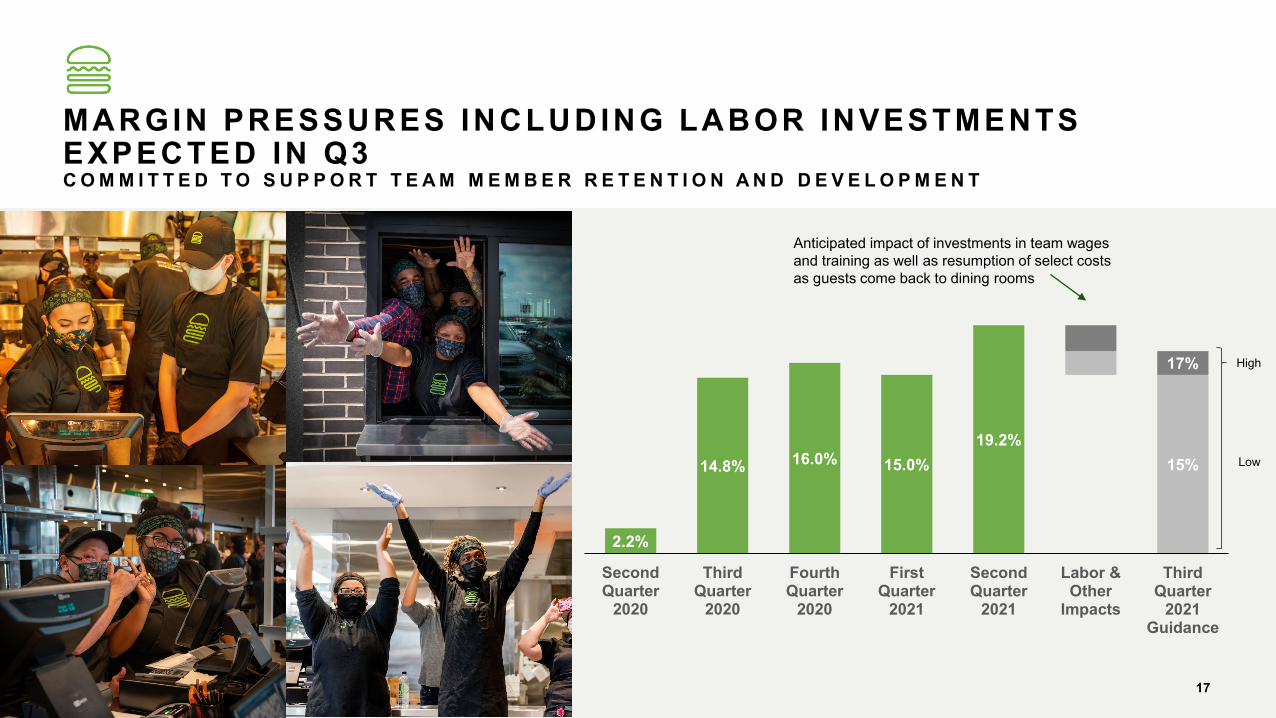
MARGIN PRESSURES INCLUDING LABOR INVESTMENTS EXPECTED IN Q3C O M M I T T E D T O S U P P O R T T E A M M E M B E R R E T E N T I O N A N D D E V E L O P M E N T
17
2.2%
14.8% 16.0% 15.0%19.2%
15%
17%
SecondQuarter
2020
ThirdQuarter
2020
FourthQuarter
2020
FirstQuarter
2021
SecondQuarter
2021
Labor &Other
Impacts
ThirdQuarter
2021Guidance
High
Low
Anticipated impact of investments in team wages and training as well as resumption of select costs as guests come back to dining rooms

Meeting of the Board of Directors | Q4 20192020 Strategic Plan
Board of Directors Meeting| Q1 2020
FINANCIALDETAILS
Meeting of the Board of Directors | Q4 20192020 Strategic Plan
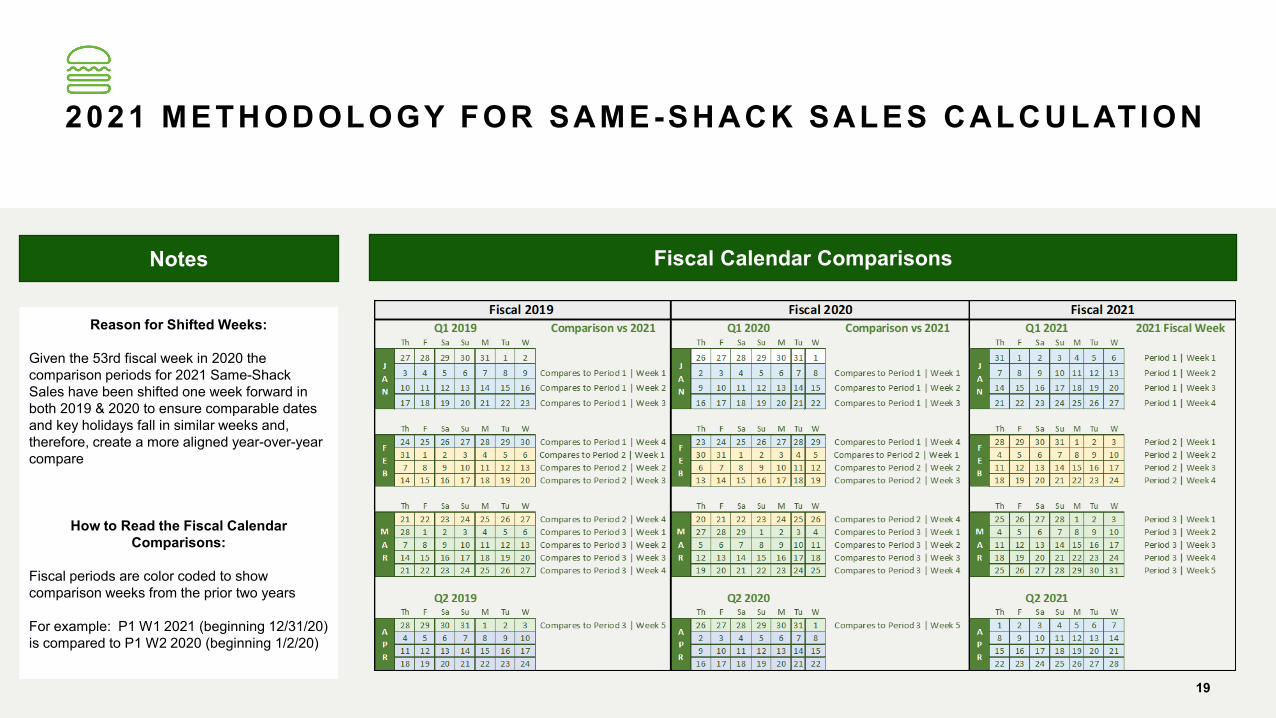
2021 METHODOLOGY FOR SAME-SHACK SALES CALCULATION
19
Notes Fiscal Calendar Comparisons
Reason for Shifted Weeks:
Given the 53rd fiscal week in 2020 the comparison periods for 2021 Same-Shack Sales have been shifted one week forward in both 2019 & 2020 to ensure comparable dates and key holidays fall in similar weeks and, therefore, create a more aligned year-over-year compare
How to Read the Fiscal Calendar Comparisons:
Fiscal periods are color coded to show comparison weeks from the prior two years
For example: P1 W1 2021 (beginning 12/31/20) is compared to P1 W2 2020 (beginning 1/2/20)
Meeting of the Board of Directors | Q4 20192020 Strategic Plan
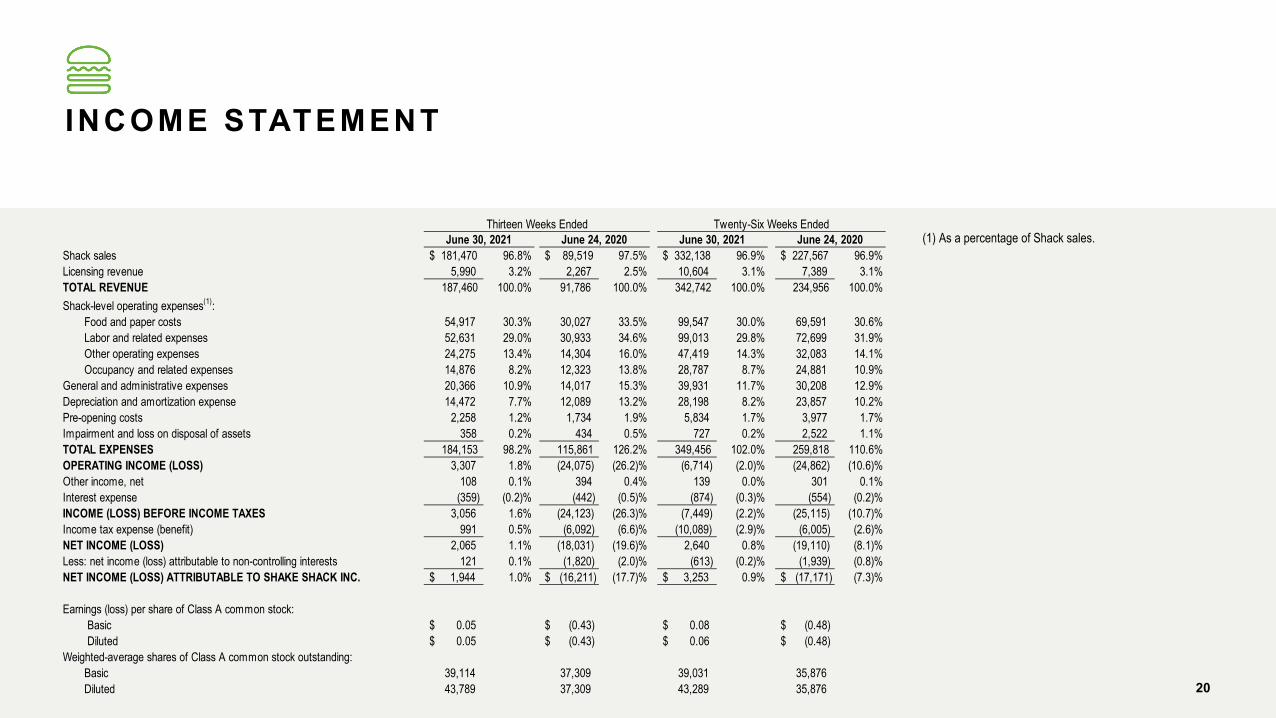
INCOME STATEMENT
20
(1) As a percentage of Shack sales.Shack sales $ 181,470 96.8% $ 89,519 97.5% $ 332,138 96.9% $ 227,567 96.9%Licensing revenue 5,990 3.2% 2,267 2.5% 10,604 3.1% 7,389 3.1%TOTAL REVENUE 187,460 100.0% 91,786 100.0% 342,742 100.0% 234,956 100.0%Shack-level operating expenses(1):
Food and paper costs 54,917 30.3% 30,027 33.5% 99,547 30.0% 69,591 30.6%Labor and related expenses 52,631 29.0% 30,933 34.6% 99,013 29.8% 72,699 31.9%Other operating expenses 24,275 13.4% 14,304 16.0% 47,419 14.3% 32,083 14.1%Occupancy and related expenses 14,876 8.2% 12,323 13.8% 28,787 8.7% 24,881 10.9%
General and administrative expenses 20,366 10.9% 14,017 15.3% 39,931 11.7% 30,208 12.9%Depreciation and amortization expense 14,472 7.7% 12,089 13.2% 28,198 8.2% 23,857 10.2%Pre-opening costs 2,258 1.2% 1,734 1.9% 5,834 1.7% 3,977 1.7%Impairment and loss on disposal of assets 358 0.2% 434 0.5% 727 0.2% 2,522 1.1%TOTAL EXPENSES 184,153 98.2% 115,861 126.2% 349,456 102.0% 259,818 110.6%OPERATING INCOME (LOSS) 3,307 1.8% (24,075) (26.2)% (6,714) (2.0)% (24,862) (10.6)%Other income, net 108 0.1% 394 0.4% 139 0.0% 301 0.1%Interest expense (359) (0.2)% (442) (0.5)% (874) (0.3)% (554) (0.2)%INCOME (LOSS) BEFORE INCOME TAXES 3,056 1.6% (24,123) (26.3)% (7,449) (2.2)% (25,115) (10.7)%Income tax expense (benefit) 991 0.5% (6,092) (6.6)% (10,089) (2.9)% (6,005) (2.6)%NET INCOME (LOSS) 2,065 1.1% (18,031) (19.6)% 2,640 0.8% (19,110) (8.1)%Less: net income (loss) attributable to non-controlling interests 121 0.1% (1,820) (2.0)% (613) (0.2)% (1,939) (0.8)%NET INCOME (LOSS) ATTRIBUTABLE TO SHAKE SHACK INC. $ 1,944 1.0% $ (16,211) (17.7)% $ 3,253 0.9% $ (17,171) (7.3)%
Earnings (loss) per share of Class A common stock:Basic $ 0.05 $ (0.43) $ 0.08 $ (0.48)Diluted $ 0.05 $ (0.43) $ 0.06 $ (0.48)
Weighted-average shares of Class A common stock outstanding:Basic 39,114 37,309 39,031 35,876 Diluted 43,789 37,309 43,289 35,876
Thirteen Weeks EndedJune 30, 2021 June 24, 2020
Twenty-Six Weeks EndedJune 30, 2021 June 24, 2020
Meeting of the Board of Directors | Q4 20192020 Strategic Plan
Shack-Level Operating ProfitShack-level operating profit is defined as Shack sales less Shack-level operating expenses, including Food and paper costs, Labor and related expenses, Otheroperating expenses and Occupancy and related expenses.
"Shack-level operating profit margin," a non-GAAP measure, is defined as Shack sales less Shack-level operating expenses, including food and paper costs, labor and related expenses, other operating expenses and occupancy and related expenses as a percentage of Shack sales.
How This Measure Is UsefulWhen used in conjunction with GAAP financial measures, Shack-level operating profit and Shack-level operating profit margin are supplemental measures of operating performance that the Company believes are useful measures to evaluate the performance and profitability of its Shacks. Additionally, Shack-level operating profit and Shack-level operating profit margin are key metrics used internally by management to develop internal budgets and forecasts, as well as assess the performance of its Shacks relative to budget and against prior periods. It is also used to evaluate employee compensation as it serves as a metric in certain performance-based employee bonus arrangements. The Company believes presentation of Shack-level operating profit and Shack-level operating profit margin provides investors with a supplemental view of its operating performance that can provide meaningful insights to the underlying operating performance of the Shacks, as these measures depict the
operating results that are directly impacted by the Shacks and exclude items that may not be indicative of, or are unrelated to, the ongoing operations of the Shacks. It may also assist investors to evaluate the Company's performance relative to peers of various sizes and maturities and provides greater transparency with respect to how management evaluates the business, as well as the financial and operational decision-making.
Limitations of the Usefulness of this MeasureShack-level operating profit and Shack-level operating profit margin may differ from similarly titled measures used by other companies due to different methods of calculation. Presentation of Shack-level operating profit and Shack-level operating profit margin is not intended to be considered in isolation or as a substitute for, or superior to, the financial information prepared and presented in accordance with GAAP. Shack-level operating profit excludes certain costs, such as General and administrative expenses and Pre-opening costs, which are considered normal, recurring cash operating expenses and are essential to support the operation and development of the Company's Shacks. Therefore, this measure may not provide a complete understanding of the Company's operating results as a whole and Shack-level operating profit and Shack-level operating profit margin should be reviewed in conjunction with the Company’s GAAP financial results. A reconciliation of Shack-level operating profit to operating income, the most directly comparable GAAP financial measure, is set forth on next slide.
SHACK-LEVEL OPERATING PROFIT DEFIN IT IONS
21
Meeting of the Board of Directors | Q4 20192020 Strategic Plan
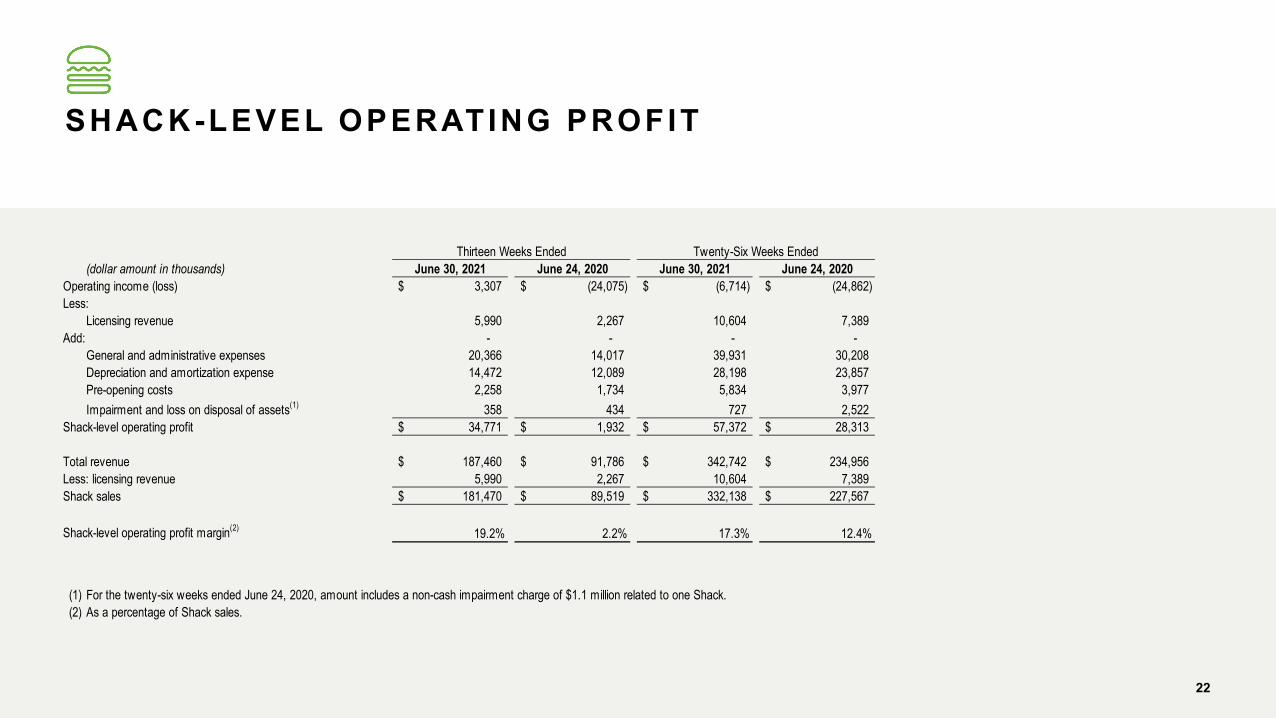
(dollar amount in thousands) June 30, 2021 June 24, 2020 June 30, 2021 June 24, 2020Operating income (loss) 3,307$ (24,075)$ (6,714)$ (24,862)$ Less:
Licensing revenue 5,990 2,267 10,604 7,389 Add: - - - -
General and administrative expenses 20,366 14,017 39,931 30,208 Depreciation and amortization expense 14,472 12,089 28,198 23,857 Pre-opening costs 2,258 1,734 5,834 3,977 Impairment and loss on disposal of assets(1) 358 434 727 2,522
Shack-level operating profit 34,771$ 1,932$ 57,372$ 28,313$
Total revenue 187,460$ 91,786$ 342,742$ 234,956$ Less: licensing revenue 5,990 2,267 10,604 7,389 Shack sales 181,470$ 89,519$ 332,138$ 227,567$
Shack-level operating profit margin(2) 19.2% 2.2% 17.3% 12.4%
Thirteen Weeks Ended Twenty-Six Weeks Ended
SHACK-LEVEL OPERATING PROFIT
22
(1) For the twenty-six weeks ended June 24, 2020, amount includes a non-cash impairment charge of $1.1 million related to one Shack.(2) As a percentage of Shack sales.
Meeting of the Board of Directors | Q4 20192020 Strategic Plan
EBITDA and Adjusted EBITDAEBITDA is defined as Net income (loss) before interest expense (net of interest income), Income tax expense (benefit) and Depreciation and amortization expense. Adjusted EBITDA is defined as EBITDA (as defined above) excluding equity-based compensation expense, deferred lease cost, Impairment and loss on disposal of assets, amortization of cloud-based software implementation costs, as well as certain non-recurring items that the Company does not believe directly reflect its core operations and may not be indicative of the Company's recurring business operations.
“Adjusted EBITDA margin,” a non-GAAP measure, is defined as net income (loss) before interest expense (net of interest income), taxes, depreciation and amortization, which also excludes equity-based compensation expense, deferred lease costs, impairment and loss on disposal of assets, amortization of cloud-based software implementation assets, as well as certain non-recurring and other items that the Company does not believe directly reflect its core operations, as a percentage of revenue.
ADJUSTED EBITDA DEFIN IT IONS
How These Measures Are UsefulWhen used in conjunction with GAAP financial measures, EBITDA and adjusted EBITDA are supplemental measures of operating performance that the Company believes are useful measures to facilitate comparisons to historical performance and competitors' operating results. Adjusted EBITDA is a key metric used internally by management to develop internal budgets and forecasts and also serves as a metric in its performance-based equity incentive programs and certain bonus arrangements. The Company believes presentation of EBITDA and adjusted EBITDA provides investors with a supplemental view of the Company's operating performance that facilitates analysis and comparisons of its ongoing business operations because they exclude items that may not be indicative of the Company's ongoing operating performance.
Limitations of the Usefulness of These MeasuresEBITDA and adjusted EBITDA may differ from similarly titled measures used by other companies due to different methods of calculation. Presentation of EBITDA and adjusted EBITDA is not intended to be considered in isolation or as a substitute for, or superior to, the financial information prepared and presented in accordance with GAAP. EBITDA and adjusted EBITDA exclude certain normal recurring expenses. Therefore, these measures may not provide a complete understanding of the Company's performance and should be reviewed in conjunction with the GAAP financial measures. A reconciliation of EBITDA and adjusted EBITDA to net income, the most directly comparable GAAP measure, is set forth on next slide.
23
Meeting of the Board of Directors | Q4 20192020 Strategic Plan
(1)
(2)
(3)
(4)
(5)(6)
(7)
(8)
(9)
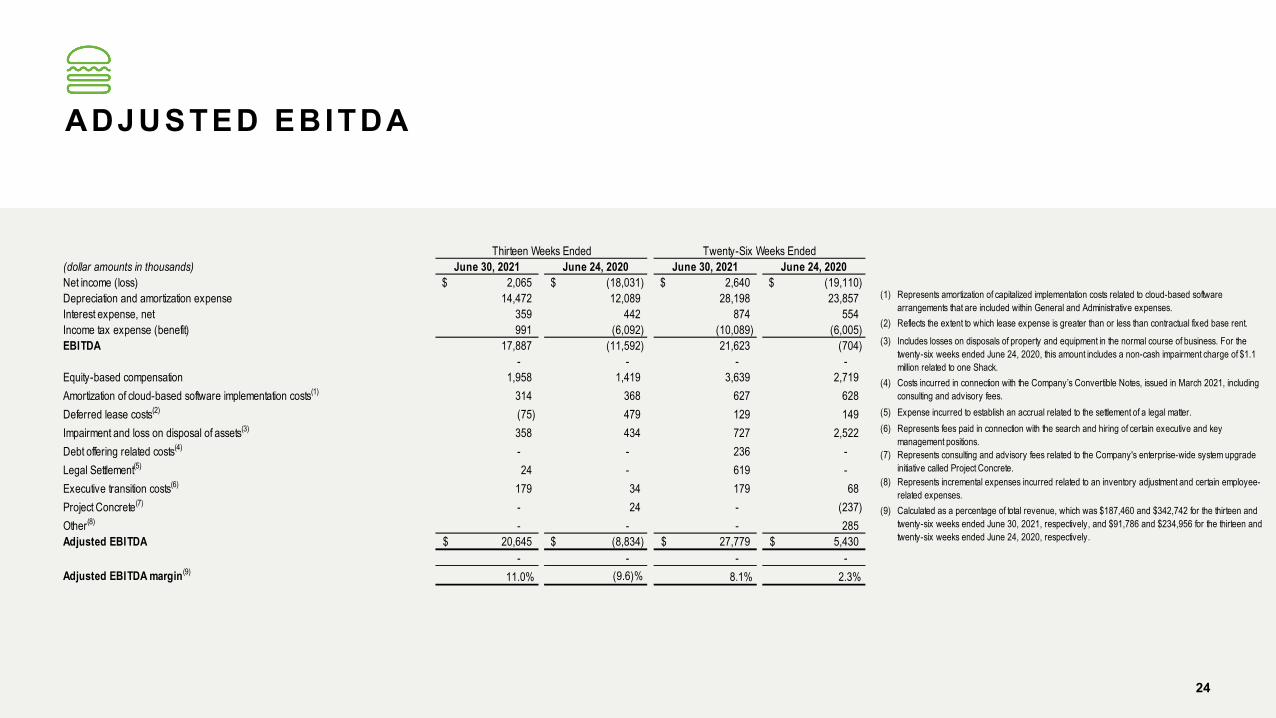
Represents fees paid in connection with the search and hiring of certain executive and key management positions.Represents consulting and advisory fees related to the Company's enterprise-wide system upgrade initiative called Project Concrete.Represents incremental expenses incurred related to an inventory adjustment and certain employee-related expenses.Calculated as a percentage of total revenue, which was $187,460 and $342,742 for the thirteen and twenty-six weeks ended June 30, 2021, respectively, and $91,786 and $234,956 for the thirteen and twenty-six weeks ended June 24, 2020, respectively.
Represents amortization of capitalized implementation costs related to cloud-based software arrangements that are included within General and Administrative expenses.Reflects the extent to which lease expense is greater than or less than contractual fixed base rent.
Includes losses on disposals of property and equipment in the normal course of business. For the twenty-six weeks ended June 24, 2020, this amount includes a non-cash impairment charge of $1.1 million related to one Shack.Costs incurred in connection with the Company’s Convertible Notes, issued in March 2021, including consulting and advisory fees.Expense incurred to establish an accrual related to the settlement of a legal matter.
(dollar amounts in thousands) June 30, 2021 June 24, 2020 June 30, 2021 June 24, 2020Net income (loss) 2,065$ (18,031)$ 2,640$ (19,110)$ Depreciation and amortization expense 14,472 12,089 28,198 23,857 Interest expense, net 359 442 874 554 Income tax expense (benefit) 991 (6,092) (10,089) (6,005) EBITDA 17,887 (11,592) 21,623 (704)
- - - - Equity-based compensation 1,958 1,419 3,639 2,719 Amortization of cloud-based software implementation costs(1) 314 368 627 628 Deferred lease costs(2) (75) 479 129 149 Impairment and loss on disposal of assets(3) 358 434 727 2,522 Debt offering related costs(4) - - 236 - Legal Settlement(5) 24 - 619 - Executive transition costs(6) 179 34 179 68 Project Concrete(7) - 24 - (237) Other(8) - - - 285 Adjusted EBITDA 20,645$ (8,834)$ 27,779$ 5,430$
- - - - Adjusted EBITDA margin(9) 11.0% (9.6)% 8.1% 2.3%
Twenty-Six Weeks EndedThirteen Weeks Ended
24
ADJUSTED EBITDA
Meeting of the Board of Directors | Q4 20192020 Strategic Plan
Adjusted Pro Forma Effective Tax RateAdjusted pro forma effective tax rate represents the effective tax rate assuming the full exchange of all outstanding SSE Holdings, LLC membership interests ("LLC Interests") for shares of Class A common stock, adjusted for certain non-recurring items that the Company does not believe are directly related to its core operations and may not be indicative of its recurring business operations.
How This Measure Is UsefulWhen used in conjunction with GAAP financial measures, adjusted pro forma effective tax rate is a supplemental measure of operating performance that the Company believes is useful to evaluate its performance period over period and relative to its competitors. By assuming the full exchange of all outstanding LLC Interests, the Company believes this measure facilitates comparisons with other companies that have different organizational and tax structures, as well as comparisons period over period because it eliminates the effect of any changes in effective tax rate driven by increases in its ownership of SSE Holdings, which are unrelated to the Company's operating performance, and excludes items that are non-recurring or may not be indicative of ongoing operating performance.
ADJUSTED PRO FORMA EFFECTIVE TAX RATE DEFIN IT IONS
Limitations of the Usefulness of this MeasureAdjusted pro forma effective tax rate may differ from similarly titled measures used by other companies due to different methods of calculation. Presentation of adjusted pro forma effective tax rate should not be considered an alternative to effective tax rate, as determined under GAAP. While this measure is useful in evaluating the Company's performance, it does not account for the effective tax rate attributable to the non-controlling interest holders and therefore does not provide a complete understanding of effective tax rate. Adjusted pro forma effective tax rate should be evaluated in conjunction with GAAP financial results. A reconciliation of adjusted pro forma effective tax rate, the most directly comparable GAAP measure, is set forth on next slide.
25
Meeting of the Board of Directors | Q4 20192020 Strategic Plan
2021 ADJUSTED PRO FORMA EFFECTIVE TAX RATE
26
(dollar amounts in thousands)
Income Tax Expense (Benefit)
Income (Loss) Before Income
TaxesEffective Tax
RateIncome Tax
ExpenseIncome Before Income Taxes
Effective Tax Rate
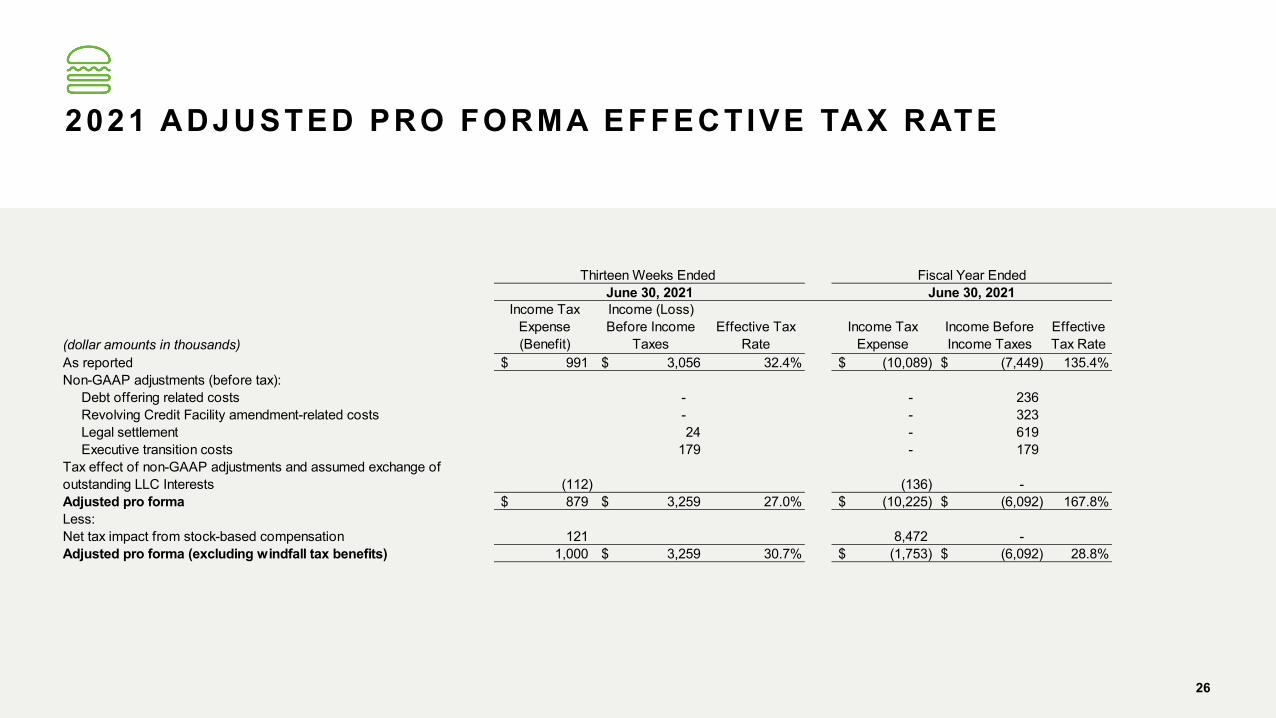
As reported 991$ 3,056$ 32.4% (10,089)$ (7,449)$ 135.4%Non-GAAP adjustments (before tax):
Debt offering related costs - - 236 Revolving Credit Facility amendment-related costs - - 323 Legal settlement 24 - 619 Executive transition costs 179 - 179
Tax effect of non-GAAP adjustments and assumed exchange of outstanding LLC Interests (112) (136) - Adjusted pro forma 879$ 3,259$ 27.0% (10,225)$ (6,092)$ 167.8%Less:Net tax impact from stock-based compensation 121 8,472 - Adjusted pro forma (excluding windfall tax benefits) 1,000 3,259$ 30.7% (1,753)$ (6,092)$ 28.8%
Thirteen Weeks Ended Fiscal Year EndedJune 30, 2021 June 30, 2021
Meeting of the Board of Directors | Q4 20192020 Strategic Plan
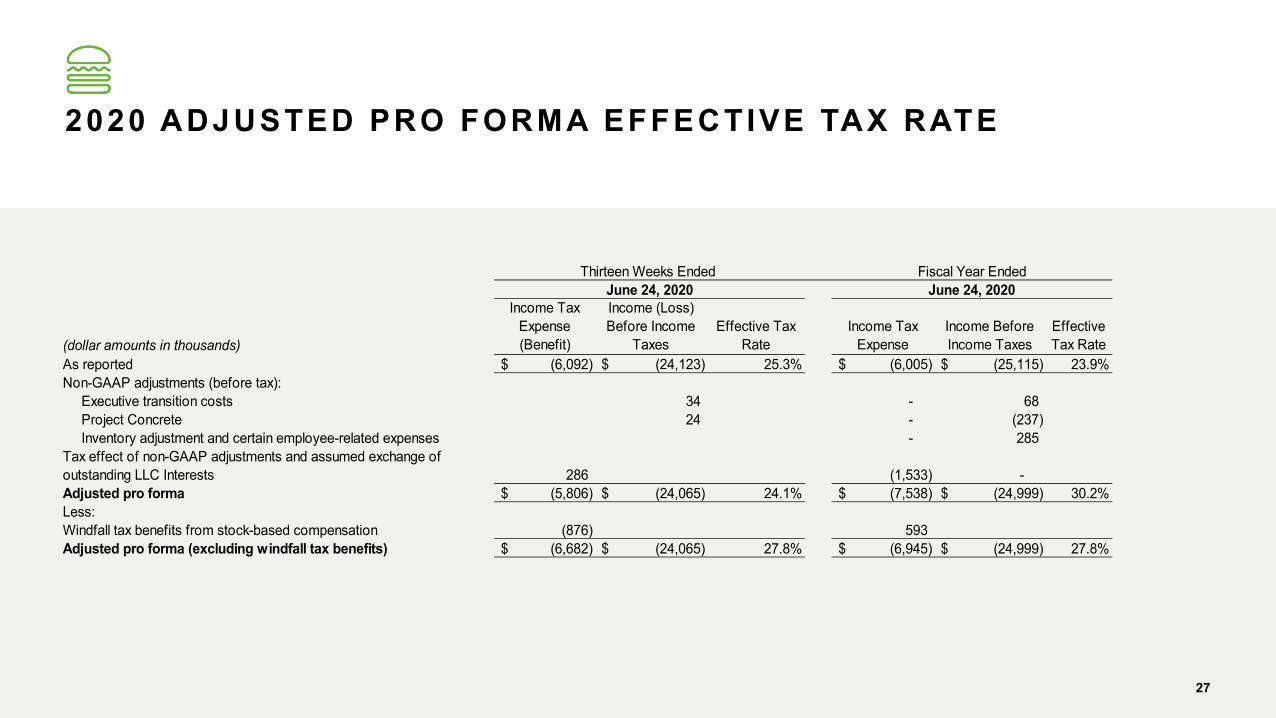
2020 ADJUSTED PRO FORMA EFFECTIVE TAX RATE
27
(dollar amounts in thousands)
Income Tax Expense (Benefit)
Income (Loss) Before Income
TaxesEffective Tax
RateIncome Tax
ExpenseIncome Before Income Taxes
Effective Tax Rate
As reported (6,092)$ (24,123)$ 25.3% (6,005)$ (25,115)$ 23.9%Non-GAAP adjustments (before tax):
Executive transition costs 34 - 68 Project Concrete 24 - (237) Inventory adjustment and certain employee-related expenses - 285
Tax effect of non-GAAP adjustments and assumed exchange of outstanding LLC Interests 286 (1,533) - Adjusted pro forma (5,806)$ (24,065)$ 24.1% (7,538)$ (24,999)$ 30.2%Less:Windfall tax benefits from stock-based compensation (876) 593 Adjusted pro forma (excluding windfall tax benefits) (6,682)$ (24,065)$ 27.8% (6,945)$ (24,999)$ 27.8%
Thirteen Weeks Ended Fiscal Year EndedJune 24, 2020 June 24, 2020
Meeting of the Board of Directors | Q4 20192020 Strategic Plan
CONTACT INFORMATION
INVESTOR CONTACT
Melissa Calandruccio, ICRMichelle Michalski, ICR(844) Shack-04 (844-742-2504)[email protected]
MEDIA CONTACT
Kristyn Clark, Shake [email protected]