Embed Size (px)
Citation preview

SECOND QUARTER BRIEF REPORT OF FINANCIAL RESULTS 〔 under Japanese GAAP〕 ( Consolidated)
(Year ending March 31 , 2017) November 2, 2016
Registered Company Name: MINEBEA CO., LTD. Common Stock Listings: Tokyo and Nagoya Code No: 6479 URL: http://www.minebea.co.jp/ Representative: Yoshihisa Kainuma Representative Director, President and Chief Executive Officer Contact: Satoshi Yoneda Executive Officer, General Manager of Accounting Department Quarterly report filing date: November 11, 2016 Phone: (03) 6758-6711 Expected date of payment for dividends: December 5, 2016 Preparation of supplementary explanation material for quarterly financial results : Yes Holding of presentation meeting for quarterly financial results : Yes( For Analyst)
(Amounts less than one million yen have been omitted.) 1. Business performance (April 1, 2016 through September 30, 2016)(1) Consolidated Results of Operations (Year-to-date) (%: Changes from corresponding period of previous fiscal year)
Net sales (millions of yen)
% Change
Operating income (millions of yen)
% Change
Ordinary income (millions of yen)
% Change
Six months ended Sep 30, 2016 275,133 (6.9) 18,594 (32.2) 18,915 (18.9) Six months ended Sep 30, 2015 295,554 36.5 27,417 10.7 23,326 (5.3)
Net income attributable to owners of the parent
(millions of yen) %
Change Net income per share
(yen) Diluted net income
per share (yen)
Six months ended Sep 30, 2016 12,745 (28.2) 34.01 33.26 Six months ended Sep 30, 2015 17,758 (0.3) 47.49 45.09
(Notes) Comprehensive Income: Six months ended September 30, 2016: (14,181) million yen ― % Six months ended September 30, 2015: 5,018 million yen (84.5) %
(2) Consolidated Financial PositionTotal assets
(millions of yen) Net assets
(millions of yen) Equity ratio
(%) Net assets per share
(yen) As of September 30, 2016 499,966 220,426 42.9 571.70
As of March 31, 2016 459,427 237,973 50.2 616.43 (Reference) Shareholders’ equity: As of September 30, 2016: 214,384 million yen
As of March 31, 2016: 230,785 million yen
2. DividendsAnnual dividends
End of first quarter
(yen)
End of second quarter
(yen)
End of third quarter
(yen)
Year-end (yen)
For the year (yen)
Year ended March 31, 2016 ― 10.00 ― 10.00 20.00 Year ended March 31, 2017 ― 7.00 Year ended March 31, 2017
(Forecast) ― 7.00 14.00
(Notes) Changes from the latest dividend forecast: Yes
- 1 -

3. Prospect for consolidated forecast for the fiscal year (April 1, 2016 through March 31, 2017) (%: Changes from corresponding period of previous fiscal year) Net sales
(millions of yen) %
Change Operating income (millions of yen)
% Change
Ordinary income (millions of yen)
% Change
Year ended March 31, 2017 560,000 (8.2) 45,000 (12.5) 44,000 (5.7)
Net income attributable to
owners of the parent (millions of yen)
% Change
Net income per share (yen)
Year ended March 31, 2017 26,500 (27.2) 70.69 (Notes) Changes from the latest consolidated results forecast: Yes * Notes (1) Changes in significant subsidiaries during the quarter (Changes in certain subsidiaries resulting in change in the scope of
consolidation): None
(2) Application of accounting peculiar to preparation of quarterly consolidated financial statements: None
(3) Changes in accounting policy, changes in accounting estimates, and restatements 1. Changes in accounting policy associated with revision of accounting standards, etc: None 2. Change in accounting policy other than 1: Yes 3. Changes in accounting estimates: Yes 4. Restatements: None (Notes) Changes subject to Article 10 (5) of the Ordinance on Terminology, Forms and Preparation Methods of Quarterly
Consolidated Financial Statements. For details, please refer to “(2) Changes in accounting policy, changes in accounting estimates, and restatements” under “2. Other summary information” on page 6.
(4) Number of shares outstanding (Common stock)
1. Number of shares outstanding at end of period (Including treasury stock) As of September 30, 2016: 399,167,695 shares As of March 31, 2016: 399,167,695 shares
2. Number of treasury shares at end of period As of September 30, 2016: 24,175,888 shares As of March 31, 2016: 24,775,093 shares
3. Average number of shares (Quarterly cumulative period) Six months ended September 30, 2016: 374,718,371 shares Six months ended September 30, 2015: 373,969,057 shares
* Explanation for implementation of the quarterly review presentations
When disclosing this Quarter Brief Report of Financial Results, the review procedures for quarterly financial statements under the Financial Instruments and Exchange Law have not been brought to completion.
* Explanation for appropriate use of financial forecasts and other special remarks (Caution Concerning Forward-Looking Statements)
The aforementioned forecasts are based on the information available as of the date when this information is disclosed as well as on the assumptions as of the disclosing date of this information related to unpredictable parameters that will most likely affect our future business performance. As such, this is not intended for the Company to give assurance that the said forecast number would be achieved. In other words, our actual performances are likely to differ greatly from these estimates depending on a variety of factors that will take shape from now on. As for the assumptions used for these forecasts and other related items, please refer to (“1. Qualitative information related to the financial results for this quarter,” “(3) Explanation of Consolidated Forecast and Other Forecasts”) on page 5 of the documents attached hereunder.
(Investor Briefing Materials for Analysts) Investor briefing materials will be made available via the Minebea corporate website (http://www.minebea.co.jp/) on
Wednesday, November 2, 2016.
- 2 -

Index
1. Qualitative information related to the financial results for the quarter ............................................. 4 (1) Explanation of Operating Results ................................................................................................. 4 (2) Explanation of Financial Position.................................................................................................. 4 (3) Explanation of Consolidated Forecast and Other Forecasts .......................................................... 5
2. Other summary information .............................................................................................................. 6 (1) Summary of changes to major subsidiaries during the quarter ..................................................... 6 (2) Changes in accounting policy, changes in accounting estimates, and restatements ...................... 6 (3) Additional Information .................................................................................................................. 6
3. Quarterly Consolidated Financial Statements ................................................................................... 7
(1) Quarterly Consolidated Balance Sheets ........................................................................................ 7 (2) Quarterly Consolidated Statements of Income and Quarterly Consolidated Statements of
Comprehensive Income .............................................................................................................. 9 (Quarterly Consolidated Statements of Income)
(Six months ended September 30, 2016) ...................................................................................... 9 (Quarterly Consolidated Statements of Comprehensive Income)
(Six months ended September 30, 2016) ...................................................................................... 10 (3) Quarterly Consolidated Statements of Cash Flows ....................................................................... 11 (4) Notes on Quarterly Consolidated Financial Statements................................................................ 13 (Notes on Going Concern Assumptions) ....................................................................................... 13 (Notes for Significant Change in the Amount of Net Assets) ....................................................... 13 (Segment Information etc.) .......................................................................................................... 13 4. Supplementary information ............................................................................................................... 15
Supplementary Financial Data for the Second Quarter of Fiscal Year ending March 31, 2017 ...... 15
- 3 -

1. Qualitative information related to the financial results for this quarter (1) Explanation of Operating Results
During the first half of the fiscal year (April 1, 2016 to September 30, 2016) the Japanese economy saw the drop in consumer spending bottom out. On the down side, both manufacturing and exports remained flat as corporations continued to take a cautious approach to making capital investments. In the U.S. growing consumer spending fueled modest economic growth although the manufacturing sector lost steam. The European economy remained on a moderate upward trajectory mainly in the household sector as employment and income opportunities increased despite declining exports to non-EU countries due to production cutbacks in the German steel industry. In Asia, although in China, dark clouds loomed over the horizon as private corporations put the brakes on investing and cut back on labor.
Under such economic circumstances, the Minebea Group has been focusing on thoroughgoing cost cutting, development of high-value-added products and new technologies, and sales expansion initiatives aiming at boosting profitability further.
As a result, net sales decreased by 20,421 million yen (-6.9%) year on year to hit 275,133 million yen. Operating income fell 8,823 million yen (-32.2%) year on year to total 18,594 million yen, and ordinary income was down 4,411 million yen (-18.9%) year on year at 18,915 million yen. Net income attributable to owners of the parent decreased 5,013 million yen (-28.2%) year on year to total 12,745 million yen. Such decreases are due to the accrual of 1,302 million yen of income taxes for prior periods, as a result of the court ruling on the petition filed by our Thai subsidiary against the local tax authorities.
Performance by segment was as follows:
Products in our Machined components business segment include our anchor product line, ball bearings, in addition to mechanical components such as rod-end bearings used primarily in aircraft and hard disk drive (HDD) pivot assemblies, etc. as well as fasteners for automobiles and aircraft. Growing demand in all major markets kept ball bearing sales volumes up. Sales were particularly robust in the automobile market where demand for energy-efficient models equipped with safety devices soared. The pivot assembly sales volume remained flat year on year despite the adverse effect of the shrinking HDD market. While sales of rod-end bearings used in aircraft were also steady mainly in Europe, revenue declined year on year due to the effects of currency fluctuations as well as other factors.
In the end, net sales for the first six-month period were down 6,780 million yen (-8.1%) year on year at 76,467 million yen. Operating income also fell 650 million yen (-3.2%) year on year to total out at 19,525 million yen.
The core products of our Electronic devices and components business include electronic devices (LED backlights for
LCDs, sensing devices (measuring components), etc.), HDD spindle motors, stepping motors, DC motors, air movers (fan motors), precision motors, and special devices. Sales of LED backlights for LCDs remained strong due to surging demand for Minebea products that offer a technological advantage in thinner products. Sales of stepping motors and other motors have continued strong centering on the automobile market.
As a result, net sales for the first six-month period were down 13,710 million yen (-6.5%) year on year to total 198,354 million yen and operating income decreased 5,497 million yen (-44.5%) year on year to total 6,582 million yen due to negative foreign exchange effects, inventory adjustments, as well as other factors.
Net sales for the first half of the fiscal year in our Other business segment, which includes machines produced
in-house, were up 69 million yen (28.4%) year-on-year to total 311 million yen. The segment also posted an operating loss of 53 million yen, bringing operating income down 77 million yen year on year.
In addition to the figures noted above, 7,730 million yen in corporate expenses, etc. not belonging to any particular
segment has been recorded as adjustments. Adjustments for the first half of last fiscal year amounted to 5,130 million yen.
(2) Explanation of Financial Position
The Minebea Group sees “strengthening our financial position” as a top priority and is taking various steps, such as efficient asset management, controlling capital investments, and reducing interest-bearing debt.
Total assets at the end of the second quarter amounted to 499,966 million yen. That’s 40,539 million yen more than what they were at the end of the previous fiscal year. The main reason for this uptick includes an increase in notes and accounts receivable.Total liabilities amounted to 279,539 million yen. That’s an increase of 58,085 million yen over what they were at the end of the previous fiscal year. This jump was primarily due to an increase in notes and accounts payable. Net assets, totaling 220,426 million yen, were down 17,547 million yen below what they were at the end of the previous fiscal year. The equity ratio dropped 7.3 percentage points below what it was at the end of the last fiscal year to hit 42.9%.
- 4 -

(Cash flow)
The balance of cash and cash equivalents at the end of the second quarter was 38,229 million yen, up 9,087 million yen from what it was at the end of the previous fiscal year and up 7,458 million yen on a year-on-year basis.
Cash flows from various business activities during the first fiscal half and relevant factors are as follows: Net cash provided by operating activities amounted to 25,167 million yen. That’s a year-on-year jump of 11,953
million yen resulting from income before income taxes, notes and accounts receivable, notes and accounts payable, and inventories as well as the posting of depreciation and amortization costs, etc. Net cash used for investing activities decreased 1,836 million yen year on year, to total 25,314 million yen due primarily to the acquisition of marketable securities and tangible fixed assets. Net cash from financing activities was up 3,442 million yen year on year due to cash inflows of 12,409 million yen resulting from an increase in short-term loans, etc.
(3) Explanation of Consolidated Forecast and Other Forecasts It is difficult to get a clear picture of where the global economy is headed for the remainder of this fiscal year. It is too early to tell how it will be affected by the death of Thailand's king and the events that may follow, the outcome of the U.S. presidential election, geopolitical risks, and fluctuating exchange rates.
After reviewing our consolidated full-year forecast in light of this backdrop and making our best estimate of the total impact current market conditions as well as our performance during the first six-month period will have on our operations, we have decided to revise the forecast for net income attributable to owners of the parent as shown below. Net sales 560,000 million yen (91.8%) Operating income 45,000 million yen (87.5%) Ordinary income 44,000 million yen (94.3%) Net income attributable to owners of the parent 26,500 million yen (72.8%)
(%): Year-on-year change
Our dividend forecast is based on our basic dividend policy that gives priority to enhancing equity efficiency and improving returns to our shareholders. Dividends are calculated to reflect performance in light of the overall business environment as we aim to maintain a stable and continuous distribution of profits. Working in line with our basic policy and in consideration of performance projections for this fiscal year, we have lowered the interim dividend by 3 yen to make it 7 yen per share and lowered the year-end dividend by 3 yen to make it 7 yen per share.
We also bought back convertible bonds worth 13,896 million yen in order to prevent the dilution of our shares resulting from the integration with MITSUMI ELECTRIC CO., LTD. that will occur through a share exchange scheduled to take place this fiscal year.
In addition, our consolidated forecast mentioned above has not taken the said company’s earnings forecast into consideration.
- 5 -

2. Other summary information (1) Summary of changes to major subsidiaries during the quarter
Not applicable.
(2) Changes in accounting policy, changes in accounting estimates, and restatements Change in accounting policy which is difficult to distinguish from the change in accounting estimates
(Change in the depreciation method of tangible fixed assets other than buildings) The Company and consolidated domestic subsidiaries have hitherto adopted the declining-balance method for the
depreciation method of tangible fixed assets other than buildings; however, we have adopted the straight-line method since the first quarter of the current fiscal year.
Minebea Group plans to make an investment in the aircraft components business in Japan and Thailand. In the wake of the decision on the investment project, we reviewed the depreciation method of tangible fixed assets. As a result, we decided to change the depreciation method of tangible fixed assets to the straight-line method, since the adoption of such method will more accurately and adequately reflect the actual state of economic conditions, given the stable operating situations of our facilities and equipment throughout their period of use.
Due to the change, depreciation cost for the first half of the current fiscal year decreased, while operating income, ordinary income, and net income before income taxes rose 228 million, respectively.
(3) Additional Information
(Adoption of revised implementation guidance on recoverability of deferred tax assets) Revised Implementation Guidance on Recoverability of Deferred Tax Assets (ASBJ Guidance No. 26, March 28,
2016) has been applied effective from the first quarter consolidated accounting period.
- 6 -
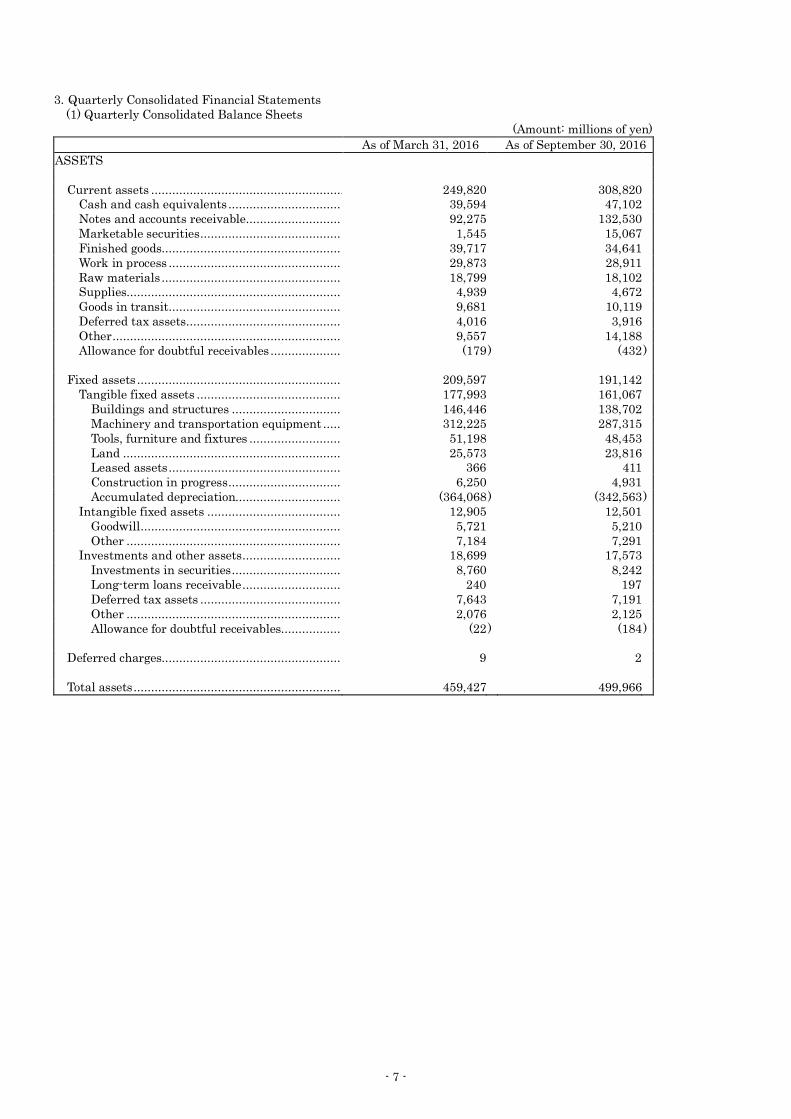
3. Quarterly Consolidated Financial Statements (1) Quarterly Consolidated Balance Sheets
(Amount: millions of yen) As of March 31, 2016 As of September 30, 2016
ASSETS
Current assets ....................................................... 249,820 308,820 Cash and cash equivalents ................................ 39,594 47,102 Notes and accounts receivable ........................... 92,275 132,530 Marketable securities ........................................ 1,545 15,067 Finished goods................................................... 39,717 34,641 Work in process ................................................. 29,873 28,911 Raw materials ................................................... 18,799 18,102 Supplies............................................................. 4,939 4,672 Goods in transit ................................................. 9,681 10,119 Deferred tax assets ............................................ 4,016 3,916 Other ................................................................. 9,557 14,188 Allowance for doubtful receivables .................... (179 ) (432 )
Fixed assets .......................................................... 209,597 191,142
Tangible fixed assets ......................................... 177,993 161,067 Buildings and structures ............................... 146,446 138,702 Machinery and transportation equipment ..... 312,225 287,315 Tools, furniture and fixtures .......................... 51,198 48,453 Land .............................................................. 25,573 23,816 Leased assets ................................................. 366 411 Construction in progress ................................ 6,250 4,931 Accumulated depreciation.............................. (364,068 ) (342,563 )
Intangible fixed assets ...................................... 12,905 12,501 Goodwill ......................................................... 5,721 5,210 Other ............................................................. 7,184 7,291
Investments and other assets ............................ 18,699 17,573 Investments in securities ............................... 8,760 8,242 Long-term loans receivable ............................ 240 197 Deferred tax assets ........................................ 7,643 7,191 Other ............................................................. 2,076 2,125 Allowance for doubtful receivables................. (22 ) (184 )
Deferred charges................................................... 9 2
Total assets ........................................................... 459,427 499,966
- 7 -

(Amount: millions of yen) As of March 31, 2016 As of September 30, 2016
LIABILITIES
Current liabilities ................................................. 165,424 226,344 Notes and accounts payable .............................. 35,807 78,881 Short-term loans payable .................................. 66,165 81,151 Current portion of bonds ................................... 10,000 10,000 Current portion of convertible bond-type
bonds with subscription rights to shares ....... 7,700 7,700 Current portion of long-term loans payable ...... 13,479 13,402 Lease obligations ............................................... 64 40 Accrued income taxes ........................................ 5,385 4,847 Accrued bonuses ................................................ 6,157 8,944 Allowance for bonuses to directors .................... 180 90 Allowance for after-care of products .................. 302 ― Allowance for environmental remediation
expenses ........................................................ 463 159 Allowance for business restructuring losses ...... 216 104 Other ................................................................. 19,502 21,022
Long-term liabilities ............................................. 56,029 53,194
Long-term loans payable ................................... 39,765 38,482 Lease obligations ............................................... 45 111 Allowance for retirement benefits
to executive officers........................................ 187 150 Allowance for environmental remediation
expenses ........................................................ 513 377 Net defined benefit liability............................... 13,246 11,978 Other ................................................................. 2,271 2,094
Total liabilities ...................................................... 221,454 279,539 NET ASSETS
Shareholders’ equity ............................................. 279,914 289,380 Common stock ................................................... 68,258 68,258 Capital surplus .................................................. 95,772 96,042 Retained earnings ............................................. 125,133 134,134 Treasury stock ................................................... (9,249 ) (9,055 )
Total accumulated other comprehensive income .. (49,129 ) (74,996 ) Difference on revaluation of available-for-sale
securities ....................................................... 588 570 Deferred gains or losses on hedges .................... 283 617 Foreign currency translation adjustments ........ (47,390 ) (74,120 )
Remeasurements of defined benefit plans ......... (2,611 ) (2,063 ) Subscription rights to shares ................................ 130 105 Non-controlling interests ...................................... 7,058 5,936 Total net assets ..................................................... 237,973 220,426
Total liabilities and net assets .................................. 459,427 499,966
- 8 -

(2) Quarterly Consolidated Statements of Income and Quarterly Consolidated Statements of Comprehensive Income (Quarterly Consolidated Statements of Income)
(Six months ended September 30, 2016) (Amount: millions of yen)
Six months ended September 30, 2015
Six months ended September 30, 2016
Net sales .................................................................. 295,554 275,133 Cost of sales ............................................................. 232,866 220,417
Gross profit ....................................................... 62,687 54,716 Selling, general and administrative expenses ...... 35,269 36,121
Operating income .............................................. 27,417 18,594 Other income............................................................ 949 1,435
Interest income ..................................................... 299 210 Dividends income ................................................. 69 68 Foreign currency exchange gains.......................... ― 538 Dividends income of insurance ............................. 206 199 Other .................................................................... 373 418
Other expenses......................................................... 5,041 1,114
Interest expenses .................................................. 569 421 Foreign currency exchange losses ......................... 3,434 ― Other .................................................................... 1,037 693
Ordinary income................................................ 23,326 18,915 Extraordinary income .............................................. 1,577 102
Gain on sales of fixed assets ................................. 15 36 Insurance income.................................................. 504 ― Government subsidy ............................................. 973 ― Gain on liquidation of affiliates ............................ 83 ― Gain on sales of subsidiaries and
affiliates’ stocks ................................................. ― 66 Extraordinary loss ................................................... 1,661 542
Loss on sales of fixed assets .................................. 13 152 Loss on disposal of fixed assets ............................. 62 28 Loss on reduction of fixed assets ........................... 928 ― Loss on disaster .................................................... 137 ― Loss on liquidation of affiliates ............................. ― 266 Business restructuring losses ............................... 61 9 Loss on abolishment of retirement benefit plan .... 50 ― Loss for after-care of products .............................. 220 12 Allowance for environmental
remediation expenses ........................................ 187 72 Income before income taxes .................................. 23,241 18,474
Income taxes
Income taxes (including enterprise tax) .................. 6,869 4,905 Income taxes for prior periods..................................... ― 1,302 Adjustment of income taxes .................................. (1,653 ) (515 )
Total income taxes ............................................. 5,215 5,692 Net income ................................................................ 18,026 12,782 Net income attributable to non-controlling interests .... 267 37 Net income attributable to owners of the parent .......... 17,758 12,745
- 9 -
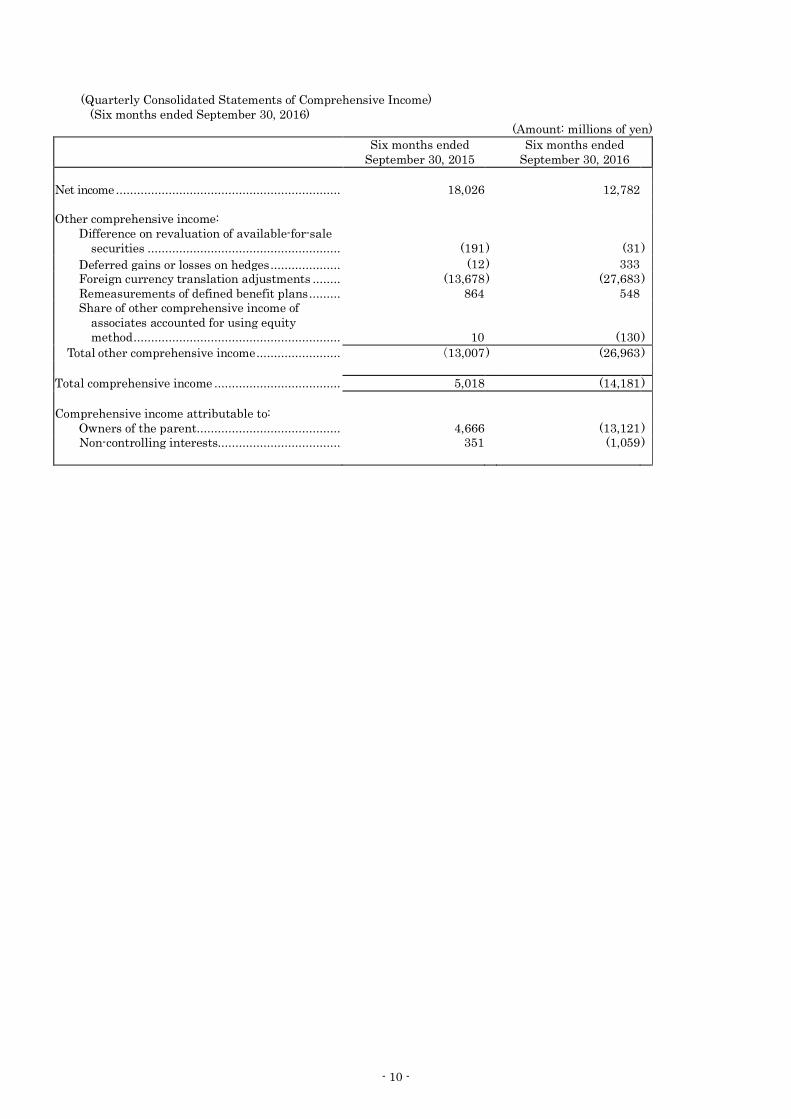
(Quarterly Consolidated Statements of Comprehensive Income) (Six months ended September 30, 2016)
(Amount: millions of yen)
Six months ended September 30, 2015
Six months ended September 30, 2016
Net income ................................................................ 18,026 12,782 Other comprehensive income:
Difference on revaluation of available-for-sale securities ....................................................... (191 ) (31 )
Deferred gains or losses on hedges .................... (12 ) 333 Foreign currency translation adjustments ........ (13,678 ) (27,683 )
Remeasurements of defined benefit plans ......... 864 548 Share of other comprehensive income of
associates accounted for using equity method ........................................................... 10 (130 )
Total other comprehensive income ........................ (13,007 ) (26,963 )
Total comprehensive income .................................... 5,018 (14,181 ) Comprehensive income attributable to:
Owners of the parent ......................................... 4,666 (13,121 ) Non-controlling interests................................... 351 (1,059 )
- 10 -

(3) Quarterly Consolidated Statements of Cash Flows (Amount: millions of yen)
Six months ended September 30, 2015
Six months ended September 30, 2016
1. Cash flows from operating activities: Income before income taxes ......................................................... 23,241 18,474 Depreciation and amortization .................................................... 16,431 14,243 Amortization of goodwill .............................................................. 461 502 Loss on disaster ........................................................................... 137 ― Loss on abolishment of retirement benefit plan ........................... 50 ― Insurance income......................................................................... (504 ) ― Government subsidy…………………………………………………… (973 ) ― Interest and dividends income ..................................................... (369 ) (278 ) Interest expenses ......................................................................... 569 421 Loss (gain) on sales of fixed assets ............................................... (1 ) 116 Loss on disposal of fixed assets .................................................... 62 28 Loss on reduction of fixed assets .................................................. 928 ― Loss (gain) on sales of stocks of subsidiaries and affiliates………. ― (66 ) Loss (gain) on liquidation of affiliates .......................................... (83 ) 266 Decrease (increase) in notes and accounts receivable .................. (31,045 ) (48,044 ) Decrease (increase) in inventories ............................................... (31,464 ) (2,221 ) Increase (decrease) in notes and accounts payable ...................... 37,080 46,870 Increase (decrease) in allowance for doubtful receivables ............ (708 ) 466 Increase (decrease) in accrued bonuses ....................................... 3,224 3,148 Increase (decrease) in allowance for bonuses to directors ............ (111 ) (90 ) Increase (decrease) in net defined benefit liability………………... (38 ) (241 ) Increase (decrease) in allowance for retirement benefits
to executive officers .................................................................. (18 ) (36 ) Increase (decrease) in allowance for after-care of products .......... (31 ) (302 ) Increase (decrease) in allowance for environmental remediation
expenses .................................................................................... 49 (357 ) Increase (decrease) in allowance for business restructuring
losses ........................................................................................ (434 ) (96 ) Other ........................................................................................... 5,885 (454 )
Sub-total 22,337 32,351 Interest and dividends received ................................................... 357 266 Interest paid ................................................................................ (552 ) (415 ) Income taxes paid ........................................................................ (7,063 ) (7,036 ) Proceeds from income taxes refund ............................................. 197 ― Payments related to Anti-Monopoly Act ...................................... (2,164 ) ― Proceeds from insurance income .................................................. 101 ―
Net cash provided by operating activities 13,214 25,167
- 11 -

(Amount: millions of yen)
Six months ended September 30, 2015
Six months ended September 30, 2016
2. Cash flows from investing activities: Payments into time deposits ........................................................ (9,694 ) (6,022 ) Proceeds from withdrawal of time deposits ................................. 7,284 6,275 Purchase of marketable securities ............................................... ― (13,896 ) Proceeds from sales of marketable securities............................... 34 29 Purchase of tangible fixed assets ................................................. (23,902 ) (10,832 ) Proceeds from sales of tangible fixed assets................................. 271 1,012 Purchase of intangible fixed assets .............................................. (473 ) (1,007 ) Purchase of investments in securities.......................................... (883 ) (1,107 ) Proceeds from sales of investments in securities ......................... 1 ― Proceeds from redemption of investment securities ..................... 690 928 Purchase of investments in subsidiaries resulting in change in scope of consolidation……………………………….. (257 ) (1,032 ) Proceeds from sales of stocks of subsidiaries and affiliates……… ― 474 Payments for loans provided........................................................ (186 ) (37 ) Proceeds from collection of loans receivables ............................... 75 35 Other ........................................................................................... (110 ) (134 )
Net cash used in investing activities (27,150 ) (25,314 ) 3. Cash flows from financing activities:
Net increase (decrease) in short-term loans payable ................... 13,117 17,157 Proceeds from long-term loans..................................................... ― 98 Repayment of long-term loans ..................................................... (2,138 ) (1,456 ) Purchase of treasury stock........................................................... (5 ) (0 ) Proceeds from disposal of treasury stock ..................................... 315 452 Cash dividends paid .................................................................... (2,243 ) (3,743 ) Dividends paid to non-controlling interests ................................. ― (62 ) Repayment of lease obligations.................................................... (78 ) (35 ) Other ........................................................................................... ― 0
Net cash used in financing activities 8,967 12,409 4. Effect of exchange rate changes on cash and cash equivalents (398 ) (3,173 ) 5. Net increase (decrease) in cash and cash equivalents (5,366 ) 9,087 6. Cash and cash equivalents at beginning of period 36,137 29,141 7. Cash and cash equivalents at end of period 30,771 38,229
- 12 -

(4) Notes on Quarterly Consolidated Financial Statements (Notes on Going Concern Assumptions)
Not applicable.
(Notes for Significant Change in the Amount of Net Assets) Not applicable.
(Segment Information etc.) Ⅰ Six months ended September 30, 2015
1. Information related to sales and income (loss) by reportable segments (Amount: millions of yen)
Reportable segments
Other
*1 Total
Adjustment *2
Quarterly Consolidated Statements of
Income amount
*3
Machined components
business
Electronic devices and components
business
Total
Total sales
(1) Sales to customers
(2) Sales to other segment
83,247
2,110
212,064
2,380
295,311
4,490
242
765
295,554
5,255
―
(5,255)
295,554
―
Total 85,357 214,444 299,801 1,008 300,810 (5,255) 295,554
Segment income 20,175 12,349 32,524 24 32,548 (5,130) 27,417 (Notes) *1. The classification of “Other” is the business segment, which is not included in the reportable segments,
and its products are mainly machine made in-house. *2. Adjustments to segment income are amortization of goodwill -461 million yen, and corporate expenses
such as general and administrative expenses in addition to research and development expenses that do not belong to the reportable segments -4,669 million yen.
*3. Segment income is reconciled to operating income in the quarterly consolidated statements of income.
2. Information related to impairment loss of fixed assets or goodwill, etc. by reportable segments Not applicable.
- 13 -

Ⅱ Six months ended September 30, 2016
1. Information related to sales and income (loss) by reportable segments (Amount: millions of yen)
Reportable segments
Other
*1 Total
Adjustment *2
Quarterly Consolidated Statements of
Income amount
*3
Machined components
business
Electronic devices and components
business
Total
Total sales
(1) Sales to customers
(2) Sales to other segment
76,467
1,835
198,354
1,894
274,821
3,730
311
432
275,133
4,162
―
(4,162)
275,133
―
Total 78,302 200,248 278,551 744 279,296 (4,162) 275,133 Segment income (loss) 19,525 6,852 26,378 (53) 26,325 (7,730) 18,594
(Notes) *1. The classification of “Other” is the business segment, which is not included in the reportable segments, and its products are mainly machine made in-house.
*2. Adjustments to segment income or loss are amortization of goodwill -502 million yen, and corporate expenses such as general and administrative expenses in addition to research and development expenses that do not belong to the reportable segments -7,227 million yen.
*3. Segment income (loss) is reconciled to operating income in the quarterly consolidated statements of income.
2. Information related to impairment loss of fixed assets or goodwill, etc. by reportable segments
Not applicable.
3. Information related to changes reportable segments, etc. (Change in the depreciation method of tangible fixed assets other than buildings)
The Company and consolidated domestic subsidiaries have hitherto adopted the declining-balance method for the depreciation method of tangible fixed assets other than buildings; however, we have adopted the straight-line method since the first quarter of the current fiscal year.
Minebea Group plans to make an investment in the aircraft components business in Japan and Thailand. In the wake of the decision on the investment project, we reviewed the depreciation method of tangible fixed assets. As a result, we decided to change the depreciation method of tangible fixed assets to the straight-line method, since the adoption of such method will more accurately and adequately reflect the actual state of economic conditions, given the stable operating situations of our facilities and equipment throughout their period of use.
Due to this change, depreciation cost for the first half of the current fiscal year decreased, while the segment income for Machined components, that for Electronic devices and components, that for Other and that for Adjustment (all companies) segment rose 61, 88, 53, and 24 million yen, respectively.
- 14 -

November 2, 2016
Minebea Co., Ltd.
1. Consolidated Results of Operations
FY ending
Mar. '17
(Millions of yen) 1st Half 2nd Half Full Year 1st Half
Net sales 295,554 314,260 609,814 275,133 -6.9%
Operating income 27,417 24,021 51,438 18,594 -32.2%
Ordinary income 23,326 23,335 46,661 18,915 -18.9%
Net income attributable to owners of the parent 17,758 18,628 36,386 12,745 -28.2%
Net income per share (yen) 47.49 49.77 97.26 34.01 -28.4%
Diluted net income per share (yen) 45.09 47.26 92.35 33.26 -26.2%
(Millions of yen) 1Q 2Q 3Q 4Q
F
u
l
1Q Q/Q *2 Y/Y *3
Net sales 127,391 168,162 178,661 135,599 120,288 154,844 +28.7% -7.9%
Operating income 12,512 14,905 15,484 8,536 6,971 11,623 +66.7% -22.0%
Ordinary income 12,872 10,453 15,120 8,215 7,255 11,659 +60.7% +11.5%
Net income attributable to owners of the parent 10,058 7,700 11,825 6,802 3,176 9,568 +201.3% +24.3%
Net income per share (yen) 26.90 20.59 31.61 18.17 8.48 25.52 +200.9% +23.9%
Diluted net income per share (yen) 25.54 19.55 30.01 17.26 8.12 24.94 +207.1% +27.6%
2. Consolidated Sales and Operating Income by Segments
FY ending
Mar. '17
%Change
Y/Y
(Millions of yen) 1st Half 2nd Half Full Year 1st Half 1st Half *1
83,247 80,564 163,811 76,467 -8.1%
212,064 233,403 445,467 198,354 -6.5%
Other 242 294 536 311 +28.4%
- - - - -
Total sales 295,554 314,260 609,814 275,133 -6.9%
20,175 20,679 40,854 19,525 -3.2%
12,349 9,987 22,336 6,852 -44.5%
Other 24 -148 -124 -53 -
-5,130 -6,497 -11,627 -7,730 -
Total operating income 27,417 24,021 51,438 18,594 -32.2%
(Millions of yen) 1Q 2Q 3Q 4Q
F
u
l
1Q Q/Q *2 Y/Y *3
40,974 42,272 40,766 39,797 39,207 37,259 -5.0% -11.9%
86,311 125,753 137,750 95,653 80,911 117,442 +45.1% -6.6%
Other 105 137 144 148 169 142 -16.0% +3.6%
- - - - - - - -
Total sales 127,391 168,162 178,661 135,599 120,288 154,844 +28.7% -7.9%
9,956 10,218 10,605 10,073 10,401 9,123 -12.3% -10.7%
5,608 6,740 7,618 2,368 432 6,420 - -4.7%
Other -41 65 -59 -89 -16 -36 - -
-3,010 -2,120 -2,680 -3,816 -3,846 -3,884 - -
Total operating income 12,512 14,905 15,484 8,536 6,971 11,623 +66.7% -22.0%
2Q
%Change Y/Y
1st Half *1
FY ending Mar. '17Fiscal year ended Mar. '16
Adjustment
Machined components
Electronic devices and components
Machined components
Electronic devices and components
Machined components
Electronic devices and components
2Q %Change
Supplementary Financial Data
for the Second Quarter of Fiscal Year ending March 31, 2017
2Q %Change
2Q
Fiscal year ended Mar. '16
FY ending Mar. '17Fiscal year ended Mar. '16
Adjustment
Machined components
Electronic devices and components
Adjustment
Fiscal year ended Mar. '16
Adjustment
- 15 -
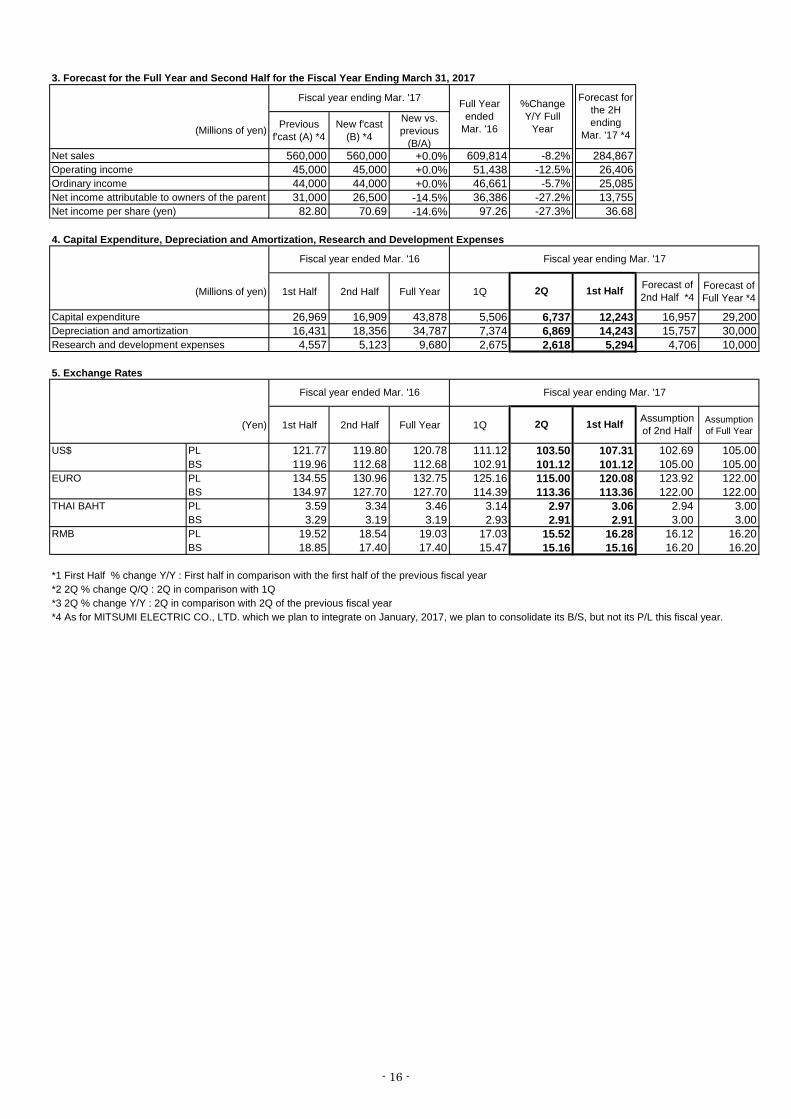
3. Forecast for the Full Year and Second Half for the Fiscal Year Ending March 31, 2017
(Millions of yen)Previous
f'cast (A) *4
New f'cast
(B) *4
New vs.
previous
(B/A)
Net sales 560,000 560,000 +0.0% 609,814 -8.2% 284,867
Operating income 45,000 45,000 +0.0% 51,438 -12.5% 26,406
Ordinary income 44,000 44,000 +0.0% 46,661 -5.7% 25,085
Net income attributable to owners of the parent 31,000 26,500 -14.5% 36,386 -27.2% 13,755
Net income per share (yen) 82.80 70.69 -14.6% 97.26 -27.3% 36.68
4. Capital Expenditure, Depreciation and Amortization, Research and Development Expenses
(Millions of yen) 1st Half 2nd Half Full Year 1QForecast of
Full Year *4
Capital expenditure 26,969 16,909 43,878 5,506 6,737 12,243 16,957 29,200
Depreciation and amortization 16,431 18,356 34,787 7,374 6,869 14,243 15,757 30,000
Research and development expenses 4,557 5,123 9,680 2,675 2,618 5,294 4,706 10,000
5. Exchange Rates
(Yen) 1st Half 2nd Half Full Year 1QAssumption
of Full Year
US$ PL 121.77 119.80 120.78 111.12 103.50 107.31 102.69 105.00
BS 119.96 112.68 112.68 102.91 101.12 101.12 105.00 105.00
EURO PL 134.55 130.96 132.75 125.16 115.00 120.08 123.92 122.00
BS 134.97 127.70 127.70 114.39 113.36 113.36 122.00 122.00
THAI BAHT PL 3.59 3.34 3.46 3.14 2.97 3.06 2.94 3.00
BS 3.29 3.19 3.19 2.93 2.91 2.91 3.00 3.00
RMB PL 19.52 18.54 19.03 17.03 15.52 16.28 16.12 16.20
BS 18.85 17.40 17.40 15.47 15.16 15.16 16.20 16.20
*1 First Half % change Y/Y : First half in comparison with the first half of the previous fiscal year
*2 2Q % change Q/Q : 2Q in comparison with 1Q
*3 2Q % change Y/Y : 2Q in comparison with 2Q of the previous fiscal year
*4 As for MITSUMI ELECTRIC CO., LTD. which we plan to integrate on January, 2017, we plan to consolidate its B/S, but not its P/L this fiscal year.
Fiscal year ended Mar. '16 Fiscal year ending Mar. '17
Assumption
of 2nd Half
Fiscal year ending Mar. '17Fiscal year ended Mar. '16
2Q 1st HalfForecast of
2nd Half *4
2Q 1st Half
Fiscal year ending Mar. '17Full Year
ended
Mar. '16
%Change
Y/Y Full
Year
Forecast for
the 2H
ending
Mar. '17 *4
- 16 -