Embed Size (px)
Citation preview

Second Quarter 2021 ResultsMarch 2021

This presentation contains forward-looking statements within the meaning of the Private Securities Litigation Reform Act of 1995. Investors are cautioned that forward-looking statements are inherently uncertain and involve potential risks and uncertainties. A number of factors could cause actual results to differ materially from these statements, including, but not limited to competition and new product introductions by competitors, our ability to attract and retain qualified personnel, increases in market compensation rates, business or production disruptions, sales order cancellations, risk related to the terms of our credit agreements and compliance with debt covenants and leverage ratios, stock price volatility and share dilution, disruptions or unanticipated costs from facility expansions, availability of labor, a slowdown in the economy, low consumer confidence, the effect of global tensions, increases in interest rates, availability of credit, availability of financing for RV and marine dealers, impairment of goodwill, risk related to cyclicality and seasonality of our business, slower than anticipated sales of new or existing products, integration of operations relating to merger and acquisition activities generally, our acquisition of Newmar, the possibility that the Newmar acquisition may not perform as expected or may not result in earnings growth, difficulties and expenses related to integrating Newmar into our business, increased focus of management attention and resources on the acquisition of Newmar, risks related to the Convertible Notes and Senior Secured Notes, including our ability to satisfy our obligations under the Convertible Notes and Senior Secured Notes, risks related to our Convertible Note hedge and warrant transactions, inadequate liquidity or capital resources, inventory and distribution channel management, our ability to innovate, our reliance on large dealer organizations, significant increase in repurchase obligations, availability and price of fuel, availability of chassis and other key component parts, increased material and component costs, exposure to warranty claims, ability to protect our intellectual property, exposure to product liability claims, dependence on information systems and web applications, any unexpected expenses related to the implementation of our ERP system, the duration and scope of the COVID-19 pandemic, actions governments, businesses, and individuals take in response to the COVID-19 pandemic, including mandatory business closures and restrictions of onsite commercial interactions; the impact of the pandemic and actions taken in response to the pandemic on regional economies and economic activity; the pace of recovery when the COVID-19 pandemic subsides; and general economic uncertainty in key markets and a worsening of domestic economic conditions or low levels of economic growth, risk related to data security, governmental regulation, including for climate change, risk related to anti-takeover provisions applicable to us, cyber-attacks and other factors. We caution that the foregoing list of important factors is not complete. . The company disclaims any obligation or undertaking to disseminate any updates or revisions to any forward-looking statements contained in this presentation or to reflect any changes in the company's expectations after the date of this presentation or any change in events, conditions or circumstances on which any statement is based, except as required by law.
INDUSTRY AND MARKET DATA In this presentation, we rely on and refer to information and statistics regarding market participants in the sectors in which we compete and other industry data. We obtained this information and statistics from third-party sources, including reports by market research firms. While such information is believed to be reliable, for the purposes used herein, we make no representation or warranty with respect to the accuracy of such information. Any and all trademarks and trade names referred to in this presentation are the property of their respective owners.
NON-GAAP FINANCIAL MEASURESThis presentation includes financial information prepared in accordance with accounting principles generally accepted in the U.S. (“GAAP”), as well as certain adjusted or non-GAAP financial measures such as EBITDA, adjusted EBITDA and adjusted EPS. EBITDA is defined as net income before interest expense, provision for income taxes, and depreciation and amortization expense. Adjusted EBITDA is defined as net income before interest expense, provision for income taxes, depreciation and amortization expense, and other adjustments made in order to present comparable results from period to period. These non-GAAP financial measures, which are not calculated or presented in accordance with GAAP, have been provided as information supplemental and in addition to the financial measures presented in accordance with GAAP. Such non-GAAP financial measures should not be considered superior to, as a substitute for, or as an alternative to, and should be considered in conjunction with, the GAAP financial measures presented herein. The non-GAAP financial measures presented may differ from similar measures used by other companies. Please see slides 26-27 for reconciliations of these non-GAAP measures to the nearest GAAP measure.
We have included these non-GAAP performance measures as comparable measures to illustrate the effect of non-recurring transactions occurring during the year and improve comparability of our results from period to period. Management uses these non-GAAP financial measures (a) to evaluate our historical and prospective financial performance and trends as well as our performance relative to competitors and peers; (b) to measure operational profitability on a consistent basis; (c) in presentations to the members of our board of directors to enable our board of directors to have the same measurement basis of operating performance as is used by management in its assessments of performance and in forecasting and budgeting for our company; (d) to evaluate potential acquisitions; and (e) to ensure compliance with covenants and restricted activities under the terms of our credit facilities. We believe these non-GAAP financial measures are frequently used by securities analysts, investors and other interested parties to evaluate companies in our industry.
Forward Looking Statements
2© 2021 Winnebago Industries

We promise…
quality delivered by empowered, passionate employees. We’re part of a team caring for customers through a lifetime of experiences with us. And we purposefully innovate to delight customers with new ways to travel, live, work and play.
For the team at Winnebago Industries, the outdoors is a calling.
One that removes the line between what we love and what we do. We are a family of brands with rich legacies that are as unique as our customers but unified in how we work.
3© 2021 Winnebago Industries

Products
Overview
Quick Facts
4© 2021 Winnebago Industries
We help our customers explore the outdoor lifestyle, enabling extraordinary experiences as they travel, live, work and play.
$2.8B FY 2021 Q2 TTM Revenue
6,100 Highly Skilled Employees
Class A – Gas & Diesel Class B
Class C – Gas & Diesel Travel Trailer
5th Wheel Specialty Vehicles
Boats
Locations
Executive Office
RV Production
Chris-Craft Production
Significant Transformation (2016-Current)
F2016 Current• Revenue $1.0B $2.8B• RV Market Share1 3.0% 12.9%• Market Cap2 $0.7B $2.7B
1 current market share is retail fiscal year-to-date as of January, 2021; per Statistical Surveys Inc.2 market cap: F16 as of 8/30/16 and current as of 3/22/21

Strengthen An Inclusive, High-Performance Culture
• Purpose-driven
• Collaborative
• Results-focused
BuildExceptional Outdoor Lifestyle Brands
• Organic Growth
• Smart Diversification
• Premium Offerings
UtilizeTechnology and Information as Business Catalysts
• Innovation
• Productivity / Agility
• Digital Competency
CreateA Lifetime of Customer Intimacy
• Consumer Insights
• Channel Partnerships
• Shared Experiences
Drive Operational Excellence and Portfolio Synergy
• Employee Safety / Health
• Product Quality
• Continuous Improvement
Enterprise Strategic Priorities
5© 2021 Winnebago Industries

Second Quarter Highlights
• Record quarterly revenue of $840M
• RV market share gains continue
• Strong gross margin expansion of 590 bps vs F20 Q2
• Adjusted EPS growth of over 200% vs F20 Q2
• Issued 2nd annual Corporate Responsibility Report in December
6© 2021 Winnebago Industries

Q2 Consolidated Results
• Revenues grew 34% driven by strong consumer demand in both the towable segment (+55%) and motorhome segment (+18%)
• Gross margins expanded 590 bps due to favorable pricing, including lower discounts and allowances, strategic cost savings initiatives, segment mix and operating leverage
• Adjusted EBITDA more than doubled driven by strong revenue growth and enhanced gross margins
• Adjusted EPS increased dramatically (over 200%) reflecting strong performance amidst robust outdoor lifestyle market growth
7© 2021 Winnebago Industries
626.8
839.9
$45.4
$108.0
$0.67
$2.12
12.7%
18.6%
2Q20 2Q21
Gross Margin
Adj. EBITDA ($-millions)
Adj. EPS
Revenue($-millions)

$14.9
$51.0
$ - millions
Motorhome Segment Results
8© 2021 Winnebago Industries
$325.5
$382.6
2,856
14,974
Segment revenues increased $57M (18%) driven by strong Winnebago branded growth
Segment Adjusted EBITDA more than tripled to $51M and Adjusted EBITDA % improved 870 bps due to cost savings initiatives, favorable pricing and operating leverage
Segment backlogs increased to a record 15K units driven by high levels of consumer demand and depleted dealer inventories
4.6%
13.3%
% of Revenue
2Q20 2Q21
Adjusted EBITDA Backlog (units)Revenue ($-millions)
+18% +242% +424%+870bps

Towables Segment Results
9© 2021 Winnebago Industries
Segment revenues increased 55% to $439M driven by strong consumer demand for both the Grand Design and Winnebago branded travel trailer and fifth wheel products
Segment Adjusted EBITDA increased 79% to $62M driven by increased revenues. Adjusted EBITDA % improved 190 bps due to favorable pricing and operating leverage
Segment backlogs increased to a record 40K units driven by high levels of consumer demand and depleted dealer inventories
2Q20 2Q21
Adjusted EBITDA Backlog (units)Revenue ($-millions)
$34.7
$62.4
$ - millions
$283.5
$439.3
9,790
39,855
12.3%
14.2%
% of Revenue
+55% +79% +307%+190bps

6%
7%9%
10%
12%
F17 F18 F19 F20 F21 Jan YTD
14%
9%
-6%
2%
36%34%
28%
6%
14%
42%
F17 F18 F19 F20 F21 Jan YTD
Industry WGO
Growing Market Share
Towables Segment Market Share (Units)
Winnebago vs. RV Industry Retail Growth (YoY % Growth of Retail Units)
Motorhome Segment Market Share (Units)
10© 2021 Winnebago Industries
17% 16% 15%
21% 21%
F17 F18 F19 F20 F21 Jan YTD
Source: Statistical Surveys Inc.

RV Market Share Performance
11© 2021 Winnebago Industries
FY2016
3.0%
FY2017
7.1%
FY2018
8.4%
FY2019
9.5%
FY2020
11.3%
Source: Statistical Surveys Inc.; represents unit volume
FYTD Jan 2021
12.9%

Chris-Craft Highlights
12© 2021 Winnebago Industries
• Strong retail growth momentum continues in Q2
• Long backlog (into the fall of 2021) with >50% sold to retail buyers
• Dealer inventories are at a 12-year low and will be 2022 before meaningful pipeline refill
• New products this year are the 35 Calypso, 24 Calypso and 24 Catalina

Motorhome Segment New Products
13© 2021 Winnebago Industries
Class A—Diesel
Quiet Ride with Automotive Cockpit
Winnebago Connect Control Panel
Start Ship Q1 Fiscal 2022
MSRP Starting at $377K
Class C—Gas
Ford Transit AWD Chassis
Off-Grid Ready
Start Ship Q3 Fiscal 2021
MSRP Starting at $164K
Journey EkkoClass A – Diesel
New Dashboard Assembly
Armless Power Awnings
Introduced April, 2020
MSRP Starting at $236K
Canyon Star
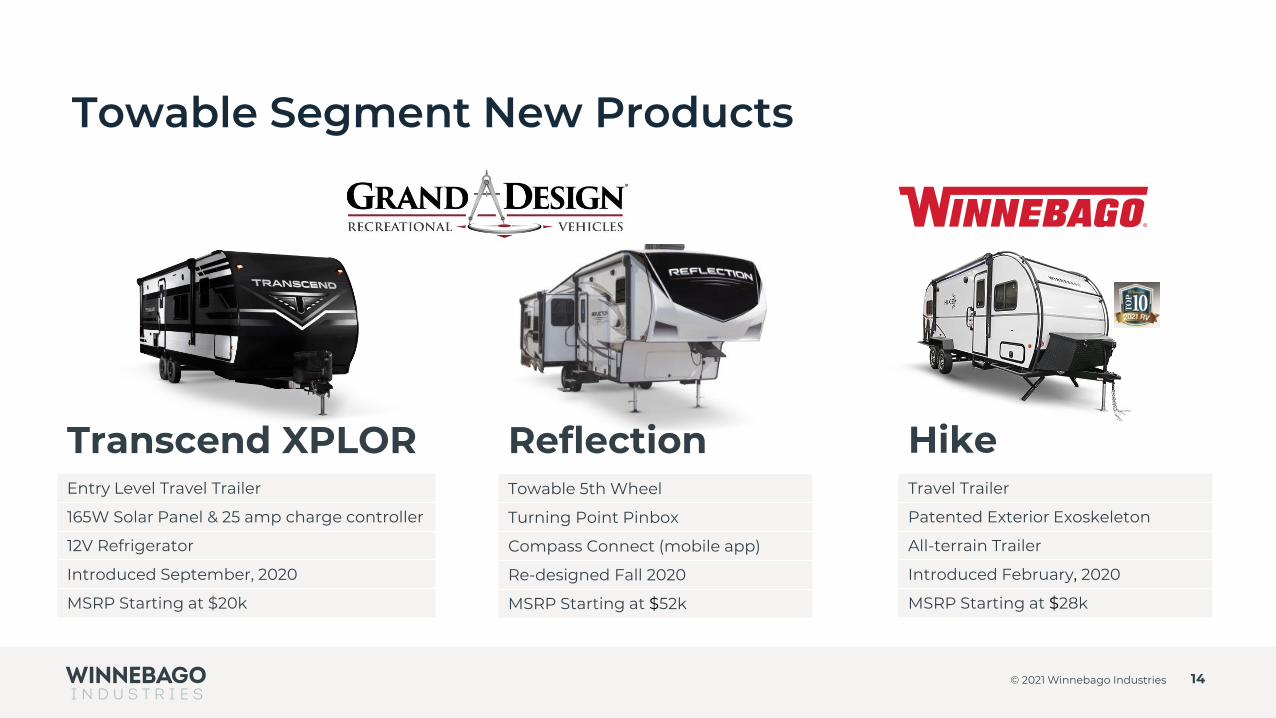
Towable Segment New Products
14© 2021 Winnebago Industries
Travel Trailer
Patented Exterior Exoskeleton
All-terrain Trailer
Introduced February, 2020
MSRP Starting at $28k
HikeEntry Level Travel Trailer
165W Solar Panel & 25 amp charge controller
12V Refrigerator
Introduced September, 2020
MSRP Starting at $20k
Transcend XPLORTowable 5th Wheel
Turning Point Pinbox
Compass Connect (mobile app)
Re-designed Fall 2020
MSRP Starting at $52k
Reflection

Other New Products
15© 2021 Winnebago Industries
Bow Rider Series
Dive Door
Dynamic Seating
Introduced November, 2020
MSRP Starting at $178k
Dual Console Series
Enclosed Hardtop
Electric Walkthrough Windshield
Introduced July, 2020
MSRP Starting at $562k
Calypso 24’ Calypso 35’Class A – Diesel
Accessibility Enhanced
Wheelchair Lift, Roll-in Shower, Wide Aisles
Introduced November, 2020
MSRP Starting at $299k
Inspire

Key RV Industry Trends
Dealer Inventories of WGO IND RV Products Continue to be Low
RV Industry Retail Sales Remain Strong
RV Industry Wholesale Shipments Averaging ~43K Units Per Month Since June 2020
16© 2021 Winnebago Industries
1%7%
-14%
-47%
-11%
34%39%
24%
37%29%
35%
48%
36%
RV Retail Units—Change vs Previous Year (through January 2021)
37,113
30,288
7,197
27,999
40,46243,035
39,48941,509
47,326
42,51340,382
45,930
Feb Mar Apr May Jun Jul Aug Sep Oct Nov Dec Jan
2%
-20%
-82%
-30%
11%
54%
17%
31%
21%
43%
47%
39%
% ch
g
20,555
23,95325,238
18,691
-
5,000
10,000
15,000
20,000
25,000
30,000
F18 Q2 F19 Q2 F20 Q2 F21 Q2
WGO IND Dealer Inventory (Units)
Source: Recreation Vehicle Industry AssociationSource: Statistical Surveys Inc.

Strong Interest In The Outdoors
17© 2021 Winnebago Industries
60% of the U.S. population pursued an outdoor activity in 2020*
68% of consumers under the age of 55 participated in an outdoor activity such as camping, hiking, boating or visiting a state or national park*
31% was first time participating in an outdoor activity*
of new campers, since the pandemic, are millennials**55%of new campers, since the pandemic, have children**82%
RV vacations are the most economical – on average 27% to 62% less expensive per day compared to other vacation options***
* Padilla Spotlight Methodology: online survey conducted among U.S. consumers at least 18 years or older between November 13 and November 17, 2020. Responses were weighted to U.S. Census for age, gender and ethnicity. There were 1,984 completed surveys.
** Kampgrounds of America; Fall 2020 Update report issued October 1, 2020*** CBRE Hotels Advisory Group report issued May 15, 2018

RVs Growing & Camping More Diverse
18© 2021 Winnebago Industries
5.0 6.911.2
1980 2001 2020
Rapid U.S. Household RV Ownership1
(millions)
+38%(1.5% CAGR)
+62%(2.3% CAGR)
20 25
Current Owners RV Intenders
RV Usage Will Grow1
(# days per year - median)
The Growing Appeal of RVs1
➢ The feeling of freedom and flexibility
➢ Adventure and pleasant escape from “real world”
➢ Love camping, but not without certain luxuries
➢ Brings back priceless experience with friends and family
➢ Don’t have to pack a suitcase
Source: 1RVIA Go RVing Owner Demographic Profile; prepared by Ipsos and published March 20212KOA 2019 North American Camping Report
8.7%household
penetration
Significant Growth of Diverse Campers2
CAMPER
S
2019
2012
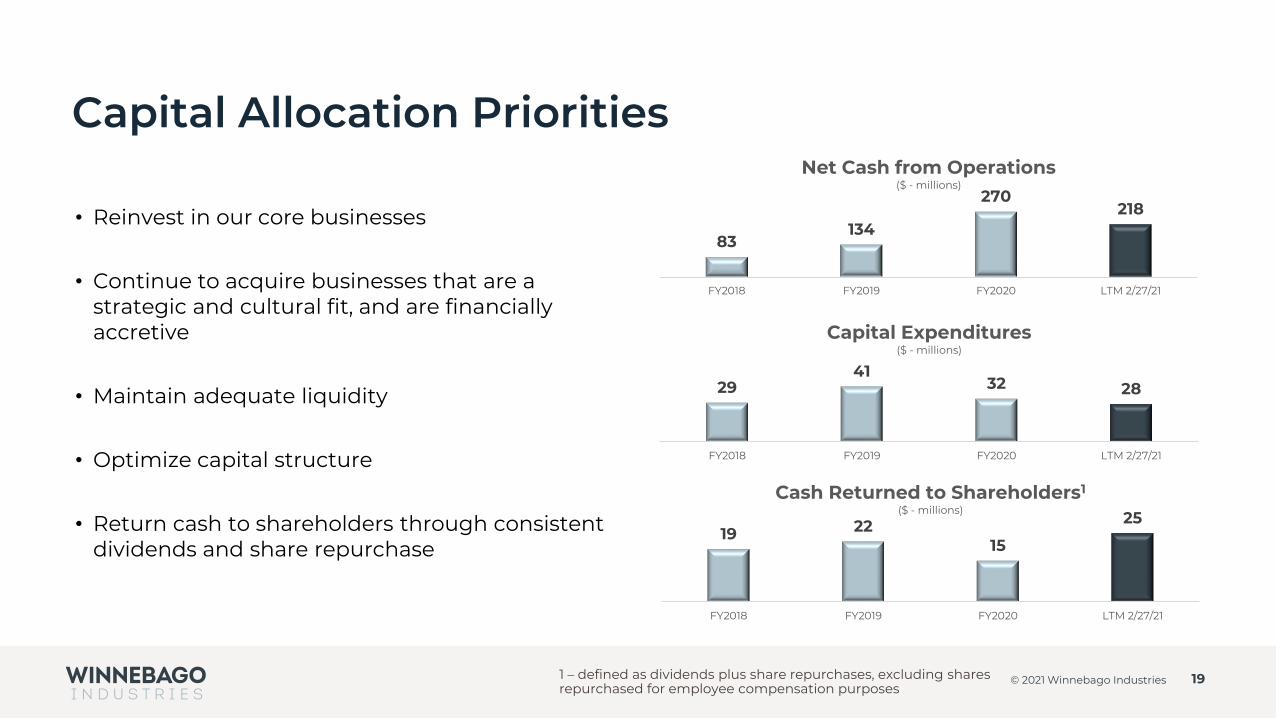
Capital Allocation Priorities
• Reinvest in our core businesses
• Continue to acquire businesses that are a strategic and cultural fit, and are financially accretive
• Maintain adequate liquidity
• Optimize capital structure
• Return cash to shareholders through consistent dividends and share repurchase
19© 2021 Winnebago Industries
83134
270218
FY2018 FY2019 FY2020 LTM 2/27/21
Net Cash from Operations($ - millions)
2941
32 28
FY2018 FY2019 FY2020 LTM 2/27/21
Capital Expenditures($ - millions)
19 2215
25
FY2018 FY2019 FY2020 LTM 2/27/21
Cash Returned to Shareholders1
($ - millions)
1 – defined as dividends plus share repurchases, excluding shares repurchased for employee compensation purposes

1.41.6
2.0
2.5
1.5
1.0
0.0
0.5
1.0
1.5
2.0
2.5
3.0
Leverage Ratio
Target Range (0.9x – 1.5x)
Liquidity/Debt Profile
Proven track record of maintaining ample liquidity and rapid debt paydown post acquisitions
• As of Q2, returned to lower end of targeted range, driven by strong cash generation and EBITDA performance
• $192.5M ABL available (currently untapped)
• $300M of convertible notes @ 1.5% due 2025
• $300M of secured notes @ 6.25% due 2028
Leverage Ratio
20© 2021 Winnebago Industries
Covid-19
EBITDA Impact

Operational Excellence
• Employee safety remains top health imperative; since 2016:
• Reduced total recordable incident rate by 70%
• Reduced days away, restricted or transferred rate by 60%
• Reduced our Workers Compensation reserves by more than 50%
• Newmar integration efforts on track to deliver annual synergies of $5M+
• Annual F21 productivity savings of $4M+ related to the closure of Junction City during F19
• Winnebago RVs transitioning fully to a build-to-dealer order model during F20 providing profitability benefits in F21
21© 2021 Winnebago Industries

COVID-19
• COVID-19 is having an impact on our employees and their families. At Winnebago Industries, we have implemented practices that have resulted in strong performance during this pandemic, including:
• following CDC guidelines strictly across our enterprise
• pre-entry symptom and temperature screening
• social distancing measures and mandatory face covers
• contact tracing and quarantines for any positive employee cases
• Flexible remote work accommodations for most office employees
• Now focusing additional efforts on vaccination tracking
22© 2021 Winnebago Industries

Corporate Responsibility
23© 2021 Winnebago Industries
As our company evolves, we focus on minimizing waste and product innovation
• Exploring new technologies and products to minimize environmental impact
• Engaging with the business to implement and evaluate waste management plans
• Introducing all-electric specialty vehicles
People and partnerships drive our inclusive, high-performing culture
• Safety: COVID-19 response veryeffective, maintaining safety gains
• People: Diversity, Equity and Inclusion strategy and goals progress
• Community: increased community support, launched WGO Together Fund providing $425,000 in pandemic hardship assistance
Responsible governance practices guide Winnebago Industries
• Code of Conduct: 100% employees trained
• ESG: enhanced corporate board engagement
• Corporate Responsibility: 2nd
annual report aligns with ESG reporting frameworks www.winnebagoind.com/responsibility
• 10 of 11 corporate directors are independent (2 new as of March, 2021)

Impact Partners
24© 2021 Winnebago Industries
Winnebago Industries and the Winnebago Industries Foundation partner with nonprofit organizations to inspire new generations of outdoor enthusiasts, mobilize resources to reach people in times of need, and support our team to grow inclusive, equitable communities where we work, live and play.
OutdoorsInspire new generations of
outdoor enthusiasts,
advance outdoor equity, and
preserve places to explore.
AccessMobilize resources to
reach people where they
are, in times of need.
CommunityPartner with our people and
hometown communities to build
vibrant neighborhoods where we
work and live.

25© 2021 Winnebago Industries

Adjusted EBITDA Reconciliation
26© 2021 Winnebago Industries
($ - millions) Q2 2020 Q2 2021
Net Income $17.3 $69.1
Interest Expense 8.7 10.1
Provision for Income Taxes 4.0 21.2
Depreciation & Amortization 12.1 8.0
EBITDA $42.0 $108.3
Acquisition-related fair-value inventory step-up 3.6 --
Restructuring Expense 0 --
Non-Operating Expense (Income) (0.3) (0.3)
Adj. EBITDA $45.4 $108.0

Adjusted EPS Reconciliation
27© 2021 Winnebago Industries
Q2 2020 Q2 2021
Diluted income per share $0.51 $2.04
Pretax acquisition-related fair-value inventory step-up 0.11 --
Pretax non-cash interest expense(2) 0.09 0.10
Impact of convertible share dilution(3) -- 0.01
Tax impact of adjustments(4) (0.04) (0.02)
Adjusted diluted income per share(1) $0.67 $2.12
(1) Per share numbers may not foot due to rounding(2) Non-cash interest expense associated with the Convertible Notes issued related to our acquisition of Newmar.(3) Represents the dilution of convertible notes (the average market price became higher in the second quarter of FY21 than the strike price).(4) Income tax charge calculated using the statutory tax rate for the U.S. of 21.0% for both periods presented.