Embed Size (px)
Citation preview

Second Quarter 2018
Financial Results
1 August 2018
1
2018
BUSINESS MILESTONES
Portfolio of Directly Managed BRANDS
Note: Din Tai Fung, Song Fa Bak Kut Teh, Wu Pao Chun Bakery, Tai
Gai and Nayuki are franchised brands.
Restaurant
Food Atrium
Jan Issued S$100m Medium Term Note at 4.0%
Opened 1st Song Fa Bak Kut Teh outlet in Shanghai,
Jing An Kerry Centre
Joint venture with Wu Pao Chun (“WPC”) Bakery to
operate WPC bakeries in Singapore and Hong Kong
Opening of Food Republic’s first Direct Operated
Restaurant ‘Sergeant Kitchen’ in Bangkok
Joint venture with PT. Pura Indah Berkat (“PIB”). PIB
will operate Toast Box outlets in Indonesia
Mar
Share Split of Every One (1) Ordinary Share into Two
(2) Ordinary Shares
Partnership with Shenzhen Pindao Food &
Beverage Management Co Ltd to operate and
manage the popular tea beverage brands Nayuki (奈雪) and Tai Gai (台盖) in Singapore and Thailand
May
New Strategic Partnership with Mr Ge Ying (“GY”) to
operate the BreadTalk brand of bakeries in
Chongqing, China, and potentially expand across
the South-western market
Jun
Tripartite alliance of BreadTalk Group-Pindao
Venture and Song Fa Holdings for Song Fa Bak Kut
Teh in Shenzhen and Guangzhou
Jul
4orth
Bakery

REVENUE EBITDANET
PROFIT
CORE F&B
NET PROFIT
2Q
2018
148.8 million 18.1 million 2.4 million 2.4 million
0.8 % - 1.9 % 10.5 % 10.5 %
1H
2018
297.4 million 34.4 million 3.6 million 5.4 million
0.7 % - 23.2 % - 72.2 % 38.9 %
2
2Q 2018
FINANCIAL HIGHLIGHTS

S$ Million 2Q18 2Q17 Y-o-Y 1Q18 Q-o-Q 1H18 1H17 Y-o-Y
Revenue 148.8 147.7 0.8% 148.5 0.2% 297.4 295.4 0.7%
Bakery 68.6 72.4 - 5.2% 70.4 - 2.5% 139.0 146.1 - 4.9%
Food Atrium 38.8 37.4 4.0% 37.5 3.6% 76.3 73.7 3.6%
Restaurant 37.3 34.8 7.1% 36.9 1.0% 74.1 69.5 6.7%
4orth 3.0 2.0 53.0% 2.7 12.2% 5.7 3.9 47.4%
Others 1.1 1.2 - 4.4% 1.1 0.2% 2.2 2.3 - 3.4%
EBITDA 18.1 18.4 - 1.9% 16.3 10.7% 34.4 44.8 - 23.2%
Bakery 4.1 6.9 - 40.0% 3.8 9.7% 7.9 12.3 - 36.0%
Food Atrium 7.7 5.3 44.3% 5.3 45.6% 13.0 10.8 20.0%
Restaurant 7.1 7.2 - 2.2% 8.7 - 18.5% 15.8 14.2 10.9%
4orth (0.1) (0.1) 29.4% (0.1) 3.8% (0.2) 0.0 n.m.
Others (0.7) (0.9) 23.2% (1.3) - 44.9% (2.0) 7.4 127.6%
EBITDA Margin (%) 12.1% 12.5% - 0.3 ppt 11.0% + 0.1 ppt 11.6% 15.2% - 3.5 ppt
Bakery 6.0% 9.5% - 3.5 ppt 5.4% + 0.1 ppt 5.7% 8.5% - 2.8 ppt
Food Atrium 19.8% 14.3% + 5.5 ppt 14.1% + 0.4 ppt 17.0% 14.7% + 2.3 ppt
Restaurant 19.0% 20.8% - 1.8 ppt 23.5% - 0.2 ppt 21.2% 20.4% + 0.8 ppt
4orth - 3.6% - 4.3% + 0.7 ppt - 3.9% - 0.1 ppt - 3.8% 0.1% - 3.9 ppt
Net Profit 2.4 2.2 10.5% 1.2 106.4% 3.6 13.0 - 72.2%
Net Margin (%) 1.6% 1.5% + 0.1 ppt 0.8% + 1.1 ppt 1.2% 4.4% - 3.2 ppt
Core F&B Net Profit 2.4 2.2 10.5% 2.9 - 17.4% 5.4 3.9 38.9%
Core F&B Net Margin (%) 1.6% 1.5% + 0.1 ppt 2.0% - 0.2 ppt 1.8% 1.3% + 0.5 ppt
EPS (cents) # 0.43 0.39 10.3% 0.42 2.4% 0.86 3.08 - 72.1%
DPS (cents) # 0.50 0.50 0.0% - n.m. 0.50 1.50 - 66.7%# For comparison purpose, 2Q17's and 1H17's EPS and DPS have been split-adjusted.
3
2Q 2018 Financial Highlights
FINANCIAL PERFORMANCE
$0.2m $0.2m
($0.6m)
$0.2m $0.4m
($0.6m)
($0.4m)
($0.2m)
$0.0m
$0.2m
$0.4m
1Q17 2Q17 1H17
1H17
Legend
Share of Results of Joint Ventures
Share of Results of Associates
Total Share of Results
4
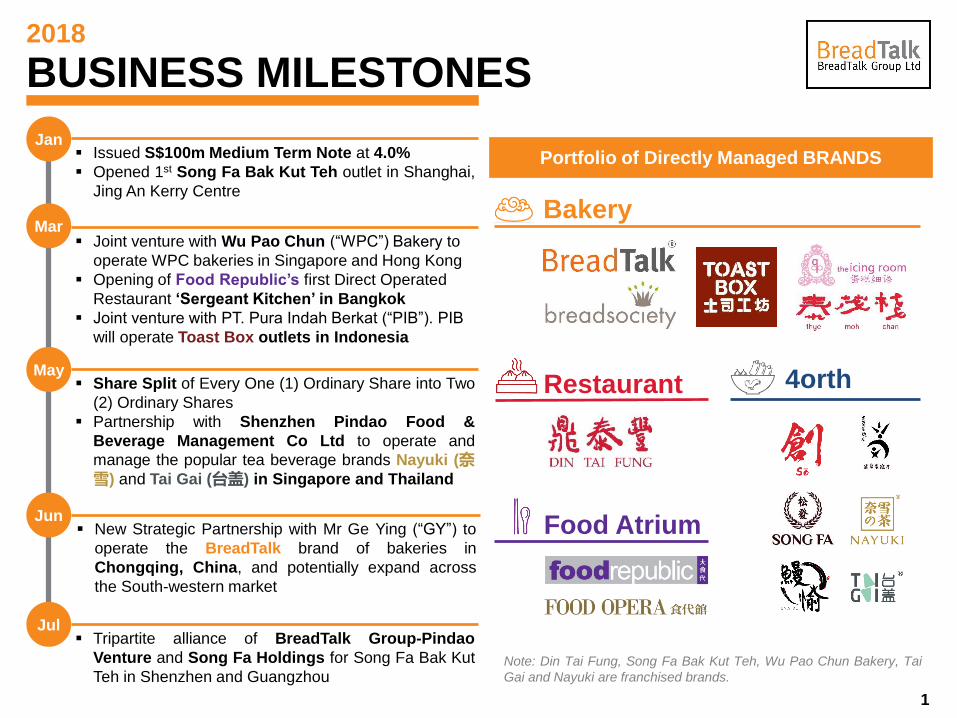
2Q 2018 Financial Highlights
SHARE OF ASSOC. & JV RESULTS
1H18
$0.3m
($0.2m)($0.3m)
($0.4m) ($0.5m)
($0.6m)
($0.4m)
($0.2m)
$0.0m
$0.2m
$0.4m
1Q18 2Q18 1H18
S$ Million 2Q18 2Q17 Y-o-Y 1H18 1H17 Y-o-Y
Share of Results (0.5) (0.2) 160.1% (0.5) 0.2 - 407.0%
Share of Assoc. Results (0.4) (0.6) - 36.4% (0.6) (0.4) 60.3%
Share of JV Results (0.2) 0.4 - 145.3% 0.1 0.6 - 81.4%
5
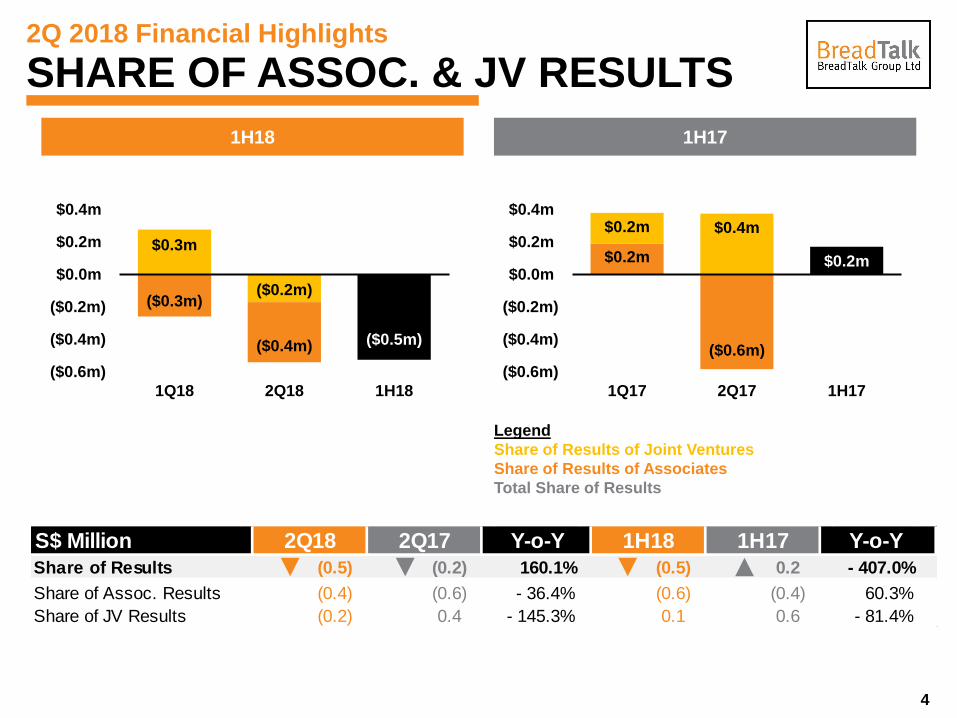
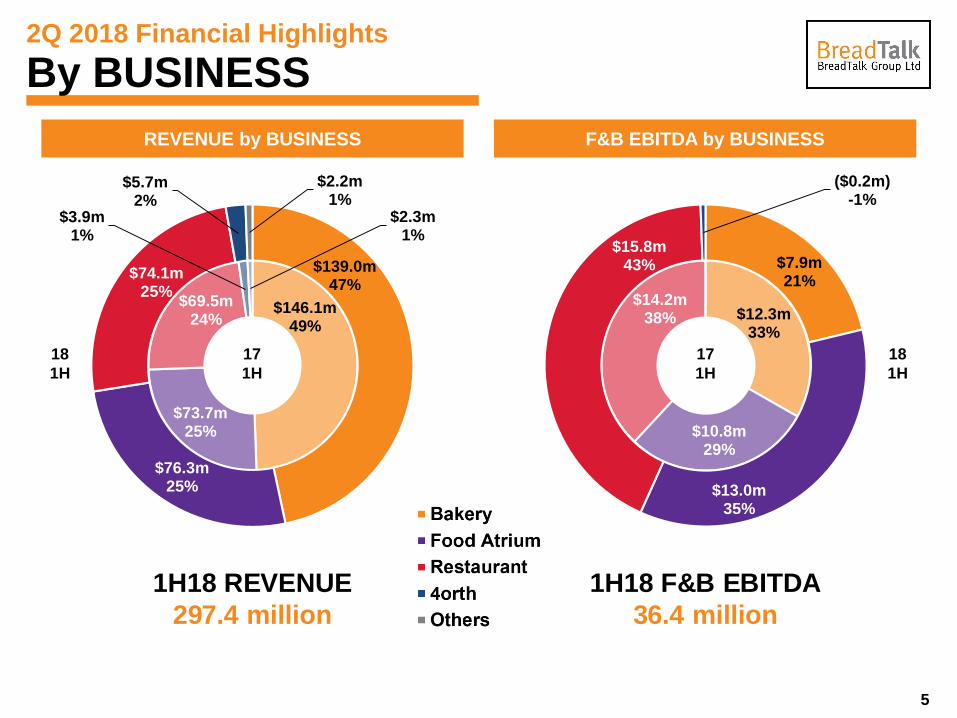
2Q 2018 Financial Highlights
By BUSINESS
REVENUE by BUSINESS F&B EBITDA by BUSINESS
$146.1m 49%
$73.7m 25%
$69.5m 24%
$3.9m 1%
$2.3m 1%
$139.0m 47%
$76.3m 25%
$74.1m 25%
$5.7m 2%
$2.2m 1%
17
1H
18
1H
1H18 REVENUE
297.4 million
$12.3m 33%
$10.8m 29%
$14.2m 38%
$7.9m 21%
$13.0m 35%
$15.8m 43%
($0.2m)-1%
17
1H
18
1H
1H18 F&B EBITDA
36.4 million

6
2Q 2018 Financial Highlights
By OUTLETS and GEOGRAPHY
OUTLET Distribution by BUSINESS FRANCHISE OUTLETS by GEOGRAPHY
REVENUE by GEOGRAPHY
$164m
$81m
$27m
$24m
$173m
$79m
$24m
$21m
247
193
55 4974
China Indonesia Philippines Thailand Others
1H
17
1H
18
Segment 2Q18 FY17Net
▲\▼2Q17
Net
▲\▼
Bakery 842 871 (29) 856 (14)
Direct Operating 224 240 (16) 259 (35)
Franchise 618 631 (13) 597 21
Food Atrium 53 53 0 56 (3)
Restaurant 27 25 2 24 3
Din Tai Fung 27 25 2 24 3
4orth 8 5 3 4 4
Sō # 5 5 0 4 1
Song Fa 2 0 2 0 2
Una-yu 1 0 1 0 1
Total 930 954 (24) 940 (10)
# Rebranded from Ramen Play in 1Q17
7
2Q 2018 Financial Highlights
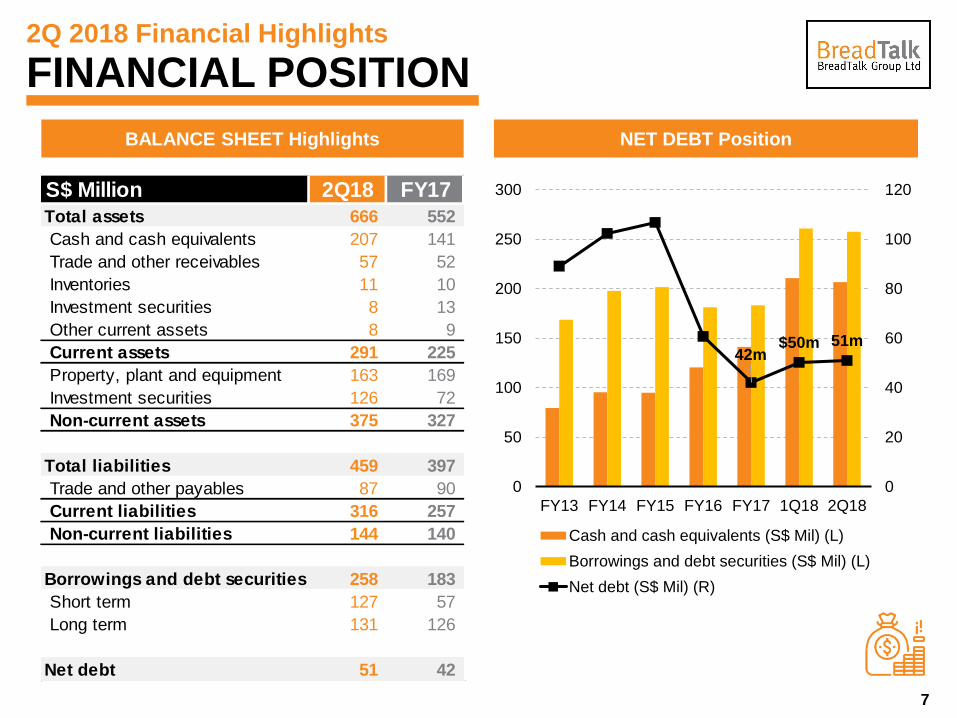
FINANCIAL POSITION
BALANCE SHEET Highlights NET DEBT Position
42m $50m 51m
0
20
40
60
80
100
120
0
50
100
150
200
250
300
FY13 FY14 FY15 FY16 FY17 1Q18 2Q18
Cash and cash equivalents (S$ Mil) (L)
Borrowings and debt securities (S$ Mil) (L)
Net debt (S$ Mil) (R)
S$ Million 2Q18 FY17
Total assets 666 552
Cash and cash equivalents 207 141
Trade and other receivables 57 52
Inventories 11 10
Investment securities 8 13
Other current assets 8 9
Current assets 291 225
Property, plant and equipment 163 169
Investment securities 126 72
Non-current assets 375 327
Total liabilities 459 397
Trade and other payables 87 90
Current liabilities 316 257
Non-current liabilities 144 140
Borrowings and debt securities 258 183
Short term 127 57
Long term 131 126
Net debt 51 42
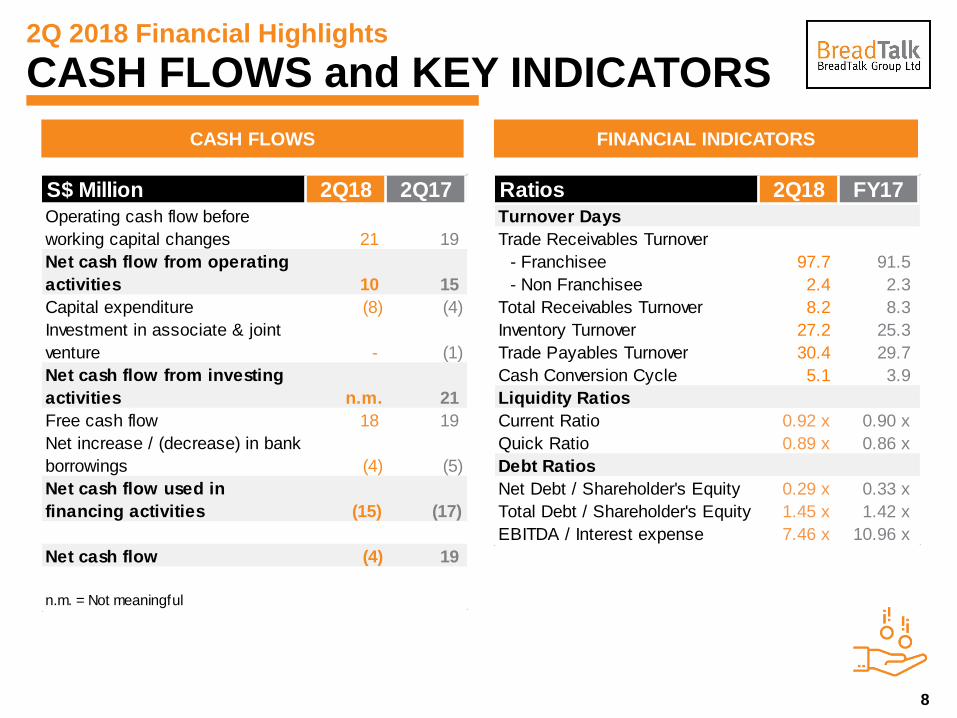
S$ Million 2Q18 2Q17
Operating cash flow before
working capital changes 21 19
Net cash flow from operating
activities 10 15
Capital expenditure (8) (4)
Investment in associate & joint
venture - (1)
Net cash flow from investing
activities n.m. 21
Free cash flow 18 19
Net increase / (decrease) in bank
borrowings (4) (5)
Net cash flow used in
financing activities (15) (17)
Net cash flow (4) 19
n.m. = Not meaningful
8
2Q 2018 Financial Highlights
CASH FLOWS and KEY INDICATORS
CASH FLOWS FINANCIAL INDICATORS
Ratios 2Q18 FY17
Turnover Days
Trade Receivables Turnover
- Franchisee 97.7 91.5
- Non Franchisee 2.4 2.3
Total Receivables Turnover 8.2 8.3
Inventory Turnover 27.2 25.3
Trade Payables Turnover 30.4 29.7
Cash Conversion Cycle 5.1 3.9
Liquidity Ratios
Current Ratio 0.92 x 0.90 x
Quick Ratio 0.89 x 0.86 x
Debt Ratios
Net Debt / Shareholder's Equity 0.29 x 0.33 x
Total Debt / Shareholder's Equity 1.45 x 1.42 x
EBITDA / Interest expense 7.46 x 10.96 x

37%
49%
10%
4%
9
Business Overview
BAKERY DIVISION
REVENUE and OUTLET Growth
EBITDA and EBITDA Margin
23.2m
12.3m 7.9m
7.8% 8.5%
5.7%
0%
5%
10%
0
10
20
30
40
FY13 FY14 FY15 FY16 FY17 1H17 1H18
EBITDA (S$ Mil) EBITDA Margin (%)
297.2m
146.1m 139.0m
871856
842
700
750
800
850
900
50
150
250
350
FY13 FY14 FY15 FY16 FY17 1H17 1H18
Revenue (S$ Mil) No. of Outlets
1H18 REVENUE
* SEA and International: Indonesia, Philippines,
Thailand, Vietnam, Sri Lanka, Cambodia, KSA West,
Kuwait, Oman, Bahrain, Myanmar and Malaysia
1H18 OUTLETS
324
122
22
374
1H18 REVENUE 1H18 OUTLETS
10
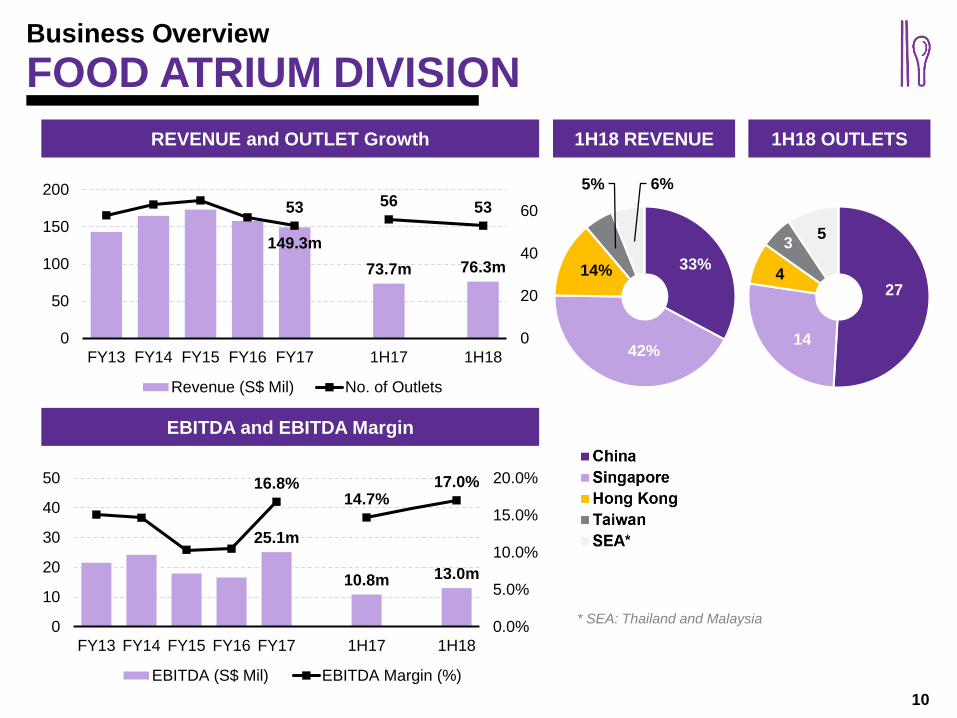
Business Overview
FOOD ATRIUM DIVISION
25.1m
10.8m 13.0m
16.8%14.7%
17.0%
0.0%
5.0%
10.0%
15.0%
20.0%
0
10
20
30
40
50
FY13 FY14 FY15 FY16 FY17 1H17 1H18
EBITDA (S$ Mil) EBITDA Margin (%)
149.3m
73.7m 76.3m
53 56 53
0
20
40
60
0
50
100
150
200
FY13 FY14 FY15 FY16 FY17 1H17 1H18
Revenue (S$ Mil) No. of Outlets
33%
42%
14%
5% 6%
* SEA: Thailand and Malaysia
REVENUE and OUTLET Growth
EBITDA and EBITDA Margin
27
14
4
3 5

1H18 REVENUE 1H18 OUTLETS
11
Business Overview
RESTAURANT DIVISION
30.1m 14.2m 15.8m
21.4% 20.4% 21.2%
0%
10%
20%
30%
0
10
20
30
40
50
FY13 FY14 FY15 FY16 FY17 1H17 1H18
EBITDA (S$ Mil) EBITDA Margin (%)
140.7m 69.5m 74.1m
25 2427
0
10
20
30
40
0
50
100
150
200
FY13 FY14 FY15 FY16 FY17 1H17 1H18
Revenue (S$ Mil) No. of Outlets
90%
10%
REVENUE and OUTLET Growth
EBITDA and EBITDA Margin
22
5

1H18 REVENUE 1H18 OUTLETS
12
Business Overview
4ORTH DIVISION
0.5m 0.0m
(0.2m)
6.8%
0.1%
-3.8%
-15%
-5%
5%
(3)
(2)
(1)
0
1
2
FY13 FY14 FY15 FY16 FY17 1H17 1H18
EBITDA (S$ Mil) EBITDA Margin (%)
7.9m 3.9m
5.7m
54
8
0
5
10
15
0
5
10
15
20
25
FY13 FY14 FY15 FY16 FY17 1H17 1H18
Revenue (S$ Mil) No. of Outlets
72%
28%
REVENUE and OUTLET Growth
EBITDA and EBITDA Margin
5
3

THANK YOU
For enquiries, please contact:
CHAN Ying JianGroup Chief Financial Officer
POH Kah HweeInvestor Relations
T : +65 6285 6116
13