Embed Size (px)
Citation preview
Second half 2004 and annual results
Pierre LéviPierre-Jean Sivignon 2005
17 February

2Second half 2004 and annual resultsProperty of Faurecia - duplication prohibited
Continued improvements
2H 2004 FY 2004Organic growth continues to surpass the auto market +7.2% +7.9%
Operating margin increases +0.3 pt +0.4 pt
Net debt declines €169m €198m
Net income 51.8 83.7 (x8)
Net income, excluding capital gains 20.8 52.7 (x5)

3Second half 2004 and annual resultsProperty of Faurecia - duplication prohibited
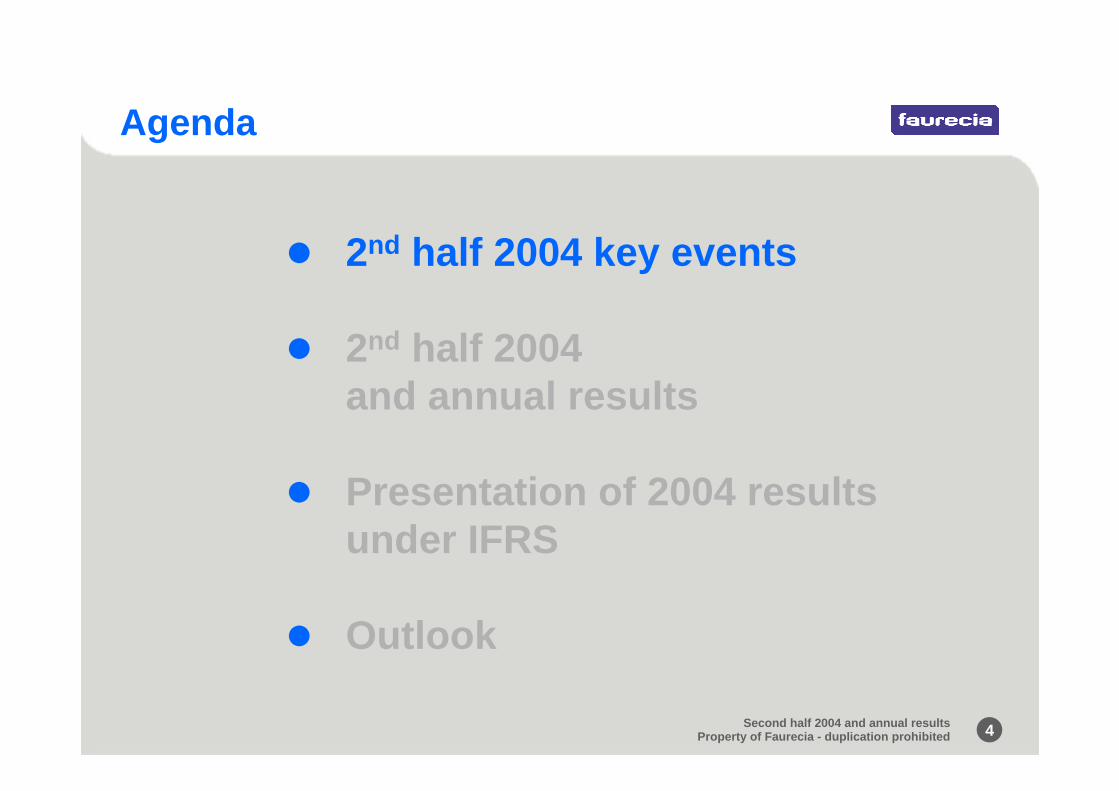
Agenda
2nd half 2004 key events
2nd half 2004 and annual results
Presentation of 2004 resultsunder IFRS
Outlook
4Second half 2004 and annual resultsProperty of Faurecia - duplication prohibited
Agenda
2nd half 2004 key events
2nd half 2004 and annual results
Presentation of 2004 resultsunder IFRS
Outlook

5Second half 2004 and annual resultsProperty of Faurecia - duplication prohibited
Europe
North America
South America
China
2H 1H
> Change in volume per geographic region
2004 vs. 2003
Automotive production was flat in the 2nd half 2004
2004 vs. 2003
source : Faurecia
(0.2%) 1.6% 0.7%
(1.6%) 0.1% (0.7%)
26.8% 17.3% 22.2%
(6.7%) 37.1% 13.2%

6Second half 2004 and annual resultsProperty of Faurecia - duplication prohibited
*excluding catalytic converters at comparable sales and exchange rates
+15.0%
+12.0%
+8.4%
1H 2002 2H 2002
+4.0% +4.4%
1H 2003 2H 2003 1H 2004
1.6%
(1.3%)(4.3)%
+2.2%
Faureciasales*
European automotiveproduction(1.3%)
2H 2004
+7.2%
Our sales growth continues to outpace the European market
(0.2%)

7Second half 2004 and annual resultsProperty of Faurecia - duplication prohibited
Organic growth in all business activities
(in €m) 2H2004
% Change 2H 2003
FY2004
% Change 2003
Interior vehicle modules Automotive Seating 2,309.0 8.7% 4,784.7 9.9%
- at constant exchange rates 9.4% 10.8%Vehicle Interior 1,693.3 2.0% 3,500.9 (0.1%)
- at comparable sales and exchange rates 4.3% 4.1%
Other modulesExhaust Systems 840.7 11.6% 1,714.9 8.0%
- excluding catalytic converters and 490.3 2.9% 1,020.0 5.2% at comparable sales and exchange rates 10.1% 8.9%
Front end 355.9 4.0% 719.0 6.4%- at constant exchange rates 4.0% 6.4%
Total 5,198.9 6.5% 10,719.5 5.9%- excluding catalytic converters and 4,848.5 5.3% 10,024.6 5.5%at comparable sales and exchange rates 7.2% 7.9%
8Second half 2004 and annual resultsProperty of Faurecia - duplication prohibited
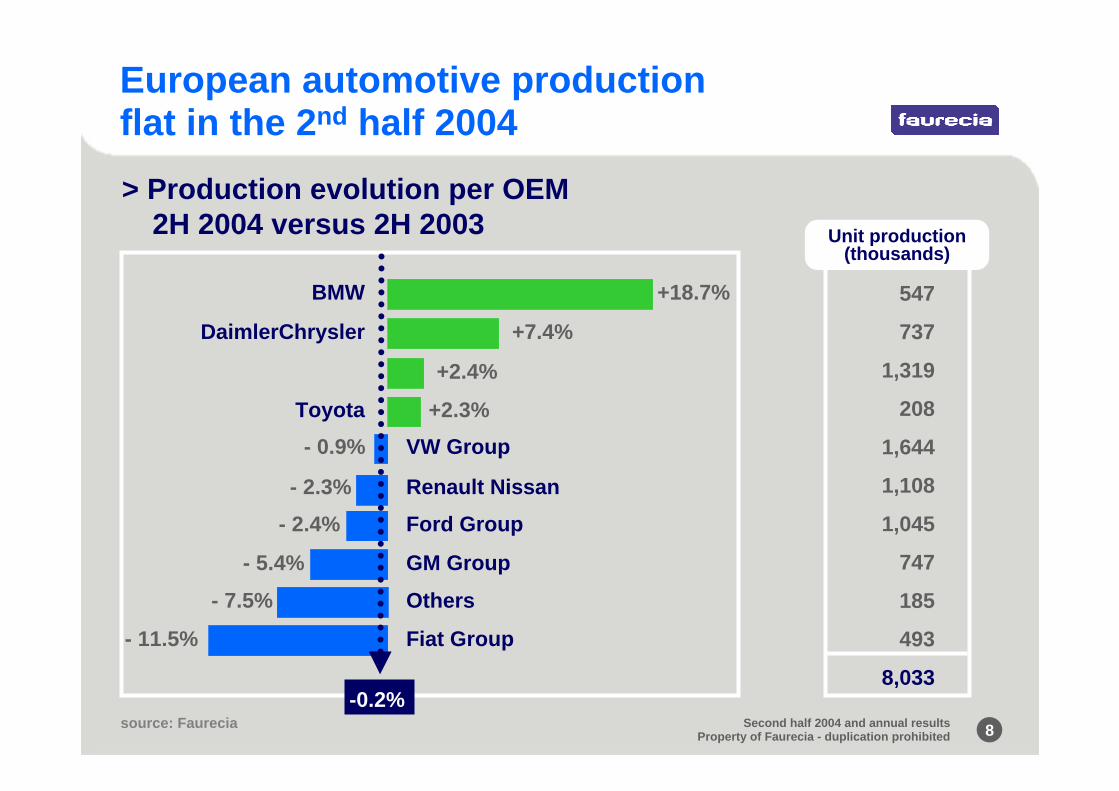
European automotive production flat in the 2nd half 2004> Production evolution per OEM
2H 2004 versus 2H 2003
source: Faurecia
Toyota +2.3%
547
737
1,319
208
1,644
1,108
1,045
747
185
493
8,033
Unit production(thousands)
+18.7%BMW
DaimlerChrysler
Fiat Group
Ford Group
GM Group
VW Group
Renault Nissan
- 2.4%
- 2.3%
- 0.9%
+2.4%
+7.4%
Others- 7.5%
- 5.4%
-0.2%
- 11.5%
9Second half 2004 and annual resultsProperty of Faurecia - duplication prohibited
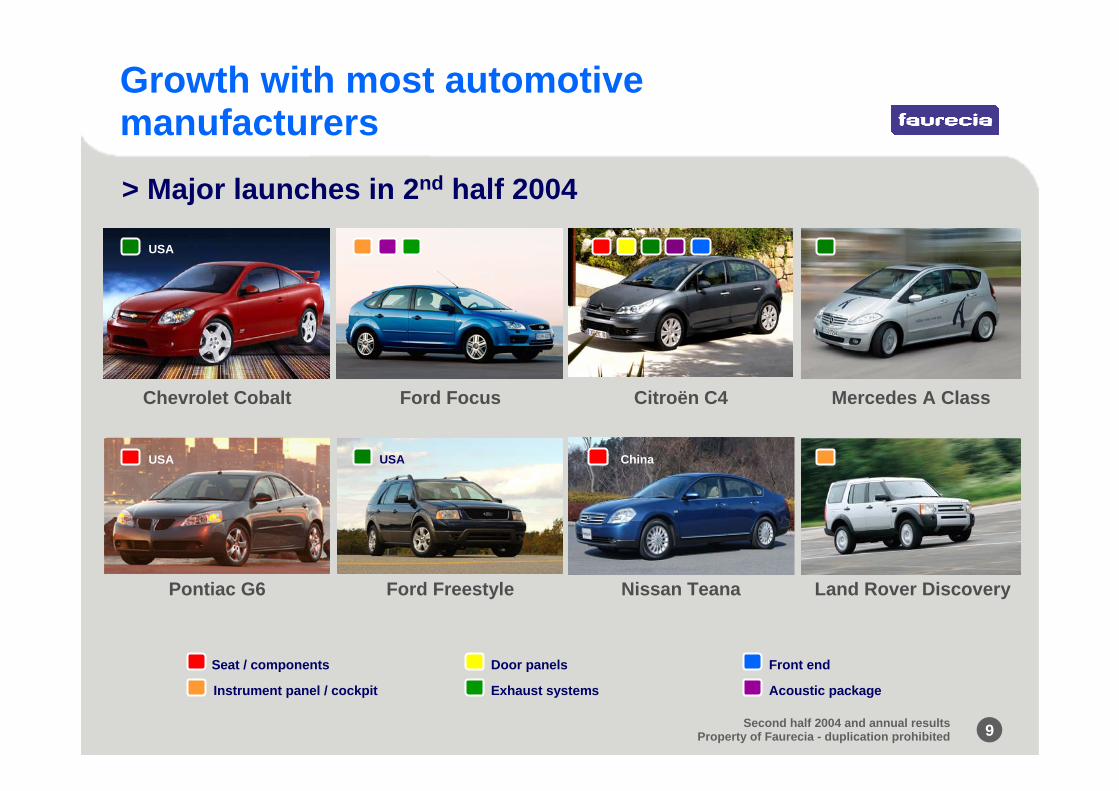
Pontiac G6 Land Rover Discovery
Seat / components
Instrument panel / cockpit
Door panels
Exhaust systems
Front end
Acoustic package
Ford Freestyle Nissan Teana
> Major launches in 2nd half 2004
USA
USA USA China
Citroën C4Chevrolet Cobalt Ford Focus Mercedes A Class
Growth with most automotive manufacturers

10Second half 2004 and annual resultsProperty of Faurecia - duplication prohibited
432.4
451.9
77.1
1,490.2
394.2
307.9
1,129.6
692.9
222.7
5,198.9
Sales increase with most OEMs
DaimlerChrysler
PSA Peugeot Citroën
Ford
Toyota
Others
Renault Nissan
GM
BMW
VW
+39.2%
+3.1%
+12.7%
+15.6%
+14.0%
+19.3%
+0.9%
- 0.5%
- 4.1%
> Sales evolution per OEM2H 2004 versus 2H 2003
+6.5%
Sales perOEM (in €m)
source: Faurecia

11Second half 2004 and annual resultsProperty of Faurecia - duplication prohibited
Strong sales growth outside Europe
2H 2004
FY 2004
North America
+14%
+9%
Asia
+67%
+118%
South America
+36%+27%
> Sales per geographic region (local currency)

12Second half 2004 and annual resultsProperty of Faurecia - duplication prohibited
Disposal of non-core business in 2nd half 2004
Mechanics and Environment - Steering Columns
Sales (annual basis) €170m
Employees 950
Cash impact + €82m
Net capital gain (after tax) + €31m

13Second half 2004 and annual resultsProperty of Faurecia - duplication prohibited
1. Manufacturing process and redeploying the industrial footprint
2. Purchasing plan
3. Program management
4. R&D efficiency
Continued progress on improvement plans
14Second half 2004 and annual resultsProperty of Faurecia - duplication prohibited
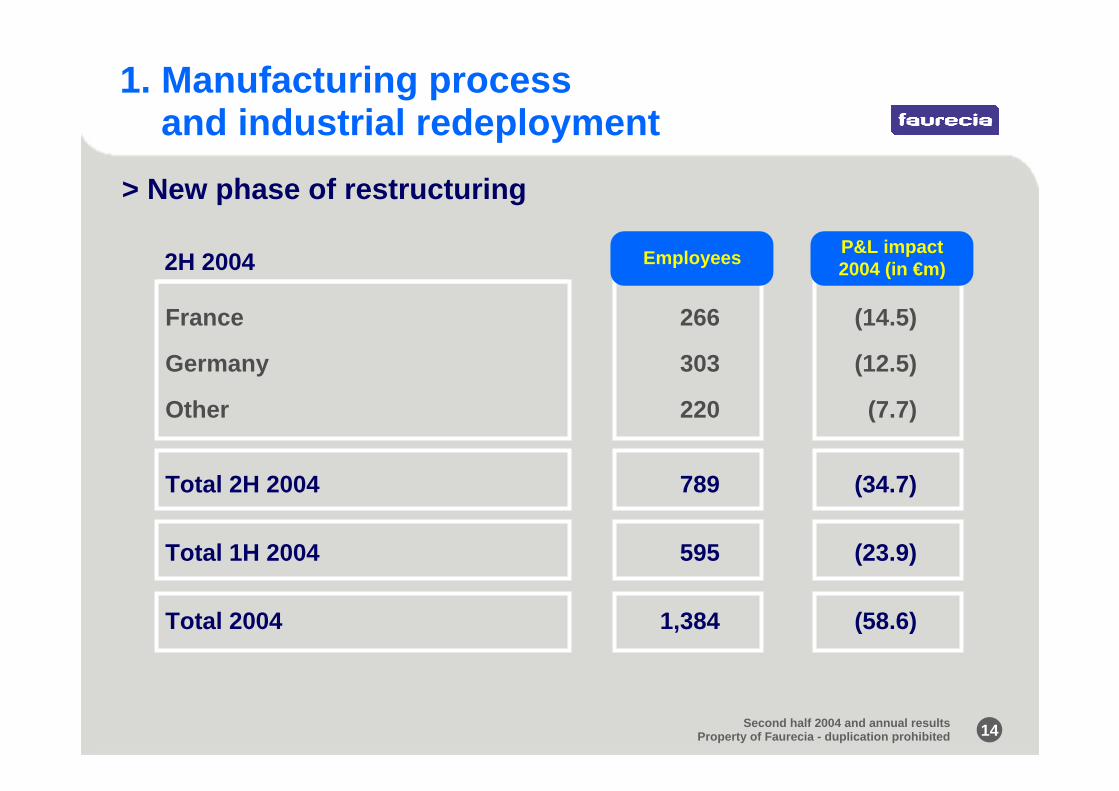
France 266 (14.5)
Germany 303 (12.5)
Other 220 (7.7)
Total 2H 2004 789 (34.7)
Total 1H 2004 595 (23.9)
Total 2004 1,384 (58.6)
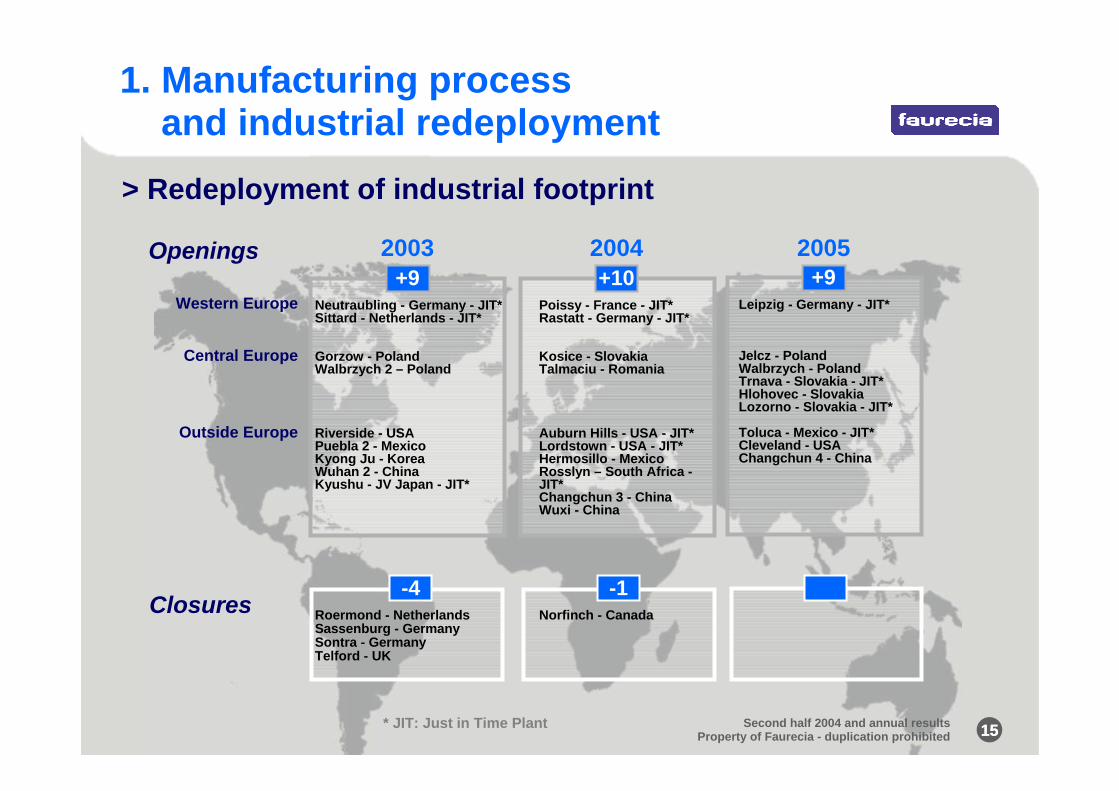
1. Manufacturing process and industrial redeployment
P&L impact 2004 (in €m)2H 2004
> New phase of restructuring
Employees
15Second half 2004 and annual resultsProperty of Faurecia - duplication prohibited
2003+9
2004+10
Neutraubling - Germany - JIT*Sittard - Netherlands - JIT*
Gorzow - PolandWalbrzych 2 – Poland
Riverside - USAPuebla 2 - MexicoKyong Ju - KoreaWuhan 2 - ChinaKyushu - JV Japan - JIT*
Poissy - France - JIT*Rastatt - Germany - JIT*
Kosice - SlovakiaTalmaciu - Romania
Auburn Hills - USA - JIT*Lordstown - USA - JIT*Hermosillo - MexicoRosslyn – South Africa -JIT*Changchun 3 - ChinaWuxi - China
Roermond - NetherlandsSassenburg - GermanySontra - GermanyTelford - UK
-4Norfinch - Canada
-1
15
2005+9
Leipzig - Germany - JIT*
Jelcz - PolandWalbrzych - PolandTrnava - Slovakia - JIT*Hlohovec - SlovakiaLozorno - Slovakia - JIT*
Toluca - Mexico - JIT*Cleveland - USAChangchun 4 - China
* JIT: Just in Time Plant
Openings
Closures
> Redeployment of industrial footprint
1. Manufacturing process and industrial redeployment
Western Europe
Central Europe
Outside Europe
Second half 2004 and annual resultsProperty of Faurecia - duplication prohibited

16Second half 2004 and annual resultsProperty of Faurecia - duplication prohibited
67
36
100
48
29
2002 2003 2004
100
Safety
Quality
> Improvement in industrial practices
1. Manufacturing process and industrial redeployment
Index: 2002 = 100
17Second half 2004 and annual resultsProperty of Faurecia - duplication prohibited
2. Purchasing plan
Reduced number of suppliers
Increased sourcing in low-cost countries
Wider use of e-purchasing
Improved quality of purchased parts
> Key actions in 2004
18Second half 2004 and annual resultsProperty of Faurecia - duplication prohibited
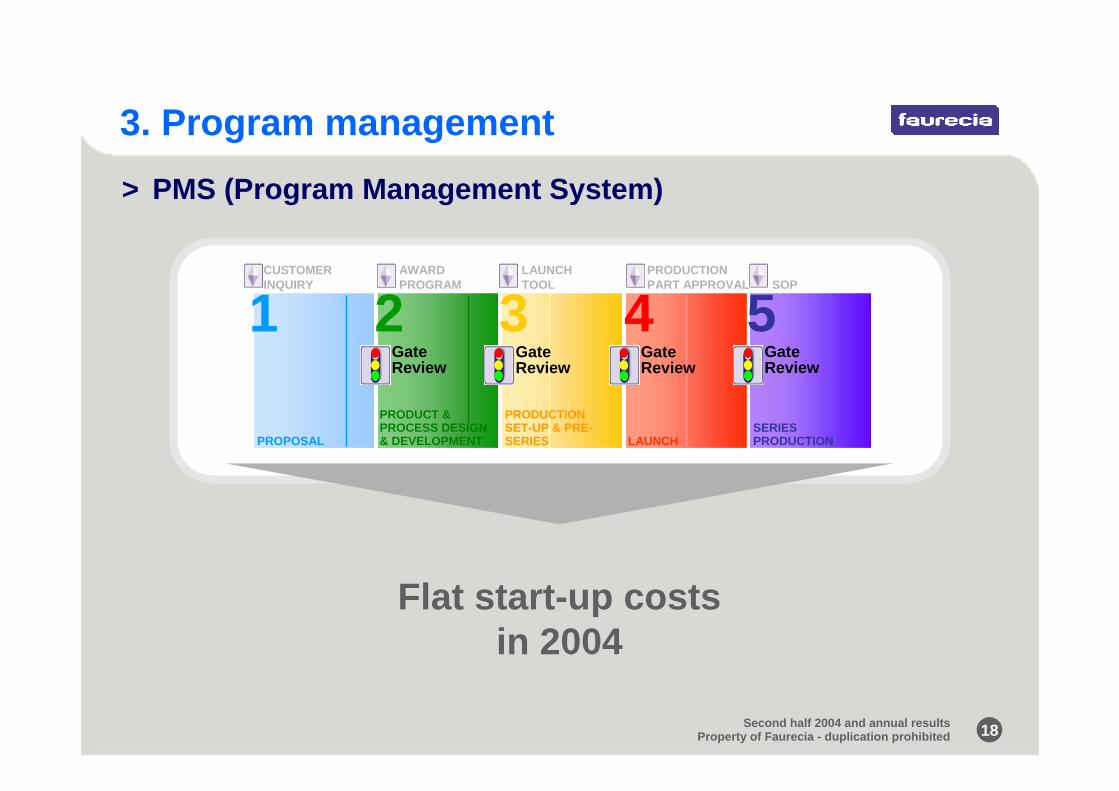
3. Program management
Flat start-up costs in 2004
5
SERIES PRODUCTION
Gate Review
4SOP
Gate Review
3PRODUCTION SET-UP & PRE-SERIES
Gate Review
2PRODUCT & PROCESS DESIGN & DEVELOPMENT
Gate Review
1CUSTOMER INQUIRY
AWARD PROGRAM
PROPOSAL LAUNCH
> PMS (Program Management System)
LAUNCHTOOL
PRODUCTION PART APPROVAL

19Second half 2004 and annual resultsProperty of Faurecia - duplication prohibited
4. R&D efficiency
Opening of D&D center in Japan (Shin-Yokohama)
"1,000 ideas" initiative: 50% achieved
Key R&D Figures
5,000 engineers / technicians28 R&D / D&D centers5.6% of 2004 sales

20Second half 2004 and annual resultsProperty of Faurecia - duplication prohibited
Agenda
2nd half 2004 key events
2nd half 2004 and annual results
Presentation of 2004 resultsunder IFRS
Outlook
21Second half 2004 and annual resultsProperty of Faurecia - duplication prohibited
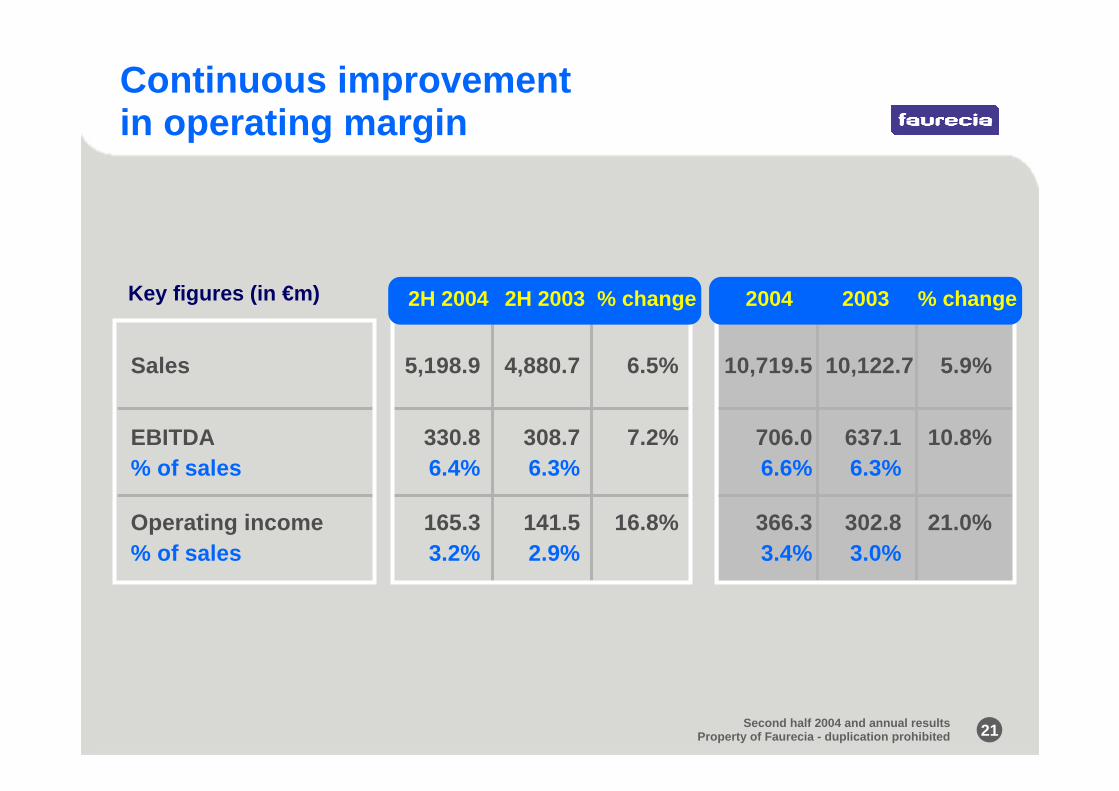
Continuous improvement in operating margin
Sales 5,198.9 4,880.7 6.5%
EBITDA 330.8 308.7 7.2%% of sales 6.4% 6.3%
Operating income 165.3 141.5 16.8% % of sales 3.2% 2.9%
10,719.5 10,122.7 5.9%
706.0 637.1 10.8%6.6% 6.3%
366.3 302.8 21.0%3.4% 3.0%
Key figures (in €m) 2004 2003 % change2H 2004 2H 2003 % change
22Second half 2004 and annual resultsProperty of Faurecia - duplication prohibited
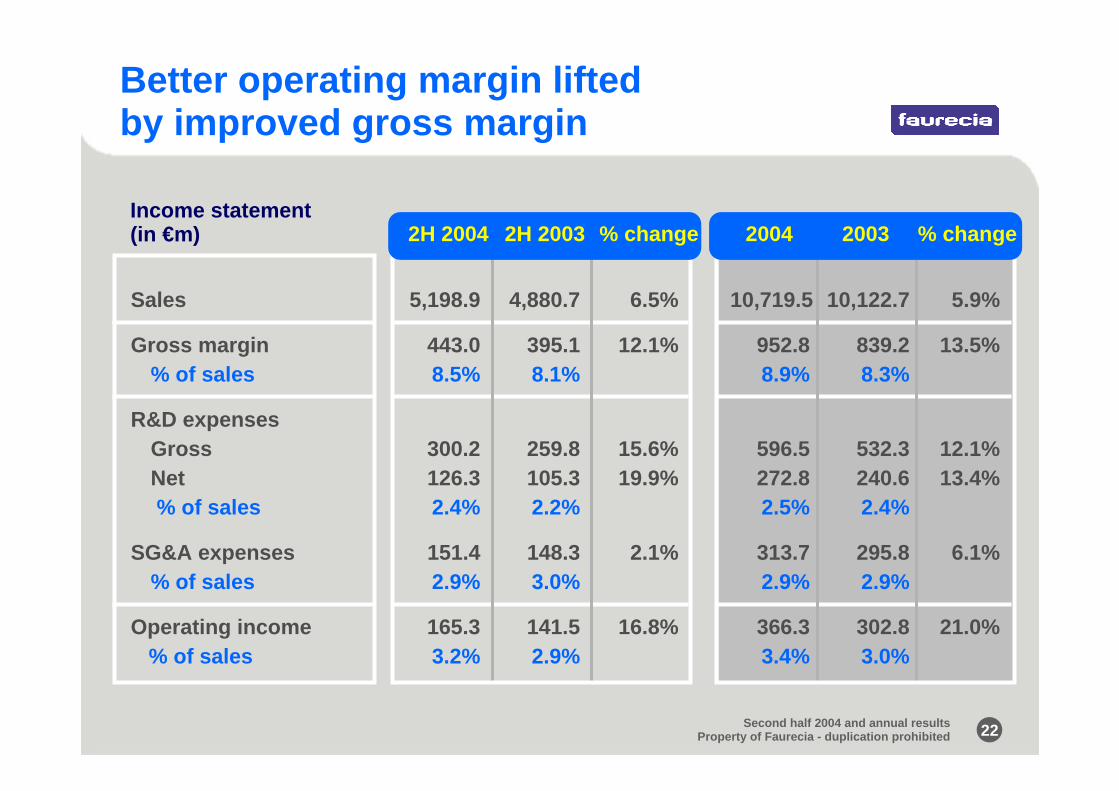
Better operating margin liftedby improved gross margin
Sales 5,198.9 4,880.7 6.5%
Gross margin 443.0 395.1 12.1%% of sales 8.5% 8.1%
R&D expensesGross 300.2 259.8 15.6%Net 126.3 105.3 19.9%% of sales 2.4% 2.2%
SG&A expenses 151.4 148.3 2.1%% of sales 2.9% 3.0%
Operating income 165.3 141.5 16.8%% of sales 3.2% 2.9%
10,719.5 10,122.7 5.9%
952.8 839.2 13.5%8.9% 8.3%
596.5 532.3 12.1%272.8 240.6 13.4%2.5% 2.4%
313.7 295.8 6.1%2.9% 2.9%
366.3 302.8 21.0%3.4% 3.0%
2004 2003 % change2H 2004 2H 2003 % changeIncome statement(in €m)
23Second half 2004 and annual resultsProperty of Faurecia - duplication prohibited
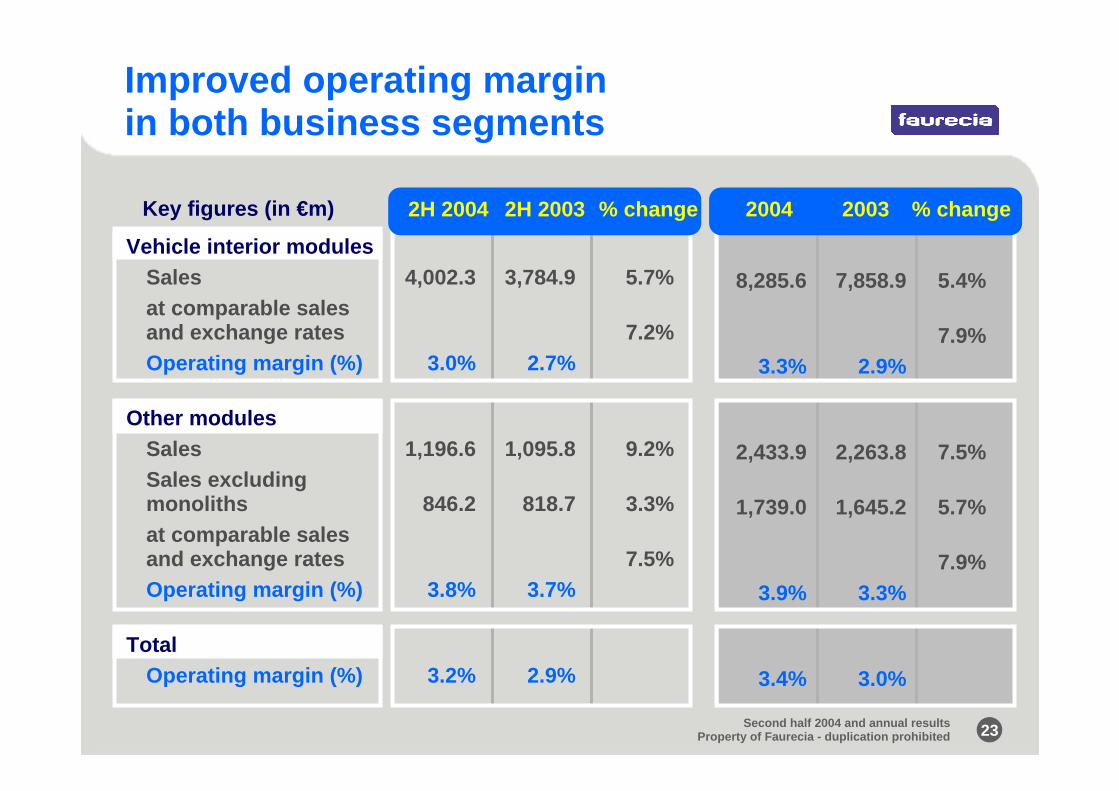
Improved operating margin in both business segments
Key figures (in €m) 2004 2003 % change2H 2004 2H 2003 % change
8,285.6 7,858.9 5.4%
7.9%3.3% 2.9%
2,433.9 2,263.8 7.5%
1,739.0 1,645.2 5.7%
7.9%3.9% 3.3%
3.4% 3.0%
Vehicle interior modules Sales 4,002.3 3,784.9 5.7%at comparable sales and exchange rates 7.2%Operating margin (%) 3.0% 2.7%
Other modulesSales 1,196.6 1,095.8 9.2% Sales excluding monoliths 846.2 818.7 3.3%at comparable sales and exchange rates 7.5%Operating margin (%) 3.8% 3.7%
TotalOperating margin (%) 3.2% 2.9%
24Second half 2004 and annual resultsProperty of Faurecia - duplication prohibited
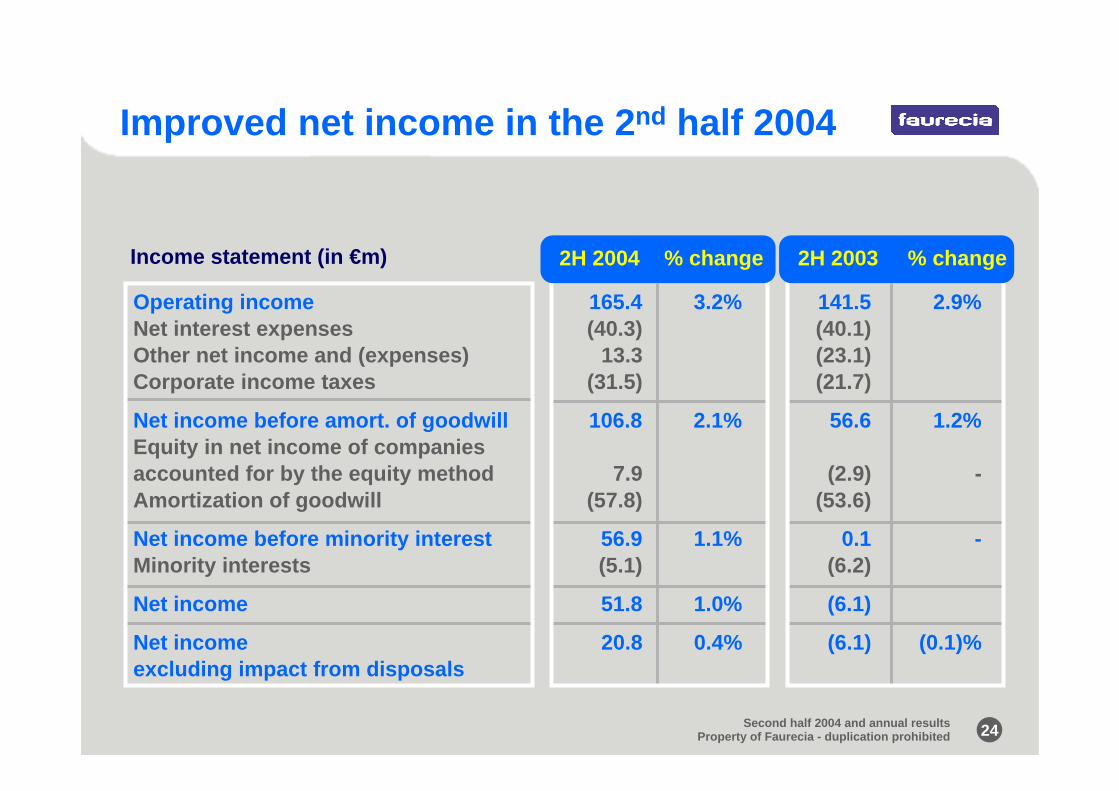
Improved net income in the 2nd half 2004
Operating income 165.4 3.2% 141.5 2.9%Net interest expenses (40.3) (40.1)Other net income and (expenses) 13.3 (23.1)Corporate income taxes (31.5) (21.7)
Net income before amort. of goodwill 106.8 2.1% 56.6 1.2%Equity in net income of companies accounted for by the equity method 7.9 (2.9) -Amortization of goodwill (57.8) (53.6)
Net income before minority interest 56.9 1.1% 0.1 -Minority interests (5.1) (6.2)
Net income 51.8 1.0% (6.1)
Net income 20.8 0.4% (6.1) (0.1)%excluding impact from disposals
2H 2003 % change2H 2004 % changeIncome statement (in €m)

25Second half 2004 and annual resultsProperty of Faurecia - duplication prohibited
Strong rise in net income
Operating income 366.3 3.4% 302.8 3.0%Net interest expenses (74.2) (82.9)Other net income and (expenses) (17.5) (32.7)Corporate income taxes (72.4) (54.7)
Net income before amort. of goodwill 202.2 1.9% 132.5 1.3%Equity in net income of companies accounted for by the equity method 7.3 1.3 -Amortization of goodwill (114.6) (110.4)
Net income before minority interest 94.9 0.9% 23.4 0.2%Minority interests (11.2) (13.3)
Net income 83.7 10.1
Net income excluding impact from disposals 52.7 10.1
2003 %2004 %Income statement (in €m)
26Second half 2004 and annual resultsProperty of Faurecia - duplication prohibited
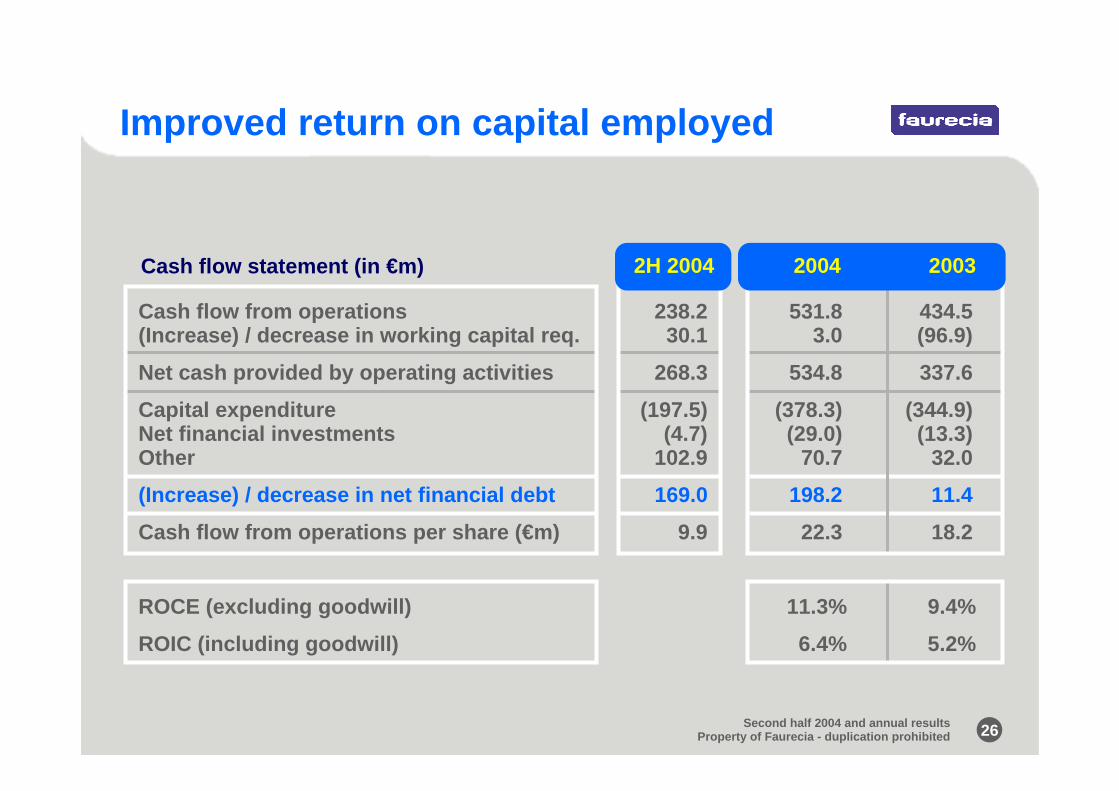
Improved return on capital employed
Cash flow statement (in €m)
531.8 434.53.0 (96.9)
534.8 337.6
(378.3) (344.9)(29.0) (13.3)
70.7 32.0
198.2 11.4
22.3 18.2
2004 20032H 2004
Cash flow from operations 238.2(Increase) / decrease in working capital req. 30.1
Net cash provided by operating activities 268.3
Capital expenditure (197.5)Net financial investments (4.7)Other 102.9
(Increase) / decrease in net financial debt 169.0
Cash flow from operations per share (€m) 9.9
ROCE (excluding goodwill) 11.3% 9.4%
ROIC (including goodwill) 6.4% 5.2%

27Second half 2004 and annual resultsProperty of Faurecia - duplication prohibited
31 December2002
31 December2003
31 December2004
Reduction in debt
31 December2002
1,707.1 1,695.7
31 December2003
31 December2004
Net financial debt (in €m) Gearing
0.90 0.93
0.791,497.5

28Second half 2004 and annual resultsProperty of Faurecia - duplication prohibited
Agenda
2nd half 2004 key events
2nd half 2004 and annual results
Presentation of 2004 resultsunder IFRS
Outlook
29Second half 2004 and annual resultsProperty of Faurecia - duplication prohibited
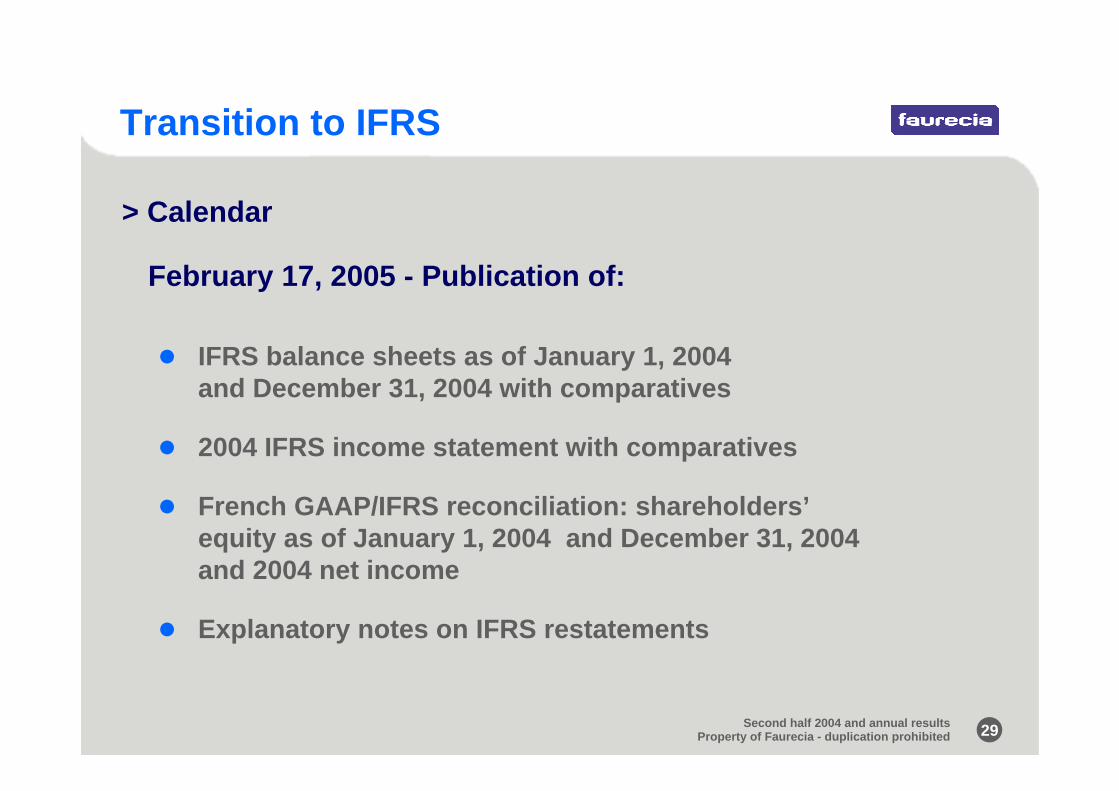
IFRS balance sheets as of January 1, 2004 and December 31, 2004 with comparatives
2004 IFRS income statement with comparatives
French GAAP/IFRS reconciliation: shareholders’equity as of January 1, 2004 and December 31, 2004and 2004 net income
Explanatory notes on IFRS restatements
> Calendar
February 17, 2005 - Publication of:
Transition to IFRS
30Second half 2004 and annual resultsProperty of Faurecia - duplication prohibited
July 21, 2005Publication of IFRS interim financial statements ending June 30, 2005, with 2004 first-half and 2004 full-year comparatives
Transition to IFRS
> Calendar

31Second half 2004 and annual resultsProperty of Faurecia - duplication prohibited
Usual position:
Development costs recognized as intangible assets
Amortization of development costs included in EBITDA
In some cases, contractual terms require development costs to be recognized as inventory
Transition to IFRS
Order-specific development costs (IAS 38)1

32Second half 2004 and annual resultsProperty of Faurecia - duplication prohibited
Transition to IFRS
Development costs (IAS 38)
Impact on 2004 operating margin €4.5m
Impact on balance sheet as of January 1, 2004 (in €m)
Intangible assets 426.6
Inventories
3.9
(422.7)
1
Shareholders’ equity 3.9(before tax effect)
3.9

33Second half 2004 and annual resultsProperty of Faurecia - duplication prohibited
In some cases, contractual terms will require recognition in property, plant and equipment
Transition to IFRS
Order-specific tooling (IAS 16)2
No impact on 2004 net income
Impact on balance sheet as of January 1, 2004 (in €m)
Property, plant & equipment 25.9
Inventories (25.9)
0

34Second half 2004 and annual resultsProperty of Faurecia - duplication prohibited
For acquisitions after January 2001
Elimination of goodwill amortization (straight line over 20 years) recognized since 2001
Restatement of goodwill
Valuation of assets and liabilities identifiable at the time of acquisition, with advice from independent expert
Amortization of identifiable intangible assets
Transition to IFRS
Business combinations (IFRS 1 & 3)3
For acquisitions prior to January 2001, eliminationof amortization from January 1, 2004

35Second half 2004 and annual resultsProperty of Faurecia - duplication prohibited
Goodwill (254.8)Contractual customer relationship
(135.4)
Transition to IFRS
Business combinations (IFRS 1 & 3)3Impact on balance sheet as of January 1, 2004 (in €m)
119.4
Impact on operating income
Amortization of contractual customer relationship: (€119.4m)
Shareholders’ equity (135.4)(before tax effect)
(135.4)
Acquisitions after January 2001:- Amortization of contractual customer relationship- Elimination of goodwill amortization €62.1m
Acquisitions prior to January 2001:- Elimination of goodwill amortization €52.5m
Impact on 2004 net income (before tax effect)
(€4.8m)
(€119.4m)
36Second half 2004 and annual resultsProperty of Faurecia - duplication prohibited
Transition to IFRS
For all acquisitions, impairment test at least once a year (IAS 36)
Impairment test on goodwill (IAS 36)4

37Second half 2004 and annual resultsProperty of Faurecia - duplication prohibited
Actuarial gains and losses offset against shareholders’ equity as of January 1, 2004
In the future, the impact of discounting and of the return on pension plan assets will be included in net interest expenses
Transition to IFRS
Retirement benefit obligations (IFRS 1 & IAS 19)5

38Second half 2004 and annual resultsProperty of Faurecia - duplication prohibited
Transition to IFRS
Retirement benefit obligations (IFRS 1 & IAS 19)5
Shareholders’ equity (125.8) (before tax effect)
Retirement benefits
Debt (7.6)
Other liabilities
Impact on balance sheet as of January 1, 2004 (in €m)
Impact on 2004 net income (before tax effect) €6.6m
119.8
13.6
0
Impact on 2004 operating margin €16.3m
39Second half 2004 and annual resultsProperty of Faurecia - duplication prohibited
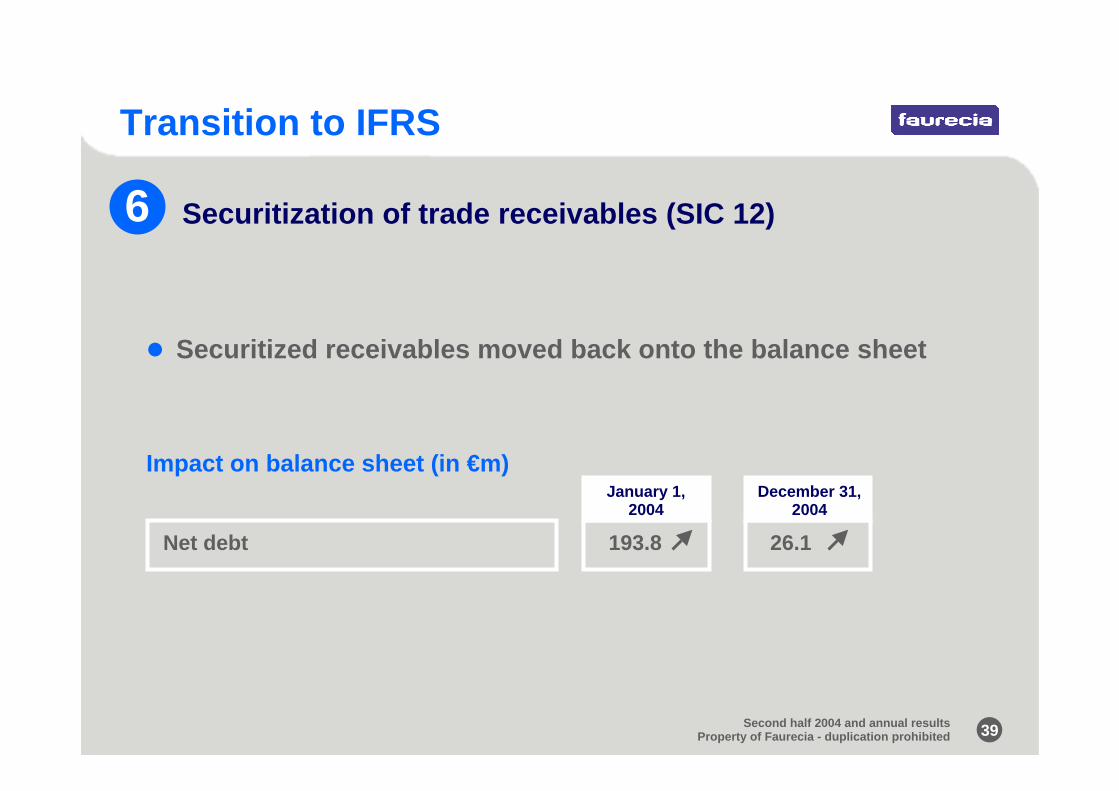
Securitized receivables moved back onto the balance sheet
Transition to IFRS
Securitization of trade receivables (SIC 12)
Net debt 193.8 26.1
January 1, 2004
December 31, 2004
Impact on balance sheet (in €m)
6

40Second half 2004 and annual resultsProperty of Faurecia - duplication prohibited
Revision of depreciation periods for property, plant and equipment, with assets split into separate components
Transition to IFRS
Property, plant & equipment and depreciation (IAS 16)7
Impact on balance sheet as of January 1, 2004
Impact on 2004 operating margin €15m
Shareholders’ equity (before tax effect) (€0.3m)

41Second half 2004 and annual resultsProperty of Faurecia - duplication prohibited
A number of contracts reclassified as finance leases- Property lease obligations- Forklift fleet
Transition to IFRS
Leases (IAS 17)
Impact on balance sheet as of January 1, 2004 (in €m)
PP&E 25.9 Debt 25.9
Impact on 2004 operating margin €2.2m
8
Impact on 2004 net income (before tax effect) €0.4m

42Second half 2004 and annual resultsProperty of Faurecia - duplication prohibited
Impact on 2004 net financial expenses €0.3m
Transition to IFRS
Interest rate hedges (IAS 39)
The instruments currently used do not qualify under IFRS strict criteria for effective hedges of Faurecia's debt
These hedging instruments will be marked to market
Changes in value will be shown as a financial itemon a separate line in the income statement
Shareholders’ equity (before tax effect) (€8.5m)
Impact on balance sheet as of January 1, 2004
9
Net debt €5.4m

43Second half 2004 and annual resultsProperty of Faurecia - duplication prohibited
Reclassification within shareholders’ equity: cumulative translation adjustment now part of consolidated reserves
Transition to IFRS
Translation of accounts of foreign companies (IAS 21)
Translation adjustment: €136.6m
Consolidated reserves: (€136.6m)
Impact on balance sheet as of January 1, 2004
10
44Second half 2004 and annual resultsProperty of Faurecia - duplication prohibited
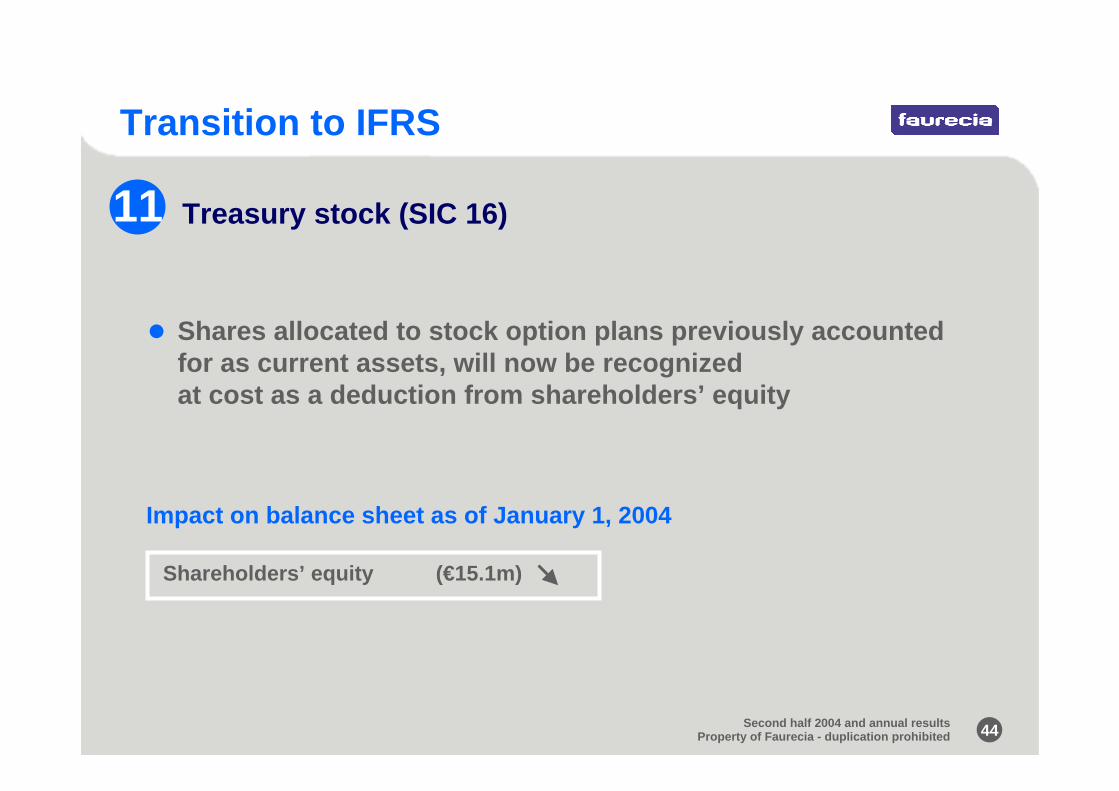
Shares allocated to stock option plans previously accounted for as current assets, will now be recognized at cost as a deduction from shareholders’ equity
Transition to IFRS
Treasury stock (SIC 16)
Shareholders’ equity (€15.1m)
Impact on balance sheet as of January 1, 2004
11

45Second half 2004 and annual resultsProperty of Faurecia - duplication prohibited
Recognition of deferred tax assets and liabilities arising on IFRS restatements
Some deferred tax assets have been written down as their recoverability was deemed to be uncertain
Transition to IFRS
Deferred taxes (IAS 12)
Impact on balance sheet as of January 1, 2004 (in €m)
Impact on 2004 net income €25.5m
12
Deferred tax assetsShareholders’ equityDeferred tax liabilities 47.0
19.4
19.4(27.6)
19.4

46Second half 2004 and annual resultsProperty of Faurecia - duplication prohibited
% sales
Transition to IFRS> Impact of IFRS on 2004 operating margin
In €m
2004 operating margin under French GAAP 366.3 3.4
Capitalization of development costs 4.5Restatement of non-current assets 15.0 Finance leases 2.1 Neutralization of actuarial gains & losses 16.4 Restatement of stock option plansMeasurement of currency hedges 1.6 Other items
2004 operating margin under IFRS beforeamortization of contractual customer relationship 402.9 3.8
Amortization of contractual customer relationship
2004 operating margin under IFRS 283.5 2.6
Impact of restatements (€82.8m)
(1.7)
(1.3)
(119.4)

47Second half 2004 and annual resultsProperty of Faurecia - duplication prohibited
2004 net income under French GAAP
Impact of restatements on operating income (82.8)Impact on other income and expensesImpact on net financial expenses
Retirement benefit obligations (9.7)Measurement of currency and interest rate instruments (3.6)Other items (2.4)Impact on income taxes
Elimination of goodwill amortizationMinority interests (0.3)
2004 net income under IFRS
Net income
Transition to IFRS
> French GAAP/IFRS reconciliation: 2004 net income
25.5114.6
130.7
83.7
5.7
(in €m)

48Second half 2004 and annual resultsProperty of Faurecia - duplication prohibited
January 1,2004
December 31,2004
> French GAAP/IFRS reconciliation: shareholders’ equity
Transition to IFRS
January 1,2004
December 31,2004
(135.4)(125.8)
(0.3)
(8.5)(27.6)(15.1)(0.3)
(140.2)(116.0)
(8.2)(1.8)
(14.1)
(in €m)
Shareholders’ equity under French GAAP 1,830.3 1,896.0
Impact of restatementsCapitalization of development costs 3.9 8.2Restatement of goodwillNeutralization of actuarial gains & losses Restatement of non-current assets 15.1 Finance leases 0.4 Measurement of interest rate hedges Deferred tax assetsTreasury stockOther items 0.3
Minority interests 0.6 0.3
Shareholders’ equity under IFRS 1,521.8 1,640.0
49Second half 2004 and annual resultsProperty of Faurecia - duplication prohibited
January 1,2004
December 31,2004
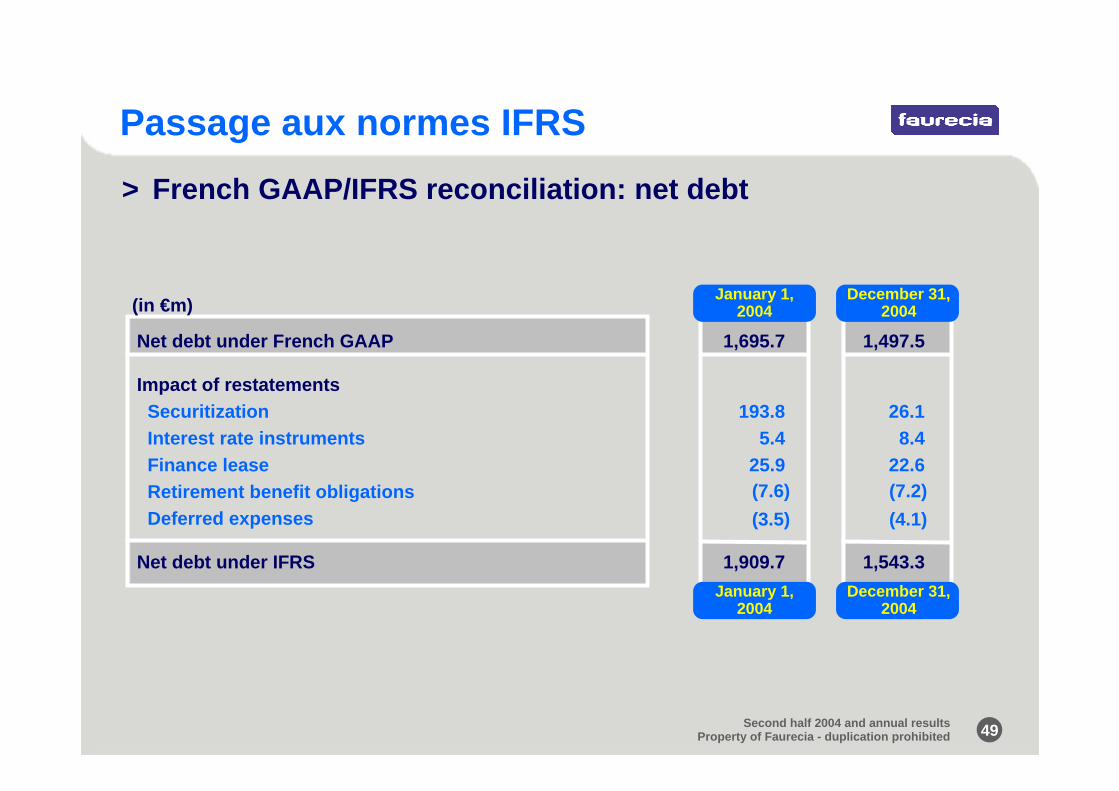
> French GAAP/IFRS reconciliation: net debt
Passage aux normes IFRS
January 1,2004
December 31,2004
Net debt under French GAAP 1,695.7 1,497.5
Impact of restatementsSecuritization 193.8 26.1Interest rate instruments 5.4 8.4Finance lease 25.9 22.6 Retirement benefit obligationsDeferred expenses
Net debt under IFRS 1,909.7 1,543.3
(7.6)(3.5)
(7.2)(4.1)
(in €m)
50Second half 2004 and annual resultsProperty of Faurecia - duplication prohibited
FrenchGAAP IFRS
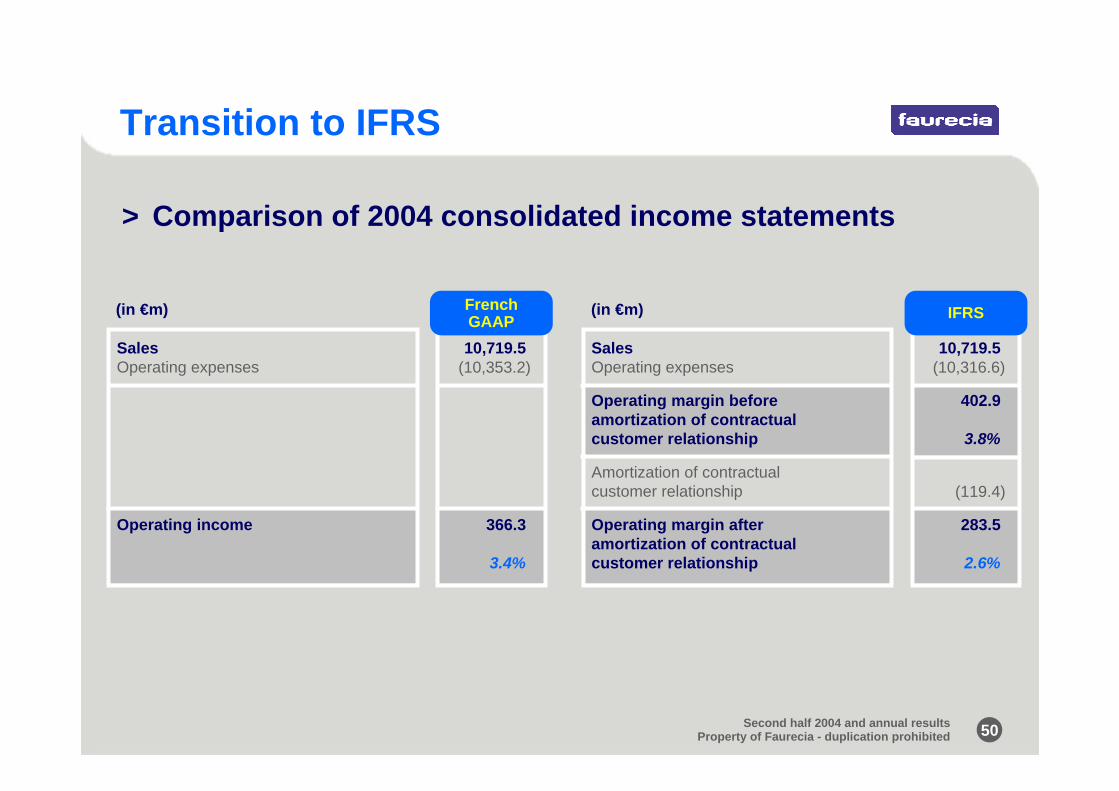
> Comparison of 2004 consolidated income statements
Transition to IFRS
Sales 10,719.5 Operating expenses
Operating margin before 402.9 amortization of contractual customer relationship 3.8%
Amortization of contractual customer relationship
Operating margin after 283.5 amortization of contractualcustomer relationship 2.6%
Sales 10,719.5Operating expenses
Operating income 366.3
3.4%
(10,353.2) (10,316.6)
(119.4)
(in €m) (in €m)
51Second half 2004 and annual resultsProperty of Faurecia - duplication prohibited
FrenchGAAP IFRS
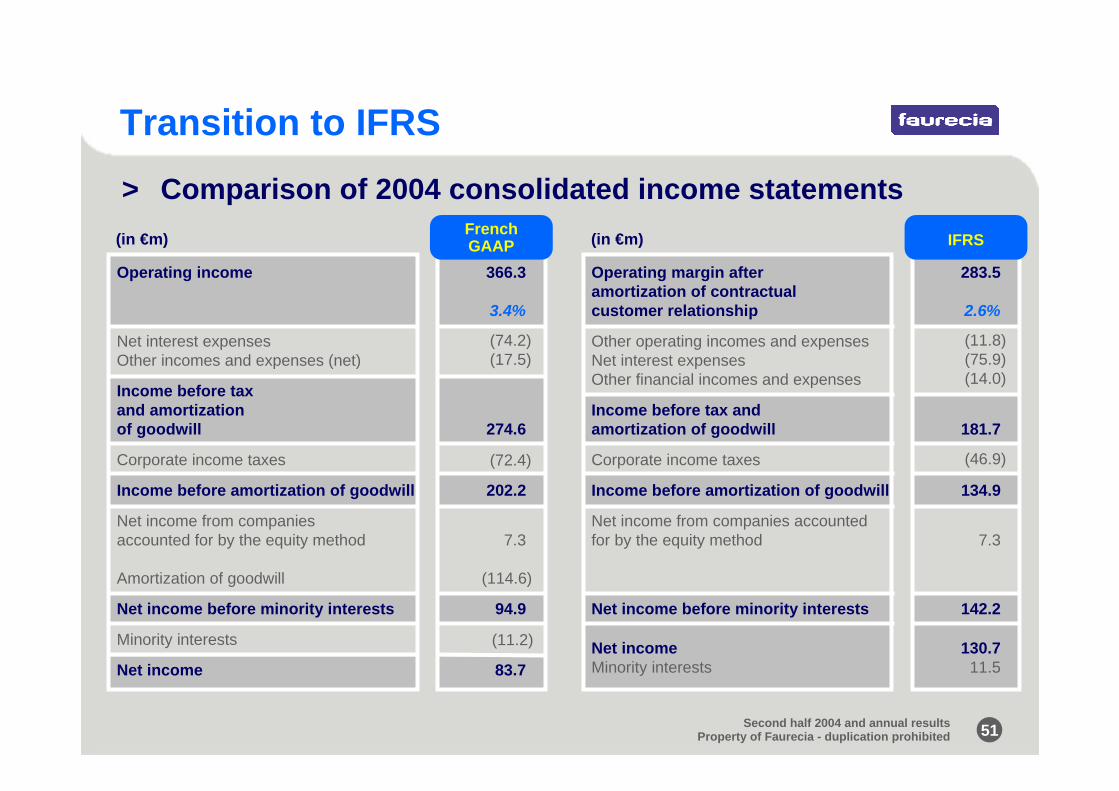
> Comparison of 2004 consolidated income statements
Transition to IFRS
(74.2)(17.5)
(11.8)(75.9)(14.0)
(46.9)
(114.6)
(11.2)
(72.4)
Operating income 366.3
3.4%
Net interest expensesOther incomes and expenses (net)
Income before tax and amortization of goodwill 274.6
Corporate income taxes
Income before amortization of goodwill 202.2
Net income from companies accounted for by the equity method 7.3
Amortization of goodwill
Net income before minority interests 94.9
Minority interests
Net income 83.7
Operating margin after 283.5 amortization of contractual customer relationship 2.6%
Other operating incomes and expensesNet interest expensesOther financial incomes and expenses
Income before tax andamortization of goodwill 181.7
Corporate income taxes
Income before amortization of goodwill 134.9
Net income from companies accountedfor by the equity method 7.3
Net income before minority interests 142.2
Net income 130.7 Minority interests 11.5
(in €m) (in €m)
52Second half 2004 and annual resultsProperty of Faurecia - duplication prohibited
FrenchGAAP
IFRS FrenchGAAP
IFRS
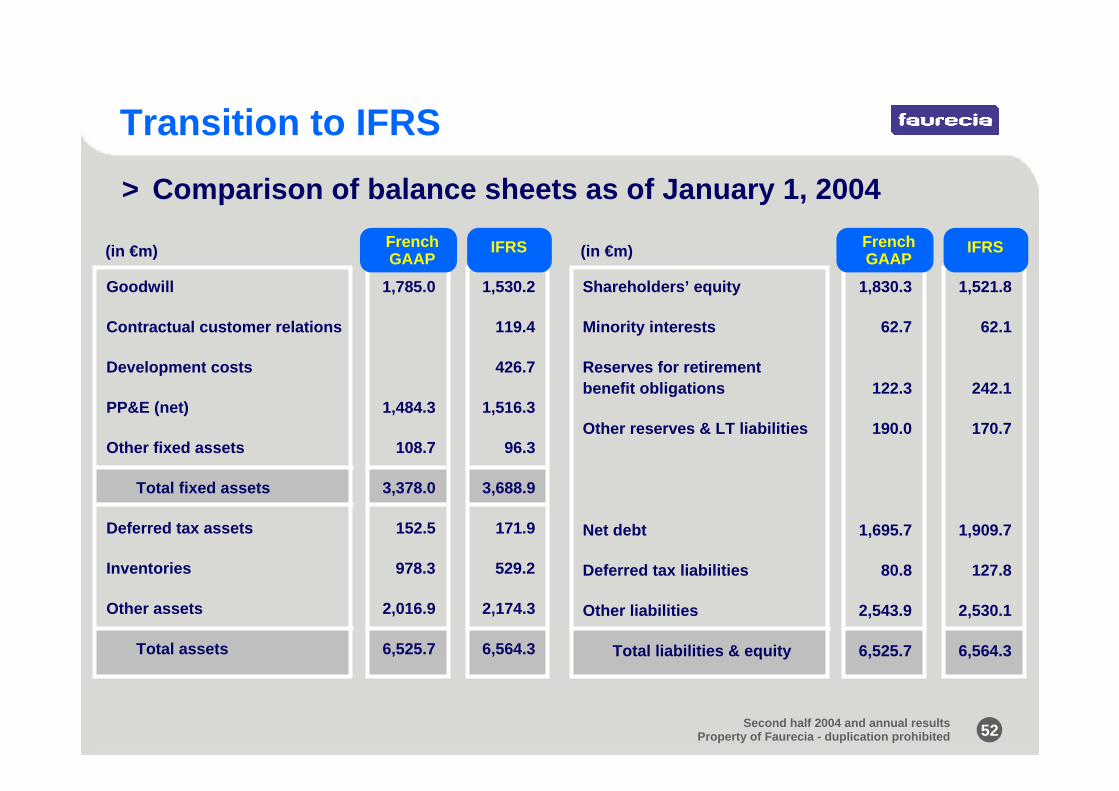
> Comparison of balance sheets as of January 1, 2004
Transition to IFRS
Goodwill 1,785.0 1,530.2
Contractual customer relations 119.4
Development costs 426.7
PP&E (net) 1,484.3 1,516.3
Other fixed assets 108.7 96.3
Total fixed assets 3,378.0 3,688.9
Deferred tax assets 152.5 171.9
Inventories 978.3 529.2
Other assets 2,016.9 2,174.3
Total assets 6,525.7 6,564.3
Shareholders’ equity 1,830.3 1,521.8
Minority interests 62.7 62.1
Reserves for retirementbenefit obligations 122.3 242.1
Other reserves & LT liabilities 190.0 170.7
Net debt 1,695.7 1,909.7
Deferred tax liabilities 80.8 127.8
Other liabilities 2,543.9 2,530.1
Total liabilities & equity 6,525.7 6,564.3
(in €m) (in €m)
53Second half 2004 and annual resultsProperty of Faurecia - duplication prohibited
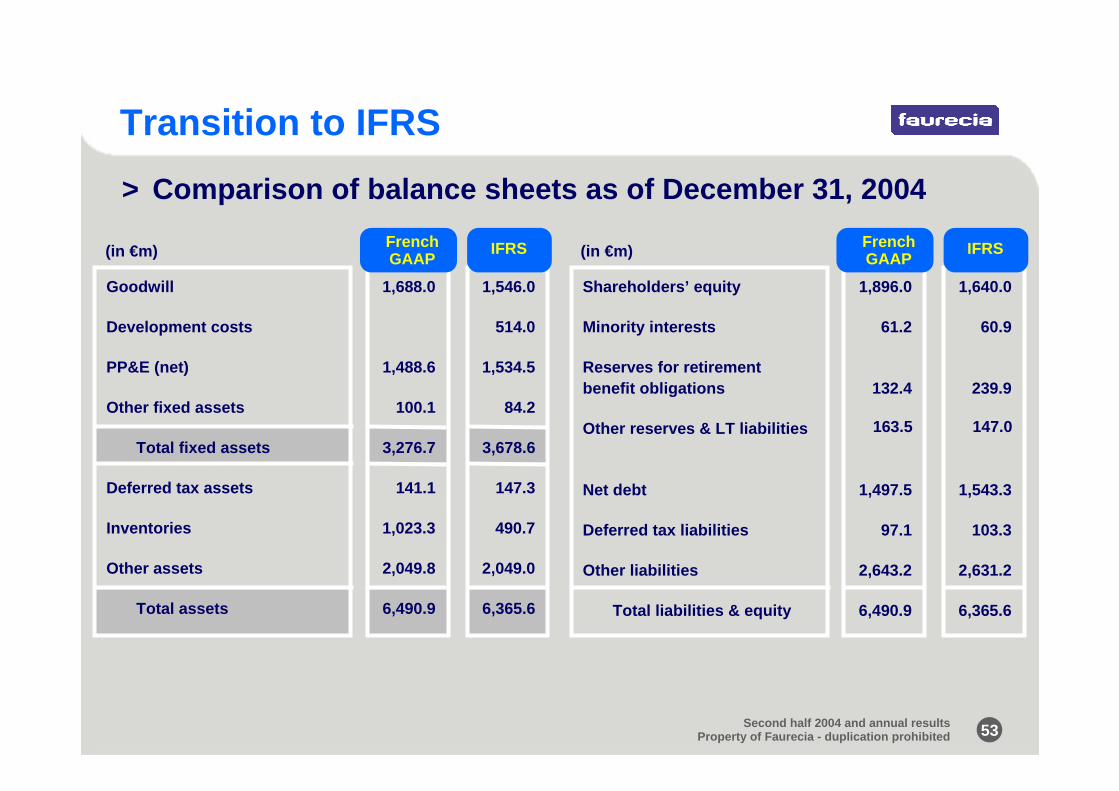
Shareholders’ equity 1,896.0 1,640.0
Minority interests 61.2 60.9
Reserves for retirementbenefit obligations 132.4 239.9
Other reserves & LT liabilities
Net debt 1,497.5 1,543.3
Deferred tax liabilities 97.1 103.3
Other liabilities 2,643.2 2,631.2
Total liabilities & equity 6,490.9 6,365.6
FrenchGAAP IFRS French
GAAP IFRS
> Comparison of balance sheets as of December 31, 2004
Transition to IFRS
163.5 147.0
Goodwill 1,688.0 1,546.0
Development costs 514.0
PP&E (net) 1,488.6 1,534.5
Other fixed assets 100.1 84.2
Total fixed assets 3,276.7 3,678.6
Deferred tax assets 141.1 147.3
Inventories 1,023.3 490.7
Other assets 2,049.8 2,049.0
Total assets 6,490.9 6,365.6
(in €m) (in €m)

54Second half 2004 and annual resultsProperty of Faurecia - duplication prohibited
Agenda
2nd half 2004 key events
2nd half 2004 and annual results
Presentation of 2004 resultsunder IFRS
Outlook

55Second half 2004 and annual resultsProperty of Faurecia - duplication prohibited
source: Faurecia
European automotive production should decline in 1H 2005
Europe
North America
South America
China
1H 2H2005 vs. 2004 2005 vs.
2004
(1.2%) (0.5%) (0.8%)
(2.9%) 4.3% 0.5%
3.0% 3.0% 3.0%
(4.0%) 27.0% 10.0%
56Second half 2004 and annual resultsProperty of Faurecia - duplication prohibited
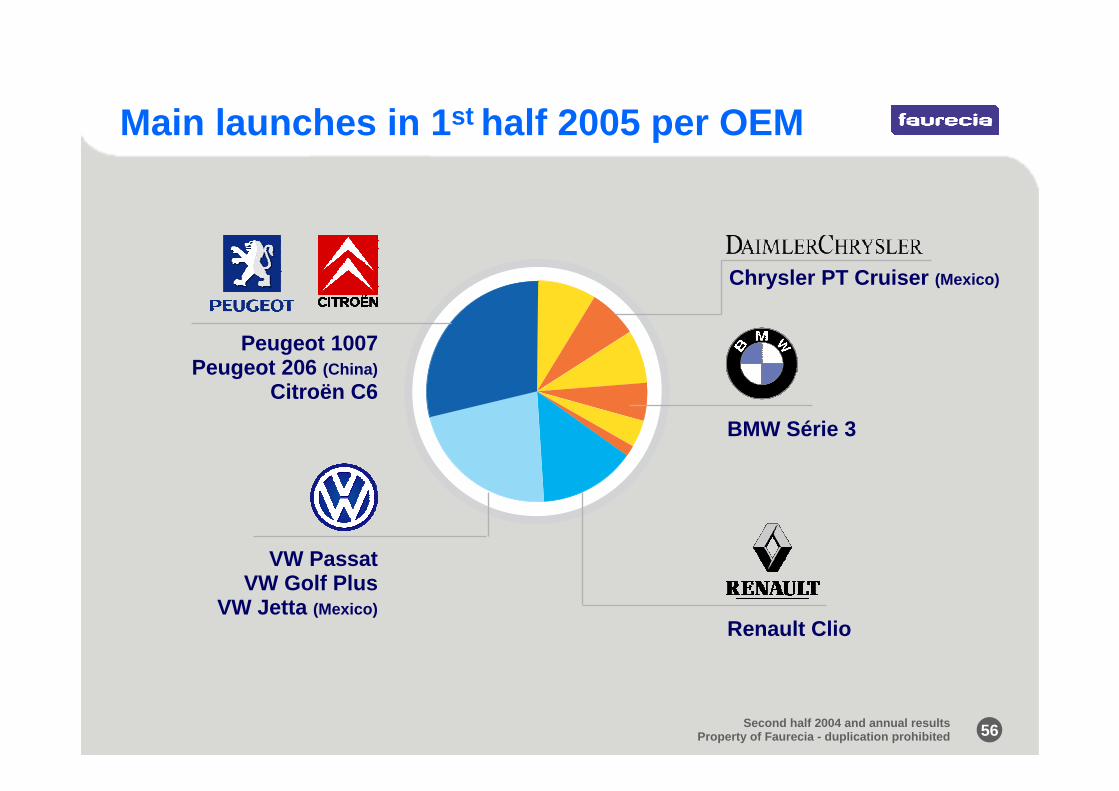
Main launches in 1st half 2005 per OEM
Peugeot 1007 Peugeot 206 (China)
Citroën C6
BMW Série 3
Renault Clio
VW PassatVW Golf Plus
VW Jetta (Mexico)
Chrysler PT Cruiser (Mexico)

57Second half 2004 and annual resultsProperty of Faurecia - duplication prohibited
Carbon steel 780 4%Stainless steel 190 2%
Total steel 970 6%
Plastic 443 6%
Raw materials challenge in 2005
FY 2004 volume(thousands of tons)
Percentage of 2004 sales
> Direct and indirect purchasing