Embed Size (px)
Citation preview
SECOND ANNUAL REPORT on the UK CETACEAN BYCATCH MONITORING SCHEME
CONTRACT REPORT TO DEFRA
ON THE WORK CONDUCTED 2005-2006
SEA MAMMAL RESEARCH UNIT
Simon Northridge, Al Kingston, Len Thomas, Alice Mackay
June 2007
1
Contents:
Introduction............................................................................................................................ 3
Obligations to Monitor Fisheries ....................................................................................... 3
Overall Monitoring Strategy .............................................................................................. 5
Analysis of Fishing Effort Data ............................................................................................. 7
Results of Observation Work................................................................................................. 8
Meeting the monitoring goals of 812............................................................................... 12
Pelagic Trawlers Over 15m in Sub-Areas IV, VI, VII and VIII.................................. 12
Gillnetters over 15m in VIa, VIIab & VIII .................................................................. 13
Driftnetters Over 15m.................................................................................................. 14
High Opening Trawls................................................................................................... 14
Pilot Projects: Under-15m vessels ............................................................................... 14
Addressing the Requirements of the Habitats Directive.................................................. 16
Estimates of bycatch ............................................................................................................ 18
Bycatch estimates and associated levels of certainty for harbour porpoises ............... 19
Bycatch estimates and associated levels of certainty for Common Dolphin............... 20
Discussion........................................................................................................................ 21
Conclusion ....................................................................................................................... 22
Some thoughts on future monitoring levels ......................................................................... 23
Implementation of Acoustic Deterrent Device Requirements (Articles 2 & 3 of Regulation
812/2004) ............................................................................................................................. 26
References............................................................................................................................ 27
2

Introduction
Council Regulation 812/2004 sets out obligations for Member States to monitor cetacean bycatch under Articles 4 and 5, and to ensure that acoustic deterrent devices are deployed in certain over-12m vessels using gill and tangle nets in some areas under Articles 2 and 3. Additional bycatch monitoring requirements are stipulated under the Habitats Directive. The Sea Mammal Research Unit (SMRU) has been contracted by DEFRA and SEERAD to meet these monitoring obligations, to make estimates of the numbers of cetaceans that are killed directly as a result of fishing activity, and to report on the UK response to the above obligations. This report addresses relevant UK activities during 2005 and 2006.
Obligations to Monitor Fisheries The UK, along with other member states of the EU, is obliged under Council Regulation 812/2004 to undertake monitoring of specified fisheries to monitor cetacean bycatch levels. The Habitats Directive also requires member states to undertake monitoring to determine the levels of incidental mortality for certain species. Under Article 12(4) of the Habitats Directive “Member States shall establish a system to monitor the incidental capture and killing of the animal species listed in Annex IV (a). In the light of the information gathered, Member States shall take further research or conservation measures as required to ensure that incidental capture and killing does not have a significant negative impact on the species concerned.” Annex IV (a) consists of a list of animal species “of community interest in need of strict protection”, and includes all cetacean species, turtles and the European sturgeon, but neither of the UK resident seal species. Under Council Regulation 812/2004 Member States are required to design and implement monitoring schemes to estimate incidental catches of cetaceans using observers on board the vessels flying their flag and with an overall length of 15 m or over, for the fisheries and under the conditions defined in Annex III of the regulation. Monitoring schemes should be designed to provide representative data on the fisheries concerned. Additionally, Member States are obliged to take the necessary steps to collect scientific data on incidental catches of cetaceans for vessels with an overall length less than 15 m and involved in fisheries defined in Annex III paragraph 3 of the Regulation by means of “appropriate scientific studies or pilot projects”. Annex III of Council Regulation 812/2004 the lists areas, the fishery types and the start dates from which times monitoring should commence. Not all of these are of relevance to the UK, but those that are or may be are summarised below: Starting January 2005: Pelagic trawls (single and pair) in ICES sub-areas VI, VII and VIII. (West of UK) Bottom-set gill or tangle nets (with mesh sizes >=80 mm) in ICES divisions VIa, VIIab, VIIIa,b,c, IXa (western waters excluding the Celtic Shelf area)
3

Starting January 2006: Driftnets in ICES sub-areas IV and VII (except VIIc,k) and division VIa, (Shelf waters around UK & Ireland) Pelagic trawls (single and pair) in ICES sub-areas IV and IX (North Sea and offshore Biscay) High-opening trawls in ICES sub-areas VI, VII and VIII and IX (western waters).
Figure 1: ICES Statistical Divisions
4

Regulation 812/2004 also stipulates that monitoring schemes should be established to monitor cetacean by-catch in a “representative manner” for the fisheries defined above. Monitoring schemes should be made sufficiently representative by adequately spreading observer coverage over the fleets, time and fishing areas. As a general rule, monitoring schemes should be designed to obtain estimates of the most frequently caught cetacean species with a CV of the bycatch estimate of not more than 0.3. However, where sufficient information to design such a scheme is lacking, Member States are obliged to implement pilot observer schemes for two consecutive years for each of the fisheries listed above, starting at the specified dates. These pilot observer schemes should be based on a sampling strategy aimed at determining the variability of by-catch which will provide the basis for the design of subsequent sampling strategies, and should also provide estimates of by-catch of cetaceans per unit effort, broken down by species. The amount of fishing effort to be observed under these pilot schemes is specified in the Regulation. For most of the fisheries listed above, a minimum of 5% of effort needs to be monitored, and where fleet size is small, at least 3 vessels should be sampled. However, for pelagic trawls (single and pair) fishing from 1 December to 31 March in ICES sub-areas VI, VII and VIII sampling should be at a rate of 10% of effort. The fisheries identified under Annex III of Regulation 812/2004 exclude certain areas and fisheries where there is a requirement to deploy acoustic deterrent devices (pingers). Monitoring of tangle net and gillnet fisheries in the southwest of Britain (sub-area VIIefghj – the Celtic Shelf area) is not required under Regulation 812, because pinger deployment is required in this area for all fishing vessels over 12m in length. However, no previous studies have examined the bycatch rate of cetaceans in any fishery other than the hake gillnet fishery in this region and that fishery predominately involves over-15m vessels fishing offshore (in VIIghj). We estimate that as many as 75% of all netting operations by UK boats in this region are made by boats of less than 15m. This region also has the highest rates of cetacean stranding in the UK, and a high proportion of these stranded animals are thought to have died in fishing operations prior to stranding (Jepson 2006). There is therefore much public concern over the nature and scale of bycatch in this region, and it is clear that in order to address the UK’s obligations under the Habitats Directive, at-sea observations are also required in gill and tangle net fisheries in this region, even though they are not required under Regulation 812/2004.
Overall Monitoring Strategy We recruited Observers through advertisements in appropriate publications, and they were trained by SMRU staff to collect data and identify cetaceans as described in Article 5 of Regulation 812/2004. Only personnel with significant sea-going experience (mainly on fishing vessels) and relevant safety training were recruited. All observers were native English speakers which minimised communication problems with crews, as stipulated in Paragraph 1(d) of Article 5. All personnel were judged able to collect the relevant data and were given appropriate training in how to complete data collection forms.
5
A preliminary analysis of the amount of fishing effort data in 2002-2003 suggested that approximately 675 observer days at sea would be needed to fulfil the UK obligations to monitor over-15m vessels under the 812 Regulation. A further 400 days of monitoring were allocated in order to address Scientific Studies or Pilot Projects of vessels less than 15m under Article 4 Para 2 of Regulation 812/2004, and also to address Habitats Directive obligations. Clearly as fishing effort varies from year to year in different sectors, these totals were estimates of likely amounts of observer effort needed and the programme was designed to remain flexible with respect to how many observer days were spent in each sector. Sampling of fishing vessels was not conducted entirely by SMRU personnel, but also included some observations made by other agencies either under discard monitoring schemes that are obligatory for member states under Council Regulation 1581/2004 on data collection, or using discard monitoring staff for dedicated and subcontracted cetacean bycatch observations. The Fisheries Research Services (FRS) Marine Laboratory at Aberdeen offered to assist in monitoring pelagic trawl fisheries, as they have observers monitoring discards and length frequencies of herring and mackerel. Approximately 150 herring and mackerel monitoring days at sea per year were planned, or 300 days overall. This work was funded independently of the present contract. SMRU subcontracted the Centre for Environment, Fisheries and Aquaculture Science (CEFAS) to collect data from 30 days at sea per year on vessels and in fisheries where some sampling was needed (“dedicated cetacean observation trips”) and which, for logistical reasons, it would be easier for CEFAS observers to sample than SMRU observers. Additionally, roughly 200 days at sea (100 p.a.) were included in the present project plan from CEFAS discard monitoring trips where it was clear that discard sampling would not interfere with cetacean bycatch monitoring. The Agri-Food and Biosciences Institute of Northern Ireland (AFBI NI, formerly DARDNI) were also subcontracted to monitor 22 days at sea per year in various Northern Irish fisheries as part of their discard monitoring scheme, ensuring that some observations could be made in sectors that might not have been covered under regular discard monitoring by AFBI. Data collected by observers who are contracted to monitor fish discards can be compromised where those observers are unable to fully monitor the hauling process if they are also supposed to be sampling fish. We were therefore careful to work with the three UK agencies involved and to include only trips where we considered it very likely that any cetacean bycatch would have been observed. Observers are required to record whether or not they have a clear view of the net leaving the water for static gear, and to estimate how sure they are that they would have seen any bycaught cetacean in pelagic trawl operations. This latter statistic is to allow for the fact that during pair trawling it is sometimes not possible to fully observe a net being hauled onto the partner vessel if the boat that the observer is on moves ahead or much further astern of the partner boat.
6
Analysis of Fishing Effort Data Fishing effort data for Scotland were supplied by the Scottish Executive Environment Food and Rural Affairs Department (SEERAD) in Edinburgh and for England, Wales and Northern Ireland by the Department for Environment Food and Rural Affairs (DEFRA) in London, from the Fisheries Activity Database (FAD) for 2005 and 2006. Data were on a trip basis and included the trip duration, landings by species and value, ICES rectangles fished, days fished per ICES rectangle, gear type and number of operations. Gear type for pelagic trawls is either single boat midwater or midwater pair trawl. For static gear, however, several categories are listed in the FAD (driftnet, gillnet, tangle net, trammel net, Danish gillnet, and a category for general gillnets). Our experience suggests that these categories are not reliably recorded in the FAD, as these distinctions are not always maintained by fishermen who complete the records. Generally speaking, a more reliable guide to which static gear category was likely to have been used on any trip is the main target species. Thus if the most valuable element of the catch is rays, monkfish, turbot or crawfish, we assume the static gear being used was a tangle net, while cod, hake, bass and salmonids are assumed to be taken in gillnets. We did not try to identify trammel nets or Danish gillnets (wreck nets) from the landed catch composition. We defined the target species on a trip by trip basis by identifying the most valuable species element of the landings rather than the species with the greatest landed weight. We allocated each trip to an ICES division based on which ICES rectangles most of the landings (largest amount in weight) came from. In order to plan our sampling strategy, we initially defined fishing effort as days at sea or “days absent”, which we calculated as the difference between the date of leaving port and the date of return to port plus one day. In this way a single identified vessel leaving port and returning on the same day is recorded as having fished for one day, while a vessel returning to port the next day is recorded as having spent two days at sea, and so on. Although the number of ‘days fished’ is also recorded for each trip, for larger vessels it is simpler to use the days absent statistic which is readily comparable to the effort recorded in the observer database. For boats of less than 10m in England and Wales landings and effort statistics are often grouped over reporting periods of one week or one month. In these cases it is not possible to use departure and arrival dates, so we use instead the ‘days fished’ statistic, which is recorded in the FAD and is a better indicator of the number of calendar days spent fishing, as the vast majority of under 10m vessels leave port, fish and return to port on the same day. Thus, to estimate fleet fishing effort we have used ‘days absent’ for over-10m boats and ‘days fished’ for under-10m boats. A particular issue arises with pair trawlers. Each vessel in a pair team is expected to make a logbook entry even if only one of them lands any catch. From a bycatch observation point of view, an observer is placed on one vessel of a pair team and records the activity of both vessels. The observer makes an assessment of whether or not he has a clear view of the net being hauled onto the partner boat, but all hauls are usually observed to some extent. Our
7
records therefore indicate the total number of tows/hauls by both boats, and the number of days that the observer was at sea. To extrapolate to the entire fleet we therefore need to consider a pair team as if it were a single entity. We have been unable develop an algorithm to link two individual vessels in the FAD as a pair team, and therefore we simply divide by two the reported number of days absent in the FAD for pair trawlers. While days absent is a useful statistic for allocating observer effort, it is not such a useful statistic for estimating fishing effort in the context of bycatch extrapolation, as the number of fishing operations per day can vary between fishing metiers. Bycatch events are associated with individual fishing operations and as this is the finest level of detail at which bycatch rates can reasonably be recorded, extrapolations to the entire fleet based on bycatch per fishing operation will produce the most precise estimate of total bycatch. This means that for raising the observed bycatch to the whole fleet, some estimate of the total number of fishing operations for the fleet are required. Analysis of the data collected by our observers and corresponding vessel trips in the FAD revealed some disparities between our observations and the recorded number of fishing operations in the FAD. Although the number of fishing operations and fishing time are listed on EU log-book forms, these fields are not mandatory and are therefore often left blank. In such circumstances, port officers are obliged to make their best estimates of these parameters for entry into the FAD. Disparities that we have observed appear to be due mainly to these estimates made by port officers on the likely number of operations made by a particular vessel when no such information had been provided by the skipper in the log-book entries. Such estimates appear to reflect what individual boats might expect to achieve, whereas in reality mechanical and other problems often reduce the actual number of tows achieved per day. We therefore use our observations of the number of hauls per day at sea by fleet sector as an estimate of the number of fishing operations per day for the entire fleet. In order to best estimate the bycatch rate of marine mammals in the entire fleet, we have also drawn upon our observations since 1996 (some 9200 observed fishing operations) to obtain better estimates of statistical properties of bycatch events in each sector. We have ONLY used data from observations made in 2005 and 2006 in order to calculate estimates of current bycatch levels, but where we have not observed any bycatch in a specific sector during 2005-2006, we have used the methods described by Northridge and Thomas (2004) to provide a likely maximum bycatch based on zero observations. This is the number of animals that we can be reasonably sure is the most that could be taken in a specific fishery given a limited number of zero-bycatch observations in that fishery. The calculation of these numbers requires some prior assumptions about likely group size that is species and fishery specific, and we have therefore used ‘old’ observations simply to derive best estimates of bycatch group size for each species group in different fisheries.
Results of Observation Work Overall, during the two years of the project, over 1200 days at sea have been monitored for cetacean bycatch by SMRU and CEFAS, and an additional 155 days have been monitored under a separate contract with DEFRA on board bass pair trawlers in the Channel. AFBINI
8

and FRS have contributed observations on approximately 470 hauls. In total this amounts to over 1350 days at sea and 2700 observed fishing operations over the two years. Overall fleet effort has been calculated in terms of the estimated number of fishing operations based on days at sea by fishery (as described above) and our estimate of the mean number of operations per day at sea for each metier. These are tabulated below for various ICES divisions and sub-areas. Pelagic trawl effort is shown in Tables 1 and 2 for 2005 and 2006 respectively. Nine principle pelagic target species have been identified, namely anchovy, bass, blue whiting, herring, mackerel, sardine (pilchard), sand smelt, scad (horse mackerel) and sprat. Sand smelt and sardines have been combined with sprats in further analysis as we did not observe any such trips, and there were very few trips for the overall fleet where these species were the major landing, and they were mostly attributed to individual vessels more usually associated with sprat fishing. Table 1: UK Pelagic Trawl Effort 2005. Estimated number of tows by ICES sub-areas
Vessel length
category Season Fishery Target Estimated
number of tows
IV VI VII VIII
<15 S Anchovy 1 1 <15 S Bass 8 8 <15 S Herring 14 12 2 <15 S Sand Smelt 21 21 <15 S Sprats 88 1 86 <15 W Bass 92 92 <15 W Herring 21 18 2 2 <15 W Sardine 1 1 <15 W Sprats 175 165 10 >15 S Bass 3 3 >15 S Blue Whiting 18 17 1 >15 S Herring 823 611 168 >15 S Horse Mackerel 69 6 60 2>15 S Mackerel 303 214 64 13 7>15 S Sardine 11 11 >15 S Sprats 204 103 101 >15 W Bass 50 50 >15 W Herring 88 9 3 73 3>15 W Horse Mackerel 83 11 8 64 >15 W Mackerel 932 171 543 198 10>15 W Sprats 142 29 37 76 Overall Total 3146 1266 946 853 21
9
Table 2: UK Pelagic Trawl Effort 2006. Estimated number of tows by ICES sub-areas Vessel length category Season Fishery Target Species Estimated
No of towsIV VI VII VIII
<15 S Anchovy 1 1 <15 S Bass 31 31 <15 S Herring 11 5 6 <15 S Mackerel 1 1 <15 S Sardine 5 5 <15 S Sprat 95 95 <15 W Anchovy 1 1 0 <15 W Bass 8 8 <15 W Herring 23 15 9 <15 W Sardine 4 4 <15 W Sprat 77 64 13 >15 S Anchovy 4 4 >15 S Bass 1 1 >15 S Blue whiting 14 14 >15 S Herring 639 425 127 80 8 >15 S Mackerel 119 93 13 12 >15 S Sardine 10 1 9 >15 S Scad 103 15 88 >15 S Sprat 111 111 >15 W Anchovy 2 2 >15 W Bass 1 1 >15 W Blue whiting 34 24 10 >15 W Herring 46 5 3 38 >15 W Mackerel 303 30 227 47 >15 W Sardine 1 1 >15 W Scad 64 27 4 33 >15 W Sprat 56 13 43 Overall Total 1768 692 420 648 8 For gillnet fisheries we initially identified 23 species groups that are targeted by gillnets in the UK. These include ‘skates and rays’ as one category, ‘dogfish spp’ as another and are dominated by sole, crustaceans (lobster, crayfish etc), bass, monkfish, cod, hake and other gadids, ‘skate’ and turbot. We did not have enough observations to provide meaningful results for each and every gillnet ‘fishery’ by species, so we have further aggregated the FAD data into gillnets, tangle nets and driftnets as described above. Our estimates of the number of hauls by each of these three categories for 2005 and 2006 are given in Tables 3 and 4 respectively. We have also split ICES sub-area VII into two zones, one of which (“VII-SW”) covers ICES divisions VIIefgh only and the other of which covers VIIa,d,j&k. (“VII-rest”). This is because most of our sampling has been in the “VII-SW” area and conditions (cetacean density, bycatch rates) are likely to be very different outside this zone.
10
Table 3: UK Static Net Fishing Effort 2005. Estimated no of hauls by ICES sub-area.
North Sea
West of Scotland
Celtic Sea
Rest of VII
Biscay Distant waters
Vessel length
category
Type of static gear
Total Of hauls
IV VI VII (SW)
VII (rest)
VIII D
<15 Gillnets 73781 17562 12939 43280 <15 Drift nets 3178 1886 1056 236 <15 Tangle nets 10581 1384 298 6735 2165 >15 Gillnets 17191 1432 1939 10538 2952 324 5>15 Tangle nets 12971 1962 3481 3299 3634 595 Totals 117703 24226 5718 34567 52267 324 600 Table 4: UK Static Net Fishing Effort 2006. Estimated no of hauls by ICES sub-area. North
Sea West of Scotland
Celtic Sea
Rest of VII
Biscay Distant waters
Vessel length
category
Type of static gear
Total Of hauls
IV VI VII(SW)
VII (rest)
VIII D
<15 Gillnets 90212 18584 21247 50309 73 <15 Drift nets 5838 2138 3283 417 <15 Tangle nets 37511 6051 45 24102 7302 11 >15 Gillnets 11406 1398 9063 247 699 >15 Tangle nets 10462 2763 1121 2624 1537 2144 272 Total 155430 30933 1166 60320 59811 2928 272 A cursory look at these tables shows that fishing effort has changed substantially from 2005 to 2006, and this highlights the difficulty of planning detailed sampling coverage based on previous years’ fishing effort data. The amount of pelagic trawl effort has declined by over 40% between these two years, largely as a result of a big drop in mackerel and herring fishing effort after legal actions taken in Scotland to reduce over-fishing. The amount of static net effort on the other hand has increased by 30%, especially in the Southwest and North Sea among small boats using tangle nets (or more strictly speaking those targeting tangle net species such as crustaceans, rays, monkfish and turbot). Our observations are shown in Table 5. For 59 of these observations (2.9%) the observer was less than 50% sure of his or her observations, and a further 62 (3%) observations were scored between 90% and 50%. We excluded any observations where the observer was less than 50% sure of having observed everything from any bycatch rate calculations. Overall we observed 200 bycaught cetaceans consisting of 20 harbour porpoises in static gear and 180 common dolphins, 164 of which were in the bass pair trawl fishery over the two calendar years, and 16 of which were in static nets. All of the cetacean bycatches were recorded in sub-area VII, which is where 87% of the observations were made.
11
Table 5: Summary of observations made, by fishery and by area.
IV VI VII & VIII All Areas
METIER Hauls observed
Hauls observed
Hauls observed Totals
Static Gear: Gill nets 29 917 946Driftnets 16 16
Tangle nets 3 808 811Pelagic Trawls:
Anchovy 8 8Bass 174 174
Blue whiting 22 3 25Herring 107 21 3 131
Mackerel 105 60 10 175Scad 16 16Sprat 29 53 82
Other gears: Ring nets 2 2
Demersal trawl 46 46Nephrops trawl 249 249
Totals 215 132 2305 2652
Meeting the monitoring goals of 812
Pelagic Trawlers Over 15m in Sub-Areas IV, VI, VII and VIII The major task for the UK has been to monitor the over-15m pelagic trawl fleet, and this has been done with some success. Table 6 shows our estimate of the number of fishing operations in each of the areas and seasons specified in Annex III paragraph 3 of the Regulation, together with the expected amount of observation and the actual amounts achieved. Overall we have monitored 70% more operations than strictly required, exceeding out target in each category except for the winter season of 2005, where we fell short by about 73 tows (highlighted). This was due to a late start in our monitoring programme and an early close to the mackerel season in February 2005, followed by the absence of any mackerel fishing in December of 2005, at which time we would normally have expected to have been able to increase our level of winter sampling.
Table 6: Targets for observations of pelagic trawl fleets under regulation 812.
Pelagic trawl tows Fleet Effort
Target Observations
Actual Observations
Winter 2005 VI-VIII-VIII 1064 106 33 Summer 2005 VI-VIII-VIII 550 27 54 Winter 2006 VI-VIII-VIII 433 43 75 Summer 2006 VI-VIII-VIII 468 23 77 Annual 2006 IV 609 30 159 Totals 3124 231 398
12
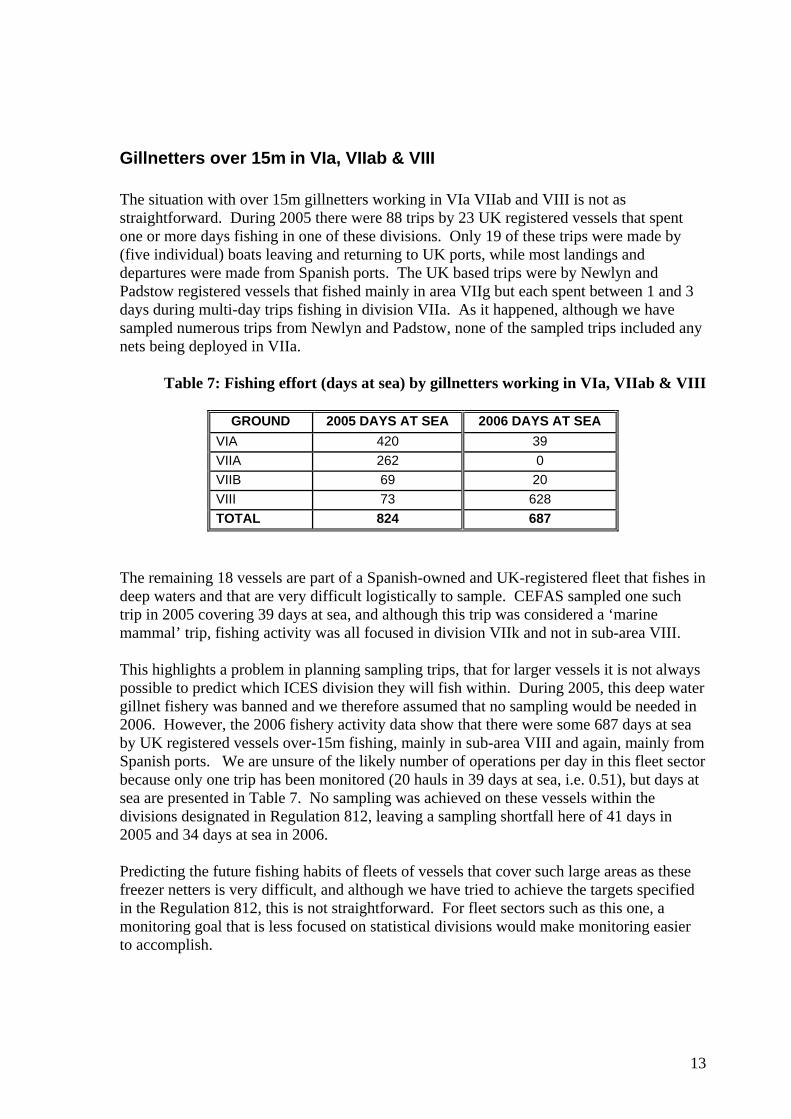
Gillnetters over 15m in VIa, VIIab & VIII The situation with over 15m gillnetters working in VIa VIIab and VIII is not as straightforward. During 2005 there were 88 trips by 23 UK registered vessels that spent one or more days fishing in one of these divisions. Only 19 of these trips were made by (five individual) boats leaving and returning to UK ports, while most landings and departures were made from Spanish ports. The UK based trips were by Newlyn and Padstow registered vessels that fished mainly in area VIIg but each spent between 1 and 3 days during multi-day trips fishing in division VIIa. As it happened, although we have sampled numerous trips from Newlyn and Padstow, none of the sampled trips included any nets being deployed in VIIa.
Table 7: Fishing effort (days at sea) by gillnetters working in VIa, VIIab & VIII
GROUND 2005 DAYS AT SEA 2006 DAYS AT SEA VIA 420 39 VIIA 262 0 VIIB 69 20 VIII 73 628 TOTAL 824 687
The remaining 18 vessels are part of a Spanish-owned and UK-registered fleet that fishes in deep waters and that are very difficult logistically to sample. CEFAS sampled one such trip in 2005 covering 39 days at sea, and although this trip was considered a ‘marine mammal’ trip, fishing activity was all focused in division VIIk and not in sub-area VIII. This highlights a problem in planning sampling trips, that for larger vessels it is not always possible to predict which ICES division they will fish within. During 2005, this deep water gillnet fishery was banned and we therefore assumed that no sampling would be needed in 2006. However, the 2006 fishery activity data show that there were some 687 days at sea by UK registered vessels over-15m fishing, mainly in sub-area VIII and again, mainly from Spanish ports. We are unsure of the likely number of operations per day in this fleet sector because only one trip has been monitored (20 hauls in 39 days at sea, i.e. 0.51), but days at sea are presented in Table 7. No sampling was achieved on these vessels within the divisions designated in Regulation 812, leaving a sampling shortfall here of 41 days in 2005 and 34 days at sea in 2006. Predicting the future fishing habits of fleets of vessels that cover such large areas as these freezer netters is very difficult, and although we have tried to achieve the targets specified in the Regulation 812, this is not straightforward. For fleet sectors such as this one, a monitoring goal that is less focused on statistical divisions would make monitoring easier to accomplish.
13
Driftnetters Over-15m As can be seen from Tables 3 and 4 there are no records of over-15m vessels using driftnets in the UK fleet, so no sampling was required under Annex III paragraph 3 for this category of vessel.
High Opening Trawls The requirement to monitor high opening trawls is not clear in the Regulation, but we take this to mean VHVO trawls such as are used by Spanish boats and which have been reported to take cetaceans on occasion (ICES 2005). These gear types are not, to our knowledge, used in the UK, though there are a few ‘high lift’ trawls, where the headline is held higher than in a regular demersal trawl. This distinction is not made in any of the gear codes used in log book records or the FAD however, so we have not been able to investigate the extent of such gear use. Advice from the Commission on how to interpret the requirement to monitor “High Opening Trawls” would be helpful.
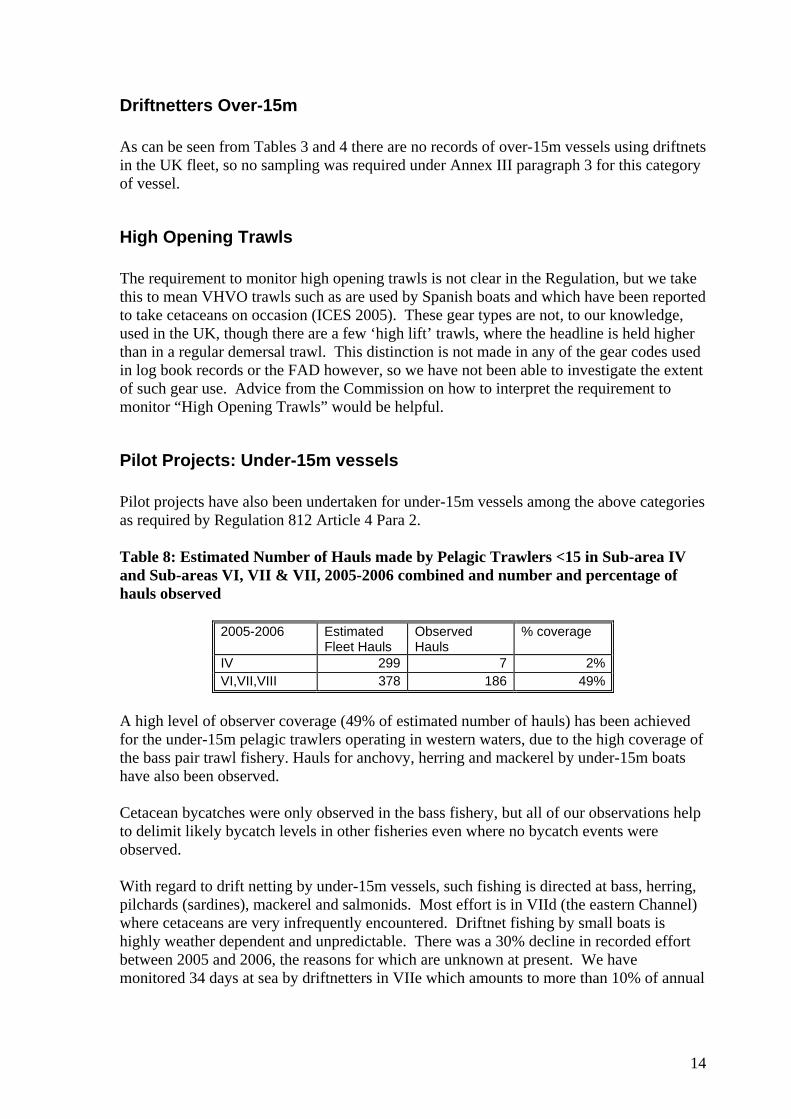
Pilot Projects: Under-15m vessels Pilot projects have also been undertaken for under-15m vessels among the above categories as required by Regulation 812 Article 4 Para 2. Table 8: Estimated Number of Hauls made by Pelagic Trawlers <15 in Sub-area IV and Sub-areas VI, VII & VII, 2005-2006 combined and number and percentage of hauls observed
2005-2006 Estimated Fleet Hauls
Observed Hauls
% coverage
IV 299 7 2% VI,VII,VIII 378 186 49%
A high level of observer coverage (49% of estimated number of hauls) has been achieved for the under-15m pelagic trawlers operating in western waters, due to the high coverage of the bass pair trawl fishery. Hauls for anchovy, herring and mackerel by under-15m boats have also been observed. Cetacean bycatches were only observed in the bass fishery, but all of our observations help to delimit likely bycatch levels in other fisheries even where no bycatch events were observed. With regard to drift netting by under-15m vessels, such fishing is directed at bass, herring, pilchards (sardines), mackerel and salmonids. Most effort is in VIId (the eastern Channel) where cetaceans are very infrequently encountered. Driftnet fishing by small boats is highly weather dependent and unpredictable. There was a 30% decline in recorded effort between 2005 and 2006, the reasons for which are unknown at present. We have monitored 34 days at sea by driftnetters in VIIe which amounts to more than 10% of annual
14
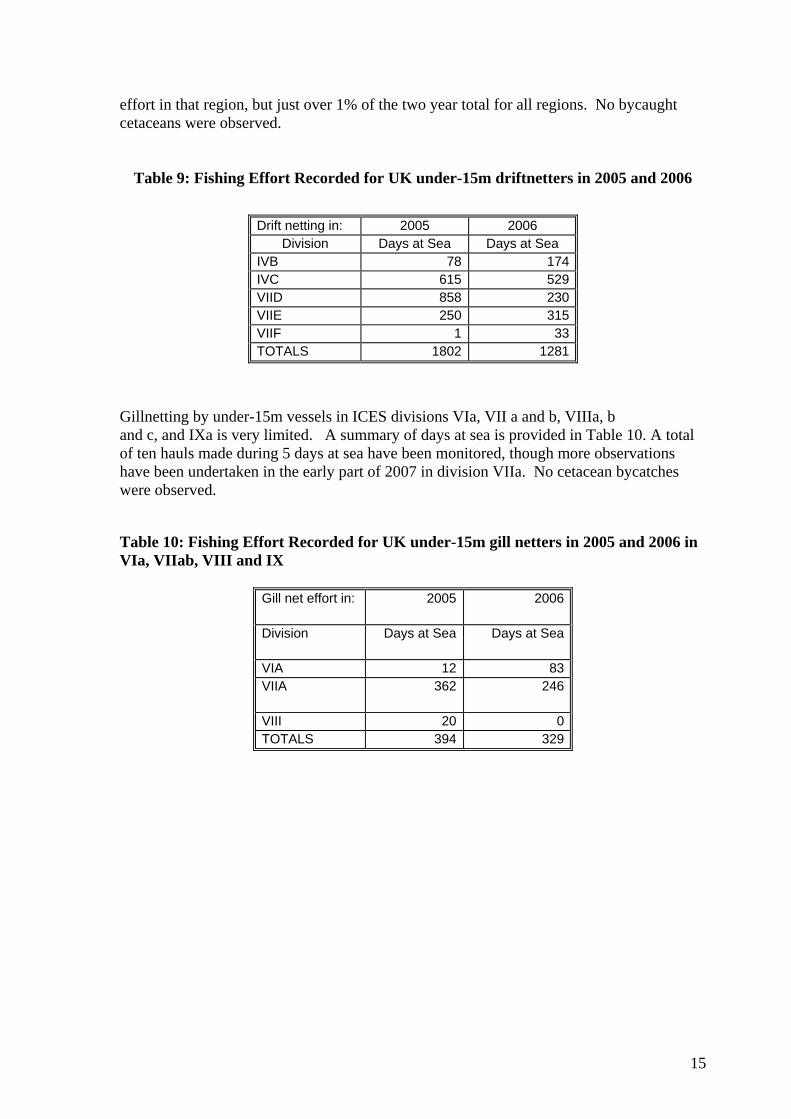
effort in that region, but just over 1% of the two year total for all regions. No bycaught cetaceans were observed.
Table 9: Fishing Effort Recorded for UK under-15m driftnetters in 2005 and 2006
Drift netting in: 2005 2006 Division Days at Sea Days at Sea
IVB 78 174 IVC 615 529 VIID 858 230 VIIE 250 315 VIIF 1 33 TOTALS 1802 1281
Gillnetting by under-15m vessels in ICES divisions VIa, VII a and b, VIIIa, b and c, and IXa is very limited. A summary of days at sea is provided in Table 10. A total of ten hauls made during 5 days at sea have been monitored, though more observations have been undertaken in the early part of 2007 in division VIIa. No cetacean bycatches were observed. Table 10: Fishing Effort Recorded for UK under-15m gill netters in 2005 and 2006 in VIa, VIIab, VIII and IX
Gill net effort in: 2005 2006
Division Days at Sea Days at Sea
VIA 12 83 VIIA 362 246
VIII 20 0 TOTALS 394 329
15
Addressing the Requirements of the Habitats Directive
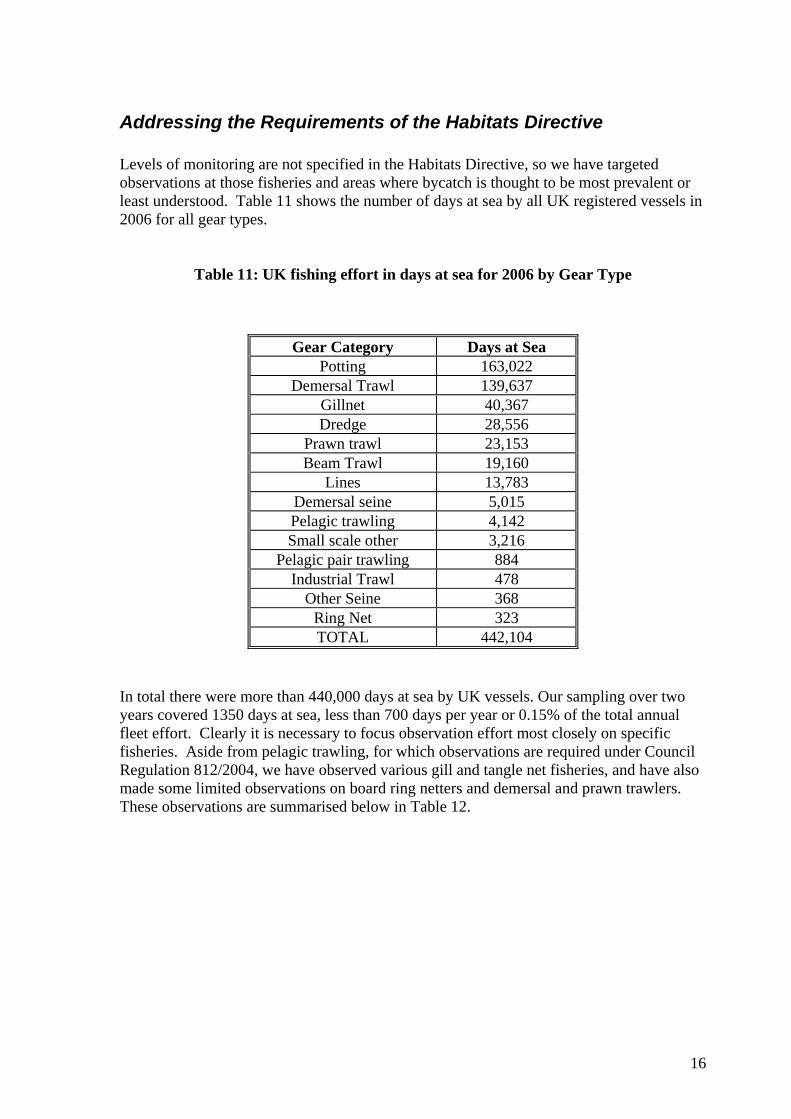
Levels of monitoring are not specified in the Habitats Directive, so we have targeted observations at those fisheries and areas where bycatch is thought to be most prevalent or least understood. Table 11 shows the number of days at sea by all UK registered vessels in 2006 for all gear types.
Table 11: UK fishing effort in days at sea for 2006 by Gear Type
Gear Category Days at Sea Potting 163,022
Demersal Trawl 139,637 Gillnet 40,367 Dredge 28,556
Prawn trawl 23,153 Beam Trawl 19,160
Lines 13,783 Demersal seine 5,015 Pelagic trawling 4,142 Small scale other 3,216
Pelagic pair trawling 884 Industrial Trawl 478
Other Seine 368 Ring Net 323 TOTAL 442,104
In total there were more than 440,000 days at sea by UK vessels. Our sampling over two years covered 1350 days at sea, less than 700 days per year or 0.15% of the total annual fleet effort. Clearly it is necessary to focus observation effort most closely on specific fisheries. Aside from pelagic trawling, for which observations are required under Council Regulation 812/2004, we have observed various gill and tangle net fisheries, and have also made some limited observations on board ring netters and demersal and prawn trawlers. These observations are summarised below in Table 12.
16

Table 12: Number of Observations and bycatches observed by gear type/target species
METIER Hauls observed
Harbour Porpoises
Common Dolphins
Drift nets 16 0 0 Tangle Nets 811 6 13 Gill nets 946 14 3 Demersal Trawls 46 0 0 Prawn Trawls 249 0 0 Ring nets 2 0 0 Pel Trawl Anchovy 8 0 0 Pel Trawl Bass 174 0 164 Pel Trawl Blue Whiting 25 0 0 Pel Trawl Herring 131 0 0 Pel Trawl Mackerel 202 0 0 Pel Trawl Scad 35 0 0 Pel Trawl Sprat 82 0 0 TOTALS 2727 20 180
Most observations that were not required under Regulation 812/2004 were focused in ICES sub-area VII. A map of observed haul locations is shown in Figure 2.
Figure 2: Locations of all observed hauls by gear type/target species
########################## #######
##########
#######
###########
###
###
##
#######
#
###
####
##
#
#
##
#
####
#####
###
#
###
#
# ##
#
##############
#
##
# ##
#
###
##
%%%%%
%%%%%%
%%%%%%
%%%
##
# #
#
##
###
#
##
##
##
######
#
%%
%%%
# #
###
##
##
#### ###
#####
##
####
#
##
##
###
## ##### ###### ################### # ######### #### ######## ##### #
#
#
#
#### ############## ############## ############ ###
#####
###
#########
#####
#
### #
##### ##### #####
#####
## #
#
# #
#
### ##
###
### ####### #############
#
###
#
##
#
###
#
##
# ### #
####
#
#
##########
#
####
#
##
#########################
######
##
##### ##
#####
##
##
##### ##
#####
##
#
##### #############
#
##### #############
#
###
#
###
##### ## ###################
############ ##
#####
###
###################
##
#
#
########
#
#
#
#
##
###
###
####
##
######
#
#
##
###
###
############
####
###
#
#
#################################$
$
$$$$$$$$$$$$$$$###########
#####
########
####################
######
##################
#############################################
########
##
########
##
#####
###### ####
## ##############
############################ ######################################
###
# ## ##########
#
#################################### #########################
## ###############################
#
##################
######### ### ##########################
###################################
########################### #########
##########
##################
##
#################################################### ###############
#################################################################################################################################################
##################################################################################################################################################
###############################
#
###########
##########
########################
####################
####################################
########## ########### #
##########
####
######### ############
##############################
#########
#########################################
#################################
#################################################################
####################
##############
#########################################
####################
########################## #################################################################################
###################
################################################ ################## ##############
###############################
###########################################
##################
##########
#################################################################
##################
##############
#
##
#
#
#####
#
###
####
#
############
####
##
#
#
##
# #####
###
##
#
##########
#
# ### #
#
#
#
#
########
##### #### #########
#
#####
#
##
#
#
##
#
####
#
## ##
#
#
# #
#
#################
#
#####################
##############
#######
#######
#
#
##
##
#
##
#
OBSERVATIONS BY HAUL$ DRIFT
25°65°15°10°65°0°5°10°15°20°25°
60°
25°
60°
# DT# GN# PTANCH# PTBASS% PTBLUWH# PTHERRING# PTMACK# PTSCAD# PTSPRAT# RING# TANG
45°
55°
20°
55°
50°
50°
45°
20° 15° 10° 5° 0° 5° 10°
17
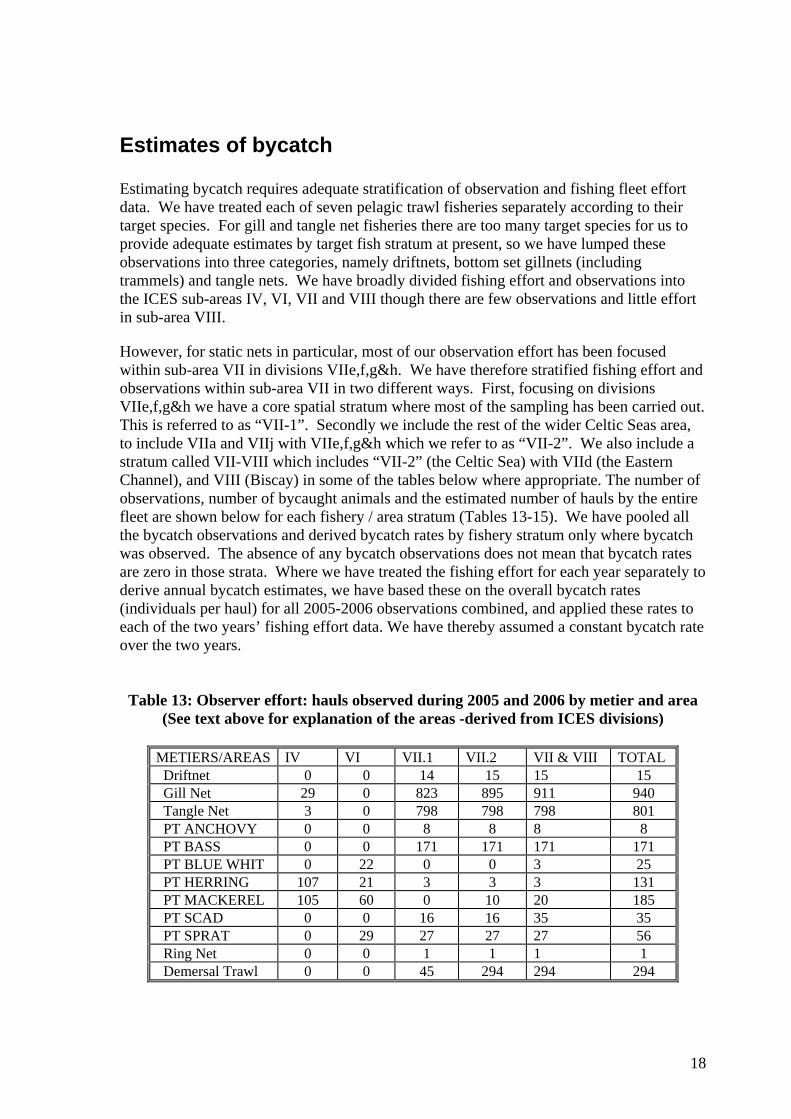
Estimates of bycatch Estimating bycatch requires adequate stratification of observation and fishing fleet effort data. We have treated each of seven pelagic trawl fisheries separately according to their target species. For gill and tangle net fisheries there are too many target species for us to provide adequate estimates by target fish stratum at present, so we have lumped these observations into three categories, namely driftnets, bottom set gillnets (including trammels) and tangle nets. We have broadly divided fishing effort and observations into the ICES sub-areas IV, VI, VII and VIII though there are few observations and little effort in sub-area VIII.
However, for static nets in particular, most of our observation effort has been focused within sub-area VII in divisions VIIe,f,g&h. We have therefore stratified fishing effort and observations within sub-area VII in two different ways. First, focusing on divisions VIIe,f,g&h we have a core spatial stratum where most of the sampling has been carried out. This is referred to as “VII-1”. Secondly we include the rest of the wider Celtic Seas area, to include VIIa and VIIj with VIIe,f,g&h which we refer to as “VII-2”. We also include a stratum called VII-VIII which includes “VII-2” (the Celtic Sea) with VIId (the Eastern Channel), and VIII (Biscay) in some of the tables below where appropriate. The number of observations, number of bycaught animals and the estimated number of hauls by the entire fleet are shown below for each fishery / area stratum (Tables 13-15). We have pooled all the bycatch observations and derived bycatch rates by fishery stratum only where bycatch was observed. The absence of any bycatch observations does not mean that bycatch rates are zero in those strata. Where we have treated the fishing effort for each year separately to derive annual bycatch estimates, we have based these on the overall bycatch rates (individuals per haul) for all 2005-2006 observations combined, and applied these rates to each of the two years’ fishing effort data. We have thereby assumed a constant bycatch rate over the two years.
Table 13: Observer effort: hauls observed during 2005 and 2006 by metier and area (See text above for explanation of the areas -derived from ICES divisions)
METIERS/AREAS IV VI VII.1 VII.2 VII & VIII TOTAL Driftnet 0 0 14 15 15 15 Gill Net 29 0 823 895 911 940 Tangle Net 3 0 798 798 798 801 PT ANCHOVY 0 0 8 8 8 8 PT BASS 0 0 171 171 171 171 PT BLUE WHIT 0 22 0 0 3 25 PT HERRING 107 21 3 3 3 131 PT MACKEREL 105 60 0 10 20 185 PT SCAD 0 0 16 16 35 35 PT SPRAT 0 29 27 27 27 56 Ring Net 0 0 1 1 1 1 Demersal Trawl 0 0 45 294 294 294
18
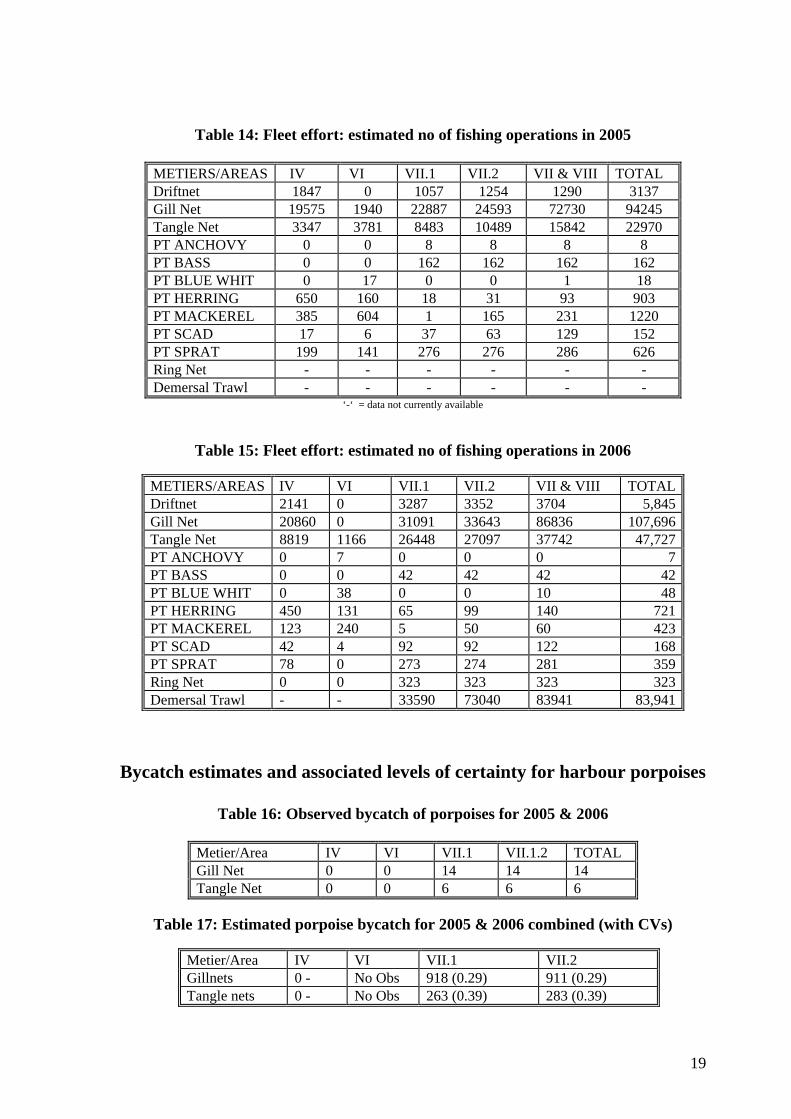
Table 14: Fleet effort: estimated no of fishing operations in 2005
METIERS/AREAS IV VI VII.1 VII.2 VII & VIII TOTAL Driftnet 1847 0 1057 1254 1290 3137 Gill Net 19575 1940 22887 24593 72730 94245 Tangle Net 3347 3781 8483 10489 15842 22970 PT ANCHOVY 0 0 8 8 8 8 PT BASS 0 0 162 162 162 162 PT BLUE WHIT 0 17 0 0 1 18 PT HERRING 650 160 18 31 93 903 PT MACKEREL 385 604 1 165 231 1220 PT SCAD 17 6 37 63 129 152 PT SPRAT 199 141 276 276 286 626 Ring Net - - - - - - Demersal Trawl - - - - - -
‘-‘ = data not currently available
Table 15: Fleet effort: estimated no of fishing operations in 2006
METIERS/AREAS IV VI VII.1 VII.2 VII & VIII TOTALDriftnet 2141 0 3287 3352 3704 5,845Gill Net 20860 0 31091 33643 86836 107,696Tangle Net 8819 1166 26448 27097 37742 47,727PT ANCHOVY 0 7 0 0 0 7PT BASS 0 0 42 42 42 42PT BLUE WHIT 0 38 0 0 10 48PT HERRING 450 131 65 99 140 721PT MACKEREL 123 240 5 50 60 423PT SCAD 42 4 92 92 122 168PT SPRAT 78 0 273 274 281 359Ring Net 0 0 323 323 323 323Demersal Trawl - - 33590 73040 83941 83,941
Bycatch estimates and associated levels of certainty for harbour porpoises
Table 16: Observed bycatch of porpoises for 2005 & 2006
Metier/Area IV VI VII.1 VII.1.2 TOTAL Gill Net 0 0 14 14 14 Tangle Net 0 0 6 6 6
Table 17: Estimated porpoise bycatch for 2005 & 2006 combined (with CVs)
Metier/Area IV VI VII.1 VII.2 Gillnets 0 - No Obs 918 (0.29) 911 (0.29) Tangle nets 0 - No Obs 263 (0.39) 283 (0.39)
19

Table 18: Estimated total porpoise bycatch 2005
Metier/Area IV VI VII.1 VII.2
Gillnets 0 No Obs 389 385 Tangle nets 0 No Obs 64 79
Table 19: Estimated total porpoise bycatch 2006
Metier/Area IV VI VII.1 VII.2 Gillnets 0 No Obs 529 526 Tangle nets 0 No Obs 199 204
Table 20: 90% Confidence Intervals on porpoise bycatch estimates by year (Bootstrap Method):
2005: VII.1 VII.2 Gillnets 225-581 195-574Tangle Nets 22-105 27-130 2006: Gillnets 306-789 267-785Tangle Nets 69-328 97-337
Bycatch estimates and associated levels of certainty for Common Dolphin
Table 21: Observed bycatch of Common Dolphins for 2005-2006
Metier/Area IV VI VII.1 VII.2 Gillnets 0 No Obs 3 3 Tangle nets 0 No Obs 13 13 Bass Pair Trawl No Obs No Obs 164 164
Table 22: Estimated dolphin bycatch for 2005 & 2006 combined (with CVs)
Metier/Area IV VI VII.1 VII.2 Gillnets 0 No Obs 197 (0.57) 195 (0.57) Tangle nets 0 No Obs 569 (0.40) 612 (0.41) Bass Pair Trawl No Obs No Obs 196 (0.04) 196 (0.04)
20
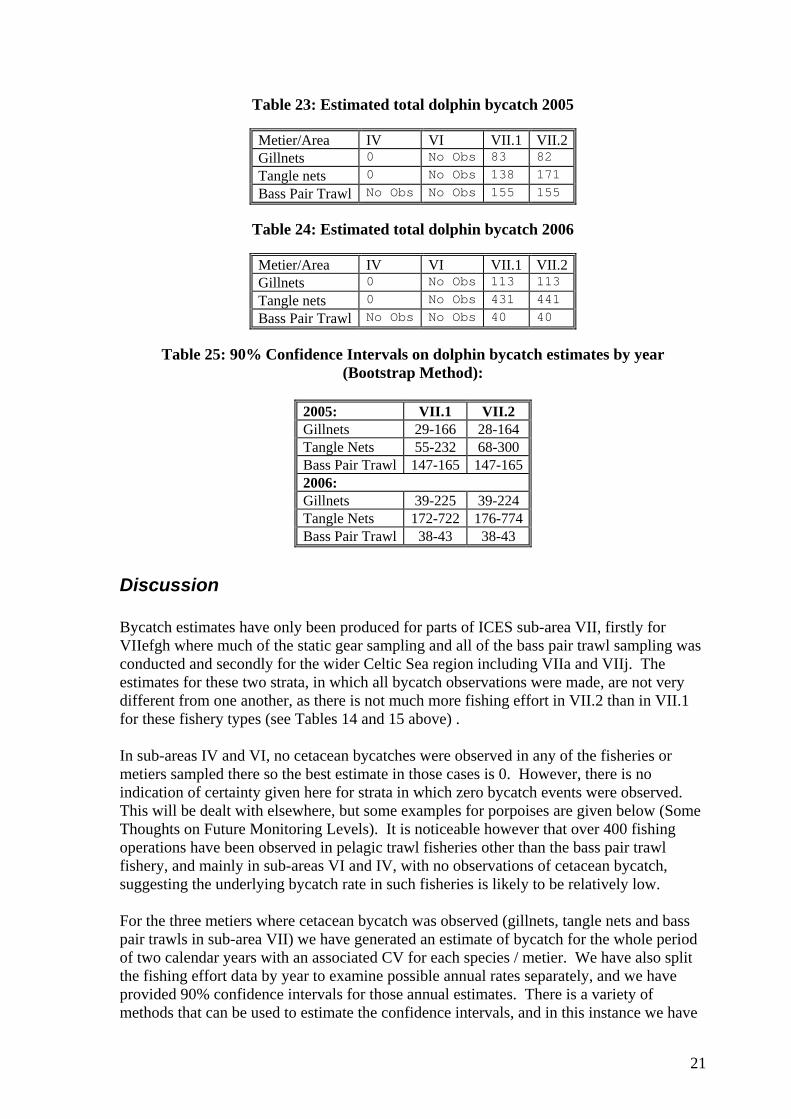
Table 23: Estimated total dolphin bycatch 2005
Metier/Area IV VI VII.1 VII.2 Gillnets 0 No Obs 83 82
Tangle nets 0 No Obs 138 171
Bass Pair Trawl No Obs No Obs 155 155
Table 24: Estimated total dolphin bycatch 2006
Metier/Area IV VI VII.1 VII.2 Gillnets 0 No Obs 113 113
Tangle nets 0 No Obs 431 441
Bass Pair Trawl No Obs No Obs 40 40
Table 25: 90% Confidence Intervals on dolphin bycatch estimates by year
(Bootstrap Method):
2005: VII.1 VII.2 Gillnets 29-166 28-164 Tangle Nets 55-232 68-300 Bass Pair Trawl 147-165 147-1652006: Gillnets 39-225 39-224 Tangle Nets 172-722 176-774Bass Pair Trawl 38-43 38-43
Discussion Bycatch estimates have only been produced for parts of ICES sub-area VII, firstly for VIIefgh where much of the static gear sampling and all of the bass pair trawl sampling was conducted and secondly for the wider Celtic Sea region including VIIa and VIIj. The estimates for these two strata, in which all bycatch observations were made, are not very different from one another, as there is not much more fishing effort in VII.2 than in VII.1 for these fishery types (see Tables 14 and 15 above) . In sub-areas IV and VI, no cetacean bycatches were observed in any of the fisheries or metiers sampled there so the best estimate in those cases is 0. However, there is no indication of certainty given here for strata in which zero bycatch events were observed. This will be dealt with elsewhere, but some examples for porpoises are given below (Some Thoughts on Future Monitoring Levels). It is noticeable however that over 400 fishing operations have been observed in pelagic trawl fisheries other than the bass pair trawl fishery, and mainly in sub-areas VI and IV, with no observations of cetacean bycatch, suggesting the underlying bycatch rate in such fisheries is likely to be relatively low. For the three metiers where cetacean bycatch was observed (gillnets, tangle nets and bass pair trawls in sub-area VII) we have generated an estimate of bycatch for the whole period of two calendar years with an associated CV for each species / metier. We have also split the fishing effort data by year to examine possible annual rates separately, and we have provided 90% confidence intervals for those annual estimates. There is a variety of methods that can be used to estimate the confidence intervals, and in this instance we have
21

used a bootstrap method (randomised re-sampling of the data used to generate estimates of uncertainty) which appears to produce consistently reliable values compared with the other methods. Using the yardstick of the 812 Regulation, the CVs of total estimates of porpoise bycatch are less than 0.3 for gillnets, but more than 0.3 for tangle nets, while those for dolphins are 0.04 for bass trawls but greater than 0.3 for both gillnets and tangle nets. The lower precision in the dolphin bycatch estimates for the static gear is due to the fact that dolphins are not always caught individually, whereas porpoises tend to be, adding an additional element of uncertainty to the extrapolations. However, only the bass pair trawl fishery is covered by the monitoring requirements of the 812 Regulation (and there only as a pilot project). Whether a more intensive level of sampling in (for example) the tangle net fishery in sub-area VII is required will depend on how important it is deemed to be to reduce the upper 90% confidence interval down from 774 dolphins in 2006 (see below). The very low CV and tight confidence intervals on the dolphin bycatch estimates for the bass pair trawl fishery are due to the very high level of sampling achieved in that fishery. It should be noted all estimates here are for calendar years of fishing effort, while previous estimates of dolphin bycatch in that fishery have usually been given for each winter season (Northridge 2006). The increase in documented fishing effort in the gill and tangle net fisheries in sub-area VII between 2005 and 2006 may be a result of the introduction of the registration Of Fish Buyers and Sellers and Designation of Fish Auction Sites Regulation (2005). If so, it is likely that actual fishing effort in 2005 may have been higher than that documented here, with obvious implications for the bycatch estimates for that year. We have refrained here from extrapolating our observations beyond the immediate vicinity of where they were made. It might seem plausible for example, to use the bycatch observations collected in ICES divisions VIIe,f,g&h to estimate total bycatches throughout sub-area VII, including the eastern Channel (division VIId). We have not included VIId in these extrapolations (nor VIIk, nor VIII), because we believe that cetacean densities and fishing methods may be very different in these more widely dispersed areas. From 2007 more observer effort on static gear is planned in sub-area IV. We have only stratified our sample of static nets crudely by general target type which we use to delimit gear as ‘gillnet’ and ‘tangle net’, and also by region. With further data collection it should be possible to produce more refined estimates using more strata, and estimates of bycatch may increase or decrease as a result.
Conclusion In brief, and in very rough figures, we estimate that between 2005 and 2006, around 460-730 porpoises and about 410-610 common dolphins were killed in pelagic trawl and static net fisheries in sub-area VII. Our sampling of pelagic trawl fisheries in sub-areas VI and IV suggests bycatch rates there are low, because over 400 operations were observed without any cetacean bycatch.
22
When compared with abundance estimates in the hundreds of thousands for both harbour porpoises and common dolphins in the wider region (see Table 26 below), these bycatch totals on their own are unlikely to represent a major conservation threat to dolphins or porpoises. However, there are cetacean bycatches in many other European fisheries affecting the same biological populations, so that the true significance of these estimates cannot be determined without a more synoptic assessment at a European level.
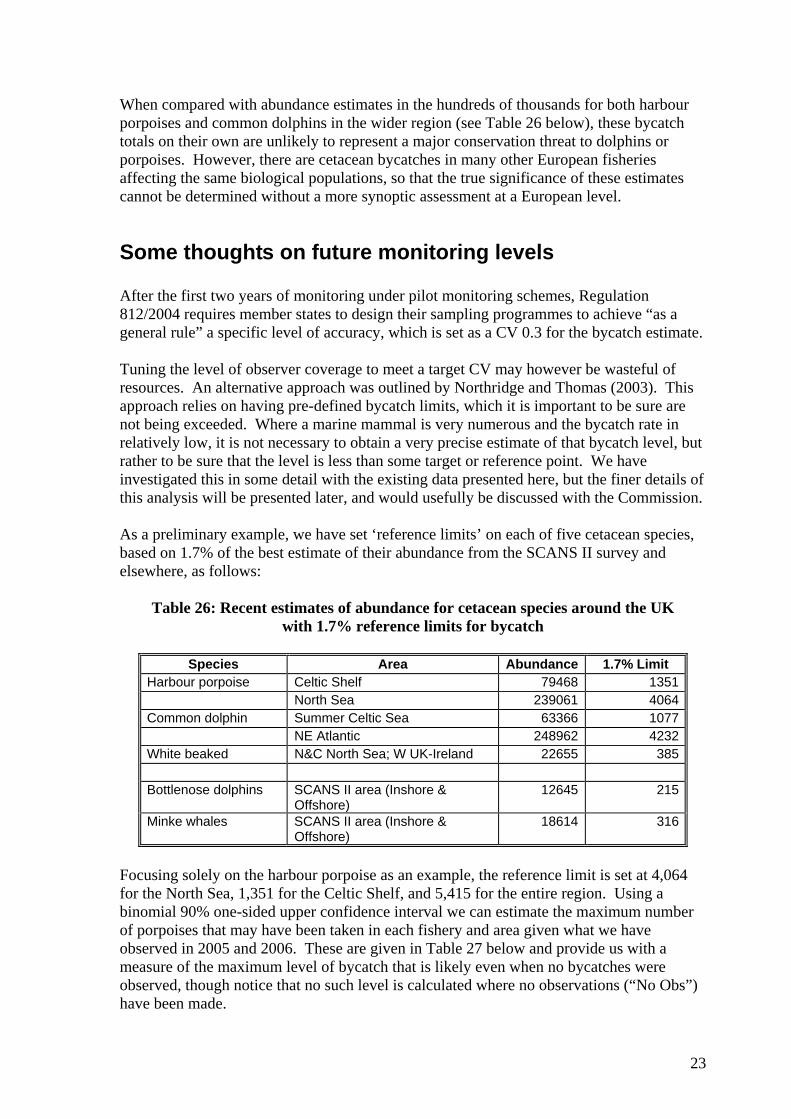
Some thoughts on future monitoring levels After the first two years of monitoring under pilot monitoring schemes, Regulation 812/2004 requires member states to design their sampling programmes to achieve “as a general rule” a specific level of accuracy, which is set as a CV 0.3 for the bycatch estimate. Tuning the level of observer coverage to meet a target CV may however be wasteful of resources. An alternative approach was outlined by Northridge and Thomas (2003). This approach relies on having pre-defined bycatch limits, which it is important to be sure are not being exceeded. Where a marine mammal is very numerous and the bycatch rate in relatively low, it is not necessary to obtain a very precise estimate of that bycatch level, but rather to be sure that the level is less than some target or reference point. We have investigated this in some detail with the existing data presented here, but the finer details of this analysis will be presented later, and would usefully be discussed with the Commission. As a preliminary example, we have set ‘reference limits’ on each of five cetacean species, based on 1.7% of the best estimate of their abundance from the SCANS II survey and elsewhere, as follows:
Table 26: Recent estimates of abundance for cetacean species around the UK with 1.7% reference limits for bycatch
Species Area Abundance 1.7% Limit
Harbour porpoise Celtic Shelf 79468 1351 North Sea 239061 4064Common dolphin Summer Celtic Sea 63366 1077 NE Atlantic 248962 4232White beaked N&C North Sea; W UK-Ireland 22655 385 Bottlenose dolphins SCANS II area (Inshore &
Offshore) 12645 215
Minke whales SCANS II area (Inshore & Offshore)
18614 316
Focusing solely on the harbour porpoise as an example, the reference limit is set at 4,064 for the North Sea, 1,351 for the Celtic Shelf, and 5,415 for the entire region. Using a binomial 90% one-sided upper confidence interval we can estimate the maximum number of porpoises that may have been taken in each fishery and area given what we have observed in 2005 and 2006. These are given in Table 27 below and provide us with a measure of the maximum level of bycatch that is likely even when no bycatches were observed, though notice that no such level is calculated where no observations (“No Obs”) have been made.
23
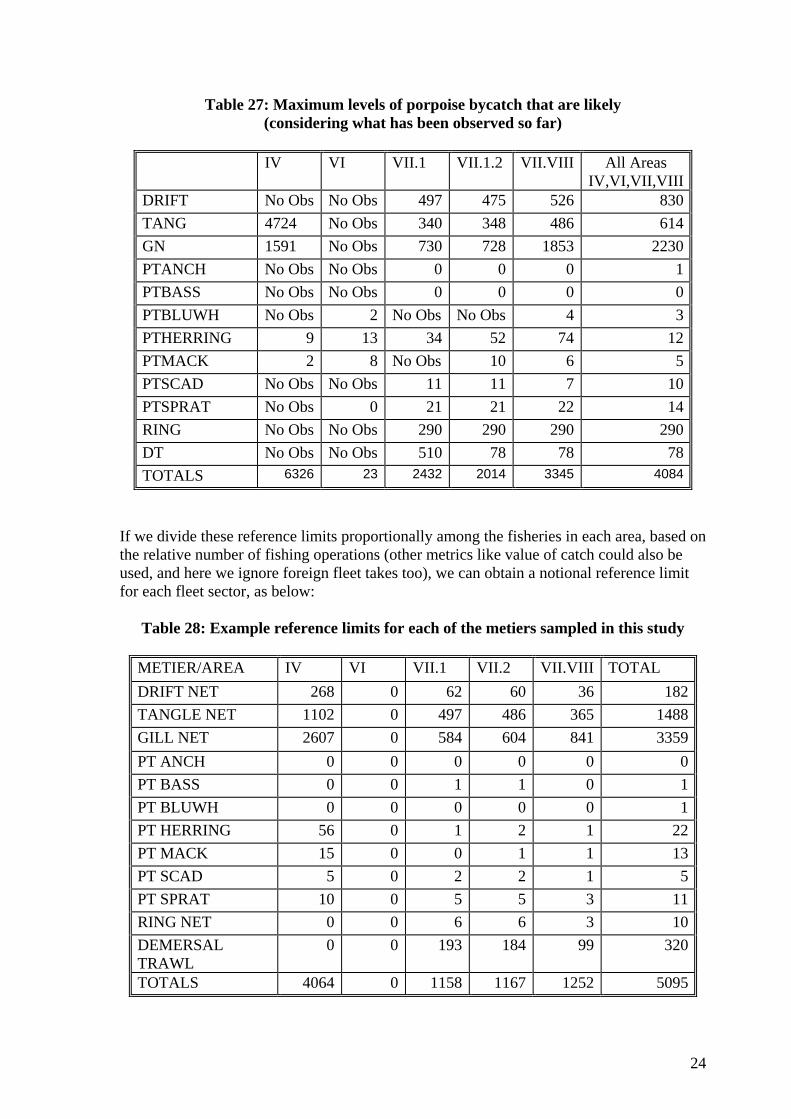
Table 27: Maximum levels of porpoise bycatch that are likely (considering what has been observed so far)
IV VI VII.1 VII.1.2 VII.VIII All Areas
IV,VI,VII,VIIIDRIFT No Obs No Obs 497 475 526 830TANG 4724 No Obs 340 348 486 614GN 1591 No Obs 730 728 1853 2230PTANCH No Obs No Obs 0 0 0 1PTBASS No Obs No Obs 0 0 0 0PTBLUWH No Obs 2 No Obs No Obs 4 3PTHERRING 9 13 34 52 74 12PTMACK 2 8 No Obs 10 6 5PTSCAD No Obs No Obs 11 11 7 10PTSPRAT No Obs 0 21 21 22 14RING No Obs No Obs 290 290 290 290DT No Obs No Obs 510 78 78 78TOTALS 6326 23 2432 2014 3345 4084
If we divide these reference limits proportionally among the fisheries in each area, based on the relative number of fishing operations (other metrics like value of catch could also be used, and here we ignore foreign fleet takes too), we can obtain a notional reference limit for each fleet sector, as below:
Table 28: Example reference limits for each of the metiers sampled in this study
METIER/AREA IV VI VII.1 VII.2 VII.VIII TOTAL DRIFT NET 268 0 62 60 36 182TANGLE NET 1102 0 497 486 365 1488GILL NET 2607 0 584 604 841 3359PT ANCH 0 0 0 0 0 0PT BASS 0 0 1 1 0 1PT BLUWH 0 0 0 0 0 1PT HERRING 56 0 1 2 1 22PT MACK 15 0 0 1 1 13PT SCAD 5 0 2 2 1 5PT SPRAT 10 0 5 5 3 11RING NET 0 0 6 6 3 10DEMERSAL TRAWL
0 0 193 184 99 320
TOTALS 4064 0 1158 1167 1252 5095
24

By comparing the upper confidence limit of the take in each fishery sector with that sectors’ limit, one can immediately see where problems may exist, that is either where the bycatch rate may exceed the limit or where not enough sampling has been done. The difference between the bycatch limit and the UCL for porpoises for each fleet sector in 2006 is given below:
Table 29: Differences between UCLs on bycatch estimates and reference limits by fishery metier and by area
METIER/AREA IV VI VII.1 VII.1.2 VII.VIII Total DRIFT NET No Obs No Obs -435 -415 -490 -648TANGLE NET -3622 No Obs 157 138 -121 875GILL NET 1016 No Obs -146 -124 -1012 1129PT ANCH No Obs No Obs 0 0 0 -1PT BASS No Obs No Obs 1 1 0 1PT BLUWH No Obs -2 No Obs No Obs -4 -1PT HERRING 48 -13 -32 -50 -73 11PT MACK 13 -8 No Obs -9 -5 9PT SCAD No Obs No Obs -9 -9 -6 -4PT SPRAT No Obs 0 -16 -16 -19 -2RING NET No Obs No Obs -284 -284 -287 -280DEMERSAL TRAWL
No Obs No Obs -317 107 22 243
TOTALS -2545 -23 -1081 -663 -1994 1331
Here it can be seen that the UCL for tangle nets in the North Sea exceeds the notional take rate for porpoises in that sector by over 3600 animals. This is because of very limited sampling in the North Sea which has resulted in a very high UCL on the bycatch estimate. On the other hand the difference between the UCL and the take limit for tangle nets in VIIefgh (VII-1) is positive, which means that even though the associated bycatch estimate CV is 0.4, we can still be sure that the total take of porpoises in tangle nets in the Celtic shelf is lower than the example limit we have allocated to this sector. A negative value for the whole of VI-VII-VIII indicates that we cannot be sure the result applies to the wider area, and perhaps should focus more sampling in areas such as VIIa,j, VIId and VIII. The large negative value for gillnets in VII and VIII reflects the very large amount of fishing effort here compared with the amount of sampling achieved to date. An elaboration of these methods and their results is beyond the scope of this report, but will be addressed in due course.
25
Implementation of Acoustic Deterrent Device Requirements (Articles 2 & 3 of Regulation 812/2004) The relevant UK authorities have not identified any vessels fishing in the fisheries specified in Annex 1(B) within ICES sub-area IV that require the use of pingers under Article 2 paragraph 1. In relation to fisheries defined in Annex 1(C), the UK’s Sea Fish Industry Authority (Seafish) has been working during the past two years with the industry to implement the use of pingers in the small fleet of over-12m vessels that are affected. Work was initiated in 2003, whereby all the existing pinger models at that time were tested in the hake gillnet fishery in divisions VIIe, f, and g. The practicalities of deployment of four different models were tested over approximately 100 shooting and hauling cycles. None of the designs were found to be sufficiently robust to recommend purchase to the industry for use in this fishery. Consequently, two of the pinger manufacturers modified their designs in response to the trials. Further Seafish trials tested the endurance of three pinger designs, with over 8000 shooting and hauling cycles monitored overall. Again, there were problems with deployment, durability and battery life and it was concluded that the available pingers were best described as a technology ‘under development’. Two pinger manufacturers made further modifications to the designs of their products, and a further short trial was conducted using these two models in early 2006. Despite design improvements, significant handling problems remain. Detailed descriptions and the results of these trials have been reported in three Seafish reports, the latest can be found at: http://www.seafish.org/upload/file/about_us/Pingers%20Extension%20Trial.pdf . One suggestion from the Industry, that is reflected in the Seafish Reports, is that a louder pinger design could enable pingers to be spaced more widely, thereby reducing some of the problems associated with handling and durability. To address this issue we have purchased several pingers made by an Italian company (STM model DDD02) which have a published source level of 165dB compared with the more usual 130-145dB for several other models. In theory, and under ideal conditions, a 165dB pinger should sound as loud at 2000m as a pinger of 145dB does at 200m. Reducing the number of pingers required per boat by a factor of 10 might substantially decrease the running costs and minimise the chances of entanglement and damage if pingers could be attached and reattached every haul. One potential problem, however, is that such loud devices might have a disproportionately aversive effect on cetaceans, effectively excluding them from wide areas. We have therefore begun to address this issue in a series of experiments off the coast of Cornwall comparing the relative abundance of dolphins and porpoises by acoustic (TPods and towed hydrophone arrays) and visual means. An initial survey along the coast identified an area of relatively high porpoise and dolphin density off The Lizard (a peninsula at around 5oW and 50oN). A 1 km fleet of nets with DDD-02 pingers at each end was deployed and retrieved twice, while 4 TPODs were deployed between 1.25km and 6.8km from the pingers and recorded continuously for a minimum of 36 days each. Acoustic and visual surveys were conducted prior to, during and after each pinger deployment. These data are currently being analysed, but should help understand the extent to which such devices might exclude cetaceans from the area around a net equipped with such devices.
26

References ICES, 2005. Report of the Working Group on Marine Mammal Ecology. Jepson, P.D. (editor) (2006) Cetacean Strandings Investigation and Co-ordination in the UK 2000-2004. Final report to the Department for Food and Rural Affairs. pp 1-79. http://www.defra.gov.uk/wildlife-countryside/resprog/findings/index.htm Northridge, S, 2006. Dolphin Bycatch: Observations And Mitigation Work In The UK Bass Pair Trawl Fishery 2005-2006 Season. Occasional Report to DEFRA October 2006. Northridge, S. and L. Thomas, 2003. Monitoring levels required in European Fisheries to assess cetacean bycatch, with particular reference to UK fisheries. Final report to the Department for Environment Food and Rural Affairs, European Wildlife Division. August 2003
Acknowledgements We are grateful to our colleague Sinead Murphy for help in training and equipping observers, to Bob Reid and Jason Barley at the Wildlife Unit at the Scottish Agricultural College’s Veterinary Science Division in Inverness for helping with an observer training session, to Sandy Robb and Craig Davis at FRS, Grant Course and Rob Forster at CEFAS and Richard Briggs and Greg Foster at AFBINI for their input on observations by their respective organisations.
27


![BYCATCH Catalog - Midyear 2011[1]](https://img.dokumen.tips/doc/110x75/54f613604a795949198b48ce/bycatch-catalog-midyear-20111.jpg)