Embed Size (px)
Citation preview

29
III. THE PRICING OF CRUDE OIL
“Leon Hess, whose oil company made more than $200 million by trading oil futures during the Persian Gulf crisis . . . said he longs for the days when oil company barons could get together and decide prices and supply levels largely among themselves, rather than depending on the violent price swings created by traders who react to rumors and headlines.
“‘I’m an old man, but I’d bet my life that if the Merc [New York Mercantile Exchange] was not in operation there would be ample oil and reasonable prices all over the world, without this volatility,’ Hess said at a hearing the Senate Committee on Governmental Affairs held on the role of futures markets in oil pricing.”
-- “Oil Baron Longs for Past, Not Futures,” Newsday, November 2, 1990
In 2002, the price of crude oil in the United States nearly doubled, climbing from $18 per barrel in January to over $34 per barrel in December. Since then, crude oil prices continued to climb and recently reached a 12-year high of nearly $40 per barrel. 34 Gasoline, home heating oil, jet fuel, and diesel fuel prices also have increased dramatically over this period.
To understand how filling the SPR became a major factor driving up oil prices, it is first necessary to understand how crude oil prices are determined in today’s markets.
The crude oil market is the largest commodity market in the world. The nations of the world consume approximately 70-80 million barrels of crude oil each day. To meet that demand, each day, hundreds of millions of barrels are traded on the crude oil spot, futures, and over-the-counter markets, with several times the world’s production of crude oil traded daily on the New York and London futures exchanges, and contracts worth hundreds of millions of dollars traded daily on the over-the-counter markets. The United States is the single largest consumer of crude oil, consuming about one quarter of the world’s production of crude oil, amounting to about 18 million barrels per day. The United States is also the largest crude oil purchaser and importer, importing about 60 percent of its oil needs, or about 10 million barrels per day. In the United States, most of this crude oil, approximately 90 percent, is refined into fuel products, such as gasoline, home heating oil, jet fuel, and diesel fuel.
Crude oil prices today are heavily influenced by producers, consumers, and traders buying and selling oil contracts or related financial instruments in various markets for crude oil. The development of a market-based system for determining the price of crude oil is a relatively recent advance in the petroleum industry. 35 Prior to the mid-1970s, crude oil prices were largely determined by fiat by a few large oil companies dubbed the “Seven Sisters.” Following the
34 The price of West Texas Intermediate crude oil on the New York Mercantile Exchange reached $39.99 on February 27, 2003. 35 See, e.g., Robert Mabro, Oil Markets and Prices, Oxford Institute for Energy Studies, Monthly Comment, August 2000.

30
nationalization of many of the Middle Eastern oil fields owned by these companies and the rise in power of the Organization of the Petroleum Exporting Countries (OPEC) cartel, crude oil pricing shifted from private companies to OPEC, which effectively controlled global prices from the mid-1970s until the mid-1980s. A variety of political and economic factors, including falling demand for crude oil and rising production by non-OPEC members, precipitated a collapse of the OPEC administered pricing system in the mid-1980s and the development of a market-based pricing system.
Nearly all commodity and financial markets have changed significantly since the mid-1980s, largely as a result of the revolutions in computer, communications, and information technology. The crude oil markets are no exception. Over the past 20 years, trading volumes on the crude oil futures exchanges have greatly increased, and in the past few years electronic over-the-counter (OTC) markets have emerged to rival the traditional futures markets.
This section of the Report provides an overview of the crude oil markets, including the spot, futures, and OTC markets. It describes the three “benchmark crudes,” which are used as a basis for the price of crude oils sold around the world, the major types of contracts by which crude oil is now sold and purchased, and the pricing mechanisms and related financial instruments that are now commonly used in futures and OTC markets. This section also outlines the varying degrees of regulation of the different crude oil markets in the United States, contrasting the extensive regulation of the futures exchanges with the near absence of regulation of trading in OTC markets.36
This section also describes in greater detail the markets for the three crude oils that serve as price benchmarks for all other types of crude oil – Brent, West Texas Intermediate (WTI), and Dubai. Additional detail is provided about the Brent market, including how the Brent spot, futures, and OTC markets interact and affect each other’s prices. The section also describes how the so-called “Arcadia squeeze” of the Brent market in 2000 spiked the price of Brent in the various markets, surprised industry observers, and dramatized the Brent market’s susceptibility to manipulation. This vulnerability continued for the next two years, until Brent market corrections were made in mid-2002.
Understanding the Brent market, its vulnerability to squeezes, and its relationship to other crude oil markets, such as the U.S. market for WTI, is critical to understanding how depositing significant amounts of Brent into the SPR in late 2001 and the first half of 2002 became a major factor driving up crude oil prices in the United States.
36 More detailed information on the regulation of commodity markets, including the crude oil markets, is provided in Appendices 1 and 2.

31
A. Overview of Crude Oil Markets
Crude oil prices are largely determined by supply and demand conditions in the global oil market, reflecting numerous transactions between buyers and sellers taking place around the world.
Most of the world’s crude oil is located within the boundaries of the countries belonging to OPEC, and OPEC has nearly all of the world’s estimated excess production capacity. OPEC attempts to set an average global price for crude oil by establishing production quotas for its members and meets regularly to adjust these quotas in consideration of the global balance between supply and demand. Because of its market power, OPEC decisions about the supply of oil significantly affect world oil prices. Nonetheless, its efforts have met with varying degrees of success, as OPEC members often have conflicting objectives and do not always adhere to the quotas, and production by non-member countries has increased in recent years. Economists disagree as to the effectiveness of OPEC as a cartel.
Global price levels are also affected by the level of inventories of crude oil and petroleum products in oil-consuming countries. When inventories are high, supplies are more plentiful, and prices tend to fall. Lower inventories mean tighter market supplies, which, in turn, push prices upward to bring more oil into the market.
Oil prices also depend on the supply and demand for the various types of crude oil produced in different oil fields. Crude oil streams with a low sulfur content (“sweet” crudes) or that are less dense (“light” crudes) than heavier crude oils are easier to process into the more valuable refined products, such as gasoline. To efficiently process the heavier crudes into lighter products, refiners must install additional, expensive refining equipment. Generally, therefore, light, sweet crudes are more expensive than heavy, sour crudes. Different refiners have adopted different strategies as to whether to make significant capital investments for more processing equipment in order to refine the cheaper heavier, sour crudes, or whether to forego the capital expenditures and continue to pay a premium for light, sweet crude oil. The price differential between light, sweet crudes and heavy, sour crudes at any given time depends on the relative capacity within the refining industry for processing these two types of crudes, the supplies of these crude oils, as well as the relative demand for lighter and heavier refined products.
The global crude oil market consists, therefore, of a number of sub-markets for crude oil, which are influenced by the characteristics of those crude oil streams, and the supply and demand balance for those particular types of crude oil. The price for any particular crude oil stream may deviate by as much as several dollars per barrel from the OPEC target or the global average, depending on the quality of the crude oil, the supply and demand situation in that particular sub-market, and local political and economic factors.
Crude oils produced in the oil fields around the world are grouped into several hundred separate crude oil streams. Almost all of these crude oil streams are priced in relation to the prevailing market price of one of the three “benchmark” grades of crude oil -- Brent crude oil produced in the North Sea territorial waters of the United Kingdom, West Texas Intermediate (WTI) produced in the U.S. Gulf Coast, and Dubai crude oil produced in the Middle East. Typically, other crude oil streams are priced at either a premium or a discount to the relevant
32
benchmark price, depending on the quality of the oil relative to the benchmark.37 The benchmark used for a particular purchase will depend upon the type of crude oil being purchased and the location of the purchaser.
There are several different types of markets for crude oil and related financial products. Most of the crude oil that is purchased for delivery is done pursuant to either a fixed-term contract or on the “cash” or “spot” market. There are also several well-established futures markets for crude oil, such as the New York Mercantile Exchange (NYMEX) and London’s International Petroleum Exchange (IPE), but futures contracts rarely result in actual delivery of crude oil. The futures markets serve mainly to spread the risks of price volatility and for price discovery.
In addition, there is an extensive over-the-counter (OTC) market for various types of crude oil contracts and a host of related complex financial instruments. Many of these financial instruments, such as swaps, serve to spread financial risk and discover prices, in the same manner as futures contracts. OTC transactions either are negotiated directly between OTC market participants, over the telephone through brokers, or, increasingly, on electronic exchanges.
1. Term Contracts
Much of the world’s crude oil is bought and sold using two-party “term contracts” covering multiple transactions over a specified length of time. These contracts specify the volumes to be delivered for the duration of the contract and fix the method for calculating the price of the oil. Although these contracts can cover as few as one shipment of oil or last as long as several years, they typically cover a number of shipments over a one-year period, and provide an option for renewal upon expiration. The contracts may also provide for different amounts of crude oil to be delivered at different times in the contract period.
Term contract prices are usually tied to the price of one of the three benchmark crude oils, plus or minus a quality adjustment. Crude oil delivered into the U.S. Gulf Coast usually is priced in reference to the price of West Texas Intermediate crude oil (WTI). Crude oil delivered into European markets or produced in West Africa usually is priced in reference to Brent crude oil. Crude oil delivered into Asia or the Middle East normally is priced in reference to the price of crude oil produced Dubai and Oman.
37 Benchmark pricing is discussed in more detail infra.

33
WTI
WTI WTI and Brent
Brent
Brent
Dubai
Brent and Dubai
Dubai
Figure III-1
Crude Oil Benchmarks
Benchmark Amount Priced off Benchmark Brent 40-50 million barrels/day (bpd) WTI 12-15 million bpd Dubai 10-15 million bpd
Source of data: Platts, Petroleum Intelligence Weekly
Term contracts for the sale of crude oil priced in relation to a benchmark also typically contain a “quality adjustment,” which is a negotiated dollar amount reflecting the difference in quality between the oil being purchased and the quality of the benchmark oil. Most often, the value of the quality adjustment will be fixed for the duration of the contract. Crude oil purchased under a term contract is usually tied to the spot price of the specified benchmark at the time the seller loads the crude oil into a cargo ship for transport to the purchaser.
Term contracts are negotiated through face-to-face meetings, or by telephone and fax, and are customized to the particular needs of the contract participants. These contracts are not traded on regulated exchanges or over-the-counter.

34
2. Crude Oil Spot or Cash Market
The crude oil spot market, also known as the “cash” market, is not a formal exchange like the NYMEX but rather an informal network of buyers and sellers. The spot market provides a market to dispose of or buy an incremental supply of crude oil not covered by contractual agreements, in response to the market’s current supply and demand conditions. Rising prices on the spot market indicate that demand is high and more supply is needed, while falling prices indicate there is too much supply for the market’s current demand level.
A spot market transaction is an agreement to buy or sell one shipment of crude oil at a price negotiated at the time of the agreement. The crude oil may be delivered immediately, or it may be delivered at some specified time in the future, in which case the contract is also known as a “forward” contract. Typically, spot market transactions are priced at the time the crude oil is loaded at the terminal for shipment.
The spot prices of the three major benchmark crudes – Brent, WTI, and Dubai -- serve as indicators for all of the crude oils bought and sold on the spot market. The spot price is typically guided by the prices of other recent spot transactions, as reported in Platts and other trade publications, and by reference to the futures prices quoted on the NYMEX for WTI or on the IPE in London for Brent.
Since the middle of the 1980s, increasing amounts of crude oil have been bought and sold on the worldwide spot market. Before 1979, less than three percent of all crude oil traded worldwide was traded on the spot market. By 1989, it was estimated that about one-third of all crude oil was traded on the spot market.38
Term cont racts and spot market transactions are the leading mechanisms for arranging for the physical delivery of crude oil. In the United States, term contracts and spot market transactions for crude oil are commercial transactions subject to state and federal law. Because neither type of transaction is considered a contract for future delivery, neither is subject to regulation under the Commodity Exchange Act (CEA), which regulates contracts for future delivery. Although the CEA makes it illegal to manipulate “the market price for any commodity,” in practice the Commodity Futures Trading Commission (CFTC) will scrutinize spot market transactions only in connection with an investigation of alleged misconduct involving the futures market. In short, crude oil term contracts and spot transactions are important mechanisms for the delivery of crude oil yet are not subject to commodity market regulation. 39
38 General Accounting Office, GAO/RCED-93-17, 37; Platts Oilgram Price Report, November 28, 2001; and DOE/EIA. 39 Subcommittee interview with CFTC staff.

35
3. Crude Oil Futures Markets
While term contracts and spot transactions involve the trade of physical barrels of oil for immediate or deferred delivery, the futures markets involve the purchase and sale of contracts for the future delivery of crude oil. A “futures contract” is a standardized contract by a buyer to accept and a seller to deliver a given quantity of a particular commodity at a specified place, price, and time in the future. For example, the standard crude oil futures contract traded on the NYMEX specifies 1,000 barrels of WTI crude oil to be delivered at Cushing, Oklahoma, at a specified date in a future month. 40 By law, futures contracts generally must be traded on regulated commodity exchanges.41
Rather than provide a mechanism for the actual delivery of physical volumes of crude oil, however, the primary purposes of futures contracts are to allow market participants to spread the risk of price volatility and to provide a mechanism for price discovery. Indeed, one of the major differences between a forward contract and a futures contract is that in the former delivery is intended whereas in the latter it is not.42
The first function of a futures contract, risk spreading, occurs as producers and consumers buy or sell futures contracts that fix the price of future purchases or sales and thereby reduce the risk of price volatility and uncertainty prior to delivery. For example, a producer of crude oil may be concerned that the price of crude may fall in the future. At the same time, a refiner may be concerned that the price of crude may rise. By entering into a futures contract that fixes the price of crude oil to be delivered in the future, both the producer and the refiner can protect themselves against adverse price movements. Alternatively, a speculator may be willing to enter into a futures contract with either a producer or a refiner and be willing to bear the risk of a price movement in return for the possibility of speculative gains from those price changes.
A broad range of participants in the oil industry use the futures markets. In addition to crude oil producers and refiners, oil trading firms, petroleum-product end users, financial institutions, and investment funds also account for significant trading volume. For example, a number of airlines use crude oil futures to hedge the cost of jet fuel. A number of investment banks use crude oil and other energy-related futures to hedge against changes in energy costs, which affect many of their other investments.
40 The contract actually provides for the delivery of several types of domestic and foreign crude oil streams, with either a discount or premium per barrel based on the specific crude the seller delivers. The standard NYMEX light sweet crude contract lists the specifications of the deliverable grades of crude oil with the specified discounts and premiums. This contract may be traded within a 30-month period prior to the date of delivery specified in the contract for the oil. NYMEX also offers standard light, sweet crude contracts for delivery of WTI crude oil 3, 4, 5, 6, and 7 years into the future. 41 Exceptions to this general rule are discussed later in this Section and in Appendix 2. 42 See Commodity Futures Trading Comm. v. Co Petro Marketing Group, Inc., 680 F.2d 573 (9th Cir. 1982).

36
Figure III-2Participants in NYMEX Crude Oil Futures
Oil Traders40%
Refiners9%
Integrated Oil Cos.13%
Producers1%
Marketers5%
End Users1%
Floor Traders5%Investors
7%Investment Funds5%
FinancialInstitutions
13%
Fig. III-2. Ownership of outstanding NYMEX crude oil futures contracts, by market sector, January - October 2000. Source of data: NYMEX.
The second function of the futures market, price discovery, occurs as market participants bring to the marketplace their knowledge of current supply and demand conditions and their expectations about the future. Prices change frequently as the participants revise or reevaluate their expectations on the basis of new information, and buy and sell futures contracts in accordance with those expectations. As a futures contract approaches the delivery date, the price of the first forward month should approach the spot price.

37
Basic Terms Used in Futures Markets
A purchaser of a futures contract that provides for delivery of a commodity to the holder of the contract at a future date is said to be long in the commodity. The holder of a futures contract that requires the contract holder to deliver the commodity at a future date is said to be short in that commodity. At any given time, the number of shorts must exactly balance the number of longs. Because futures contracts are not generally used to obtain or deliver actual commodities, holders of futures contracts generally will square out their positions (i.e., buy back from the market the amount of the commodity that previously had been sold, or sell back to the market that which previously had been bought) before the expiry of the contract, meaning the date on which the contract expires, at which time the remaining holders of outstanding contracts will be required to accept or make physical delivery of the commodity. See, e.g., Chicago Board of Trade, Agricultural Futures and Options (1998).
Standardized Contracts
The standardization of futures contracts facilitates the trading of these contracts, and is one of the major advantages of purchasing a contract that can be traded on an exchange. Typically, to execute a trade involving a standardized futures contract on an exchange, the only contractual term that must be negotiated for the sale or purchase of that contract is the price. On a commodities exchange, this takes place through either the open outcry system, which is the traditional system of traders and brokers signaling and shouting to each other bids and offers in trading pits located on the exchange floor, or through an electronic exchange, where the bids and offers are posted and matched electronically, without any face-to-face contact between the parties or their brokers. The NYMEX uses the open outcry system for trading crude oil and other commodity contracts, whereas the IPE plans to discontinue pit trading and switch to all-electronic trading.
Because the contracts are standardized, a single futures contract can be traded many times before the delivery date specified on the contract, each time at a new price as the market’s supply and demand situation changes. Since futures contracts rarely are used to obtain or make physical delivery, the volume of crude oil traded under these contracts can far exceed the actual available volumes of the underlying commodity. In fact, in recent years the total volume of crude oil represented in open NYMEX light sweet crude oil contracts typically has been over 110 times the daily production of all crude grades deliverable under the contract.43 On average, less than one-tenth of one percent of these oil futures contract results in the actual delivery of crude oil. For example, over the 7 years that the December 2001 NYMEX light sweet crude oil contract was traded, 5 billion barrels were traded, but only 31,000 barrels were actually delivered on those contracts.44
43 Information provided to Subcommittee staff by NYMEX. 44 Information provided to Subcommittee staff by NYMEX.

38
Futures trading of crude oil on NYMEX began in 1983, and today the volume of the WTI crude oil futures contract traded on the NYMEX is the largest of any physical commodity traded in any futures market. For example, in 2001, over 37.5 million crude oil futures contracts - each for 1,000 barrels of WTI crude oil - were traded on the NYMEX. 45 Although the NYMEX also offers a futures contract for Brent crude oil, trading in this contract remains limited. The majority of futures contracts for Brent crude oil are traded at the IPE in London.
Exchange Membership and Clearinghouse
A commodity futures exchange like the NYMEX is similar to a stock exchange in that it is an association of members who own seats on the exchange and who can trade on the exchange. The members of an exchange generally fall into several categories: the commercial producers and purchasers of the commodities traded on the exchange, speculators, and brokers. Members may trade on the exchange for their own account or for others; nonmembers must trade through brokerage firms.
A key feature of an exchange is a clearinghouse, which is operated by or on behalf of the exchange. Generally, a number of firms that are members of the exchange own and operate the clearinghouse. In addition to keeping track of all the trades that occur on the exchange each day, all trades must be cleared through the clearinghouse, and the clearinghouse guarantees performance on all the contracts traded on the exchange. When two customers buy and sell futures contracts on an exchange, each of their brokers actually conducts the transaction through the clearinghouse rather than by bringing the customers together. In effect, the clearinghouse acts as a party to every transaction. Thus, when customers want to sell back or buy back futures contracts, they do not need to find the original counterparty; rather they need only find another party interested in a new transaction, and the trade is again conducted through the clearinghouse.
To guarantee contract performance, the members of the clearinghouse deposit funds into the clearinghouse. The rules of the exchange also require brokers trading through the clearinghouse and their customers to post deposits or “margins,” related to the value of the positions taken in their trades, to cover any losses that may occur. At the end of each day of trading these margin accounts are “marked-to-market” -- the exchange collects money from accounts that have lost value and credits those accounts that have gained value -- so that sufficient funds to guarantee performance are on deposit at all times. In this manner, “counterparty risk” -- the risk that the other party to a trade will default on performance -- is virtually eliminated.
Traditionally, one of the major advantages of trading on an approved exchange rather than over-the-counter has been that the exchange guarantees financial performance and removes counterparty risk, whereas in the over-the-counter market each party to each contract assumes the risk that the other party may fail to perform.46 According to the Chicago Board of Trade,
45 Information provided to Subcommittee staff by NYMEX. In addition to the trade in futures contracts, options to buy or sell futures contracts are also traded on the NYMEX. Options also are popular instruments used for hedging and speculating. For simplicity, the following discussion refers only to futures. 46 But see infra, which explains that OTC traders can now trade instruments backed by a clearinghouse.

39
which uses a clearinghouse, “the success of this system is obvious. Since its start in 1925, no customer within or outside of the [CBOT] exchange has lost money due to default on a futures position.”47
Market Oversight
The trading of futures contracts on the NYMEX and the other approved commodities exchanges in the United States is regulated by the Commodity Futures Trading Commission (CFTC) under the Commodity Exchange Act (CEA).48 The goal of federal commodity market regulation is to ensure that the exchanges remain “a means for managing and assuming price risks, discovering prices, or disseminating pricing information through trading in liquid, fair and financially secure trading facilities.”49 The primary objectives of the CEA are “to deter and prevent price manipulation or any other disruptions to market integrity; to ensure the financial integrity of all transactions subject to this Act and the avoidance of systemic risk; to protect all market participants from fraudulent or other abusive sales or practices and misuses of customer assets; and to promote responsible innovation and fair competition among boards of trade, other markets and market participants.”50
A cornerstone of the CEA is the system of self- regulation by the exchanges. Although the CFTC is the federal agency responsible for regulating the futures markets, and has authority to issue civil penalties for violations of its regulations,
47 Chicago Board of Trade, Action in the Marketplace. 48 7 U.S.C. §1 et seq. 49 Id., at §3. For more information on the regulation of commodity markets, see Appendices 1 and 2. 50 Id.
Regulation of IPE Brent Contracts
In the United Kingdom, the futures and over-the-counter (OTC) markets are regulated by the Financial Services Authority (FSA). Brent IPE contracts are traded in a manner similar to the trading of NYMEX WTI contracts, and many of the principles underlying the U.K. system commodity market regulation are similar those of the U.S. system. There are also several significant differences. The U.K. “Code of Market Conduct” governing the U.K. futures exchanges and OTC markets is less prescriptive than the regulatory system under the CEA, emphasizing adherence to general principles of conduct rather than detailed regulations.
Additionally, the U.K. “light touch” regulatory system provides for less stringent regulation of “professional” markets, such as the IPE’s crude oil market, as opposed to markets in which retail investors participate. The rationale for the light touch system is that large institutions and market professionals are sophisticated investors who have less need for protective government oversight than small investors. As explained in Appendix 2, U.S. law exempts certain large market participants trading certain OTC instruments from many CEA requirements, but applies the full array of CEA requirements to the trading of crude oil futures contracts on the NYMEX.

40
and to refer potential criminal violations to the Department of Justice for prosecution, 51 the exchanges themselves have the front-line responsibility for ensuring that trading remains orderly, commodities brokers are properly qualified and registered, sufficient margins are posted to guarantee contract performance, and fraud or market manipulation is detected and stopped. To be permitted to trade futures, an exchange must establish rules and regulations for trading, as well as market oversight and surveillance programs, in accordance with the requirements of the CFTC under the CEA. An exchange whose self- regulatory programs and futures contracts have been approved by the CFTC is termed a “designated contract market.” Generally, a futures contract for a commodity regulated under the CEA must be traded on a designated contract market.52 A list of currently active designated contract markets is provided in Table A.2-1 in Appendix 2.
To ensure orderly trading, the exchanges have established daily price limits for most commodity futures contracts (limiting the amount the price can increase or decrease in one day); position limits for the clearing members of the exchange (so that each clearing member has sufficient capital to cover its commitments); position limits for customers with contracts expiring in the current delivery month (to prevent squeezes of the commodity in the final month of the contract); and reporting requirements for customers with large positions in the futures and options markets. The market oversight and surveillance programs of each exchange monitor price movements, trading practices, and the accumulation of large positions in order to detect potential manipulations and squeezes and take corrective measures before the market is disrupted.
Price Transparency
Each time a transaction is completed on the floor of an approved exchange, the exchange records the pairing of buyers and sellers and reports the transaction price. These prices are available throughout the day from the exchanges via the Internet,53 are published in specialty trade publications and daily newspapers, and are reported on a weekly basis by the Department of Energy’s Energy Information Administration. The timely availability of contract prices improves price transparency – the ability of any market participant to see the prevailing price level – and makes futures market contracts a price reference for negotiations in the spot and term contract markets.54
51 Less than a handful of criminal prosecutions have been brought for violation of the CEA. Markham, Manipulation of Commodity Futures Prices – The Unprosecutable Crime , 8 Yale J. on Reg. 281, n604 (1991). 52 The exceptions to this general rule are discussed infra. 53 See, for example, NYMEX website, at http://www.nymex.com. 54 DOE/EIA-0545(99), Petroleum: An Energy Profile: 1999, July 1999, 54-55; DOE, EIA, Oil Market Basics; GAO/FREC-93-17, 34-37; NYMEX website, at http://www.nymex.com; and February 11, 2002, meeting with NYMEX representative.

41
Price Risk and Hedging
The most straightforward use of the futures market by a crude oil producer or refiner is to “hedge” against adverse price movements by locking in the prevailing price for future deliveries. For example, an oil producer can establish a sales price for oil that will be produced later by selling a futures contract. Then, if a drop in market price causes the value of the oil to decline, the decline in the value of the oil sold in the physical market will be offset by the gain in the futures market made when the futures contract is bought back later at a lower price. Conversely, a refiner may want to fix the price that must be paid for crude oil that will be needed in the future. To do so, the refiner could purchase a futures contract for delivery of oil at a specified date in the future. If the price of crude oil increases in the cash market, the refiner’s increased costs in the physical market when the crude oil is bought will be compensated for by its gain in the futures market when at the same time the refiner sells back the futures contract at a higher price. By limiting the uncertainty over future costs, hedging allows companies to offer fixed price arrangements to its customers for its products and to plan and budget for the future without having to bear all of the risk of price changes.55
In general, crude oil refiners are more concerned with ensuring they receive adequate margins for their products rather than absolute price levels. It does not necessarily matter to a refiner whether crude oil is at $20 per barrel and gasoline is selling at $23 per barrel, or crude oil is at $25 per barrel and gasoline is selling at $28 per barrel - the $3 per barrel margin is the same in both cases. What matters to a refiner is the difference between the price of crude oil and the price of refined products, such as gasoline. To protect their margins, crude oil refiners will adopt trading strategies that protect against changes in relative price levels rather than lock in absolute price levels. These strategies typically involve the simultaneous buying and selling of futures contracts for different commodities, such as crude oil and gasoline futures, or the simultaneous buying and selling of futures contracts for the same commodity in different futures months. These strategies, termed “spread trading,” can be effective in locking in margins and protecting against unanticipated changes in price.
Similarly, crude oil traders, like commodity traders in general, are not so much concerned with absolute prices as they are with relative prices. Whether crude oil is at $20 or $25 per barrel is not nearly as important to a trader as whether crude oil was bought for less than it can be sold, or was sold for more than it can be bought. Crude oil traders frequently use spread trading to lock in the margin between buying and selling.
Although exchange-traded futures contracts are standardized with respect to the type and quantity of deliverable commodity, standardized contracts can be used to hedge or speculate on price movements for a much broader range of commodities when there is a fairly predictable relationship between the commodity being hedged and the commodity in the standardized contract. Because the price of most crude oil is priced relative to WTI or Brent, the futures
55 The term “hedge” means to take one position in one transaction, such as selling a commodity, and the opposite position in another transaction, such as purchasing the commodity, to minimize the possibility of losses from one of the transactions. The word hedge “evolved from the notion of the common garden hedge as a boundary or limit . . .” Roger Lowenstein, When Genius Failed (Random House, 1999), at 25.

42
markets for WTI and Brent are used to hedge or speculate on price movements of many varieties of crude oil. Thus, for example, a purchaser of crude oil produced in Nigeria -- which is priced at a differential to Brent -- could use the IPE Brent futures market to hedge against movements in the price of Nigerian crude. Even with this hedge, however, a producer or consumer of Nigerian crude oil would continue to be exposed to the risk of a variance from the normal differential between Nigerian crude and Brent. Such variances could be caused by a variety of global or local conditions, such as political events in Nigeria or United Kingdom, changes in commodity exchange rates, or changes in the local supply and demand conditions affecting Brent or Nigerian crude.
This latter type of risk is part of a price risk that generally can never be completely hedged – namely, the variance between the spot or cash price and the futures price of a commodity. While the cash price of a commodity and the futures price of the commodity generally converge at expiry of the nearest-month contract, this convergence exists only for delivery of standardized quantities at a particular location on a particular date. Because most purchasers or sellers of commodities would like their purchases and sales to occur somewhere other than the specific location in the standardized futures contract and at a time other than the particular date on which a futures contract expires, the cash price for these particularized transactions will differ from the standardized futures price even at expiry. The risk that the cash price of a commodity will differ from the futures price of that or another commodity used for hedging purposes is known as “basis risk,” the “basis” being the difference between the cash price and the futures price at a given location and time.56
Arbitrage
Although absolute price movements are impossible to forecast accurately, it is possible to make predictions about the relative prices of commodities in various markets, both cash and futures. Many commodities have seasonal supply and demand trends, and prices tend to follow corresponding seasonal patterns. For example, although the absolute level of future gasoline prices are impossible to predict, gasoline prices in the United States tend to be higher in the summer, when demand is greatest. Traders use these patterns to minimize price risks and costs.
In situations in which several different markets exist for the same commodity, or similar commodities, different prices may arise for the same or similar commodities, either in the cash market or in the futures markets. Local supply and demand conditions may influence one market more than another, traders in different markets may have different information upon which the market prices are based, or different traders may evaluate the same information differently.
56 Typically, the local basis of a commodity will be determined by transportation costs, storage costs, interest rates, and local supply and demand conditions. To minimize risk, or to attempt to obtain profits when cash and futures diverge from their historical relationships, commodity producers, purchasers, and traders closely follow the relationship between cash and futures prices and will structure their trades accordingly. These patterns and relationships are used to determine whether or not to accept cash bids for a particular commodity; which buyer or seller to use; when to purchase, store, or sell a particular commodity; when to terminate a hedge on the futures market; and which future month of a commodity to use for hedging or speculation. Chicago Board of Trade: Understanding Basis: Improving Margins Using Basis (1998).

43
Different markets for the same or similar commodities are linked together by the principle of “arbitrage.” “The general notion of cash arbitrage is that traders purchase goods where they are cheapest and simultaneously sell them where they are most expensive. In cash markets, arbitrage opportunities occur when prices in the two markets differ by more than transportation costs between the markets.”57 In futures markets, opportunities for arbitrage arise when traders believe that futures prices for one commodity at a particular time in the future depart from their historical relationship either to the cash market, the futures prices for another commodity, or the price of the same commodity at another time in the future.58
Hence, although there are three major benchmarks and a number of distinct, local markets for crude oil, these crude oil benchmarks and markets, both cash and futures, are linked together by the concept of arbitrage. Arbitrage trading between the Brent markets and the WTI markets, both of which are light sweet crudes, to a large extent determines the price and amount of oil imported into the U.S. from the Atlantic basin. On average, Brent is less expensive than WTI by about $1.50 per barrel, and it costs between $1.00 and $1.50 per barrel to ship Brent across the Atlantic in a large tanker. Because supply and demand conditions in the European markets and the U.S. markets may differ at any given time, the difference between the price of Brent and the price of WTI can vary from this average. When the price of Brent plus the cost of transporting Brent across the Atlantic is less than the price of WTI, refiners will import more Brent and Brent-priced crudes. When the price of Brent plus the cost of transporting Brent across the Atlantic is more than the price of WTI, refiners will import less Brent and Brent-priced crudes, and instead rely more upon crude oil produced in North and South America, as well as crude oil in domestic inventories. The Brent-WTI price difference, therefore, is one of the most significant factors determining the price and volume of the transatlantic crude oil trade.
A significant amount of commodities and financial trading today consists of sophisticated and complex arbitrage trading designed to exploit differences between the various markets. This type of arbitrage trading brings additional liquidity to the market and helps bring the various markets into an overall equilibrium.59
57 Steven Errera and Stewart L. Brown, Trading Energy Futures & Options, at 40 (1999). 58 Warren Buffet reportedly once said, “Give a man a fish and you feed him for a day. Teach him how to arbitrage and you feed him forever.” Kirk Kinnear, The Brent/WTI Arb (NYMEX website). 59 The Long-Term Capital Management (LTCM) debacle demonstrates how even sophisticated arbitrage trading carries risk. LTCM’s strategy was to exploit differences in currency exchange rates, bond prices, interest rates, and other financial instruments, based on mathematical models of the historical prices and volatilities of those instruments. Although LTCM initially earned several billion dollars, with annual returns greater than 40 percent, after Russia devalued the ruble and defaulted on its bonds, an event not anticipated by the model, the fund “blew up” and spiraled into near-bankruptcy, ultimately requiring a multi-billion dollar bail-out by the Wall Street firms and banks with which it had la rge outstanding trades. See Inventing Money, supra ; When Genius Failed, supra .

44
4. Over-the-Counter Markets
“Derivatives are financial instruments that have no value of their own. That may sound weird, but it is the secret of what they are all about.”
-- Peter L. Bernstein, Against the Gods (Wiley, 1998)
A derivative is any type of financial instrument that derives its value from an underlying commodity or market index. Strictly speaking, forward and futures contracts are types of derivatives, since their value derives from the value of an underlying commodity.
OTC trading instruments also derive their value from an underlying commodity or market index but, unlike futures contracts, are not traded on a regulated commodities exchange and generally are not used by or offered to small businesses or retail customers. Initially, OTC derivatives were developed as customized devices to meet the particularized needs of parties to protect themselves against adverse price movements in financial and commodity markets, in situations in which such risks could not be adequately addressed by the use of standardized futures contracts on the regulated exchanges. Until recently, the terms of most OTC instruments were negotiated directly between the two parties to the transaction, either face-to-face or through brokers over the telephone.
As OTC derivatives became more popular, parties to these instruments became interested in trading these instruments to help spread risks further. As a result, there has been a rapid growth in the use of standardized OTC derivatives and in the use of electronic exchanges to match parties seeking to trade OTC derivative instruments.
Although the OTC market can provide the parties with more flexibility in crafting particularized instruments than the futures markets, the traditional OTC markets present a number of additional risks as well. In the typical OTC transaction, each party assumes the credit risk that the other party will not perform. There is no “OTC clearinghouse” to guarantee performance. In addition, unlike futures contracts, many individually negotiated OTC instruments are not transferable to third parties without the consent of both parties to the original transaction. Additionally, there is less price transparency in most of the OTC markets than on the designated exchanges. There is also less government oversight to detect and prevent market manipulation and fraud in the OTC markets than on the designated exchanges.
Despite these drawbacks, the overall market for OTC derivatives is now estimated to be several times larger than the exchange-based futures markets. At the end of 1998, the estimated total notional amount of outstanding OTC derivative contracts was $80 trillion, whereas the estimated total value of outstanding exchange-traded futures and options contracts was $13.5 trillion. 60 The vast majority of OTC derivatives contracts are interest rate and foreign currency 60 Report of the President’s Working Group on Financial Markets, Over-the-Counter Derivatives Markets and the Commodity Exchange Act, November 1999. The notional amount in a swap represents the value of the commodity or index underlying the swap, not the actual value swapped. Because there are no reporting requirements for OTC commodity transactions, more specific data with respect to commodity derivatives traded on the OTC markets is not available.

45
exchange contracts; only a small fraction of the total relates to tangible commodities such as crude oil. The OTC commodities trade is nonetheless substantial; in 1999, the notional value of OTC commodities contracts was estimated at approximately $1.8 trillion. 61
Normally, only large financial institutions, corporations, or commodities firms participate in OTC markets. Many of these traders, however, use both the OTC markets and the regulated exchanges. Traders who trade on the designated exchanges often prefer the advantages of a market with more participants and trades (“liquidity”), the greater price transparency provided by the exchanges, and the performance guarantees provided by the exchange clearinghouses. Traders who participate in the OTC markets may prefer the flexibility offered through individualized transactions, have a greater capacity to assume credit risks than other traders, and seek to avoid brokerage fees and margin payments required on the exchanges. Some traders may prefer the lesser degrees of transparency and regulatory oversight.
OTC Swaps
A key type of OTC instrument used by oil and other commodity traders is a derivative known as a “swap.” Swaps were originally developed in the financial markets to hedge against fluctuations in currency exchange rates, interest rates, bond rates, and mortgage rates. Increasingly, they are being used in commodity markets to hedge against fluctuations in commodity prices. Like a futures contract, a commodity swap locks in the value of a commodity at a particular price. For example, in a swap for crude oil to be delivered in the future, the seller will agree to pay the buyer for any increases in the price of crude oil above an agreed-upon value between the time the contract is entered and the time the crude oil is delivered, while the buyer will agree to pay the seller for any decreases below the agreed-upon value.
In both the commodities and financial markets, there are an endless variety of swaps, individually tailored to address the particular risk and speculative strategies of market players. Definitive data regarding the magnitude of the swap market and the type of instruments used is impossible to obtain, however, since there is virtually no regulation of any swaps market.
One of the major advantages of the swaps market is that swaps can be used to hedge against price changes for commodities for which there is not a market on the designated exchanges. To continue with a previous example, a crude oil refiner intend ing to purchase Nigerian oil could use a swap to hedge that part of the price risk that cannot be hedged by purchasing a Brent futures contract. The refiner could purchase a Brent futures contract to hedge that part of the price of the Nigerian crude that is linked to the price of Brent, and then enter into a swap with another party to hedge the risk that the price of Nigerian crude may vary from the price of Brent crude by a fixed differential. The “price” of this swap would be the price of Brent on the IPE plus the fixed differential between Brent and Nigerian crudes. Through this type of swap, basis risks remaining after futures contracts are bought or sold can be minimized.
61 Information on Intercontinental Exchange (ICE) website, as of October 2002.

46
Because swaps allow more precise risk management for commodity traders they have become increasingly popular. Since these commodity swaps are often linked to the value of a commodity traded on a designated futures exchange, the growth in the use of such swaps has contributed to a corresponding growth in trading volume on the designated exchanges. In this manner, the price discovery and hedging functions of the designated exchanges and the OTC swaps market are now intertwined.
Most swaps involving energy contracts, metals, and financial instruments are excluded from the extensive regulatory structure that the Commodity Exchange Act applies to the trading of futures contracts.62 These statutorily excluded swaps include any swap transaction involving a non-agricultural commodity or financial instrument, between large market participants,63 provided the transaction is individually negotiated and not executed or traded on a “trading facility,” meaning an exchange- like facility where multiple bids and offers are made and accepted. Under current law, then, bilaterally negotiated swap agreements involving crude oil are excluded from all regulation under the CEA.
62 Appendix 2 provides more detailed information on the exclusions and exemptions for OTC energy contracts. 63 These large market participants, termed “eligible contract participants,” include financial institutions, brokers and dealers, corporations with more than $5 million in assets, and individuals with more than $10 million in assets. 7 U.S.C. §2(g) (West Supp. 2002).
Example of a Crude Oil Swap
In April a refiner is planning its crude oil purchases for December. The NYMEX price for December delivery of WTI is $25 per barrel, and December gasoline futures are at $30 per barrel. The refiner wants to lock in this $5 margin for 10,000 barrels. A Wall Street investment firm believes that over the same period the Euro will weaken relative to the dollar, making European crudes cheaper for U.S. refiners to import, and therefore WTI will fall in price. Neither firm is concerned about non-performance by the other, since they both have significant assets. In the swap, they agree that in December, if the NYMEX price for December delivery has increased above $25, the Wall Street firm will pay the refiner the difference, and if the price has decreased, the refiner will pay the Wall Street firm the difference. Thus, if the December price rises to $26, the Wall Street firm will pay the refiner $10,000 (10,000 barrels at $1 per barrel). The refiner’s net cost for crude oil in December is still $25 per barrel ($26 per barrel market price minus $1 per barrel payment from the Wall Street Firm). If the December price falls to $24, the refiner will pay the Wall Street firm $10,000, yet its net cost for the crude still will be $25 per barrel ($24 market price plus $1 payment to the Wall Street firm).
Although the swap is a hedge for the refiner, it is speculation for the Wall Street firm, since the firm will profit if the price of WTI falls as it projects, but lose if the market moves in the other direction. Should the Wall Street firm decide it no longer wishes to speculate on the price of December crude oil, it could buy a NYMEX December futures contract for WTI, in which case it too would be hedging. Although the notional value of this swap is $250,000 (10 barrels x $25/barrel), the actual payments will be much less.
47
OTC Electronic Exchanges
Although OTC market participants desire flexibility to craft instruments to address their particular risk strategies, at the same time they would like to be able to trade these instruments when market conditions change. Thus, although there is a large amount of innovation and customization in the types of instruments that are traded on the OTC markets, there also is a movement towards the standardization of features to facilitate the trading of these instruments.
Recently, a number of companies have created organizations and facilities to take advantage of the growing desire to trade in OTC instruments. Generally, they have used strategies that fall into two broad categories. The first, typified by “Enron Online,” provides an OTC trading facility in which the company hosting the facility acts as the counterparty to all of the other parties seeking to buy or sell instruments. These are termed “one-to-many” facilities because one party acts as the counterparty to many other parties. The Enron scandal has exposed a number of weaknesses in this business model, as it provides the one counterparty with significant market power and knowledge that can be used to manipulate the market at the expense of all of the other traders.
The second approach, which has become the most successful type of OTC trading facility, is the “multilateral transactional facility,” whereby an organization provides an electronic trading “platform” that facilitates OTC trading between the parties using the platform, but does not provide clearinghouse operations to guarantee performance or monitor trades.
Using this second approach, in 2000, several investment banks and oil companies formed the Intercontinental Exchange (“ICE”) to trade in OTC energy and metals derivatives.64 Located in Atlanta, Georgia, the ICE is an electronic exchange open only to large commercial traders.65 Rather than provide a counterparty to all trades, as do the NYMEX and IPE clearinghouses, ICE acts only as a posting facility for bids and offers, which the traders can then choose to accept or reject.66 Any large commercial company can trade on ICE’s facility without having to employ a broker or pay a fee to a member of the Exchange. All trades are bilateral deals between the buyers and sellers. There is no clearinghouse and, accordingly, no requirement to post margins. The ICE website advertises: “There are no memberships. No artificial restrictions. No dues or fees beyond those incurred in the trading itself.”
Although ICE does not require exchange memberships or operate its own clearinghouse, it has established an alternative system for traders to protect against counterparty credit risk. ICE has arranged for traders using the ICE trading platform to apply to the London Clearing House or
64 The founding partners of ICE are BP Amoco, Deutsche Bank AG, Goldman Sachs, Dean Witter, Royal Dutch/Shell Group, SG Investment Bank, and Totalfina Elf Group. 65 Participation is restricted to parties that quality as an “eligible commercial entity” under §1a(11) of the CEA. Generally, the entities that qualify are large financial institutions, insurance companies, investment companies, corporations and individuals with significant assets, employee benefit plans, government agencies, and registered securities brokers and futures commission merchants. 66 To the extent that all bids, offers, and contract prices of traders using ICE are posted on the ICE system, ICE provides a degree of price transparency that is wholly absent in other OTC transactions.

48
the Chicago Board of Trade Clearing Corporation for performance guarantees. The ICE software identifies traders who have obtained such performance guarantees, so that traders can choose to accept bids and offers from only those other traders who have obtained such guarantees. A party trading on the ICE platform can eliminate counterparty risk just as if he or she were trading on a futures exchange, thereby eliminating one of the major disadvantages of OTC trading.
The ICE describes the benefits of using its OTC clearing system as follows: “OTC Clearing on the Intercontinental Exchange provides traders and risk managers the best of both worlds: the safety and security offered by a central clearinghouse along with the flexibility and accessibility of the fully-electronic ICE platform.”67
A 2001 ICE press release describes the extent of the ICE system:
[ICE’s electronic trading system] is installed on over 6,500 desktops worldwide from which traders log on each day of the business week to trade more than 600 listed commodity and derivative contract types, approximately 200 more than when Intercontinental went live. Broadly, these include crude oil and refined products, natural gas, power, precious metals and emissions allowances. Contract forms include physical delivery as well as financially settled swaps, spreads, differentials and options based on a variety of fixed and floating price indices.
According to this release, the total notional value of the contracts traded on IPE over the previous twelve months was in excess of $500 billion. As of 2001, the daily volume of oil traded on the ICE was approximately 19 million barrels.68
The NYMEX also operates an electronic trading platform for the trading of standardized OTC instruments. The NYMEX OTC platform opens for the trading for crude oil contracts at 3:15 p.m., 45 minutes after the close of the open outcry trading in the NYMEX pits, and then closes at 9:00 a.m. the next morning, one hour before exchange trading begins again.
NYMEX also recently began to provide clearinghouse services for traders using the NYMEX electronic trading platform. NYMEX describes its system as follows:
NYMEX ClearPortsm clearing services are also available to market participants who wish to conduct bilateral energy transactions in a slate of 23 standardized contracts for crude oil, natural gas basis, refined products, and electricity and submit them for clearing. Cleared bilateral transactions are submitted, margin requirements are calculated, and the transactions are processed by the clearinghouse in the same manner as the NYMEX Division futures contracts.69
67 ICE, Clearing and Credit, at http://www.theice.com/risk.html. 68 Information obtained from ICE website, http://www.theice.com/home.html . 69 NYMEX ClearPortsm Services Overview, at http://209.67.30.245/jsp/markets/cp_overvi.jsp.

49
5. Convergence of Futures and OTC Markets
As OTC instruments have become standardized, and organizations that operate the designated futures exchanges, like the NYMEX and the ICE/IPE, offer OTC instruments for large institutional traders and provide clearing services for OTC trades, the traditional distinctions between these OTC markets and the futures markets have vanished. Both the futures exchanges and the OTC electronic trading platforms offer standardized instruments; both offer ways to eliminate counterparty risk; and traders purchase, sell, and trade derivative instruments on both markets to hedge price risk. The NYMEX description of its clearing services for OTC trades states: “Energy market participants no longer have to choose between the safety of the cleared, standardized markets of the Exchange, and the exposure to counterparty default that has traditionally been the drawback to customized deals in the over-the-counter markets.”70
The OTC markets and the regulated exchanges now offer identical instruments for trading. The NYMEX, for example, now offers futures contracts for OTC trading. Specifically, as shown in Exhibit III-1, one can trade instruments NYMEX calls “Light Louisiana Sweet Crude Oil Futures” and “West Texas Sour Crude Oil Futures” on the NYMEX OTC trading platform. 71 These futures contracts traded electronically on the NYMEX OTC platform are identical in form and function to the futures contracts traded on the NYMEX pit. On the ICE, the instruments that are traded are so similar to futures contracts they are called “futures look-alikes.” Crude oil traders interviewed by the Subcommittee staff stated that, from their perspective, there was no functional difference between the types of crude oil derivatives they traded on the OTC electronic platforms and on the NYMEX or the IPE.
The OTC markets for crude oil were further intertwined with traditional futures markets for crude oil when, in 2001, ICE acquired the London IPE. Following the acquisition, ICE moved to integrate its OTC trading of Brent-related derivatives with the trading of Brent contracts on the London IPE. Recently, ICE began to offer a particular type of Brent contract, the “BFO contract,” for trading on ICE’s platform. 72 Previously, these Brent OTC instruments had been traded exclusively through OTC brokers. To further mesh the operations of ICE and the IPE, the London IPE plans to do away with open outcry trading of Brent futures and move towards an all-electronic trading system.
70 NYMEX ClearPortsm Clearing Overview, About NYMEX at ClearPort sm Clearing http://209.67.30.245/jsp/markets/otc_overvi.jsp. 71 See NYMEX website, at http://www.nymex.com/jsp/markets/lsco_otc_llspe.jsp (LLS OTC futures); http://www.nymex.com/jsp/markets/lsco_otc_wtsspe.jsp (West Texas Sour OTC futures). NYMEX also provides for OTC trading of WTI contracts with future delivery in Midland, Texas, and for trading of Mars Blend Crude Oil with delivery in the Gulf of Mexico. Although these contracts appear to be identical to futures contracts, they are not labeled as such on the NYMEX website. 72 The BFO contract is explained in the following subsection.

50
6. Disparity in Market Disclosure and Oversight
The U.S. futures markets, such as the NYMEX, are the most heavily regulated and transparent commodity markets in the world. Commodity trading on these markets is subject to a variety of reporting requirements and regulations designed to detect and deter fraud and manipulation. This regulation and transparency has bolstered the confidence of traders in the integrity of these markets and helped propel the United States into the leading marketplace for many of the commodities traded on these exchanges.
Today, there are few, if any, differences between the commodity derivative instruments traded on the regulated futures markets and on OTC markets. Although many of the distinctions between the OTC and futures markets have disappeared in recent years, the trading of derivative instruments on OTC markets is subject to much less regulation than the trading of equivalent instruments on the regulated futures exchanges. For example, unlike the regulated exchanges, OTC trading facilities are not required to monitor trading to detect and deter fraud and manipulation. Commodity prices do not have to be disclosed to any oversight body. Although the new electronic trading facilities operated by NYMEX and ICE are improving the price transparency of the OTC market by making data on posted bids, offers, and completed trades available, other trading information routinely reported to the futures exchanges and the CFTC is not available. Large trader reports do not have to be provided on a routine basis to the CFTC, and, unlike trading on the NYMEX, there are no position limits or daily price limits.73
A common justification for this disparity in treatment is that the large institutions using OTC markets are sophisticated traders with less need for governmental protection from misconduct. Largely for this reason, Congress determined it was not necessary to apply most of the regulatory safeguards of the CEA to OTC markets in which smaller investors and members of the public do not participate.
With the convergence of the OTC and futures markets, however, this rationale is no longer convincing. Price manipulation in one market can harm other markets involving the same commodity, negatively affect related commodities, and ultimately harm a broad range of the American public. Federal regulation of the commodity markets is designed to protect not just small commodity traders, but also the purchasers of those commodities and the public at large. In the CEA, Congress clearly articulates the national interest in preventing market manipulation:
The transactions and prices of commodities on such boards of trades are susceptible to excessive speculation and can be manipulated, controlled, cornered or squeezed to the detriment of the producer or the consumer and the persons handling commodities and the products and byproducts thereof in interstate commerce, rendering regulation imperative for the protection of such commerce and the national public interest therein. 74
73 See Appendix 2. 74 7 U.S.C.A. §5 (West 1999).

51
A review of the history of commodity markets demonstrates it is unrealistic to rely on the self- interest of a few large traders to protect the integrity of an entire market.75 The self- interest of a limited group of large traders is not synonymous with the public interest, and it is not the responsibility of individual traders to look out for public rather than private interests. Most recently, the Enron scandal, which led to exposure of misconduct by traders at several large energy companies active in OTC trading, provides new evidence of how the conduct of a few sophisticated traders can harm not only other market participants, but also the public at large by artificially increasing prices.76 Consumers paying artificially elevated prices suffer the same harm regardless of whether the commodity price was manipulated through trades executed on regulated exchanges, on OTC electronic trading platforms, or through false information about prices and trades conveyed to price reporting services.
The record also demonstrates that a legal prohibition against commodity market manipulation, without routine market disclosure and oversight, does not effectively deter or prevent manipulation. 77 Routine market disclosure and oversight are essential to halt manipulation before economic damage is inflicted upon the market and the public. As one former CFTC Chairman stated: “The job of preventing price distortion is performed today by regulatory and self- regulatory rules operating before the fact and by threats of private lawsuits and disciplinary proceedings after the fact. Both elements are essential.”78
The manipulation of the copper markets in the 1990s by Sumitomo Corporation demonstrated that, given a choice, some traders will operate on less-regulated, less-transparent markets in order to avoid the routine disclosure and oversight that takes place on the U.S. futures
75 See discussion of commodity market regulation in the Appendices to this Report. 76 See, e.g., August 2002 report prepared by the Federal Energy Regulatory Commission (FERC) staff, Docket No. PA02-2-000, which found significant evidence of price manipulation and deceptive practices by Enron in connection with its OTC electronic trading platform known as Enron OnLine. The report includes a detailed analysis of natural gas trades made on Enron OnLine for next -day delivery into California over the course of a single day, January 31, 2001. The report found that of a total of 227 trades on that day, 174 involved Enron and a single unnamed party; these 174 trades took place primarily during the last hour of trading; and by utilizing “higher prices,” these trades resulted in a steep price increase over the last hour of trading. The report also noted that price information displayed electronically on Enron OnLine was a “significant, even dominant, source” of price information used by reporting firms publishing natural gas pricing data. The report tentatively concluded that Enron OnLine price data was susceptible to price manipulation and may have affected not only Enron trades, but also increased natural gas prices industrywide. See also, e.g., “FERC Asks Gas Marketers for Data Given to Indexes,” Wall Street Journal, October 29, 2002 (“A handful of companies have already disclosed in recent weeks that their traders provided inaccurate information to publishers of natural-gas indexes. … If traders provided false information – such as pricing and volumes – the possibility exists that they may have manipulated large swaths of the country’s gas markets.”); Plea Agreement filed by former Enron trader Timothy Belden, United States v. Belden (USDC NDCA, Case No. CR 02-0313 MJJ), October 17, 2002, admitting to conspiracy to commit fraud “to obtain increased revenue for Enron from wholesale electricity customers and other market participants in the State of California” and to “manipulat[ing] prices” in certain energy markets. Although these instances of fraud and manipulation did not occur through the use of many-to-many electronic trading facilities, they nonetheless illustrate the impact that misconduct by OTC market participants can have on the general public. 77 See extensive analysis in Appendix 1. 78 In re Indiana Farm Bureau Cooperative, 1982 CFTC LEXIS 25, 72 (Stone, dissenting), Comm. Fut. L. Rep. (CCH) & 21,796 [’82-’84 Transfer Binder] (CFTC Dec. 17, 1982).

52
exchanges.79 In the wake of the scandal, Sumitomo traders admitted using less-regulated overseas and OTC markets to avoid detection by U.S. regulatory authorities. Hence, a disparity in the degree of oversight of different markets that provide traders with func tionally equivalent instruments for trading undermines the oversight mechanisms of the more regulated market.
The Subcommittee Minority staff’s findings indicate that the current disparity in market disclosure and oversight afforded OTC crude oil markets compared to the regulated exchanges is not justified. OTC markets today function as major trading centers for crude oil derivatives. OTC markets regularly affect crude oil prices on the regulated exchanges, and vice versa, since many of the same traders use both the OTC and futures markets for risk-spreading and price discovery, and trade virtually identical instruments in both markets. The price of many OTC derivatives are linked directly to futures prices on the regulated exchanges.
The unavailability of OTC trading data was a major obstacle to the Subcommittee Minority staff’s investigation of allegations of manipulation of crude oil markets in 2002. The absence of data regarding OTC prices and trades made it impossible to determine the extent to which traders may have sought to exploit or exacerbate squeezes through activity on OTC markets. The absence of OTC information made it impossible, in practice, to get a complete picture of crude oil market behavior to determine whether manipulation took place.
Since many of the instruments traded on the regulated exchanges and OTC markets are virtually identical, traders often operate in both settings, and both markets handle billions of dollars in commodity transactions daily, it makes little sense to apply the full panoply of reporting requirements and market oversight to one market but none to the other. The absence of small traders in the OTC markets does not make the market less susceptible to price manipulation. Indeed, a market with fewer, larger participants may be even more susceptible to price manipulation. Moreover, due to the increasing interaction between the OTC and futures markets, price manipulation in one market necessarily affects prices in the other market.
The following explanation of the Brent crude oil market illustrates these points. It explains the interconnections among the spot, futures, and OTC markets for Brent, and how the price of Brent in one type of crude oil market can affect the price of Brent in another. It also describes the decades- long relationship between the prices of Brent and WTI, which normally rise and fall together in response to global factors affecting crude oil supply and demand. Using the example of the 2000 Arcadia squeeze, the analysis shows how a market squeeze in Brent can disrupt the normal relationship between Brent and WTI, and increase the price of Brent alone. This explanation of the Brent market provides a broader context for understanding the following Section of this Report, Section IV, which shows how depositing large amounts of Brent into the SPR not only spiked the price of Brent in world markets, but led to a cascading set of price spikes in other crude oils and petroleum products in the United States.
79 See Appendix 1 for a discussion of the Sumitomo case.

53
B. Crude Oil Price Benchmarks
The above discussion presents an overview of the crude oil spot, futures, and OTC markets and term contracts that, together, play a major role in determining crude oil prices. This part of Section III provides more information about the three types of crude oil, Brent, WTI, and Dubai, that function as price benchmarks for crude oils traded around the world. Additional information is provided about the Brent market for the light it sheds on how crude oil spot, futures, and OTC markets interact, how Brent and WTI markets relate to each other, and how a market manipulation spikes crude oil prices and can shift the price curve for near-term and long-term crude oil contracts.
1. Brent Crude Oil
“A major feature of the Brent market is that it works extremely well as long as one does not think about it too hard.”
-- Paul Horsnell, Oxford Institute for Energy Studies Monthly Comment, May 2000
Brent is a light, sweet crude oil produced in the North Sea within the territorial waters of the United Kingdom.80 Because Brent is slightly heavier and has slightly more sulfur than WTI, which is also a light, sweet crude oil, it normally costs less than WTI.
More crude oil is priced in relation to Brent than to any other type of crude oil. Brent serves as the benchmark for approximately 40-50 million barrels of crude oil produced daily. Most of the crude oil priced off Brent is purchased in Europe. About one-fifth of the 10 million barrels of crude oil imported daily into the United States are priced off Brent. As Figure III-3 shows, the Brent-based imports come from west Africa and northwest Europe.
80 Brent crude oil is a mixture of the oil produced in 19 separate oil fields in the North Sea. The oil is collected through two distinct pipeline systems (the Brent and Ninian systems) to a loading terminal at Sullom Voe in the Shetland Islands. Paul Horsnell and Robert Mabro, Oil Markets and Prices 11 (Oxford University Press, 2000). The Sullom Voe terminal is operated by the Royal Dutch/Shell Petroleum oil company.

54
Figure III-3U.S. Crude Oil Imports: 2001 Daily Averages
Nigeria842
Other Sour 262
Kuwait237
Iraq795
Colombia260
Canada1,335
Mexico1.394
Saudi Arabia1,611
Venezuela1,291
Other Sweet139
Gabon 140
U.K.244
Norway281
Angola321
WTI &Brent
WTI
WTI
WTI
I T W
WTI
WTI
Brent
B
BB B
WTI
Fig. III-3. About 20 percent of U.S. crude oil imports are priced off Brent. Source of data: EIA, Petroleum Intelligence Weekly.
The U.K. oil fields, including the Brent fields, are among the most mature of the oil fields in the North Sea, and the production of Brent is in decline. In the early 1990s, the Brent fields produced approximately 700,000 barrels per day, which is the equivalent of about 60 cargoes per month. By 2002, production had fallen to around 350,000 barrels per day, or about 20-25 cargoes per month. Production is expected to decline by approximately 15 percent per year for the next several years. (Figure III-4).

55
Figure III-4Brent Production: Daily Volumes
1999 - 2005
327
235
277
385
570
0
100
200
300
400
500
600
700
1999 2002 2003 2004 2005
Barrels per Day (Thousands)
Projected
Fig. III-4. Brent production is declining by about 15% per year. Source of Brent data: Platts. As is explained in more detail in Section III.C, the drop in the number of Brent cargoes
leaving the Sullom Voe terminal to less than one per day made the Brent market much more prone to distortions and squeezes. To alleviate this problem, in July 2002, Platts added two other grades of North Sea crude oil, Forties and Oseberg, to the pool of oil from which it computes the price of “Brent.”81 In September, the London IPE approved the inclusion of Forties and Oseberg within the Brent benchmark. The new benchmark is still often referred to as Brent, but also is called “BFO.” The inclusion of the Forties and Oseberg grades within the Brent benchmark has increased the number of cargoes to about 60 cargoes per month and reduced the vulnerability of the Brent benchmark price to manipulation.
81 See footnote 55 for a description of how the price of Brent is calculated.

56
The market for Brent is actually a complicated interrelation of four sub-markets: (1) an OTC market for “15-day Brent” which, in 2002, changed to an OTC market for “21-day Brent”; 82 (2) the spot market for “dated Brent”; (3) the Brent futures market; and (4) an OTC market for Brent-based derivatives.83 Table III-1 summarizes the purpose and function of the four Brent sub-markets. Oil companies and traders use the 21-day Brent market to purchase standardized contracts for the delivery of 600,000 barrel Brent cargoes up to 21 days prior to the loading of those cargoes at the North Sea terminal. The dated Brent market is the spot market used to buy or sell Brent cargoes once they are about to be or after they already have been loaded on ship. The futures market and OTC swaps are used for hedging and speculation, but rarely to obtain actual delivery of oil.
Table III-1
Brent Crude Oil Trading Instruments
Trading
Instrument Objective Trading Period Market where
Traded BFO 21-Day Contract Obtain Brent
cargoes, Hedge, Speculate
Up to 21 days before loading at Sullom Voe terminal
OTC market
Dated Brent Obtain Brent cargoes
Within 21 days prior to loading on ship
Spot market
IPE Futures Hedge, Speculate Until expiry of contract in month prior to loading month
Futures exchanges: IPE, NYMEX
CFD, DFL Swaps Hedge, Speculate Weeks prior to loading
OTC market
82 The 21-day BFO contract replaced the 15-day Brent contract when the Forties and Oseberg grades were added to the benchmark. The additional 6 days were provide to allow buyers more time to make arrangements for delivery if Forties or Oseberg were delivered rather than Brent. 83 See Crude Oil Handbook , supra , at B9-B17.

57
Only part of one of these Brent markets - the futures market - is regulated in the United States. Although Brent contracts traded on the NYMEX are fully regulated under the CEA, the vast majority of Brent futures trading takes place on the London IPE, which is regulated by the U.K. Financial Services Authority. 84 The Brent OTC markets, including the swaps and 15/21-day Brent contracts, have been exempted from most regulation by the CFTC and the Congress. The result is that the bulk of the Brent market is not regulated under U.S. law.
The complexity of the Brent market has evolved largely for historical reasons, as each type of contract or financial instrument was designed to fill a market need at a particular time. As one commenter has written: “Physics may say that the bumblebee can not fly, but the bumble bee does not think about it. Financial theory would not produce a design like Brent, but Brent traders should also not think about it. The market has in general evolved more through chance than design.”85 The following subsections provide additional detail about the Brent market.
a. 15- and 21-Day Brent
The 15-day Brent market largely evolved to address the need of producers, traders, and purchasers of Brent crude oil to be able to trade in a contract that could accommodate the peculiarities of the Brent production schedule. The major owners of the crude oil in the Brent fields -- Shell, BP, Exxon, and Philips/Conoco, who are called the “equity producers” -- all use the terminal at Sullom Voe, in the Shetland Islands, off the coast of Scotland, to load the Brent crude oil onto very large crude carrier tankers, each of which is capable of holding up to 2 million barrels of oil. One company, Royal Dutch/Shell, the operator of the Sullom Voe terminal, controls the monthly production and delivery schedule. Shell requires each company that desires to load one or more cargoes at the terminal in any given month nominate the cargoes for loading by the 5th day of the preceding month. Shell finalizes the entire loading schedule by the 15th day of the preceding month.
Until Shell finalizes the loading schedule on the 15th of each month, the producers of Brent crude oil do not know when their crude oil will be available for delivery or sale on the spot market. Initially there can be as much as thirty days variability as to when a particular cargo will actually be delivered. Accordingly, contracts for 15-day Brent specified the month, anywhere from one to four months in the future, but not the particular date, in which the cargo of Brent will be loaded. Under the 15-day contract, the seller of a cargo to be delivered in a future month was required to provide at least 15 days advance notice to the purchaser of when the cargo will be loaded at the Sullom Voe terminal. Now, under the 21-day contract, the seller is required to provide at least 21 days advance notice.
Even though a producer may know anywhere up to six weeks in advance of when a particular cargo will be loaded, the purchaser of that cargo may not learn of the loading date until 21 days in advance. Depending upon the market conditions at the time the notice is provided and
84 See Section III.A. 85 Paul Horsnell, Oil Pricing Systems, Oxford Institute for Energy Studies, Monthly Comment, May 2000 (a version of this article originally appeared in Pipeline, the magazine of the IPE). A thorough explanation of the Brent market is found in Horsnell and Mabro, Oil Markets and Prices, supra .

58
the purchaser’s commercial objectives, the purchaser may or may not want actual possession of the cargo. If the original purchaser has sold another 21-day contract to a second buyer, the first purchaser can require the second buyer to take the cargo if at least 21-days notice is given to the second buyer. The second buyer, in turn, may have sold a 21-day contract to a third buyer, and so on. In this manner, 21-day Brent can move through a “daisy-chain” of buyers and sellers until a purchaser desires physical possession of the oil or the 21-day notice period expires and timely notice cannot be provided to any more buyers.86
Purchasers of 21-day Brent can also opt out of the contract by identifying other contract holders with opposite positions and settling out their obligations with each other, along with any necessary adjustments for differences in transaction prices (called “offset” or “bookout”). As with a typical futures contract, there may be many more 21-day contracts for the loadings of Brent in any particular month than there are actual cargoes of Brent in that month.
The market for 15- and 21-day Brent always has been limited to major oil companies and traders. The large size of each contract -- each 15-day contract represented a cargo of 500,000 barrels, and each 21-day contract represents a cargo of 600,000 barrels -- the complicated mechanics of the daisy chain, and the informal nature of the market are major impediments to small traders. In the 1980s, about 100 companies traded in this market. As the formal futures markets became more established (the 15-day market existed prior to the futures market for Brent), and trading in over-the-counter derivatives increased, the market for 15-day Brent contracted. By the late 1990s, only about 30 traders remained. By 1998, the ten most active traders accounted for over 80 percent of the deals with identified buyers and sellers.87
Traditionally, 15-day Brent contracts have been bought and sold through OTC brokers. In September 2002, ICE began to post bids and offers for 21-day BFO contracts on its electronic trading platform.
As expla ined in Appendix 2, the nature and status of 15-day Brent contracts under U.S. commodities law was debated throughout the 1990s. The U.S. District Court for the Southern District of New York ignited this controversy in 1990 when, in the case Transnor v. BP, the court held that: the 15-day Brent market had a substantial effect on interstate commerce in the United States; the 15-day Brent market was subject to the jurisdiction of the U.S. courts and the
86 Under the 15-day contract, the 15-day notice period expired at 5 p.m., Greenwich Mean Time, 15 days before the three-day loading period or “window.” A holder of a contract who received notice at the last possible moment before the expiration of the notice period and was unable to require another purchaser to take delivery was said to have been “five o’clocked” or just plain “clocked.” 87 Crude Oil Handbook, at B12. The 15-day market also developed to enable Brent producers to “tax spin” to reduce their tax liability to the British government. Under the British tax code in effect at the time this market developed, the tax paid by producers of North Sea crude oil was based on the market price of the crude oil, which was calculated on the basis of the prior transactions for that type of oil. Under tax spinning, “an oil company would sell a contract to deliver oil into the market. This contract would pass through many hands and frequently end up back with the original company, completing what the market called a daisy chain. Positions would be cancelled out, losses and gains paid up, and the oil company was able to pay taxes based on the lowest price paid for an individual cargo while it shipped the oil off to its refinery.” Steven Butler, Nervous Trading in a Market Held in Limbo, Financial Times (London), May 3, 1990; see also Transnor v. BP, 738 F.Supp. 1472 (S.D.N.Y. 1990).

59
CFTC; and 15-day Brent contracts were futures contracts within the meaning of the Commodities Exchange Act. The British government, Wall Street trading firms, and U.S. oil companies charged that the district court’s decision was an unjustified extension of American jurisdiction into a British market, could undermine much of the Brent market, and cast doubt on the validity of a host of OTC contracts. In response, the CFTC issued a “statutory interpretation” that 15-day Brent contracts were not futures contracts subject to the CEA, but rather were forward contracts excluded from CEA regulation.
In the Futures Trading Practices Act of 1992, Congress ratified the CFTC’s authority to exempt 15-day Brent and other contracts that could be considered futures contracts from CEA requirements. In 1993, the CFTC issued implementing regulations exempting a host of energy derivatives traded between large institutions, including 15-day Brent contracts, from most of the CEA requirements. Under the Commodity Futures Modernization Act of 2000, a variety of energy derivatives, including 21-day Brent contracts bought and sold on the ICE, are exempted from many of the CEA’s requirements. The end result is that the 21-day Brent market is subject to very limited oversight by U.S. authorities.
b. Brent Spot Market: “Dated Brent”
Brent crude oil bought and sold on the spot market is known as “dated Brent.” Once the notice period has expired under the 21-day Brent contracts, and the daisy chain has ended, the Brent oil that is to be loaded in the specified time period is traded on the spot market as dated Brent. Dated Brent is generally traded within 21 days of the loading date.
The largest sellers of dated Brent are the Wall Street financial institutions and crude oil traders who have purchased Brent on the forward or futures market, and the largest buyers of dated Brent are the oil companies with refineries in Northwest Europe and in the northeastern United States.
As dated Brent refers to crude oil that is to be loaded in the immediate future, it is the price of dated Brent that is used as the benchmark price for spot and contract transactions. The current price of dated Brent transactions is reported daily by reporting services such as Platts and Petroleum Argus.
As a cash commodity market, the market for dated Brent has never been regulated, either in the United States or Britain. Although the CFTC may have the legal authority under a strict reading of the CEA to prevent fraud and manipulation in the spot or “cash” market for a commodity regulated under the CEA, the CFTC has never attempted to exercise authority over any spot market apart from its oversight of the corresponding futures market for that commodity. For all practical purposes, the dated Brent market is unregulated.

60
c. Brent Futures Markets
Although the NYMEX offers trading in a Brent futures contract, most Brent futures contracts are traded on London’s IPE. Unlike the NYMEX WTI contract, which requires delivery of the physical commodity upon expiry, both the NYMEX and the IPE futures contracts for Brent are cash-settled. Upon expiry, the holders of outstanding contracts requiring delivery must pay the exchange the value of the Brent oil to be delivered, and the holders of the outstanding contracts requiring acceptance of delivery are paid the value of the crude oil to be delivered. No physical delivery of Brent oil is required.
Because the 21-day Brent contract has many characteristics of a futures contract and the 21-day market performs many of the same functions as a futures market, the IPE Brent futures market is structured to converge to the 21-day market at expiry. The value of the Brent crude oil in the futures market on the date of expiry is therefore linked to the price of the next shipment of Brent crude oil in the 21-day market on tha t date.88 By providing a price discovery mechanism for traders in the 21-day market, the IPE Brent futures market makes the more limited 21-day market less susceptible to manipulation.
The IPE Brent futures market attracts a much broader range of partic ipants than the 21-day market, largely as a result of the smaller size of the standard contract – 1,000 barrels for an IPE contract as opposed to 600,000 barrels for a 21-day contract. Approximately 75,000 contracts for Brent crude oil futures, representing about 75 million barrels, are traded daily on the IPE. 89
d. Brent Over-the-Counter Markets
The peculiarities of the Brent market have created a demand for several other types of financial instruments linked to the price of Brent crude oil. Because the price of Brent futures contracts on expiry are linked to prices on the 21-day market, the price of a cargo of Brent at expiry of a futures contract is fixed from two to six weeks in advance of the time when the oil underlying the contract is actually loaded for delivery. This time gap means there may be significant changes in the price of a barrel of Brent crude between the expiry of a future contract and when the barrel is loaded at the Sullom Voe terminal.
Two types of instruments were developed as tools for hedgers and speculators to manage the risk of price changes in the price of oil in the two to six weeks between when a futures contract expires and the Brent is loaded. “Contracts-for-differences” (CFDs) are contracts for
88 This settlement price, termed the “Brent index,” is computed by taking the average of the following three elements: (1) the price of first month trades in the 21-day market; (2) the price of second month trades in the 21-day market plus or minus a straight average of the spread trades between the first and second months; and (3) a straight average of all the price assessments published in media reports. These three elements are averaged to minimize the ability to manipulate the IPE price through the manipulation of the off-exchange prices used to calculate the Index. IPE, IPE Brent Crude Futures Contract, available at http://www.ipe.uk.com/include/downloads/contracts/bc_futures.pdf. 89 IPE, Introduction to the IPE, available on the IPE website, at http://www.ipe.uk.com/include/downloads/brochures/introduction%20to%20the%20IPE(screen).pdf.

61
the difference between the price of dated Brent and the price of Brent in the first forward month 15- or 21-day contract. By using a CFD, a buyer or seller can effectively lock- in the price of dated Brent in relation to the 21-day price, reducing exposure to changes in the price of the cargo of Brent from the time the 21-day contract expires and the time the cargo is loaded onto the ship.
Because the price of dated Brent is the benchmark price, plus or minus a quality differential, for a variety of crude oils, a CFD is a useful tool, along with Brent futures contracts, for the purchasers and sellers of these other Brent- linked crude oil streams to hedge against the risks of changes in the price of dated Brent. Brent futures contracts, by themselves, leave the purchasers or sellers of crude oil linked to dated Brent exposed to anywhere from two to six weeks of change in the price of dated Brent. CFDs provide a hedge against these changes in price. Hence, Brent CFDs have become a key risk-management instrument in the crude oil trade.
As with the formal futures markets for crude oil, the CFD market has grown rapidly since the early 1990s, and since the mid-1990s, trading volumes in CFDs have been larger than for both 15-day Brent and dated Brent. It is estimated that, by 1998, over three-fourths of non-futures Brent transactions were in the form of CFDs, with the remainder in 15-day and dated Brent.90 Brent CFDs are purchased and sold through brokers, with daily quotes reported and published by Platts.
In its description of CFDs, the Crude Oil Handbook reports on the strengths and weaknesses of the CFD market, including the incentives they may provide to manipulate underlying weaknesses in the dated Brent market:
While CFDs would seem to be a perfect complement to other Brent markets, these derivatives have come under criticism since their inception as a vehicle for market squeezes and as a source of price volatility. . . . The main problem has been the large variation in price between dated Brent and 15-day Brent. Ironically, the possibility of hedging this exact risk with CFDs has undoubtedly contributed to the growth of the market. The emergence of CFDs did coincide with a period of greater volatility in the spread between the dated and 15-day prices. While the CFD market is meant to hedge that risk, it also may have prompted increased efforts to manipulate price quotes for dated Brent. It also seems to have contributed to squeezes in the forward market, because it provides a way for the initiator of a squeeze to make a profit unwinding the long position that has been created in the forward market by taking offsetting positions in CFDs before the squeeze gets going. 91
Another popular way to hedge the risk of divergence between the price of dated Brent and the price of Brent futures on the IPE is through the “dated to front-line (DFL) swap.” This OTC instrument is similar to the CFD, but is the difference between the price of dated Brent and the price of the next month’s Brent on the IPE. As with the CFD, DFL swap prices are tracked and published on a daily basis by oil industry trade 90 Crude Oil Handbook , supra , at B16. 91 Id. at B17.

62
publications. DFL swaps are bought and sold either through brokers or directly between the parties.
Generally, the Brent OTC markets are either totally excluded or substantially exempted from regulation under the CEA. CFDs and DFLs that are traded between oil companies, Wall Street firms, and crude oil traders could be considered swap transactions, which under the CFMA are totally excluded from regulation under the CEA. To the extent that OTC instruments, such as 21-day Brent contracts, are traded on an electronic exchange such as the ICE, such trades are exempt from all regulation other than some of the bare-bones anti- fraud and anti-manipulation provisions.
Each of the different spot, forward, futures, and over-the-counter markets for Brent crude oil has evolved to address the peculiar manner in which Brent crude oil is brought to the market and the risks of price changes during the process. Because of the importance of dated Brent as a benchmark for the price of so much crude oil worldwide, the highly liquid IPE futures market and OTC markets for CFDs and DFL swaps have become popular mechanisms to spread risk and discover prices for crude oil traded globally. However, in contrast to the highly transparent Brent futures market to which they are linked, at present there is little transparency in the market for Brent OTC instruments.
2. West Texas Intermediate (WTI) “It’s not ideal, but it’s what we’ve got.” --A crude oil trader, commenting on the NYMEX WTI contract, December 2002 WTI is the benchmark for approximately 12 to 15 million barrels of crude oil produced or
sold each day in the Western Hemisphere. Except for crude oil produced in Alaska, nearly all of the crude oil produced in the United States is priced off WTI. About 80 percent of the crude oil imported into the United States is priced off WTI.92
Although more crude oil worldwide is priced off Brent than WTI, the standard NYMEX WTI contract is the most widely traded commodity futures contract in the world. Approximately 150,000 contracts for WTI are traded daily on the NYMEX, representing a volume of crude oil equal to nearly twice the world’s daily production.
WTI is actually a blend of crude oils produced in oil fields in Texas, New Mexico, Oklahoma, and Kansas. These crude oils all have relatively low sulfur levels and are relatively low in density. Like Brent, the production of WTI is dwindling. Ten years ago, around 750,000 barrels of WTI were produced daily; presently, around 400,000 barrels of WTI are produced daily. Future production is expected to decline.93
92 See Figure III-3. Because WTI is the benchmark for most of the crude oil consumed in the United States, exporters of North Atlantic basin crudes priced off Brent often will quote the prices in relation to WTI to facilitate price comparisons for U.S. importers. 93 Subcommittee interviews, 2002.

63
As a result of the historical development of Cushing, Oklahoma, as a transportation and storage hub for crude oil produced in the region, the standard NYMEX futures contract for light sweet crude oil provides for the delivery of WTI or several comparable alternative grades at that location. Presently, there are about 20 million gallons of storage capacity at Cushing and an extensive network of crude oil pipelines leading into and out of these facilities. However, Cushing is landlocked, far from the ports handling oil imports and exports, and no longer the central distribution point it once was for crude oil produced in the United States.
Numerous industry participants are concerned about the potential for distortion – either intentional or unintentional – of WTI pricing due to the limited volume of WTI produced each month, the relative isolation of Cushing from global trade, and limits on Cushing’s pipeline and storage capacity. Like Brent, the production of WTI is half of what it once was. Like Brent, the constrained logistics of WTI production, transport, and storage can make the availability of WTI subject to artificial bottlenecks or surges in supply.
One of the most frequently raised issues regarding the WTI benchmark is that 80 percent of the tank storage capacity at Cushing, Oklahoma is controlled by two companies, BP and Shell. Figure III-5 shows one industry estimate of the division of ownership of the crude oil storage tanks at Cushing. Because crude oil inventories in the Midwest strongly affect WTI prices, the concern is that the actions of these two firms regarding their storage tanks at Cushing may have a disproportionate impact on Midwestern supplies and inventories and hence on the price of WTI.
Figure III-5Ownership of Storage Tanks at Cushing, Oklahoma
Sun0.5 mb
2%
Phillips/Conoco0.8 mb
4%Koch1 mb5%
Plains Marketing2 mb9%
Shell8 million barrels
38%
BP/Amoco9 million barrels
42%
Fig. III-5. Two companies own 80 percent of the storage tanks at Cushing, Oklahoma. Source of data: Industry estimate.

64
Many oil companies and traders do no t consider the WTI price at Cushing, Oklahoma, to accurately reflect global supply and demand, and therefore do not rely solely on the price of WTI as a reference price to determine whether to import crude oil from Europe or west Africa. These companies and traders also use the price of Light Louisiana Sweet (LLS) crude oil, which is delivered on the Gulf Coast, to gauge whether it is profitable to import crudes from across the Atlantic (with attendant transportation costs) or instead purchase domestic crudes.94
3. Dubai
Generally, crude oil purchased in Asia, most of which originates in the Middle East, is priced off the Dubai benchmark. This benchmark price is calculated from the price of crude oils produced in both Dubai and Oman. Approximately 10-15 million barrels per day of crude oil are priced off the Dubai benchmark. Only a small fraction of U.S. crude oil imports are linked to the price of Dubai oil.
Initially, the Dubai benchmark price was calculated solely on the basis of the price of crude oil produced in Dubai. However, as production declined from around 350,000 barrels per day ten years ago to around 200,000 barrels per day in recent years, the Dubai market became volatile and susceptible to manipulation. In 2001, Platts added Omani crude oil to the benchmark formula, which effectively doubled the amount of crude oil underlying the calculation. The inclusion of Omani crude oil in the benchmark calculation immediately reduced the volatility of the price of Dubai.
Just as crude oil purchasers located in the United States use the difference between the price of Brent and the price of WTI as a major factor in determining whether to import crudes from Europe and west Africa, purchasers in Asia use the difference between the price of Brent and the price of Dubai as a major factor in determining whether to export European and west African crudes to Asia. Hence, the price of Brent is a critical component of the entire global crude oil trade, and the relative price of the three benchmarks is a major factor determining the global flow of crude oil.
94 The addition of several new futures contracts for trading on the NYMEX OTC trading platform, including a LLS futures contract, indicates there may be sufficient market demand for futures contracts that can more precisely hedge crude oil costs than can be done with just a NYMEX WTI contract. As the Brent market shows, however, a proliferation of OTC instruments that complement an exchange-traded futures contract can obscure the price discovery function of the basic futures contract, expose the underlying exchange-traded contract to price distortions created in the OTC market, and introduce additional barriers to market transparency since OTC prices are not

65
C. The Vulnerability of the Brent Market to Squeezes “If you have to ask who the chump is, you’re it.”
--Alleged Remark of a Crude Oil Trader following Brent Squeezes in 2002
As production of Brent crude oil has dwindled, the number of Brent cargoes leaving the Sullom Voe terminal has declined from about 60 cargoes per month a decade ago to only about 20 cargoes per month, or less than one per day, by the first half of 2002. This drop in the number of cargoes made the Brent market, prior to the addition of the Forties and Oseberg grades to the Brent pricing mechanism in mid-2002, prone to squeezes by making it possible for a single company to purchase most of the Brent production in a given month. As Horsnell and Mabro observed in their textbook on the Brent market, “it is much easier and more tempting to squeeze a twenty cargo loading programme in a month than a sixty cargo programme.”95
One large-scale squeeze of the Brent market occurred in the summer of 2000, in what is commonly referred to as the “Arcadia squeeze.” This squeeze disrupted the Brent market and led to spikes in the prices of crude oil priced off Brent, reportedly costing U.S. refiners tens of millions of dollars. The magnitude of the Arcadia squeeze surprised market observers and alerted oil traders to possible means and consequences of manipulating the Brent market.
Arcadia, a wholly owned subsidiary of the Japanese Mitsui Corporation, is a crude oil trading company, doing business principally in London and Geneva, and is active in the global and Brent crude oil markets. In September 2000, the Tosco Corporation, a refining company that has since been merged into what is now Philips-Conoco, sued Arcadia for $30 million in damages due to the higher costs for crude oil resulting from Arcadia’s alleged manipulation of the Brent market.96 According to Tosco, Arcadia and other crude oil traders “pursued a complex scheme to monopolize the September Brent Crude sub-market, thereby manipulating the entire September [2000] Brent Indexed market.”97 Tosco further alleged, “Arcadia knew at all times relevant that, by manipulating the Platts price for Brent crude, it would in turn manipulate prices for crude oil being purchased for delivery to the eastern United States.”
Because Arcadia settled with Tosco several weeks after the lawsuit was filed in a confidential settlement, Tosco’s complaint and contemporaneous press reports of the lawsuit are the primary public sources of information about Arcadia’s trading activities during this period.98 required to be published and may not always be widely available. 95 Paul Horsnell and Robert Mabro, Oil Markets and Prices 138 (Oxford University Press, 2000). 96 Tosco Corp v. Arcadia Petroleum Ltd., (D.C. S.D.N.Y.) Complaint, Sept. 7, 2000. 97 Tosco’s complaint described the use and purpose of 15-day Brent contracts in a manner akin to futures contracts:
’15-day Brent’ transactions are paper transactions involving the sale or purchase of cargoes for delivery on an unspecified day of a given future month. The cargo becomes deliverable when the seller gives 15 days notice to the buyer. Notice often travels down a chain of subsequent traders until one chooses to accept physical delivery of the cargo. Because 15-day Brent transactions do not initially require physical delivery, they are frequently traded for hedging and speculation purposes.
98 The Subcommittee staff requested an interview with Arcadia to provide it with an opportunity to clarify or

66
In addition, however, Arcadia’s Brent trades left a trail of price spikes in the Brent spot, futures, and over-the-counter markets. These price spikes are consistent with the price spikes left by squeezes in other commodity markets.
In its complaint, Tosco outlined how Arcadia allegedly manipulated the limited Brent market:
Arcadia effectuated its scheme by obtaining control of the market for 15 Day Brent contracts for September 2000 delivery. Arcadia did so by surreptitiously purchasing more 15 Day Brent contracts for September delivery than it knew could be physically delivered in September. Only a finite number of shipments of Brent crude are available for delivery in any given month. In conspiring to control the September Dated Brent market, Arcadia and its coconspirators were undoubtedly aware that, due to a market abnormality, only 22 deliveries of Brent oil would be available in September, much fewer than would be available in a typical month.
Tosco asserted that Arcadia and its coconspirators used this “monopoly power” over the September deliveries of Brent oil to raise the price of Brent crude oil and all other crude oils indexed to the price of Brent “higher than would result from the ordinary functioning of the market.” According to Tosco, “From August 21 to September 5, the price of Brent crude increased by $3.33 per barrel, including a one-day leap of $2.38 per barrel between August 24 and 25.” Moreover, said Tosco, “In a conversation with a Tosco trader, an Arcadia trader stated that Arcadia controlled the September market for Brent crude, that Arcadia had raised the price of September Brent Crude by approximately $3.00 per barrel and that Arcadia could raise the September price further than it already had.” “By causing September Brent Crude prices to spike,” Tosco declared, “Arcadia’s squeeze on the market caused injury to every buyer in the September Brent Indexed market.”
Arcadia has told the London IPE that all of its Brent trades had valid commercial justifications.99 Similarly, Glencore International, one of Arcadia’s alleged coconspirators, acknowledged that Arcadia bought large amounts of Brent crude in August and September 2000, but asserted that these trades were undertaken for a valid commercial reason – to fulfill specific contracts for Brent crude oil. According to Glencore, “the need to supply a crude contract to India” was one of the reasons for the large purchases of September Brent.100
Although Arcadia and Glencore asserted there were valid commercial reasons for Arcadia’s near-monopolization of the September 2000 Brent market, others were skeptical. According to Platt’s, “India’s Ministry of Petroleum and Natural Gas asked its refiners at the end
supplement the record regarding Tosco’s allegations of manipulation and antitrust violations. Arcadia declined to meet with the Subcommittee staff on any of the several dates proposed. Arcadia, which is organized outside the United States, is the only company trading crude oil that did not cooperate with Subcommittee requests for information in this investigation. 99 Interview with IPE officials, November 2002. 100 Ross McCracken, Esa Ramasamy, Beth Evans, Brent Row Escalates as Unipec Suspends Trading with Arcadia, Platt’s Oilgram News, September 13, 2000.

67
of August to reduce runs due to a drop in demand.”101 “Something is amiss,” Philip Verleger wrote in late August 2000, “On the one hand traders claim the oil is needed in India. On the other hand, India does not really need the oil.”102
The effects of Arcadia’s purchase of large amounts of Brent cargoes in August and September 2000 – whether a legal squeeze or an abusive one 103 – can be seen in a number of price charts. The data shows that the Arcadia squeeze raised, not only the spot price of Brent in August and September of 2000, but also the price of the futures contracts sold in August and September for the delivery of Brent crude oil in September and October. These price increases, in turn, raised the price of Brent OTC instruments whose value was linked to the spot and futures prices. The resulting price spikes are clearly observable in crude oil price data over this time period.
Figure III-6 shows the increases in both the spot price of Brent and the price of the expiring Brent futures contracts resulting from the Arcadia squeeze of the Brent market in August and September 2000.
101 Id. 102 Id. 103 Whether Arcadia and Glencore had a legitimate commercial need for the large amounts of Brent crude purchased in August and September 2000 is critical to any determination, under U.S. law or U.K. law, on whether the Brent market was illegally manipulated. Under both U.S. and U.K. commodities law, manipulation will be found only if congestion in the market is not the natural result of supply and demand conditions in the market, but was intentionally created by a trader for the specific purpose of creating an artificial price. Accordingly, in this Report the use of the term “squeeze” does not connote illegal activity, unless there are additional ele ments present that amount to an “abusive squeeze” or “manipulation.” See Appendix 1 for a more detailed discussion of the law of manipulation.

68
Figure III-6Arcadia Squeeze Increases Brent Spot Price
and 1st Month Futures Price
22
24
26
28
30
32
34
36
38
Jun-00 Jul-00 Aug-00 Sep-00 Oct-00 Nov-00
Arcadia Squeeze
Brent Spot Price
Brent 1st Month Futures Contract
Dollars per Barrel
Fig. III-6. The Arcadia squeeze increased the Brent spot price in August and September 2000, and the price of the futures contracts expiring in those months (contracts for delivery of oil in September and October). Price data obtained from EIA website.
A sharp increase in the price of the nearest futures contract as the current contract nears expiry is a classic sign of a squeeze.104 This spike in the price of the near-term contract occurs because towards the expiry of a futures contract the “shorts” – those who must deliver the commodity to the “longs” when the next-month contract expires – must either purchase the physical commodity to make delivery or pay those expecting delivery – the “longs” – to cancel out the obligation to deliver. In a squeeze, the supply of the physical commodity is in scarce supply, especially as compared to the outstanding contracts to deliver, so that the “shorts” have no alternative but to pay the “longs” for their expiring futures contracts to cancel their obligation to deliver the commodity. 105 Because the shorts are legally obligated to either deliver the 104 Stephen Craig Pirrong, The Economics, Law, and Public Policy of Market Power Manipulation 148 (Kluwer Academic Press 1996). 105 “He that sells what isn’t hisn Must buy it back or go to prisn.” Attributed to Commodore Vanderbilt, in Edwin Lefèvre, Reminiscences of a Stock Operator 236 (Wiley, 1994).
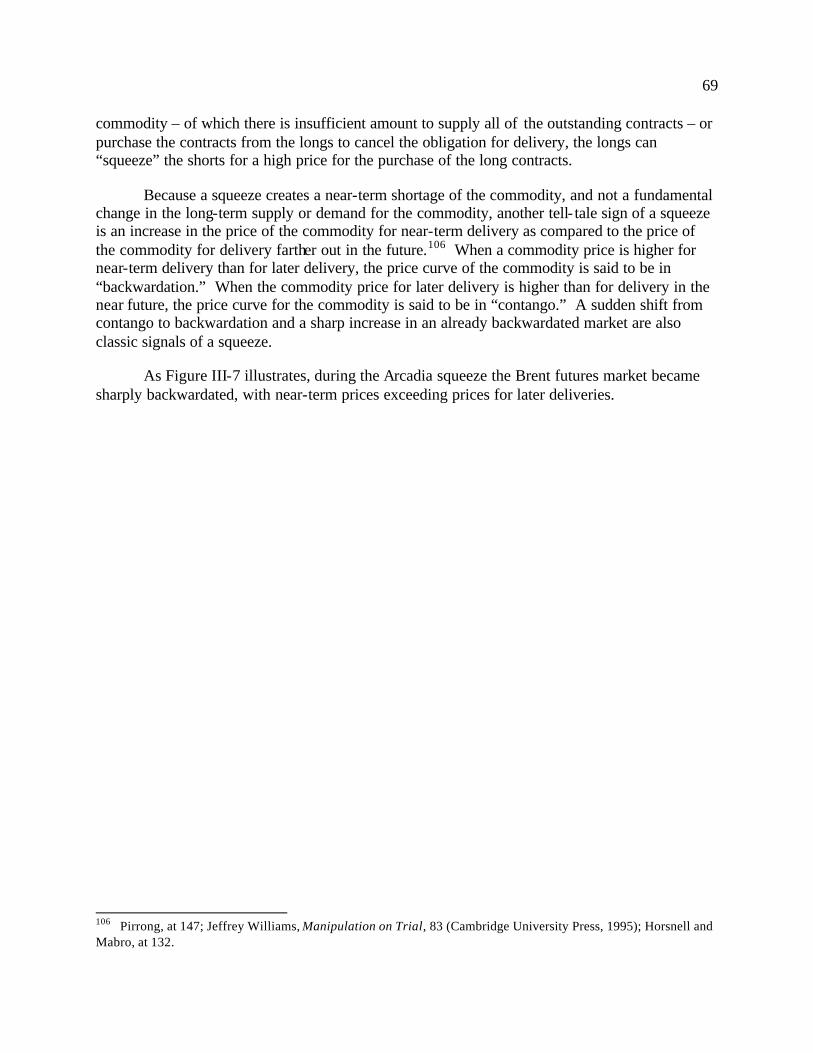
69
commodity – of which there is insufficient amount to supply all of the outstanding contracts – or purchase the contracts from the longs to cancel the obligation for delivery, the longs can “squeeze” the shorts for a high price for the purchase of the long contracts.
Because a squeeze creates a near-term shortage of the commodity, and not a fundamental change in the long-term supply or demand for the commodity, another tell- tale sign of a squeeze is an increase in the price of the commodity for near-term delivery as compared to the price of the commodity for delivery farther out in the future.106 When a commodity price is higher for near-term delivery than for later delivery, the price curve of the commodity is said to be in “backwardation.” When the commodity price for later delivery is higher than for delivery in the near future, the price curve for the commodity is said to be in “contango.” A sudden shift from contango to backwardation and a sharp increase in an already backwardated market are also classic signals of a squeeze.
As Figure III-7 illustrates, during the Arcadia squeeze the Brent futures market became sharply backwardated, with near-term prices exceeding prices for later deliveries.
106 Pirrong, at 147; Jeffrey Williams, Manipulation on Trial, 83 (Cambridge University Press, 1995); Horsnell and Mabro, at 132.

70
Figure III-7Arcadia Squeeze Increases Near-Term Brent Futures Prices
and Backwardation of Brent Market
-1.00
-0.50
0.00
0.50
1.00
1.50
2.00
2.50
3.00
Jun-00 Jul-00 Aug-00 Sep-00 Oct-00 Nov-00
Dollars per Barrel
Difference Between Brent 1st and 2nd Month Futures Contracts
Arcadia Squeeze
Backwardation
Contango
III-7. In August 2000, as Arcadia’s purchases of September Brent cargoes squeezed the Brent market, futures contracts expiring in August (1st month contract) became more expensive than futures contracts expiring in September (2nd month contract). Price data obtained from EIA website.
In addition, price data shows that Brent prices rose sharply compared to WTI prices. This change in relative prices shows that the increased Brent price was not due to worldwide pressures on crude oil markets, but to events that affected only the Brent and not the WTI market. During a squeeze, the price of the squeezed commodity will increase in relation to the price of similar commodities that are not squeezed.107 Although the demand, and hence price, of related, substitutable commodities may also increase as the squeezed commodity becomes scarce and buyers seek alternative supplies, the primary effects of the squeeze are seen by comparing the price of the squeezed commodity to the price of similar but “unsqueezed” commodities.
107 Pirrong, at 146; Williams, at 87.

71
Figure III-8 shows that during the Arcadia squeeze the price of Brent crude oil rose sharply in comparison to the price of WTI. This is strong evidence that the price rise that occurred at the time was caused by a distortion in the market for Brent crude oil, rather than some other factor affecting the general global supply and demand for crude oil.
Figure III-8Arcadia Squeeze Increases Price of Brent Compared to WTI
-5
-4
-3
-2
-1
0
1
2
3
Jun-00 Jul-00 Aug-00 Sep-00 Oct-00 Nov-00
Dollars per Barrel
Difference between spot prices of Brent and WTI
Arcadia Squeeze
Fig. III-8. The price of a squeezed commodity will rise in relation to the price of similar but unsqueezed commodities. Normally, Brent is about $1.50 less than WTI. During the Arcadia squeeze Brent rose to nearly $3.00 more than WTI. Price data obtained from EIA website.

72
The relationship between Brent and WTI is a major factor determining the volume and price of crude oil imported into the United States. Normally, Brent sells for about $1.50 per barrel, on average, less than WTI. Because it costs on average between $1.00 and $1.50 per barrel to transport a very large tanker of crude oil from the North Sea across the Atlantic Ocean to ports in the United States, Brent is generally price-competitive with WTI only when it is priced at about $1.50 per barrel less than WTI. When the price of Brent plus the costs for shipping Brent to the United States is less than the price of WTI, the transatlantic “arbitrage” is said to be “open,” meaning that Brent and other crudes priced off Brent will be less expensive than WTI.108 Lower costs for importing Brent mean U.S. imports of these crude oils will be more attractive for U.S. refiners, who will then increase their purchases of Brent and other crudes priced off Brent. When the price of a barrel of Brent plus transportation costs is greater than the price of WTI, it is less economical to import Atlantic basin Brent-based crudes, and the transatlantic “arbitrage” is said to be “closed.” U.S. refiners then import less crude from the North Atlantic and rely more on their inventories and crude oils that are produced in North and South America and priced off WTI.
An article by a crude oil trader for a major U.S. oil company posted on the NYMEX website describes the significance of the Brent-WTI price difference as follows:
Several times during the year, the market provides price incentives for the Atlantic Basin sweet production to flow west. The Brent/WTI spread is the ‘roadmap’ the industry studies to determine if the arbitrage is open or closed. The status of the arbitrage is one of the driving factors determining the structure of the forward WTI and refined product market price curves in the U.S. and Europe. An open export market for Brent implies tighter supplies for the U.S., and the reverse is true when the barrels are priced to stay in Europe.109
108 Importers also consider the relationship between the price of WTI and the price of other domestic grades.
109 Kinnear, The Brent/WTI Arb: Linking the World’s Key Marker Crudes (NYMEX website). This article further describes how the closing of the Brent/WTI arbitrage, which results in a reduction in the amount of Atlantic basin crude oil imported into the U.S., can have a significant effect on U.S. crude oil prices:
Deliveries of Brent to the U.S. Gulf Coast and East Coast of Canada can reduce demand for domestic sweet barrels including WTI. When the trans-Atlantic sweet crude arbitrage to the U.S. is completely closed, there is typically a draw on sweet crude inventories; WTI volatility increases as does the probability of a market distortion.
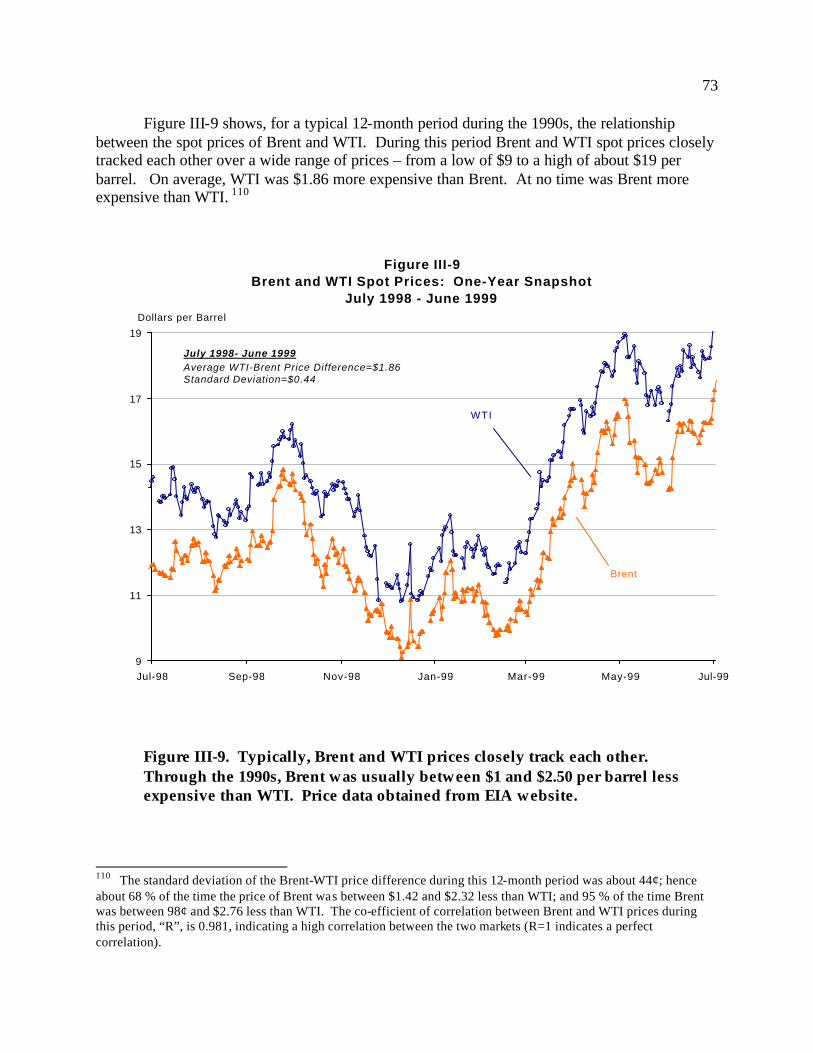
73
Figure III-9 shows, for a typical 12-month period during the 1990s, the relationship between the spot prices of Brent and WTI. During this period Brent and WTI spot prices closely tracked each other over a wide range of prices – from a low of $9 to a high of about $19 per barrel. On average, WTI was $1.86 more expensive than Brent. At no time was Brent more expensive than WTI. 110
Figure III-9Brent and WTI Spot Prices: One-Year Snapshot
July 1998 - June 1999
9
11
13
15
17
19
Jul-98 Sep-98 Nov-98 Jan-99 Mar-99 May-99 Jul-99
WTI
Brent
July 1998- June 1999Average WTI-Brent Price Difference=$1.86Standard Deviation=$0.44
Dollars per Barrel
Figure III-9. Typically, Brent and WTI prices closely track each other. Through the 1990s, Brent was usually between $1 and $2.50 per barrel less expensive than WTI. Price data obtained from EIA website.
110 The standard deviation of the Brent-WTI price difference during this 12-month period was about 44¢; hence about 68 % of the time the price of Brent was between $1.42 and $2.32 less than WTI; and 95 % of the time Brent was between 98¢ and $2.76 less than WTI. The co-efficient of correlation between Brent and WTI prices during this period, “R”, is 0.981, indicating a high correlation between the two markets (R=1 indicates a perfect correlation).

74
As Figure III-8 shows, during the Arcadia squeeze the price of Brent rose to nearly $3.00 per barrel more than WTI. As Tosco’s complaint states, such an increase in the price of Brent would make other Atlantic basin crude oils priced off Brent significantly more expensive for U.S. refiners. As the price of Brent rose to artificially high prices, U.S. refiners, such as Tosco, had to pay more for their imports that were indexed to the price of Brent.
Figure III-10 shows the price difference between Brent and WTI from January 1992, through December 2000. The data shows that, on average over this nine-year period, Brent cost $1.46 less than WTI. The data also shows that, in 2000, the Arcadia squeeze raised the price of Brent compared to WTI to extraordinary levels when compared with the prior Brent-WTI relationship.
Figure III-10Difference Between Spot Prices of Brent and WTI
January 1992 - December 2000
-3
-2.5
-2
-1.5
-1
-0.5
0
0.5
1
Jan-92 Jan-93 Jan-94 Jan-95 Jan-96 Jan-97 Jan-98 Jan-99 Jan-00
Arcadia Squeeze
January 1992 - December 2000 Average WTI-Brent Price Difference=$1.46 Standard Deviation ( σ )=$0.62
Dollars per Barrel
Dif ference Between Spot Prices of Brent and WTI
Avg=$1.46
+ σ
− σ
+2σ
Figure III-10. During the Arcadia squeeze, the price of Brent rose significantly in relation to WTI, especially in relation to the historical average difference between the two benchmarks. Prices reflect 20-day moving averages. Price data obtained from EIA website.

75
Due to the peculiarities of the Brent market, a trader seeking to acquire a large number of Brent cargoes at some month in the future must acquire 21-day contracts to obtain the physical cargoes, as well as futures contracts and OTC instruments to hedge against the price increases that can be expected to follow from the increased market demand for Brent caused by the trader. As explained earlier, crude oil traders use Brent derivatives called contracts- for-differences (CFDs) and dated-to-frontline (DFL) swaps to hedge Brent price risks.111
A squeeze in the Brent market will increase the price of CFDs and DFL swaps, since the values of these over-the-counter derivatives are linked to the spot and futures prices for Brent. As the price of the near-term futures contract increases in a squeeze, the price of the related OTC Brent derivatives will also increase. Figure III-11 shows that, during the Arcadia squeeze, the relative price of the Brent first month futures contract increased compared to the price of dated Brent, indicating a spike in the price of a DFL swap.
Figure III-11Arcadia Squeeze Increases Price of Brent OTC Derivatives
-4.00
-3.00
-2.00
-1.00
0.00
1.00
2.00
3.00
Jun-00 Jul-00 Aug-00 Sep-00 Oct-00 Nov-00
Arcadia Squeeze
Difference Between the Price of IPE Brent First Month Futures Contract and Dated Brent
Fig. III-11. During the Arcadia squeeze, the price of the expiring Brent contract rose relative to the price of dated Brent. Price data from EIA and IPE websites.
111 A CFD is the difference between the price of dated Brent (“spot price”) and the price of the 15- or 21-day contract needed to obtain a physical cargo of Brent. A DFL swap is the difference between the price of dated Brent and the price of the expiring IPE contract. See Section III.B.

76
In addition to sharp price increases, Figures III-6, 7, 8, 10, and 11 also show classic price “drop-offs” after the squeeze is ended. A sudden drop in the spot price of a commodity or the price of a futures contract right after expiry of the contract is yet another indication of a short-term squeeze in the market for that commodity. Following the run-up at expiry in the price of the squeezed commodity and the expiring futures contract, the price of the commodity and the futures contracts rapidly fall to reflect the normal supply and demand in the market. Price spikes caused by factors other than squeezes do not normally cluster around the expiry of a futures contract.112
The magnitude of the Arcadia squeeze surprised market observers. “In the 20 years that I’ve been following the oil market, this is probably the most extreme example of an artificial price being created that I’ve observed that has persisted for as long as this one persisted,” said oil economist Philip Verleger at the time.113 Another petroleum economist, University of Houston Professor Michael Economides, stated at the time, “The idea that one could corner, could encompass an entire benchmark market and, consequently, manipulate potentially other prices is absolutely fascinating and, in my view, astonishing. We certainly have not been confronted with a situation like this, to my knowledge, in the history of the petroleum industry.”114
Others, however, viewed Arcadia’s squeeze and the use of derivatives to profit from the Brent squeeze as business-as-usual in the petroleum markets. Commenting on Arcadia’s effect on the market, the Oil Daily wrote, “[T]he manipulation of dated Brent by trading houses, who skillfully engineer gains in derivatives markets, sometimes by sacrificing losses in physical markets, has evolved into a high art. And it is not only buyers of Brent that are affected. Buyers of Nigerian or other Brent price- linked crude grades exported to the US could argue that they too had been harmed by the manipulation of the Brent market.”115
The price data during the period of the Arcadia squeeze demonstrates that a squeeze can spike prices not only in the crude oil spot and futures markets, but also in the OTC markets. The extent to which Arcadia profited from the squeeze caused by its activity in the Brent market is not known.
Robert Mabro, Director of the Oxford Institute for Energy Studies, and one of the foremost authorities on the Brent market, contends the OTC Brent market facilitates squeezes, and enables traders to artificially create profits from the weaknesses in the market. According to an interview of Dr. Mabro reprinted by the Derivatives Study Center in 2000:
A typical Brent squeeze involves a company quiety building a strong position in short-term swaps called contracts- for-differences, or CFD’s, for a differential not reflected in
112 Pirrong, at 147; Horsnell and Mabro, at 132. 113 National Public Radio, All Things Considered , October 3, 2000. 114 Id. 115 Paul Merolli, Stephen MacSearraigh, Tosco Sues Arcadia for Brent Manipulation , Oil Daily, September 11, 2000.

77
current prices. The company then buys enough cargoes in the dated Brent market to drive the physical crude price higher, which boosts the CFD differential, Mabro said.
The company may lose money on the physical side, but it’s more than compensated from profits on its offsetting paper position in the short-term swaps market, Mabro said.
“The whole trick is to collect more money in CFD’s than you lose on the physical squeeze,” Mabro said. “People seem to do it in turn. It depends on who’s smart enough to move in a way that nobody notices until it happens.”116
In another article, Dr. Mabro concluded that the variety of financial instruments and the
complexity of the Brent market magnifies the vulnerability of the Brent market to squeezes and price distortions:
The array of instruments available to traders enable a small number of powerful and sophisticated players to operate squeezes or launch other operations which causes prices to move in directions do not always reflect the actual state of the supply/demand balance. Whether these ‘games’ whose frequency has been increasing in recent years affect price trends over the medium term is debatable. It is certain, however, that they cause higher price volatility, and that they rob prices from their most important function which is to signal at every movement the state of the supply/demand balance.117
Dr. Mabro and others point to profit-taking in OTC derivatives as a major source of gain for traders attempting to squeeze the crude oil markets. Price data tracing OTC price increases and documenting OTC trading gains is unavailable, however, due to the lack of price transparency and disclosure requirements in OTC markets.
Dr. Mabro observes that large players in the crude oil markets have little incentive to improve the operation of the markets, and this situation harms U.S. interests and consumers:
Traders like [the current situation] because they all think that it provides them with opportunities to make money. . . . Whether the system is good for the exporting countries, the oil companies, the importing countries, the US government and the final consumer is very doubtful. Judging from recent experience it is clear that nobody likes either very high or very low oil prices. When they obtain, it is far too easy to blame OPEC. The issue however is not OPEC on its own but the system in its complex operation, in the links between various markets, and the awkward relationship between markets and OPEC. A fundamental reform is required.118
116 Derivatives Study Center, Not Learning the Lessons of Long-Term Capital’s Failure, September 2000. 117 Robert Mabro, Oil Markets and Prices, OIES Monthly Comment, August 2000. Dr. Mabro’s comments were written prior to the implementation of the BFO contract. In an interview with the Subcommittee staff in December 2002, Dr. Mabro stated that the new BFO contract could help prevent the particular types of squeezes in the Brent market to date, but that squeezes were “endemic” to all commodity markets. Dr. Mabro stated that the limited number of players in the crude oil markets, together with the lack of transparency in the OTC markets, continued to present risks to the efficiency and transparency of the market. 118 Id.