Embed Size (px)
Citation preview

SEC: How to Create and View Charts
and GraphsOregon SEC Collaborative
SEC 201

Web Video
About 9 minutes
http://seconline.wceruw.org/resources.asp (click “SEC Reports Tutorial” link at the bottom of the page)

Log in: http://seconline.org

Select “SEC Reports” from the Menu

Choose Your Data Sources and click “Submit”
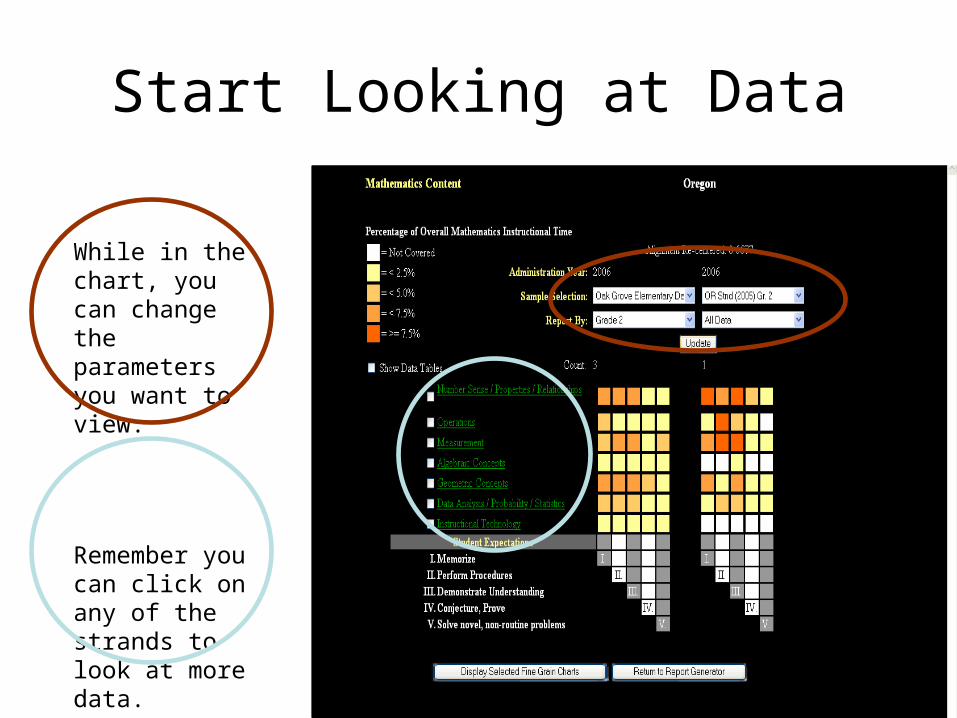
Start Looking at Data
While in the chart, you can change the parameters you want to view.
Remember you can click on any of the strands to look at more data.

Click on the trait and you can drill down

“Number Sense”
Comparison

Let’s See What Our School’s Data Looks Like
• Principals, log in to see group data
• Group reports are only available when there are more than three teachers in a grade level or content area
• Click here to log in to SEC Online

Now, your turn
• Individual teachers may log in on their own to see data
• Remember your login and your password
• Questions?