Embed Size (px)
Citation preview

1
Seasonal and inter-annual variability of bud development as related to
climate in two co-existing Mediterranean Quercus species
Arben Q. Alla1*, J. Julio Camarero
2, and Gabriel Montserrat-Martí
1
1Instituto Pirenaico de Ecología (CSIC). Avda. Montañana 1005, 50080 Zaragoza, Spain.
2ARAID-Instituto Pirenaico de Ecología (CSIC). Avda. Montañana 1005, 50080 Zaragoza,
Spain.
Running title:
Seasonal and inter-annual variability of bud development in oaks
*Corresponding author:
Arben Q. Alla
Instituto Pirenaico de Ecología, CSIC.
Avenida Montañana 1005, 50080 Zaragoza, Spain.
E-mail: [email protected]
Tel. 0034-976-716031, Fax: 0034-976-716019

2
Summary
In trees, bud development is driven by endogenous and exogenous factors such as
species and climate, respectively. However, there is scarce knowledge on how these factors
drive the changes in bud size across different time scales.
We describe the seasonal patterns of apical bud enlargement as related to primary and
secondary growth in two coexisting Mediterranean oaks with contrasting leaf habit (Quercus
ilex, evergreen; Quercus faginea, deciduous) over three years. Furthermore, we determine the
climatic factors driving changes in bud size of both oak species by correlating bud mass with
climatic variables at different time scales (from 5 to 30 days) over a 15-year period.
We found that the maximum enlargement rate of buds is reached between late July and
mid-August in both species. Moreover, the apical bud size increased as minimum air
temperatures did during the period of maximum bud enlargement rates.
The forecasted rising minimum air temperatures predicted by climatic models may
affect bud size and consequently alter crown architecture differentially in sympatric
Mediterranean oaks. However, the involvement of several drivers controlling the final size of
buds makes it difficult to predict the changes in bud size as related to ongoing climate
warming.
Key words: bud size, current-year stem, Quercus faginea, Quercus ilex subsp. ballota,
temperature, summer growth.

3
Introduction
The buds formed within an individual tree show different sizes (Gill, 1971). Bud size
determines primary growth and reproduction ability in plants with rhythmic growth (Nitta and
Ohsawa, 1998). This suggests that bud size is modulated by several drivers including the
individual tree size and vigour, the position of the bud in the shoot, and ontogenetic factors
(Remphrey and Powell, 1984; Sabatier and Barthélémy, 2001; Puntieri et al., 2002a, 2002b;
Ishihara and Kikuzawa, 2009; Alla et al., 2011). Among the endogenous factors, secondary
growth has been found to drive bud size since changes in current-year stem cross-sectional
area are linked to the stem hydraulic conductivity and the size of buds (Cochard et al., 2005;
Lauri et al., 2008; Alla et al., 2011). However, it remains unclear when the secondary growth
of trunks and current-year stems occur in relation to the pattern of bud enlargement, whether
these processes overlap in time, and if climate indirectly affects the development of buds
through the control of secondary growth. Climate and species are two of the main exogenous
and endogenous factors, respectively, affecting bud size in trees (Kozlowski et al., 1973;
Salminen and Jalkanen, 2004; Meier and Leuschner, 2008; Sanz-Pérez and Castro-Díez,
2010).
In species with preformed growth, shoot primordia are initiated inside the buds in a
growing season but remain un-extended during the autumn-winter resting period until the
following spring (Puntieri et al., 2002b). Many temperate Quercus species present preformed
growth of their shoots (Fontaine et al., 1999). Meristems and preformed primordia generally
are enclosed and protected by specialized elements, which determine the type of bud (Puntieri
et al., 2007). Quercus species have typical scaled buds (Keator, 1998) which show different
protective elements (hypsophylls, scales and cataphylls) and present a regular pattern of
development along the year (Nitta and Ohsawa, 1998, 1999). In spring, once shoot extension
is accomplished, the shoot presents a small hypsophyllary bud protected by hypsophylls and

4
located at the apex. A bud consists of many scales developed in the following weeks,
switching to a small scaled bud (Nitta and Ohsawa, 1999). Scaled buds enlarge until early or
mid-autumn, when they enter dormancy (Arora et al., 2003; Horvath et al., 2003). This
resting stage is broken in late winter or early spring when buds start swelling (Marks, 1975;
Montserrat-Martí et al., 2009). Indeed, the adaptive value of scaled buds seems to be the
protection of the shoot primordia against climatic stressors such as low temperatures during
the cold winter season (Nitta and Ohsawa, 1998).
Despite the relevance of buds as organs determining the aboveground growth and
reproduction patterns of trees, the driving factors controlling the seasonal pattern of bud
enlargement have received little attention except in the case of conifers (Kozlowski et al.,
1973; Lanner, 1985; Chen et al., 1996). Such drivers must be characterised to understand how
variations in bud size relate to bud composition and primary growth within a tree species. In a
previous study, Montserrat-Martí et al., (2009) analysed the seasonal patterns of bud
enlargement in two co-existing Mediterranean Quercus species with contrasting leaf habit,
namely Quercus ilex L. subsp. ballota (Desf.) Samp. (evergreen; hereafter abbreviated as Q.
ilex) and Q. faginea Lam. (winter deciduous). They showed that the buds of both species
reached the maximum growth rate in summer, although their data lacked the temporal
resolution to determine the precise period of maximum growth rate. In addition, they observed
that these two species present a reduced growth activity in response to drought during summer
when shoot and secondary growth are almost arrested and acorns enlarge at a very low rate.
Their study also showed that budburst and shoot extension occurred earlier in Q. faginea than
in Q. ilex, so the buds of Q. faginea grow during more time than those of Q. ilex. Montserrat-
Martí et al. (2009) also reported an alternating yearly pattern of bud and shoot size in Q. ilex.
Such pattern may be related to the different seasonal patterns of bud enlargement in the two
studied species.

5
In this study we aimed: (i) to quantify the seasonal patterns of bud enlargement and
secondary growth of main (trunk) and current-year stems of Q. ilex and Q. faginea over three
years with contrasting climatic conditions, and (ii) to identify the climatic factors which most
influence bud size of both species over a 15-year period. Our hypotheses were: (i) buds will
attain their maximum enlargement rate when the climatic conditions are harsh enough for
cessation of other aboveground growth types (primary, secondary and reproductive), usually
occurring in mid-summer, and (ii) the main climatic drivers of bud enlargement will be those
more important for growth in summer, namely water availability. In this study, other growth
types happening in summer (lammas growth and acorn development) were discarded as they
tend to occur in a small percentage of branches (Alla et al., unpubl. res.). Furthermore, the
size of apical buds did not differ between shoots bearing and not bearing acorns (Alla et al.
2012).
Material and methods
Study area and species
The study site is located in Agüero, Aragón, north eastern Spain (42° 18’ N, 0° 47’ W, 750 m
a.s.l.). Climate is Mediterranean and continental being characterized by dry summers and cold
winters, with 544 mm and 13.8 ºC of total annual precipitation and mean annual temperature,
respectively. Soil in this area is a Calcisol (FAO, 1998), formed on Miocene clays with
bedrock of calcareous sandstone. Vegetation is a scrubland dominated by Q. ilex, Q. faginea,
Arbutus unedo L. and Pinus halepensis Mill., approximately with similar dominance, and
other less abundant woody species (see Montserrat-Martí et al., 2009 for further details on the
study site).
Quercus ilex is an evergreen oak tree with semi-ring to diffuse porous wood (Campelo
et al., 2007), which grows preferentially inland under continental conditions in the Iberian

6
Peninsula (Amaral Franco, 1990). Q. faginea is a deciduous oak tree with ring-porous wood
(Corcuera et al., 2004a) and with a wide distribution in sub-Mediterranean areas of the
Iberian Peninsula (Amaral Franco, 1990). Both oak species frequently coexist in the study
area forming multi-stemmed trees (Table 1).
Table 1. Morphological and structural features of the studied species and trees (means ± SE).
Species Diameter at
1.3 m (cm) Height (m)
No. stems
per tree
Shoot length (mm)
2006 2007 2008
Q. ilex 10.2 ± 1.2b 3.4 ± 0.4b 6.5 ± 1.0a 29.4 ± 2.0aC 43.2 ± 2.2aA 35.7 ± 2.0aB
Q. faginea 14.5± 1.8a 5.7 ± 0.9a 4.0 ± 1.2b 17.7 ± 1.8bB 24.7 ± 2.6bA 23.4 ± 1.9bA
Small letters correspond to significant differences between species and capital letters indicate
significant differences among years in the case of shoot length (P < 0.05, Mann-Whitney U tests).
Figure 1. Monthly climatic data (maximum, mean and minimum temperatures; total
precipitation) recorded during the study period (1997-2011).
Field sampling and variables measured
Two different approaches were undertaken: the seasonal development measurements were
made over three years (2006-2008) and the inter-annual measurements were taken over fifteen
Months
1997 1998 1999 2000 2001 2002 2003 2004 2005 2006 2007 2008 2009 2010 2011 2012
Pre
cip
ita
tio
n (
mm
)
0
20
40
60
80
100
120
140
Te
mp
era
ture
(ºC
)
0
5
10
15
20
25
30
35
Precipitation
Temperature

7
years (1997-2011). Climate varied markedly among the studied years. During the monitoring
period of seasonal development higher summer temperature and lower precipitation in 2007
as compared with 2006 and 2008 were detected, whereas during the long-term period 1998,
2005 and 2011 were dry years while 2003 was very warm (Fig. 1).
Seasonal development
In spring 2006 before budburst, four mature individuals per species were randomly selected,
tagged and the size (diameter at 1.3 m, height) and number of stems per tree were registered
(Table 1). Within each multi-stemmed tree, ten current-year shoots were randomly selected
and collected monthly from the southern side and upper third of the crown during three
consecutive years (2006, 2007 and 2008). We assumed that all stems of each tree were
equivalent in architectural terms. Current-year shoots were frozen until measures were taken
in the laboratory. To minimize shoot length variability, the average length of the shoots
selected for analyses was similar among sampling dates for both species within each tree and
year. Shoot length and diameter (the average of two perpendicular measures taken in the
middle of the stem without nodes) were measured in each shoot with a centesimal calliper
(Mitutoyo, Kawasaki, Japan). Diameter was transformed to stem cross-sectional area
assuming a circular shape. Buds were oven-dried at 60 °C to a constant weight before being
individually weighted to the nearest 0.001 g to obtain the apical bud mass.
In order to assess the relationships between bud mass, size and composition (number
and type of primordia contained within the bud) we performed bud dissection in selected
dates of bud development, namely: budburst (April-May), formation of the scaled bud (June-
July) and enlargement of the bud (August). Dissection of buds is a destructive method and, in
most cases, we cannot know the exact number of leaves produced by the shoot derived from
dissected buds. There are at least two methods to solve this problem. First, we may select a

8
bud of similar size and position on a shoot of similar characteristics as the dissected bud and
follow its development (Puntieri et al., 2002a). Second, we can assume that the dissected
apical bud will produce a similar shoot as the bearing shoot. We followed the second
approach which renders a reliable approximation to the actual fate of the analysed buds. The
apical buds of 35 shoots of Q. ilex and 40 shoots of Q. faginea were removed and dissected at
10-100x magnification under a stereomicroscope (Leica MZ6, Leica Microsystems,
Heerbrugg, Switzerland). Then, the components of the bud (hypsophylls, scales, cataphylls,
and leaf primordia) were visually distinguished, according to their different size, shape, and
extension growth at budburst, and counted following the method proposed by Nitta and
Ohsawa (1998, 1999).
To quantify changes in stem secondary growth the radial increment of those trees
sampled for bud enlargement was measured using manual band dendrometers (Agriculture
Electronics Corporation, Tucson, USA) during the three years of study. In March 2006,
dendrometers were placed at 1.3 m on the thickest stem of the selected multi-stemmed
individuals. Bark was carefully brushed off before installing the dendrometers, which were
read at 24-day intervals on average. Displacement measurements were taken with a precision
of 0.1 mm and readings after rainy days were discarded. Radial growth was transformed to
basal area considering the initial diameter of the trees.
Inter-annual measurements
Samplings for the inter-annual assessment of bud size and shoot growth were done at mid-
October from 1997 to 2011, i.e. during 15 years. Each year 20 mature trees were randomly
selected for each species. Annually, we collected 15 shoots per tree from the southern side
and upper third of the crown (n = 300 shoots). Then, we randomly selected 30 shoots per
species, excluding very big and very small shoots and also lammas shoots, to get the annual

9
mean values of shoot length and stem cross-sectional area and bud size. October was selected
as the most adequate time for annual sampling because shoot development is completed and
buds have almost reached their final size by that time of the year. Shoot length and stem
cross-sectional area were measured and apical buds were removed. After being oven-dried the
apical buds were individually weighted as previously described.
To estimate the radial growth patterns of the sampled trees during the period 1997-
2011, the main trunk was cored at 1.3 m using an increment Pressler borer. All wood samples
were prepared following standard dendrochronological methods, they were air dried, sanded
and visually cross-dated (Cook and Kairiukstis, 1990). Tree-ring widths were then measured
at a precision of 0.001 mm using a LINTAB measuring system (Rinntech, Heidelberg,
Germany). Lastly, they were standardized and transformed into tree-ring width indices by
subtracting the raw width by the mean value and then retaining the residuals, i.e. the
differences between observed and fitted values.
Climatic data and water balance
Daily climate data (maximum temperature, Tmax; minimum temperature, Tmin; and total
precipitation, P) for the period 1997-2011 were obtained from the weather station of Luna
(42º 10’ N, 0º 56’ W, 409 m a.s.l.), situated at ca. 18 km from the study site. Daily air
temperature were obtained from January 2007 up to December 2011 at the study site using a
Hobo®
data logger which recorded temperatures every 30 minutes (Onset Computer Co.,
Bourne, USA) (Fig. 1). To estimate local temperatures for the previous years (1997-2006), a
linear regression between local data (y) and data from the weather station (x) was calculated (y
= 0.2131 + 0.9067x; r = 0.97, P < 0.0001). Daily cumulative water balance (hereafter
abbreviated as WB) was calculated as explained in Montserrat-Martí et al. (2009). Briefly, the
soil WB was estimated by using a modified Thornthwaite water-budget procedure based on
10
mean temperature and total precipitation data. Following this procedure, soil–water balance is
modelled by estimating soil-water withdrawal (actual evapotranspiration), recharge, and
surplus. Actual evapotranspiration is related to the percentage of the current soil at the
available water capacity, and to potential evapotranspiration, which is estimated from mean
temperature and day length.
Data analyses
To compare tree features (diameter at 1.3 m, height, number of stems per tree) and studied
variables (basal area, stem cross-sectional area and apical bud mass) between species and
among years we performed non-parametric Mann-Whitney U tests. We also used this test to
compare shoot length between species and among years by performing pairwise comparisons.
To compare basal area, stem cross-sectional area and apical bud mass values among years and
sampling dates we performed linear mixed-effects models considering years and dates as
fixed factors and individuals as random factors.
To estimate the growth rates of measured variables (basal area, stem cross-sectional
area, apical bud mass) we fitted the following logistic model to cumulative growth data (y) as
a function of time (x) using the CurveExpert software (Hyams, 2010):
( )) (1)
where a is the maximum or asymptotic value, b is the maximum daily rate and c is the Julian
day when the maximum growth rate was attained.
Correlation analyses were performed using the Pearson correlation coefficient to
evaluate the relationships between growth (tree-ring width indices, shoot length, stem cross-
sectional area, apical bud mass) and climatic variables (Tmax, Tmin, P, WB). Correlations
were calculated for the 15-year (1997-2011) study period considering the growing season
from March to early October. To detect potential lags or cumulative effects between climatic

11
and growth variables, climatic data were averaged (Tmax, Tmin) or summed (P, WB) for
periods of increasing time span (5, 10, 15 and 30 days). To simplify, we only present the
maximum correlations, in absolute terms, and the period when it was observed.
Figure 2. Intra-annual trends observed in cumulative stem basal area (BA), current-year stem
cross-sectional area (SCA) and apical bud mass (ABM) of Q. ilex and Q. faginea. The
different symbols and lines correspond to data (means ± SE) and fitted logistic models,
respectively, for the three years of study. Time is given as days (bottom axis) and as months
(top axis).
0
1
2
3
4
5
6
7
8
9
J F M A M J J A S O N D J F M A
BA
(cm
2)
0
1
2
3
4
5
6
J F M A M J J A S O N D J F M A
SC
A (
mm
2)
0.0
0.5
1.0
1.5
Day
0 60 120 180 240 300 360 420 480
AB
M (
mg)
0
1
2
3
42006
2007
2008
0.0
0.5
1.0
1.5
0 60 120 180 240 300 360 420 480
0
2
4
6
8
10
12
Q. fagineaQ. ilex
12
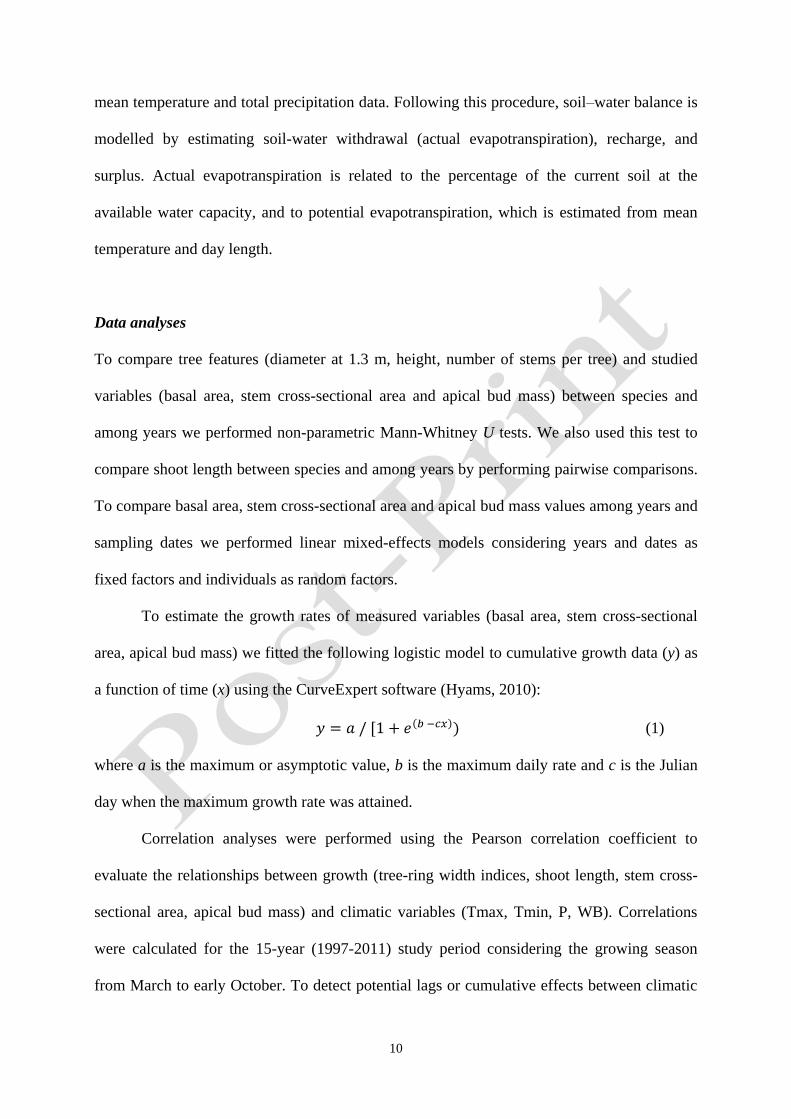
Results
Seasonal dynamics of basal area, stem cross-sectional area and bud size
Considering all data, we found significant differences between species for both apical bud
mass (F = 96.91, P < 0.0001) and basal area (F = 11.82, P < 0.001), but not for stem cross-
sectional area (F = 0.01, P = 0.95). As expected all variables showed significantly different
values among sampling dates and among years, excepting apical bud mass which did not
differ among years in both species (Fig. 2; Table 2).
Table 2. Main statistics (F and P between parentheses) of linear mixed-effects models fitted
to compare growth variables among the three study years for each oak species. Individual
trees were considered random factors.
Variable Factor Q. ilex Q. faginea
Stem basal area Year 13.67 (<0.001) 16.38 (<0.001)
Date 17.03 (<0.001) 85.69 (<0.001)
Stem cross-sectional area Year 40.82 (<0.001) 12.61 (<0.001)
Date 116.45 (<0.001) 137.04 (<0.001)
Apical bud mass Year 2.22 (0.14) 2.26 (0.13)
Date 184.37 (<0.001) 502.01 (<0.001)
Basal area presented the lowest values in 2006 and the highest ones in 2008. In the case of
stem cross-sectional area both species showed increasing values from 2006 to 2008. In Q.
ilex, apical bud mass showed an alternate yearly pattern with the highest values in 2006 and
the lowest ones in 2007, whereas in Q. faginea apical bud mass behaved as the stem cross-
sectional area did, i.e. showing minimum and maximum mean values in 2006 and 2008,
respectively (Fig. 2, Table 3).
Growth of all measured variables, except the ending of apical bud mass development,
started and finished earlier in Q. faginea than in Q. ilex during the three years of study (Figs. 2
and 3). Q. faginea showed a larger final apical bud mass than Q. ilex, while basal area and
stem cross-sectional area did not differ between species (Table 3).

13
Table 3. Statistical analyses based in the logistic model ( ( )) as a function
of time (x, in Julian days) for cumulative values of stem basal area, current-year stem cross-
sectional area and apical bud mass of Q. ilex (Qi) and Q. faginea (Qf). Models were highly
significant (P < 0.001, R2 > 0.96) in all cases.
a b c
Qi Qf Qi Qf Qi Qf
Basal area
2006 1.93 ± 0.61b 3.70 ± 1.58 0.019 ± 0.008 0.051 ± 0.020 9 July ± 7abA 3 June ± 2B
2007 3.32 ± 1.34ab 5.41 ± 2.52 0.035 ± 0.015 0.066 ± 0.029 16 July ± 2aA 4 June ± 4B
2008 4.31 ± 1.40a 5.55 ± 2.00 0.033 ± 0.013 0.047 ± 0.020 2 July ± 5bA 8 June ± 3B
Stem cross-sectional area
2006 1.02 ± 0.06b 1.11 ± 0.15b 0.010 ± 0.001 0.009 ± 0.001 29 May ± 3bA 15 May ± 5B
2007 1.16 ± 0.09ab 1.22 ± 0.18ab 0.010 ± 0.001 0.010 ± 0.001 3 June ± 3bA 12 May ± 4B
2008 1.33 ± 0.10a 1.48 ± 0.17a 0.012 ± 0.002 0.009 ± 0.001 21 June ± 1aA 22 May ± 9B
Apical bud mass
2006 3.38 ± 0.67B 8.73 ± 1.44A 0.023 ± 0.004B 0.069 ± 0.009bA 13 August ± 7 4 August ± 5
2007 2.62 ± 0.50B 9.40 ± 0.79A 0.023 ± 0.007B 0.074 ± 0.009bA 7 August ± 6 3 August ± 6
2008 2.82 ± 0.52B 10.94 ± 1.80A 0.027 ± 0.005B 0.095 ± 0.009aA 12 August ± 4 9 August ± 9
Abbreviations: a, maximum value (units: basal area, cm2; stem cross-sectional area, mm
2;
apical bud mass, mg), b, maximum rate (units: basal area, cm2 d
-1; stem cross-sectional area,
mm2 d
-1; apical bud mass, mg d
-1), c, day of maximum rate. Small letters correspond to
significant differences among years and capital letters indicate significant differences between
species (P < 0.05, Mann-Whitney U tests).
Considering all analysed variables and years, maximum growth rates were significantly
higher for Q. faginea than for Q. ilex only in the case of apical bud mass. The day of the
maximum growth rate was always observed earlier in Q. faginea than in Q. ilex for basal area
and stem cross-sectional area, and such date showed a higher year-to-year variability in Q.
ilex than in Q. faginea. The stem cross-sectional area of Q. faginea was the variable showing
the earliest day of maximum growth rate, which was on average the 16th
May, whereas the
apical bud mass of Q. ilex was the variable with the corresponding latest day of maximum
enlargement rate being on average the 11th
August (Table 3, Fig. 3). The maximum
enlargement rate of apical bud mass was attained in the first two weeks of August in both
species and for the three years of study (Table 3).

14
Figure 3. Intra-annual growth rates of basal area (BA), current-year stem cross-sectional area
(SCA) and apical bud mass (ABM) during the three years of study based on the fitted logistic
models (see Fig. 2). Black areas correspond to Q. ilex rates, grey areas represent Q. faginea
rates and dark grey areas indicate the intersections between both species. Time is given as
days (bottom axis) and as months (top axis).
BA
rate
(m
m2 d
-1)
0.00
0.02
0.04
0.06
0.08
Month
J F M A M J J A S O N D J F M A M J J A S O N D J F M A M J J A S O N D J
Q. ilex
Q. faginea S
CA
rate
(m
m2 d
-1)
0.000
0.002
0.004
0.006
0.008
0.010
0.012
0.014
2006 2007 2008
Day
30 90 150 210 270 330 390 450 510 570 630 690 750 810 870 930 990 1050
AB
M r
ate
(m
g d
-1)
0.00
0.02
0.04
0.06
0.08

15
Bud dissection revelated that all leaf primordia were initiated before the period of maximum
growth rate of apical bud mass was reached (Table 4). In early August Q. ilex was initiating
the hypsophylls of the following apical bud, while Q. faginea probably had all hypsophylls
already initiated. Anyway, if any new primordia were formed during August it would be the
last elements of the heteroblastic series of the year, i.e. the hypsophylls. Scales are initiated at
the beginning of the year of growth when buds are at the swellins stage, just before the onset
of budburst.
Table 4. Number of pairs (minimum-maximum values) of primordia or formed structures
(hypsophylls, scales, cataphylls and stipules) contained within the buds of the two studied oak
species along the period of bud development.
Q. ilex Q. faginea
Event Hypsophylls Scales Cataphylls Stipules Hypsophylls Scales Cataphylls Stipules
Budburst
(April-May) 1-2 1-2 0 0 2-3 2-4 0 0
Formation of
baled buds
(June-July)
1-2 1-3 2-3 5-11 2-3 3-7 3-6 4-7
Intense bud
enlargement
(August)
1-2 1-3 2-3 8-11 2-3 3-7 3-6 8-12
Climatic drivers of growth and bud enlargement
Most significant correlations between climate and growth parameters were observed for time
spans ranging between 5 and 15 days (Table 5). Maximum (Tmax) and minimum (Tmin)
spring and early summer temperatures correlated negatively with tree-ring width indices,
shoot length and stem cross-sectional area, whereas late July to early August temperatures,
particularly Tmin, showed positive relationships with apical bud mass for both species. Spring
precipitation and cumulative water balance were positively correlated with all growth
variables, except in the case of apical bud mass of Q. ilex and Q. faginea, which were more
related to early summer water availability and water balance in late summer, respectively.
Furthermore, apical bud mass responded positively to early July and negatively to late August

16
precipitation and water availability in Q. ilex and Q. faginea, respectively (Table 5). apical
bud mass was mainly and positively related to early August Tmin considering 5- to 15-day
spans, but also to 5-day Tmax (Table 5, Fig. 4).
Discussion
The maximum enlargement rate of the buds of both oak species is reached in mid-summer,
between the 3rd
and the 13th
August, although the peak enlargement rate of Q. faginea was on
average 6 days earlier than that of Q. ilex. In spite of this moderate temporal lag in maximum
bud enlargement rates, both oak species present very similar patterns of apical bud
enlargement. This brief period in early August probably corresponds to the relatively least
favourable period for vegetative growth since secondary growth is constrained by low soil
water availability (Montserrat-Martí et al. 2009). During summer, low precipitation amounts
and elevated air temperatures, causing high evapotranspiration rates, lead to soil water deficit
(Alla et al. 2012). However, despite the fact that both studied species present a very low
activity in shoot elongation or stem thickening during this period their buds enlarge
intensively as previously described by Montserrat-Martí et al. (2009). Contrastingly, the mid-
summer water shortage experienced by plants under Mediterranean climatic conditions limits
the hydration levels required by some meristems to grow (Palacio et al., 2008). Our analyses
on bud composition evidence that the final number of leaf primordia is reached in both
species before the maximum rate of bud enlargement occurred. Since fresh and dry bud mass
are highly related in both studied species (Q. ilex, R2 = 0.95, n = 120; Q. faginea, R
2 = 0.98, n
= 134, P < 0.001 in both cases) we assume that bud mass is a reliable estimate of the number
of leaf primordia formed within the bud. Finally, our findings suggest that conditions suitable
for bud growth may be provided inside enclosed structures which are highly protected by an
envelope of scale-like structures, namely bud scales and cataphylls protecting shoot primordia

17
Table 5. Significant (P < 0.05) Pearson correlation coefficients obtained between growth (tree-ring width index, current-year shoot length,
current-year stem cross-sectional area and apical bud mass) of Q. ilex (Qi) and Q. faginea (Qf) and related climatic variables (Tmax, Tmin, mean
maximum and minimum temperatures, respectively; P, precipitation; WB, cumulative water balance).
Variable
Time span
(days)
Tree-ring width index Shoot length Stem cross-sectional area Apical bud mass
Qi Qf Qi Qf Qi Qf Qi Qf
Tmax
5 -0.55 (11-15 May) -0.55 (11-15 May) -0.62 (11-15 April) -0.81 (1-5 May) -0.60 (26-30 March) -0.67 (26-30 March) 0.65 (30 July-3 August) 0.61 (30 July-3 August)
10 -0.57 (20-29 June) -0.57 (10-19 June) -0.51 (1-10 April) -0.70 (1-10 May) −−− -0.71 (21-30 May) −−− −−−
15 -0.60 (15-29 June) -0.62 (15-29 June) -0.61 (1-15 April) -0.70 (1-15 May) -0.63 (16-30 March) -0.64 (16-30 March) −−− −−−
30 -0.69 (June) -0.61 (June) -0.63 (April) -0.63 (April) -0.52 (May) -0.66 (May) −−− −−−
Tmin
5 -0.51 (25-29 June) -0.77 (20-24 June) -0.64 (10-14 June) -0.70 (1-5 May) -0.61 (26-30 March) −−− 0.66 (30 July-3 August) 0.57 (30 July-3 August)
10 -0.54 (10-19 July) -0.72 (20-29 June) −−− -0.63 (1-10 May) -0.55 (21-30 March) −−− 0.70 (30 July-8 August) 0.72 (30 July-8 August)
15 -0.81 (15-29 June) -0.52 (15-29 June) −−− −−− -0.72 (16-30 March) −−− 0.50 (30 July-13 August) 0.74 (30 July-13 August)
30 −−− -0.65 (June) −−− −−− −−− −−− −−− −−−
P
5 −−− −−− −−− 0.70 (26-30 April) 0.60 (20-24 May) 0.53 (26-30 March) 0.74 (30 June-4 July) -0.59 (24-28 August)
10 −−− 0.50 (21-30 May) −−− 0.71 (21-30 April) −−− −−− 0.68 (30 June-9 July) −−−
15 0.68 (16-30 April) −−− −−− −−− −−− −−− 0.70 (1-15 July) −−−
30 −−− −−− −−− −−− −−− −−− −−− −−−
WB
5 −−− −−− −−− 0.70 (26-30 April) −−− 0.57 (26-30 March) 0.69 (30 June-4 July) -0.65 (24-28 August)
10 −−− −−− −−− 0.67 (21-30 April) −−− −−− 0.64 (30 June-9 July) −−−
15 0.72 (16-30 April) −−− −−− −−− −−− −−− −−− −−−
30 −−− −−− −−− −−− −−− −−− −−− −−−
The dates of the displayed correlations are indicated between parentheses. Correlations were calculated for the period 1997-2011 considering the
growing season from March to early October. Climatic data were averaged (Tmax, Tmin) or summed (P, WB) for periods of increasing time span
(5, 10, 15 and 30 days).

18
and scaly cupules enclosing developing acorns. Contrastingly, primary and secondary growths
are mostly arrested at mid-summer in the studied species (Montserrat-Martí et al., 2009;
Gutiérrez et al., 2011).
The variables of primary growth were influenced by climate when growth started and
when it was fully performed. Similarly, the radial growth on both studied species were
negatively influenced by temperature and positively by water availability in spring and early
summer, when secondary growth attains its maximum rate, in agreement with other published
results (Corcuera et al., 2004a, 2004b; Gutiérrez et al., 2011). Moreover, a higher availability
of water in early summer seems to favour the earlier accomplishment of vegetative shoot
growth and the start of bud enlargement in Q. ilex. The same correlation was not found in Q.
faginea, as it finishes its shoot development at mid spring, 4-7 weeks earlier than Q. ilex. On
the other hand, precipitation at the end of August probably favours the enlargement of acorns
over that of buds in Q. faginea but not in Q. ilex, reflecting the early acorn development of the
former species (Montserrat-Martí et al., 2009).
The most unexpected and interesting result was the positive association between apical
bud mass and temperature in summer, particularly the minimum, coinciding with the period of
maximum bud enlargement rates between late July and mid-August. High air temperatures in
summer restrict primary and secondary growth through enhanced evapotranspiration rates
since they preclude tissue hydration during the driest period of the growing season
(Montserrat-Martí et al. 2009). Nevertheless, the growth of scale-protected structures such as
buds seems to be enhanced by warm summer nights, i.e. high minimum temperatures, as
growing tissues are actively enlarging at night (Boyer, 1968; Ortega, 2010). Our results
suggest that buds are more responsive to warm night temperatures during summer, when the
studied oak species may access soil water reserves (Villar-Salvador et al., 1997). However,
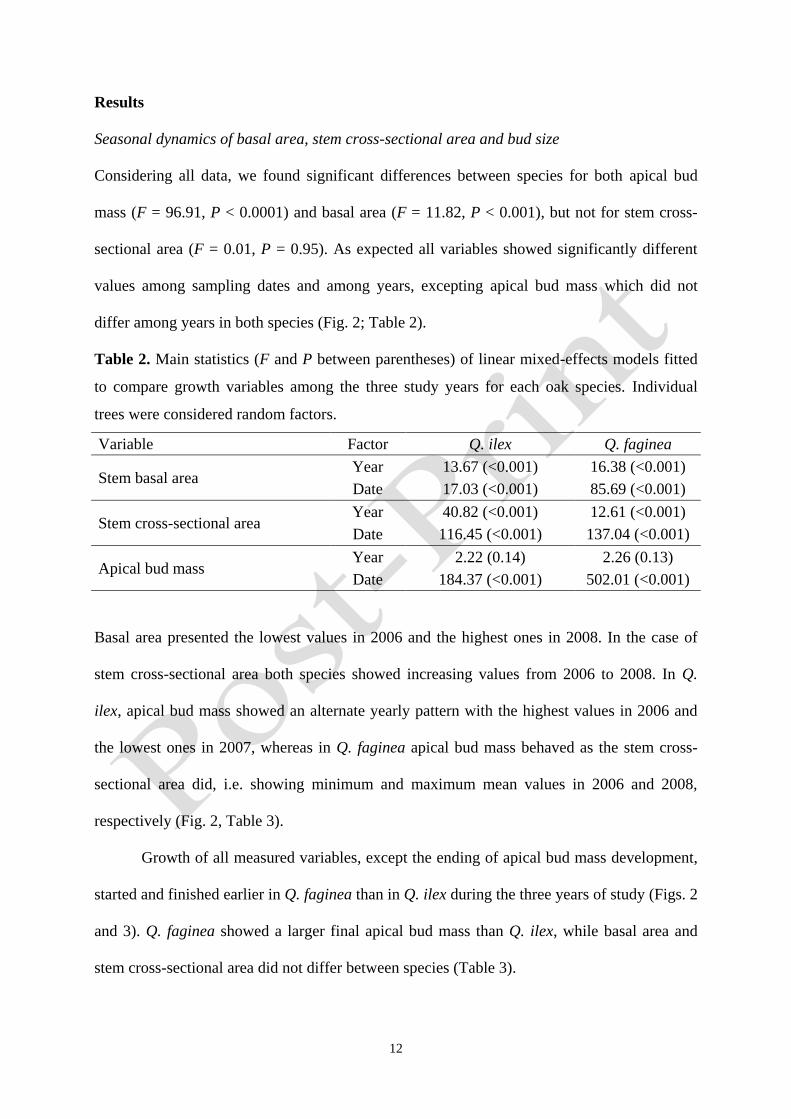
19
other meristems as the cambium are more controlled by the tree water status (Gutiérrez et al.,
2011).
Figure 4. Inter-annual variations of the apical bud mass of Q. ilex and Q. faginea as related to
minimum temperatures of the ten-day interval 30 July-8 August along the 15 years of study
(1997-2011). We found for this time interval the highest Pearson correlation coefficients
between temperature and apical bud mass.
Our results aid to explain the alternating year-to-year pattern of long shoots and small buds
with short shoots and big buds formed the following year observed in Q. ilex. The idea that
the production of numerous long shoots would constrain bud development, must be
complemented by the effect of the early to mid-August minimum temperatures on bud
enlargement. In the studied climatic series we observed a regular alternating pattern of
minimum summer temperatures during the period 1997-2004 (Fig. 4). In this period, the
minimum temperatures from late July to mid-August strongly correlated with bud size in Q.
ilex, explaining the pattern described by Montserrat-Martí et al. (2009). We did not observe
the same zigzag pattern in the deciduous Q. faginea, despite showing a similar temperature-
Year
1997 1998 1999 2000 2001 2002 2003 2004 2005 2006 2007 2008 2009 2010 2011
Apic
al-bud m
ass (
mg)
0
2
4
6
8
10
12
Mean m
inim
um
tem
pera
ture
(3
0 J
uly
-8 A
ugust)
(ºC
)
12
14
16
18
20
22Q. ilex
Q. faginea
Tmin

20
bud correlation or even stronger than in the case of Q. ilex. This could be explained by the
longer period of bud enlargement of Q. faginea as compared with Q. ilex, which would
mitigate the effects of temperature in this short summer period on the final bud size.
During the last 60 years the minimum temperatures of the considered summer period
have significantly increased at a mean rate of +0.03 ºC yr-1
(r = 0.30, P = 0.017). Such
observation is consistent with the increase of air temperatures associated to ongoing climate
warming (IPCC, 2007). This trend might result in the increase of the apical bud size in the
forthcoming years, which could have consequences for the development of tree crowns.
However, we do not know how plastic bud enlargement would be and to what extent would it
allow trees to adjust their phenological patterns to the forecasted warmer conditions. For
example, the severe summer droughts recorded in 2005 and 2011 led to the formation of very
small buds in both oak species, despite their contrasting leaf phenologies, probably because
plants were not able to adequately hydrate bud tissues at mid-summer (Alla et al., unpubl.
res.). The involvement of more than one driving factor on the final size of buds makes it
difficult to predict the variations of bud size associated to climate change.
We consider this study a relevant example showing the usefulness of phenological
analyses of tree species as a tool to interpret their responses to environmental factors and to
facilitate the understanding of their ecological adaptations. The study of the temporal
arrangement of different phenological events including the developmental pattern of buds
allows analysing how these events overlap with each other, and how they are affected by
different climatic stressors. Taking into account that growth in seasonally dry and cold
climates is limited by temperature and water availability (Chapin et al., 1987), and that
different plant structures show distinct climatic thresholds, the accurate knowledge of the
temporal arrangement of phenophases is key for interpreting the functional responses of
plants.

21
To conclude, Q. faginea started bud enlargement earlier than Q. ilex, but both species
reached maximum bud enlargement rates in the first two weeks of August, with a few days of
advanced peak in the deciduous species. Warm night temperatures in this short summer
period enhance bud enlargement. These findings suggest that the rise in air temperature
forecasted by climatic models will enhanced bud size in both studied Mediterranean oak
species.
Acknowledgements
We thank the comments provided by two anonymous reviewers and the handling editor (N.
Chaffey) for improving a previous version of the manuscript. A.Q.A. and J.J.C. acknowledge
the support of MAEC-AECID and ARAID, respectively. This work was supported by the
Spanish Ministerio de Ciencia e Innovación and FEDER (grant numbers CGL2008-04847-
C02-01, CGL2010-16880 BOS, CGL2011-26654 BOS). We thank the support of the
Globimed network. We thank the “Oficina del Regante de Aragón” and “Agencia Estatal de
Meterorología (AEMET)” for providing climatic data. We acknowledge Sara Palacio for
revising a previous version of this work. We thank J. Albuixech and E. Lahoz for their help in
the field and the laboratory, respectively.
References
Alla AQ, Camarero JJ, Maestro-Martínez M, Montserrat-Martí G. 2012. Acorn
production is linked to secondary growth but not to declining carbohydrate
concentrations in current-year shoots of two oak species. Trees 26: 841–850.
Alla AQ, Camarero JJ, Rivera P, Montserrat-Martí G. 2011. Variant allometric scaling
relationships between bud size and secondary shoot growth in Quercus faginea:
implications for the climatic modulation of canopy growth. Annals of Forest Science 68:
1245–1254.
Amaral Franco J. 1990. Quercus. In: Castroviejo S, Laínz M, López González G, Montserrat
P, Muñoz Garmendia F, Paiva J, Villa L, eds. Flora IbeÏrica. Real JardiÏn BotaÏnico,
CSIC, 15–36.

22
Arora R, Rowland LJ, Tanino K. 2003. Induction and release of bud dormancy in woody
perennials: a science comes of age. HortScience 38: 911–921.
Boyer JS. 1968. Relationship of water potential to growth of leaves. Plant Physiology 43:
1056–1062.
Campelo F, Gutiérrez E, Ribas M, Nabais C, Freitas H. 2007. Relationships between
climate and double rings in Quercus ilex from northeast Spain. Canadian Journal of
Forest Research 37: 1915–1923.
Chapin FS, Bloom AJ, Field CB, Waring RH. 1987. Plant responses to multiple
environmental factors. Bioscience 37: 49–57.
Chen HJ, Bollmark M, Eliasson L. 1996. Evidence that cytokinin controls bud size and
branch form in Norway spruce. Physiologia Plantarum 98: 612–618.
Cochard H, Coste S, Chanson B, Guehl JM, Nicolini E. 2005. Hydraulic architecture
correlates with bud organogenesis and primary shoot growth in beech (Fagus sylvatica).
Tree Physiology 25: 1545–1552.
Cook ER, Kairiukstis LA. 1990. Methods of dendrochronology: applications in the
environmental sciences. Boston, MA: Kluwer Academic Publishers.
Corcuera L, Camarero JJ, Gil-Pelegrin E. 2004a. Effects of a severe drought on growth
and wood anatomical properties of Quercus faginea. IAWA Journal 25: 185–204.
Corcuera L, Camarero JJ, Gil-Pelegrín E. 2004b. Effects of a severe drought on Quercus
ilex radial growth and xylem anatomy. Trees 18: 83–92.
FAO. 1998. World reference base for soil resources. Rome: ISRIC and ISSS.
Fontaine F, Chaar H, Colin F, Clément C, Burrus M, Druelle JL. 1999. Preformation and
neoformation of growth units on 3-year-old seedlings of Quercus petraea. Canadian
Journal of Botany 77: 1623–1631.
Gill AM. 1971. The formation, growth and fate of buds of Fraxinus americana L. in central
Masachusetts. Harvard Forest Paper 20: 1–16.
Gutiérrez E, Campelo F, Camarero JJ, et al. 2011. Climate controls act at different scales
on the seasonal pattern of Quercus ilex L. stem radial increments in NE Spain. Trees 25:
637–646.
Horvath DP, Anderson JV, Chao WS, Foley ME. 2003. Knowing when to grow: signals
regulating bud dormancy. Trends in Plant Science 8: 534–540.
Hyams DG. 2010. CurveExpert. USA: The University of Tennessee, Chattanooga.
IPCC. 2007. Solomon S, Qin D, Manning M, Chen Z, Marquis M, Averyt KB, Tignor M,
Miller HL, eds. Climate change 2007: the physical science basis. Contribution of

23
Working Group I to the fourth assessment report of the Intergovernmental Panel on
Climate Change. Cambridge, UK and New York, NY, USA: Cambridge University
Press.
Ishihara MI, Kikuzawa K. 2009. Annual and spatial variation in shoot demography
associated with masting in Betula grossa, comparison between mature trees and
saplings. Annals of Botany 104: 1195–1205
Keator G. 1998. The life of an oak: an intimate portrait. California, USA: Heyday.
Kozlowski TT, Torrie JH, Marshall PE. 1973. Predictability of shoot length from bud size
in Pinus resinosa Ait. Canadian Journal of Forest Research 3: 34–38.
Lanner RM. 1985. On the insensitivity of height growth to spacing. Forest Ecology and
Management 13: 143–148.
Lauri PÉ, Bourdel G, Trottier C, Cochard H. 2008. Apple shoot architecture: evidence for
strong variability of bud size and composition and hydraulics within a branching zone.
New Phytologist 178: 798–807.
Marks PL. 1975. On the relation between extension growth and successional status of
deciduous trees of the North-eastern United States. Bulletin of the Torrey Botanical
Club 102: 172–177.
Meier IC, Leuschner C. 2008. Leaf size and leaf area index in Fagus sylvatica forests:
competing effects of precipitation, temperature, and nitrogen availability. Ecosystems
11: 655–669.
Montserrat-Martí G, Camarero JJ, Palacio S, et al. 2009. Summer-drought constrains the
phenology and growth of two coexisting Mediterranean oaks with contrasting leaf habit:
implications for their persistence and reproduction. Trees 23: 787–799.
Nitta I, Ohsawa M. 1998. Bud structure and shoot architecture of canopy and understory
evergreen broad-leaved trees at their northern limit in East Asia. Annals of Botany 81:
115–129.
Nitta I, Ohsawa M. 1999. Bud and module structure of evergreen broad-leaved trees in
Anaga cloud forests. In: Ohsawa M, Wildpret W, del Arco M, eds. Anaga cloud forest.
A comparative study on evergreen broad-leaved forests and trees of the Canary Islands
and Japan. Chiba: Laboratory of Ecology, Chiba University, 139–146.
Ortega JKE. 2010. Plant cell growth in tissue. Plant Physiology 154: 1244–1253.
Palacio S, Hester AJ, Maestro M, Millard P. 2008. Browsed Betula pubescens trees are not
carbon-limited. Functional Ecology 22: 808–815.

24
Puntieri JG, Grosfeld JE, Stecconi M, Brion C, Barthélémy D. 2007. Bud and growth-unit
structure in seedlings and saplings of Nothofagus alpina (Nothofagaceae). American
Journal of Botany 94: 1382–1390.
Puntieri JG, Barthélémy D, Mazzini C, Brion C. 2002a. Periods of organogenesis in shoots
of Nothofagus dombeyi (Mirb.) Oersted (Nothofagaceae). Annals of Botany 89: 115-
124.
Puntieri JG, Stecconi M, Barthélémy D. 2002b. Preformation and neoformation in shoots
of Nothofagus antarctica (G. Forster) Oerst. (Nothofagaceae) shrubs from northern
Patagonia. Annals of Botany 89: 665–673.
Remphrey WR, Powell GR. 1984. Crown architecture of Larix laricina saplings: shoot
preformation and neoformation and their relationships to shoot vigour. Canadian
Journal of Botany 62: 2181–2192.
Sabatier S, Barthélémy D. 2001. Bud structure in relation to shoot morphology and position
on the vegetative annual shoots of Juglans regia L. (Juglandaceae). Annals of Botany
87: 117–123.
Salminen H, Jalkanen R. 2004. Does current summer temperature contribute to the final
shoot length on Pinus sylvestris? A case study at the northern conifer timberline.
Dendrochronologia 21: 79–84.
Sanz-Pérez V, Castro-Díez P. 2010. Summer water stress and shade alter bud size and
budburst date in three Mediterranean Quercus species. Trees 24: 89–97.
Villar-Salvador P, Castro-Díez P, Pérez-Rontomé C, Montserrat-Martí G. 1997. Stem
xylem features in three Quercus (Fagaceae) species along a climatic gradient in NE
Spain. Trees 12: 90–96.