Embed Size (px)
Citation preview

727
Seasonal, not annual precipitation drives community productivity across ecosystems
Todd M. P. Robinson, Kimberly J. La Pierre, Matthew A. Vadeboncoeur, Kerry M. Byrne, Michell L. Thomey and Samantha E. Colby
T. M. P. Robinson ([email protected]), W. K. Kellogg Biological Station, Michigan State Univ., 3700 E. Gull Lake Dr. Hickory Corners, MI 49060, USA. – K. J. La Pierre, Dept of Ecology and Evolutionary Biology, Yale Univ., New Haven, CT 06511, USA. – M. A. Vadeboncoeur, Earth Systems Research Center, Univ. of New Hampshire, Durham, NH 03824, USA. – K. M. Byrne, Graduate Degree Program in Ecology, Colorado State Univ., Fort Collins, CO 80523, USA. – M. L. Thomey, Dept of Biology, Univ. of New Mexico, Albuquerque, NM 87131, USA. – S. E. Colby, Dept Botany and Plant Pathology, Oregon State Univ., Corvallis, OR 97331, USA.
Understanding drivers of aboveground net primary production (ANPP) has long been a goal of ecology. Decades of investigation have shown total annual precipitation to be an important determinant of ANPP within and across eco-systems. Recently a few studies at individual sites have shown precipitation during specific seasons of the year can more effectively predict ANPP. Here we determined whether seasonal or total precipitation better predicted ANPP across a range of terrestrial ecosystems, from deserts to forests, using long-term data from 36 plant communities. We also deter-mined whether ANPP responses were dependent on ecosystem type or plant functional group. We found that seasonal precipitation generally explained ANPP better than total precipitation. Precipitation in multiple parts of the growing season often correlated with ANPP, but rarely interacted with each other. Surprisingly, the amount of variation explained by seasonal precipitation was not correlated with ecosystem type or plant functional group. Overall, examining seasonal precipitation can significantly improve ANPP predictions across a broad range of ecosystems and plant types, with impli-cations for understanding current and future ANPP variation. Further work examining precipitation timing relative to species phenology may further improve our ability to predict ANPP, especially in response to climate change.
Oikos 122: 727–738, 2013 doi: 10.1111/j.1600-0706.2012.20655.x
© 2012 The Authors. Oikos © 2012 Nordic Society Oikos Subject Editor: Martin F. Quigley. Accepted 29 June 2012
Understanding the variable nature of aboveground net primary production (ANPP) is a fundamental goal in ecology (Sala and Austin 2000). Historically, studies of ANPP have focused on regional and global patterns, link-ing temporal changes in ANPP to abiotic factors, especially annual precipitation and temperature (Rosenzweig 1968, Leith and Whittaker 1975, Sala et al. 1988). These studies have increased our knowledge of carbon cycling, trophic interactions, and predictions of agricultural yields (McNaughton et al. 1989, Baker et al. 1993, Motha and Baier 2005). Recent predictions of altered precipita-tion patterns (Easterling et al. 2000, Weltzin et al. 2003, Diffenbaugh et al. 2005) have initiated new studies on how increased precipitation variability affects plant com-munity dynamics (Heisler-White et al. 2009, Robinson and Gross 2010, Yang et al. 2011). While most studies have accounted for the effect of total annual precipitation on ANPP patterns (Lauenroth and Sala 1992, Ma et al. 2008), several site-specific studies have recently found that precipitation within specific segments of the year (hereafter ‘seasonal precipitation’) can explain the variation in yearly ANPP better than total precipitation for some ecosystems (Milchunas et al. 1994, Briggs and Knapp 1995, Jobbágy and
Sala 2000, Knapp et al. 2006, Chou et al. 2008, Muldavin et al. 2008, Xia et al. 2010, La Pierre et al. 2011). Climate models consistently project increased climate variability to include altered seasonal precipitation regimes (IPCC 2007, Schoof et al. 2010), therefore, it is essential to understand how seasonal precipitation affects ANPP across ecosystems. Changes in precipitation during a period when production is most sensitive to water availability may have a dispropor-tionate impact on total annual production and potentially feedback to the global carbon cycle (Schimel et al. 2001).
While climate change is expected to alter precipitation regimes at a global scale, analysis of the effects of changes in seasonal precipitation on ANPP to date has generally been limited to single-system studies (Suttle et al. 2007, but see Vermeire et al. 2009) with no generalization across ecosystem types. Despite its importance, understanding changes in ANPP due to variability in precipitation across ecosystems is problematic because plant communities can differ in sensitivity to precipitation variability (i.e. rain-use efficiency, Huxman et al. 2004). For example, ANPP in desert and grassland ecosystems is highly sensitive to inter-annual rainfall variability but the magnitude of the change is likely limited by plant density. In contrast, solar

728
radiation, nutrient supply, or growing season length may be more important in explaining ANPP in forested eco-systems that are characterized by high soil water content and low precipitation variability (Webb et al. 1978, 1983, Knapp and Smith 2001, Newman et al. 2006).
In addition to ecosystem type, differences in co-occurring plant functional groups within an ecosystem are also likely to interact with changes in the distribution of precipitation to control ANPP (Fay et al. 2002). For example, grasses generally have relatively shallow, fibrous root systems that take advantage of soil moisture at the surface, while shrubs and trees often have deeper or dimorphic root sys-tems that can access both shallow and deep soil moisture (Walter 1979, Ogle and Reynolds 2004). In addition to plant functional groups at the same site using water from different depths along the soil profile (Schenk and Jackson 2002, Nippert and Knapp 2007), previous studies have also shown that they may be using precipitation from dif-ferent parts of the growing season (Jobbágy and Sala 2000, Huenneke et al. 2002, Robertson et al. 2010) as well. It could be conjectured that specific plant functional groups may drive the patterns observed in the seasonal precipitation– ANPP relationship within a particular ecosystem, but play a minimal role in another ecosystem. On the other hand, particular functional group combinations may stabilize overall ANPP responses to precipitation fluctuations by varying in opposite directions. This community level stabil-ity could then mask the impacts of precipitation variability on the relative abundance of functional groups. If such a mechanism exists, then it would be important to under-stand how plant functional group productivity changes with seasonal rainfall distributions across a broad range of ecosystems.
Here we aim to examine:
whether the variability of ANPP is best explained by 1. precipitation amounts in specific seasonal periods as opposed to total annual or total growing season precipita-tion for multiple ecosystem types across North America;whether this sensitivity to precipitation at either the 2. seasonal or annual level can be generalized across all ecosystems or if it varies by ecosystem type; andwhether the effects of seasonal precipitation vary across 3. plant functional groups.
Across ecosystems, we predict that seasonal precipitation will show a stronger correlation with ANPP than total pre-cipitation in arid and semiarid ecosystems (desert and xeric grassland) since water is the most limiting resource in these systems and because production is known to be sensitive and respond rapidly to changes in water availability (Huxman et al. 2004, Yang et al. 2011). We further predict that ANPP will be better predicted by precipitation during the growing season in mesic grassland ecosystems because pre-cipitation inputs in these systems are similar to potential evapotranspiration. This leads to more intermittent periods of water limitation and a greater possibility of water stor-age from previous parts of the growing season. We predict that ANPP in forested ecosystems will correlate best with pre-season precipitation, which recharges deeper soil layers, or not respond to annual or seasonal precipitation at all.
We also predict that sensitivity to seasonal precipitation will vary between plant functional groups. Production of shallow-rooted species (annuals and grasses) may be more sensitive to precipitation during the growing season while deeper rooted species (perennial herbaceous and woody species) will be more sensitive to pre-season precipitation (Notaro et al. 2010).
Methods
Site selection
We chose sites from the Long-Term Ecological Research (LTER) network based on the availability of long-term ( 10 years) annual ANPP records from unmanipulated or minimally manipulated communities. Of the 26 LTER sites, 10 met our criteria and are included in our analysis (Table 1). These sites span a wide range of climatic and vegetation types across North America, from deserts to for-ests (Table 1). We included four additional sites, Capulin Volcano National Monument (CVO), Hopland Field Station (HOP), Teakettle Experimental Forest (TEA), and the US Sheep Experiment Station (USE), in the analysis to represent vegetation types not covered by LTER data meeting our criteria. Because some sites have multiple com-munity types (e.g. grass and shrub dominated communi-ties at the Sevilleta LTER; SEV) or multiple types of ANPP proxy data (e.g. litterfall and tree cores from different sites at Hubbard Brook Experimental Forest; HBR), we included a total of 36 communities in our analysis (Table 1). The locations of all of the included sites are shown in Supplementary material Appendix A1 Fig. A1.
ANPP and precipitation data
ANPP data characterized whole-growing-season produc-tion at all sites, though a variety of methods were employed (see Supplementary material Appendix A1 for specific details on ANPP collection and data processing at each site). In general, forested sites used dendrometers, increment cores and/or litterfall collection to determine ANPP, while herbaceous sites determined ANPP by clipping current-year aboveground biomass within a given area at ground level. However some sites, including Jornada Experimental Range (JRN), SEV and USE, used non-destructive measurements to determine ANPP (Huenneke et al. 2001, Muldavin et al. 2008). A subset of herbaceous-dominated sites sepa-rated biomass by functional type prior to weighing by growth form and/or life history; the communities with this level of data are noted in Table 1. ANPP data were divided by growth form (grass, forb, woody) in 14 communities and in seven of these the data were also divided by life-history (annual, perennial).
Precipitation data were collected daily from weather stations at or near each site (Supplementary material Appendix A1). We calculated total annual precipitation as the sum of all precipitation from the end of one growing season through the end of the next (Fig. 1). We calcu-lated total annual precipitation based on a plant-centric

729
Janu
ary
March
June
Septem
ber
Decem
ber
Octobe
r
Early (p2)Pre (p1) Middle (p3) Late (p4)
Growing season precipitation (pg)
Plant-centric Annual Precipitation (pt)
Dormant (p0)
Calendar Year Annual Precipitation
Biomassharvest
Figure 1. Yearly precipitation may be broken up in a variety of ways. We used a plant-centric definition for annual precipitation based on the growth period for a site and compared that to subdivisions of the year to determine which method better explained variation in aboveground net primary productivity. This is a generic example; growing season start and end dates were determined individually for each study site.
Table 1. Study sites analyzed in this study, arranged from lowest to highest mean annual precipitation (MAP). Due to different methodologies in forested sites, we have not reported average ANPP values. More complete site descriptions are in Supplementary material Appendix A1.
Site
Average ANPP (g m
22)
MAP (mm) CV
Vegetation type
Community types (where multiple)
Growing season (DOY)
Dataset length
Growth form* Lifespan*
Sevilleta National Wildlife Refuge (SEV)
63–99 245 0.22 desert and shrubland
creosote shrubland, black grama grassland
84–278 1999–2008 yes yes
Jornada Experimental Range (JRN)
68–104 269 0.32 desert and shrubland
black grama grassland, mesquite shrubland, creosote shrubland, tarbush shrubland
84–281 1990–2008 no no
Bonanza Creek Experimental Forest (BNZ)
269 0.17 forest floodplain (early and late succ.) upland (early and late succ.)
115–267 1994–2008 no no
US Sheep Experiment Station (USE)
92 280 0.18 shrubland n/a 84–217 1936–1954 no no
Shortgrass Steppe LTER (SGS)
13–26 353 0.20 grassland ridgetop, midland, swale 96–217 1983–2006 yes yes
Capulin Volcano National Monument (CVO)
442 0.20 shrubland 105–287 1951–1991 no no
Konza Prairie Biological Station (KNZ)
332–567 807 0.24 grassland uplands and lowlands in annual, 4-yr, and 20-yr burn regimes
85–278 1984–2008 yes no
Cedar Creek Ecosystem Science Reserve (CDR)
191–417 815 0.20 grassland n/a 115–288 1982–2006 yes yes
Kellogg Biological Station (KBS)
416–599 855 0.25 grassland early and mid successional
85–248 1990–2008 yes yes
Hopland Field Station (HOP)
230 908 0.23 grassland n/a 288–156 1952–1966 no no
Teakettle Experimental Forest (TEA)
1113 0.47 forest n/a 105–287 1997–2008 no no
Harvard Forest (HFR) 1119 0.16 forest hemlock, hardwood, mixed
115–267 1965–2007 no no
Hubbard Brook Experimental Forest (HBR)
1448 0.13 forest northern hardwood (1 area with cores, 1 with litter)
115–267 1956–2005 no no
Coweeta Experimental Forest (CWT)
1619 0.19 forest oak-pine, cove hardwoods, mixed oak lowland, mixed oak highland, northern hardwoods
115–297 1999–2008 no no
*Functional groups.
precipitation year rather than the calendar year, excluding months that could not influence measured ANPP (i.e. pre-cipitation received after biomass collection). For example, in ecosystems with a spring–summer growing season and late September harvest, this would lead to plant-centric total ‘annual’ precipitation being summed from October of one year until September of the next year as opposed to January
to December (Fig. 1). We determined the start and end of the growing season for each site based on a review of the literature or personal communication with principal investigators at the site (Table 1). We added ten days to the beginning and end of the growing season as a buf-fer against yearly variation in timing of emergence and senescence.

730
only, while five additional models included the interactions between consecutive seasonal periods. We only included combinations of sequential seasonal periods in these models, as we considered these periods to be the ones most likely to interact to influence ANPP. We did not include interactions between precipitation during the dormant period and any other season in the models, as we thought this interaction would be less likely to influence ANPP. Models did not include all combinations of seasonal precipitation variables or interactions in order to limit the identification of spurious correlations.
We compared all models using AICc, with the lowest value indicating the model that had the greatest support (Burnham and Anderson 2002). We considered models within two AICc points of each other to have equal empiri-cal support (Burnham and Anderson 2002) and in these cases we report all tied models. We then examined the best models for statistical support and biological relevance. Models were considered to be statistically supported when they had a p 0.05 and biologically relevant when they had an adjusted R2 0.30. We used adjusted R2 to evaluate the explanatory power of our models because our models var-ied in the number variables. If the model(s) with the lowest AICc value for each community was statistically supported and biologically relevant, we report it as the best model for that community. We conducted these analyses for all communities on total ANPP data and in the subset of com-munities that had functional group data we ran the same analyses on functional group production. We ran all statis-tics in R 2.10.1 (R Foundation for Statistical Computing) using the packages lme4, qPCR, minpack.lm, and rgl.
Results
ANPP response to seasonal and annual precipitation
Breaking annual precipitation into five periods led to models with greater support from the data across all of the sites than simply using total annual precipitation (ΔAICc 8), despite the penalty that AICc imposes for
We then sub-divided the plant-centric annual precipita-tion data into five periods for each site based on the site’s growing season. First, we took the growing season for each site and split it into three equal parts (Fig. 1): an early growing season period (P2), a mid-growing season period (P3), and a late growing season period (P4). We defined the period immediately before the growing season as the ‘pre-season’ (P1, Fig. 1) that we hypothesized might affect emergence and initial plant growth due to recharging soil moisture immediately preceding the growing season. The length of this period was 1/3 of the growing season length, the same length as the individual components (early, mid and late) of the growing season. The rest of the year was aggregated into a dormant period (P0, Fig. 1), to account for water storage since the end of the previous growing season. In addition to the three subdivisions of the grow-ing season, we also used total growing season precipitation (Pg, Fig. 1) calculated as the sum of all precipitation dur-ing the early, middle, and late part of the growing season (P2–P4).
Model development and analysis
First we examined whether breaking annual precipita-tion into five distinct periods improved the fit of linear regression models relating precipitation to ANPP across communities in all of our sites. We used Akaike informa-tion criterion corrected for small sample sizes, AICc, to compare a model with all five periods to a model using only total precipitation, treating community as a random effect. While this allowed us to generalize across all com-munities, we also wanted to examine specific combination of seasonal periods with the idea that communities in differ-ent ecosystems might respond differently. We developed 17 biologically relevant models (Table 2) to determine the extent to which ANPP in different ecosystems correlated with annual precipitation, total growing season precipitation, or precipitation during individual or consecutive seasonal periods and their interactions. Twelve of the models included either total annual precipitation, growing season precipi-tation, or combinations of seasonal precipitation variables
Table 2. List of statistical models.
No. Model Description
1 ANPP p1 pre-season only2 ANPP p2 early growing season only3 ANPP p3 mid-growing season only4 ANPP p4 late growing season only5 ANPP p2 p3 early and mid-growing season5a ANPP p2 p3 p2*p3 early and mid-growing season, plus interaction6 ANPP p3 p4 mid- and late growing season6a ANPP p3 p4 p3*p4 mid- and late growing season, plus interaction7 ANPP p1 p2 pre-season and early growing season7a ANPP p1 p2 p1*p2 pre-season and early growing season, plus interaction8 ANPP p0 dormant season only9 ANPP p2 p3 p4 all three segments of the growing season9a ANPP p2 p3 p4 p2*p3 p3*p4 all three segments of the growing season, plus interactions
10 ANPP p0 p1 p2 p3 p4 all five segments of the year10a ANPP p0 p1 p2 p3 p4 p1*p2 p2*p3 p3*p4 all five segments of the year, plus interactions11 ANPP pt total yearly precipitation12 ANPP pg total growing season precipitation

731
extra variables. When we analyzed each community indi-vidually using our subset of 17 hypothesized models, we found that 21 of the 36 communities were statistically supported by models that explained annual variance in ANPP (see Table A1 for model results). In agreement with our general analysis, models that included some combination of seasonal variables generally outperformed models that only included annual precipitation (Fig. 2). Total annual precipitation alone (model 11) was the sin-gle best model in only three communities (JRN black grama grassland; SEV creosote shrubland; USE) although it was tied for best model in six additional communities (KNZ annually burned upland; KNZ annually burned lowland; KNZ upland burned every four years; SGS ridge,
Best model type
Num
ber o
f com
mun
ities
0
4
8
12
Annual Seasonal Tied
Figure 2. The distribution of best models for the communities by model type. Models within 2 AICc points of each other were considered ‘tied’.
Figure 3. Breakdown of the significant (p 0.1) results across the different periods of precipitation tested in the models for (a) total ecosystem ANPP, and where data were available, (b) annual, (c) perennial, (d) grass, (e) forb, (f ) woody plant functional groups individually, at sites where such data were available (Table 1). The value on the y-axis is the number of models where a particular period was significant in the best model. Positive values indicate that the relationship between precipitation and ANPP was positive; negative values indicate that the relationship is negative.

732
worth noting that total annual precipitation and total grow-ing season precipitation (models 11 and 12) were never the ‘best’ model in any forested system.
To assess the utility of seasonal precipitation data in predicting annual ANPP across all 36 communities, we compared the adjusted R2 of the best seasonal model from each community to the R2 of model 11, which included only total annual precipitation (Fig. 4). In all but four communities examined (JRN black grama grassland, SEV creosote shrubland, SGS midland, USE) the seasonal model explained more variance than annual precipitation. In 19 of the communities, the improvement in adjusted R2 in the seasonal model over model 11 was greater than 0.10, and in 10 of the communities the improvement was greater than 0.20 (Fig. 4). Communities showing this greatest level of improvement when seasonal data were used to predict ANPP were found at BNZ (all), CVO, HOP, KBS (annually burned), KNZ (uplands and lowlands burned every 20 years), and SEV (black grama grassland). Across all sites, improvement in adjusted R2 did not correlate significantly with either the mean or the coefficient of variation (CV) of total annual precipitation (Fig. 5).
Functional group responses to seasonal and annual precipitation
In the seven communities where annual and perennial biomass were examined separately, production by annu-als tended to be better explained by seasonal precipitation (four of five communities with significant models; Fig. 3, 6), while production by perennials responded more to total annual precipitation (three of four communities with significant models; Fig. 3, 6). In about half of the 14 communities with growth form data, precipitation and ANPP variation were correlated for grasses and forbs, but not for woody species. Grass production was correlated roughly equally with seasonal (three communities) and total annual precipitation (four communities; Fig. 3, 6) while forb production tended to be correlated with seasonal precipitation (four out of six communities where pre-cipitation was significant). Precipitation models were only
midland, and swale; Fig. 2). The annual and seasonal ties along with ties between multiple seasonal models led to a total of 30 statistically supported models across the 21 communities.
Across all models, the impact of precipitation on ANPP was overwhelmingly positive (52 of 55 significant effects; Fig. 3). The best seasonal models often included more than one period (70% of seasonal models) and across the 30 best statistically supported models, the most com-mon term included was mid-growing season precipitation (P3; significant in 47% of the best models), followed by early and late growing season precipitation (P2 and P4; significant in 38% and 32% of the best models, respec-tively, Fig. 3). Interactions were included in only 3 of the best models, and where significant they were always negative (Supplementary material Appendix A1 Table A1). The seasonal periods that significantly affected ANPP were not consistent across ecosystem type (Fig. 3), though it is
Figure 4. Comparison of the performance of the best seasonal model with a model that uses only total annual precipitation to predict ANPP. The dashed line indicates a 1:1 relationship (null hypothesis), above which ANPP is better predicted by sea-sonal precipitation and below which ANPP is better predicted by total annual precipitation.
Figure 5. Improvement across all communities of the best seasonal model over the model including only total annual precipitation in predicting ANPP versus (a) mean annual precipitation and (b) the CV of annual precipitation. ANPP in communities with positive improvement values are better predicted by seasonal precipitation while ANPP in communities with negative improvement values are better predicted by total annual precipitation.

733
Figure 6. Comparison of the performance of the best seasonal model with a model that uses only total annual (plant-centric) precipitation to predict total-above ground biomass of (a) grasses, (b) forbs, (c) woody, (d) annual, and (e) perennial plants at sites where such data were available (Table 1). The dashed line indicates a 1:1 relationship, above which biomass is better predicted by seasonal precipitation and below which biomass is better predicted by total annual precipitation.
related to woody shrub production in two communi-ties, with one seasonal and one total annual precipitation model (Fig. 3, 6). Interestingly, the same model (model 11) best explained all three functional groups in only one com-munity (USE).
Discussion
Across the majority of our ecosystems, which ranged from deserts to forests, we found that seasonal precipitation described variation in ANPP as well or better than total
precipitation. Our results go beyond previous site-specific work (Suttle et al. 2007) to demonstrate the generality and strength of the effects of variation in precipitation at sub-annual time scales on annual ANPP in a wide array of ecosystems.
ANPP is more sensitive to seasonal precipitation than annual precipitation
The majority of the best seasonal models showed that ANPP correlated significantly with only one or two periods of the
734
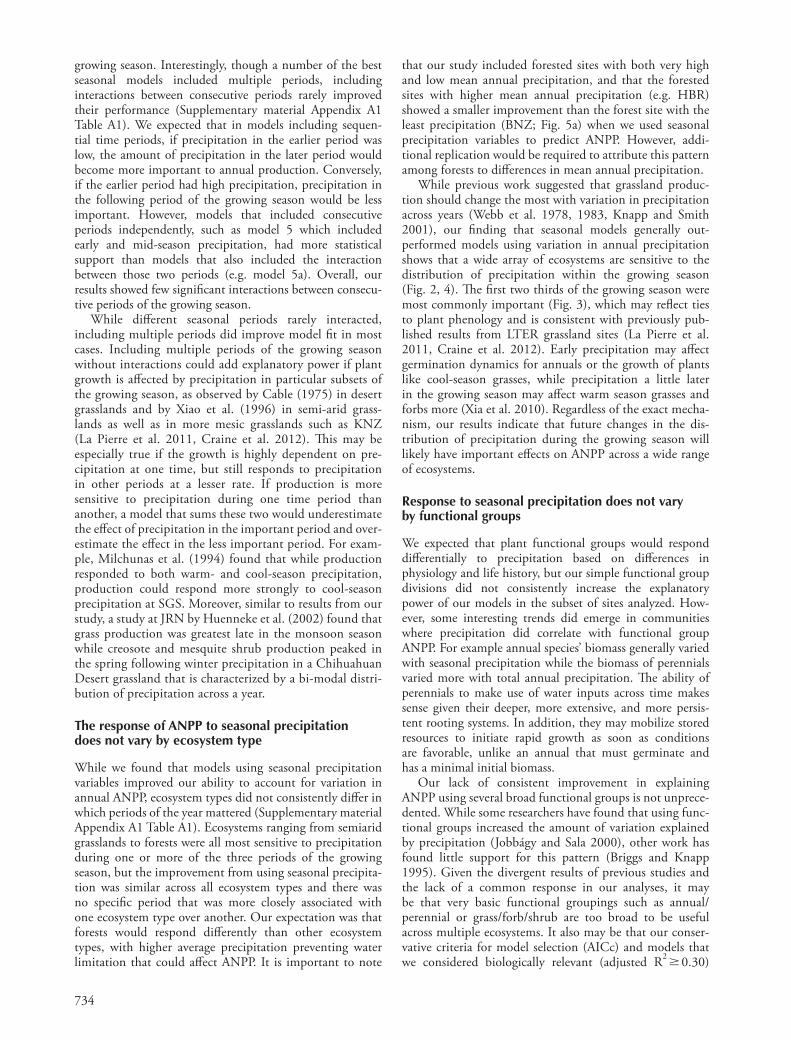
that our study included forested sites with both very high and low mean annual precipitation, and that the forested sites with higher mean annual precipitation (e.g. HBR) showed a smaller improvement than the forest site with the least precipitation (BNZ; Fig. 5a) when we used seasonal precipitation variables to predict ANPP. However, addi-tional replication would be required to attribute this pattern among forests to differences in mean annual precipitation.
While previous work suggested that grassland produc-tion should change the most with variation in precipitation across years (Webb et al. 1978, 1983, Knapp and Smith 2001), our finding that seasonal models generally out-performed models using variation in annual precipitation shows that a wide array of ecosystems are sensitive to the distribution of precipitation within the growing season (Fig. 2, 4). The first two thirds of the growing season were most commonly important (Fig. 3), which may reflect ties to plant phenology and is consistent with previously pub-lished results from LTER grassland sites (La Pierre et al. 2011, Craine et al. 2012). Early precipitation may affect germination dynamics for annuals or the growth of plants like cool-season grasses, while precipitation a little later in the growing season may affect warm season grasses and forbs more (Xia et al. 2010). Regardless of the exact mecha-nism, our results indicate that future changes in the dis-tribution of precipitation during the growing season will likely have important effects on ANPP across a wide range of ecosystems.
Response to seasonal precipitation does not vary by functional groups
We expected that plant functional groups would respond differentially to precipitation based on differences in physiology and life history, but our simple functional group divisions did not consistently increase the explanatory power of our models in the subset of sites analyzed. How-ever, some interesting trends did emerge in communities where precipitation did correlate with functional group ANPP. For example annual species’ biomass generally varied with seasonal precipitation while the biomass of perennials varied more with total annual precipitation. The ability of perennials to make use of water inputs across time makes sense given their deeper, more extensive, and more persis-tent rooting systems. In addition, they may mobilize stored resources to initiate rapid growth as soon as conditions are favorable, unlike an annual that must germinate and has a minimal initial biomass.
Our lack of consistent improvement in explaining ANPP using several broad functional groups is not unprece-dented. While some researchers have found that using func-tional groups increased the amount of variation explained by precipitation (Jobbágy and Sala 2000), other work has found little support for this pattern (Briggs and Knapp 1995). Given the divergent results of previous studies and the lack of a common response in our analyses, it may be that very basic functional groupings such as annual/perennial or grass/forb/shrub are too broad to be useful across multiple ecosystems. It also may be that our conser-vative criteria for model selection (AICc) and models that we considered biologically relevant (adjusted R2 0.30)
growing season. Interestingly, though a number of the best seasonal models included multiple periods, including interactions between consecutive periods rarely improved their performance (Supplementary material Appendix A1 Table A1). We expected that in models including sequen-tial time periods, if precipitation in the earlier period was low, the amount of precipitation in the later period would become more important to annual production. Conversely, if the earlier period had high precipitation, precipitation in the following period of the growing season would be less important. However, models that included consecutive periods independently, such as model 5 which included early and mid-season precipitation, had more statistical support than models that also included the interaction between those two periods (e.g. model 5a). Overall, our results showed few significant interactions between consecu-tive periods of the growing season.
While different seasonal periods rarely interacted, including multiple periods did improve model fit in most cases. Including multiple periods of the growing season without interactions could add explanatory power if plant growth is affected by precipitation in particular subsets of the growing season, as observed by Cable (1975) in desert grasslands and by Xiao et al. (1996) in semi-arid grass-lands as well as in more mesic grasslands such as KNZ (La Pierre et al. 2011, Craine et al. 2012). This may be especially true if the growth is highly dependent on pre-cipitation at one time, but still responds to precipitation in other periods at a lesser rate. If production is more sensitive to precipitation during one time period than another, a model that sums these two would underestimate the effect of precipitation in the important period and over-estimate the effect in the less important period. For exam-ple, Milchunas et al. (1994) found that while production responded to both warm- and cool-season precipitation, production could respond more strongly to cool-season precipitation at SGS. Moreover, similar to results from our study, a study at JRN by Huenneke et al. (2002) found that grass production was greatest late in the monsoon season while creosote and mesquite shrub production peaked in the spring following winter precipitation in a Chihuahuan Desert grassland that is characterized by a bi-modal distri-bution of precipitation across a year.
The response of ANPP to seasonal precipitation does not vary by ecosystem type
While we found that models using seasonal precipitation variables improved our ability to account for variation in annual ANPP, ecosystem types did not consistently differ in which periods of the year mattered (Supplementary material Appendix A1 Table A1). Ecosystems ranging from semiarid grasslands to forests were all most sensitive to precipitation during one or more of the three periods of the growing season, but the improvement from using seasonal precipita-tion was similar across all ecosystem types and there was no specific period that was more closely associated with one ecosystem type over another. Our expectation was that forests would respond differently than other ecosystem types, with higher average precipitation preventing water limitation that could affect ANPP. It is important to note

735
causes certain ecosystems to be sensitive to one part of the growing season compared to another? Potential explana-tions include interactions with both abiotic (i.e. nutrients and temperature) and biotic (i.e. herbivory and competition) factors that may limit production.
Our results were often congruent with previous site- specific studies, yet there were also some important discrep-ancies that show the importance of site-specific research. For example, at our annual grassland site (HOP), we found no relationship between ANPP and precipitation, yet previous research at the site found strong precipitation effects (Murphy 1970). However, the relationship revolved around precipitation in only one month (November) so it is likely that the length of our growing season periods were too long to recreate these results. For that site our gener-alized approach fell short. In other instances, our results generally matched previous results, for example like Milchunas et al. (1994) at SGS we found that precipita-tion mattered, but did not always find the strong support they did for separating cool and warm season precipitation (Supplementary material Appendix A1 Table A1). How-ever, in the most supported seasonal models the earlier cool season regression coefficients were generally larger than the later warm season coefficients, consistent with Milchunas et al.’s (1994) finding that cool season precipi-tation had a larger impact on ANPP than warm season precipitation. At JRN, our results and previous research both found a relationship between ANPP and precipitation (Huenneke et al. 2002) across multiple communities. However, while we found evidence that shrub com-munities responded to seasonal precipitation (Fig. 4, 5, Supplementary material Appendix A1 Table A1), we did not find the strong early season signal that Huenneke et al. (2002) did. One reason for this discrepancy may be that we used annual ANPP measurements while Huenneke et al. (2002) measured production at three points during the year to quantify seasonal production. Overall, while site-specific studies often captured a more nuanced picture of the patterns at a given site, our sim-plified analysis was able to capture a reasonably accurate picture across a broad range of ecosystems.
Although precipitation provides a convenient and widely available metric, the effect of a precipitation event on a plant community depends on a number of abiotic and biotic factors that affect how precipitation translates into plant-available soil moisture (Weltzin et al. 2003, Schwinning and Sala 2004). For example, differences in soil texture and structure (Sala et al. 1988, Loik et al. 2004), plant litter (Deutsch et al. 2010), or antecedent soil moisture conditions (Rawls et al. 1993) will influence the changes in soil moisture that result from a precipita-tion event. While beyond the scope of this study, research also indicates that landscape position (run-on/off) and soil properties may be a more important driver of ANPP in ecosystems like deserts than precipitation alone (Huenneke et al. 2002, Muldavin et al. 2008, Sponseller et al. 2012). While not as commonly available as long-term time series, soil moisture data can relate more directly to plant growth and help explain patterns in ANPP (Nippert et al. 2006, Muldavin et al. 2008). Differences in ANPP measurement methodology among sites and ecosystem types may obscure
also limited our results. Other studies focused on specific ecosystems could use less conservative metrics when analyz-ing one system, as compared to our multi-site analysis, or use more appropriate functional groups. For example, an analysis using cool (C3) and warm (C4) season grasses, which have been shown to use different soil moisture pools at KNZ (Nippert and Knapp 2007), may have more success explain-ing the sensitivity of grassland ANPP to multiple parts of the growing season. It is also possible that functional-group data will need to be combined with information on community characteristics such as dominant species when functional groups do not respond consistently. System-specific knowledge about species interactions like nurse plants and other forms of facilitation may become more important as these interactions may allow for produc-tion by species that might not otherwise survive (i.e. Armas et al. 2011), thereby mediating responses to precipitation variability.
Conclusions
Here we used a simple method to partition precipitation throughout the year into five periods across a range of climate and ecosystem types. With this coarse metric and a broad definition of growing season length, our analyses show that including seasonal variation in future work exam-ining the effects of precipitation variability may improve ANPP predictions. The summing of precipitation over both ecologically important and unimportant parts of the growing season in analyses using annual precipitation may partially explain why previous studies found a weaker rela-tionship between inter-annual variation in precipitation and ANPP (Smoliak 1986, Briggs and Knapp 1995) than across spatial gradients in precipitation (Sala et al. 1988, Lauenroth and Sala 1992). Analyses that take advantage of specific system knowledge may allow investigators to deter-mine more subtle patterns within a site, for example by tying the definition of the growing season more tightly to environmental factors. Examples could include temperature and moisture in arid areas, growing degree-days in colder ecosystems, or the timing of specific phenological stages (Richardson et al. 2010, La Pierre et al. 2011), which may respond differently to precipitation (Robinson and Gross 2010). Lagged effects of the previous year’s weather condi-tions may also be important in some systems (Lane et al. 1993), though we did not have the statistical power to test such effects. Such site-specific analyses could also test specific combinations of periods not considered here that might be relevant for a particular system, for example using only two periods in a system with bi-modal precipita-tion patterns. Overall, using site-specific biological know-ledge is likely to provide more distinctive and meaningful seasonal periods, but even a coarse definition that allows comparisons across a range of very different ecosystems can improve our understanding of variation in ANPP.
While we have shown that ANPP responds to precipi-tation on a seasonal scale more commonly than previously thought, our results raise several questions. What separates ecosystems that show a weak correlation between ANPP and seasonal precipitation from those that show a strong correlation with seasonal precipitation? Additionally, what

736
ecosystems. Many studies relating ANPP and precipitation examine how precipitation affects ANPP on an annual time-scale, but there is a growing body of site-specific studies that find a stronger relationship with seasonal precipitation (Lauenroth and Sala 1992, Milchunas et al. 1994, Briggs and Knapp 1995, Jobbágy and Sala 2000, Knapp et al. 2006, Chou et al. 2008, Muldavin et al. 2008). However, we lack a cross-ecosystem understanding of the relation-ship between seasonal precipitation and ANPP. Our work examining long-term data sets across a variety of ecosys-tems in North America indicates that seasonal precipita-tion patterns often play an important role in determining ANPP. Indeed, most of the ecosystems in our study were more responsive to precipitation during specific portions of the growing season than to annual or growing season totals. While the 2007 IPCC reports project increased NPP across North America due to predictions of longer growing seasons, our findings indicate that understanding this relationship may require further work. If changes in temperature are not accompanied by precipitation at the appropriate time, ANPP may not follow the anticipated trend. Incorporating a more thorough understanding of how seasonal precipitation patterns affect ANPP is necessary to advance our understanding of ANPP dynamics and improve predictions of how climate change will affect ANPP.
Acknowledgements – This work was supported by a LTER network synthesis grant. The authors thank Scott Collins and William Lauenroth for comments on previous drafts of this manuscript and Steven Rostkowski for his input in project design and assis-tance with data processing. The authors would also acknowledge the following NSF LTER sites for providing data: BNZ, CDR, CWT, HBR, HFR, JRN (in particular J. Yao), KBS, KNZ SEV, SGS. CVO data are archived by NOAA paleoclimatology program, and the TEA data were provided by Malcolm North at the US Forest Service PSW Research Station. Converted data from Murphy, 1970 for HOP came from Joanna Hsu at UC Berkeley, and Dr. Peter Alder (Utah State Univ.) provided us with converted data from Blaisdell 1958 for USE. This is KBS contribution number 1699.
References
Armas, C. et al. 2011. A field test of the stress-gradient hypothesis along an aridity gradient. – J. Veg. Sci. 22: 818–827.
Baker, B. B. et al. 1993. The potential effects of climate-change on ecosystem processes and cattle production on US rangelands. – Climate Change 25: 97–117.
Barger, N. N. et al. 2011. Woody plant proliferation in North American drylands: a synthesis of impacts on ecosystem carbon balance. – J. Geophys. Res. 116, G00K07, doi: 10.1029/2010JG001506.
Briggs, J. M. and Knapp, A. K. 1995. Interannual variability in primary production in tallgrass prairie: climate, soil moisture, topographic position, and fire as determinants of aboveground biomass. – Am. J. Bot. 82: 1024–1030.
Burnham, K. P. and Anderson, D. R. 2002. Model selection and multi-model inference, 2nd edn. – Springer.
Cable, D. R. 1975. Influence of precipitation on perennial grass production in the semidesert southwest. – Ecology 56: 981–986.
Chou, W. W. et al. 2008. The sensitivity of annual grassland carbon cycling to the quantity and timing of rainfall. – Global Change Biol. 14: 1382–1394.
some patterns, particularly in the forest and woodland sites where data sets describing woody biomass and foliar production were not both available (CVO, CWT, TEA) or could not be combined (HBR, HFR). While our study focused on aboveground biomass responses, future work should also attempt to account for belowground responses to precipitation such as root production, and soil respiration (Hui and Jackson 2006, Fay et al. 2008, Thomey et al. 2011) as more long-term data becomes available. Predicted shifts in storm intensity and fre-quency (Easterling et al. 2000, Diffenbaugh et al. 2005, IPCC 2007) which may independently affect communi-ties (Knapp et al. 2008, Robinson and Gross 2010) will make it more important than ever to factor in how abiotic and biotic factors affect the transition from precipitation to plant-available soil moisture.
The results of our study have implications for predic-tions of future ANPP under a changing climate. One of the primary shifts in climate predicted by the Intergovernmen-tal Panel on Climate Change is that higher temperatures will lead to an overall increase in growing season length across North America (IPCC 2007). Our results show that many ecosystem types are sensitive to the timing of precipi-tation with respect to their growing seasons. If changes in growing season length are not accompanied by a shift in the timing of precipitation, the result may be large changes in production. For example, Ma et al. (2008) showed how temperature and precipitation interacted in a Mongolian grassland by observing higher mean annual biomass when both temperature and pre-season precipitation were higher, but lower mean annual biomass when temperature alone was higher. Likewise, Xia and Wan (2012) found that while increased nighttime temperature resulted in longer grow-ing season length, it was actually changes in accumulated precipitation that explained a large portion (48%) of the variation in changes in species percent coverage. The overall warming predicted for North America may make the sea-sonal interactions seen in our data even more important in determining production in the future.
Based on our analyses, one ecosystem that might be affected would be the eastern deciduous forest if summers in North America become longer and drier (IPCC 2007). The two temperate forest sites with significant models (Coweeta and Harvard Forest) showed the greatest sensi-tivity to precipitation received in the middle of their grow-ing season, when evapotranspirative demand is generally greatest and precipitation is predicted to decrease. Even though mean annual precipitation is predicted to increase for most of North America, greater variability and uncer-tainty about the timing of these future events makes the net effect of increased precipitation on production uncer-tain. In addition, it is unclear how seasonal precipitation may interact with concurrent anthropogenic changes to the environment such as nitrogen deposition, increased ambient CO2 and O3, non-native species invasions, and disturbance regimes (Barger et al. 2011, Vargas et al. 2012). Further research to determine how changes in seasonal precipitation interact with chronic resource alteration and more variable weather would be worthwhile.
Quantifying and predicting ANPP is crucial for our understanding of the carbon cycle and the management of

737
temperate regions: North America. – Climate Change 70: 137–164.
Muldavin, E. H. et al. 2008. Aboveground net primary produc-tion dynamics in a northern Chihuahuan Desert ecosystem. – Oecologia 155: 123–132.
Murphy, A. H. 1970. Predicted forage yield based on fall preci-pi tation in California annual grasslands. – J. Range Manage. 23: 363–365.
Newman, G. S. et al. 2006. Above- and belowground net primary production in a temperate mixed deciduous forest. – Ecosystems 9: 317–329.
Nippert, J. B. and Knapp, A. K. 2007. Linking water uptake with rooting patterns in grassland species. – Oecologia 153: 261–272.
Nippert, J. B. et al. 2006. Intra-annual rainfall variability and grassland productivity: can the past predict the future? – Plant Ecol. 184: 65–74.
Notaro, M. et al. 2010. Complex seasonal cycle of ecohydrology in the southwest United States. – J. Geophys. Res. Biogeosci. 115 doi:10.1029/2010JC006261.
Ogle, K. and Reynolds, J. F. 2004. Plant responses to precipitation in desert ecosystems: integrating functional types, pulses, thresholds and delays. – Oecologia 141: 282–294.
Rawls, W. J. et al. 1993. Infiltration and water movement. – In: Maidment, D. R. (ed.), Handbook of hydrology. McGraw-Hill, pp. 1–51.
Richardson, A. D. et al. 2010. Influence of spring and autumn phonological transitions on forest ecosystem productivity. – Phil. Trans. R. Soc. B 365: 3227–3246.
Robertson, T. et al. 2010. Precipitation magnitude and timing differ-entially affect species richness and plant density in the sotol grass-land of the Chihuahuan Desert. – Oecologia 162: 185–197.
Robinson, T. M. P. and Gross, K. L. 2010. The impact of altered precipitation variability on annual weed species. – Am. J. Bot. 97: 1–5.
Rosenzweig, M. 1968. Net primary productivity of terrestrial communities - prediction from climatological data. – Am. Nat. 102: 67–74.
Sala, O. E. and Austin, A. T. 2000. Methods of estimating aboveground net primary production. – In: Sala, O. E. et al. (eds), Methods in ecosystem science. Springer, pp. 31–43.
Sala, O. E. et al. 1988. Primary production of the central grassland region of the USA. – Ecology 69: 40–45.
Schenk, H. J. and Jackson, R. B. 2002. Rooting depths, lateral root spreads and below-ground/above-ground allometries of plants in water-limited ecosystems. – J. Ecol. 90: 480–494.
Schimel, D. S. et al. 2001. Recent patterns and mechanisms of carbon exchange by terrestrial ecosystems. – Nature 414: 169–172.
Schoof, J. T. et al. 2010. Development of daily precipitation projections for the United States based on probabilistic down-scaling. – J. Geophys. Res. Atmospheres 115 D13106, doi:10.1029/2009JD013030.
Schwinning, S. and Sala, O. E. 2004. Hierarchy of responses to resource pulses in and and semi-arid ecosystems. – Oecologia 141: 211–220.
Smoliak, S. 1986. Influence of climatic conditions on production of Stipa bouteloua prairie over a 50-year period. – J. Range Manage. 39: 100–103.
Sponseller, R. A. et al. 2012. Variation in monsoon precipitation drives spatial and temporal patterns of Larrea tridentata growth in the Sonoran Desert. – Funct. Ecol. 26: 750–758.
Suttle, K. B. et al. 2007. Species interactions reverse grassland responses to changing climate. – Science 315: 640–642.
Thomey, M. L. et al. 2011. Effect of precipitation variability on net primary production and soil respiration in a Chihuahuan Desert grassland. – Global Change Biol. 17: 1505–1515.
Vargas, R. et al. 2012. Precipitation variability and fire influence the temporal dynamics of soil CO2 efflux in an arid grassland. – Global Change Biol. 18: 1401–1411.
Craine, J. M. et al. 2012. Precipitation timing and grazer perform-ance in a tallgrass prairie. – Oikos. 122: 191–198.
Deutsch, E. S. et al. 2010. Separation of grassland litter and ecosite influences on seasonal soil moisture and plant growth dynamics. – Plant Ecol. 209: 135–145.
Diffenbaugh, N. S. et al. 2005. Fine-scale processes regulate the response of extreme events to global climate change. – Proc. Natl Acad. Sci. USA 102: 5774–15778.
Easterling, D. R. et al. 2000. Climate extremes: observations, modeling and impacts. – Science 289: 2068–2074.
Fay, P. A. et al. 2002. Altered rainfall patterns, gas exchange, and growth in grasses and forbs. – Int. J. Plant Sci. 163: 549–557.
Fay, P. A. et al. 2008. Changes in grassland ecosystem function due to extreme rainfall events: implications for responses to climate change. – Global Change Biol. 14: 1600–1608.
Heisler-White, J. L. et al. 2009. Contingent productivity responses to more extreme rainfall regimes across a grassland biome. – Global Change Biol. 15: 2894–2904.
Huenneke, L. F. et al. 2001. Spatial heterogeneity in Chihuahuan Desert vegetation: implications for sampling methods in semi-arid ecosystems. – J. Arid Environ. 47: 257–270.
Huenneke, L. F. et al. 2002. Desertification alters patterns of aboveground net primary production in Chihuahuan ecosys-tems. – Global Change Biol. 8: 247–264.
Hui, D. and Jackson, R. B. 2006. Geographical and interannual variability I biomass partitioning in grassland ecosystems: a synthesis of field data. – New Phytol. 169: 85–93.
Huxman, T. E. et al. 2004. Convergence across biomes to a common rain-use efficiency. – Nature 429: 651–654.
IPCC 2007. Climate change 2007: the physical science basis. Summary for policymakers. – Cambridge Univ. Press.
Jobbágy, E. G. and Sala, O. E. 2000. Controls of grass and shrub aboveground production in the Patagonian steppe. – Ecol. Appl. 10: 541–549.
Knapp, A. K. and Smith, M. D. 2001. Variation among biomes in temporal dynamics of aboveground primary production. – Science 291: 481–484.
Knapp, A. K. et al. 2006. Convergence and contingency in production-precipitation relationships in North American and south african C-4 grasslands. – Oecologia 149: 456–464.
Knapp, A. K. et al. 2008. Consequences of more extreme precipi-tation regimes for terrestrial ecosystems. – BioScience 58: 811–821.
La Pierre, K. J. et al. 2011. Explaining temporal variation in above-ground productivity in a mesic grassland: the role of climate and flowering. – J. Ecol. 99: 1250–1262.
Lane, C. J. et al. 1993. Width of sugar maple (Acer saccharum) tree rings as affected by climate. – Can. J. For. Res. 23: 2370–2375.
Lauenroth, W. K. and Sala, O. E. 1992. Long-term forage produc-tion of North American shortgrass steppe. – Ecol. Appl. 2: 397–403.
Leith, H. and Whittaker, R. J. (eds) 1975. Primary productivity of the biosphere. – Springer.
Loik, M. E. et al. 2004. A multi-scale perspective of water pulses in dryland ecosystems: climatology and ecohydrology of the western USA. – Oecologia 141: 269–281.
Ma, W. H. et al. 2008. Above- and belowground biomass in relation to environmental factors in temperate grasslands, Inner Mongolia. – Sci. China Ser. C Life Sci. 51: 263–270.
McNaughton, S. J. et al. 1989. Ecosystem-level patterns of primary productivity and herbivory in terrestrial habitats. – Nature 341: 142–144.
Milchunas, D. G. et al. 1994. Productivity of long-term grazing treatments in response to seasonal precipitation. – J. Range Manage. 47: 133–139.
Motha, R. P. and Baier, W. 2005. Impacts of present and future climate change and climate variability on agriculture in the

738
Xia, J. and Wan, S. 2012. The effects of warming-shifted plant phenology on ecosystem carbon exchange are regulated by precipitation in a semi-arid grassland. – PLoS One 7(2): e32088.
Xia, Y. et al. 2010. Aboveground production and species richness of annuals in Chihuahuan Desert grassland and shrubland plant communities. – J. Arid Environ. 74: 378–385.
Xiao, X. M. et al. 1996. Temporal variation in aboveground biomass of Leymus chinense steppe from species to commu-nity levels in the Xilin River basin, Inner Mongolia, China. – Vegetatio 123: 1–12.
Yang, H. J. et al. 2011. Community structure and composition in response to climate change in a temperate steppe. – Global Change Biol. 17: 452–465.
Vermeire, L. T. et al. 2009. Primary productivity and precipitation-use efficiency in mixed-grass prairie: a comparison of northern and southern US Sites. – Rangeland Ecol. Manage. 62: 230–239.
Walter, H. 1979. Vegetation of the Earth. – Springer.Webb, W. L. et al. 1978. Primary productivity and water-use
in native forest, grassland and desert ecosystems. – Ecology 59: 1239–1247.
Webb, W. L. et al. 1983. Primary production and abiotic controls in forests, grasslands and desert ecosystems in the United States. – Ecology 64: 134–151.
Weltzin, J. F. et al. 2003. Assessing the response of terrestrial ecosystems to potential changes in precipitation. – BioScience 53: 941–952.
Supplementary material (available as Appendix O20655 www.oikosoffice.lu.se/appendix . ). Appendix A1.

Oikos o20655
Robinson, T. M. P., La Pierre, K. J., Vadeboncoeur,
M. A., Byrne, K. M., Thomey, M. L. and Colby, S.
E. 2013. Seasonal, not annual precipitation drives
community productivity across ecosystems. – Oikos
122: 727–738.
Appendix A1
Site-specific details on data collection
Bonanza Creek Experimental Forest (BNZ)
The Bonanza Creek Experimental Forest is a boreal forest study site in the Alaskan interior. The
area is dominated by Picea glauca and Populus balsamifera. Two study communities each were
located on floodplain (150 m a.s.l.) and upland (300 m a.s.l) locations. Daily precipitation data
were collected from a meteorological station located at the Fairbanks Airport (20 km from the
study site). We defined the growing season as 25 May – 24 September
(<www.lter.uaf.edu/bnz_climate.cfm>). Each of the four communities was sampled in three
plots. Annual readings from ten dendrometer bands per species per 10-cm diameter class and plot
inventory data were used to determine annual biomass increment from 1994–2008. ANPP data
were from the following data set:
Ruess, R. 2009. Alaska paper birch NPP per tree calculated from dendrometer bands annually
from 1994 to 2008, Bonanza Creek LTER – University of Alaska Fairbanks. BNZ: 420,
<www.lter.uaf.edu/data_detail.cfm?datafile_pkey=420>
Cedar Creek Ecosystem Science Reserve (CDR)
The Cedar Creek Ecosystem Science Reserve is a 2200 ha area located in central Minnesota. We

used data collected from old-field communities dominated by Elymus repens, Poa pratensis and
Schizachyrium scoparium. Daily precipitation data were collected from a meteorological station
located at CDR. We defined the growing season as 25 April – 15 October each year (Dan
Bahauddin, pers. comm.).
ANPP was harvested from 1982–2006 from control plots of the long-term nitrogen
deposition experiment at CDR. The 46 16-m2 control plots were located in four old fields (A, B,
C, and D; n = 12 per field, except field D where n = 10). ANPP was harvested by clipping all
biomass 1–2 cm above ground level within a 0.3-m2 quadrat of each plot at peak biomass. The
quadrat sampled was relocated yearly to prevent a sampling effect. Collected biomass was
separated by species, dried at 60ºC for 48 h, and weighed. Precipitation and ANPP data were
from the following data sets:
Tilman, D. 2008. Experiment 001 - Aboveground biomass data. St. Paul, MN: Cedar Creek
Ecosystem Science Reserve Data Base: E001. [Database].
<www.cedarcreek.umn.edu/research/data/data.php?input=ple001>
Seeley, M. 2010. Experiment 080 – Meterologic measurements at Cedar Creek Natural History
Area. St. Paul, MN: Cedar Creek Ecosystem Science Reserve Data Base: E080.
[Database]. <www.cedarcreek.umn.edu/research/data/data.php?input=clime080>
Capulin Volcano National Monument (CVO)
Capulin Volcano National Monument was selected randomly from piñion Pinus edulis woodland
sites with modern tree-ring data hosted by the NOAA paleoclimatology database
<www.ncdc.noaa.gov/paleo/treering.html>. The site is located in northeastern New Mexico.
Daily precipitation data are from Des Moines, NM (12 km east of the study site). We defined the
growing season as 15 April – 15 October (Baker 1944).
Tree ring measurements of 23 individual P. edulus collected from 1951–1991 were used
to determine mean annual production per tree by 1) linear detrending, 2) normalization of

residuals to each tree’s mean increment width, and 3) calculation of an unweighted mean
increment width for each year across all cores with complete data for the study period. The
resulting dimensionless values serve as an index of production, but cannot be scaled to ANPP in
g m-2 y-1.
Baker F.S. 1944. Mountain climates of the western United States. – Ecol. Monogr. 14: 223–254.
ANPP data were from the following data set:
Woodhouse, C. A. and Brown, P. M. 1998. Capulin Volcano - PIED - ITRDB NM576.
[Database]
<http://hurricane.ncdc.noaa.gov/pls/paleox/f?p=519:1:2874077818569153::::P1_STUDY
_ID:5287>
Coweeta Hydrologic Laboratory (CWT)
Coweeta Hydrologic Laboratory has a mixed deciduous forest in the mountains of southwestern
North Carolina. Five distinct community types are sampled along an elevation gradient: oak pine,
cove hardwoods, mixed oak lowland, mixed oak highland, northern hardwoods. The oak pine
community is characterized by Pinus rigida, Quercus spp. and Carya spp. The cove hardwoods
are dominated by Liriodendron tulipifera, Quercus prinus and Carya spp. The mixed oak
lowlands and uplands are characterized by Quercus spp., Carya spp. and Rhododendron
maximum. The northern hardwoods are dominated by Betula spp., Tilia heterophylla and Quercus
rubra. Daily precipitation data were collected from raingauge 6 at CWT. We defined the growing
season as 15 April – 24 October (Hwang et al. 2011).
Deciduous species’ litterfall collected annually in ten 0.85 m2 baskets was used as an
index of foliar production at each of the five 20 × 40 m plots. Although species composition
varies across the gradient, values should be comparable within each community type.
Hwang, T. C. et al. 2011. Topography-mediated controls on local vegetation phenology estimated
from MODIS vegetation index. – Landscape Ecol. 26: 541–556.

ANPP data were from the following data set:
Knoepp, J., Clark, J., Vose, J., Haines, B. and Crossley, D. A. Terrestrial gradient leaf litter
weights. Athens, GA: Coweeta Hydrologic Laboratory Database: 1121 [Database].
<http://coweeta.uga.edu/summaries/summary1121_b.html>
Harvard Forest (HFR)
Harvard Forest is a 1214 ha hardwood-hemlock-pine forest located in central Massachusetts. The
area is dominated by both deciduous and evergreen species, including Tsuga canadensis, Betula
lenta, Acer rubrum, Quercus rubra and Pinus strobus. Daily precipitation data were collected
from meteorological stations on-site; missing data (from 1994 and 1995) were filled using NCDC
data from Tully Lake in Athol (13 km NNW of the study site). We defined the growing season as
25 April – 24September (Richardson et al. 2006). ANPP data were collected as foliar litterfall
from deciduous species from 1998–2007 from 34 plots located in the footprint of an HFR flux
tower ('EMS litter'). Additionally, increment cores were taken in six hemlock-dominated plots
and two hardwood plots in 2003, totaling 217 trees sampled across 12 species. Hemlock and
hardwood plots were included as separate communities. Raw data were processed as described
above for CVO.
Richardson, A. D. et al. 2006. Phenology of a northern hardwood forest canopy. – Global Change
Biol. 12: 1174–1188.
Precipitation and ANPP data were from the following data sets:
Boose, E., Gould, E. and Hall, B. 2002. Shaler Meteorological Station (1964–2002). Petersham,
MA: Harvard Forest Data Archive: HF000. [Database]. <
http://harvardforest.fas.harvard.edu:8080/exist/xquery/data.xq?id=hf000>
Boose, E. and VanScoy, M. 2010. Fisher Meteorological Station (since 2001). Petersham, MA:

Harvard Forest Data Archive: HF001. [Database].
<http://harvardforest.fas.harvard.edu:8080/exist/xquery/data.xq?id=hf001>
Bettmann-Kerson, P. and Ellison, A. 2006. Hemlock Removal Experiment - Dendrochronological
Record. Petersham, MA: Harvard Forest Data Archive: HF086. [Database].
<http://harvardforest.fas.harvard.edu:8080/exist/xquery/data.xq?id=hf086>
Munger, W. and Wofsy, S. 2010. EMS Biomass Inventories - Litterfall. Petersham, MA: Harvard
Forest Data Archive: HF069-07. [Database].
<http://harvardforest.fas.harvard.edu:8080/exist/xquery/data.xq?id=hf069>
Hopland Field Station (HOP)
Hopland Field Station is a 1902 ha area located in Northern California foothill rangeland. The site
is dominated by annual grasses, including Bromus, Festuca, Avena, and Hordeum species. Daily
precipitation data were collected from a NOAA weather station in Hopland, CA (10 km from
study site). We defined the growing season as 15 October – 5 June (Murphy 1970).
ANPP was collected each year from six 4.05 m2 (0.001 acre) grazing exclosures from
1952–1966. Collected biomass was dried at 60ºC for 48 h and weighed. Data from 1958 and 1967
were not included in the analysis due to missing precipitation data.
Murphy, A. H. 1970. Predicted forage yield based on fall precipitation in California annual
grasslands. – J. Range Manage. 23: 363–365.
Hubbard Brook Experimental Forest (HBR)
Hubbard Brook Experimental Forest is a 3160 ha area in the White Mountain National Forest in
New Hampshire. At the elevations sampled, the forest is dominated by deciduous species,
including Fagus grandifolia, Acer saccharum, Betula alleghaniensis and Fraxinus americana.
Daily precipitation records for three collectors in watershed 6 (litterfall) or watershed 1

(increment cores) were used. We defined the growing season as 25 April – 24 September
(Richardson et al. 2006).
Litter fall was collected each November from 1993–2005 on two 100-m long transects at
525 and 585 m elevation west of the reference watershed. Higher-elevation transects were
excluded from analysis because they were affected by an ice storm in 1998. Each transect had 12
baskets 0.097 m2 in area. Additionally, 145 increment cores taken from four species in a different
location in 1985 (Kim 1988) were processed using the same approach as for CVO (above) and
treated as a separate 'community'.
Kim, E. S. 1988. Radial growth patterns of tree species in relation to environmental factors. –
PhD thesis, Yale Univ. New Haven, CT.
Precipitation and ANPP data were from the following data sets:
Campbell, J. 2008. Daily precipitation by watershed data. Woodstock, NH: Hubbard Brook
Ecosystem Study Database: 14 [Database].
<www.hubbardbrook.org/data/dataset.php?id=14>
Kim, E. S. and Bormann, F. H. 1988. Tree core increment data. Woodstock, NH: Hubbard Brook
Ecosystem Study Database: 55 [Database].
<www.hubbardbrook.org/data/dataset.php?id=55>
Fahey, T. J., Hughes, J. W., Wood, C. and Wapner, S. 2006. Fine litterfall data. Woodstock, NH:
Hubbard Brook Ecosystem Study Database: 49 [Database].
<www.hubbardbrook.org/data/dataset.php?id=49>
Jornada Experimental Range (JRN)
The Jornada Experimental Range is a 100 000 ha area located in southern New Mexico. Four
community types within JRN were used in our analysis: black grama grassland, mesquite
shrubland, creosotebush shrubland and tarbush shrubland. The black grama grassland is

dominated by B. eriopoda. Mesquite shrubland is the most widespread community type at JRN
and is dominated by Prosopis glandulosa. The creosotebush shrubland and tarbush shrubland are
dominated by L. tridentata and Flourensia cernua, respectively. Daily precipitation data were
collected from a meteorological station at the Jornada headquarters. We defined the growing
season as 25 April – 5 October (Canfield 1934).
At each site, permanent 1-m2 quadrats are arranged in a square 7 × 7 pattern, with 10 m
between each quadrat. All quadrats are measured at each site for standing biomass three times per
year. Sampling occurs in February–March, May and late summer – October. At each sampling of
standing biomass, all quadrats within each site are measured. Measurements include species
present, and cover, height, count and phenological state of each species. Volume is then
calculated for all species in all quadrats. Specified volumes of plants are harvested from nearby,
and are sorted, dried, and weighed. For some species, plant material is separated into leaves,
stems, and flowers, and each part is weighed separately. Regression of biomass by volume can
then be constructed, and combined with volume data to calculate biomass in each quadrat.
Canfield, R. G. 1934. Stem structure of grasses on the Jornada Experimental Range. – Bot. Gaz.
95: 636–648.
Precipitation data were from the following data set:
Anderson, J. P. 2010. Climatalogical data (Jornada LTER Weather Station): Daily summary
weather data. Las Cruces, NM: Jornada Data Catalog [Database]. <http://jornada-
www.nmsu.edu/datacat.php#DsdClimate>
Kellogg Biological Station (KBS)
Kellogg Biological Station is an agricultural research station located in central Michigan. We
used the annually burned successional field data for this analysis. The annually burned
successional field is dominated by herbaceous annuals, including Solidago canadensis, Poa
pratensis and Rhus typhore. Daily precipitation data for KBS was collected from a

meteorological station at the site headquarters. We defined the growing season as 25 – 5
September (Robinson unpubl.).
ANPP was collected from five 1-m2 quadrats located within each community from 1990–
2008. ANPP was harvested by clipping all biomass at ground level within each 1-m2 quadrat.
Collected biomass was sorted by species, dried at 60ºC for 48 h, and weighed. Data from 2007
were not included in the analysis, due to missing values. Precipitation and ANPP data were from
the following data sets:
Bergsma, T. 2010. LTER daily weather (1988 to present). Hickory Corners, MI: Kellogg
Biological Station Long Term Ecological Research Data Base: KBS002. [Database].
<http://lter.msu.edu/datatables/12>
Gross, K, Baker, C. and Robertson, P. 2009. Non-crop biomass (1990 to present). Hickory
Corners, MI: Kellogg Biological Station Long Term Ecological Research Data Base:
KBS019. [Database]. <http://lter.msu.edu/datatables/40>
Konza Prairie Biological Station (KNZ)
Konza Prairie Biological Station is a 3487 ha area of native tallgrass prairie in the Flint Hills
region of northeastern Kansas. The area is dominated by warm-season C4 grasses, particularly
Andropogon gerardii, Sorghastrum nutans and Schizachyrium scoparium. We used data from
three watersheds (ca 60 ha each) burned in the spring at either one-, four-, or twenty-year
intervals (since 1973 for the four- and twenty-year burns and 1978 for the annual burn). Within
each watershed, we focused on two topographic positions: 1) upland, characterized by shallow
Florence soils and 2) lowland, characterized by deep Tully soils, for a total of six community
types. Daily precipitation data were collected at the KNZ headquarters. The growing season was
determined to span, on average, from 15 March – 1 October each year (Weaver 1954; La Pierre
unpubl.).

ANPP was collected from twenty 0.1-m2 quadrats located within each community from
1984–2008. Quadrats were placed every 10 m in a different location each year (to avoid
reharvesting the same quadrat) along four permanent transects (50 m in length), with five
quadrats per transect. ANPP was harvested by clipping all biomass at ground level within each
0.1-m2 quadrat. Collected biomass was dried at 60ºC for 48 h, sorted by growth form (grass, forb,
woody), and weighed. Plots with woody biomass greater than the 95th percentile were dropped
from the analysis (1 quadrat). ANPP was calculated as the sum of current year’s grass, forb, and
woody biomass per quadrat.
Weaver, J. E. 1954. North American prairie. – Johnsen Publ. Co.
Precipitation and ANPP data were from the following data sets:
Knapp, A. K. 2008. Aboveground primary production on fire frequency treatments. Manhattan,
KS: Konza Prairie Data Base: PAB01. [Database].
<www.konza.ksu.edu/datasets/knzdsdetail.aspx?currMenu=0&datasetcode=PAB01>
Briggs, J. M. 2008. Meteorological data. Manhattan, KS: Konza Prairie Data Base: AWE01.
[Database].
<www.konza.ksu.edu/datasets/knzdsdetail.aspx?currMenu=0&datasetcode=AWE01>
Sevilleta National Wildlife Refuge (SEV)
The Sevilleta National Wildlife Refuge is a 100 000 ha site located in central New Mexico. Two
community types within the SEV were used in our analysis: Chihuahuan Desert scrub dominated
by Larrea tridentata and Chihuahuan Desert grassland, dominated by Bouteloua eriopoda. Daily
precipitation data were collected from meteorological station no. 40 located within 8 km of the
creosote shrubland and black grama grassland core communities. We defined the growing season
as 25 March – 5 October (Doug Moore, pers. comm.).
For each community, ANPP data were collected from 80 1-m2 permanent quadrats from

1999–2003 and 40 starting in 2004. ANPP measurements were recorded in the spring and fall of
each year 1999–2009 when plant species had reached peak biomass. Regressions of weight-to-
volume were developed by harvesting various sized individuals of each species from adjacent
areas. A positive change in green biomass (current seasons growth) from spring to fall in each
subplot was used as a measure of mean ANPP for all species (detailed methods in Huenneke et al.
2001, Muldavin et al. 2008).
Huenneke, L. F. et al. 2001. Spatial heterogeneity in Chihuahuan Desert vegetation: implications
for sampling methods in semi-arid ecosystems. – J. Arid Environ. 47: 257–270.
Muldavin, E. H. et al. 2008. Aboveground net primary production dynamics in a northern
Chihuahuan Desert ecosystem. – Oecologia 155: 123–132.
Precipitation and ANPP data were from the following data sets:
Moore, D. I. 1987-ongoing. Meteorology: Long-Term Ecological Research. Albuquerque, NM:
Meteorological Data: SEV 001 [Database]. <http://sev.lternet.edu>
Muldavin, E. H. 1991-ongoing. Primary production: long-term ecological research. Albuquerque,
NM: Seasonal and Annual Biomass and ANPP for Sevilleta LTER Core Research Sites:
SEV 182 [Database]. <http://sev.lternet.edu>
Shortgrass Steppe Long-Term Ecological Research Site (SGS)
The Shortgrass Steppe Long-Term Ecological Research site is a 6280 ha area located in northern
Colorado in the rain shadow of the Rocky Mountains. The area is dominated by warm-season C4
grasses, particularly Bouteloua gracilis and Buchloe dactyloides. We used data collected from
three community types separated by elevation: ridgeland, midland and swale. Daily precipitation
data for SGS was collected from a meteorological station located at the station headquarters. If
precipitation data were missing (1983–1996), values were filled in from a nearby NOAA weather
station in Nunn, CO (24 km south of the study site). We defined the growing season as 5 April –

5 August each year, as plots were generally clipped the first week in August. The true growing
season ends in September (Lauenroth and Burke 2008).
ANPP was collected from fifteen 0.25-m2 quadrats located within each community from
1983–2006. Quadrats were placed along three permanent transects, with five quadrats per transect
in a different location each year (to avoid reharvesting the same quadrat). ANPP was harvested
by clipping all biomass at ground level within each quadrat. For shrub species, only current
year’s growth was collected. Collected biomass was dried at 60ºC for 48 h, sorted by species and
weighed.
Lauenroth, W. and Burke, I. C. (eds) 2008. Ecology of the shortgrass steppe. – Oxford Univ.
Press.
Precipitation and ANPP data were from the following data sets:
Parton, B. 2010. Standard Met Data: 1969–2010 Manually Collected Standard Meteorological
Data. Fort Collins, CO: Shortgrass Steppe Long Term Ecological Research Site Database:
man11_climdb. <http://sgs.cnr.colostate.edu/dataset_view.aspx?id=man11_climdb> (17 April
2010).
Lauenroth, W. K. 2007. Standard production data: 1983–2007 annual aboveground net primary
production. Fort Collins, CO: Shortgrass Steppe Long Term Ecological Research Site
Database: anpp. <http://sgs.cnr.colostate.edu/dataset_view.aspx?id=anpp> (17 April
2010).
Teakettle Experimental Forest (TEA)
The Teakettle Experimental Forest is a 1300 ha site on the western slope of the Sierra Nevada in
central California. The site is dominated by Abies concolor, Calocedrus decurrens, Pinus jeffreyi
and Pinus lambertiana. Daily precipitation data were collected at the Wishon Dam
meteorological station (10 km from study site). Precipitation data from November 1999 were

incomplete and therefore dropped from the analysis. We defined the growing season as 15 April –
15 October (Baker 1944, Concilio et al. 2009). Dendrometer band data from an unburned,
unthinned area was collected for 26 trees in four conifer species from 1997–2008. As with
increment core data, dimensionless detrended mean proportional residuals (see CVO, above)
were used as a production index.
Baker, F. S. 1944. Mountain climates of the western United States. – Ecol. Monogr. 14: 223–254.
Concilio, A., Chen, J. Q., Ma, S. and North, M. 2009. Precipitation drives interannual variation in
summer soil respiration in a Mediterranean-climate mixed-conifer forest. – Climate
Change 92: 109–122.
ANPP data previously reported by:
Hurteau, M. and North, M. 2010. Carbon recovery rates following different wildfire risk
mitigation treatments. – For. Ecol. Manage. 260: 930–937.
US Sheep Experiment Station (USE)
The US Sheep Experiment Station is an 11 303 ha area spanning the border between Montana
and Idaho. The area is characterized by sagebrush shrubland and is dominated by Artemisia
tripartita, Pseudoroegneria spicata and Balsamorhiza sagittata. Daily precipitation data for USE
was collected from a meteorological station at the station headquarters. We defined the growing
season as 25 March – 5 August (Blaisdell 1958).
Aboveground biomass was visually estimated by growth form (woody, graminoids, forbs,
and succulents) and lifespan (annual, perennial) from 1936–1954 in 125 4.65-m2 (50 ft2)
permanent quadrats in three grazing exclosures.
Blaisdell, J. P. 1958. Seasonal development and yield of native plants on the upper Snake River
plains and their relation to certain climatic factors. – In: Technical Bulletin No. 1190.
USDA, Washington, D.C., pp. 1–63.

Figure A1. Location of sites that provided data for the study and mean annual precipitation.

Table A1. Best statistically supported models for all communities (Com) studied where precipitation had a strong (adjusted R2 ≥ 0.3) and significant (overall model p < 0.05) effect on production. Communities that did not meet these criteria are not included in this table. Coefficient parameters and their significance are shown for each model, and sites where the total precipitation model had the most support have the most supported seasonal model included for comparison. Parameter coefficients (g m-2 mm-1) Site Com Model Model adj R2 p DF Intercept p0 p1 p2 p3 p4 p1*p2 p2*p3 p3*p4 pt pg rank SEV CRE 11 best 0.33 0.036 9 10.5 0.21 * JRN C 9 best (tied) 0.73 5E-04 11 22.9 0.23 0.11 0.55 *** 6 best (tied) 0.68 4E-04 12 22.2 0.12 0.61 *** G 11 best 0.51 0.002 13 3.4 0.39 ** T 4 best (tied) 0.35 0.011 13 29.0 0.57 * BNZ FP3 5a best 0.43 0.027 11 181.2 5.82 ** 1.94 -0.08 *** FP4 9a best 0.77 0.002 9 -168.8 6.03 *** 5.30 *** 4.63 *** -0.07 *** -0.05 *** UP2 3 best 0.54 0.003 11 896.6 -3.31 ** UP3 7 best (tied) 0.49 0.014 10 244.1 -1.22 * 1.77 * 9 best (tied) 0.57 0.014 9 236.1 1.15 -1.48 * 1.71 * USE Non 11 best 0.45 0.007 11 22.1 0.25 ** SGS MID 11 best 0.76 8E-09 23 -40.6 0.30 *** 12 best seasonal 0.70 1E-07 23 4.8 0.30 *** RID 11 best 0.60 3E-06 23 -24.4 0.22 *** 10 best seasonal 0.65 8E-05 19 -16.8 0.09 0.40 ** 0.24 *** 0.18 ** 0.30 *** SWA 9 best (tied) 0.57 1E-04 21 -13.2 0.46 ** 0.35 * 0.91 *** 11 best (tied) 0.53 2E-05 23 -71.2 0.49 *** CVO † -- 10 best 0.55 3E-06 35 -203.9 0.37 0.77 * 1.00 *** 0.49 ** -0.24 KNZ 1f 5 best (tied) 0.58 3E-05 22 193.2 0.45 *** 0.39 *** 11 best (tied) 0.54 2E-05 23 133.0 0.30 *** 1t 5 best (tied) 0.38 0.002 22 345.8 0.49 * 0.51 ** 5a best (tied) 0.45 0.001 21 189.1 1.24 ** 1.12 ** -0.003 11 best (tied) 0.31 0.002 23 291.1 0.34 ** 20f 9 best 0.45 0.002 20 269.8 0.28 * 0.33 ** -0.35 * 4f 5 best (tied) 0.39 0.002 21 197.6 0.32 * 0.30 ** 11 best (tied) 0.34 0.002 22 152.9 0.23 ** KBS T7 1 best 0.32 0.009 16 284.1 4.26 ** TEA † -- 8 best 0.41 0.021 9 -710.5 1.00 * HFR EMS 3 best 0.33 0.049 8 186.8 0.47 * CWT 118 3 best 0.40 0.029 8 45.7 0.10 *
* = p < 0.05; ** = p < 0.01; *** = p < 0.001 †ANPP data for CVO and TEA are not in units of g m-2 y-1(Supplementary material Appendix A1); intercept and coefficients for these sites are expressed relative to the largest effect size in each model.