Embed Size (px)
Citation preview

Seasonal and Intraseasonal Modulation of Tropical Cyclogenesis Environment overthe Bay of Bengal during the Extended Summer Monsoon
WATARU YANASE AND MASAKI SATOH
Atmosphere and Ocean Research Institute, The University of Tokyo, Kashiwa, Japan
HIROSHI TANIGUCHI
International Pacific Research Center, University of Hawaii at Manoa, Honolulu, Hawaii
HATSUKI FUJINAMI
Hydrospheric Atmospheric Research Center, Nagoya University, Nagoya, Japan
(Manuscript received 12 April 2011, in final form 16 September 2011)
ABSTRACT
The environmental field of tropical cyclogenesis over the Bay of Bengal is analyzed for the extended
summer monsoon season (approximately May–November) using best-track and reanalysis data. Genesis
potential index (GPI) is used to assess four possible environmental factors responsible for tropical cyclo-
genesis: lower-tropospheric absolute vorticity, vertical shear, potential intensity, and midtropospheric relative
humidity. The climatological cyclogenesis is active within high GPI in the premonsoon (;May) and post-
monsoon seasons (approximately October–November), which is attributed to weak vertical shear. The
genesis of intense tropical cyclone is suppressed within the low GPI in the mature monsoon (approximately
June–September), which is due to the strong vertical shear. In addition to the climatological seasonal tran-
sition, the authors’ composite analysis based on tropical cyclogenesis identified a high GPI signal moving
northward with a periodicity of approximately 30–40 days, which is associated with boreal summer intra-
seasonal oscillation (BSISO). In a composite analysis based on the BSISO phase, the active cyclogenesis
occurs in the high GPI phase of BSISO. It is revealed that the high GPI of BSISO is attributed to high relative
humidity and large absolute vorticity. Furthermore, in the mature monsoon season, when the vertical shear is
climatologically strong, tropical cyclogenesis particularly favors the phase of BSISO that reduces vertical
shear effectively. Thus, the combination of seasonal and intraseasonal effects is important for the tropical
cyclogenesis, rather than the independent effects.
1. Introduction
The Bay of Bengal (BoB) in the north Indian Ocean
(NIO) is one of the regions where tropical cyclones
(TCs) form frequently (Fig. 1). Although the TC fre-
quency over the BoB is less than those over the western
and eastern North Pacific, TCs over the BoB have af-
fected human society in the surrounding countries. For
example, the Bhola cyclone caused a catastrophic death
toll of 500 000 in November 1970, and tropical Cyclone
Nargis took more than 130 000 victims in April–May
2008 (Webster 2008; Fritz et al. 2009).
A unique characteristic of the BoB is that TCs with
maximum wind speeds exceeding 34 kt or ;17.5 m s21
[referred to as tropical storms (TSs)] form in two sepa-
rate seasons (black circles in Fig. 2) under the influence
of the Asian summer monsoon (ASM): most of the TSs
form around the premonsoon (;May) and around the
postmonsoon (approximately October–November),
whereas few TSs form during the mature monsoon (ap-
proximately June–September). Such a bimodal TS dis-
tribution is not observed over the other regions, where TS
formation is active around summer (black circles in
Fig. 13) with a unimodal distribution, except over the
Arabian Sea in the NIO. On the other hand, TCs with
wind speeds less than 34 kt throughout lifetimes [tropical
depressions (TDs)] still form during the mature monsoon
season over the BoB, which are called low pressure
Corresponding author address: Wataru Yanase, Atmosphere
and Ocean Research Institute, The University of Tokyo, 5-1-5
Kashiwanoha, Kashiwa, Chiba 277-8564, Japan.
E-mail: [email protected]
2914 J O U R N A L O F C L I M A T E VOLUME 25
DOI: 10.1175/JCLI-D-11-00208.1
� 2012 American Meteorological Society

systems (LPSs; Goswami et al. 2003; Krishnamurthy
and Ajayamohan 2010). These seasonal characteristics
of tropical cyclogenesis (including TS and TD) over the
BoB could be related to environmental conditions in
the ASM region. The Bay of Bengal is a suitable region
to examine the local environmental field responsible
for tropical cyclogenesis, because the surrounding land
on the northern, eastern, and western margins of the BoB
obstructs disturbances moving from the other oceans to
the BoB (Fig. 1).
Previous studies have proposed several environmen-
tal factors responsible for tropical cyclogenesis (Gray
1975; Emanuel and Nolan 2004; Camargo et al. 2007).
Whereas the sea surface temperature (SST) is a well-
known important factor, the activity of tropical cyclo-
genesis also seems to be controlled by other dynamical
and thermodynamical factors including moist static sta-
bility and planetary vorticity. Emanuel and Nolan (2004)
developed the genesis potential index (GPI) based on the
following four factors: large lower-tropospheric absolute
vorticity, weak vertical shear, high potential intensity,
and high midtropospheric humidity. Weak vertical shear
is necessary for tropical cyclogenesis because the shear
breaks a warm core structure of TC (a ventilation effect).
The potential intensity is a thermodynamical factor con-
sidering the effects of SST and moist static instability (see
section 2). Camargo et al. (2007) demonstrated that the
seasonal transition of GPI is in good agreement with that
of tropical cyclogenesis in the major oceans including the
bimodal TS season over the NIO. Another interesting
characteristic of tropical cyclogenesis over the BoB or
NIO is related to the boreal summer intraseasonal oscil-
lation (BSISO). Using 30 yr of data, Kikuchi and Wang
(2010) showed that the BSISO modulates the topical
cyclogenesis activity over the NIO, and that the GPI is
high during the active cyclogenesis phase of the BSISO.
Yanase et al. (2010) proposed that the superposition of
seasonal transition and BSISO caused the high GPI
during the genesis of Cyclone Nargis in the premonsoon
of 2008. More statistical analysis is necessary to elucidate
the relation between the seasonal transition and shorter
time-scale modulation that is responsible for tropical
cyclogenesis over the BoB.
In the present study, we assess the statistical relation
between the tropical cyclogenesis and environmental
field over the BoB by addressing the following issues: 1)
Are there any GPI signals on seasonal and shorter time
scales in a composite analysis based on cyclogenesis
events? 2) What is the relation between the seasonal
transition and the shorter time-scale modulation for the
cyclogenesis? 3) Which factor contributes to the modu-
lation of GPI? These characteristics over the BoB are
compared with those over the other oceans including the
Arabian Sea and the North Pacific. The remainder of the
manuscript is organized as follows. Section 2 describes
the methodology employed in the data analysis. Section 3
FIG. 1. Distribution of the number of tropical cyclogenesis (contour interval is five events per
58 3 58) in 27 yr (1982–2008).
15 APRIL 2012 Y A N A S E E T A L . 2915
presents the climatological relation between the seasonal
transition of environmental field and tropical cyclogenesis.
This section confirms the results of previous studies. Sec-
tion 4 provides a composite analysis based on the tropical
cyclogenesis to identify environmental modulations that
have shorter time scales than the seasonal transition. Be-
cause the dominant shorter time-scale modulation was
revealed to be the BSISO, section 5 analyzed the cyclo-
genesis and GPI based on the phases of the BSISO. We
extended the result of Kikuchi and Wang (2010) to iden-
tify the main environmental factors that modulate the GPI
within the BSISO. Section 6 discusses the cyclogenesis
over the other oceans and the role of BSISO. Finally,
section 7 summarizes the characteristics of the environ-
mental field responsible for the cyclogenesis over the BoB.
2. Methodology
a. Data
The large-scale environmental field analyzed in this
study comprises daily data on the atmosphere and ocean
between 1982 and 2008. Atmospheric analysis data are
the Japanese 25-yr Reanalysis (JRA-25) for the period
between 1979 and 2004 (Onogi et al. 2007) and the Japan
Meteorological Agency (JMA) Climate Data Assimi-
lation System (JCDAS) for the period from 2005, which
are provided by the JMA and the Central Research
Instituted of Electric Power Industry (CRIEPI); be-
cause JCDAS is based on the same system as that em-
ployed by JRA-25, the two products, when combined,
provide a homogeneous dataset for the period from 1979
to 2008. The horizontal resolutions of the products are
1.258 grid intervals. The original 6-hourly dataset of
JRA-25/JCDAS is averaged every four time steps to
create a daily dataset. Convective activity is represented
by outgoing longwave radiation (OLR) of the National
Oceanic and Atmospheric Administration (NOAA).
The analysis data of SST is the product of NOAA Op-
timum Interpolation from late 1981, which uses in situ
and satellite data (Reynolds et al. 2002). The original
weekly dataset of SST, with a horizontal resolution of 18,
is linearly interpolated in time and space to create a daily
dataset on the same grid system as that used in the at-
mospheric dataset.
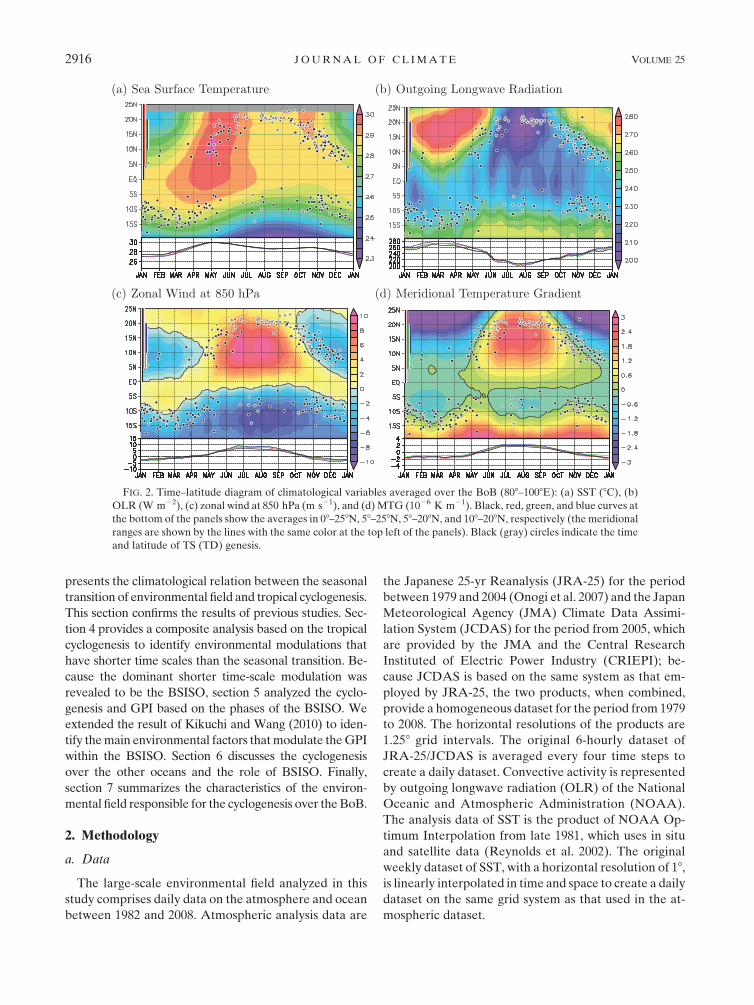
FIG. 2. Time–latitude diagram of climatological variables averaged over the BoB (808–1008E): (a) SST (8C), (b)
OLR (W m22), (c) zonal wind at 850 hPa (m s21), and (d) MTG (1026 K m21). Black, red, green, and blue curves at
the bottom of the panels show the averages in 08–258N, 58–258N, 58–208N, and 108–208N, respectively (the meridional
ranges are shown by the lines with the same color at the top left of the panels). Black (gray) circles indicate the time
and latitude of TS (TD) genesis.
2916 J O U R N A L O F C L I M A T E VOLUME 25
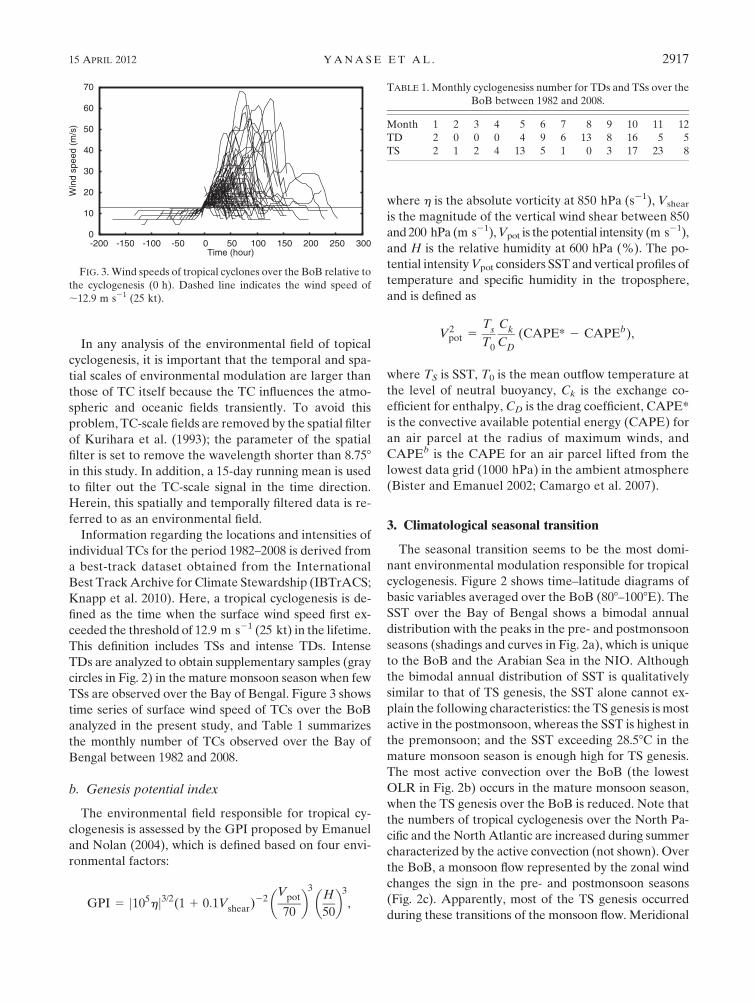
In any analysis of the environmental field of topical
cyclogenesis, it is important that the temporal and spa-
tial scales of environmental modulation are larger than
those of TC itself because the TC influences the atmo-
spheric and oceanic fields transiently. To avoid this
problem, TC-scale fields are removed by the spatial filter
of Kurihara et al. (1993); the parameter of the spatial
filter is set to remove the wavelength shorter than 8.758
in this study. In addition, a 15-day running mean is used
to filter out the TC-scale signal in the time direction.
Herein, this spatially and temporally filtered data is re-
ferred to as an environmental field.
Information regarding the locations and intensities of
individual TCs for the period 1982–2008 is derived from
a best-track dataset obtained from the International
Best Track Archive for Climate Stewardship (IBTrACS;
Knapp et al. 2010). Here, a tropical cyclogenesis is de-
fined as the time when the surface wind speed first ex-
ceeded the threshold of 12.9 m s21 (25 kt) in the lifetime.
This definition includes TSs and intense TDs. Intense
TDs are analyzed to obtain supplementary samples (gray
circles in Fig. 2) in the mature monsoon season when few
TSs are observed over the Bay of Bengal. Figure 3 shows
time series of surface wind speed of TCs over the BoB
analyzed in the present study, and Table 1 summarizes
the monthly number of TCs observed over the Bay of
Bengal between 1982 and 2008.
b. Genesis potential index
The environmental field responsible for tropical cy-
clogenesis is assessed by the GPI proposed by Emanuel
and Nolan (2004), which is defined based on four envi-
ronmental factors:
GPI 5 j105hj3/2(1 1 0:1Vshear)22
Vpot
70
� �3H
50
� �3
,
where h is the absolute vorticity at 850 hPa (s21), Vshear
is the magnitude of the vertical wind shear between 850
and 200 hPa (m s21), Vpot is the potential intensity (m s21),
and H is the relative humidity at 600 hPa (%). The po-
tential intensity Vpot considers SST and vertical profiles of
temperature and specific humidity in the troposphere,
and is defined as
V2pot 5
Ts
T0
Ck
CD
(CAPE* 2 CAPEb),
where TS is SST, T0 is the mean outflow temperature at
the level of neutral buoyancy, Ck is the exchange co-
efficient for enthalpy, CD is the drag coefficient, CAPE*
is the convective available potential energy (CAPE) for
an air parcel at the radius of maximum winds, and
CAPEb is the CAPE for an air parcel lifted from the
lowest data grid (1000 hPa) in the ambient atmosphere
(Bister and Emanuel 2002; Camargo et al. 2007).
3. Climatological seasonal transition
The seasonal transition seems to be the most domi-
nant environmental modulation responsible for tropical
cyclogenesis. Figure 2 shows time–latitude diagrams of
basic variables averaged over the BoB (808–1008E). The
SST over the Bay of Bengal shows a bimodal annual
distribution with the peaks in the pre- and postmonsoon
seasons (shadings and curves in Fig. 2a), which is unique
to the BoB and the Arabian Sea in the NIO. Although
the bimodal annual distribution of SST is qualitatively
similar to that of TS genesis, the SST alone cannot ex-
plain the following characteristics: the TS genesis is most
active in the postmonsoon, whereas the SST is highest in
the premonsoon; and the SST exceeding 28.58C in the
mature monsoon season is enough high for TS genesis.
The most active convection over the BoB (the lowest
OLR in Fig. 2b) occurs in the mature monsoon season,
when the TS genesis over the BoB is reduced. Note that
the numbers of tropical cyclogenesis over the North Pa-
cific and the North Atlantic are increased during summer
characterized by the active convection (not shown). Over
the BoB, a monsoon flow represented by the zonal wind
changes the sign in the pre- and postmonsoon seasons
(Fig. 2c). Apparently, most of the TS genesis occurred
during these transitions of the monsoon flow. Meridional
FIG. 3. Wind speeds of tropical cyclones over the BoB relative to
the cyclogenesis (0 h). Dashed line indicates the wind speed of
;12.9 m s21 (25 kt).
TABLE 1. Monthly cyclogenesiss number for TDs and TSs over the
BoB between 1982 and 2008.
Month 1 2 3 4 5 6 7 8 9 10 11 12
TD 2 0 0 0 4 9 6 13 8 16 5 5
TS 2 1 2 4 13 5 1 0 3 17 23 8
15 APRIL 2012 Y A N A S E E T A L . 2917
temperature gradient (MTG) in the upper troposphere
(200–500 hPa) is another index of the ASM (Mao and Wu
2007). In general, the MTG is negative in the Northern
Hemisphere because of the meridional difference of solar
radiation. However, the MTG during the mature ASM is
uniquely positive, which is attributed to the heating of the
Asian continent to the north of the BoB. Thus, the MTG
changes the sign in the pre- and postmonsoon seasons
(Fig. 2d), when most of the TS formations are observed.
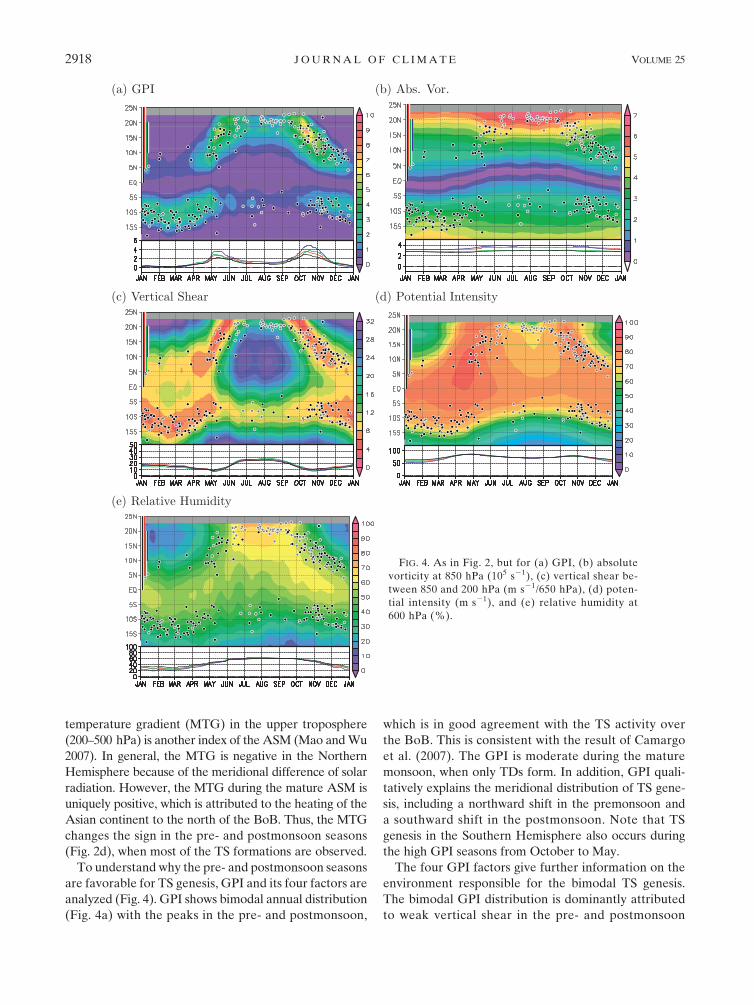
To understand why the pre- and postmonsoon seasons
are favorable for TS genesis, GPI and its four factors are
analyzed (Fig. 4). GPI shows bimodal annual distribution
(Fig. 4a) with the peaks in the pre- and postmonsoon,
which is in good agreement with the TS activity over
the BoB. This is consistent with the result of Camargo
et al. (2007). The GPI is moderate during the mature
monsoon, when only TDs form. In addition, GPI quali-
tatively explains the meridional distribution of TS gene-
sis, including a northward shift in the premonsoon and
a southward shift in the postmonsoon. Note that TS
genesis in the Southern Hemisphere also occurs during
the high GPI seasons from October to May.
The four GPI factors give further information on the
environment responsible for the bimodal TS genesis.
The bimodal GPI distribution is dominantly attributed
to weak vertical shear in the pre- and postmonsoon
FIG. 4. As in Fig. 2, but for (a) GPI, (b) absolute
vorticity at 850 hPa (105 s21), (c) vertical shear be-
tween 850 and 200 hPa (m s21/650 hPa), (d) poten-
tial intensity (m s21), and (e) relative humidity at
600 hPa (%).
2918 J O U R N A L O F C L I M A T E VOLUME 25

(shadings and curves in Fig. 4c). In the mature monsoon
season, strong vertical shear seems to prevent TCs from
developing to TS intensity by the ventilation effect. Based
on the thermal wind balance, the weak vertical shear is
associated with the small MTG in the pre- and post-
monsoon over the BoB (Fig. 2d). The potential intensity
also shows a weak bimodal distribution (Fig. 4d), which
reflects the SST distribution (Fig. 2a). The seasonal
transition of absolute vorticity is relatively weak (Fig. 4b)
because of the large planetary vorticity. Midtropospheric
relative humidity is highest during the mature monsoon
(Fig. 4e), which is related to the active convection as
shown in Fig. 2b. In summary, the bimodal annual dis-
tribution of climatological GPI is attributed to the weak
vertical shear dominantly and to the high potential in-
tensity secondarily.
4. TC-based composite analysis
The seasonal transition of climatological GPI in sec-
tion 3 is in good agreement with the tropical cyclogen-
esis: TS genesis occurs within the high GPI environment
in the pre- and postmonsoon seasons, whereas only TD
forms within the moderate GPI environment in the
mature monsoon. If the large-scale environment mod-
ulates on a time scale shorter than the seasonal transi-
tion, it is of interest to examine whether GPI can explain
the cyclogenesis even on such a short time scale statis-
tically. To extract signals of environmental modulation,
we attempt a composite analysis based on the cyclo-
genesis events (TC-based composite analysis).
As the climatological seasonal transition is the large
environmental modulation, the original field (total field)
is separated into climatological and anomalous ones in
advance of the composite analysis: the climatological
field is the average of 27 yr, whereas the anomalous field
is the difference between the total and the climatological
ones. Then the TC-based composite is performed for the
total, climatological, and anomalous fields. As the cyclo-
genesis activity is different between seasons (Fig. 4), the
composite field is assessed for three seasons: April–May
(AM; premonsoon over the BoB), June–September
(JJAS; mature monsoon) and October–November (ON;
postmonsoon). To obtain the time evolution of environ-
mental modulation, the composite is performed for the
period from 30 days before the cyclogenesis (230 relative
day) to 30 days after the cyclogenesis (30 relative day).
It should be noted again that the analysis is performed
using the environmental fields (spatially and tempo-
rally filtered data).
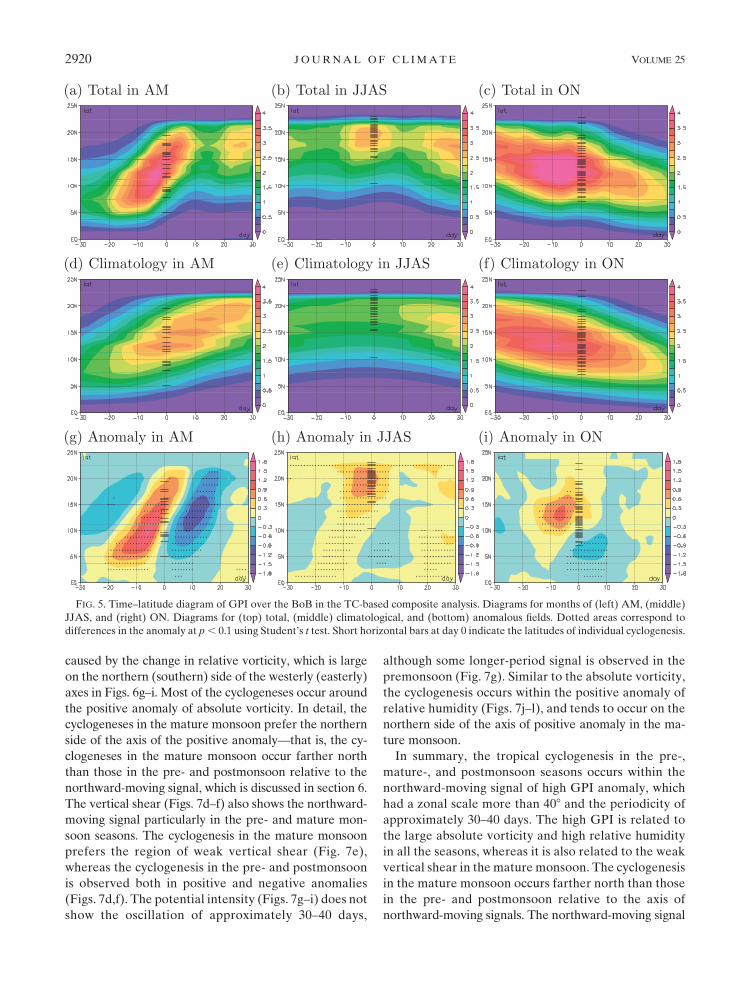
Figure 5 shows time–latitude diagrams of the TC-
based composite GPI. Here, the relative day 0 is the
time when the cyclogenesis events occur, and the short
horizontal bars indicate the latitude of cyclogenesis. In
the premonsoon (the left column in Fig. 5), a high GPI
signal in the total field shifts northward from 58 to 208N
during the period between 220 and 10 days (Fig. 5a). This
northward-moving signal is attributed to both the cli-
matological and anomalous modulations. In the cli-
matological field (Fig. 5d), a high GPI signal slowly
shifted northward during the period from 230 to 30 days,
which is the seasonal transition observed in Fig. 4a. In the
anomalous field (Fig. 5g), a positive GPI signal moves
northward quickly from 220 to 10 days, which is enough
intense to modify the climatological field. Most of the
cyclogenesis in the premonsoon occurs within the positive
anomaly of the northward-moving GPI signal. The posi-
tive GPI anomaly is followed by a negative one, and then
by a weak positive one again, showing a periodicity of
approximately 30–40 days. For the mature monsoon
(the middle column in Fig. 5), a high GPI signal in the
climatological field is stationary around approximately
158–208N. In the anomalous field, on the other hand,
a high GPI signal moves fast northward as observed in
the premonsoon season. In the postmonsoon season (the
right column in Fig. 5), a high GPI signal in the climato-
logical field slowly shifts southward, which is the seasonal
transition shown in Fig. 4a. In the anomalous field, a high
GPI signal still moves northward. Thus, the northward-
moving anomaly with the intraseasonal time scale (ap-
proximately 30–40 days) is observed in all the analyzed
seasons, although it is a little obscure in the postmonsoon
season.
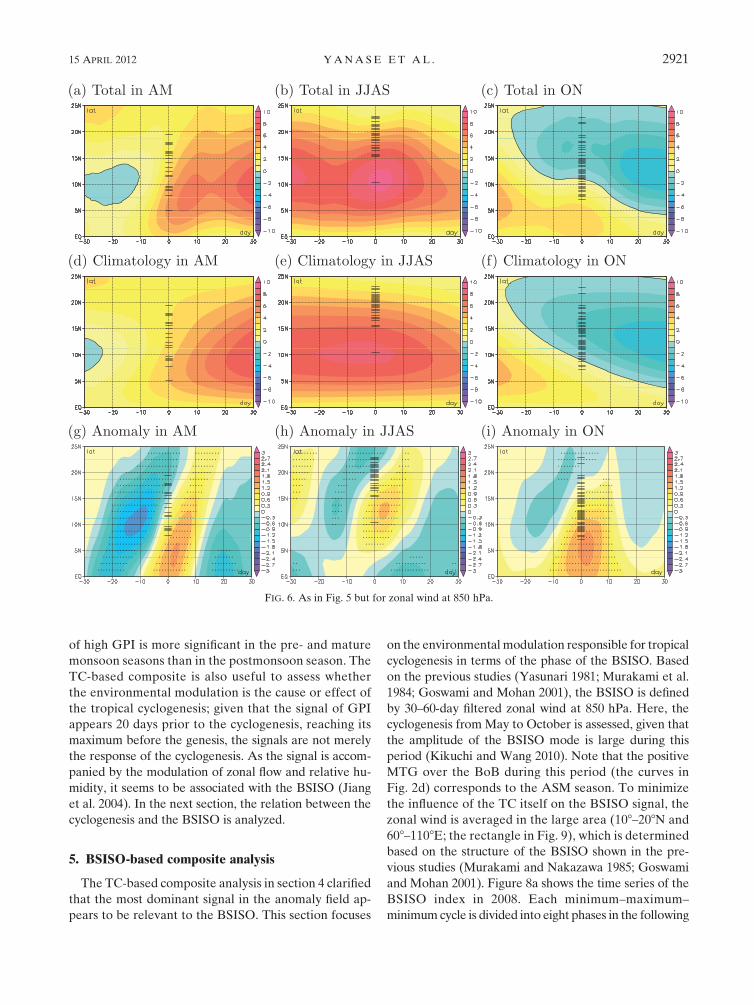
The northward-moving signal in the anomalous field is
simply observed in the time–latitude diagram of zonal
wind at 850-hPa pressure level (Fig. 6). In the clima-
tological field, the westerly flow over the BoB increases
in the premonsoon, remains almost static in the mature
monsoon, and then decreases in the postmonsoon
(Figs. 6d–f). The anomalous fields of zonal wind show
fast northward-moving signals in all the seasons again
(Figs. 6g–i): a westerly anomaly to the south of the cyclo-
genesis and an easterly one to the north. In the longitude–
time diagrams of the composite field (not shown) the
signal almost remain static, and shows the zonal scale of
408 or more. Because the signal has the large horizontal
scale and long time scale, it is not merely the influence
of TC itself.
To elucidate the environmental modulation responsible
for the high GPI, the four GPI factors are assessed using
the TC-based composite analysis. Figure 7 shows time–
latitude diagrams of the anomalous fields of the four
factors in the three seasons. The absolute vorticity
(Figs. 7a–c) shows a positive signal quickly moving
northward in all the seasons. As planetary vorticity does
not change in time, the northward-moving signal is
15 APRIL 2012 Y A N A S E E T A L . 2919
caused by the change in relative vorticity, which is large
on the northern (southern) side of the westerly (easterly)
axes in Figs. 6g–i. Most of the cyclogeneses occur around
the positive anomaly of absolute vorticity. In detail, the
cyclogeneses in the mature monsoon prefer the northern
side of the axis of the positive anomaly—that is, the cy-
clogeneses in the mature monsoon occur farther north
than those in the pre- and postmonsoon relative to the
northward-moving signal, which is discussed in section 6.
The vertical shear (Figs. 7d–f) also shows the northward-
moving signal particularly in the pre- and mature mon-
soon seasons. The cyclogenesis in the mature monsoon
prefers the region of weak vertical shear (Fig. 7e),
whereas the cyclogenesis in the pre- and postmonsoon
is observed both in positive and negative anomalies
(Figs. 7d,f). The potential intensity (Figs. 7g–i) does not
show the oscillation of approximately 30–40 days,
although some longer-period signal is observed in the
premonsoon (Fig. 7g). Similar to the absolute vorticity,
the cyclogenesis occurs within the positive anomaly of
relative humidity (Figs. 7j–l), and tends to occur on the
northern side of the axis of positive anomaly in the ma-
ture monsoon.
In summary, the tropical cyclogenesis in the pre-,
mature-, and postmonsoon seasons occurs within the
northward-moving signal of high GPI anomaly, which
had a zonal scale more than 408 and the periodicity of
approximately 30–40 days. The high GPI is related to
the large absolute vorticity and high relative humidity
in all the seasons, whereas it is also related to the weak
vertical shear in the mature monsoon. The cyclogenesis
in the mature monsoon occurs farther north than those
in the pre- and postmonsoon relative to the axis of
northward-moving signals. The northward-moving signal
FIG. 5. Time–latitude diagram of GPI over the BoB in the TC-based composite analysis. Diagrams for months of (left) AM, (middle)
JJAS, and (right) ON. Diagrams for (top) total, (middle) climatological, and (bottom) anomalous fields. Dotted areas correspond to
differences in the anomaly at p , 0.1 using Student’s t test. Short horizontal bars at day 0 indicate the latitudes of individual cyclogenesis.
2920 J O U R N A L O F C L I M A T E VOLUME 25
of high GPI is more significant in the pre- and mature
monsoon seasons than in the postmonsoon season. The
TC-based composite is also useful to assess whether
the environmental modulation is the cause or effect of
the tropical cyclogenesis; given that the signal of GPI
appears 20 days prior to the cyclogenesis, reaching its
maximum before the genesis, the signals are not merely
the response of the cyclogenesis. As the signal is accom-
panied by the modulation of zonal flow and relative hu-
midity, it seems to be associated with the BSISO (Jiang
et al. 2004). In the next section, the relation between the
cyclogenesis and the BSISO is analyzed.
5. BSISO-based composite analysis
The TC-based composite analysis in section 4 clarified
that the most dominant signal in the anomaly field ap-
pears to be relevant to the BSISO. This section focuses
on the environmental modulation responsible for tropical
cyclogenesis in terms of the phase of the BSISO. Based
on the previous studies (Yasunari 1981; Murakami et al.
1984; Goswami and Mohan 2001), the BSISO is defined
by 30–60-day filtered zonal wind at 850 hPa. Here, the
cyclogenesis from May to October is assessed, given that
the amplitude of the BSISO mode is large during this
period (Kikuchi and Wang 2010). Note that the positive
MTG over the BoB during this period (the curves in
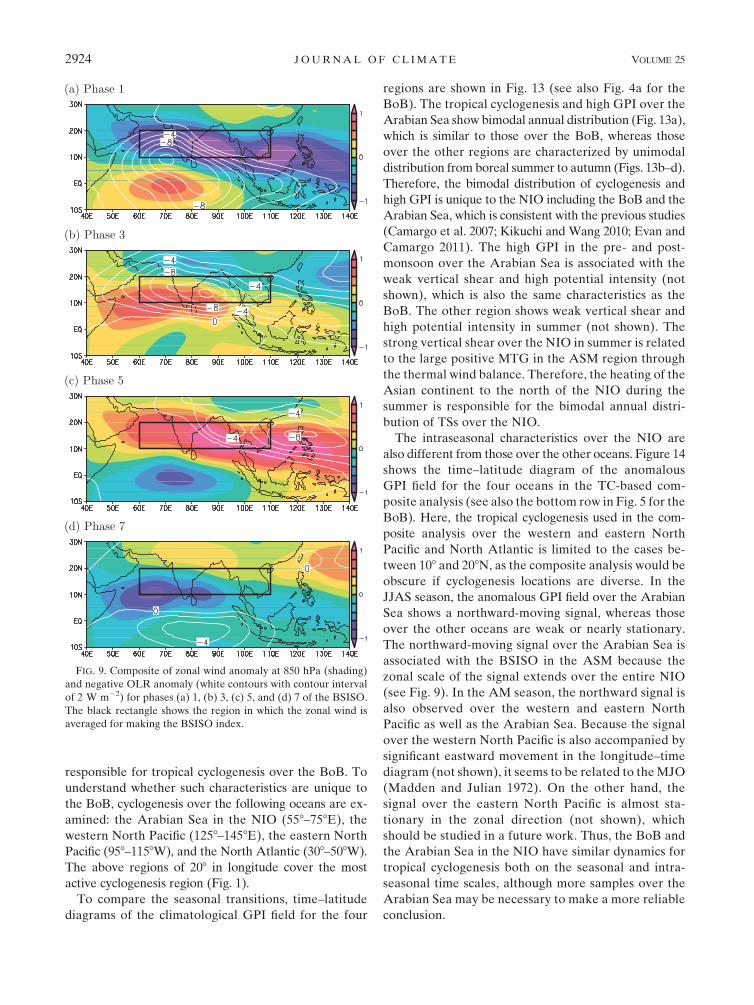
Fig. 2d) corresponds to the ASM season. To minimize
the influence of the TC itself on the BSISO signal, the
zonal wind is averaged in the large area (108–208N and
608–1108E; the rectangle in Fig. 9), which is determined
based on the structure of the BSISO shown in the pre-
vious studies (Murakami and Nakazawa 1985; Goswami
and Mohan 2001). Figure 8a shows the time series of the
BSISO index in 2008. Each minimum–maximum–
minimum cycle is divided into eight phases in the following
FIG. 6. As in Fig. 5 but for zonal wind at 850 hPa.
15 APRIL 2012 Y A N A S E E T A L . 2921

manner (Fig. 8b): phases 1–4 (5–8) are defined by sepa-
rating the period between the first minimum and the
maximum (between the maximum to the next minimum)
evenly. If the amplitude of the signal (the half of the
difference between a maximum and a minimum) is less
than one standard deviation, the period is not analyzed
because of the weak BSISO. Composite of the environ-
mental fields (spatially and temporally filtered data as
described in section 2) and count of cyclogenesis are
performed for each phase of the BSISO.
Figure 9 shows composite patterns of zonal wind at
850 hPa and OLR for phases 1, 3, 5, and 7. In phase 1,
FIG. 7. As in Figs. 5g,h,i but for the anomalous fields of (a)–(c) absolute vorticity at 850 hPa (1025 s21), (d)–(f) vertical shear
[m s21(650 hPa)21], (g)–(i) potential intensity (m s21), and (j)–(l) relative humidity at 600 hPa (%).
2922 J O U R N A L O F C L I M A T E VOLUME 25

a westerly anomaly is observed near the equator over the
Indian Ocean, and active convection (negative OLR)
occurs to the north of the westerly axis. From phases 1 to
5, the westerly axis and active convection shift northward
from the equator to the BoB. In phase 7, the westerly axis
almost disappears over the Indian Ocean, which is the
end of a BSISO cycle.
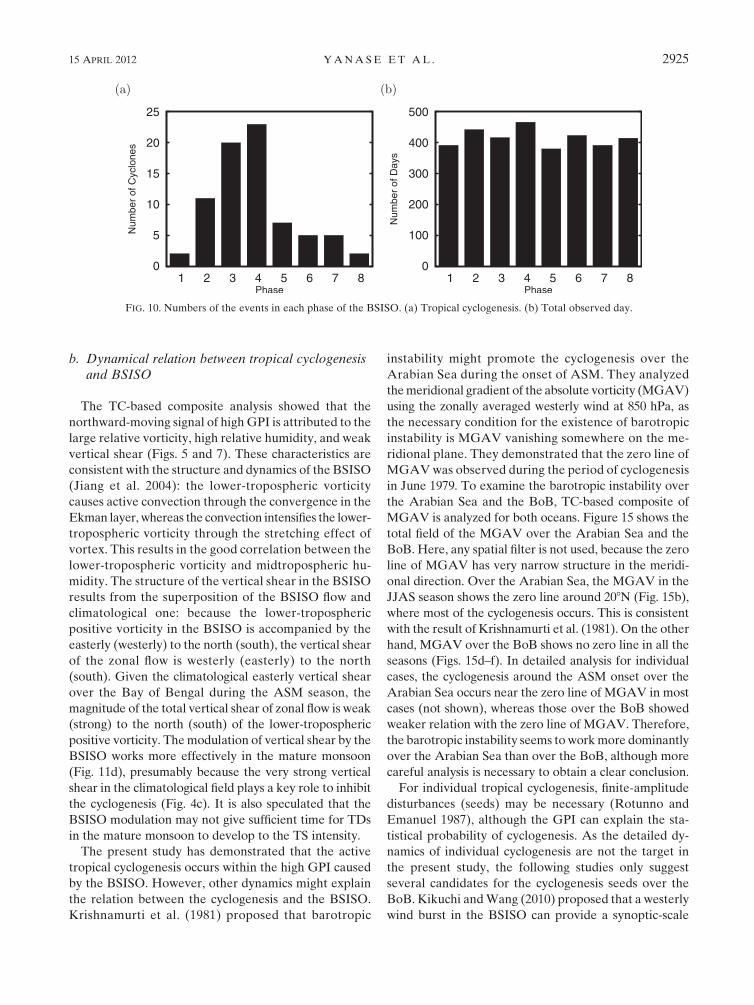
Figure 10a shows the number of tropical cyclogeneses
for each phase. The cyclogenesis is significantly modu-
lated by the phase of the BSISO: the number of cyclo-
geneses in phases 3 and 4 are 20 and 23, respectively,
whereas those in phases 1 and 8 are only 2. Phases 3 and
4 are characterized by active convection over the BoB
(Fig. 9b). This is consistent with the result of Kikuchi
and Wang (2010) using an extended empirical orthogo-
nal function (EEOF) for the BSISO definition. As the
numbers of analyzed days are not much different be-
tween the phases (approximately 392–467 days; Fig. 10b),
the difference in cyclogenesis numbers between the
phases is attributed to the BSISO dynamics. For the weak
BSISO period, the number of cyclogenesis is 21 for 1638
analyzed days. This frequency (0.013 events per day) is
nearly the same as those for phases 5–7.
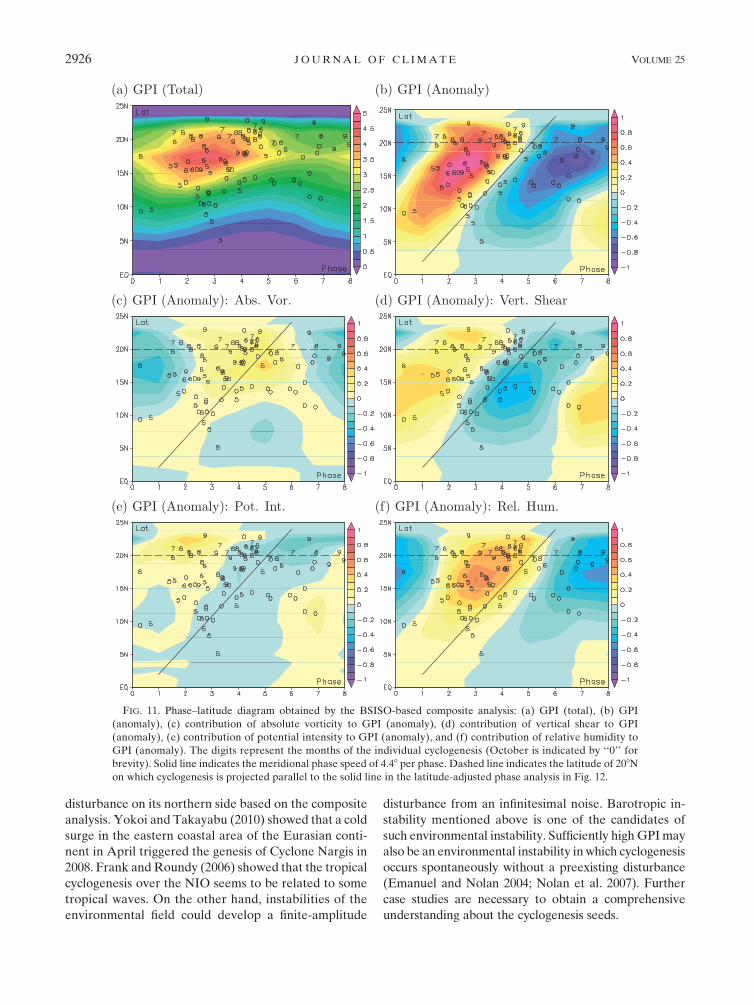
The phase–latitude diagrams of GPI and its four fac-
tors in the BSISO-based composite analysis are shown in
Fig. 11 together with the months of the cyclogenesis
(digits in the figure). The total GPI is largest from phases
2 to 4 between 158 and 208N, where the cyclogenesis is
active (Fig. 11a). The anomalous field of GPI shows a
positive signal moving northward from phases 1 to 4
(Fig. 11a). The cyclogenesis is active around the positive
region of GPI anomaly, although the timing seems to be
delayed by ;1 phase. This lag may indicate the time
during which a TC grows gradually. To assess the in-
dividual contributions of the four GPI factors quanti-
tatively, the GPI is recalculated using the climatological
fields (1982–2008) of three out of the four factors, but
using the unmodified daily fields of the target factor (cf.
Camargo et al. 2009). Figures 11c–f show the contribu-
tion of the four factors to the GPI anomaly. The relative
humidity dominantly contributes to the high GPI. The
absolute vorticity changes in a similar manner to the
relative humidity, although the contribution is relatively
small. The GPI anomaly caused by vertical shear is
accompanied more by the cyclogenesis from June to
September than by those in May and October (Fig. 11d),
which is consistent with the result of TC-based composite
analysis (Fig. 7e).
As the sign of GPI anomaly in a BSISO phase also
changes in the meridional direction, the analysis is more
effective if the BSISO phase is adjusted based on the
latitude. Therefore, all the cyclogeneses are moved to
the latitude of 208N (the dashed line in Fig. 11) along the
line parallel to the northward movement of the BSISO
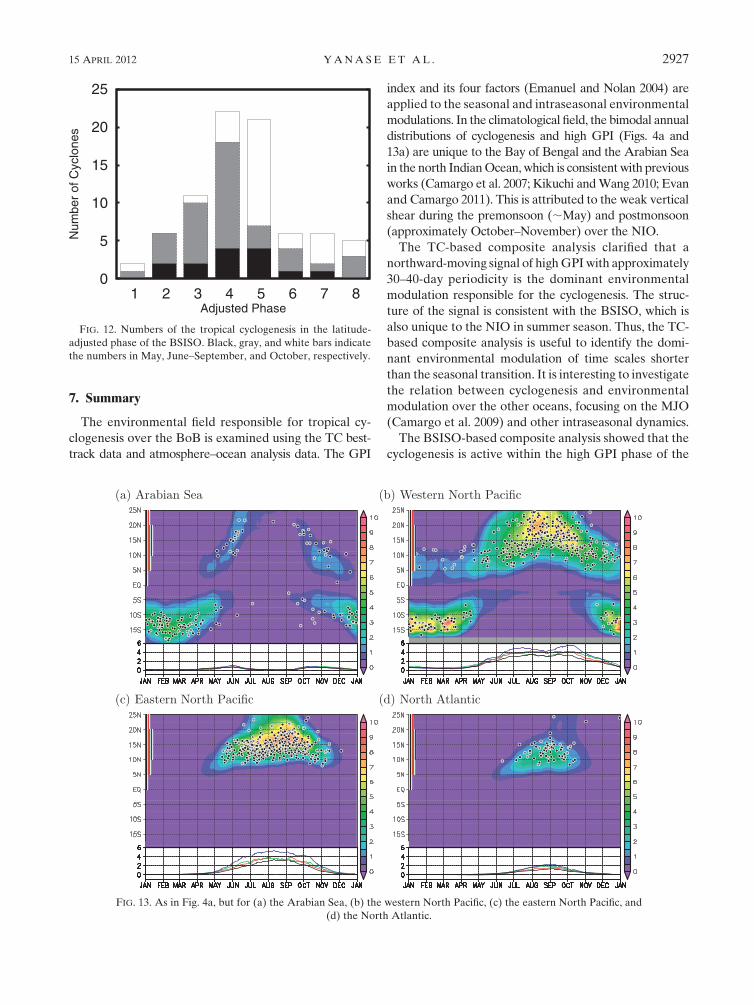
signal (the solid line in Fig. 11). Figure 12 shows the cy-
clogenesis number recalculated in the latitude-adjusted
BSISO phases. The cyclogenesis distribution with the
peak around phase 4 in the adjusted phase is more sym-
metric than that in the original BSISO phase (Fig. 10a).
The ratio of cyclogenesis from June to September (gray
bars) is high between phases 2 and 4, whereas those in
May and October (black and white bars, respectively) are
high between phases 4 and 7. This indicates that the cy-
clogenesis in the mature monsoon occur in an earlier
phase (or farther north relative to the BSISO phase) than
those in the pre- and postmonsoon. Thus, the cyclogen-
esis in the mature monsoon prefers the BSISO phase that
reduces the vertical shear effectively.
6. Discussion
a. Comparison with other oceans
The previous sections described the seasonal and
intraseasonal characteristics of the environmental field
FIG. 8. Time series of 30–60-day bandpath-filtered zonal wind at 850 hPa averaged in the region (108–208N,
608–1108E). (a) Time series in 2008. (b) Definition of eight phases of the BSISO.
15 APRIL 2012 Y A N A S E E T A L . 2923
responsible for tropical cyclogenesis over the BoB. To
understand whether such characteristics are unique to
the BoB, cyclogenesis over the following oceans are ex-
amined: the Arabian Sea in the NIO (558–758E), the
western North Pacific (1258–1458E), the eastern North
Pacific (958–1158W), and the North Atlantic (308–508W).
The above regions of 208 in longitude cover the most
active cyclogenesis region (Fig. 1).
To compare the seasonal transitions, time–latitude
diagrams of the climatological GPI field for the four
regions are shown in Fig. 13 (see also Fig. 4a for the
BoB). The tropical cyclogenesis and high GPI over the
Arabian Sea show bimodal annual distribution (Fig. 13a),
which is similar to those over the BoB, whereas those
over the other regions are characterized by unimodal
distribution from boreal summer to autumn (Figs. 13b–d).
Therefore, the bimodal distribution of cyclogenesis and
high GPI is unique to the NIO including the BoB and the
Arabian Sea, which is consistent with the previous studies
(Camargo et al. 2007; Kikuchi and Wang 2010; Evan and
Camargo 2011). The high GPI in the pre- and post-
monsoon over the Arabian Sea is associated with the
weak vertical shear and high potential intensity (not
shown), which is also the same characteristics as the
BoB. The other region shows weak vertical shear and
high potential intensity in summer (not shown). The
strong vertical shear over the NIO in summer is related
to the large positive MTG in the ASM region through
the thermal wind balance. Therefore, the heating of the
Asian continent to the north of the NIO during the
summer is responsible for the bimodal annual distri-
bution of TSs over the NIO.
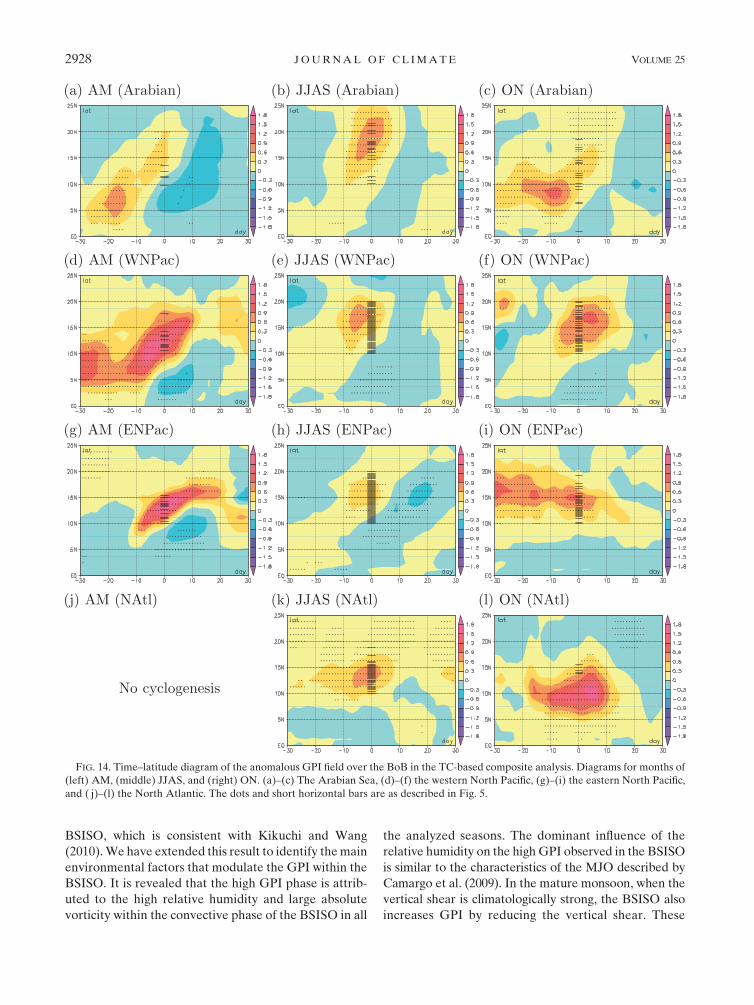
The intraseasonal characteristics over the NIO are
also different from those over the other oceans. Figure 14
shows the time–latitude diagram of the anomalous
GPI field for the four oceans in the TC-based com-
posite analysis (see also the bottom row in Fig. 5 for the
BoB). Here, the tropical cyclogenesis used in the com-
posite analysis over the western and eastern North
Pacific and North Atlantic is limited to the cases be-
tween 108 and 208N, as the composite analysis would be
obscure if cyclogenesis locations are diverse. In the
JJAS season, the anomalous GPI field over the Arabian
Sea shows a northward-moving signal, whereas those
over the other oceans are weak or nearly stationary.
The northward-moving signal over the Arabian Sea is
associated with the BSISO in the ASM because the
zonal scale of the signal extends over the entire NIO
(see Fig. 9). In the AM season, the northward signal is
also observed over the western and eastern North
Pacific as well as the Arabian Sea. Because the signal
over the western North Pacific is also accompanied by
significant eastward movement in the longitude–time
diagram (not shown), it seems to be related to the MJO
(Madden and Julian 1972). On the other hand, the
signal over the eastern North Pacific is almost sta-
tionary in the zonal direction (not shown), which
should be studied in a future work. Thus, the BoB and
the Arabian Sea in the NIO have similar dynamics for
tropical cyclogenesis both on the seasonal and intra-
seasonal time scales, although more samples over the
Arabian Sea may be necessary to make a more reliable
conclusion.
FIG. 9. Composite of zonal wind anomaly at 850 hPa (shading)
and negative OLR anomaly (white contours with contour interval
of 2 W m22) for phases (a) 1, (b) 3, (c) 5, and (d) 7 of the BSISO.
The black rectangle shows the region in which the zonal wind is
averaged for making the BSISO index.
2924 J O U R N A L O F C L I M A T E VOLUME 25
b. Dynamical relation between tropical cyclogenesisand BSISO
The TC-based composite analysis showed that the
northward-moving signal of high GPI is attributed to the
large relative vorticity, high relative humidity, and weak
vertical shear (Figs. 5 and 7). These characteristics are
consistent with the structure and dynamics of the BSISO
(Jiang et al. 2004): the lower-tropospheric vorticity
causes active convection through the convergence in the
Ekman layer, whereas the convection intensifies the lower-
tropospheric vorticity through the stretching effect of
vortex. This results in the good correlation between the
lower-tropospheric vorticity and midtropospheric hu-
midity. The structure of the vertical shear in the BSISO
results from the superposition of the BSISO flow and
climatological one: because the lower-tropospheric
positive vorticity in the BSISO is accompanied by the
easterly (westerly) to the north (south), the vertical shear
of the zonal flow is westerly (easterly) to the north
(south). Given the climatological easterly vertical shear
over the Bay of Bengal during the ASM season, the
magnitude of the total vertical shear of zonal flow is weak
(strong) to the north (south) of the lower-tropospheric
positive vorticity. The modulation of vertical shear by the
BSISO works more effectively in the mature monsoon
(Fig. 11d), presumably because the very strong vertical
shear in the climatological field plays a key role to inhibit
the cyclogenesis (Fig. 4c). It is also speculated that the
BSISO modulation may not give sufficient time for TDs
in the mature monsoon to develop to the TS intensity.
The present study has demonstrated that the active
tropical cyclogenesis occurs within the high GPI caused
by the BSISO. However, other dynamics might explain
the relation between the cyclogenesis and the BSISO.
Krishnamurti et al. (1981) proposed that barotropic
instability might promote the cyclogenesis over the
Arabian Sea during the onset of ASM. They analyzed
the meridional gradient of the absolute vorticity (MGAV)
using the zonally averaged westerly wind at 850 hPa, as
the necessary condition for the existence of barotropic
instability is MGAV vanishing somewhere on the me-
ridional plane. They demonstrated that the zero line of
MGAV was observed during the period of cyclogenesis
in June 1979. To examine the barotropic instability over
the Arabian Sea and the BoB, TC-based composite of
MGAV is analyzed for both oceans. Figure 15 shows the
total field of the MGAV over the Arabian Sea and the
BoB. Here, any spatial filter is not used, because the zero
line of MGAV has very narrow structure in the meridi-
onal direction. Over the Arabian Sea, the MGAV in the
JJAS season shows the zero line around 208N (Fig. 15b),
where most of the cyclogenesis occurs. This is consistent
with the result of Krishnamurti et al. (1981). On the other
hand, MGAV over the BoB shows no zero line in all the
seasons (Figs. 15d–f). In detailed analysis for individual
cases, the cyclogenesis around the ASM onset over the
Arabian Sea occurs near the zero line of MGAV in most
cases (not shown), whereas those over the BoB showed
weaker relation with the zero line of MGAV. Therefore,
the barotropic instability seems to work more dominantly
over the Arabian Sea than over the BoB, although more
careful analysis is necessary to obtain a clear conclusion.
For individual tropical cyclogenesis, finite-amplitude
disturbances (seeds) may be necessary (Rotunno and
Emanuel 1987), although the GPI can explain the sta-
tistical probability of cyclogenesis. As the detailed dy-
namics of individual cyclogenesis are not the target in
the present study, the following studies only suggest
several candidates for the cyclogenesis seeds over the
BoB. Kikuchi and Wang (2010) proposed that a westerly
wind burst in the BSISO can provide a synoptic-scale
FIG. 10. Numbers of the events in each phase of the BSISO. (a) Tropical cyclogenesis. (b) Total observed day.
15 APRIL 2012 Y A N A S E E T A L . 2925
disturbance on its northern side based on the composite
analysis. Yokoi and Takayabu (2010) showed that a cold
surge in the eastern coastal area of the Eurasian conti-
nent in April triggered the genesis of Cyclone Nargis in
2008. Frank and Roundy (2006) showed that the tropical
cyclogenesis over the NIO seems to be related to some
tropical waves. On the other hand, instabilities of the
environmental field could develop a finite-amplitude
disturbance from an infinitesimal noise. Barotropic in-
stability mentioned above is one of the candidates of
such environmental instability. Sufficiently high GPI may
also be an environmental instability in which cyclogenesis
occurs spontaneously without a preexisting disturbance
(Emanuel and Nolan 2004; Nolan et al. 2007). Further
case studies are necessary to obtain a comprehensive
understanding about the cyclogenesis seeds.
FIG. 11. Phase–latitude diagram obtained by the BSISO-based composite analysis: (a) GPI (total), (b) GPI
(anomaly), (c) contribution of absolute vorticity to GPI (anomaly), (d) contribution of vertical shear to GPI
(anomaly), (e) contribution of potential intensity to GPI (anomaly), and (f) contribution of relative humidity to
GPI (anomaly). The digits represent the months of the individual cyclogenesis (October is indicated by ‘‘0’’ for
brevity). Solid line indicates the meridional phase speed of 4.48 per phase. Dashed line indicates the latitude of 208N
on which cyclogenesis is projected parallel to the solid line in the latitude-adjusted phase analysis in Fig. 12.
2926 J O U R N A L O F C L I M A T E VOLUME 25
7. Summary
The environmental field responsible for tropical cy-
clogenesis over the BoB is examined using the TC best-
track data and atmosphere–ocean analysis data. The GPI
index and its four factors (Emanuel and Nolan 2004) are
applied to the seasonal and intraseasonal environmental
modulations. In the climatological field, the bimodal annual
distributions of cyclogenesis and high GPI (Figs. 4a and
13a) are unique to the Bay of Bengal and the Arabian Sea
in the north Indian Ocean, which is consistent with previous
works (Camargo et al. 2007; Kikuchi and Wang 2010; Evan
and Camargo 2011). This is attributed to the weak vertical
shear during the premonsoon (;May) and postmonsoon
(approximately October–November) over the NIO.
The TC-based composite analysis clarified that a
northward-moving signal of high GPI with approximately
30–40-day periodicity is the dominant environmental
modulation responsible for the cyclogenesis. The struc-
ture of the signal is consistent with the BSISO, which is
also unique to the NIO in summer season. Thus, the TC-
based composite analysis is useful to identify the domi-
nant environmental modulation of time scales shorter
than the seasonal transition. It is interesting to investigate
the relation between cyclogenesis and environmental
modulation over the other oceans, focusing on the MJO
(Camargo et al. 2009) and other intraseasonal dynamics.
The BSISO-based composite analysis showed that the
cyclogenesis is active within the high GPI phase of the
FIG. 12. Numbers of the tropical cyclogenesis in the latitude-
adjusted phase of the BSISO. Black, gray, and white bars indicate
the numbers in May, June–September, and October, respectively.
FIG. 13. As in Fig. 4a, but for (a) the Arabian Sea, (b) the western North Pacific, (c) the eastern North Pacific, and
(d) the North Atlantic.
15 APRIL 2012 Y A N A S E E T A L . 2927
BSISO, which is consistent with Kikuchi and Wang
(2010). We have extended this result to identify the main
environmental factors that modulate the GPI within the
BSISO. It is revealed that the high GPI phase is attrib-
uted to the high relative humidity and large absolute
vorticity within the convective phase of the BSISO in all
the analyzed seasons. The dominant influence of the
relative humidity on the high GPI observed in the BSISO
is similar to the characteristics of the MJO described by
Camargo et al. (2009). In the mature monsoon, when the
vertical shear is climatologically strong, the BSISO also
increases GPI by reducing the vertical shear. These
FIG. 14. Time–latitude diagram of the anomalous GPI field over the BoB in the TC-based composite analysis. Diagrams for months of
(left) AM, (middle) JJAS, and (right) ON. (a)–(c) The Arabian Sea, (d)–(f) the western North Pacific, (g)–(i) the eastern North Pacific,
and ( j)–(l) the North Atlantic. The dots and short horizontal bars are as described in Fig. 5.
2928 J O U R N A L O F C L I M A T E VOLUME 25

results propose that the combination of seasonal and
intraseasonal effects is important for the tropical cy-
clogenesis, rather than the independent effects.
Acknowledgments. We acknowledge helpful com-
ments by Dr. Tetsuo Nakazawa, Dr. Yukari Takayabu,
Dr. Satoru Yokoi, Dr. Amato T. Evan, Dr. Suzana
J. Camargo, and three anonymous reviewers. The best-
track data was obtained from the IBTrACS website. The
atmosphere and ocean datasets made use of JRA-25/
JCDAS reanalysis, NOAA OI-SST reanalysis, and NOAA
OLR data. Potential intensity was calculated using the
FORTRAN program from the website of Dr. Kerry
Emanuel. This research was supported by Core Research
for Evolutional Science and Technology, Japan Science
and Technology Agency (CREST, JST), and Grants-in-
Aid for Scientific Research 20740266 and 23740349.
REFERENCES
Bister, M., and K. A. Emanuel, 2002: Low frequency variability of
tropical cyclone potential intensity 1. Interannual to inter-
decadal variability. J. Geophys. Res., 107, 4801, doi:10.1029/
2001JD000776.
Camargo, S. J., K. A. Emanuel, and A. H. Sobel, 2007: Use of
a genesis potential index to diagnose ENSO effects on tropical
cyclone genesis. J. Climate, 20, 4819–4834.
——, M. C. Wheeler, and A. H. Sobel, 2009: Diagnosis of the MJO
modulation of tropical cyclogenesis using an empirical index.
J. Atmos. Sci., 66, 3061–3074.
Emanuel, K. A., and D. S. Nolan, 2004: Tropical cyclone activity
and global climate. Proc. 26th Conf. on Hurricanes and
Tropical Meteorology, Miami, FL, Amer. Meteor. Soc.,
240–241.
Evan, A. T., and S. J. Camargo, 2011: A climatology of Arabian
Sea cyclonic storms. J. Climate, 24, 140–158.
Frank, W. M., and P. E. Roundy, 2006: The role of tropical
waves in tropical cyclogenesis. Mon. Wea. Rev., 134, 2397–
2417.
Fritz, H. M., C. D. Blount, S. Thwin, M. K. Thu, and N. Chan, 2009:
Cyclone Nargis storm surge in Myanmar. Nat. Geosci., 2, 448–
449, doi:10.1038/ngeo558.
Goswami, B. N., and R. S. A. Mohan, 2001: Intraseasonal oscilla-
tions and interannual variability of Indian summer monsoon.
J. Climate, 14, 1180–1198.
——, R. S. Ajayamohan, P. K. Xaviers, and D. Sengupta, 2003:
Clustering of synoptic activity by Indian summer monsoon
intraseasonal oscillations. Geophys. Res. Lett., 30, 1431, doi:
10.1029/2002GL016734.
Gray, W. M., 1975: Tropical cyclone genesis. Colorado State
University, Department of Atmospheric Science Paper 234,
121 pp.
Jiang, X., T. Li, and B. Wang, 2004: Structures and mechanisms of
the northward propagating boreal summer intraseasonal os-
cillation. J. Climate, 17, 1022–1039.
Kikuchi, K., and B. Wang, 2010: Formation of Nargis (2008) and
tropical cyclones in the northern Indian Ocean associated with
with tropical intraseasonal oscillation. J. Meteor. Soc. Japan,
88, 475–496.
Knapp, K. R., M. C. Kruk, D. H. Levinson, H. J. Diamond, and
C. J. Neumann, 2010: The International Best Track Archive
for Climate Stewardship (IBTrACS) unifying tropical cyclone
data. Bull. Amer. Meteor. Soc., 91, 363–376.
FIG. 15. Time–latitude diagram of the total MGAV field (10211 m21 s21) in the TC-based composite. Diagrams for months of (left) AM,
(middle) JJAS, and (right) ON. (a)–(c) The Arabian Sea and (d)–(f) the BoB. The short horizontal bars are as described in Fig. 5.
15 APRIL 2012 Y A N A S E E T A L . 2929
Krishnamurthy, V., and R. S. Ajayamohan, 2010: Composite
structure of monsoon low pressure systems and its relation to
Indian rainfall. J. Climate, 23, 4285–4305.
Krishnamurti, T. N., P. Ardanuy, Y. Ramanathan, and R. Pasch,
1981: On the onset vortex of the summer monsoon. Mon. Wea.
Rev., 109, 344–363.
Kurihara, Y., M. A. Bender, and R. J. Ross, 1993: An initialization
scheme of hurricane models by vortex specification. Mon.
Wea. Rev., 121, 2030–2045.
Madden, R. A., and P. R. Julian, 1972: Description of global cir-
culation cells in the tropics with a 40–45 day period. J. Atmos.
Sci., 29, 1109–1123.
Mao, J., and G. Wu, 2007: Interannual variability in the onset of the
summer monsoon over the eastern Bay of Bengal. Theor.
Appl. Climatol., 89, 155–170.
Murakami, T., and T. Nakazawa, 1985: Tropical 45 day oscillations
during the 1979 Northern Hemisphere summer. J. Atmos. Sci.,
42, 1107–1122.
——, ——, and J. He, 1984: On the 40–50 day oscillations during
the 1979 Northern Hemisphere summer. Part I: Phase prop-
agation. J. Meteor. Soc. Japan, 62, 440–468.
Nolan, D. S., E. D. Rappin, and K. A. Emanuel, 2007: Tropical
cyclogenesis sensitivity to environmental parameters in
radiative–convective equilibrium. Quart. J. Roy. Meteor.
Soc., 133, 2085–2107.
Onogi, K. J., and Coauthors, 2007: The JRA-25 Reanalysis.
J. Meteor. Soc. Japan, 85, 369–432.
Reynolds, R. W., N. A. Rayner, T. M. Smith, D. C. Stokes, and
W. Wang, 2002: An improved in situ and satellite SST analysis
for climate. J. Climate, 15, 1609–1625.
Rotunno, R., and K. A. Emanuel, 1987: An air–sea interaction
theory for tropical cyclones. Part II: Evolutionary study using
a nonhydrostatic axisymmetric numerical model. J. Atmos.
Sci., 44, 542–561.
Webster, P. J., 2008: Myanmar’s deadly daffodil. Nat. Geosci., 1,488–490.
Yanase, W., H. Taniguchi, and M. Satoh, 2010: The genesis of
tropical cyclone Nargis (2008): Environmental modulation
and numerical predictability. J. Meteor. Soc. Japan, 88, 497–
519.
Yasunari, T., 1981: Structure of an Indian summer monsoon sys-
tem with around 40-day period. J. Meteor. Soc. Japan, 59,336–354.
Yokoi, S., and Y. Takayabu, 2010: Environmental and external
factors of tropical cyclone Nargis in April 2008 over the Bay of
Bengal. J. Meteor. Soc. Japan, 88, 425–435.
2930 J O U R N A L O F C L I M A T E VOLUME 25