Embed Size (px)
Citation preview
Deep-Sea Research II ] (]]]]) ]]]–]]]
Contents lists available at ScienceDirect
Deep-Sea Research II
0967-06
http://d
n Corr
E-m
PleasII (20
journal homepage: www.elsevier.com/locate/dsr2
Seasonal and interannual variability in Gulf of Maine hydrodynamics:2002–2011
Yizhen Li a, Ruoying He a,n, Dennis J. McGillicuddy Jr.b
a Department of Marine, Earth and Atmospheric Sciences, North Carolina State University, NC, USAb Department of Applied Ocean Physics and Engineering, Woods Hole Oceanographic Institution, MA, USA
a r t i c l e i n f o
Keywords:
Gulf of Maine
Upwelling index
River discharge
Hydrography
Interannual variability
45/$ - see front matter & 2013 Elsevier Ltd. A
x.doi.org/10.1016/j.dsr2.2013.03.001
esponding author. Tel.: þ919 513 0249; fax:
ail address: [email protected] (R. He).
e cite this article as: Li, Y., et al., Seas13), http://dx.doi.org/10.1016/j.dsr2
a b s t r a c t
In situ observations including long-term moored meteorological and oceanographic measurements and
multi-year gulf-wide ship survey data are used to quantify interannual variability of surface wind, river
runoff, and hydrographic conditions in the Gulf of Maine during summers 2002–2011. The cumulative
upwelling index shows that upwelling (downwelling)-favorable wind conditions were most persistent
in 2010 (2005) over the 10-year study period. River discharge was highest in 2005; peak runoff
occurred in early April in 2010 as opposed to late April to middle May in other years. Moored time
series show that coastal water temperature was 0.5–2 1C warmer than average in summer 2010, and
about 2 1C colder than average in 2004. Coastal salinity in April 2010 was the lowest in the 10-year
study period. Both moored Acoustic Doppler Current Profiler (ADCP) current measurements and
dynamic height/geostrophic velocity calculations based on gulf-wide ship survey data show May–June
2010 had one of the weakest alongshore transports in the western Gulf of Maine during the 10-year
study period, likely associated with intrusions of warm slope water and fresher-than-usual Scotian
Shelf water. Comparisons of coastal currents to the Paralytic Shellfish Poisoning (PSP) closure maps
resulting from Alexandrium fundyense blooms suggest a linkage between alongshore transport and the
downstream extent of toxicity.
& 2013 Elsevier Ltd. All rights reserved.
1. Introduction
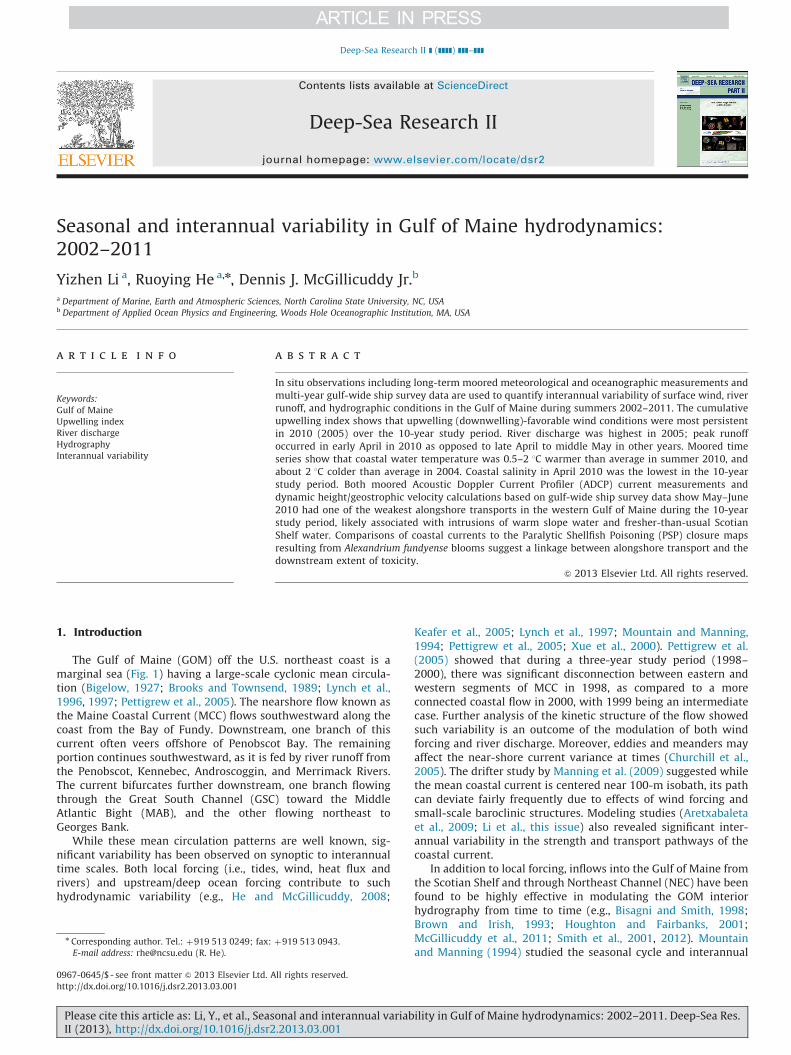
The Gulf of Maine (GOM) off the U.S. northeast coast is amarginal sea (Fig. 1) having a large-scale cyclonic mean circula-tion (Bigelow, 1927; Brooks and Townsend, 1989; Lynch et al.,1996, 1997; Pettigrew et al., 2005). The nearshore flow known asthe Maine Coastal Current (MCC) flows southwestward along thecoast from the Bay of Fundy. Downstream, one branch of thiscurrent often veers offshore of Penobscot Bay. The remainingportion continues southwestward, as it is fed by river runoff fromthe Penobscot, Kennebec, Androscoggin, and Merrimack Rivers.The current bifurcates further downstream, one branch flowingthrough the Great South Channel (GSC) toward the MiddleAtlantic Bight (MAB), and the other flowing northeast toGeorges Bank.
While these mean circulation patterns are well known, sig-nificant variability has been observed on synoptic to interannualtime scales. Both local forcing (i.e., tides, wind, heat flux andrivers) and upstream/deep ocean forcing contribute to suchhydrodynamic variability (e.g., He and McGillicuddy, 2008;
ll rights reserved.
þ919 513 0943.
onal and interannual variab.2013.03.001i
Keafer et al., 2005; Lynch et al., 1997; Mountain and Manning,1994; Pettigrew et al., 2005; Xue et al., 2000). Pettigrew et al.(2005) showed that during a three-year study period (1998–2000), there was significant disconnection between eastern andwestern segments of MCC in 1998, as compared to a moreconnected coastal flow in 2000, with 1999 being an intermediatecase. Further analysis of the kinetic structure of the flow showedsuch variability is an outcome of the modulation of both windforcing and river discharge. Moreover, eddies and meanders mayaffect the near-shore current variance at times (Churchill et al.,2005). The drifter study by Manning et al. (2009) suggested whilethe mean coastal current is centered near 100-m isobath, its pathcan deviate fairly frequently due to effects of wind forcing andsmall-scale baroclinic structures. Modeling studies (Aretxabaletaet al., 2009; Li et al., this issue) also revealed significant inter-annual variability in the strength and transport pathways of thecoastal current.
In addition to local forcing, inflows into the Gulf of Maine fromthe Scotian Shelf and through Northeast Channel (NEC) have beenfound to be highly effective in modulating the GOM interiorhydrography from time to time (e.g., Bisagni and Smith, 1998;Brown and Irish, 1993; Houghton and Fairbanks, 2001;McGillicuddy et al., 2011; Smith et al., 2001, 2012). Mountainand Manning (1994) studied the seasonal cycle and interannual
ility in Gulf of Maine hydrodynamics: 2002–2011. Deep-Sea Res.
39
40
41
42
43
44
45
462005 OC412
B
EI
M
N
Penobscot BayNova Sacoti
Cape Ann Wilkinson Basin
Jordan Basin
Gre
at S
outh
Cha
nnel
Northeast Chnnel
Continental S
lopeSco
tian Shelf
St.John R.
Penobscot R.
Merrimack R.
Androscoggin R.
Kennebec R.
2006 OC425
−72 −71 −70 −69 −68 −67 −66 −65 −6439
40
41
42
43
44
45
462007 EN435/437EN 435EN 437
−72 −71 −70 −69 −68 −67 −66 −65 −64
2010 OC460/EN476/OC465/OC467OC 460EN 476OC 465OC 467
Casco Bay
Bay of Fundy
Mass Bay
Cape Cod
Fig. 1. Locations of the NERACOOS buoys (pink squares) and CTD stations (red dots) of gulf-wide ship surveys (A) Oceanus 412 in 2005, (B) Oceanus 425 in 2006,
(C) Endeavor 435/437 in 2007 and Oceanus (D) 460/465/467 and Endeavor 476 in 2010, respectively. Also shown is the 200-m isobath. The blue solid line indicates the
transect off Casco Bay that is used for computing alongshore transport shown in Table 1. (For interpretation of the references to colour in this figure legend, the reader is
referred to the web version of this article.)
Y. Li et al. / Deep-Sea Research II ] (]]]]) ]]]–]]]2
variability in coastal hydrography. In the eastern Gulf the salinitycycle is dominated by the winter influx of low salinity ScotianShelf water, as opposed to that in the western Gulf, which isheavily influenced by the local runoff in spring. Because of thephase differences in temperature and salinity cycles, the westernGOM is more stratified in spring and summer. On decadal timescales, there was less variability in temperature (1–2 1C) duringthe period 1977–1987, compared to observed fluctuations of4–6 1C in 1960s. Further analysis confirmed that the temperaturevariability was driven by both local heat flux and boundaryinflows with an advective origin (Mountain et al., 1996).Townsend et al. (2010) found lower nitrate but higher silicateconcentrations in the GOM interior beginning in the 1970s, likelydue to increased freshwater inflow from the Scotian Shelf. Assuch, the coastal current system in recent decades is comprised ofa greater portion of relatively nutrient-poor, cold shelf waters andless of the nutrient-rich, warm slope waters that were previouslythought to dominate the nutrient flux into the gulf.
Long-term moored meteorological and oceanographic obser-vations (with hydrographic observations becoming available inJuly 2001) taken by a regional marine buoy network, along withmulti-year gulf-wide ship surveys of the Gulf of Maine Toxicity(GOMTOX) project and predecessor programs, have provided anew opportunity to quantify the interannual variability of theGOM hydrodynamics in recent years. Focusing on the late springand summer periods (April 1–August 1), we use these observa-tions to investigate the interannual variations in local windforcing, river discharge, and the gulf-wide hydrographic
Please cite this article as: Li, Y., et al., Seasonal and interannual variabII (2013), http://dx.doi.org/10.1016/j.dsr2.2013.03.001i
conditions during 2002–2011. One of our objectives is to providean updated knowledge of regional coastal hydrography that cancomplement Pettigrew et al. (2005) and other earlier studies(which were based on ship survey data and Gulf of Maine OceanObserving System observations prior to 2005), and discuss thepossible causes to such variability during the past 10 years. Inaddition, a number of earlier studies have illustrated that changesin atmospheric forcing, gulf hydrography and coastal circulationhave significant impacts on the timing and magnitude of annually-occurring Alexandrium fundyense blooms and shellfish toxicity inthe gulf (e.g., Anderson et al., 2005; He et al., 2008; Li et al., 2009;McGillicuddy et al., 2011; Thomas et al., 2010). In this regard, aparticular motivation of this research is to better quantify theseasonal and interannual variations in the Gulf of Maine hydro-dynamics to provide a foundation for understanding the intrinsiclinkage between regional hydrodynamics, A. fundyense blooms, andthe distribution of the associated toxicity along the coast.
2. Methods
The majority of long-term time series observations used in thisstudy during 2002–2011 were obtained from moorings of the Gulfof Maine Ocean Observing System (now part of the NortheasternRegional Association of Coastal and Ocean Observation Systems[NERACOOS], http://www.neracoos.org, e.g., Pettigrew et al.,2011), including hourly observations of surface wind speed anddirection, ocean temperature, salinity and velocity. We focused on
ility in Gulf of Maine hydrodynamics: 2002–2011. Deep-Sea Res.
Y. Li et al. / Deep-Sea Research II ] (]]]]) ]]]–]]] 3
temperature and salinity measured by buoys B and E in thewestern GOM coastal region, and buoy I in the eastern GOMcoastal region. Both areas are primary habitats of A. fundyense
(Anderson et al., 2005; Stock et al., 2005) and where onshoreshellfish bed closures regularly occur. Buoys M and N documentvariability in Jordan Basin and the Northeast Channel, respec-tively, which provides important information about offshoreforcing that impacts the coastal region (Fig. 1A, pink squares).
01−Apr 01−May 01−Jun 01−Jul 01−Aug−20
−15
−10
−5
0
5
10
15
20
Cum
ulat
ive
Upw
ellin
g In
dex
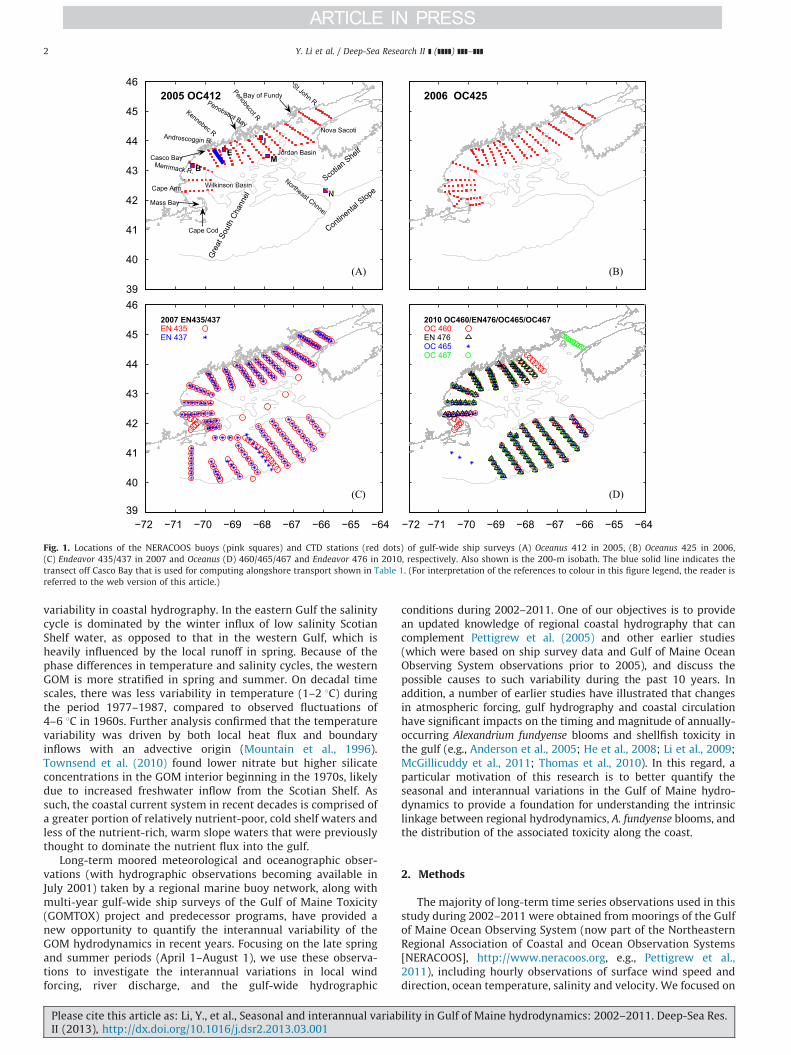
Fig. 2. Time series of cumulative upwelling indices (CUI) for 2004–2011 at (A) WGOM b
the long-term mean CUI is shown in dashed gray line.
2002 2003 2004 2005 2006 2007 20080
2
4
6Apr
2002 2003 2004 2005 2006 2007 20080
2
4
6May
2002 2003 2004 2005 2006 2007 20080
2
4
6Jun
2002 2003 2004 2005 2006 2007 20080
2
4
6Jul
2002 2003 2004 2005 2006 2007 20080
5
10
15 April−July
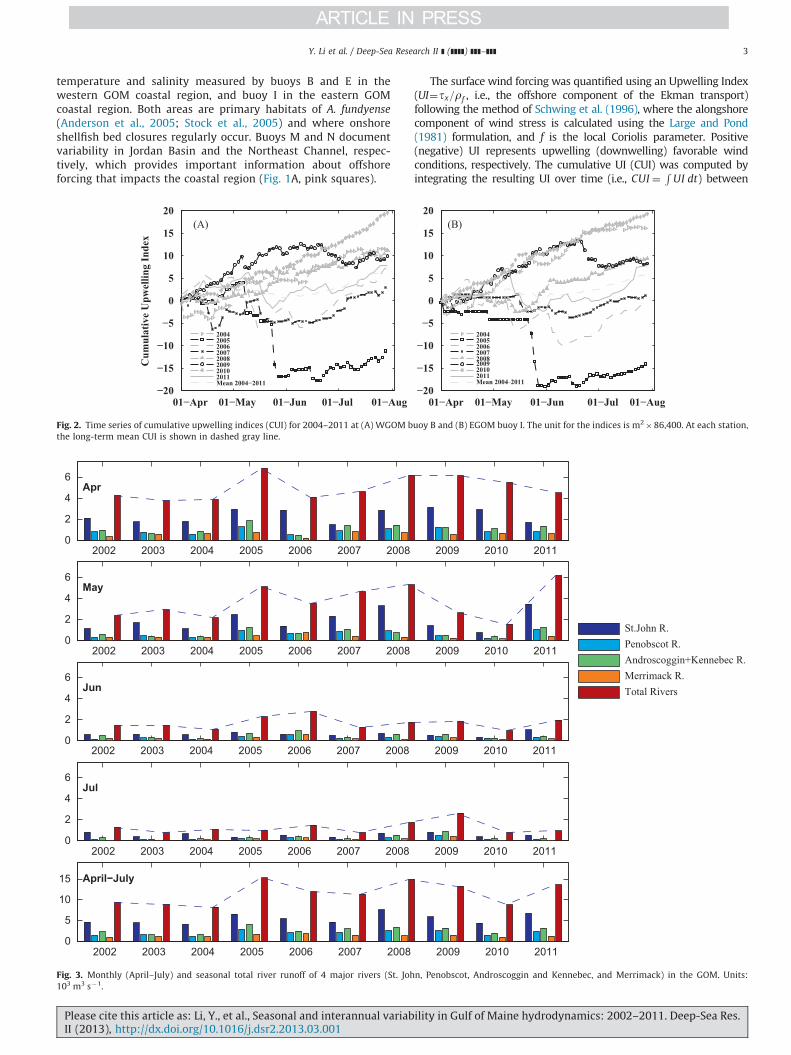
Fig. 3. Monthly (April–July) and seasonal total river runoff of 4 major rivers (St. Joh
103 m3 s�1.
Please cite this article as: Li, Y., et al., Seasonal and interannual variabII (2013), http://dx.doi.org/10.1016/j.dsr2.2013.03.001i
The surface wind forcing was quantified using an Upwelling Index(UI¼tx=rf , i.e., the offshore component of the Ekman transport)following the method of Schwing et al. (1996), where the alongshorecomponent of wind stress is calculated using the Large and Pond(1981) formulation, and f is the local Coriolis parameter. Positive(negative) UI represents upwelling (downwelling) favorable windconditions, respectively. The cumulative UI (CUI) was computed byintegrating the resulting UI over time (i.e., CUI¼
RUI dt) between
01−Apr 01−May 01−Jun 01−Jul 01−Aug−20
−15
−10
−5
0
5
10
15
20
uoy B and (B) EGOM buoy I. The unit for the indices is m2�86,400. At each station,
2009 2010 2011
2009 2010 2011
2009 2010 2011
2009 2010 2011
2009 2010 2011
St.John R.Penobscot R.Androscoggin+Kennebec R.Merrimack R.Total Rivers
n, Penobscot, Androscoggin and Kennebec, and Merrimack) in the GOM. Units:
ility in Gulf of Maine hydrodynamics: 2002–2011. Deep-Sea Res.

Y. Li et al. / Deep-Sea Research II ] (]]]]) ]]]–]]]4
April 1 and August 1 of each year. The slope of CUI is particularlyinformative, in that the most upwelling favorable wind conditions arerepresented by the steepest rising trend in CUI. In contrast, a decliningtrend in CUI indicates that downwelling favorable winds (negative UI)become more dominant.
For ocean temperature and salinity observations and densityprofiles, harmonic fitting was applied to derive their seasonalcycles. To define the mean seasonal cycles, a least-squaresharmonic fitting method was applied to hourly surface (2 m)temperature and salinity measurements at buoys such that
Sseasonal ¼ constþa sin ðotÞþb cos ðotÞ,
where t is time in days, o¼ 2p=365d�1, and a and b are fittingcoefficients of the harmonic signal.
Temperature and salinity observations collected during ship-board surveys in the summers of 2005, 2006, 2007, and 2010were also used to provide quasi-synoptic, gulf-wide hydrographicanalyses (Fig. 1A–D). Additionally, river runoff time series col-lected from five major rivers in the GOM (i.e., St. John, Penobscot,Androscoggin, Kennebec, and Merrimack rivers; Fig. 1A) wereconsidered. Daily discharge observations during 2002–2011 wereobtained from the United States Geological Survey (USGS) riverstation and water survey of Canada.
3. Results
3.1. Seasonal and interannual variability in wind forcing
The long-term (2002–2011) seasonal mean wind fields over theGOM exhibit a directional shift that typically occurs in April–May.
0
1
2
3
45
2004 2005 2006 2007
Merrimack River
0
1
2
3
45
Androscoggin+Kennebec River
0
1
2
3
45
Penobscot River
0
2
4
6
8
10St.John River
Fig. 4. Daily river discharge time series for the St. John, Penobscot, Androscoggin and K
months (February–August) of each year. Units: 103 m3 s�1.
Please cite this article as: Li, Y., et al., Seasonal and interannual variabII (2013), http://dx.doi.org/10.1016/j.dsr2.2013.03.001i
Northwesterly winds generally dominate the gulf in April. South-westerly winds then become prevailing starting in May, andcontinue as the season progresses. Such southwesterly winds favorcoastal upwelling circulation near the Maine coast. Earlier studies(e.g., Anderson et al., 2005; He and McGillicuddy, 2008) haveshown that outbreaks of consecutive strong northeasters canreverse the monthly mean wind field into downwelling favorablein some years (e.g., May 2005; also see Butman et al., 2008).
Significant interannual variability was revealed by CUI analyses onwind time series between April and August of 2004–2011 at buoy Bin the western GOM (WGOM) and buoy I in the eastern GOM (EGOM)(Fig. 2). Among all 8 years, 2010 strands out as the year with the mostpersistent upwelling-favorable wind conditions, whereas 2005 hadthe most downwelling-favorable wind. Indeed, a sharp decline in2005 CUI was associated with a series of strong northeasters thatoccurred in the month of May, as indicated earlier by He andMcGillicuddy (2008) and Butman et al. (2008).
Although the signals were not as strong as 2010, years 2004,2008 and 2009 were also characterized largely by upwelling-favorable winds, as shown by a generally rising trend in theirrespective CUI time series. CUIs for 2006, 2007, and 2011 wererelatively flat for most of the time period examined, suggestingthe mean alongshore wind stress was significantly weaker duringthese three years compared to the other years. We note temporalpatterns of CUIs at buoys B and I were generally very similarexcept during May–August of 2004 and June–July 2006. Somesub-regional wind field differences became apparent during thesetwo periods, such that surface winds were more downwellingfavorable in the EGOM than in the WGOM, as reflected in thesteeper declines in CUI at buoy I than buoy B. Such spatialheterogeneity may be explained by differences in storm tracks.
2008 2009 2010 2011
ennebec, and Merrimack rivers. Gray shaded areas indicate the spring and summer
ility in Gulf of Maine hydrodynamics: 2002–2011. Deep-Sea Res.
Y. Li et al. / Deep-Sea Research II ] (]]]]) ]]]–]]] 5
3.2. River discharge
River runoff is an important factor influencing the salinity anddensity structure of the coastal GOM, especially in the spring andsummer seasons (Brooks, 1994; Geyer et al., 2004; Keafer et al.,2005). Based on daily discharge observations of the St. John river,the Penobscot river, the Androscoggin/Kennebec river, and theMerrimack river (see Fig. 1 for their geographic locations), weconstructed monthly mean runoff time series in April, May, Juneand July for 2002–2011. The cumulative monthly runoff fromthese four rivers was also computed to represent the total fresh-water discharge into the gulf in each corresponding month(Fig. 3).
For each river, the runoff was the largest in April and May, andgenerally declined by 40–70% by June and July. Significantinterannual differences were seen in terms of monthly meanand total river discharge. In April, the largest monthly runoff(�7�103 m3 s�1) occurred in 2005, although the April runoffwas high in most other years. In May, the highest river dischargetook place in 2011, with the second highest in 2005. The largesttotal river runoff in the months of June and July happened in 2006and 2009, respectively. The total river runoff time series for theentire season (April–July) (Fig. 3, bottom panel) displayed asimilar pattern as those in the individual months. For 6 years(2005–2009 and 2011), the total river runoff was 50–100% largerthan those in 2002, 2003, 2004 and 2010.
2002 2003 2004 2005 2006 200702468
1012141618
B 2m
2002 2003 2004 2005 2006 200702468
10121416 E 2m
2002 2003 2004 2005 2006 20070
2
4
6
8
10
12 I 2m
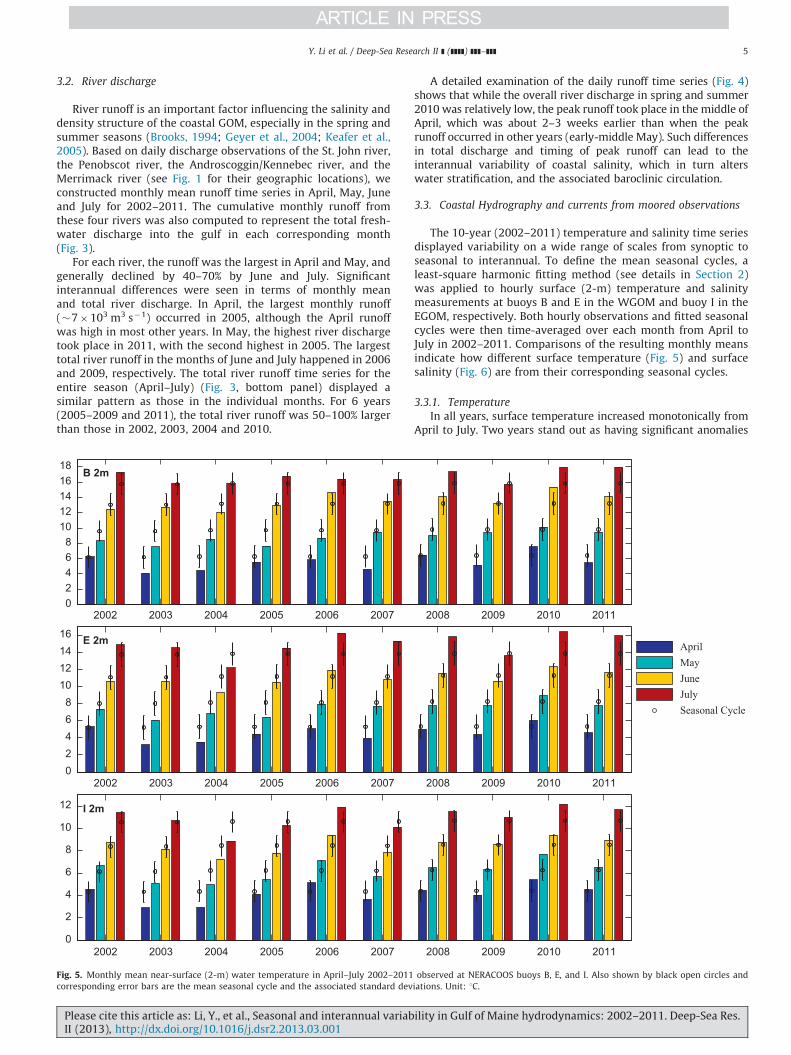
Fig. 5. Monthly mean near-surface (2-m) water temperature in April–July 2002–2011
corresponding error bars are the mean seasonal cycle and the associated standard dev
Please cite this article as: Li, Y., et al., Seasonal and interannual variabII (2013), http://dx.doi.org/10.1016/j.dsr2.2013.03.001i
A detailed examination of the daily runoff time series (Fig. 4)shows that while the overall river discharge in spring and summer2010 was relatively low, the peak runoff took place in the middle ofApril, which was about 2–3 weeks earlier than when the peakrunoff occurred in other years (early-middle May). Such differencesin total discharge and timing of peak runoff can lead to theinterannual variability of coastal salinity, which in turn alterswater stratification, and the associated baroclinic circulation.
3.3. Coastal Hydrography and currents from moored observations
The 10-year (2002–2011) temperature and salinity time seriesdisplayed variability on a wide range of scales from synoptic toseasonal to interannual. To define the mean seasonal cycles, aleast-square harmonic fitting method (see details in Section 2)was applied to hourly surface (2-m) temperature and salinitymeasurements at buoys B and E in the WGOM and buoy I in theEGOM, respectively. Both hourly observations and fitted seasonalcycles were then time-averaged over each month from April toJuly in 2002–2011. Comparisons of the resulting monthly meansindicate how different surface temperature (Fig. 5) and surfacesalinity (Fig. 6) are from their corresponding seasonal cycles.
3.3.1. Temperature
In all years, surface temperature increased monotonically fromApril to July. Two years stand out as having significant anomalies
2008 2009 2010 2011
2008 2009 2010 2011
2008 2009 2010 2011
AprilMayJuneJulySeasonal Cycle
observed at NERACOOS buoys B, E, and I. Also shown by black open circles and
iations. Unit: 1C.
ility in Gulf of Maine hydrodynamics: 2002–2011. Deep-Sea Res.

2002 2003 2004 2005 2006 2007 2008 2009 2010 201129
29.5
30
30.5
31
31.5
32
32.5
33
Data Gap
B 2m
2002 2003 2004 2005 2006 2007 2008 2009 2010 201129
29.5
30
30.5
31
31.5
32
32.5
33E 2m
2002 2003 2004 2005 2006 2007 2008 2009 2010 201130.5
31
31.5
32
32.5I 2m
AprilMayJuneJulySeasonal Cycle
Fig. 6. Monthly mean near-surface (2-m) water salinity in April–July 2002–2011 observed at NERACOOS buoys B, E, and I. Also shown by black open circles and
corresponding error bars are the mean seasonal cycle and the associated standard deviations.
Y. Li et al. / Deep-Sea Research II ] (]]]]) ]]]–]]]6
compared to the mean seasonal cycle. In 2004, the water wasabout 2 1C colder than usual at all three coastal stations B, E, and I.In contrast, in 2010, the water was significantly warmer (1–2 1C)than the mean seasonal cycle at the same three stations. The 50-mtemperature record (not shown) showed similar signals, suggestingsuch interannual variability extended well below the surface.
3.3.2. Salinity
The salinity measured by the coastal buoys B, E, and Iexhibited pronounced interannual variations as well (Fig. 6).We computed the salinity seasonal cycle and standard deviationerror with the same harmonic fitting method used for thetemperature (note there is a data gap at buoy B in summer2011 so no analysis was made). All three buoys showed thecoastal water in 2005 was the freshest in the 10-year record. Atbuoy B for instance, the measured salinity was 2 units fresher inApril and May and 1 unit fresher in June than their correspondingseasonal cycle values. Such freshening was consistent with 2005having the largest runoff event in the time series (Fig. 3). Condi-tions were less variable in other years, with salinity valuesgenerally falling within a standard deviation of the mean seasonalcycle. We noted that salinity in April 2010 was highly anomalous.At all three buoy locations (in both WGOM and EGOM), salinitywas 1–2.5 unit fresher than the seasonal cycle. This coincidedwith the earlier freshening in April 2010 discussed in Section 3.2.
Please cite this article as: Li, Y., et al., Seasonal and interannual variabII (2013), http://dx.doi.org/10.1016/j.dsr2.2013.03.001i
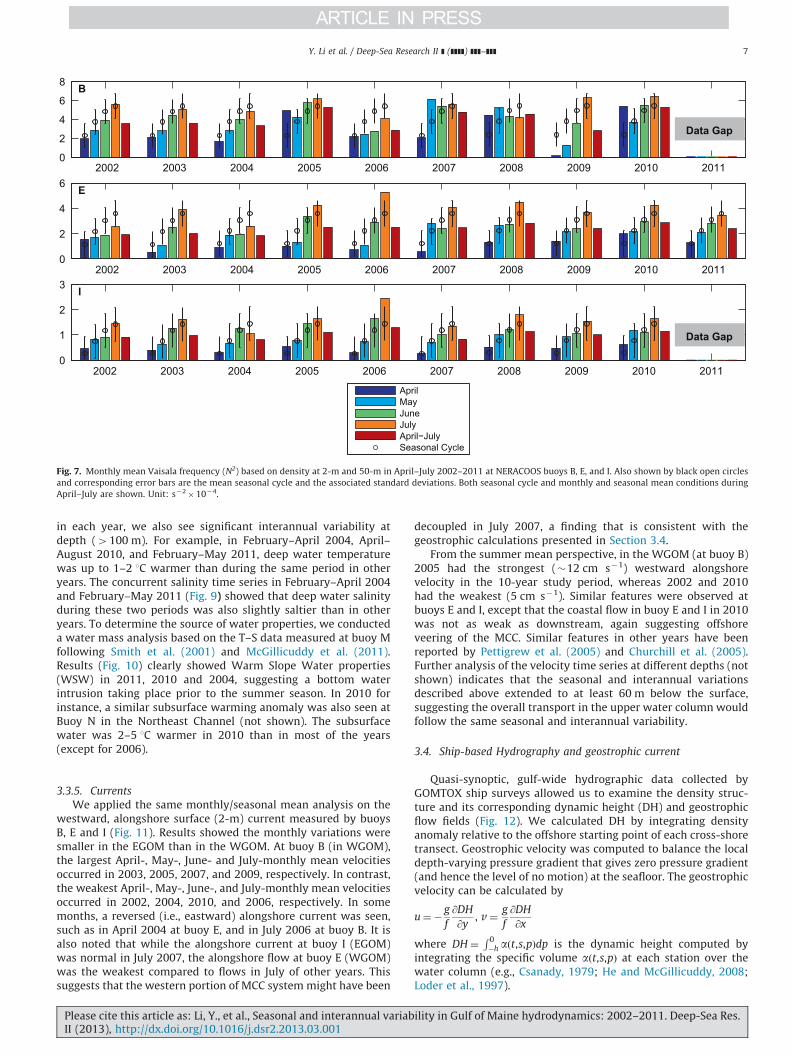
3.3.3. Stratification
Temperature and salinity observations at 2-m and 50-m can beused to compute the water column buoyancy (Vaisala) frequencyN2 following:
N2mid_depth ¼�
g
r0
@r@z��
g
r0
rð�2mÞ�rð�50mÞ
ð�2m�ð�50mÞÞ,
where r0¼1027 kg/m3 and g¼9.8 m/s2.The seasonal cycle, monthly and seasonal means were calcu-
lated for each year between 2002 and 2011 (Fig. 7). In most years,the stratification was dominated by temperature and increasedgradually as the seasonal warming progressed, reaching thehighest values of N2 in July. This was not the case in 2005 and2010 at buoy B, when April had stronger stratification than May.Interannual variability is affected by the salinity anomaly intro-duced by larger (or earlier) than normal river discharge discussedearlier (Section 3.2), resulting in lower salinity and density in theupper ocean that enhances water column stratification. Remoteforcing, such as advection of water mass anomalies fromupstream, can also play a role in stratification (Section 3.3.4).
3.3.4. Hydrographic variability in Jordan Basin and the Northeast
Channel
Buoy M collects subsurface temperature and salinity data inJordan Basin (Fig. 8). In addition to the expected seasonal cycleshown in the time series (between February and September)
ility in Gulf of Maine hydrodynamics: 2002–2011. Deep-Sea Res.
2002 2003 2004 2005 2006 2007 2008 2009 2010 20110
2
4
6
8
Data Gap
B
2002 2003 2004 2005 2006 2007 2008 2009 2010 20110
2
4
6 E
2002 2003 2004 2005 2006 2007 2008 2009 2010 20110
1
2
3
Data Gap
I
AprilMayJuneJulyApril−JulySeasonal Cycle
Fig. 7. Monthly mean Vaisala frequency (N2) based on density at 2-m and 50-m in April–July 2002–2011 at NERACOOS buoys B, E, and I. Also shown by black open circles
and corresponding error bars are the mean seasonal cycle and the associated standard deviations. Both seasonal cycle and monthly and seasonal mean conditions during
April–July are shown. Unit: s�2�10�4.
Y. Li et al. / Deep-Sea Research II ] (]]]]) ]]]–]]] 7
in each year, we also see significant interannual variability atdepth (4100 m). For example, in February–April 2004, April–August 2010, and February–May 2011, deep water temperaturewas up to 1–2 1C warmer than during the same period in otheryears. The concurrent salinity time series in February–April 2004and February–May 2011 (Fig. 9) showed that deep water salinityduring these two periods was also slightly saltier than in otheryears. To determine the source of water properties, we conducteda water mass analysis based on the T–S data measured at buoy Mfollowing Smith et al. (2001) and McGillicuddy et al. (2011).Results (Fig. 10) clearly showed Warm Slope Water properties(WSW) in 2011, 2010 and 2004, suggesting a bottom waterintrusion taking place prior to the summer season. In 2010 forinstance, a similar subsurface warming anomaly was also seen atBuoy N in the Northeast Channel (not shown). The subsurfacewater was 2–5 1C warmer in 2010 than in most of the years(except for 2006).
3.3.5. Currents
We applied the same monthly/seasonal mean analysis on thewestward, alongshore surface (2-m) current measured by buoysB, E and I (Fig. 11). Results showed the monthly variations weresmaller in the EGOM than in the WGOM. At buoy B (in WGOM),the largest April-, May-, June- and July-monthly mean velocitiesoccurred in 2003, 2005, 2007, and 2009, respectively. In contrast,the weakest April-, May-, June-, and July-monthly mean velocitiesoccurred in 2002, 2004, 2010, and 2006, respectively. In somemonths, a reversed (i.e., eastward) alongshore current was seen,such as in April 2004 at buoy E, and in July 2006 at buoy B. It isalso noted that while the alongshore current at buoy I (EGOM)was normal in July 2007, the alongshore flow at buoy E (WGOM)was the weakest compared to flows in July of other years. Thissuggests that the western portion of MCC system might have been
Please cite this article as: Li, Y., et al., Seasonal and interannual variabII (2013), http://dx.doi.org/10.1016/j.dsr2.2013.03.001i
decoupled in July 2007, a finding that is consistent with thegeostrophic calculations presented in Section 3.4.
From the summer mean perspective, in the WGOM (at buoy B)2005 had the strongest (�12 cm s�1) westward alongshorevelocity in the 10-year study period, whereas 2002 and 2010had the weakest (5 cm s�1). Similar features were observed atbuoys E and I, except that the coastal flow in buoy E and I in 2010was not as weak as downstream, again suggesting offshoreveering of the MCC. Similar features in other years have beenreported by Pettigrew et al. (2005) and Churchill et al. (2005).Further analysis of the velocity time series at different depths (notshown) indicates that the seasonal and interannual variationsdescribed above extended to at least 60 m below the surface,suggesting the overall transport in the upper water column wouldfollow the same seasonal and interannual variability.
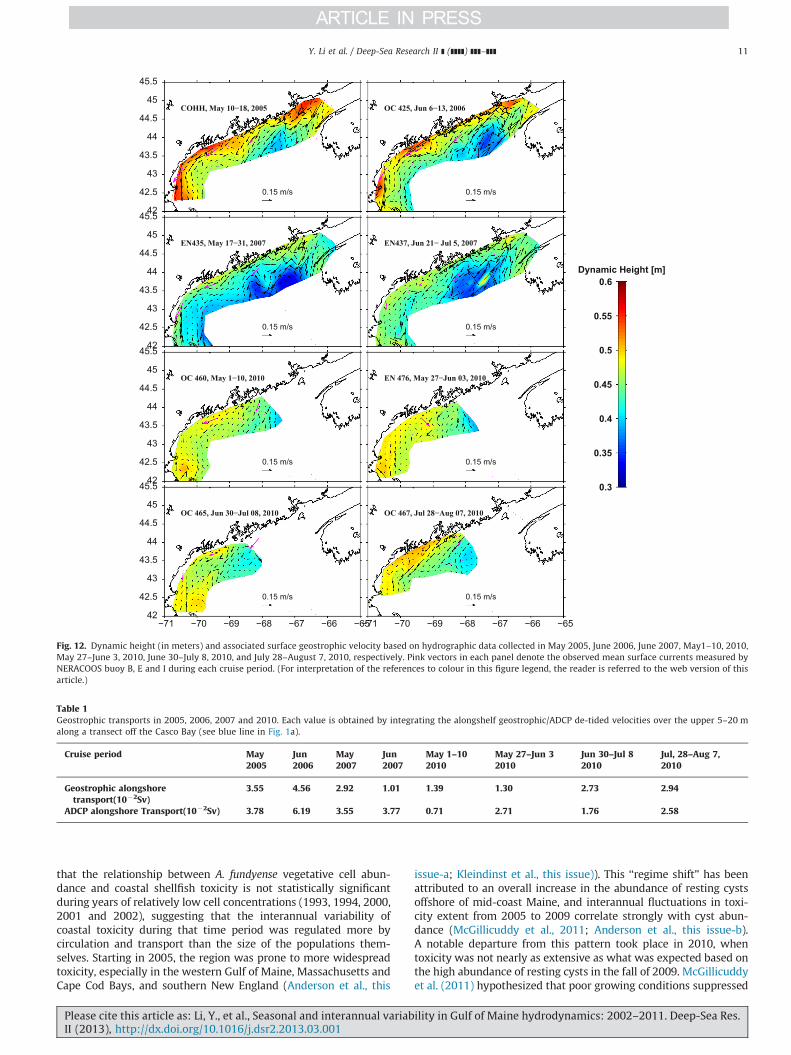
3.4. Ship-based Hydrography and geostrophic current
Quasi-synoptic, gulf-wide hydrographic data collected byGOMTOX ship surveys allowed us to examine the density struc-ture and its corresponding dynamic height (DH) and geostrophicflow fields (Fig. 12). We calculated DH by integrating densityanomaly relative to the offshore starting point of each cross-shoretransect. Geostrophic velocity was computed to balance the localdepth-varying pressure gradient that gives zero pressure gradient(and hence the level of no motion) at the seafloor. The geostrophicvelocity can be calculated by
u¼�g
f
@DH
@y, v¼
g
f
@DH
@x
where DH¼R 0�h aðt,s,pÞdp is the dynamic height computed by
integrating the specific volume aðt,s,pÞ at each station over thewater column (e.g., Csanady, 1979; He and McGillicuddy, 2008;Loder et al., 1997).
ility in Gulf of Maine hydrodynamics: 2002–2011. Deep-Sea Res.

Fig. 8. Time series of observed temperature at NERACOOS buoy M in Jordan Basin, February–September, 2004–2011. Black circles indicate the depths where observations
are available. A 7-day low-pass filter was applied to the time series to remove high-frequency noise.
Y. Li et al. / Deep-Sea Research II ] (]]]]) ]]]–]]]8
In May 2005, a strong DH gradient induced by the anoma-lously large freshwater input (He and McGillicuddy, 2008) led to astrong (20 cm s�1) geostrophic flow, which was continuous fromthe EGOM to the WGOM. The calculations showed that stronggeostrophic flows were also present in 2006, although its flowpattern in the WGOM appeared to be more sluggish and lessorganized than in the EGOM. In May–July 2007, the cross-shoreDH gradient and alongshore geostrophic current were strong inthe EGOM, but currents in the WGOM became weaker (especiallyin late June, see EN437 in Fig. 12), which was consistent withweak alongshore current measured in situ at buoy B and E (toptwo panels, Fig. 11). The cross-shelf DH gradient in May–June2010 was an order of magnitude smaller than that in 2005–2007.
Please cite this article as: Li, Y., et al., Seasonal and interannual variabII (2013), http://dx.doi.org/10.1016/j.dsr2.2013.03.001i
As a result, the alongshore geostrophic currents were the weakestamong this set of comparisons.
We can estimate the upper water-column geostrophic trans-port (Table 1) by integrating the geostrophic current between 5and 20 m along a transect off Casco Bay (blue line in Fig. 1D).Alongshore transports were much larger in 2005 and 2006 than inother years. In 2007, the transport decreased by nearly 70% fromMay to June. Similarly, very weak alongshore transports were alsoobserved in May–June 2010. The flow transport started to pick upafterward, and transport doubled by the end of June. Analyses ofde-tided ship-board ADCP current data (Table 1) also suggest thatthe alongshore transport across the same transect was muchweaker in 2010 than those in 2005 and 2006.
ility in Gulf of Maine hydrodynamics: 2002–2011. Deep-Sea Res.
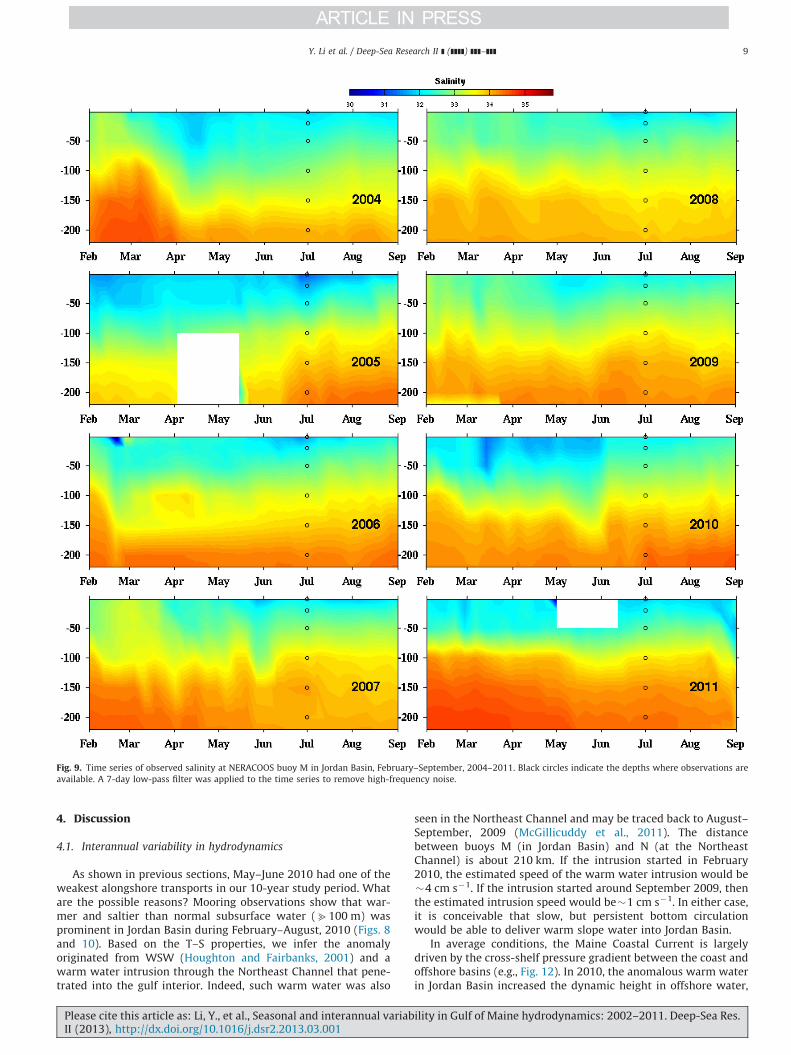
Fig. 9. Time series of observed salinity at NERACOOS buoy M in Jordan Basin, February–September, 2004–2011. Black circles indicate the depths where observations are
available. A 7-day low-pass filter was applied to the time series to remove high-frequency noise.
Y. Li et al. / Deep-Sea Research II ] (]]]]) ]]]–]]] 9
4. Discussion
4.1. Interannual variability in hydrodynamics
As shown in previous sections, May–June 2010 had one of theweakest alongshore transports in our 10-year study period. Whatare the possible reasons? Mooring observations show that war-mer and saltier than normal subsurface water (b100 m) wasprominent in Jordan Basin during February–August, 2010 (Figs. 8and 10). Based on the T–S properties, we infer the anomalyoriginated from WSW (Houghton and Fairbanks, 2001) and awarm water intrusion through the Northeast Channel that pene-trated into the gulf interior. Indeed, such warm water was also
Please cite this article as: Li, Y., et al., Seasonal and interannual variabII (2013), http://dx.doi.org/10.1016/j.dsr2.2013.03.001i
seen in the Northeast Channel and may be traced back to August–September, 2009 (McGillicuddy et al., 2011). The distancebetween buoys M (in Jordan Basin) and N (at the NortheastChannel) is about 210 km. If the intrusion started in February2010, the estimated speed of the warm water intrusion would be�4 cm s�1. If the intrusion started around September 2009, thenthe estimated intrusion speed would be�1 cm s�1. In either case,it is conceivable that slow, but persistent bottom circulationwould be able to deliver warm slope water into Jordan Basin.
In average conditions, the Maine Coastal Current is largelydriven by the cross-shelf pressure gradient between the coast andoffshore basins (e.g., Fig. 12). In 2010, the anomalous warm waterin Jordan Basin increased the dynamic height in offshore water,
ility in Gulf of Maine hydrodynamics: 2002–2011. Deep-Sea Res.
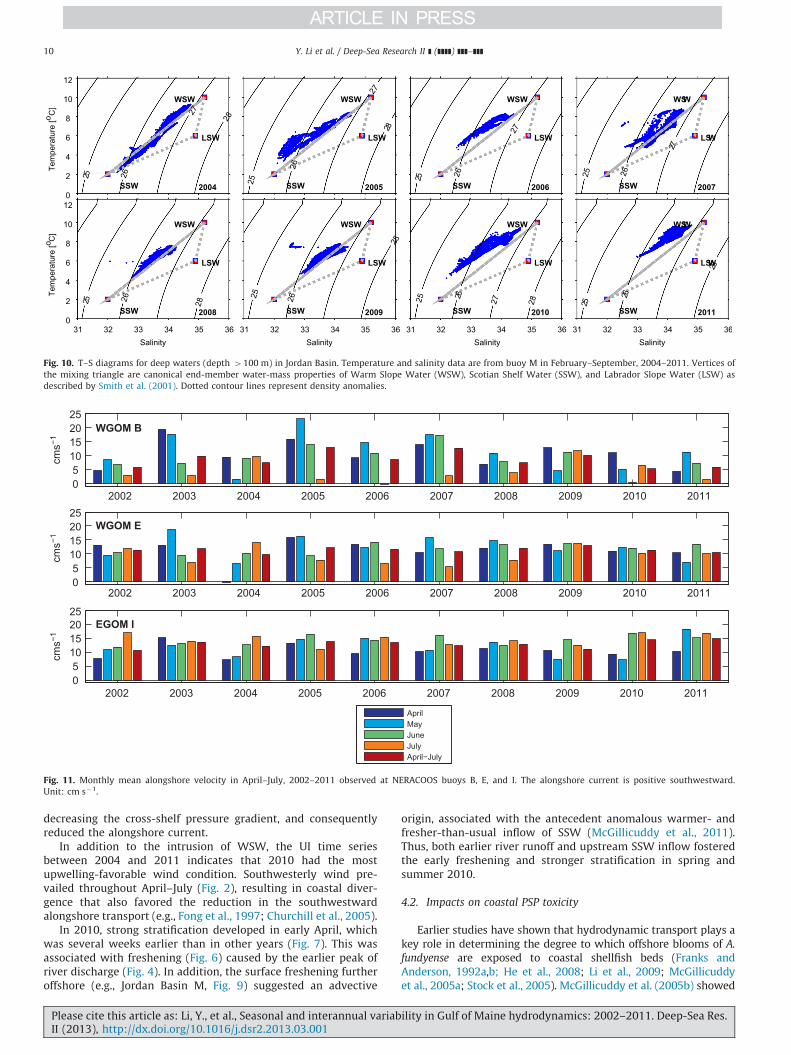
Fig. 10. T–S diagrams for deep waters (depth 4100 m) in Jordan Basin. Temperature and salinity data are from buoy M in February–September, 2004–2011. Vertices of
the mixing triangle are canonical end-member water-mass properties of Warm Slope Water (WSW), Scotian Shelf Water (SSW), and Labrador Slope Water (LSW) as
described by Smith et al. (2001). Dotted contour lines represent density anomalies.
2002 2003 2004 2005 2006 2007 2008 2009 2010 2011
WGOM B
cms−1
cms−1
cms−1
2002 2003 2004 2005 2006 2007 2008 2009 2010 2011
WGOM E
2002 2003 2004 2005 2006 2007 2008 2009 2010 2011
05
10152025
05
10152025
05
10152025
EGOM I
AprilMayJuneJulyApril−July
Fig. 11. Monthly mean alongshore velocity in April–July, 2002–2011 observed at NERACOOS buoys B, E, and I. The alongshore current is positive southwestward.
Unit: cm s�1.
Y. Li et al. / Deep-Sea Research II ] (]]]]) ]]]–]]]10
decreasing the cross-shelf pressure gradient, and consequentlyreduced the alongshore current.
In addition to the intrusion of WSW, the UI time seriesbetween 2004 and 2011 indicates that 2010 had the mostupwelling-favorable wind condition. Southwesterly wind pre-vailed throughout April–July (Fig. 2), resulting in coastal diver-gence that also favored the reduction in the southwestwardalongshore transport (e.g., Fong et al., 1997; Churchill et al., 2005).
In 2010, strong stratification developed in early April, whichwas several weeks earlier than in other years (Fig. 7). This wasassociated with freshening (Fig. 6) caused by the earlier peak ofriver discharge (Fig. 4). In addition, the surface freshening furtheroffshore (e.g., Jordan Basin M, Fig. 9) suggested an advective
Please cite this article as: Li, Y., et al., Seasonal and interannual variabII (2013), http://dx.doi.org/10.1016/j.dsr2.2013.03.001i
origin, associated with the antecedent anomalous warmer- andfresher-than-usual inflow of SSW (McGillicuddy et al., 2011).Thus, both earlier river runoff and upstream SSW inflow fosteredthe early freshening and stronger stratification in spring andsummer 2010.
4.2. Impacts on coastal PSP toxicity
Earlier studies have shown that hydrodynamic transport plays akey role in determining the degree to which offshore blooms of A.
fundyense are exposed to coastal shellfish beds (Franks andAnderson, 1992a,b; He et al., 2008; Li et al., 2009; McGillicuddyet al., 2005a; Stock et al., 2005). McGillicuddy et al. (2005b) showed
ility in Gulf of Maine hydrodynamics: 2002–2011. Deep-Sea Res.
0.15 m/s
COHH, May 10−18, 2005
42
42.5
43
43.5
44
44.5
45
45.5
0.15 m/s
OC 425, Jun 6−13, 2006
0.15 m/s
EN435, May 17−31, 2007
42
42.5
43
43.5
44
44.5
45
45.5
0.15 m/s
EN437, Jun 21− Jul 5, 2007
0.15 m/s
OC 460, May 1−10, 2010
42
42.5
43
43.5
44
44.5
45
45.5
0.15 m/s
EN 476, May 27−Jun 03, 2010
0.15 m/s
OC 465, Jun 30−Jul 08, 2010
−71 −70 −69 −68 −67 −66 −6542
42.5
43
43.5
44
44.5
45
45.5
0.15 m/s
OC 467, Jul 28−Aug 07, 2010
−71 −70 −69 −68 −67 −66 −65
0.3
0.35
0.4
0.45
0.5
0.55
0.6Dynamic Height [m]
Fig. 12. Dynamic height (in meters) and associated surface geostrophic velocity based on hydrographic data collected in May 2005, June 2006, June 2007, May1–10, 2010,
May 27–June 3, 2010, June 30–July 8, 2010, and July 28–August 7, 2010, respectively. Pink vectors in each panel denote the observed mean surface currents measured by
NERACOOS buoy B, E and I during each cruise period. (For interpretation of the references to colour in this figure legend, the reader is referred to the web version of this
article.)
Table 1Geostrophic transports in 2005, 2006, 2007 and 2010. Each value is obtained by integrating the alongshelf geostrophic/ADCP de-tided velocities over the upper 5–20 m
along a transect off the Casco Bay (see blue line in Fig. 1a).
Cruise period May2005
Jun2006
May2007
Jun2007
May 1–102010
May 27–Jun 32010
Jun 30–Jul 82010
Jul, 28–Aug 7,2010
Geostrophic alongshoretransport(10�2Sv)
3.55 4.56 2.92 1.01 1.39 1.30 2.73 2.94
ADCP alongshore Transport(10�2Sv) 3.78 6.19 3.55 3.77 0.71 2.71 1.76 2.58
Y. Li et al. / Deep-Sea Research II ] (]]]]) ]]]–]]] 11
that the relationship between A. fundyense vegetative cell abun-dance and coastal shellfish toxicity is not statistically significantduring years of relatively low cell concentrations (1993, 1994, 2000,2001 and 2002), suggesting that the interannual variability ofcoastal toxicity during that time period was regulated more bycirculation and transport than the size of the populations them-selves. Starting in 2005, the region was prone to more widespreadtoxicity, especially in the western Gulf of Maine, Massachusetts andCape Cod Bays, and southern New England (Anderson et al., this
Please cite this article as: Li, Y., et al., Seasonal and interannual variabII (2013), http://dx.doi.org/10.1016/j.dsr2.2013.03.001i
issue-a; Kleindinst et al., this issue)). This ‘‘regime shift’’ has beenattributed to an overall increase in the abundance of resting cystsoffshore of mid-coast Maine, and interannual fluctuations in toxi-city extent from 2005 to 2009 correlate strongly with cyst abun-dance (McGillicuddy et al., 2011; Anderson et al., this issue-b).A notable departure from this pattern took place in 2010, whentoxicity was not nearly as extensive as what was expected based onthe high abundance of resting cysts in the fall of 2009. McGillicuddyet al. (2011) hypothesized that poor growing conditions suppressed
ility in Gulf of Maine hydrodynamics: 2002–2011. Deep-Sea Res.

Y. Li et al. / Deep-Sea Research II ] (]]]]) ]]]–]]]12
what otherwise would have been a large bloom, thereby preventingthe potential for widespread toxicity from being realized.
Our results suggest that hydrodynamics may have also played asignificant role in diminishing the extent of toxicity in 2010. Bothmoored observations (Fig. 11) and shipboard surveys (Fig. 12)indicate that decreased alongshore flow in the WGOM may havereduced the transport of A. fundyense populations to the south andwest, thereby curtailing the alongshore extent of toxicity. Thiseffect may have been augmented by upwelling-favorable windconditions (Fig. 2), which not only tend to decelerate delivery of A.
fundyense cells to the WGOM, but also can spread the cells in theoffshore direction (Franks and Anderson, 1992b; Hetland et al.,2002; McGillicuddy et al., 2003). Lastly, we note that the early peakin river runoff (Fig. 4) may have contributed to the unusually fresh(Fig. 6) and highly stratified (Fig. 7) conditions present early in theseason. Although these aspects of the oceanographic environmentwere affected by large-scale water mass anomalies advected intothe region (McGillicuddy et al., 2011), local forcing also contributedto the earlier-than-normal stratification. In turn, this would favorearlier-than-normal nutrient depletion, thereby negatively affect-ing the growing conditions for A. fundyense. Lower ambientnutrient concentrations might also be part of long-term trend ofdecreased inflow of nutrient-rich slope water through the NEC(Pettigrew et al., 2011; Smith et al., 2012; Townsend et al., 2010),and increased SSW inflow.
Another episode of reduced transport in the WGOM took placein June–July 2007 (Fig. 12). Alongshore currents at buoys B and Ein July 2007 were among the weakest of all the Julys in the time-series (Fig. 11). Possibly due to this sluggish transport, thecoincident PSP closures in 2007 were second only to 2010 intheir limited along-coast extent (McGillicuddy et al., 2011). Incontrast, the strong coastal flow in 2005 (e.g., He andMcGillicuddy, 2008) coincided with one of the most extensivetoxicity closures in the last 30 years (Anderson et al., 2005).Although hindcast simulations suggest increased cyst abundancewas the primary cause of the widespread bloom in 2005 (e.g., Heet al., 2008; Li et al., 2009), hydrodynamic conditions clearlyfavored exposure of coastal shellfish beds to the toxic algae.
In an effort to quantify these relationships, we tested severallinear regression models relating toxicity extent to alongshorecurrents and cyst abundance. Although such relationships werestatistically significant for subsets of the data, no robust relation-ship emerged from the complete time series (2004–2010). Thefailure of these simple regression models is likely due to theabsence of other complex physical and biological factors, such aspre-bloom nutrient conditions, delivery of offshore bloomsthrough cross-shelf transport, and other processes that aredifficult to parameterize based on limited observations. Never-theless, it is clear that the smaller alongshore toxicity extentssuch as in 2010 and 2007 coincided with weakened alongshorecurrents, and that the extensive toxicity closure in 2005 coincidedwith strong alongshore flow in the same year. Thus, there appearsto be some linkage between coastal circulation and the along-shore extent of toxicity in the WGOM.
5. Conclusions
In situ observations including long-term moored meteorologi-cal and oceanographic measurements and multi-year gulf-wideship survey data were used to quantify interannual variability ofsurface wind, river runoff, and hydrographic conditions in theGulf of Maine during summers 2002–2011. Significant interann-ual variability was found in the local forcing (i.e., wind and riverrunoff). The CUI showed that the upwelling (downwelling)-favorable wind conditions were most persistent in 2010 (2005)
Please cite this article as: Li, Y., et al., Seasonal and interannual variabII (2013), http://dx.doi.org/10.1016/j.dsr2.2013.03.001i
respectively over the 9-year study period. River discharge washighest in 2005, whereas the peak runoff started in early April in2010 as opposed to late April to mid-May in other years.
Coastal hydrography (temperature, salinity, stratification)influenced by both local and deep-ocean forcing also displayedstrong interannual variations. Coastal water temperature was0.5–2 1C warmer than average in summer 2010, and about 2 1Ccolder than average in 2004. Coastal salinity in April 2010 was thelowest in the 10-year study period. Both moored ADCP currentmeasurements and dynamic height/geostrophic velocity calcula-tions based on gulf-wide synoptic ship survey data show May–June 2010 had weak alongshore transport in the western Gulf ofMaine. The reduction in alongshore current was likely influencedby a combined effect of a subsurface warm water intrusionthrough NEC, and anomalously warm and fresh SSW inflow(e.g., McGillicuddy et al., 2011). However, our analysis showedthat upwelling-favorable wind conditions in 2010 also contrib-uted to the decreased alongshore transport, further favoring thereduced alongshore extent of toxicity. In contrast, widespreadcoastal toxicity in 2005 was accompanied by strong alongshorecurrents and downwelling-favorable winds, which tend toincrease the exposure of coastal shellfish beds to offshore popula-tions of A. fundyense. These observations suggest linkage betweencoastal transport and the alongshore extent of toxicity in theWGOM.
Acknowledgments
We thank the Northeastern Regional Association of Coastaland Ocean Observing Systems (NERACOOS) for providing themooring data used in this study; we thank Linda Mangum forher assistance with these data. River outflow data were suppliedby the United States Geological Survey.
We gratefully acknowledge support of the National OceanicAtmospheric Administration (grant NA06NOS4780245 for theGulf of Maine Toxicity (GOMTOX) program). Additional supportfor DJM was provided by the Woods Hole Center for Oceans andHuman Health through National Science Foundation grants OCE-0430724 and OCE-0911031 and National Institute of Environ-mental Health Sciences grant 1P50-ES01274201.
This is the Ecology and Oceanography of Harmful Algal BloomsProgram contribution number 729.
References
Anderson, D.M., Keafer, B.A., McGillicuddy, D.J., Mickelson, M.J., Keay, K.E., Libby, P.S.,Manning, J.P., Mayo, C.A., Wittaker, D.K., Hickey, J.M., He, R., Lynch, D.R., Smith,K.W., 2005. Initial observation of the 2005 Alexandrium fundyense bloom in thesouthern New England: general patterns and mechanisms. Deep Sea Res. II 52,2856–2876.
Anderson, D.M., Couture, D.A., Keafer, B.A., Kleindinst, J.L., McGillicuddy, D.J.,Martin, J.L., Hickey, J.M. Understanding interannual, decadal level variability inPSP toxicity in the Gulf of Maine: a HAB Index and Alexandrium fundyense cystabundance. Deep-Sea Res. II, this issue a.
Anderson, D.M., Keafer, B.A., McGillicuddy, D.J., Martin, J., Norton, K., Pilskaln, C.,Smith, J. Alexandrium fundyense cysts in the Gulf of Maine: time series ofabundance and distribution, and linkages to past and future blooms. Deep-SeaRes. II, this issue b.
Aretxabaleta, A.L., McGillicuddy, D.J., Smith, K.W., Manning, J.P., Lynch, D.R., 2009.Model simulations of the Bay of Fundy Gyre: 2. Hindcasts for 2005–2007reveal interannual variability in retentiveness. J. Geophys. Res. 114, C09005,http://dx.doi.org/10.1029/2008JC004948.
Bigelow, H.B., 1927. Physical Oceanography of the Gulf of Maine. Fish. Bull. 40,511–1027.
Bisagni, J.J., Smith, P.C., 1998. Eddy-induced flow of Scotian Shelf water acrossNortheast Channel, Gulf of Maine. Cont. Shelf Res. 18, 515–539.
Brooks, D.A., 1994. A model study of the buoyancy-driven circulation in the Gulf ofMaine. J. Phys. Oceanogr. 24, 2387–2412.
Brooks, D.A., Townsend, D.W., 1989. Variability in the coastal current and nutrientpathways in the eastern Gulf of Maine. J. Mar. Res. 47, 303–321.
ility in Gulf of Maine hydrodynamics: 2002–2011. Deep-Sea Res.
Y. Li et al. / Deep-Sea Research II ] (]]]]) ]]]–]]] 13
Brown, W.S., Irish, J.D., 1993. The annual variation of the mass structure in the Gulfof Maine: 1986–1987. J. Mar. Res. 51, 53–107.
Butman, B., Sherwood, C.R., Dalyande, P.S., 2008. Northeast storms ranked by windstress and wave-generated bottom stress observed in Massachusetts Bay,1990–2006. Cont. Shelf Res. 28 (10–11), 1231–1245.
Churchill, J.H., Pettigrew, N.R., Signell, R.P., 2005. Structure and variability of theWestern Maine Coastal Current. Deep Sea Res. II 52, 2392–2410.
Csanady, G.T., 1979. The pressure field along the western margin of the NorthAtlantic. J. Geophys. Res. 84 (C8), 4905–4915, http://dx.doi.org/10.1029/JC084iC08p04905.
Fong, D.A., Geyer, W.R., Signell, R.P., 1997. The wind-forced response on a buoyantcoastal current: observations of the western Gulf of Maine plume. J. Mar. Syst.12 (1–4), 69–81.
Franks, P.J.S, Anderson, D.M., 1992a. Toxic phytoplankton blooms in the south-western Gulf of Maine: testing hypotheses of physical control using historicaldata. Mar. Biol. 112, 165–174.
Franks, P.J.S., Anderson, D.M., 1992b. Alongshore transport of a toxic phytoplank-ton bloom in a buoyancy current: Alexandrium tamarensis in the Gulf of Maine.Mar. Biol. 112, 153–164.
Geyer, W.R., Signell, R.P., Fong, D.A., Wang, J., Anderson, D.M., Keafer, B.A., 2004.The freshwater transport and dynamics of the Western Maine Coastal Current.Cont. Shelf Res. 24, 1339–1357.
He, R., McGillicuddy, D.J., 2008. The historic 2005 toxic bloom of Alexandriumfundyense in the west Gulf of Maine—Part 1: In situ observations of coastalhydrography and circulation. J. Geophys. Res. 113, C07039, http://dx.doi.org/10.1029/2007JC004601.
He, R., McGillicuddy, D.J., Keafer, B.A, Anderson, D.M., 2008. Gulf of Maine harmfulalgal bloom in summer 2005—Part 2: Coupled bio-physical numerical model-ing. J. Geophys. Res. 113, C07040, http://dx.doi.org/10.1029/2007 JC 004602.
Hetland, R.D., McGillicuddy, D.J., Signell, R.P., 2002. Cross-frontal entrainment ofplankton into a buoyant plume: the frog tongue mechanism. J. Mar. Res. 60,763–777.
Houghton, R.W., Fairbanks, R.G., 2001. Water sources for Georges Bank. Deep-SeaRes. II 48, 95–114.
Keafer, B.A., Churchill, J.H., McGillicuddy, D.J., Anderson, D.M., 2005. Bloomdevelopment and transport of toxic Alexandrium fundyense population withina coastal plume in the Gulf of Maine. Deep Sea Res. II 52, 2674–2697.
Kleindinst, J.L., Anderson, D.M., McGillicuddy, D.J., Stumpf, R.P., Fisher, K.M.,Couture, D.A., Hickey, J.M., Nash, C. Categorizing the severity of PSP outbreaksin the Gulf of Maine for forecasting and management. Deep-Sea Res. II, thisissue.
Large, W.G., Pond, S., 1981. Open ocean momentum flux measurements inmoderate to strong winds. J. Phys. Oceanogr. 11, 324–336.
Li, Y., He, R., McGllicuddy, D.J., Anderson, D.M., Keafer, B.A., 2009. Investigation ofthe 2006 Alexandrium fundyense bloom in the Gulf of Maine: in situ observa-tions and numerical modelling. Cont. Shelf Res., http://dx.doi.org/10.1016/j.csr.2009.07.012.
Li, Y., He, R., Manning, J.P.. The coastal connectivity in the Gulf of Maine. Deep SeaRes. II, this issue.
Loder, J.W., Han, G., Hannah, C.G., Greeberg, D.A., Smith, P.C., 1997. Hydrographyand baroclinic circulation in the Scotian shelf region: winter vs. summer. Can.J. Fish. Aquat. Sci. Supplement 54, 40–56.
Lynch, D.R., Ipa, J.T., Naimie, C.E., Wernerb, F.E., 1996. Comprehensive coastalcirculation model with application to the Gulf of Maine. Cont. Shelf Res. 16–7,875–906.
Please cite this article as: Li, Y., et al., Seasonal and interannual variabII (2013), http://dx.doi.org/10.1016/j.dsr2.2013.03.001i
Lynch, D.R, Holboke, M.J., Naimie, C.E., 1997. The Maine coastal current: springclimatological circulation. Cont. Shelf Res. 17 (6), 605–634.
Manning, J.P., McGullicuddy, D.J., Pettigrew, N.R., Churchill, J.H., Incze, L.S., 2009.Drifter observations of the Gulf of Maine Coastal Current. Cont. Shelf Res. 29(7), 835–845.
McGillicuddy, D.J., Signell, R.P., Stock, C.A., Keafer, B.A., Keller, M.D., Hetland, R.D.,Anderson, D.M., 2003. A mechanism for offshore initiation of harmful algalblooms in the coastal Gulf of Maine. J. Plankton Res. 25 (9), 1131–1138.
McGillicuddy, D.J., Anderson, D.M., Lynch, D.R., Townsend, D.W., 2005a. Mechan-isms regulating large-scale seasonal fluctuations in Alexandrium fundyensepopulations in the Gulf of Maine: results from a physical–biological model.Deep Sea Res. II 52, 2698–2714.
McGillicuddy, D.J., Anderson, D.M., Solow, A.R., Townsend, D.W., 2005b. Inter-annual variability of Alexandrium fundyense abundance and shellfish toxicity inthe Gulf of Maine. Deep-Sea Res. II 52, 2843–2855.
McGillicuddy, D.J., Townsend, D.W., He, R., Keafer, B.A., Kleindinst, J.L., Li, Y.,Manning, J.P., Mountain, D.G., Thomas, M.A., Anderson, D.M., 2011. Suppres-sion of the 2010 Alexandrium fundyense bloom by changes in physical,biological, and chemical properties of the Gulf of Maine. Limnol. Oceanogr.56 (6), 2411–2426.
Mountain, D.G., Manning, J.P., 1994. Seasonal and interannual variability in theproperties of the surface waters of the Gulf of Maine. Cont. Shelf Res. 14,1555–1581.
Mountain, D.G., Strout, G., Beardsley, R., 1996. Surface heat flux in the Gulf ofMaine. Deep Sea Res. II 43, 1533–1546.
Pettigrew, N.R., Churchill, J.H., Janzen, C.D., Mangum, L.J., Signell, R.P., Thomas, A.C.,Townsend, D.W., Wallinga, J.P., Xue, H., 2005. The kinematic and hydrographicstructure of the Gulf of Maine coastal current. Deep Sea Res. II 52 (19–21),2369–2391.
Pettigrew, N.R., Fleming, R.J., Fikes, C.P., 2011. The history of the first decade of theobserving system in the Gulf of Maine, and plans for the second decade. MTS J.,September 2011, 1–10.
Schwing, F.B., O’Farrell, M., Steger, J.M., Baltz, K., 1996. Coastal upwelling indices,West Coast of North America, 1946–1995. NOAA Tech. Memo. NOAA-TM-NMFS-SWFSC-231, 144.
Smith, P.C, Houghton, R.W., Fairbanks, R.G., Mountain, D.G., 2001. Interannualvariability of boundary fluxes and water mass properties in the Gulf of Maineand on Georges Bank: 1993–1997. Deep-Sea Res. II 48, 37–70.
Smith, P.C., Pettigrew, N.R., Yeats, P., Townsend, D.W., Han, G., 2012. Regime shiftin the Gulf of Maine. In: Stephenson, R.L., Annala, J.H., Runge, J.A., Hall-Arber,M. (Eds.), Advancing an Ecosystem Approach in the Gulf of Maine. AmericanFisheries Society, Symposium 79, Bethesda, MD, pp. 185–203.
Stock, C.A., McGillicuddy, D.J., Solow, A.R., Anderson, D.M., 2005. Evaluatinghypothesis for the initiation and development of Alexandrium fundyenseblooms in the western Gulf of Maine using a coupled physical–biologicalmodel. Deep Sea Res. II 52, 2715–2744.
Thomas, A.C., Weatherbee, R., Xue, H., Liu, G., 2010. Interannual variability ofshellfish toxicity in the Gulf of Maine: time and space patterns and links toenvironmental variability. Harmful Algae 9, 458–480, http://dx.doi.org/10.1016/j.hal.2010.03.002.
Townsend, D.W., Rebuck, N.D., Thomas, M.A., Karp-Boss, L., Gettings, R.M., 2010. Achanging nutrient regime in the Gulf of Maine. Cont. Shelf Res. 30, 820–832.
Xue, H., Chai, F., Pettigrew, N.R., 2000. A model study of the seasonal circulation inthe Gulf of Maine. J. Phys. Oceanogr. 30 (5), 1111–1135.
ility in Gulf of Maine hydrodynamics: 2002–2011. Deep-Sea Res.