Embed Size (px)
Citation preview
Vol. 98: 89-105,1993 MARINE ECOLOGY PROGRESS SERIES
Mar. Ecol. Prog. Ser. l Published August 5
Seasonal and annual variations in abundance and species composition of fish and macrocrustacean
communities on a Scottish sandy beach
R. N. Gibson, A. D. Ansell, L. Robb
Dunstaffnage Marine Laboratory, PO Box 3. Oban, Argyll. Scotland PA34 4AD, United Kingdom
ABSTRACT: Forty-three species of fishes and 16 species of larger crustaceans were caught by trawl and seine during a 4 yr study on a sandy beach on the west coast of Scotland. There were considerable differences in the species composition of the trawl and seine catches such that neither alone provided an adequate description of the sampled cornnlunity. Approximately monthly s a m p h g demonstrated a clear seasonal cycle in abundance and species composition. A few species were resident on the beach all year round; the majority were only present from spring to autumn. Increases in both numbers and species were caused mainly by the recruitment of young of the year individuals whose numbers subse- quently declined rapidly probably due to a combination of predation and emigration. There were marked differences in both species composition and abundance between years. Annual cycles in spe- cies richness and abundance closely paralleled those of temperature and sahnity. It is suggested that the cycles result mainly from recruitment and mortality rather than from immigration and emigration in response to physical factors.
INTRODUCTION
Fishes and crustaceans form important components of the fauna of sandy beaches and the community ecology of these 2 groups has been studied in many parts of the world, particularly South Africa, Australia and the United States (Brown & McLachlan 1991). On European beaches, where studies of benthic in- vertebrate communities are common (Salvat 1962, Beukema 1974, 1976, Eleftheriou & Nicholson 1975, Angus 1979, Eleftheriou & Robertson 1988, Ansell &
Gibson 1990, Dexter 1990), investigations of the fish communities inhabiting the same environment are relatively rare (Macer 1967, Creutzberg & Fonds 1971, Gibson 1973, Riley et al. 1981, Nash 1986, Reina-Hervas 1987, Reina-Hemas & Serrano 1987) and frequently limited to the dominant species, typi- cally flatfishes (e.g. Jones 1973, Lockwood 1974, Kuipers 1977, Poxton et al. 1983). Observations on the motile crustaceans in such habitats have similarly concentrated on the numerically most abundant groups, particularly crabs (Edwards 1958, Naylor
1962, Crothers 1968, Atkinson & Parsons 1973, Ven- ema & Creutzberg 1973, Klein Breteler 1976, Pihl 1985) or shrimps (Lloyd & Yonge 1947, Boddeke 1975, 1976, Janssen & Kuipers 1980, Kuipers & Dapper 1981, Evans & Tallmark 1985, Pihl 1985, Henderson et al. 1990). In addition, the majority of studies have been relatively short term, often lasting a year or less, and year-to-year variation is thereby excluded. Species richness and abundance estimates are also frequently biassed by the use of selective gear types. In an attempt to overcome these shortcomings and to provide a comprehensive description of the ecology of the larger elements of the fauna on a Scottish sandy beach, the fishes and larger motile crustaceans were regularly sampled over 4 yr using gears that were effective at capturing benthic, demersal and pelagic species. The aim of the study was 3-fold. Firstly, to describe the structure of the fish and macrocrustacean communities, secondly to determine the intra- and interannual variation in abundance and species diver- sity, and thirdly to relate these variations to changes in the major environmental variables.
0 Inter-Research 1993
90 Mar. Ecol. Prog. Ser. 98: 89-105, 1993
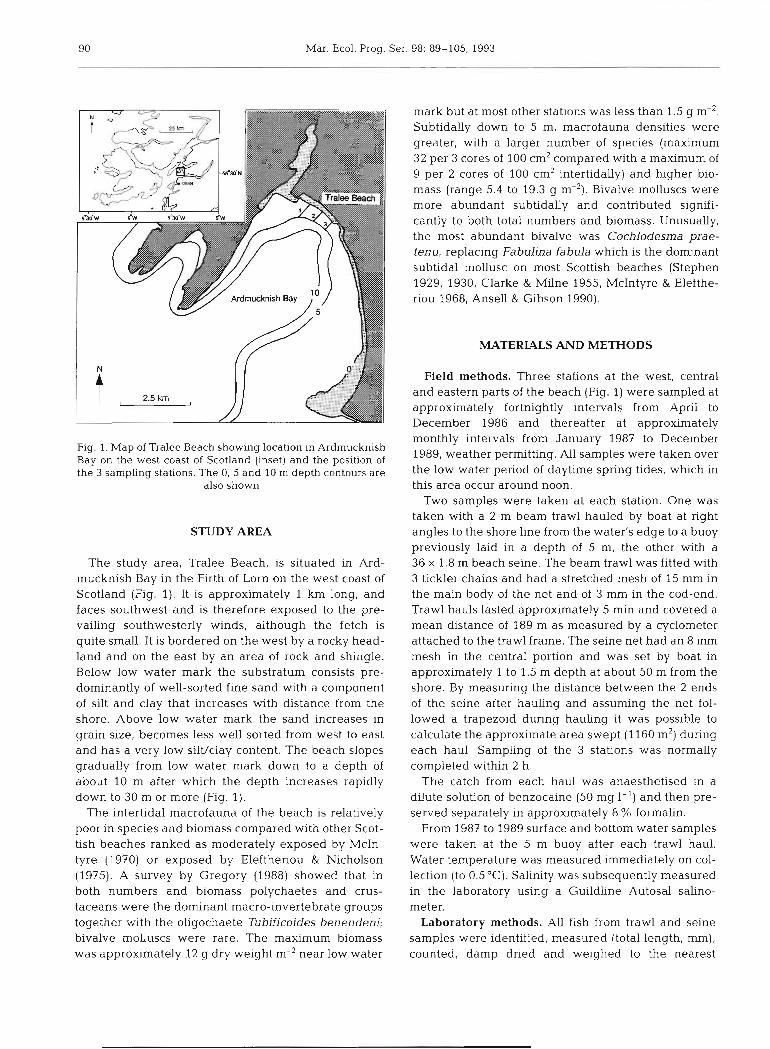
Fig. 1. Map of Tralee Beach showing location in Ardmucknish Bay on the west coast of Scotland (inset) and the position of the 3 sampling stations. The 0, 5 and 10 m depth contours are
also shown
STUDY AREA
The study area, Tralee Beach, is situated in Ard- mucknish Bay in the Firth of Lorn on the west coast of Scotland (Fig. 1). It is approximately 1 km long, and faces southwest and is therefore exposed to the pre- vailing southwesterly winds, although the fetch is quite small. It is bordered on the west by a rocky head- land and on the east by an area of rock and shingle. Below low water mark the substratum consists pre- dominantly of well-sorted fine sand with a component of silt and clay that increases with distance from the shore. Above low water mark the sand increases in grain size, becomes less well sorted from west to east and has a very low silWclay content. The beach slopes gradually from low water mark down to a depth of about 10 m after which the depth increases rapidly down to 30 m or more (Fig. 1).
The intertidal macrofauna of the beach is relatively poor in species and biomass compared with other Scot- tish beaches ranked as moderately exposed by McIn- tyre (1970) or exposed by Eleftheriou & Nicholson (1975). A survey by Gregory (1988) showed that in both numbers and biomass polychaetes and crus- taceans were the dominant macro-invertebrate groups together with the oligochaete Tubificoides benendeni; bivalve molluscs were rare. The maximum biomass was approximately 12 g dry weight m-2 near low water
mark but at most other stations was less than 1.5 g m-'. Subtidally down to 5 m, macrofauna densities were greater, with a larger number of species (maximum 32 per 3 cores of 100 cm2 compared with a maximum of 9 per 2 cores of 100 cm2 intertidally) and higher bio- mass (range 5.4 to 19.3 g m-'). Bivalve molluscs were more abundant subtidally and contributed signifi- cantly to both total numbers and biomass. Unusually, the most abundant bivalve was Cochlodesma prae- tenu, replacing Fabulina fabula which is the dominant subtidal mollusc on most Scottish beaches (Stephen 1929, 1930, Clarke & Milne 1955, McIntyre & Elefthe- riou 1968, Ansell & Gibson 1990).
MATERIALS AND METHODS
Field methods. Three stations at the west, central and eastern parts of the beach (Fig. 1) were sampled at approximately fortnightly intervals from April to December 1986 and thereafter at approximately monthly intervals from January 1987 to December 1989, weather permitting. All samples were taken over the low water period of daytime spring tides, which in this area occur around noon.
Two samples were taken at each station. One was taken with a 2 m beam trawl hauled by boat at right angles to the shore line from the water's edge to a buoy previously laid in a depth of 5 m, the other with a 36 X 1.8 m beach seine. The beam trawl was fitted with 3 tickler chains and had a stretched mesh of 15 mm in the main body of the net and of 3 mm in the cod-end. Trawl hauls lasted approximately 5 min and covered a mean distance of 189 m as measured by a cyclometer attached to the trawl frame. The seine net had an 8 mm mesh in the central portion and was set by boat in approximately 1 to 1.5 m depth at about 50 m from the shore. By measuring the distance between the 2 ends of the seine after hauling and assuming the net fol- lowed a trapezoid during hauling it was possible to calculate the approximate area swept (1 160 m2) during each haul. Sampling of the 3 stations was normally completed within 2 h.
The catch from each haul was anaesthetised in a dilute solution of benzocaine (50 mg 1-l) and then pre- served separately in approximately 8 % formalin.
From 1987 to 1989 surface and bottom water samples were taken at the 5 m buoy after each trawl haul. Water temperature was measured immediately on col- lection (to 0.5 "C). Salinity was subsequently measured in the laboratory using a Guildline Autosal salino- meter.
Laboratory methods. All fish from trawl and seine samples were identified, measured (total length, mm), counted, damp dried and weighed to the nearest

Gibson et al.: Vanations in fish and macrocrustacean con~mumties 91
0.01 g. Measured weights were subsequently cor- rected for losses due to preservation using predeter- mined correction factors. The larger crustaceans from the trawl samples were identified and counted only.
Wind data were taken from anemometer records at the Dunstaffnage Marine Laboratory, approximately 5 km from the study area. To quantify the possible effects of wind, principally through wave action, on the fauna a 'wind factor' (W) was calculated as W = cos(220° - a ) s where 220" is the compass direction in which the beach faces, a = wind direction in degrees and s = wind speed in km h-'. Wwill be positive from 130 to 310" and negative from 311 to 129'. A mean value of W was calculated from the hourly values for the 48 h prior to each sampling occasion. When values of W are high and positive, indicating strong onshore winds, wave action on the beach is greatest. When W is negative (offshore or longshore winds), wave action is low or negligible.
Data treatment. Because the efficiency of the trawl used is unknown, and almost certainly varies with both size and species, fish catches were expressed as number 100m-2 trawled rather than as abundances. To do so would give a spurious impression of accu- racy. A mean value of the 3 stations was then calcu- lated. For the seine samples, abundances were ex- pressed as numbers per haul and a mean of the 3 stations calculated. Data (number are only given for the larger crustaceans in the trawl catches because the larger mesh size and relative inefficiency of the seine for these species produced samples in which the smaller size groups were not adequately represented.
Fish species composition between years and be- tween gear types was compared in 3 ways. Firstly, on a presence or absence basis using Jaccard's coeffi- cient (Krebs 1989) which varies from 0 to 1 and gives a measure of the number of species in common between 2 samples. Secondly, rankings of species abundance on the basis of both numbers and weight were compared using Spearman's rank correlation coefficient; a significant correlation denotes close similarity in species rankings (Krebs 1989). Thirdly, a more quantitative comparison was made by convert- ing the number and weight of each fish species caught each year, after square root transformation, to a percentage of the total of all fish species caught that year. Square root transformation was considered necessary because all catches were dominated by one or a few species. These percentages were then used to calculate percent similarity (Krebs 1989). Each gear type was treated separately. A comparison was also made of species rankings when measured by weight and numbers (Spearman's rank correla- tion) for each gear type. The same statistics were cal-
culated for the trawl catches of the larger crus- taceans.
To examine temporal changes in species composition in more detail the number of samples in which a spe- cies was present each month was expressed as a per- centage of the number of samples taken in that month. This standardisation was necessary to account for slightly different sample numbers in each month. Pat- terns of occurrence suggested by this superficial analysis were tested using detrended correspondence analysis (DECORANA; Hill 1979a) and 2-way indicator species analysis (TWINSPAN; Hill 1979b). DECO- RANA is an ordination technique that assumes no sys- tematic relationships between the ordination axes and has many advantages over earlier methods (Gauch 1982, but see Raffaelli et al. 1991 and references therein). TWINSPAN is a technique that first classifies samples and then uses this sample classification to classify species according to their ecological prefer- ences. The 2 classifications are used together to pro- duce an ordered 2-way table that expresses the spe- cies' ecological relationships as succinctly as possible (Hill 197913). In each analysis samples taken within each month were combined and rare fish species, i.e. those in which 3 or less individuals were caught over the period of the investigation, were excluded. DECO- RANA and TWINSPAN were done with the Cornell Ecology Computer Package using presence and absence data and all default options except that only one cut level was used. These techniques have been used recently for fish communities by Bianchi (1991).
RESULTS
Variation in physical factors
Seawater temperatures at 5 m showed a clear annual cycle, reaching a minimum of 6 to 7 "C in Feb- ruary and a maximum of 13 to 14OC between July and September (Fig. 2A). There was little consistent differ- ence between the temperature at the surface and 5 m. Salinity at 5 m varied over a less well-defined annual cycle with minima in November to January and max- ima in April to June (Fig. 2B). The annual cycle in salinity was therefore 2 to 3 mo out of phase with the temperature cycle. Surface salinities were generally slightly lower than those at 5 m. The maxima were approximately the same (33 to 34%0) over the 3 yr measured but the minima depended on the rainfall during the early part of the year. Rainfall was particu- larly high in January and February 1989 and as a result the salinity fell to approximately 21 %. The pat- tern of wind strength and speed as measured by the wind factor, W, indicated that the strongest onshore

Mar. Ecol. Prog. Ser. 98: 89-105, 1993
Fig. 2. Variations in (A) temperature at 5 m, (B) salinity at 5 m and (C) wind factor at the study site between 1987 and 1989. Means of measurements at the 3 stations are plotted in (A) and (B). The calculation of the wind factor is explained in the text. High positive values are indicative of strong onshore
winds, hlgh negative values of strong offshore winds
winds (high positive values of W) tended to blow in the autumn months (Fig. 2C).
Species composition of catches
Fishes. Forty-three species of fishes were caught during the investigation (Tables 1 & 2). There was a considerable difference in the species composition of the catches made by trawl (35 species) and seine (32 species) and only 24 species were common to both gears. Comparison of species composition using pres- ence/absence data (Jaccard's coefficient) and numbers and weight (percent similarity and Spearman's cor- relation coefficient) demonstrated the &fference be- tween the gears (Table 3). Percent similarity never exceeded 49 % and rankings of abundance were only significantly correlated (p < 0.05) in 1989 (by numbers) (Table 3). For these reasons the catches made by trawls
and seines have been kept separate throughout. Withm one gear, however, species rankings by weight were always highly significantly correlated (p < 0.001) with species ranking by number.
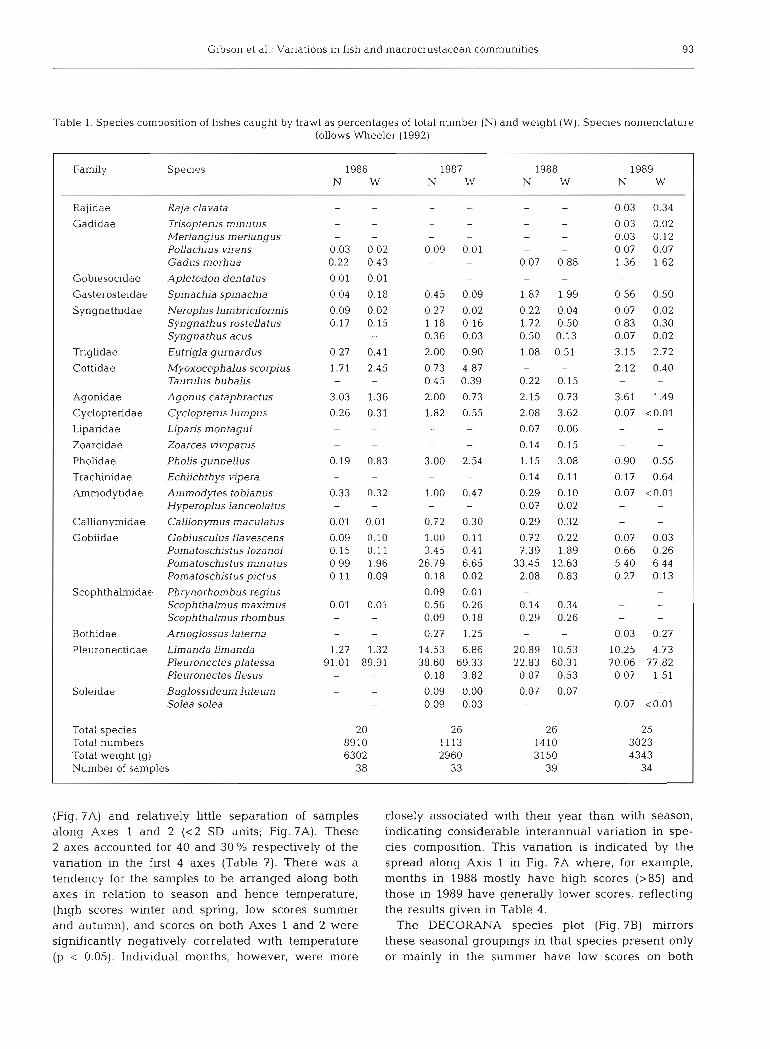
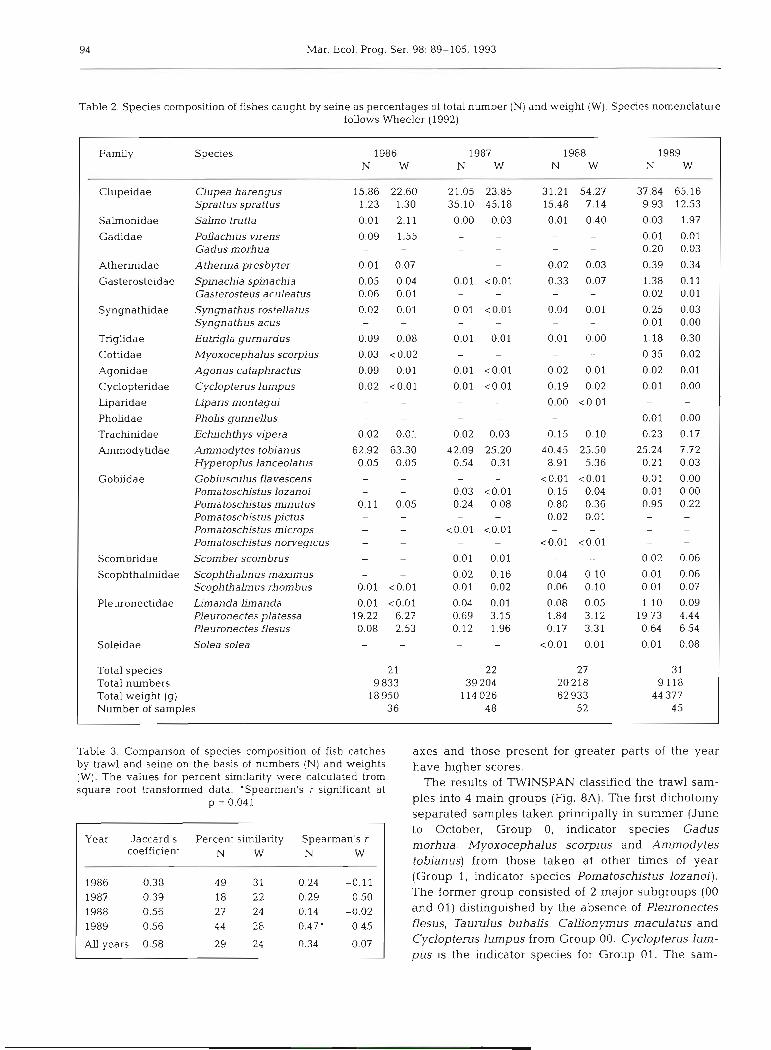
Trawl catches were dominated by Pleuronectes platessa particularly in 1986 and 1989 (Table 1) and between 3 and l l species made up 95 % or more of the catch whether measured by numbers or weight. Spe- cies composition of the trawl catches was generally similar between years, the differences in the percent- age similarity values (Table 4) being due mainly to dif- ferences in the relative contributions of plaice to the overall catch. Species rankings between years were significantly correlated in all cases (p < 0.01). Similar conclusions apply to the seine catches, but in this case 3 to 6 species made up 95 % or more of the catch and 3 dominant species (herring, sprat and sandeel) always accounted for 73 % or more of numbers and 85 % or more of the weight (Table 2). Differences in percent similarity between years (Table 4) were caused princi- pally by the changing relative contributions of the 3 dominant species. The years 1987 and 1988 were the most similar and 1986 and 1988 the least similar for both trawl and seine catches.
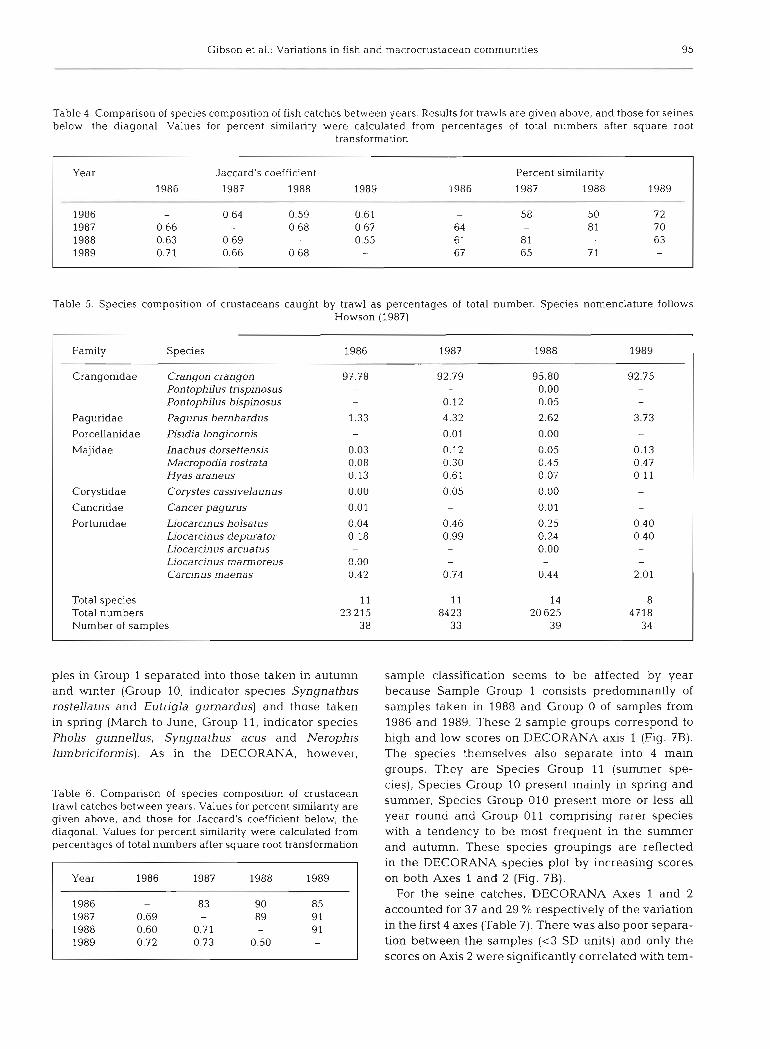
Crustaceans. The trawl catches of larger crus- taceans were dominated numerically by the brown shrimp Crangon crangon, which always made up more than 92 % of the catch (Table 5) . Fifteen species, principally brachyuran crabs and Pagurus bern- hardus, accounted for the remainder. The values for Jaccard's coefficient (Table 6) were similar to those for the trawl fish catches (Table 4) but the percent similarities were markedly higher and differed little from year to year (Table 6).
Variations in species occurrence
Fishes. More species were caught during the sum- mer and autumn than in winter and spring leading to an annual cycle in species richness (Figs. 3A & 4A). This cycle was caused by an influx of species in April and May and their disappearance from the catches in the later months of the year (Figs. 5 & 6). The differ- ence in species composition between winter and summer was particularly marked in the seine catches. For some species the 2 gear types presented slightly different patterns of occurrence. Limanda limanda and Syngnathus rostellatus, for example, were present in virtually every month in trawl catches but only during the summer months in seines.
Detrended correspondence analysis of the trawl data produced a complex picture in which there was no clear grouping of equivalent months over the 4 yr
Gibson et al.: Variations in fish and macrocrustacean communities 93
Table 1. Species composition of fishes caught by trawl as percentages of total number ( N ) and weight (W) . Species nomenclature follows Wheeler (1992)
Family Species
1 Rajidae Raja clavata - - - - - - 0.03 0.34 1 Gadidae Trisopterus minutus - - - - - 0.03 0.02
Merlangius merlangus - - - - - 0.03 0.12 PoUachjus virens 0.03 0.02 0.09 0 01 - - 0 07 0.07 Gadus morhua 0.22 0.43 - - 0.07 0.88 1.36 1.62
Gobiesocidae Apletodon dentatus 0.01 0.01 - - - - - -
Gasterosteidae Spinachia spinachia 0.04 0.18 0.45 0.09 1.87 1.99 0.56 0.50
Syngnathidae Nerophislumbriclformis 0.09 0.02 0.27 0.02 0.22 0.04 0.07 0.02 Syngnathus rosteUatus 0.17 0.15 1.18 0.16 1.72 0.50 0.83 0.30 Syngnathus acus - - 0.36 0.03 0.50 0.13 0.07 0.02
Triglidae Eutrigla gurnardus 0.27 0.41 2.00 0.90 1.08 0.51 3.15 2.72
Cottidae Myoxocephalus scorpius 1.71 2.45 0.73 4.87 - - 2.12 0.40 Ta urulus bubalis - - 0.45 0.39 0.22 0.15 -
Agonidae Agon us cataphractus 3.03 1.36 2.00 0.73 2.15 0.73 3.61 1.49 1 Cyclopteridae Cyclopterus lumpus 0.26 0.31 1.82 0.55 2.08 3.62 0.07 <0.01 1 Liparidae Liparis montagui - - - 0.07 0.06 - - I Zoarcidae Zoarces viviparus - - - - 0.14 0.15 - - I Pholidae Pholjs gunneUus 0.19 0.83 3.00 2.54 1.15 3.08 0.90 0.55 1 Trachlnidae Echi~chthys vipera - - - 0.14 0.11 0.17 0.64
Ammodytidae Arnmodytes tobianus 0.33 0.32 1.00 0.47 0.29 0.10 0.07 <0.01 Hyperoplus lanceolatus - - - 0.07 0.02 - -
Callionymidae Callionymus maculatus 0.01 0.01 0.72 0.30 0.29 0.32 - -
Gobiidae Gobiusculus flavescens 0.09 0.10 1.00 0.11 0.72 0.22 0.07 0.03 Pornatoschstus lozanoj 0.15 0.11 3.45 0.41 7.39 1.89 0.66 0.26 Pornatoschistus rninutus 0.99 1.96 26.79 6.65 33.45 12.63 5.40 6.44 Pomatoschistus pjctus 0.11 0.09 0.18 0.02 2.08 0.83 0.27 0.13
Scophthalmidae Phrynorhornbus regius - 0.09 0.01 - - -
Scoph thahus maximus 0.01 0.01 0.56 0.26 0.14 0.34 - -
Scoph thahus rhombus - - 0.09 0.18 0.29 0.26 - -
Bothidae Arnoglossus laterna - - 0.27 1.25 - 0.03 0.27
Pleuronectidae Limanda limanda 1.27 1.32 14.53 6.86 20.89 10.53 10.25 4.73 Pleuronectes platessa 91.01 89.91 38.60 69.33 22.83 60.31 70.06 77.82 Pleuronectes flesus - 0.18 3.82 0.07 0.53 0.07 1.51
Soleidae Buglossideum luteum - - 0 09 0.00 0.07 0.07 - Solea solea - - 0 09 0.03 - - 0.07 <0.01
Total species Total numbers Total weight ( g ) Number of samples
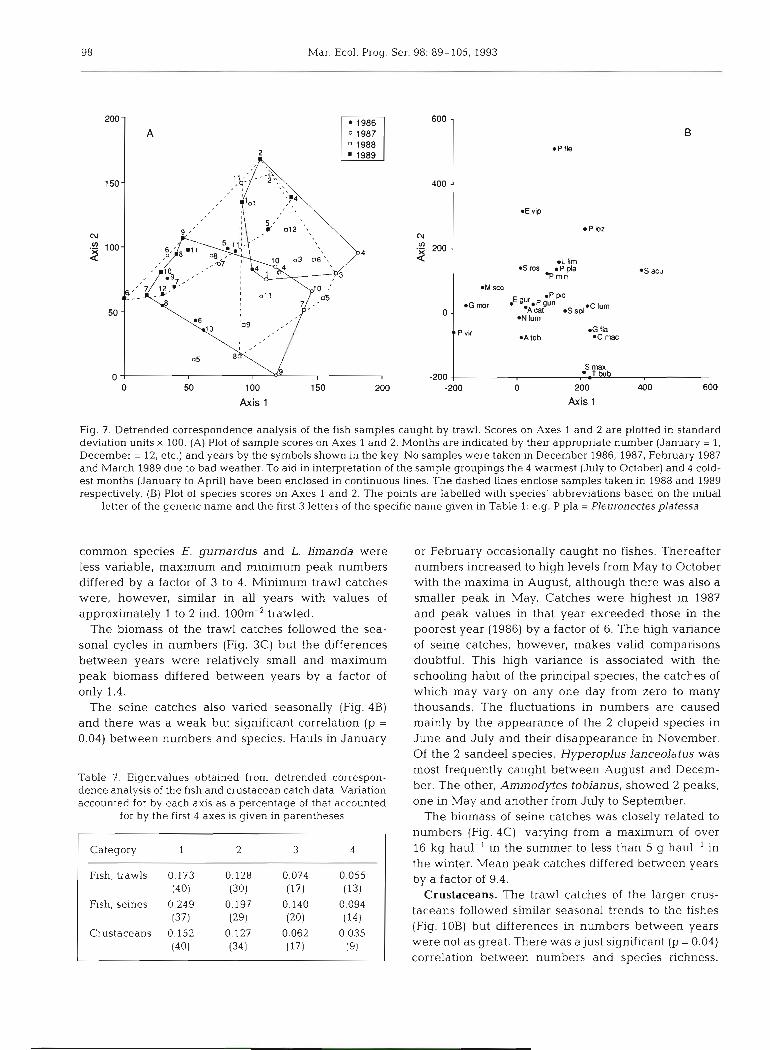
(Fig. ?A) and relatively little separation of samples along Axes 1 and 2 (c2 SD units; Fig. ?A). These 2 axes accounted for 40 and 30% respectively of the variation in the first 4 axes (Table 7). There was a tendency for the samples to be arranged along both axes in relation to season and hence temperature, (high scores winter and spring, low scores summer and autumn), and scores on both Axes 1 and 2 were significantly negatively correlated with temperature (p < 0.05). Individual months, however, were more
closely associated with their year than with season, indicating considerable interannual variation in spe- cies composition. This variation is indicated by the spread along Axis 1 in Fig. ?A where, for example, months in 1988 mostly have high scores (>85) and those in 1989 have generally lower scores, reflecting the results given in Table 4.
The DECORANA species plot (Fig. ?B) mirrors these seasonal groupings in that species present only or mainly in the summer have low scores on both
Mar. Ecol. Prog. Ser. 98: 89-105, 1993
Table 2. Species composition of fishes caught by seine as percentages of total number (N) and weight (W). Species nomenclature follows Wheeler (1992)
Farmly Species 1986 1987 1988 1989 N W N W N W N W
Clupeidae Clupea harengus 15.86 22.60 21.05 23.85 31.21 54.27 37.84 65.16 Sprattus sprattus 1.23 1.30 35.10 45.18 15.48 7.14 9.93 12.53
Salmonidae S a h o trutta 0.01 2.11 0.00 0.03 0.01 0.40 0.03 1.97
Gaddae Pollachius vjrens 0.09 1.55 - - - - 0.01 0.01 Gadus morhua - - - - - - 0.20 0.03
Atherinidae Atherina presbyter 0.01 0.07 - - 0.02 0.03 0.39 0.34
Gasterosteidae Spinachia spinachia 0.05 0.04 0.01 <0.01 0.33 0.07 1.38 0.11 Gasterosteus aculeatus 0.06 0.01 - - - 0.02 0.01
Syngnathidae Syngnathus rostella tus 0.02 0.01 0.01 <0.01 0.04 0.01 0.25 0.03 Syngnathus acus - - - - - 0.01 0.00
Triglidae Eutrigla gurnardus 0.09 0.08 0.01 0.01 0.01 0.00 1.18 0.30
Cottidae Myoxocephalus scorpius 0.03 <0.02 - - - 0.35 0.02
Agonidae Agonus cataphractus 0.09 0.01 0.01 <0.01 0.02 0.01 0.02 0.01
Cyclopteridae Cyclopterus lumpus 0.02 ~ 0 . 0 1 0.01 <0.01 0.19 0.02 0.01 0.00
Liparidae Lipans mon tagui - - - - 0.00 <0.01 - Pholidae Pholis gunnellus - - - - - 0.01 0.00
Trachinidae Echuchthys vipera 0.02 0.01 0.02 0.03 0.15 0.10 0.23 0.17
Ammodytidae Ammodytes toblanus 62.92 63.30 42.09 25.20 40.45 25.50 25.24 7.72 Hyperoplus lanceola tus 0.05 0.05 0.54 0.31 8.91 5.36 0.21 0.03
Gobiidae Gobiusculus flavescens - - - - <0.01 <0.01 0.01 0.00 Poma toschistus lozanoi - - 0.03 <0.01 0.15 0.04 0.01 0.00 Pomatoschistus minutus 0.11 0.05 0.24 0.08 0.80 0.36 0.95 0.22 Pomatoschistus pictus - - - - 0.02 0.01 - - Poma toschstus microps <0.01 <0.01 - - - - Poma toschis tus norvegicus - - <0.01 <0.01 - -
Scombridae Scorn ber scombrus - 0.01 0.01 - - 0.02 0.06
Scophthalmidae Scophthalmus maximus - - 0.02 0.16 0.04 0.10 0.01 0.06 Scophthalmus rhombus 0.01 <0.01 0.01 0.02 0.06 0.10 0.01 0.07
Pleuronectidae Limanda limanda 0.01 <0.01 0.04 0.01 0.08 0.05 1.10 0.09 Pleuronecfes platessa 19.22 6.27 0.69 3.15 1.84 3.12 19.73 4.44 Pleuronectes flesus 0.08 2.53 0.12 1.96 0.17 3.31 0.64 6.54
Soleidae Solea solea - - <0.01 0.01 0.01 0.08
Total species 21 22 27 31 Total numbers 9 833 39 204 20218 9 118 Total weight (g) 18 950 114 026 62 933 44 377 Number of samples 36 48 5 2 45
Table 3. Comparison of species composition of fish catches by trawl and seine on the basis of numbers (N) and weights (W). The values for percent similarity were calculated from square root transformed data. 'Spearman's r significant at
p = 0.041
Year Jaccard's Percent s i d a r i t y Spearman's r coefficient N W N W
1986 0.38 49 31 0.24 -0.11 1987 0.39 18 22 0.29 0 50 1988 0.56 27 24 0.14 -0.02 1989 0.56 44 28 0.47' 0.45
All years 0.58 29 24 0.34 0.07
axes and those present for greater parts of the year have higher scores.
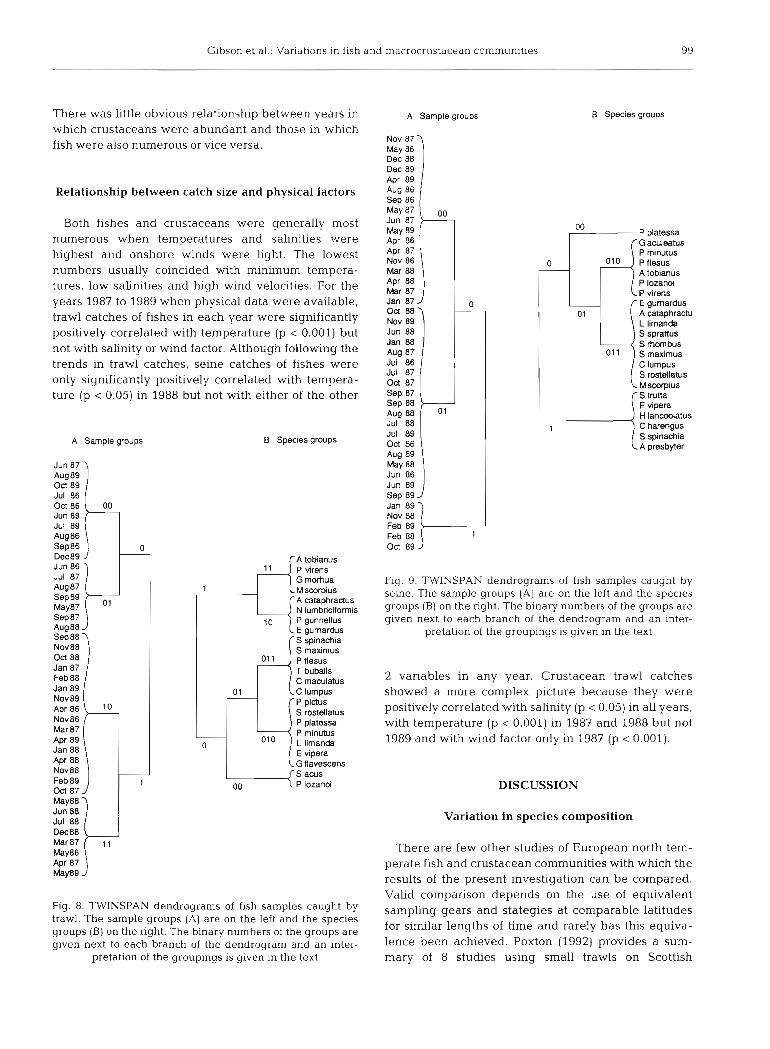
The results of TWINSPAN classified the trawl sam- ples into 4 main groups (Fig. BA). The first dichotomy separated samples taken principally in summer (June to October, Group 0, indicator species Gadus morhua, Myoxocephalus scorpius and Ammodytes tobianus) from those taken at other times of year (Group 1, indicator species Pomatoschistus lozanoi). The former group consisted of 2 major subgroups (00 and 01) distinguished by the absence of Pleuronectes flesus, Taumlus bubalis, Callionymus maculatus and Cycloptems lumpus from Group 00. Cyclopterus lum- pus is the indicator species for Group 01. The sam-
Gibson et a1 : Variations in fish and macrocrustacean communities 95
Table 4. Comparison of species composition of fish catches between years. Results for trawls are given above, and those for seines below, the diagonal. Values for percent similarity were calculated from percentages of total numbers after square root
transformation
Year Jaccard's coefficient Percent similarity
1986 1987 1988 1989 1986 1987 1988 1989
1986 - 0.64 0.59 0.61 - 5 8 5 0 7 2 1987 0.66 0.68 0.67 64 - 81 7 0 1988 0.63 0.69 - 0.55 61 81 - 63 1989 0.71 0.66 0.68 - 67 65 7 1 -
Table 5. Species composition of crustaceans caught by trawl as percentages of total number. Species nomenclature follows Howson (1987)
I Farmly Species 1986 1987 1988 1989 1 Crangonidae Crangon crangon 97.78 92.79 95.80 92.75
Pontophilus tnspinosus - - 0.00 -
Pontophilus bispinosus - 0.12 0.05 -
I Paguridae Pagurus bernhardus 1.33 4.32 2.62 3.73 1 Porcellanidae Pisidia long~cornis - 0.01 0.00 - Majidae Inachus dorsettensis 0.03 0.12 0.05 0.13
Macropodia ros trata 0.08 0.30 0.45 0.47 Hyas araneus 0.13 0.61 0.07 0.11
I Corystidae Corystes cassivelaunus 0.00 0.05 0.00 I Cancridae Cancer pagurus 0.01 - 0.01 -
Portunidae Liocarcinus holsatus 0.04 0.46 0.25 0.40 Liocarcinus depurator 0.18 0.99 0.24 0.40 Liocarcinus arcuatus - - 0.00 -
Liocarcinus marmoreus 0.00 - - -
Carcinus maenas 0.42 0.74 0.44 2.01
Total species Total numbers Number of samples
ples in Group 1 separated into those taken in autumn and winter (Group 10, indicator species Syngnathus rostellatus and Eutrigla gurnardus) and those taken in spring (March to June, Group 11, indicator species Pholis gunnellus, Syngnathus acus and Nerophis lumbnciformis). As in the DECORANA, however,
Table 6. Comparison of species composition of crustacean trawl catches between years. Values for percent similarity are given above, and those for Jaccard's coefficient below, the diagonal. Values for percent similarity were calculated from percentages of total numbers after square root transformation
Year 1986 1987 1988 1989
1986 - 83 90 85 1987 0.69 - 89 91 1988 0.60 0.71 - 9 1 1989 0.72 0.73 0.50
sample classification seems to be affected by year because Sample Group 1 consists predominantly of samples taken in 1988 and Croup 0 of samples from 1986 and 1989. These 2 sample groups correspond to high and low scores on DECORANA axis 1 (Fig. ?B). The species themselves also separate into 4 main groups. They are Species Group 11 (summer spe- cies), Species Group 10 present mainly in spring and summer, Species Group 010 present more or less all year round and Group 011 comprising rarer species with a tendency to be most frequent in the summer and autumn. These species groupings are reflected in the DECORANA species plot by increasing scores on both Axes 1 and 2 (Fig. ?B).
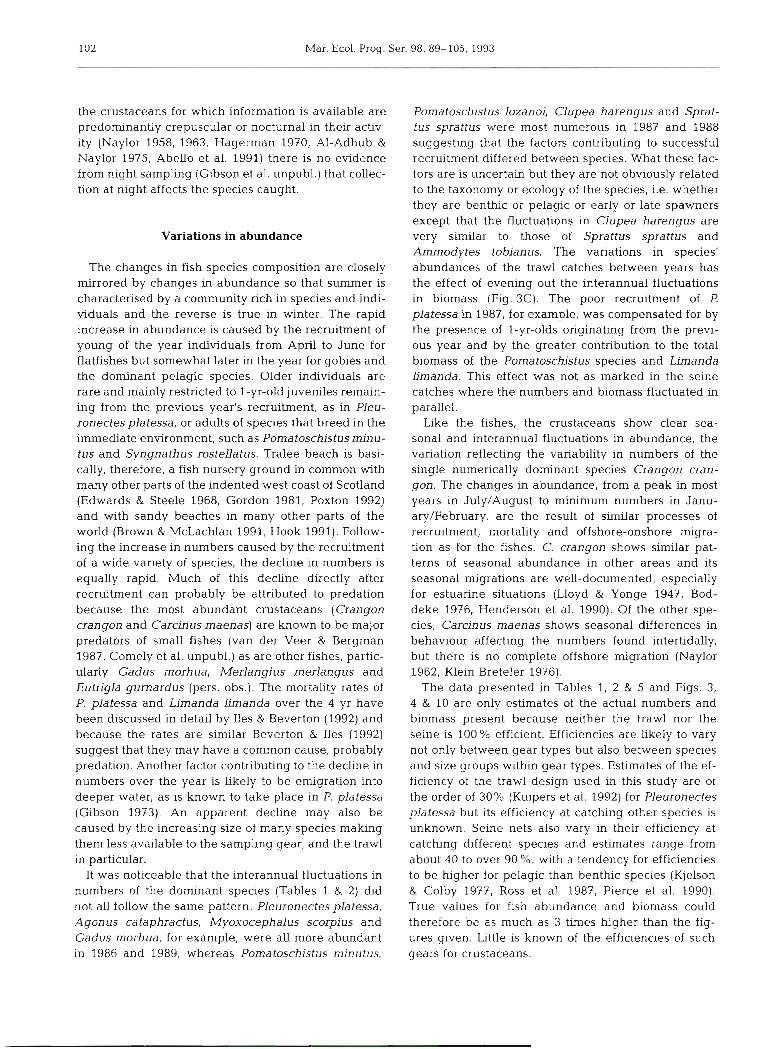
For the seine catches, DECORANA Axes 1 and 2 accounted for 37 and 29 % respectively of the variation in the first 4 axes (Table 7) . There was also poor separa- tion between the samples (<3 SD units) and only the scores on Axis 2 were significantly correlated with tem-

96 Mar. Ecol. Prog. Ser. 98: 89-105, 1993
Fig. 3. Variation in (A) number of fish species per sampling date, (B) individuals per 100 m2 trawled and (C) biomass per 100 m2 trawled, of fishes caught on each sampling date from April 1986 to December 1989. Values for individual samples
are plotted and the means joined by a continuous line
perature (p = 0.015). The species plot showed greater separation and 3 main groups could be recognised, com- parable to those identified by TWINSPAN (Fig. 9). Sam- ples in TWINSPAN Group 1 were taken early and late in the year. The samples in the large Group 0, whose indi- cator species were Pleuronectes flesus, Ammodytes tobianus, and Pomatoschistus minutus, consisted of 2 distinct subgroups. Group 00 samples (no indicator species) were taken from March to June and in Novem- ber and December and contained those species present all year round. The other sample subgroup, 01, (indica- tor species Limanda limanda, Spinachia spinachia, Clu- pea harengus and Sprattus sprattus) contained samples with most species and were taken in summer and autumn. The species groupings were slightly more com- plex. The first dichotomy separated the small Group 1, consisting principally of pelagic species present from summer to winter, from the large heterogeneous Group 0. The small subgroup 00 contained only Pleuro-
. . I " " ' " " ' 1 ' " ' '
1988 I 1989
Fig. 4 . Variation in (A) number of fish species, (B) number of individuals and (C) biomass per seine haul on each sampllng date from April 1986 to December 1989. Values for indvidual samples are plotted and the means joined by a continuous
line
nectes platessa present all year round. The remaining subgroup (01) contained species caught all year round except winter (Group 010) and those present principally in summer and autumn (Group 01 1).
In summary, the multivanate analyses identified 2 major groupings of the fish fauna. One consisted of species present all year round and the other of those present mainly in summer. No species were present only in winter.
Crustaceans. Although there was a tendency for the number of species to be lowest in January and Febru- ary (Fig. 10A) the seasonal variation in species richness was not as clear as that of the fish catches. Several spe- cies (Liocarcinus depurator, L. holsatus, Hyas araneus) were rare or absent during the winter from December to February (Fig. 11). Others such as Crangon crangon, Carcinus maenas and Pagurus bernhardus were pre- sent all year round but most numerous during the sum- mer and autumn.

Gibson et al.: Variations in flsh and macrocrustacean communities 97
P platessa P m nutus L limanda P lozanoi A cataphractus
correlation (p < 0.0001) between numbers and species richness (Fig. 3B) . After a min- lmum in the early months of the year catches increased to their maximum levels from June to September. Peak numbers were reached in June and July in 1986 and 1989 because of the strong year classes of plaice present in those years. In 1987 and 1988 when settlement of 0-group plaice was poor, numbers reached their peak in September and consisted mainly of other species, particularly Limanda limanda, Pomatoschistus spp. and Eutngla gurnar- dus. There were also considerable differ- ences in total catches between years (Fig. 3B) and there was a more than ?-fold difference in peak numbers between 1986 and 1987. The numbers of each species did not fluctuate in the same way. For the most common species (n > loo), Pleuronectes platessa, Agonus cataphractus and Myox- ocephalus scorpius were most abundant in 1986 and 1989. For P platessa the differ-
C lumpus A tobianus S rostellatus P piclus S spinachia E gurnardus P gunnellus S acus S rnaxirnus P flesus C maculatus E vipera G flavescens N lurnbriciformis G morhua Mscorpius T bubalis S rhombus P virens
ence was particularly striking because Fig. 5. Variation in the monthly occurrence of the commoner fish species (>3 individuals) caught by trawl. Results from equivalent months are there was a more than 100-fold difference
combined and the thickness of the lines remesents the Dercentaae of between the peak numbers 1986 and
- - - - 0
- - - -
- - -
- - -
samples in that month in which the species was present
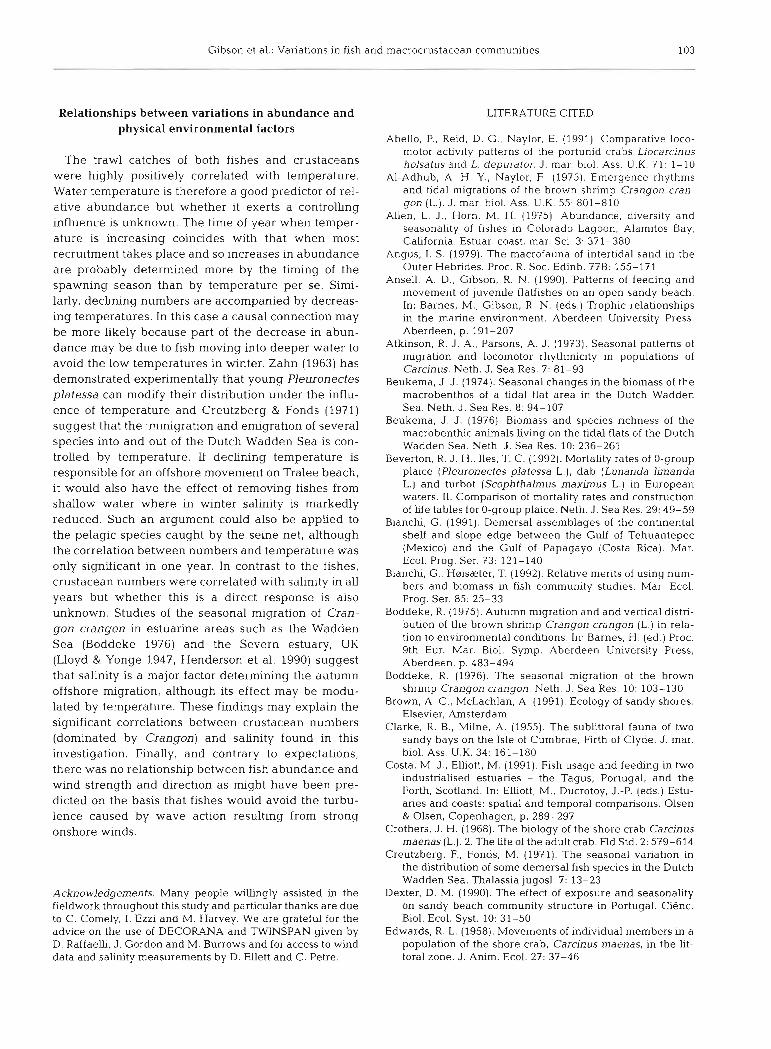
The most informative analysis of the crustaceans was provided by TWINSPAN rather than DECORANA. The first dichotomy of the TWINSPAN (Fig. 12) sep- P PIatessa
A tobianus arated samples characterised by Cancer P flesus
pagurus and Pontophilus bispinosus and p ,inutus - - -
taken between November and April Struna (Group 1) from the remainder. The latter Sspinachia group (0) was split into samples taken prin- A Presbyter
cipally in the summer and autumn (May to E 'bera P lozanoi
October, Group 01, indicator species Hyas Gaculeatus araneus and Inachus dorsettensis) and a H lanceolatus mixed group (00, no indicator species) spread over the year. The occurrence of most species in most months of the year resulted in poor separation of species groups in the TWINSPAN (Fig. 12) and 8 of the 11 species were contained in a single large group (01).
Variations in numbers and biomass
C lumpus S rostellatus L limanda C harengus E gurnardus S rhombus A cataphraclus S maxirnus S sprattus Mscorpius P virens
4
those of 1987. The Pornatoschistus species showed the opposite trend, they were commonest in 1987 and 1988. The 2 other
Fishes. Trawl catches showed marked Fig. 6 . Variation in the monthly occurrence of the commoner fish species (>3 individuals) caught by seine. Results from equivalent months are
changes that paralleled in combined and the thickness of the lines represents the percentage of species richness and there was a strong samples in that month in which the species was present
Mar. Ecol. Prog. Ser. 98: 89-105, 1993
0 50 100 150 200
Axis 1
@E vip
.L lim .S ms .P @a
.P min
I .M sol .P FiC
.G rmr 'Jur.p gun 0 -A cat .S spl -C IUrn
ON lum
*S acu
*A tob .G fla *C mac
Smax -200 -T bub
-200 0 200 400 600
Axis 1
Fig. 7. Detrended correspondence analysis of the fish samples caught by trawl. Scores on Axes 1 and 2 are plotted in standard deviation units X 100. (A) Plot of sample scores on Axes 1 and 2. Months are indicated by their appropriate number (January = 1, December = 12, etc.) and years by the symbols shown in the key. No samples were taken in December 1986, 1987, February 1987 and March 1989 due to bad weather. To aid m interpretation of the sample groupings the 4 warmest (July to October) and 4 cold- est months (January to April) have been enclosed in continuous lines. The dashed h e s enclose samples taken in 1988 and 1989 respectively. (B) Plot of species scores on Axes 1 and 2. The points are labelled with species' abbreviations based on the initial
letter of the generic name and the first 3 letters of the specific name given in Table 1: e.g. P pla = Pleuronectesplafessa
common species E. gurnardus and L. limanda were less variable, maximum and minimum peak numbers differed by a factor of 3 to 4. Minimum trawl catches were, however, similar in all years with values of approximately 1 to 2 ind. 100m-~ trawled.
The biomass of the trawl catches followed the sea- sonal cycles in numbers (Fig. 3C) but the differences between years were relatively small and maximum peak biomass differed between years by a factor of only 1.4.
The seine catches also varied seasonally (Fig. 4B) and there was a weak but significant correlation (p =
0.04) between numbers and species. Hauls in January
Table 7. Eigenvalues obtained from detrended correspon- dence analysis of the fish and crustacean catch data. Variation accounted for by each axis as a percentage of that accounted
for by the first 4 axes is given in parentheses
Category 1 2 3 4
Fish, seines 0.249 (37)
Crustaceans 0.152 (40)
or February occasionally caught no fishes. Thereafter numbers increased to high levels from May to October with the maxima in August, although there was also a smaller peak in May. Catches were highest in 1987 and peak values in that year exceeded those in the poorest year (1986) by a factor of 6 . The high variance of seine catches, however, makes valid comparisons doubtful. This high variance is associated with the schooling habit of the principal species, the catches of which may vary on any one day from zero to many thousands. The fluctuations in numbers are caused mainly by the appearance of the 2 clupeid species in June and July and their disappearance in November. Of the 2 sandeel species, Hyperoplus lanceolatus was most frequently caught between August and Decem- ber. The other, Ammodytes tobianus, showed 2 peaks, one in May and another from July to September.
The biomass of seine catches was closely related to numbers (Fig. 4C), varylng from a maximum of over 16 kg haul-' in the summer to less than 5 g haul-' in the winter. Mean peak catches differed between years by a factor of 9.4.
Crustaceans. The trawl catches of the larger crus- taceans followed similar seasonal trends to the fishes (Fig. 10B) but differences in numbers between years were not as great. There was a just significant (p = 0.04) correlation between numbers and species richness.
Gibson et al.: Variations in fish and macrocrustacean communities 99
There was little obvious relationship between years in which crustaceans were abundant and those in which fish were also numerous or vice versa.
Relationship between catch size and physical factors
Both fishes and crustaceans were generally most numerous when temperatures and salinities were highest and onshore winds were light. The lowest numbers usually coincided with minimum tempera- tures, low salinities and high wind velocities. For the years 1987 to 1989 when physical data were available, trawl catches of fishes in each year were significantly positively correlated with temperature (p < 0.001) but not with salinity or wind factor. Although following the trends in trawl catches, seine catches of fishes were only significantly positively correlated with tempera- ture (p < 0.05) in 1988 but not with either of the other
A Sample groups B Species groups
Jun 87 Aug89
Jun 89 Jul 89 Aug 86
0
May88
Jul 88 Dec88 Mar87 p May86 Aor 87
A tobianus P virens G momua Mscorpius A cataphraaus N lurnbridtormis P gunnellus E gurnardus S spinachia S maximus P flesus T bubalis C rnaculatus C lurnpus P pictus S roaellatus P platessa P minutus
E vipera G flavescens S acus P lozanoi
Fig. 8. TWINSPAN dendrograms of fish samples caught by trawl. The sample groups (A) are on the left and the species groups (B) on the right. The binary numbers of the groups are given next to each branch of the dendrogram and an inter-
pretation of the groupings is given in the text
A Sample groups B Species groups
Nov 87 1
P platessa G aculeatus P minutus P flesus A tobianus P lozanoi P virens
May 86 Dec 88 Dec 89 Apr 89 Aug 86 Sep 86 May 87 Jun 87 May 89 Apr 86 Apr 87 Nov 86 Mar 88 Apr 88 Mar 87
E gurnardus A cataphractu L limanda S sprattus S rhombus S maximus C lumpus S rostellatus Mscorpius S tnma E vipera H lanceolatus C harengus S spinachia A presbyter
00
Fig. 9. WINSPAN dendrograms of fish samples caught by seine. The sample groups (A) are on the left and the species groups (B) on the right. The binary numbers of the groups are given next to each branch of the dendrogram and an inter-
pretation of the groupings is given in the text
2 variables in any year. Crustacean trawl catches showed a more complex picture because they were positively correlated with salinity (p < 0.05) in all years, with temperature (p 0.001) in 1987 and 1988 but not 1989 and with wind factor only in 1987 (p < 0.001).
Jan 87 oa 88 1 Nov 89 Jun 88 Jan 88 Aug 87 Jul 86 Jul 87 Oct 87 Sep 87 Sep 88
DISCUSSION
0
Variation in species composition
There are few other studies of European north tem- perate fish and crustacean communities with which the results of the present investigation can be compared. Valid comparison depends on the use of equivalent sampling gears and stategies at comparable latitudes for similar lengths of time and rarely has this equiva- lence been achieved. Poxton (1992) provides a sum- mary of 8 studies using small trawls on Scottish
Aug88 Jul 88 Jul 89 Oct 86 Aug 89 May 88 Jun 86 Jun 89
O1
Sep 89 J Jan 89 Nov 88 Feb 89 Feb 88 1 Oct 89

Mar. Ecol. Prog. Ser 98: 89-105, 1993
A Sample groups B Species groups
Fig. 10. Variation in the numbers of species per sampling date (A) and individuals (B) of larger crustaceans caught per 100 m2 trawled from April 1986 to December 1989. Individual samples are plotted and the means joined by a continuous
line
beaches that can be used to illustrate the problem. The number of species caught in each study was signifi- cantly positively correlated (Spearman's rank correla- tion) with depth range (p < 0.01), and with duration of the survey in years (p i 0.01) but not with the number of samples taken (p > 0.5). Survey duration has previ- ously been recognised as a confounding factor in such comparisons (Ross 1983) as has the influence of depth on species abundance and distribution (Gibson 1973, Riley et al. 1981). Nevertheless, the 35 species caught by trawl in this investigation is considerably more than the number (approximately 20) estimated as typical for
C crangon P bernhardus C rnaenas L depurator M rostrata L holsatus C cassivelaunu
H araneus I dorsenensis
P bispinosus C pagurus
L depurator C cassivelaunus C crangon C rnaenas P bernhardus L holsatus M r o m t a H araneus I dorsenensls
Jul 87 May 86 Jun 87 Aug 86 May 88 Aug 88 May 89 013 86 May 87 Aug 87 Jul 88
Flg. 12. TWINSPAN dendrograms of crustacean samples caught by trawl The sample groups (A) are on the left and the species groups (B) on the right. The binary numbers of the groups are given next to each branch of the dendrogram and
an interpretation of the groupings is given In the text
0
any one Scottish beach by Poxton (1992). The differ-
Sep 88 0' Sep 89 Apr 86 Apr 88 Oct 87 Sep 86 Oct 88 Mar 88 Nov 89 Dec 89 Apr 87 Feb 88 Nov 88 Dec 88 1 Mar 87 Nov 86
ence can be mainly ascribed to more intensive sam- pling. The small size of the beach and its close proxim-
ity to adjacent rocky headlands, however, although typical of many Scottish west coast beaches in this respect (Elefthenou & Mcln-
]looO10 tyre 1976), may have resulted in the capture of individuals of some species whose normal habitat is rocky shores. Comparisons with other geographical areas are confounded by the effects of latitude (Henderson 1989) and methods of capture but the 4 3 fish species caught here may be compared with the 39 predicted from the relationship between lati- tude and species number derived by Hender- son (1989) from catches at power stations located throughout England and Wales. A
Fig. 11 Variation in the monthly occurrence of the crustacean species caught by trawl Results from equivalent months are combined and the further factor confounding cornpanson is
thickness of the hnes represents the percentage of samples in that month salinity, although in the Forth estuary at a in which the species was present comparable latitude on the east coast of Scot-

Gibson et al.: Variations in fish and macrocrustacean communities 101
land Costa & Elliott (1991) also caught 43 species in a long-term trawl survey.
As in most other shallow water fish comnlunities (Allen & Horn 1975) a few common species are domi- nant both in terms of numbers and biomass, both of which are considered adequate measures of commu- nity composition (Bianchi & Hmszter 1992). In the pre- sent case assessment of dominance depends on the gear type used. The trawl catches consisted predorni- nantly of 3 benthic species, 2 flatfishes (Pleuronectes platessa and Limanda limanda) and a goby (Pomato- schistus minutus) in all 4 years, whereas the seines were dominated in varying proportions by 3 pelagic species (Ammodytes tobianus, Clupea harengus and Sprattus sprattus) although P. platessa still made up a significant part of the catch. The dominance of clu- peoids in seine catches is a common feature in many parts of the world (e.g. Allen & Horn 1975, Modde & Ross 1980, Nash 1986, Reina-Hervas & Serrano 1987, Hook 1991) but flatfishes only seem to form a signifi- cant proportion of benthic species at higher latitudes (Nash 1986, Poxton 1992, this study). The differences in the species composition between the 2 gear types can be related to the different efficiencies with which they catch benthic and pelagic species and to the dif- ference in the depths at which they were fished.
All samples in this investigation were taken at low tide during the day. The description of species compo- sition given here therefore applies only to the hours of daylight. In other studies undertaken elsewhere diel changes have been observed in species composition, size distribution and abundance (Lasiak 1984, Nash 1986, Ross et al. 1987) and related to day/night differ- ences in net avoidance and to diel onshore-offshore movements. Subsequent sampling on Tralee beach at night (Gibson et al. unpubl.) demonstrated that there were also differences in day-night catches on this beach caused mainly by the nocturnal absence of the diurnal sandeel species and the onshore movement of gadoids at sunset. There is also a significant onshore movement of juvenile flatfish at night (Burrows et al. unpubl.). Although more species were generally caught at night, the day and night species lists differed only in 2 species, each of which was represented by one individual.
The major temporal differences in species richness, however, occur on a seasonal basis. There is strong evidence that the fish community is based on a set of 'regular' species, using Tyler's (197 1) tern~inology, pre- sent in varying abundance all year round. From May onwards the community is augmented by the arrival of 'periodic' species that are mostly present on the beach until November after which the number of species declines rapidly. Some differences in the species com- position of seine catches between summer and winter
are not reflected in trawl catches, suggesting that for some species at least, Llmanda limanda and Syngna- thus rostellatus for example, the decline is due to a movement into deeper water in the later part of the year. The TWINSPAN results indicated that more subtle species groupings may be present. In addition to the summer periodics caught by the trawls there are 2 further groups of penodics present mostly in spring/summer and summer/autumn (Figs. 5 & 8). The distinction between regulars and periodics is much clearer in the seine catches (Figs. 6 & 9) and both sets of data show that there is no evidence for separate summer and winter communities composed of differ- ent species. Although the regular species are consis- tent from year to year there is considerable variation in the appearance of the periodics. Consequently, the exact species composition of the community is unpre- dictable and gives rise to relatively low species similar- ity values among years (Table 4) and only loose clus- tering of equivalent months in the DECORANA plots (Fig. 7). Such seasonal and annual fluctuations in spe- cies richness and composition seem to be a feature of many sandy beach fish communities (e.g. Modde & Ross 1980, Reina-Hervas & Serrano 1987, Ross et al. 1987, Brown & McLachlan 1991, Hook 1991).
There are no other studies of European north tem- perate epibenthic crustacean communities with which the present results can be compared. Edwards & Steele (1968) carried out a similar sampling programme with beam trawl and seine nets at Firemore Bay, Loch Ewe, Scotland, but did not publish full species lists of either the fishes or crustaceans collected, of the latter they mention only Crangon and Portunus spp. Limited trawl surveys of beaches in Scotland, in Broad Bay, Lewis, and on the west coast of Harris (Ansell unpubl.) caught 7 and 12 species of crustaceans respectively (12 in all) of which 5 and 9 (9 in all) were also recorded here. Similar surveys at St. Andrews caught 8 species of crustaceans of which 7 were also recorded here.
The crustacean catches were dominated by the shrimp Crangon crangon. This species, together with the shore crab Carcinus maenas, is a ubiquitous mem- ber of the larger motile epifauna on northern European beaches (Salvat 1962, Macer 1967, Edwards & Steele 1968, Pihl & Rosenberg 1982, Evans & Tallmark 1985, Jensen & Jensen 1985, Pihl 1985, Le Mao 1986, Gee 1987, van de Veer & Bergman 1987, Rafaelli et al. 1989).
The temporal changes in the crustacean populations are less than those of the fish and most species appear to be 'regular' although present in varying abundance through the year. There are no species which could be classified as 'periodic'; rather the community consists of a small number of species of which a significant pro- portion occurs only relatively rarely. Although most of
Mar. Ecol. Prog. Ser. 98: 89-105, 1993
the crustaceans for which information is available are predominantly crepuscular or nocturnal in their activ- ity (Naylor 1958, 1963, Hagerman 1970, Al-Adhub & Naylor 1975, Abello et al. 1991) there is no evidence from night sampling (Gibson et al. unpubl.) that collec- tion at night affects the species caught.
Variations in abundance
The changes in fish species composition are closely mirrored by changes in abundance so that summer is characterised by a community rich in species and indi- viduals and the reverse is true in winter. The rapid increase in abundance is caused by the recruitment of young of the year individuals from April to June for flatfishes but somewhat later in the year for gobies and the dominant pelagic species. Older individuals are rare and mainly restricted to I-yr-old juveniles remain- ing from the previous year's recruitment, as in Pleu- ronectes platessa, or adults of species that breed in the immediate environment, such as Pornatoschistus rninu- tus and Syngnathus rostellatus. Tralee beach is basi- cally, therefore, a fish nursery ground in common with many other parts of the indented west coast of Scotland (Edwards & Steele 1968, Gordon 1981, Poxton 1992) and with sandy beaches in many other parts of the world (Brown & McLachlan 1991, Hook 1991). Follow- ing the increase in numbers caused by the recruitment of a wide variety of species, the decline in numbers is equally rapid. Much of this decline directly after recruitment can probably be attributed to predation because the most abundant crustaceans (Crangon crangon and Carcinus maenas) are known to be major predators of small fishes (van der Veer & Bergman 1987, Comely et al. unpubl.) as are other fishes, partic- ularly Gadus morhua, Merlangius merlangus and Eutrigla gumardus (pers, obs.). The mortality rates of P. platessa and Limanda Limanda over the 4 yr have been discussed in detail by Iles & Beverton (1992) and because the rates are similar Beverton & Iles (1992) suggest that they may have a common cause, probably predation. Another factor contributing to the decline in numbers over the year is likely to be emigration into deeper water, as is known to take place in P. platessa (Gibson 1973). An apparent decline may also be caused by the increasing size of many species making them less available to the sampling gear, and the trawl in particular.
It was noticeable that the interannual fluctuations in numbers of the dominant species (Tables 1 & 2) did not all follow the same pattern. Pleuronectes platessa, Agonus cataphractus, Myoxocephalus scorpius and Gadus rnorhua, for example, were all more abundant in 1986 and 1989, whereas Pomatoschistus minutus,
Pomatoschistus lozanoi, Clupea harengus and Sprat- tus sprattus were most numerous in 1987 and 1988 suggesting that the factors contributing to successful recruitment differed between species. What these fac- tors are is uncertain but they are not obviously related to the taxonomy or ecology of the species, i.e. whether they are benthic or pelagic or early or late spawners except that the fluctuations in Clupea harengus are very similar to those of Sprattus sprattus and Ammodytes tobianus. The variations in species' abundances of the trawl catches between years has the effect of evening out the interannual fluctuations in biomass (Fig. 3C). The poor recruitment of P. platessa in 1987, for example, was compensated for by the presence of l-yr-olds originating from the previ- ous year and by the greater contribution to the total biomass of the Pomatoschistus species and Limanda Limanda. This effect was not as marked in the seine catches where the numbers and biomass fluctuated in parallel.
Like the fishes, the crustaceans show clear sea- sonal and interannual fluctuations in abundance, the variation reflecting the variability in numbers of the single numerically dominant species Crangon cran- gon. The changes in abundance, from a peak in most years in July/August to minimum numbers in Janu- ary/February, are the result of similar processes of recruitment, mortality and offshore-onshore migra- tion as for the fishes. C. crangon shows similar pat- terns of seasonal abundance in other areas and its seasonal migrations are well-documented, especially for estuarine situations (Lloyd & Yonge 1947, Bod- deke 1976, Henderson et al. 1990). Of the other spe- cies, Carcinus maenas shows seasonal differences in behaviour affecting the numbers found intertidally, but there is no complete offshore migration (Naylor 1962, Klein Breteler 1976).
The data presented in Tables 1 , 2 & 5 and Figs. 3, 4 & 10 are only estimates of the actual numbers and biomass present because neither the trawl nor the seine is 100 % efficient. Efficiencies are likely to vary not only between gear types but also between species and size groups within gear types. Estimates of the ef- ficiency of the trawl design used in this study are of the order of 30% (Kuipers et al. 1992) for Pleuronectes platessa but its efficiency at catching other species is unknown. Seine nets also vary in their efficiency at catching different species and estimates range from about 40 to over 90 %, with a tendency for efficiencies to be higher for pelagic than benthic species (Kjelson & Colby 1977, Ross et al. 1987, Pierce et al. 1990). True values for fish abundance and biomass could therefore be as much as 3 times higher than the fig- ures given. Little is known of the efficiencies of such gears for crustaceans.
Gibson et al.: Variations in fish and macrocrustacean communities 103
Relationships be tween variat ions in a b u n d a n c e a n d physical env i ronmenta l factors
T h e trawl catches of both fishes a n d crustaceans w e r e highly positively correlated with temperature. Water temperature is therefore a good predictor of rel- ative a b u n d a n c e but whether it exerts a controlling influence is unknown. T h e time of year w h e n temper- a tu re is increasing coincides with that w h e n most recruitment t akes place a n d s o increases in a b u n d a n c e a r e probably determined more by the timing of the spawning season than by temperature p e r se. Simi- larly, declining numbers a r e accompanied by decreas- i n g temperatures . In this case a causal connection m a y b e more likely because part of t h e decrease in a b u n - d a n c e m a y b e d u e to fish moving into d e e p e r wate r to avoid t h e low temperatures i n winter. Zahn (1963) h a s demonstrated experimentally that young Pleuronectes platessa c a n modify their distribution u n d e r t h e influ- e n c e of temperature a n d Creu tzberg & Fonds (1971) sugges t that t h e immigration a n d emigration of several species into and out of t h e Dutch W a d d e n S e a is con- trolled by temperature. If declining temperature is responsible for a n offshore nlovement on Tralee beach , it would also h a v e the effect of removing fishes from shallow wate r w h e r e in winter salinity is markedly reduced. Such a n a rgument could also b e appl ied t o the pelagic species caught by t h e seine ne t , a l though the correlation be tween numbers a n d temperature w a s only significant in o n e year. In contrast to t h e fishes, crustacean numbers w e r e correlated with salinity in all years but whether this is a direct response is also unknown. Studies of the seasonal migration of Cran- gon crangon in estuarine a r e a s such a s t h e Wadden S e a (Boddeke 1976) a n d t h e Severn estuary, UK (Lloyd & Yonge 1947, Henderson e t al. 1990) suggest that salinity is a major factor determining the a u t u m n offshore migration, a l though its effect m a y b e modu- la ted by temperature. These findings m a y explain t h e significant correlations be tween crustacean numbers (dominated by Crangon) a n d salinity found in this investigation. Finally, a n d contrary to expectations, the re w a s n o relationship be tween fish a b u n d a n c e a n d wind s trength a n d direction a s might h a v e b e e n pre - dicted on the basis that fishes would avoid t h e turbu- l ence caused by w a v e action resulting from strong onshore winds.
Acknowledgements. Many people wihngly assisted in the fieldwork throughout this study and particular thanks are due to C. Comely, I. Ezzi and M. Harvey. We are grateful for the advice on the use of DECORANA and TWINSPAN given by D. Raffaelh, J. Gordon and M. Burrows and for access to wind data and salinity measurements by D. Ellett and C. Petre.
LITERATURE CITED
Abello, P., Reid, D. G . , Naylor, E. (1991). Comparative loco- motor activity patterns of the portunid crabs Liocarcinus holsatus and L. depurator. J . mar. biol. Ass. U.K. 71: 1-10
Al-Adhub, A. H. Y., Naylor, E. (1975). Emergence rhythms and tidal migrations of the brown shrimp Crangon cran- gon (L.). J. mar. biol. Ass. U K 55: 801-810
Allen, L J., Horn, M. H. (1975) Abundance, diversity and seasonality of f~shes in Colorado Lagoon, Alamitos Bay, California. Estuar. coast. mar. Sci. 3: 371-380
Angus. I. S. (1979). The macrofauna of intertidal sand in the Outer Hebrides. Proc. R. Soc. Edinb. 77B: 155-171
Ansell, A. D., Gibson, R. N. (1990). Patterns of feeding and movement of juvenile flatfishes on an open sandy beach. In: Barnes, M,, Gibson, R. N. (eds.) Trophic relationships in the marine environment. Aberdeen University Press, Aberdeen, p. 191-207
Atlunson, R. J. A., Parsons, A. J. (1973). Seasonal patterns of migration and locomotor rhythmicity in populations of Carcinus. Neth. J. Sea Res. 7: 81-93
Beukema, J . J. (1974). Seasonal changes in the biomass of the macrobenthos of a tidal flat area in the Dutch Wadden Sea. Neth. J. Sea Res. 8: 94-107
Beukema, J . J. (1976). Biomass and species nchness of the macrobenthic animals living on the tidal flats of the Dutch Wadden Sea. Neth. J. Sea Res. 10: 236-261
Beverton, R. J . H., Iles, T. C. (1992). Mortality rates of 0-group plaice (Pleuronectes platessa L.), dab (Limanda limanda L.) and turbot (Scophthalmus maximus L.) in European waters. 11. Comparison of mortality rates and construction of life tables for 0-group plaice. Neth. .I. Sea Res. 29: 49-59
Bianchi, G. (1991). Demersal assemblages of the continental shelf and slope edge between the Gulf of Tehuantepec (Mexico) and the Gulf of Papagayo (Costa Rica). Mar. Ecol. Prog. Ser. 73: 121-140
Bianchi, G., Hoisater. T. (1992). Relative merits of using num- bers and biomass in fish community studies. Mar. Ecol. Prog. Ser. 85: 25-33
Boddeke, R. (1975). Autumn migration and and vertical distri- buhon of the brown shrimp Crangon crangon ( L . ) in rela- tion to environmental conditions. In: Barnes. H. (ed.) Proc. 9th Eur. Mar. Biol. Syrnp. Aberdeen University Press, Aberdeen, p. 483-494
Boddeke, R. (1976). The seasonal migration of the brown shnmp Crangon crangon. Neth. J. Sea Kes. 10: 103-130
Brown, A. C., McLachlan, A. (1991). Ecology of sandy shores. Elsevier, Amsterdam
Clarke, R. B., Milne. A. (1955). The sublittoral fauna of two sandy bays on the Isle of Cumbrae, Firth of Clyde. J. mar. biol. Ass. U.K. 34: 161-180
Costa, M. J., Elliott, M. (1991). Fish usage and feedlng in two industrialised estuaries - the Tagus, Portugal, and the Forth, Scotland. In: Elliott, M., Ducrotoy, J.-P. (eds.) Estu- aries and coasts: spatial and temporal compansons. Olsen & Olsen, Copenhagen, p, 289-297
Crothers. J. H. (1968). The biology of the shore crab Carcinus maenas (L.). 2. The life of the adult crab. Fld Std. 2: 579-614
Creutzberg, F., Fonds. M. (1971). The seasonal variation in the distribution of some demersal fish species in the Dutch Wadden Sea. Thalassia jugosl. 7: 13-23
Dexter, D. M. (1990). The effect of exposure and seasonality on sandy beach community structure in Portugal. Ci&nc. Biol. Ecol. Syst. 10: 31-50
Edwards, R. L. (1958). Movements of individual members in a population of the shore crab, Carcinus maenas, in the lit- toral zone. J. Anirn. Ecol. 27: 37-46
104 Mar. Ecol. Prog. Ser. 98: 89-105, 1993
Edwards, R. R. C., Steele, J. H. (1968). The ecology of 0-group plaice and common dabs at Loch Ewe. I . Population and food. J . exp. mar. Biol. Ecol 2: 215-238
Eleftheriou, A., McIntyre, A. D. (1976). The intertidal fauna of sandy beaches - a survey of the Scottish coast. Scottish Fish. Res. Rept 6: 1-61
Eleftheriou, A., Nicholson, M. D. (1975). The effects of expo- sure on beach fauna. Cah. Biol. mar. (suppl). 16: 695-710
Eleftheriou, A., Robertson, M. R. (1988). The intertidal fauna of sandy beaches - a survey of the east Scottish coast. Scottish Fish. Res. Rept 38: 1-52
Evans, S., Tallmark, B. (1985). Niche separation within the mobile predator g d d on marine shallow soft bottoms. Mar. Ecol. Prog. Ser. 23: 279-286
Gauch, H. G. (1982). Multivariate analysis in community ecol- ogy. Cambridge University Press, Cambridge
Gibson, R. N. (1973). The intertidal movements and distribu- tion of young fish on a sandy beach with special reference to the plaice (Pleuronectes platessa L.) . J . exp. mar Biol. Ecol. 12: 79-102
Gee, J. M. (1987). Impact of epibenthic predation on estuarine intertidal harpacticoid copepod populations. Mar. Biol. 96: 497-510
Gordon, J. D. M. (1981). The fish populations of the west of Scotland shelf. A. Rev. Oceanogr. mar. Biol. 19: 405-441
Gregory, S. F. (1988). An investigation of the invertebrate macrofauna of a sandy beach near Oban, Argyll, with spe- cific study of mouthpart components of Bathyporeia pilosa Lindstrom and B. pelagica (Bate) (Amphipoda: Haustori- idae). B.Sc. (Hons) thesis, University of Stirling
Hagerman. L. (1970). Locomotory activity patterns of Cran- gon vulgaris (Fabricius) (Crustacea, Natantia). Ophelia 8: 255-256
Henderson, P. A (1989). On the structure of the inshore fish community of England and Wales. J , mar. biol. Ass. U.K. 69: 145-163
Henderson, P. A., Seaby, R., Marsh, S. J . (1990). The popula- tion zoogeography of the common shrimp (Crangon cran- gon) in British waters. J . mar. biol. Ass. U.K. 70: 89-97
Hill, M. 0. (1979a). DECORANA. A FORTRAN program for detrended correspondence analysis and reciprocal aver- aging. Cornell University, lthaca
Hill, M. 0. (1979b). TWINSPAN. A FORTRAN program for arranging multivariate data in an ordered two-way table by classification of the indviduals and attributes. Cornell University, lthaca
Hook, J . H. (1991). Seasonal variation in relative abundance and species diversity of fishes in South Bay. Contrib. mar. Sci. 32: 127-141
Howson, C. M. (ed.) (1987). Directory of the British marine fauna and flora. A coded checklist of the marine fauna and flora of the British Isles and its surrounding seas. Marine Conservation Society, Ross-on-Wye
Iles, T. C., Beverton, R. J H. (1992). Mortality rates of 0-group plaice (Pleuronectes platessa L.) , dab (Limanda h a n d a L.) and turbot (Scophthalrnus maximus L.) in European waters. I. Statistical analysis of the data and estimation of parameters. Neth. J. Sea Res. 27: 217-235
Janssen, G. M., Kuipers, B. R. (1980). On tidal migration in the shrimp Crangon crangon. Neth. J. Sea. Res. 14: 339-348
Jensen, K. T., Jensen, J N. (1985). The importance of some ep iben t lc predators on the density of juvenile benthic macrofauna in the Danish Wadden sea. J. exp. mar. Biol. Ecol. 89: 157-174
Jones, A. (1973). The ecology of young turbot Scophthalmus maximus (L.) at Borth, Cardiganshre, Wales. J . Fish Biol 5: 367-383
Kjelson, M. A., Colby, D. R. (1977). The evaluation and use of gear efficiencies in the estimation of estuarine fish abun- dance. In: Estuarine processes, Vol. 2, Circulation, sedi- ments and transfer of material in the estuary. Academic Press, New York
Klein Breteler, W. C. M. (1976). Migrahon of the shore crab, Carcinus maenas, in the Dutch Wadden Sea. Neth. J. Sea Res. 10: 338-353
Krebs. C. J. (1989). Ecological methodology. Harper & Row, New York
Kuipers. B. R. (1977). On the efficiency of a two-metre beam trawl for juvenile plaice (Pleuronectes platessa). Neth. J . Sea Res. 9: 69-85
Kuipers, B. R., Dapper, R. (1981). Production of Crangon cran- gon in the tidal zone of the Dutch Wadden Sea. Neth. J. Sea Res. 15: 33-53
Kuipers, B. R., Maccurrin, B., Miller. J. M., van der Veer, H. W., Witte, J. IJ. (1992). Small trawls in juvenlle flatfish research: their development and efficiency. Neth. J. Sea Res. 29: 109-117
Lasiak, T A. (1984). Structural aspects of the surf zone fish assemblages at King's Beach, Algoa Bay, South Africa. Estuar. coast. Shelf Sci. 18: 347-360
Le Mao, P. (1986). Feeding relationships between the benthlc infauna and the dominant benthic fish of the Rance estu- ary (France). J . mar. biol. Ass. U.K. 66: 391-401
Lloyd, A. J., Yonge, C. M. (1947). The biology of Crangon vul- garis (L.) in the Bristol Channel and Severn Estuary. J. mar. biol. Ass. U.K. 26: 626-661
Lockwood, S. J . (1974). The settlement, distribution and movements of 0-group plaice Pleuronectes platessa (L.) in Filey Bay, Yorkshire. J. Fish Biol. 6: 465-477
Macer, C. T (1967). The food web in Red Wharf Bay (North Wales) with particular reference to young plaice (Pleu- ronectes platessa). Helgolander wlss. Meeresunters. 15: 560-573
McIntyre, A. D. (1970). The range of biomass in intertidal sand, with special reference to the blvalve Tellina tenuis. J. mar. biol. Ass. U.K. 50: 561-575
McIntyre, A. D., Eleftheriou, A. (1968). The bottom fauna of a flatfish nursery ground. J. mar. biol. Ass. U.K. 48: 113-142
Modde, T., Ross, S. T (1980). Seasonality of fishes occupying
a surf zone habitat in the northern Gulf of Mexico. Fish. Bull. U.S. 78: 911-922
Nash, R. D. M. (1986). Die1 fluctuations of a shallow water fish community in the inner Oslofjord. P.S.Z.N. I: Mar. Ecol. 7: 219-232
Naylor, E. (1958). Tidal and diurnal rhythms of locomotory activity in Carcinus maenas (L.). J. exp. Biol. 35: 602-610
Naylor, E. (1962). Seasonal changes in a population of Carci- nus maenas (L.) in the littoral zone. J. Anim. Ecol. 31: 601-609
Naylor, E. (1963). Temperature relationships of the locomo- tory rhythms of Carcinus. J . exp. Biol. 40: 669-680
Pierce, C. L., Rasmussen, J. B., Leggett, W. C. (1990). Sam- pling littoral fish with a seine: corrections for variable catch efficiency. Can. J . Fish. Aquat. Sci. 47: 1004-1010
Plhl, L. (1985). Food selection and consumption of mobile epibenthic fauna in shallow marine areas. Mar. Ecol. Prog. Ser. 22: 169-179
Pihl, L., Rosenberg, R. (1982). Production, abundance, and biomass of mobile epibenthic marine fauna in shallow waters, western Sweden. J. exp. mar. Biol. Ecol. 57: 273-301
Poxton, M. G. (1992). Towards a strategy for the conservation of marine fish in Scotland. Proc. R. Soc. Edinb. 100B: 141-167

Gibson et al.. Variations in fish and macrocrustacean communities 105
Poxton, M. G., Eleftheriou, A., Mclntyre, A. D. (1983). The food and growth of 0-group flatfish on nursery grounds in the Clyde Sea area. Estuar. coast. Shelf Sci. 17: 319-337
Rafaelli, D , Conacher, A. , McLachlan, H., Emes, C. (1989). The role of epibenthic crustacean predators in an estuar- ine food web. Estuar. coast. Shelf Sci 289. 149-160
Raffaelli, D., Karakassis, l . , Galloway, A. (1991). Zonation schemes on sandy shores: a multivariate approach. J . exp. mar. Biol. Ecol. 148: 241-253
Reina-Hervas, J. A. (1987). Analisis de la ictiofauna infrali- toral en el sureste espanol (Mediterraneo occidental). Cah. Biol. mar. 28: 73-89
Reina-Hervas, J. A., Serrano, P. (1987). Structural and sea- sonal variations of inshore fish populations in Malaga Bay. southeastern Spain. Mar. Biol. 95: 501-508
Rlley, J . D., Syrnonds, D. J. , Woolner, L. (1981). On the factors influencing the distribution of 0-group demersal fish in coastal waters. Rapp. P.-v. Reun. Cons. perm. int. Explor. Mer 178: 223-228
Ross, S. T. (1983). A review of the surf zone ichthyofauna in the Gulf of Mexico. In: Shabica, S. V., Cake, E. W. Jr (eds.) Proceedings of the northern Gulf of Mexico estuaries and barrier islands research conference. U.S. Department of the Interior, Atlanta, p. 25-34
Ross, S. T., McMichael, R. H. Jr. Ruple, D. L. (1987). Seasonal and die1 variation in the standing crop of fishes and macroinvertebrates from a Gulf of Mexico surf zone. Estuar. coast. Shelf Sci. 25: 391-412
This article was submitted to the editor
Salvat, B. (1962). Faune des sediments meubles intertidaux du bassin d'Arcachon. Systematique et ecologie. Cah. Biol. mar. 3: 219-244
Stephen, A. C. (1929). Studies on the Scottish marine fauna: the fauna of the sandy and muddy areas of the tidal zone. Trans. R. Soc. Ed~nb. 56: 291-306
Stephen, A. C. (1930). Studies on the Scottish marine fauna: additional observations on the fauna of the sandy and muddy areas of the tidal zone. Trans. R. Soc. Edinb. 56: 521-535
Tyler, A. V. (1971) Periodic and resident components in communities of Atlantic fishes. J. Fish. Res. Bd Can. 28: 935-946
van de Veer, H. W., Bergman, M. J . N. (1987). Predation by crustaceans on a newly settled 0-group plaice Pleu- ronectes platessa population in the western Wadden Sea. Mar. Ecol. Prog. Ser. 35: 203-215
Venema, S. C., Creutzberg, F. (1973). Seasonal migration of the swimming crab Macropipus holsatus in an estuarine area controlled by tidal streams. Neth. J . Sea. Res. 7: 94-102
Wheeler, A. (1992). A list of the common and scientific names of fishes of the British Isles. J . Fish Biol. 41: Suppl. A, 1-37
Zahn, M. (1963). Jahreszeitliche Veranderungen der Vorzugs- temperatur von Scholle (Pleuronectes platessa Linne) und Bitterling (Rhodeus senceus Pallas). Verh, dt. zool. Ges. 27: 562-580
Manuscript first received: March 29, 1993 Revised version accepted: May 28, 1993