Embed Size (px)
Citation preview

IMT Institute for Advanced Studies, Lucca
Lucca, Italy
Searching in the Dark:
Exploring the Technological Search Process
during the Business Cycle and in the
Pharmaceutical Industry
PhD IMT Institute for Advanced Studies Lucca
Track in Computer, Decision and Systems Science
Curriculum in Management Science
XXVIII Cycle
Joint PhD in Business Economics
KU Leuven
By
Daniela Silvestri
2017


The dissertation of Daniela Silvestri is approved.
Program Coordinator: Prof. Dr. Rocco De Nicola, IMT Lucca
Supervisors:
Prof. Dr. Massimo Riccaboni IMT Lucca
Prof. Dr. Rene Belderbos KU Leuven
The dissertation of Daniela Silvestri has been reviewed by:
Prof. Dr. Mario Daniele Amore Bocconi University
Prof. Dr. Victor Gilsing University of Antwerpen
Prof. Dr. Bart Leten KU Leuven
Prof. Dr. Paolo Zacchia IMT Lucca
IMT Institute for Advanced Studies, Lucca 2017

Acknowledgements
About four years ago I set sail for this amazing journey. At that time I was
following classes of algorithms and linear algebra while trying to figure out
"what a PhD would look like?"; "What was I doing?"; and Why was I, all of a
sudden, sailing such uncertain waters, with waves of matrices and binary
codes.
Now I am at KU Leuven, trying to reach a safer harbor, and land is in sight
after a very intense journey. It was a rewarding and pleasant voyage but also
stressful and exhausting. Luckily, I was not sailing alone. My two supervisors,
Massimo Riccaboni and Rene Belderbos, guided me along this journey. Your
guidance, intellectual inputs and invaluable advice were an important source of
inspiration. In particular, the prolific discussions on the pharmaceutical
industry stimulated even more my curiosity and motivated me to broadly
investigate reasons of firms' failures.
I also would like to express my deepest gratitude to the members of my PhD
committee - Mario Daniele Amore, Bart Leten, Victor Gilsing and Paolo
Zacchia - for their valuable comments and suggestions on this dissertation.
Special thanks goes to Bart Leten for influencing me with his overwhelming
interest in research. My gratitude also goes to the MSI Professors for the
inestimable comments I received during the brown bag seminar and in
informal discussions with Reinhilde Veugelers and Dirk Czarnitzki.
My gratitude also goes to Francesco Bolici, it was a bit your "fault" if I started
this journey and I am really grateful for that.
Along this journey a great captain, Antonio Della Malva, facilitated the
navigation in headwind. You pushed me to go on my own, to experiment, and
to fall; but you were always available to talk and discuss my doubts. Frank
Zappa said "A mind is like a parachute. It doesn't work if it is not open".
During these years your "creative" spirit and talks have been an important
aspect for this process, thank you.
I also would like to express my gratitude to IMT professors and researchers,
Armando Rungi, Rodolfo Metulini, Greg Morrison, Orion Penner, Valentina
Tortolini and Laura Magazzini., but also to very good colleagues and friends:

Daniele, Alessandro, Giuseppe, Laura D., Ünal, Roberto, Monika and
Tomislav, Davide, Tiziano, Sah, Fahad, Michele, Davide D'Arenzo, Sara and
Justine.
In Leuven I had the pleasure to meet great colleagues, which I call friends
by now. I remember that the first person I met was Philippe, this is my
occasion to thank you for your unconditional help in several occasions. The
office 03.108. (named "at Daniela's") is a seed of interesting discussions with
my office mates - Manuel, Jurriën, Dennis - and the MSI community at large,
in particular Thomas, Jeroen, Maarten, Fede, Naza and Michela. Dennis,
thanks for challenging always my results. During our day time conversations
as well as night shifts at HOG when deadlines threaten us, you have always
been ready to help me out. I cannot forget to thank the crew of the boat trip as
well as Maarten and Manuel for our incredible "two euro trip" to Berlin. The
time with Federico, Naza and Michela helped me to share common problems
and realize that I was not alone. The coffee breaks at Onan with Manuel
triggered me the need to read again the classics of Italian literature. Marcelina,
thanks for spotting my long sentences in the text and for the nice time spent
together. Hanne, your enthusiasm and caring has calmed me down several
times and I will not forget the nice time we spent at Druid, thanks. Paolè,
Adriàn, Céline, Charro, Cem, Helene, Hendrik, Jelle, Jeroen, Nima, Sam,
Sven, Sebastiaan, Wytse, Markus, Sarah, Kierean, Linde, thanks for the great
time I spent at MSI.
Grazie a Valeria e Tania per avermi sostenuto nonostante la distanza e
spesso la mia prolungata assenza, avrei dovuto coinvolgervi di più in questo
viaggio ma ormai non si torna indietro. Whillip, grazie per le fantastiche
giornate passate assieme e alla pace che mi hai regalato in questi mesi di duro
lavoro. Grazie a Massimiliano, Andrea e Ludovico ed in particolare alla mia
sorellina per il suo costante sostegno, anche nei silenzi riesci sempre a capire
quando ho bisogno di te. Grazie ai miei nonni per i loro energici in bocca a
lupo e soprattutto grazie mamma e papà per aver sempre creduto in me.
GRAZIE!

Presentation
SPRU 50th Anniversary Conference, Sailing in all Winds: Technological Search over
the Business Cycle, 07-09 Sept. 2016, University of Sussex, Falmer campus, UK.
Druid Academy Winter Conference: Economics and Management of Innovation,
Technology and Organization, Success through Failures? Evidence from
pharmaceutical R&D Projects, 13-15 January 2016, University of Bordeaux, France.
International Conference "Large-Scale Crises:1929 vs. 2008", Innovation over the
Business Sector Cycle: the interrelated effects of inventors' mobility and firms'
technological competences on patents' creativity, 17-19 December 2015, Università
Politecnica delle Marche, Italy.
5th SEEK Conference: Overcoming the Crisis: How to Foster Innovation and
Entrepreneurship, Innovation over the Business Sector Cycle: the interrelated effects of
inventors' mobility and firms' technological competences on patents' creativity, 8-9
October 2015, ZEW, Manheim, Germany.
Technology Transfer Annual Conference, Innovation over the Business Sector Cycle:
the interrelated effects of inventors' mobility and firms' technological competences on
patents' creativity, 28-30 October 2015, Dublin Institute of Technology, Ireland.
31st EGOS Colloquium: Organizations and the Examined Life: Reason, Reflexivity and
Responsibility, Innovation dynamics over the business cycle: the interrelated effects of
knowledge flow and firms' strategies on patents' creativity, 2-4 July 2015, American
College of Greece, Athens.
3rd KTO Paper Development Workshop, Innovation During the Dot-Com Crisis: the
Role of Labor Mobility, 18-21 June 2014, SKEMA Business School, Sophia Antipolis,
France.

Non è vero che l’uomo insegue la verità: è la verità che insegue l’uomo.
Robert Musil

Table of Contents Chapter 1
General Introduction .................................................................................................... 1 1.1 Search, Innovation and Growth............................................................... 1
1.2 The Search Debate .................................................................................. 2
1.3 Overview of the Dissertation .................................................................. 4
1.3.1 Setting the stage - the dissertation at a glance .................................... 4
1.3.2 Across the chapters ............................................................................ 5
Chapter 2
(Un)conventional Combinations: at the Origins of Breakthrough Inventions ......... 9 2.1 Introduction............................................................................................. 9
2.2 Measuring unconventionality: Theoretical consideration ..................... 13
2.2.1 Locus of Search in the Recombination Process................................ 13
2.2.2 Sources of Unconventionality .......................................................... 15
2.3 Measuring Unconventionality: existing measures. ................................ 18
2.4 Data and methodology .......................................................................... 19
2.4.1 Data .................................................................................................. 19
2.4.2 Unconventionality measure .............................................................. 20
2.4.3 Unconventionality and its sources .................................................... 28
2.5 Results .................................................................................................. 31
2.5.1 Relation with existing Indicators ...................................................... 32
2.5.2 Sources of Unconventionality .......................................................... 34
2.5.3 Technological Impact ....................................................................... 39
2.6 Discussion and Conclusion ................................................................... 44
Chapter 3
Sailing in all Winds: Technological Search over the Business Cycle ...................... 47 3.1 Introduction........................................................................................... 47
3.2 Innovation and the Business Cycle ....................................................... 51
3.3 Data and Methodology .......................................................................... 53
3.3.1 Dependent Variables ........................................................................ 54
3.3.2 Independent Variables ...................................................................... 55
3.3.3 The role of Financial constraints ...................................................... 56
3.3.4 The Competences of the firm ........................................................... 57
3.3.5 Control variables .............................................................................. 58
3.4 Results .................................................................................................. 60
3.4.1 Technological Search Over the Business Cycle ............................... 63
3.4.2 Technological Search over the Business Cycle: the role of financial
constraints and firms' competences ............................................................................... 64

3.4.3 Technological Search over the Business Cycle: Technological Impact
68
3.5 Discussion and Concluding Remarks .................................................... 71
Chapter 4 ..................................................................................................................... 75 Sowing Failures, Reaping Success? Evidence from Pharmaceutical R&D Projects
...................................................................................................................................... 75 4.1 Introduction........................................................................................... 75
4.2 Theory and Research Questions ............................................................ 78
4.2.1 Organizational Learning................................................................... 78
4.2.2 Learning from Failures and Success ................................................ 79
4.2.3 Vicarious Learning ........................................................................... 83
4.3 Data ....................................................................................................... 85
4.3.1 Research Setting: Innovation in the Pharmaceuthical Industry ............
......................................................................................................... 85
4.3.2 Sample and Data .............................................................................. 88
4.3.3 Dependent Variable.......................................................................... 92
4.3.4 Independent Variables ...................................................................... 95
4.3.5 Control Variables ............................................................................. 97
4.4 Results ................................................................................................ 104
4.5 Discussion and Conclusion ................................................................. 113
Chapter 5
Concluding Remarks and Direction for Future Research ..................................... 119 5.1 Summary of main findings .................................................................. 119
5.2 Limitations and avenues for future research ....................................... 121
Appendix to Chapter 2 ............................................................................................. 124 A.1 Analytical derivation of the Unconventionality measure .................... 124
A.2 Conventionality across years and technologicies ................................ 128
Appendix to Chapter 3 ............................................................................................. 134 Appendix B: Additional analysis at firm level ................................................. 134
Appendix to Chapter 4 ............................................................................................. 143 References

List of Tables Table 2.1: Description of existing measures. ................................................................ 25
Table 2.2: Distribution of Conventionality of Inventions across years. .................. 26 Table 2.3: Distribution of Conventionality of Inventions across Technology fields.
...................................................................................................................................... 27
Table 2.4: Summary Statistics split by degree of median Unconventionality (10th of
the most unconventional inventions). ............................................................................ 30
Table 2.5: Correlation tables with existing measures. ............................................. 33
Table 2.6: OLS estimations for the relation with other measures. .......................... 33
Table 2.7: Correlation table on the determinants of Unconventionality.................. 37
Table 2.8: Determinants of Unconventionality ....................................................... 38
Table 2.9: Generalized negative binomial regressions estimating the impact of
inventions: comparison with exiting indicators. ............................................................ 41
Table 2.10: Generalized negative binomial regressions estimating the impact of
inventions. ..................................................................................................................... 42
Table 3.1 : Summary statistics ................................................................................ 61
Table 3.2 : Summary statistics for High and Low Financially constrained firms. .. 62
Table 3.4: Estimations for technological search over the business cycle. OLS
models for the degree of Unconventionality. ................................................................ 67
Table 3.5 : Technological Impact. OLS models for the number of forward citations.
...................................................................................................................................... 70
Table 4.1: Most representative firms ...................................................................... 91
Table 4.2: Final Phase reached by the focal and the cited project before termination.
...................................................................................................................................... 93
Table 4.3 : Status of Focal and Cited project. ......................................................... 94
Table 4.4 Status of focal projects that build on previous projects versus those that
don't built on previous projects ..................................................................................... 95
Table 4.5 : Citations patterns. ................................................................................. 96
Table 4.6 : Success Ratio ........................................................................................ 96
Table 4.7 : Number of Indication and ATC Classes of focal projects ..................... 98
Table 4.8: Overview of Variables, their description and summary statistics for the
group of Failure and Success excluding ongoing (4193 obs) ...................................... 101
Table 4.9: Correlation table .................................................................................. 103
Table 4.10 : Estimations for experiential and vicarious learning .......................... 105
Table 4.11:Estimations for experiential and vicarious learning on project status.
Time Restriction.......................................................................................................... 107
Table 4.12: Estimations for experiential and vicarious learning on ATC ............. 110

Table 4.13: Estimations for experiential and vicarious learning on ATC. Time
restriction .................................................................................................................... 112
Table A.1: Conventionality over time in Drugs .................................................... 129
Table A.2 : Conventionality over time in Computer Hardware & Software ......... 129
Table A.3 : Conventionality over time in Information Storage ............................. 130
Table A.4 : Conventionality over time Semiconductors ....................................... 130
Table A.5 : Conventionality over time in Material Processing & Handling ......... 131
Table A.6 : Conventionality over time in Communications .................................. 131
Table A.7: Summary statistics of Conventionality distinguishing for the frequency
of combinations occurring at the couple level ............................................................. 132
Table A.8 : Distribution of Conventionality for the combination between the most
representative technologies ......................................................................................... 133
Table B.1: Estimations for technological search over the business cycle. OLS
models for the degree of Unconventionality ............................................................... 135
Table B.2: Estimations for technological search over the business cycle. ............ 136
Table B.3 Estimations for Patent Production over the business cycle.................. 137
Table B.4 Estimations for patent production based on R&D cut. ........................ 138
Table B.5: estimations for patent production bases on Kaplan Zingales. 43 ......... 139
Table B.6: Estimation for the weighted conventionality. 40 ................................. 140
Table B.7: Estimations for the weighed conventionality based on tut in R&D. ... 141
Table B.8; Estimations for the weighed conventionality based on . .................... 142
Table C.1:Estimations for experiential and vicarious learning on project status fixed
effect ........................................................................................................................... 146
Table C.2:Estimations for experiential and vicarious learning on project status fixed
effect. Time restriction. ............................................................................................... 148
Table C.3:Estimations for experiential and vicarious learning on project status.
PATENT REUSE........................................................................................................ 150
Table C.4:Estimations for experiential and vicarious learning on project status.
PATENT REUSE. Time restriction ............................................................................ 152
Table C.5:Multinomial Logit ................................................................................ 154

1
Chapter 1
General Introduction
1.1 Search, Innovation and Growth
Technological change is considered a driving force of long-term economic
growth and societal progress. Advancements in several domains have
contributed to the outward shift of the production-possibility frontier paving
the way to economic development. In particular, technological change occurs
when new or improved technologies are introduced into the existing repertoire
of knowledge. The polymerase chain reaction, for example, is considered an
indispensable technique useful for the diagnosis of genetic diseases and for the
study of specific segments of DNA. The laser, another key achievement of the
twentieth century, has been defined as an ubiquitous invention given its wide
application in scientific and industrial development (eye surgery, fiber-optic
communication, bar code readers, cancer treatment to mention few). In health
care, biopharmaceutical drugs - using biological rather than chemical
synthesis- are increasingly improving treatment in a range of diagnostic areas.
Other famous inventions like the personal computer, GPS, blockchain
algorithms, MOOCs (Massive Open Online Courses), autonomous cars,
defibrillators, Google’s Page Rank algorithm, and the 3D printer illustrate how
drastic improvements in technology can open up new markets, inspire a range
of applications and, in doing so, increase both social and economic welfare.
Given the importance of technological change, scholars have focused on
the understanding of the locus and mechanisms of the inventive process.
Arthur (2007) notes that a novel technology, like those mentioned above,
"seems to materialize out of nothing, but it emerges always from a cumulation
of previous components and functionality already in place" (p. 284). In a
similar vein, other scholar have identified the recombination of existing or of
new technologies as the "fil rouge" in the development of inventions

2
(Schumpeter, 1934; Nelson & Winter, 1982; Kogut & Zander, 1992; Fleming
& Sorenson, 2004; Fagerberg, 2005; Nerkar, 2003). For example, the
polymerase chain reaction combines knowledge from computer science with
techniques from chemical engineering, whereas the laser combines
fundamentals from physic and optics.
The recombination of knowledge is not a random nor an automatic
practice. Indeed, it requires extensive search over existing knowledge and
technologies that will be recombined for solving existing problems, satisfying
or discovering new economic opportunities. Hence, understanding how
economic actors orchestrate technological search is crucial in order to explain
how technological development unfolds.
1.2 The Search Debate
The concept of search underlying the inventive process has attracted the
attention of several scholars in the attempt to characterize its main aspects.
While conventional wisdom conceived search and discovery as a sequential
and linear process, recent approaches recognize that the search process is
characterized by an intrinsic complexity that increases with the bits of
knowledge that is searched and recombined. To solve the complexity,
inventors adopt a recursive approach using feedback loops and a continuous
refinement of their mental schemes (Magitti et al., 2013; Arthur, 2007). This
process, generally triggered by problem-solving and opportunity seeking, stops
when a satisfactory result has been achieved (Greve & Taylor, 2000).
Theoretical contributions have conceptualized the search process using a
spatial metaphor distinguishing between local versus distant - or ‘boundary-
spanning’ - search (Cyert & March, 1963; Nelson & Winter, 1982). Local
search relates to the search in the neighborhood of the existing organizational
knowledge base (Stuart & Podolny, 1996) whereas boundary-spanning refers
to search into distant, unfamiliar knowledge domains and away from existing
organizational routines (Katila & Ahuja, 2002). In their empirical work, Katila
and Ahuja (2002) distinguish between search depth (the extent to which firms
reuse their existing knowledge) and scope (the extent to which the firm
explores new knowledge). The greater the depth of search, the greater tend to
be firm's knowledge and competences in that field.

3
Studies based on the behavioral and evolutionary theory of the firm have
concluded that firms show a strong tendency to limit their search to familiar
domains guided by past routines, experience and practice (March, 1963;
Nelson & Winter, 1982). Helfat (1994) uncovered this pattern in the petroleum
industry where firms tend to persist in their R&D activities Along this line,
Pavitt (1988) highlighted that "firms seek to improve and to diversify their
technology by searching in zones that enable them to use and to build upon
their existing technological base" (Pavitt, 1988, p.130). The repeated search
among local domains of knowledge hinder shift in technological paradigms
and the combination of ideas from disparate domains. In this regard, Dosi
(1982) posited that technological progress often advances along an established
trajectory guided by existing paradigms.
The strong tendency towards local search can be explained by two main
reasons. First, individuals have limited cognitive abilities, they are unable to
process every possible solutions to a problem. Hence, they can only aim for a
satisfactory rather than an optimal outcome. This generates bounded rational
behavior pushing firms or inventors to search in the neighborhood of their
existing expertise where it is easier to deduce clearer conclusions (Cyert &
March, 1992; Leonard-Barton, 1992; Simon, 1982). Second, search in familiar
areas facilitates a deeper and faster learning of the cause-effects of a
phenomenon or problem (Cohen & Levinthal., 1990). Hence, local search is
efficient because the costs of selecting and processing familiar information are
lower (Rosenkopf & Almeida, 2003).
Searching only in local domains can have important negative
repercussions. It generates inertia, myopic behavior, fewer opportunities for
knowledge recombination and difficulties in dealing with new problems
(Levinthal & March, 1993; Gavetti & Levinthal, 2000; Rosenkopf & Nerkar,
2001; Ahuja & Lampert, 2001). A deep focus on local search leads to
cognitive biases and search traps. Firms that search locally tend to overlook
possible solutions that are in distant knowledge domains. Another limitation
related to a high reliance on local search is the inability to exploit potential
markets. For instance, in 1974 Du Pont developed the aramid fiber called
Klevar used today in a variety of clothing and accessories (e.g. body armor)
that exploit its robustness. However, since Du Pont’s strategy was to leverage
its competences in the tires market, it was only in 1987, after many failures,
4
that Du Pont decided to enter other markets that were more responsive to this
new product (Christensen, 1998).
In order to mitigate the disadvantages of local search, March (1991) has
advocated the need to find a balance between the two search strategies. Recent
contributions have started to question the prominence of local search strategies
by investigating the role of boundary-spanning as a way to introduce variety
into firms’ routines. (Tripsas & Gavetti, 2000; Rosenkopf & Almeida, 2003;
Fleming & Sorenson, 2004; He & Wong, 2004). These studies stress that
external collaborations, diversified teams, in-licensing, alliances or staff
mobility may solve the problems linked to local search. This stream of
literature recognizes the importance of external, diverse and complementary
knowledge in facilitating the recombination of knowledge and technologies.
1.3 Overview of the Dissertation
1.3.1 Setting the stage - the dissertation at a glance
This dissertation has two main objectives. The first is to extend the
understanding of how the external environment shapes the search process. The
trade-off between local and distant search is not only determined by
organizational factors. Environmental conditions may affect the type of search
performed by firms. The second, is to provide insights about the trade-off
between local and distant search. While existing literature has widely
discussed the fundamentals of search, our knowledge about the role of external
contingencies on the direction and intensity of the search process remain
limited. For instance, March (1991) posits that in tight competitive situations it
is exploration that, although entailing a higher risk, leads to significant
improvements. Katila and Chen (2009) focus on the role of competition in the
search process of robotics firms and show that firms that search ahead of
competitors introduce more innovative products. Leten et al., (2016) analyze
firms' choices to enter into new technology domains - which can be conceived
as firms' efforts towards distant search. They argue that in this choice firms are
driven not only by firm-level factors but also environmental characteristics, in
particular the potential for new technological opportunities. They also stress
that in order to exploit technological opportunities in the new domain, firms
require related technological expertise.

5
Other external pressures may shape the search process, for example a
decrease in profits, slack resources or contraction in economic growth. Hence,
it is important to understand the influence of external environment on the
direction and intensity of search process. Another important aspect is the
difference in performances and value linked to diverse search processes.
1.3.2 Across the chapters
This dissertation consists of three studies. Based on the foundation of search,
the study presented in Chapter 2 explores the search and knowledge
recombination process underlying inventions. The search for new
combinatorial possibilities usually occurs in the proximity of existing
competences through local search. This process is characterized by lower
levels of risks and uncertainty as it builds on extant competences, past failures
and previous successful solutions (Cyert & March, 1963; Simon, 1978).
However, connecting pieces of knowledge and ideas that are already highly
related hinder the possibilities of exploring new trajectories and producing
impactful inventions (Perkins, 1995). Although inventions resulting from local
search are essential for increasing technological performance (Baumol, 2002),
distant search aiming for novel or breakthrough innovations prevent core-
rigidities with positive impacts on performance and economic growth (March,
1991; Leonard-Barton, 1992; Dosi, 1982). Distant search entails the
exploration of new and unfamiliar technological domains, with larger
possibilities to extend the range of combinatorial alternatives (Katila & Ahuja,
2002). The ultimate result of this process is that inventions are more likely to
include new or original coupling relationships characterized by higher level of
novelty (Levinthal & March, 1993; Simonton, 1999; Schilling, 2005, Katila &
Chen, 2009). On the other hand, compared to local, distant search is a costly
activity, associated with higher levels of uncertainty and failures, as it requires
more effort in the selection and integration of relevant knowledge (Fleming,
2001).
The chapter proposes a measure of the extent to which knowledge is
combined within inventions in an unconventional or atypical way. It focuses
on the proximity among the knowledge components recombined in inventions.
Rather than looking at backward citations, as other measures have done, we

6
examine patent class membership and the joint occurrences of subclasses
combination in the entire technological space.
The analysis uncovers that a large fraction of patents is based on
conventional knowledge recombination resulting from local search. Inventions
that build on more novel combinations are rare but more cited. The analysis is
further enriched by a comparison with existing measures of novelty in
knowledge recombination. Results show that the measure presented in this
study is only weakly correlated with existing measures suggesting that they
capture different dimensions of knowledge recombination. This chapter
contributes to the stream of literature on recombinant invention by
emphasizing the role of distance in the recombination process. Compare to
measure based on the first instance of a combination, the unconventionality
measure allows to consider also those inventions that are in the continuum
between extremely unconventional and conventional inventions.
The study presented in Chapter 3 investigates the impact of the business
cycle on firms' search strategies using the measure built in Chapter 2. The
scholarly debate on the relationships between economic crises, business cycles
and innovation has mainly dealt with the impact of recessions on the input side
of innovation (R&D) suggesting a pro-cyclical response to recessions
(Filippetti & Archibugi, 2011). More recently, the discussion has been partially
extended to the analysis of the output side (Hud & Hussinger 2015; Cincera et
al., 2010; Ouyang, 2011; Berchicci et al., 2013; Fabrizio & Tsolomon 2014).
Theoretical contributions have advanced two opposing arguments, one
suggesting pro-cyclicality (Barlevy, 2007; Ouyang, 2011) and the other
predicting counter-cyclicality trends in innovation activities (Aghion & Saint-
Paul, 1998, Aghion et al., 2012). The first line of argument, focusing on the
relevance of financial constraints, states that economic downturns are
associated with reduced profitability on existing products, forcing firms to cut
back on expenses, including R&D, and to postpone the introduction of
innovations (Campello et al., 2010). The second line of argument, claims that
firms will react to the reduced profitability on existing products by investing in
new projects due to lower opportunity costs (Berchicci et al., 2013). The extant
empirical evidence indicates that both R&D investments and innovative
outputs are pro-cyclical.
7
Tighter economic conditions not only affect the propensity of firms to
invest in R&D, but are also expected to shape the type of inventions that are
generated. Chapter 2 contributes by exploring the relationship between the
nature of the inventive process and the business cycle. Results suggest that
contractive phases of the cycle are associated with more conventional
recombination signaling local search strategies, i.e. knowledge recombination
processes that, by combining familiar components, generate inventions
characterized by lower level of novelty. Firms respond asymmetrically to
expansions and contractive phases showing overall a pro-cyclical trend both at
the intensive (a decrease in the degree of unconventionality of patents) and at
the extensive margins (an overall decline in number of patents). This process is
not uniform across the entire technological portfolio of firms, but it is
concentrated in firms’ core technologies. Moreover, only financially
constrained firms retrench from explorative activities, indicating that the
mechanism behind the result acts through a decrease in financial resources.
These findings contribute to the innovation literature, enriching it with a
discussion on how search and the resulting innovation output vary along the
business cycle.
The study in Chapter 4 examines when and to what extent pharmaceutical
firms learn from prior failures in their subsequent drug development efforts.
Innovation has been conceptualized as a cumulative process (Scotchmer, 2004)
where organizations build on their previous knowledge and experience. The
experimental nature inherent to innovation implies high risk and uncertain
outcomes. The pharmaceutical industry represents a typical example of an
innovation setting where organizations face high failure rates and extensive
development costs. Chapter 4 examines the extent to which current drug
development projects benefit from experience with previous - successful or
failed – related drug development efforts: not only firms’ own experience, but
also rival firms’ experience as a relevant environmental influence. Related
prior drug development efforts are prior projects of which the underlying
patent is cited by the patent that is exploited in the current drug development
project. Benefiting from comprehensive and detailed information on
pharmaceutical firms’ global drug activities, we find that projects that build on
firms’ previous successful projects have a higher likelihood to generate
marketable drugs, while building on prior failures reduces this likelihood. A

8
similar pattern, though weaker in magnitude, is observed for drug development
projects building on prior projects of other firms through vicarious learning.
This study also show that local search, measured as drug development in
existing or related ATC classes, can increase the likelihood of drug
development success The study contributes to the debate on organizational
learning by providing a more nuanced view on the role of failure and success
for future performance in the drug development process.

9
Chapter 2
(Un)conventional Combinations: at the Origins of Breakthrough Inventions*
¿Qué, quieren una originalidad absoluta? No existe.
Ni en el arte ni en nada. Todo se construye sobre lo anterior...
Ernesto Sabato (1963), El escritor y sus fantasma p.26
2.1 Introduction
Technical change has been unanimously recognized to be the main engine of
long-term economic growth (Schumpeter, 1939). Some inventions like the
laser or the turbojet engine are unshakably mentioned amongst the most
fundamental achievements of human kind and responsible for shifts in
technological paradigms (Arthur, 2007; Dosi, 1982). These inventions are
customarily addressed as breakthrough or radical as they overcome existing
bottlenecks in technological development and pave the way for new
technological advancements. Studies on the origins of radical innovations have
long debated on whether radical innovations originate from completely new
knowledge or from the combinations of already existing knowledge
(Rosemberg, 1982, Schumpeter, 1939; Weitzman, 1998). Much of the
academic literature builds on seminal works by Schumpeter (1939) who
emphasizes the role of combining existing components in a new way or
✴ This chapter is based on a working paper joint with Antonio della Malva (KU Leuven) and
Massimo Riccaboni (IMT Lucca / KU Leuven). We thank Ludovic DiBiaggio, Gino Cattani, Jian
Wang and participants of the KTO Workshop (Sophia Antipolis June 2013) for useful comments
on previous versions. The current version has benefitted from informal discussion with department members at MSI-KU Leuven and LIME-IMT Lucca. Timon Gaertner provided useful research
assistance.
10
developing new combinations. Hargadon (2004) stresses that many key
technologies like the light bulb result from bridging disconnected but pre-
existing components. A common assumption made in the literature is that the
impact of inventions is a function of the newness of knowledge combination
generated during the inventive process. By looking at the inventive process as
one of search and recombination of existing ideas (Fleming, 2001; Kaplan &
Vakili, 2015; Magitti, 2013), newness is determined by those inventive acts
that embed unfamiliar, unconventional or atypical combinations (Simonton,
1999). As the search process is usually local, the extent to which combinations
are unconventional or atypical is in turn a function of the distance in the
technological space.
In this study we draw on the literature on recombinant search and
conceptualize the origins of novelty in the inventive process as a function of
the proximity of the elements constituting the invention (Stuart & Podolny,
1996). Drawing on the literature on product market diversification, we adapt
the measure of relatedness in product space to account for the distance
between each element combined in the invention. The measure proposed in
this chapter - "Unconventionality"- is population based and, similarly to the
concept of technological regime, reflects the current understanding of the
relational structure of the components in the knowledge space (Nelson &
Winter, 1982).
To assess the novelty of inventions, the Unconventionality measure
presented in this chapter focuses on the proximity among the knowledge
components recombined in inventions. Rather than looking at backward
citations as other measures have done (Trajtenberg et al., 1997; Keijl et al.,
2016), we examine patent class membership and the joint occurrences of
subclasses combination in the entire technological space. In so doing, the
unconventionality indicator also differentiate itself from other measures based
on first instances of combinations (Verhoeven et al., 2016; Fleming, 2001).
The focus of this study is on the underlying dimension of the recombinant
process responsible for the extraordinary impact of some inventions, i.e.
unconventional combinations. Moreover, the unconventionality measure offers
an overview over the search and recombinant process exploring all
combinatorial possibilities in the technological landscape. The framework
upon which this measure builds, shares strong similarities with the exploration

11
- exploitation concept (March, 1991). This notion defines exploration (or
exploitation) relative to the organizational or the inventor existing domain of
knowledge Unconventionality measure instead takes a broader perspective by
considering the entire technological landscape. We enrich our analysis by
comparing the Unconventionality measure to existing measures based on
backward citations, in particular the originality measure pioneered by
Trajtenberg et al., (1997), and related measures building on technological
classes by Verhoeven et al., (2016), Fleming and Sorenson (2001).
Results reported in Section 2.4, show that most combinations are indeed
conventional as they occur between elements that are related and that have
been similarly combined in the past. Only a handful of combinations bring
together components that are substantially far apart. This result is in line with a
view of unconventionality as a result of wide search, which spans technical
domains to incorporate principles and solutions from other realms. These
unconventional recombinant efforts come about in very few inventive acts but
show a significant and positive association with technological impact captured
by the number of forward citations received by the invention.
In our analysis we also consider the role of team on the search process.
Experienced teams are mostly responsible for unconventional combinations in
the inventive process, whereas lonely inventors are at disadvantage. Large
teams are instead negatively associated with Unconventionality while large
organizations produce more unconventional combinations.
From a theoretical standpoint, the results are in line with the body of work
on the theory of invention and creativity in general, which posit that agents
mostly work in the neighborhood of their competences.
This work belongs to a recent stream of research that inquires the origins of
breakthrough inventions and scientific discoveries by means of large scale
databases (i.e. Ahuja & Lampert, 2001; Arts & Veugelers, 2013; Dahlin &
Beherens, 2005; Fleming et al., 2007; Kelley et al., 2013; Schilling & Greene,
2011; Schoenmakers & Duysters, 2010; Uzzi et al., 2013; Verhoeven et al.,
2016). However, most of the studies listed above trace the origins of radical
innovation on the base of citations to existing technologies. Measures based on
backward citations (Dahlin & Berhens, 2005; Uzzi et al., 2013) however, may
12
be sensitive to strategic decisions (Uzzi et al., 2013) and to changes in the
composition of the patent universe.
From a methodological point of view, we are among the first to propose a
measure that take into account the proximity aspect in the recombinant process
by considering the technological classes recombined in inventions. With the
exceptions of Fleming (2001), Dahlin and Behrens (2005), and Verhoeven et
al., (2016), most of the empirical studies on the origins of high-impact
inventions have assumed that the ultimate source of technological impact had
to be found in the generation of unconventional combinations (Ahuja &
Lampert, 2001; Fleming & Singh, 2011; Schoenmakers & Duysters, 2010;
Kelly et al., 2013). Yet, these studies made no effort to operazionalize this
concept. Other attempts have focused on the very first instance of a
combinatorial occurrence and have mostly considered backward citations (i.e.
Fleming et al., 2007; Operti & Carnabuci, 2013; Verhoeven et al., 2016). Such
approaches operationalize novelty in absolute terms, neglecting the cumulative
nature of the inventive process. We claim that novelty is often distributed
across early attempts but not necessarily constrained to the very first one. In
addition, these studies do not take into account that combinations that have not
been occurring for a longer time, my emerge again after a long period of non-
occurrence (Verhoeven et al., 2016). The approach based on first instances is
plagued by a problem of incompleteness, which Unconventionality measure
tries to overcome. To identify absolute novelty, a complete knowledge of all
human inventions and the exact time at which they came into existence is
needed. Unconventionality is instead a population based measure and reflects
the state of relationships among the elements of the knowledge space at a
given point in time in relation to the wider technological landscape.
Section 2.2 discusses the literature on the origins of radical inventions and
the characteristics of the search process (Section 2.2.1) useful for identifying
the antecedents of unconventionality (Section 2.2.2). To construct the
Unconventionality measure, we take advantage of the patent dataset at the
USPTO (Lai et al., 2014) using patent data and their technological classes over
more than two decades – i.e. between 1975 and 2000 (Section 2.3). Results are
discussed in Section 2.4 while section 2.5 closes the chapter with the
concluding remarks.
13
2.2 Measuring unconventionality: Theoretical consideration
2.2.1 Locus of Search in the Recombination Process
Scholars have identified several different forms characterizing the process
through which new knowledge is created: combination of new components,
new recombinations of existing components, or reconfiguration of existing
combinations1 (Schumpeter 1939, Nelson & Winter 1982, Weitzman 1998,
Henderson & Clark 1990, Fleming & Sorenson, 2001). Therefore, knowledge
is generated by integrating new components within an established framework
or by modifying the existing framework to accommodate new configurations
(Schilling & Phelps, 2007).
Knowledge generation initiates with the search of knowledge components
(Cohen & Levinthal, 1990; Rosenkopf & Neckar, 2001). The set of
combinable components comprises all bits of knowledge which are potentially
available: existing components, previously untried components, or new
components.2 Inventors are expected to operate with an extraordinary large
number of possible components and possibly an infinite number of
combinations: the search process exponentially increases the number of
possible combinations with which individuals should deal. To ease the search
process, subjects are used either to take into account familiar components
which are locally available for new combinations, or to implement earlier
utilized combinations. The choice of the components is therefore usually based
on their availability, proximity, and saliency according to the inventor’s aims
and mental schemas (Fleming 2001; Mugatti et al., 2013). Inventors usually
search in the vicinity of their competences (Dosi, 1988; Stuart & Podolny,
1996). They rely on existing and certain solutions, whose past use has been
proved successful to their purpose (Cyert & March, 1992). The type of
1 The reconfiguration of existing components refer to architectural innovation like for example in
the case of the aircraft industry as discussed by Henderson & Clark, 1990). 2 Jung and Lee (2013) report different definitions of the components involved in the recombinant
process employed in the literature. Components are considered as “conceptual or physical
materials”, such as routines or technologies (Nelson & Winter, 1982); “old knowledge,” such as
existing cultivated plant varieties (Weitzman, 1998); pre-existing “elements,” such as materials in
periodic tables, and “conditions,” such as temperature and pressure (Romer, 1994); and
“constituents of invention,” such as Schumpeterian “factors” (Schumpeter, 1939; Fleming, 2001).

14
recombinant effort that results from local searches is characterized by high
search depth (Katila & Ahuja, 2002), as it is geared towards increasing the
understanding of a limited set of relationships among the components. The
exploration of local and familiar domains of knowledge is likely to deliver
incremental solutions as the combinatorial possibilities can quickly exhaust
(Fleming, 2001). Inventors therefore reproduce or incrementally alter existing
combinations, preserving the actual framework of relations among
components. As relationships are scrutinized and challenged, the framework in
which they are established is reinforced. Agents thus develop expectations on
the nature of the relationships among the components forming the knowledge
space and tend to constrain themselves to search within the existing boundaries
of extant problems (Finke, 1995 as in Schilling & Greene, 2011). The patterns
of association of the components therefore reflect conventions and common
understanding of the possible interdependencies.
The continuous exploitation of local reservoirs of knowledge can lead to
inventive traps, where inventors find themselves trapped in inefficient local
optima. Extending the breadth of the knowledge base from which components
are sourced is expected to bring outcomes with higher degree of novelty and
originality (Levinthal & March, 1993; Fleming, 2001). The number of possible
combinations used in an invention increases with the set of elements that are
available to the inventor in the generative phase. Furthermore, the broader the
search scope, the more likely are inventors to combine components which
stand far apart from each other in the technological space.3 From a cognitive
standpoint, being exposed to a variety of sources may lead agents to analyze
and re-conceptualize the same problem from different angles, facilitating the
integration of new knowledge into an existing interpretative framework (see
Schilling and Greene, 2011, for an overview). The inclusion of novel elements
in established interpretative frameworks challenges the existing cognitive
structures and lead to the generation of novel and overlooked combinations
3 The psychological literature has also stressed that newer, and thus more creative, combinations are those which are apparently not related among each other. Simonton (1999) pointed out that
many of the most famous scientific breakthroughs occurred through a free associative process
(what Freudians might call “primary process thinking”). Agents generate many unusual combinations between different bodies of knowledge that set to a screening process of selective
retention, keeping only the best variations (much like Darwinian evolution).

15
(Fleming, 2001; Simonton, 1999). Combinations that relate components that
are rarely, if at all used together, are therefore unconventional.
Our measure of unconventionality has strong conceptual similarities with
the tension described by Levinthal and March (1993) between distant search,
leading toward exploration, and local search, pointing to exploitation.
However, the main distinction relies in the perspective that is adopted. While
most of the studies on technological recombination discuss the tension
between exploration and exploitation in relation to the organizations and
inventors' existing knowledge domains, we adopt a broader perspective by
considering the recombination process over the entire technological landscape.
The Unconventionality measure presented in this study is population-
based4, in the sense that it reflects the actual state of relationships between
elements of the knowledge space at a given point in time. This measure builds
around the “principle of survival” as the actual configuration of
interdependences among components is the result of successful attempts.
Consequently weak or nonexistent links represent overlooked connections or
failed trials. This feature enables to delineate the actual boundaries of the
conceptual space and consequently any act of modifying sensibly the latter at
any time.
2.2.2 Sources of Unconventionality
A growing empirical literature has analyzed high impact, breakthrough or
radical inventions, detailing several determinants for their impact (i.e. Fleming,
2001; Kelley et al., 2013; Schilling & Greene, 2011; Schoenmakers &
Duysters, 2010 among others). These studies speculate on the role of novelty
in the determination of highly impactful inventions advancing arguments that
mostly pertain to the sources of novelty (or unconventionality as we define it).
One of the most discussed aspect is whether unconventionality is the
outcome of the recombination of existing knowledge or whether relies on
completely new solutions. A stream of literature has argued that novelty in the
knowledge base used for the generation of inventions relies on completely new
4 In the derivation of the measure we consider the entire universe of patents. Patents with only one USPC are included in the derivation of the measure but are excluded in the analysis as we are
interested in the process of recombination of components within the invention.

16
technical knowledge, hence not yet embedded in existing inventions (van de
Poel, 2003). A second stream of research points to the role of existing
components, and their recombination (Schumpeter, 1939; Arthur, 2007;
Fleming, 2001). Under the first view, novelty is carried forward by little if not
existent references to previous inventive efforts (Ahuja & Lampert, 2001).
However, Unconventional combinations might find their rationale in a broad
scientific realm (Dahlin & Behrens, 2005). The second perspective instead
posits that the knowledge base from which unconventional recombinations are
sourced is broadly distributed. Despite being a repository of knowledge with
potential technological implications (not yet exploited), Science works as a
map of the technological space, allowing inventors to move within the latter
with greater foresight (Fleming & Sorenson, 2004). By elaborating and testing
theories of general validity, Science helps predict the outcome of scarcely
tested combinations, guiding inventors in their search beyond the existing
cognitive boundaries.
Despite the different realms comprising the knowledge space, proximity
has been defined by variety of terms. The temporal dimension has recently
gained noteworthy attention (Neckar, 2003). The debate revolves around the
contribution of novel and emerging bodies of knowledge to the generation of
original solutions as opposed to the contribution of more mature ones.
Emerging technologies usually bring about novel solutions, embed a higher
degree of novelty in the proposed solutions and hence expand the current space
for recombinations – for instance by bringing to the market new components
themselves (Ahuja & Lampert, 2001). Mature technologies, on the opposite,
tend to be “… well understood and offer greater reliability relative to more
recently developed and less tested” technologies" (Ahuja & Lampert, 2001, p.
527). Hence, familiarity with the nature and properties of older technologies
will be substantially higher.
Unconventional recombinations are also expected to be the result of
combinations of older and emerging knowledge bases. As they result from the
association of distant bodies of knowledge, recombinant efforts will most often
link bodies of knowledge with high internal coherence – i.e. areas of the
knowledge space whose existing interdependences are mostly understood – but
loosely recombined among themselves. A useful analogy in this respect is the
realm of Science, where new contributions bear a tension between conformity
17
to the “currently predominant beliefs about the nature of things” (Polanyi,
1962, p.58) and dissent from it.
The organizational literature has extended the discussion on the sources of
impactful inventions to include the role of inventors and teams. The debate
focuses on the role of teams in the process of idea generation and retention.
The question at the core of the debate is whether teams facilitate the
recombination of dispersed competences, distributed across team members
(Singh and Fleming, 2010) or whether they generate frictions in the phase of
retention of creative ideas (Paulus & Nijstad, 2003). Advocates of the latter
view, embrace the “myth of the lone inventor” as source of unconventional
solutions because teams are plagued by collaborative frictions in the process of
idea generation (Mullen et al., 1991). Proponents of the former view, claim
that collaboration enables greater combinational opportunities and that teams
are better endowed in the “sorting and identification of most promising ideas”
(i.e. Singh & Fleming, 2010, p.42). In this respect, inventors’ experience plays
a crucial role in that it determines the extent of combinatorial possibilities and
the ability to select promising inventive venues (Fleming et al., 2007;
Hargadon & Sutton, 1997; Schilling & Greene, 2011).
The debate on the origins of novel or unconventional inventions is also one
of the cornerstones of the industrial organization discussion. Scholars have
been debating as to whether the type of organization in which inventions occur
- large firms vs. small firms – has an influence on the extent of
unconventionality in recombination. On the one hand, large firms are
considered to be at disadvantage with the generation of unconventional
solutions as they are trapped in established routines and product lines, around
which new solutions are incrementally developed (Hill & Rothaermel, 2003).
On the other hand, firms can be thought as repositories of knowledge and
competences (Grant, 1996) whose potential for recombination depends directly
on firm size. This assumption is consistent with theories of industry evolutions
via corporate spin-offs, where unconventional ideas are rejected by incumbent
firms because of mismatch with the firms’ main strategy (Klepper & Thomson,
2010). Hence large firms are a seedbed for unconventional combinations,
whose exploitation will depend on strategic decisions.

18
2.3 Measuring Unconventionality: existing measures.
Indicators established in literature, rely on information from backward
citations. The Originality measure by Trajtenberg et al. (1997) is defined as
the Herfindahl Index on technological classes of cited patents and points to the
spread of citations over classes. Rosenkpopf and Nerkar (2001) also use patent
citations to identify the number of patent classes that do not belong to the focal
patent. Along this line, Dahlin and Behrens (2005) define an invention as
radical on three main basis: its novelty (few common citations to patent in
previous years), uniqueness (citations to other patents in the same year) and its
impact (technological impact). These studies determine novelty as the overlap
in backward citations among patents to determine similarity among patents.
This methodology is problematic as the universe of patents is ever expanding
and similar inventions might share few backward citations as they occur in two
different time periods or because the solution they address is grounded in a
multitude of former patents, which might end up not being cited in all the
future inventions.
Closer to our approach, are the measures based on the recombination of
components within inventions (Fleming & Sorenson, 2001; Verhoeven et al.,
2016). Fleming and Sorenson (2001) identify new pairwise combinations of
patent subclasses as novel inventions. They also account for the number of
times that the same combination has been used (Cumulative Usage) and for
the Interdependence of the components recombined in the focal invention.
Verhoeven et al. (2016) adopt a combination of constructs that consider
both the newness of the combination of technological classes (Novelty in
Recombination, "NR") but also, via citations, the extent to which inventions
built on previously unconnected scientific fields (Novelty in Knowledge
Origins, "NSO") and different technological classes (Novelty in
Technological Knowledge Origins, "NTO"). This novelty measure identify
ex ante characteristics of novel inventions by adopting pairwise combinations
of technological classes and by considering the extent to which focal
inventions rely on new technological origins and knowledge.
However, existing measures do not account for the distance among the
technological components as expressed by their synergic usage. Moreover,
although novelty is often distributed across early attempts, it may not be
19
necessarily captured by the very first combination. A low usage of that
combination after the first novel attempt can still have a value for attempts
occurred at later time.
Others studies have recognized the importance of considering distance by
looking at the number domains (Nemet & Johnson, 2012; Schoeenmaker &
Duysters, 2010). Keijl et al, (2016) investigate the recombination process by
considering both the number of domains and the distance between them.
However, in line with existing studies, they also conceive distance based on
the spread of technological components over technological domains through
the use of backward citations. They analyze the recombination process in the
biotechnology industry distinguishing between focal patents citing others
patent in biotechnological classes versus those that cite patents in adjacent
classes (chemicals or drugs) or in unrelated classes.
Schilling and Greene (2011) use the Dewey decimal system, a
bibliographic categorization for the organization of libraries, to determine
which combinations of topics is the least likely to occur within the articles
cited as references. Their work however is not informative on the actual
procedure to determine unconventional connections.
The study by Uzzi et al. (2013) on the universe of scientific articles in the
Web of Science is the closest to the approach used for the Unconventionality
measure. They explicitly model novelty in the creative process as the pairwise
combination of references in the bibliography of each paper. Similarly to this
study, they also take a probabilistic approach as to whether combinations are
deterministic or instead the outcome of a random process. They find that
highest impact is grounded in exceptionally conventional combinations, yet
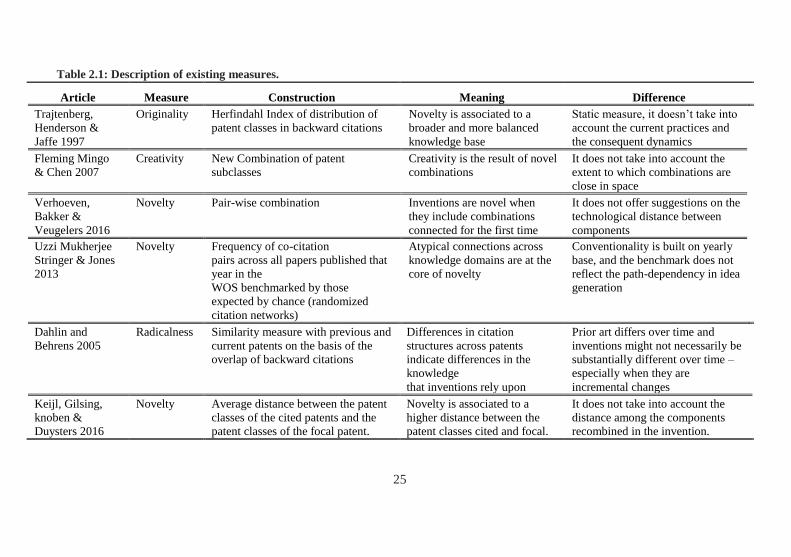
with the inclusions of unusual combinations. Table 2.1 reports a summary of
the related indicators.
2.4 Data and methodology
2.4.1 Data
We use U.S. patent data from 1975 to 2000 (Lai et al., 2014), to measure the
degree of Unconventionality of the inventive outputs. In line with most

20
researches on patent data (Hall et al., 2001), only the utility patents are used. 5
The unit of analysis in the derivation of the measure and used in the regression
models is the individual patent. The information contained in patents enables
to model the extent to which the components used in the generation of
inventions are combined in an unconventional fashion. In particular, we used
detailed information about patents' technological class and subclass references
(there are over 400 classes, and over 100,000 subclasses). Classes reflect broad
technological areas, whereas subclasses reflect specific technological
components within a given technological area. Central to this study is the
listing of the technological components used in the generation of the invention
and their joint occurrence across the whole universe of patents at the USPTO
level.
Aside from containing a great deal of technical information (e.g. patent
number, date of application and grant, number of claims, technological
classes), a single patent also provides a rich amount of individual and
organizational-level data. Patents documents also list inventors’ names (also
referred to as the authors) and hometowns, the assignee (i.e., the owner of the
patent that typically identifies the organization for which the inventor works,
such as a firm, a university or government, or the inventor himself).
2.4.2 Unconventionality measure
The degree of unconventionality in recombination reflects the distance
between elements in the space of components as a function of the
commonalities they shared.
From the literature on firms' business diversification, we borrow the
measure of relatedness and its conceptualization, used in previous studies to
describe the diversification of firms in the product market Teece et al. (1994).
More recent studies have adapted the relatedness measure to describe the
5 A patent is a legal instrument that protects a new and useful product, process, machine, or new
combinations of materials. Patents are especially useful for analyzing inventions because they are
granted only to products and processes that a knowledgeable, objective third party (e.g. United
States Patent and Trademark Office USPTO) decides that the work exceeds a minimum threshold
of creativity and innovation.
21
diversification patterns of firms at the technological portfolio level (Dosi et al.,
2016; Breschi et al., 2003; Nesta & Saviotti, 2005).
Two elements constituting a diversified set - two products or two
technologies in the portfolio of a firm - are said to be related if their joint
occurrence is not driven by a random process. This is usually the outcome of
existing commonalities or synergies between the two elements.
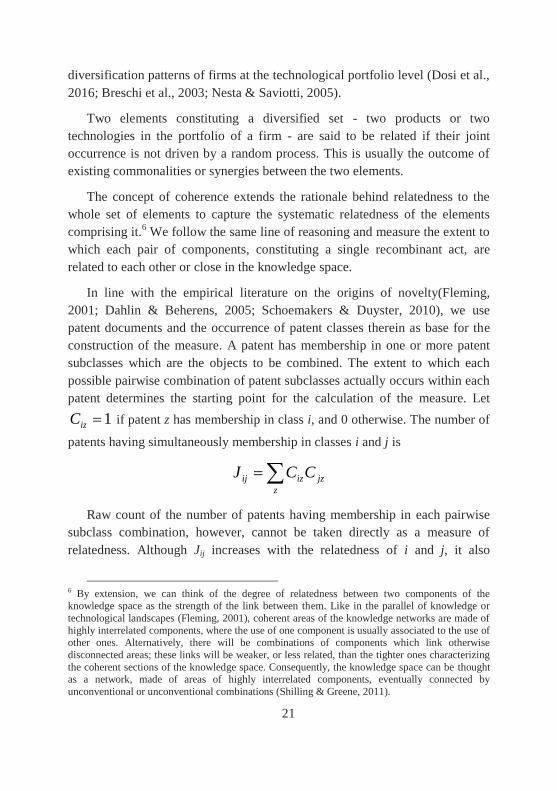
The concept of coherence extends the rationale behind relatedness to the
whole set of elements to capture the systematic relatedness of the elements
comprising it.6 We follow the same line of reasoning and measure the extent to
which each pair of components, constituting a single recombinant act, are
related to each other or close in the knowledge space.
In line with the empirical literature on the origins of novelty(Fleming,
2001; Dahlin & Beherens, 2005; Schoemakers & Duyster, 2010), we use
patent documents and the occurrence of patent classes therein as base for the
construction of the measure. A patent has membership in one or more patent
subclasses which are the objects to be combined. The extent to which each
possible pairwise combination of patent subclasses actually occurs within each
patent determines the starting point for the calculation of the measure. Let
1izC if patent z has membership in class i, and 0 otherwise. The number of
patents having simultaneously membership in classes i and j is
jz
z
izij CCJ
Raw count of the number of patents having membership in each pairwise
subclass combination, however, cannot be taken directly as a measure of
relatedness. Although Jij increases with the relatedness of i and j, it also
6 By extension, we can think of the degree of relatedness between two components of the
knowledge space as the strength of the link between them. Like in the parallel of knowledge or
technological landscapes (Fleming, 2001), coherent areas of the knowledge networks are made of
highly interrelated components, where the use of one component is usually associated to the use of other ones. Alternatively, there will be combinations of components which link otherwise
disconnected areas; these links will be weaker, or less related, than the tighter ones characterizing
the coherent sections of the knowledge space. Consequently, the knowledge space can be thought as a network, made of areas of highly interrelated components, eventually connected by
unconventional or unconventional combinations (Shilling & Greene, 2011).

22
increases with ni and nj, the number of patents having membership in each
class of the couple. Thus, large values of Jij might simply reflect intense
inventive activities in i and j. Therefore, Jij must be adjusted for the number of
patents that would have simultaneous membership both in i and j under the
null hypothesis that classes were randomly assigned to inventions. Teece et al.
(1994) show that the joint occurrence of two objects i and j follows an
hypergeometric distribution against which the null hypothesis can be tested.
Hence, relatedness, τij, is measured as the difference between the observed
pattern of co-occurrences of i and j and the expected one:
ij
ijij
ij
J
where ij is equal to the expected number of patents with simultaneous
membership in i and j under the observed occurrences of i and j and ij the
standard deviation of the observed occurrence.7 This measure thus reports the
extent to which a combination of patent subclasses appears as unconventional
or conventional. When this measure is large, components i and j are
systematically recombined. Thus they are highly related in the technological
space. When it takes values close to 0 or even negative, the measure indicates
that unexpectedly few inventions embed the two components given their
separate use; consequently i and j are unrelated and their joint use will be
rather novel or unconventional.8
Most combinations are highly conventional; only a handful of them have
values of τij which are close to zero, and are hence original or unconventional.
For instance, among the most unconventional combinations we can find the
attempts to explore biotechnology-related applications in the late 1990s. The
patent subclass 435/320.1 [Molecular Biology (435); Vector, per se (e.g.,
7 Details on the derivation of the measure and formulae to calculate ij
and ij
are reported in
the appendix. 8 The index of relatedness τij can also be interpreted as the centripetal strength that ties together
the nodes (patent subclasses) of the cognitive space in which inventions occur. High values
indicate that two elements are very close in space or interdependent as in Fleming (2001). Intuitively, components which are largely used – large ni – are indeed hardly interdependent with
other components.

23
plasmid, hybrid plasmid, cosmid, viral vector, bacteriophage vector, etc.)
(320.1)] 9 appears to be combined in an unconventional fashion with 425/401
[Drug (425); Cosmetics, antiperspirants, dentifrices (401)], and 707/3 [Data
Processing: Database and File Management, Data Structures, or Document
Processing (707); Query processing (i.e. searching) (3)]. 10
The two examples
document the attempts to explore new applications for the nascent
biotechnology sector: the first is the application of genetic engineering to the
domain of cosmetics, whereas the second relates to the bio-informatics.
Following the construction of the measure, we derive patent-based
measures of unconventionality, on the basis of the distributional properties of τ
for each pairwise combination of patent subclasses within each patent. To this
purpose, we provide two indicators of the degree of unconventionality in an
invention: the median and the minimum value of τ among the possible pair-
wise combinations contained in an invention.
The median captures the degree of unconventionality around the main bulk
of combinations within the invention, whereas the minimum value indicates
the most unconventional recombinant act within an invention. Most patents
embed a high degree of conventionality in the combination of their constituent
parts. More than half of the patents (50,46%) in the sample have a median τ
larger than 33, whereas only 28 patents have a median τ below 0. These highly
unconventional patents are mostly in drugs and communication domains as for
instance the patent number "US 5863736" recombining the subclass 435/6.16,
435/91.2 [Molecular Biology (435); Vector, per se (e.g., plasmid, hybrid
plasmid, etc.) and the subclass 715/234 [Data processing, structured
documents (e.g. htm, sgml, etc.)]. When we look at the minimum value of τ
within each patent, more than half of the patents combine components whose τ
is above 17; the occurrence of negative values is a rare event as well. All in all,
the preliminary evidence provided so far indicates that the inventive process
9 Subject matter directed to self-replicating nucleic acid molecules which may be employed to
introduce a nucleic acid sequence or gene into a cell; such nucleic acid molecules are designated as vectors and may be in the form of a plasmid, hybrid plasmid, cosmid, viral vector, bacteriophage
vector, etc. 10 Subject matter directed to methods of searching for (i.e., querying) data stored as a database in a computer or digital data processing system, including sequential searching, primary and secondary
index searching, and bit-map searching of inverted lists or topological maps.

24
relies mostly on conventional recombinations and only rarely embed more
unconventional efforts.
Table 2.2 and 2.3 report the distribution of the median τ respectively across
years of application and technological domain of the focal invention. On
average, inventions are less conventional over time; yet, there is a tendency to
both exploit established trajectories and to move beyond the existing
boundaries as we also observe that the dispersion of conventionality increases
over time. Table 2.3 provides further evidence on the goodness of our measure,
suggesting that inventions in domains like “Apparel and Textile” and
“Furniture, House Fixtures” are more conventional than ICT related inventions
like “Semiconductors” or “Computers”, which for instance find applications in
a multitude of other domains.
25
Table 2.1: Description of existing measures.
Article Measure Construction Meaning Difference
Trajtenberg,
Henderson &
Jaffe 1997
Originality Herfindahl Index of distribution of
patent classes in backward citations
Novelty is associated to a
broader and more balanced
knowledge base
Static measure, it doesn’t take into
account the current practices and
the consequent dynamics
Fleming Mingo
& Chen 2007
Creativity New Combination of patent
subclasses
Creativity is the result of novel
combinations
It does not take into account the
extent to which combinations are
close in space
Verhoeven,
Bakker &
Veugelers 2016
Novelty Pair-wise combination Inventions are novel when
they include combinations
connected for the first time
It does not offer suggestions on the
technological distance between
components
Uzzi Mukherjee
Stringer & Jones
2013
Novelty Frequency of co-citation
pairs across all papers published that
year in the
WOS benchmarked by those
expected by chance (randomized
citation networks)
Atypical connections across
knowledge domains are at the
core of novelty
Conventionality is built on yearly
base, and the benchmark does not
reflect the path-dependency in idea
generation
Dahlin and
Behrens 2005
Radicalness Similarity measure with previous and
current patents on the basis of the
overlap of backward citations
Differences in citation
structures across patents
indicate differences in the
knowledge
that inventions rely upon
Prior art differs over time and
inventions might not necessarily be
substantially different over time –
especially when they are
incremental changes
Keijl, Gilsing,
knoben &
Duysters 2016
Novelty Average distance between the patent
classes of the cited patents and the
patent classes of the focal patent.
Novelty is associated to a
higher distance between the
patent classes cited and focal.
It does not take into account the
distance among the components
recombined in the invention.

26
Table 2.2: Distribution of Conventionality of Inventions across years.
Year Conventionality St.Dev. N
Year Conventionality St.Dev. N
1980 52.322 43.133 57,185
1991 45.384 41.392 90,331
1981 51.400 42.715 55,584
1992 44.170 40.281 93,781
1982 51.431 42.668 56,723
1993 44.163 41.120 97664
1983 50.915 43.079 54,310
1994 44.066 41.128 111,428
1984 51.028 42.623 59,401
1995 44.039 41.367 130,686
1985 50.133 42.718 63,264
1996 43.079 43.015 129,961
1986 49.411 41.447 66,885
1997 43.314 43.585 152,371
1987 48.884 41.994 72,710
1998 42.327 44.758 151,632
1988 48.056 41.971 80,404
1999 42.086 44.174 161,870
1989 47.301 41.449 85,728
2000 43.550 47.141 176,747
1990 46.470 41.801 89,066
Tot. 45.638 43.012 2,037,731
Table 2.1 displays the distribution of inventions' conventionality over application year. Conventionality decreases over time,
namely patents are characterized by combination that are on average more atypical. We find similar trends across technologies
which are showed in the Appendix A. In non reported tables, we checked the consistency of this pattern by looking at all pair of
combinations supporting the tendency over time to combine components in an unconventional manner. Fixed effects estimates
taking as unit of analysis the coupling of subclasses, indicate that a move toward lower levels of conventionality is occurring in the central part of the distribution. On the opposite, conventionality increases for extreme values of initial conventionality: highly
unconventional combinations become more conventional, at a faster rate than more conventional ones become unconventional, and
conventionality strengthens over time for highly conventional combinations with the current understanding of structural relationship among constituting components.

27
Table 2.3: Distribution of Conventionality of Inventions across Technology fields.
Technological Category Mean Std. Dev. N
Agriculture, Food, Textiles 47.309 39.323 20,999
Agriculture, Husbandry, Food 57.829 55.266 50,366
Amusement Devices 69.975 56.446 23,936
Apparel & Textile 74.472 66.065 35,871
Biotechnology 77.455 76.561 9,664
Coating 33.406 29.955 56,012
Communications 34.621 30.684 194,391
Computer Hardware & Software 34.318 30.950 168,644
Computer Peripherals 30.584 28.268 65,859
Drugs 32.109 27.785 21,6705
Earth Working & Wells 58.499 49.609 36,765
Electrical Devices 44.266 40.553 88,954
Electrical Lighting 41.609 32.203 48,456
Furniture, House Fixtures 65.429 51.958 57,918
Gas 49.738 37.306 14,111
Heating 51.227 45.500 36,204
Information Storage 31.759 29.479 111,469
Materials Processing & Handlin 50.522 41.838 144,494
Measuring & Testing 41.925 36.087 83,094
Metal Working 47.604 41.869 87,355
Miscellaneous-Drug & Med 54.592 49.141 16,985
Miscellaneous-Electrical 40.620 33.473 112,175
Miscellaneous-Mechanical 59.109 50.274 129,295
Miscellaneous-Others 41.583 40.948 319,628
Miscellaneous-Chemical 38.090 32.894 308,242
Motors, Engines & Parts 54.308 46.397 93,533
Nuclear & X-rays 37.891 32.399 49,659
Optics 41.510 37.187 32,690
Organic Compounds 47.373 42.406 64,715
Pipes & Joints 42.499 32.624 25,122
Power Systems 41.244 35.379 116,500
Receptacles 46.994 33.976 55,378
Resins 27.727 22.517 101,862
Semiconductor Devices 30.861 23.413 96,714
Surgery & Medical Instruments 40.812 34.788 83,323
Transportation 64.758 55.523 83,211
Total 42.561 39.526 3,240,299
Note: Each invention is associated to more than one technology, hence we linked each UPC classes to Technological Categories considering all classes reported in a patent.

28
2.4.3 Unconventionality and its sources
As the unconventionality measure is positively skewed, we use as dependent
variable the natural logarithm of it, Log Unconventionality.11
Based on the literature on the origins of novel inventions, the first type of
origin we consider is the extent to which the focal invention builds on existing
knowledge. In our setup, we will use the (natural logarithm plus one of)
number of citations to prior art as measure of the knowledge base on which the
focal invention relies on (Log Citations). We also differentiate between
citations to previous technical and scientific literature (non-patent literature),
include the latter as the share of total citations (Science).
Furthermore, we include a control for those inventions that do not cite any
prior art to account for the possibility that unconventional connections might
not find support in any existing knowledge base (No Prior Art). We use the
average patent number of the patent documents cited as prior art as a measure
of the average age of the patent literature which forms the basis of the focal
invention (Age). Furthermore, we control for the standard deviation of the
patent numbers of the patent documents cited as prior art (Spread Age). We
also control for patents citing no patents in the prior art, because for this group
we cannot calculate the variable Age (No Patent) and a control for inventions
citing a single patent document as prior art because Spread Age cannot be
calculated for this group (Single Citation). Based on Verhoeven et al., (2016),
we also include the log of the number of connection between classes and
scientific articles referenced in the focal patents that have never occurred
before the focal application year (NSO-Novelty in Scientific Origins). Along
the same line, we also include the log of the number of references to other
technological classes referenced in the focal patent that have not occurred in
the years prior the focal patent application year (NTO-Novelty in
Technological Origins).
11 As our measure of conventionality takes negative values, we added the absolute of the lowest
value taken by Conventionality. We then took the natural logarithm of the newly transformed
covariate plus one. As the number of co-occurrences among patent subclasses can be highly volatile over time, we use 5 year moving averages. For the sake of exposition, we display the
natural logarithm of τij
29
The extent of conventionality embedded in an invention is a positive
function of the elements constituting it, that is its components. Hence, we
include the number of patent subclasses the patent has membership in
(Component).
We further control for the main organizational factors affecting the search
process. We include the number of inventors comprising the inventive team
(Team) as well as a measure for single inventor patents (Single Inventor). To
control for the experience of the inventive team, we include the largest
progressive number of patents by the inventors in the team (Experience).
We also account for the determinants of organizational inventive behavior,
by considering the inventive size of the organizations (e.g. assignee on the
patent document) as the (log plus one) of the number of patents at USPTO in
the year of the focal invention (Assignee) as well as a dummy indicating
whether the patent was not assigned to any third party and remained to the
inventors (Self). We finally add Year and Technology dummies to account for
macro trends in the degree of conventionality among patents, such as the
introduction of novel patent classes in a given year at USPTO which would
artificially alter the measure of recombinant conventionality.

30
Table 2.4: Summary Statistics split by degree of median Unconventionality (10th of the most unconventional inventions).
Full Sample
90% least Unconventional
10% Most Unconventional
Variables Obs Mean Std. Dev.
Obs Mean Std. Dev.
Obs Mean Std.Dev.
Unconv. 2,037,731 -3.658 0.675
1,833,956 -3.780 0.593
203,775 -2.561 0.223
Min Unconv. 2,037,731 -3.237 0.758
1,833,956 -3.337 0.728
203,775 -2.345 0.296
Interdependence 2,037,731 1.456 1.068
1,833,956 1.458 1.092
203,775 1.440 0.820
Originality 1,690,973 0.530 0.348
1,512,793 0.523 0.351
178,180 0.583 0.323
Cumulative Usage 2,037,731 20.969 8.2715
1,833,956 21.001 85.766
203,775 20.681 47.062
NR 2,037,731 0.026 0.1787
1,833,956 0.026 0.178
203,775 0.024 0.179
NTO 2,037,731 0.35 0.702
1,833,956 0.356 0.705
203,775 0.289 0.669
NSO 2,037,731 0.017 0.157
1,833,956 0.0167 0.154
203,775 0.022 0.181
Bwd Citations 2,037,731 2.199 0.827
1,833,956 2.185 0.816
203,775 2.326 0.910
Fwd Citations 2,037,731 13.105 21.90
1,833,956 13.014 21.831
203,775 13.923 22.585
Science 2,037,731 0.138 0.256
1,833,956 0.133 0.252
203,775 0.188 0.287
Components 2,037,731 4.659 3.267
1,833,956 4.607 3.213
203,775 5.121 3.691
Age 2,037,731 63.568 4782.242
1,833,956 59.571 4620.925
203,775 99.541 6043.214
Spread Age 2,037,731 102.383 77454.44
1,833,956 99.485 81510.22
203,775 128.464 14026.08
No Patent 2,037,731 0.027 0.163
1,833,956 0.026 0.161
203,775 0.035 0 .185
No Prior Art 2,037,731 0.012 0.110
1,833,956 0.012 0.109
203,775 0.012 0.112
Team 2,037,731 2.216 1.573
1,833,956 2.186 1.556
203,775 2.484 1.695
Max Experience 2,037,731 11.680 27.564
1,833,956 11.330 26.748
203,775 14.837 33.873
Single Inventor 2,037,731 0.423 0.494
1,833,956 0.433 0.495
203,775 0.336 0.472
Assignee 2,037,731 3.839 2.758
1,833,956 3.729 2.740
203,775 4.826 2.722
Self 2,037,731 0.153 0.360
1,833,956 0.162 0.368
203,775 0.073 0.261

31
2.5 Results
In this section, we analyze the degree of unconventionality in inventions
through a multivariate setting (Table 2.4) report the summary statistics of the
variables used).
In a first analysis we examine the relationship between Unconventionality
and the main indicators of technological novelty discussed in Section 2.3. In
particular, we analyze the relationship between Unconventionality the measure
of Interdependence and cumulative usage by Fleming and Sorenson (2001),
Originality by Trajtenber et al., (1997) and with the measure of Novelty in
New Combination (NR) by Verhoeven et al., (2016). Table 2.5 shows the
correlation between Unconventionality and other indicators. Correlations
among the indicators are weak suggesting that these measures capture different
dimensions of knowledge recombination. Table 2.6 reports the OLS
estimations of the relation among the indicators.
In a second analysis we analyze the role of the main antecedents and
sources of novelty discussed in Section 2.2.2. In this analysis we are mainly
interested in the understanding of the extent to which unconventionality is the
result of a search process that span different knowledge domains (via the
number of technological classes recombined and citations to existing domains
of knowledge). In addition, we examine whether unconventionality is affected
by the organizational structure, team/organization, in which search occurs.
Table 2.6 presents bivariate correlations among the variables that we have
identifies as determinant of unconventionality. Table 2.7 shows the correlation
table. Table 2.8 reports instead the OLS estimations of this set of analysis
In a third set of regressions reported in Table 2.9 and 2.10 we focus on the
extent to which unconventional combinations contribute to overcoming
inventive traps and are related to higher technological impact. Also in this
analysis we relate the Unconventionality measure with existing Indicators of
novelty.

32
2.5.1 Relation with existing Indicators
In Table 2.6 we report the OLS estimations that include existing measures
of novelty, in particular originality by Trajtenberg et al., (1997) and NR by
Verhoeven et al., (2016). In Model 1 to 4 we introduce the indicators
sequentially while Model 5 reports the full model. Unconventionality is
negatively associated with interdependence. Components that are highly
interdependent are synergistically recombined. As a consequence they are
strongly related and hence associated to well-established combinations. Along
this line, a higher cumulative usage (number of times a particular combination
has been used since 1975), is associated to a decrease in unconventionality,
although with a smaller magnitude relative to the interdependence of
components.
As expected, originality and NR are statistically significant and positively
associated with unconventionality. Higher scores of Originality as measured
by the spread of backward citations over technological classes, indicate that
inventions integrate divergent ideas. Inventions with high score of originality
may not necessarily be novel per se. This measure suggests the importance of a
broad knowledge base. Inventions that source on wide knowledge base are
associated with less conventional combinations.
The NR construct points instead to the existence of pair of classes in
inventions that were previously unconnected. Higher number of previously
unconnected classes within inventions are hence positively associated with
unconventionality, although with a smaller magnitude compared to the
originality construct.
Model 5 includes all constructs and contrary to model 1 the
Interdependence change sign and shows a positive association with
unconventionality. To uncover potential underlying patterns among the
variables we run a factor analysis that revealed a potential underlying structure
between Interdependence and Cumulative usage that drives the change of the
sign of Interdependence coefficient. This may suggest the need to have a
balance between wide and local search and of having focused search strategy
within narrow and synergic components before making connections to
unrelated field.

33
Table 2.5: Correlation tables with existing measures.
Unconventionality 1.0000
Interdependence -0.0609* 1.0000
Originality 0.1020* -0.1521* 1.0000
NR 0.0060* -0.0457* 0.0730* 1.0000
Cumulative Usage -0.0363* 0.2057* -0.0017* -0.0169* 1.0000
Note: Correlation between Unconventionality and related measure is very low
suggesting that the measures pick up different dimensions.
Table 2.6: OLS estimations for the relation with other measures.
Model 1 Model 2 Model 3 Model 4 Model 5
Interdependence -0.017*** 0.009***
(0.000) (0.001)
Originality 0.200*** 0.201***
(0.001) (0.001)
NR 0.054*** 0.024***
(0.002) (0.003)
Cumulative Usage -0.001*** -0.001***
(0.000) (0.000)
Constant -3.930*** -4.032*** -3.948*** -3.945*** -4.041***
(0.006) (0.007) (0.006) (0.006) (0.007)
N 2,037,731 1,690,973 2,037,731 2,037,731 1,690973
R2 0.116 0.115 0.116 0.125 0.124
*, **, and *** indicate respectively 10%, 5% and 1% statistical significance. Regressions include 21 year
dummies and 37 technology dummies; all dummies are jointly statistically significant. Regressions include also
controls (dummies) for missing information on the age of the backward citations and.

34
2.5.2 Sources of Unconventionality
Table 2.8 reports the results of OLS and logit models on the determinants of
unconventionality. Model 1 introduces the variables at the level of the
invention; Model 2 accounts for the inventive team whereas Model 3 adds the
determinants at the level of the assignee. The initial set of variables provide the
bulk of explanatory power, most of which is attributable to year and
technology effects: regressing Unconventionality only on the 21 year dummies
and 37 technological dummies yields an R-squared of 0.1147. Adding the
remaining invention controls improves the explicative power of the model to
0.147. Yet, this improvement is by far the largest when compared to the
inclusion of team and assignee level controls.
Unconventionality in inventions is positively associated with the amount of
backward citations in patents. A 10% increase in the amount of documents
cited as prior art is related to an increase of 0.13% in the median level of
conventionality of the focal invention. However, references between
technological classes and scientific field that occur for the first time (NSO) are
associated with a decrease in unconventionality. Originality instead, spread of
citations over technological classes, is positively associated with
unconventionality. As expected references to non-patent literature contributes
to unconventionality. An increase in one standard deviation of Science (Non
patent literature) is associated with 2.9% increase in the degree of
unconventionality of the focal invention. Ceteris paribus, the more inventions
source from other domains than the technical one – especially from Science –
the higher the extent of unconventionality in their recombinations.
Inventions carrying forward unconventional recombinations rely to a larger
extent on less recent prior art. The results indicate that inventions are more
unconventional when they embed a higher number of components.
Conventionality is rooted in familiar and mature solutions which happen to be
combined with more recent ones. The degree of unconventionality instead
increases as the number of components used in the focal invention also
increases: one standard deviation increase in the number of patent subclasses
in which the focal invention has memberships in is related to an increase of
0.10% in the median value of conventionality of the invention, ceteris paribus.
35
Teams produce inventions with a higher degree of unconventionality
(model 2) as opposed to single inventors. This finding suggest that large teams
benefit from knowledge from multiple inventors that are likely to search and
built on larger and diversified range of components. Inventions being the result
of collaborations are less conventional; yet, larger teams seem to recombine
components in a more conventional fashion. The median value of
unconventionality in an invention produced by a single inventor is indeed
3.8% lower. More experienced inventors are able to combine components in an
unconventional fashion.
The final set of controls suggest that larger firms are more likely to be
responsible for the generation of unconventional inventions12
. Inventions
occurring in larger organizations carry forward unconventional solutions, as
opposed to “garage” inventions. At the average, doubling the size of the
assignee in terms of successful patents applied in a given year increases the
degree of unconventionality by 2.1%, all else equal. "Garage” inventors,
inventors which do not belong to any existing organization and most likely are
self-employed, produce less unconventional combinations. Large firms may
leverage economies of scope and scale in R&D. Large firms can spread costs
and risks on broader output (Cohen & Klepper, 1996a, 1996b; Henderson &
Cockburn, 1996). Moreover, they can exploit a more diversified portfolio and
technological base which may facilitate the recombination of knowledge.
Adding the final set of variables for the size of the patent assignee, causes
some covariates related to the characteristics of the team to change sign: team
size become negative and significant. We suspect that this has to do with the
ability of large firms to coordinate larger teams. The OLS estimations reported
in Table 2.8 has been replicated by using logit models on the 10th centile of
the inventions with the highest values of median unconventionality. The most
unconventional inventions have a higher probability to combine components in
an unconventional way (lower likelihood to be conventional). Consistently
with OLS results, a higher likelihood to score in unconventionality, is driven
12 Note that information on the Assignees are not consolidated. To check the robustness of this finding we uses alternative data sources from Orbis. Results are robust to this alternative
specification of the firm patent portfolio. In general we expect that consolidated data would
reinforce this finding. The finding that large firms produce more unconventional inventions also holds in non reported analysis that control for the concentration of firm activities computed
through the Herfindahl Index.

36
by the amount of citations and the number of components that are recombined
while the odds for large team and experienced inventors suggest a focus on
established combinations.

37
Table 2.7: Correlation table on the determinants of Unconventionality
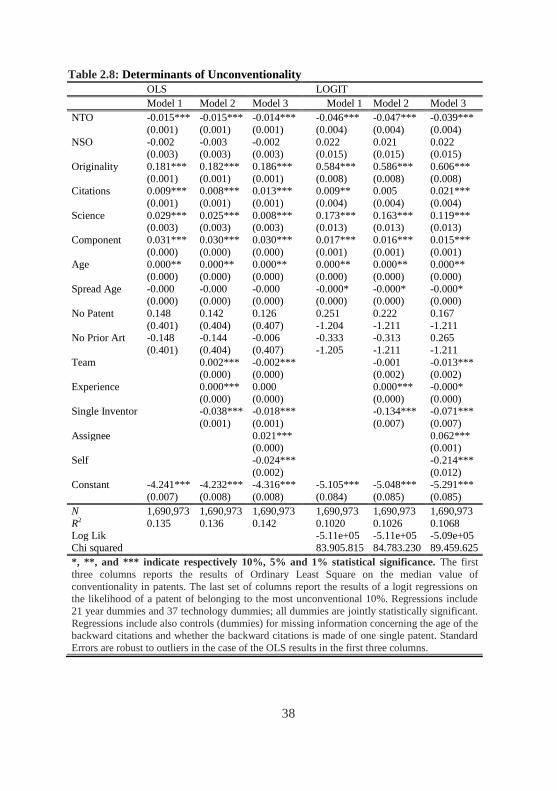
38
Table 2.8: Determinants of Unconventionality
OLS LOGIT
Model 1 Model 2 Model 3 Model 1 Model 2 Model 3
NTO -0.015*** -0.015*** -0.014*** -0.046*** -0.047*** -0.039***
(0.001) (0.001) (0.001) (0.004) (0.004) (0.004)
NSO -0.002 -0.003 -0.002 0.022 0.021 0.022 (0.003) (0.003) (0.003) (0.015) (0.015) (0.015)
Originality 0.181*** 0.182*** 0.186*** 0.584*** 0.586*** 0.606***
(0.001) (0.001) (0.001) (0.008) (0.008) (0.008) Citations 0.009*** 0.008*** 0.013*** 0.009** 0.005 0.021***
(0.001) (0.001) (0.001) (0.004) (0.004) (0.004)
Science 0.029*** 0.025*** 0.008*** 0.173*** 0.163*** 0.119*** (0.003) (0.003) (0.003) (0.013) (0.013) (0.013)
Component 0.031*** 0.030*** 0.030*** 0.017*** 0.016*** 0.015***
(0.000) (0.000) (0.000) (0.001) (0.001) (0.001)
Age 0.000** 0.000** 0.000** 0.000** 0.000** 0.000**
(0.000) (0.000) (0.000) (0.000) (0.000) (0.000)
Spread Age -0.000 -0.000 -0.000 -0.000* -0.000* -0.000* (0.000) (0.000) (0.000) (0.000) (0.000) (0.000)
No Patent 0.148 0.142 0.126 0.251 0.222 0.167
(0.401) (0.404) (0.407) -1.204 -1.211 -1.211 No Prior Art -0.148 -0.144 -0.006 -0.333 -0.313 0.265
(0.401) (0.404) (0.407) -1.205 -1.211 -1.211
Team 0.002*** -0.002*** -0.001 -0.013*** (0.000) (0.000) (0.002) (0.002)
Experience 0.000*** 0.000 0.000*** -0.000*
(0.000) (0.000) (0.000) (0.000) Single Inventor -0.038*** -0.018*** -0.134*** -0.071***
(0.001) (0.001) (0.007) (0.007)
Assignee 0.021*** 0.062*** (0.000) (0.001)
Self -0.024*** -0.214***
(0.002) (0.012) Constant -4.241*** -4.232*** -4.316*** -5.105*** -5.048*** -5.291***
(0.007) (0.008) (0.008) (0.084) (0.085) (0.085)
N 1,690,973 1,690,973 1,690,973 1,690,973 1,690,973 1,690,973
R2 0.135 0.136 0.142 0.1020 0.1026 0.1068 Log Lik
-5.11e+05 -5.11e+05 -5.09e+05
Chi squared 83.905.815 84.783.230 89.459.625
*, **, and *** indicate respectively 10%, 5% and 1% statistical significance. The first
three columns reports the results of Ordinary Least Square on the median value of
conventionality in patents. The last set of columns report the results of a logit regressions on the likelihood of a patent of belonging to the most unconventional 10%. Regressions include
21 year dummies and 37 technology dummies; all dummies are jointly statistically significant.
Regressions include also controls (dummies) for missing information concerning the age of the backward citations and whether the backward citations is made of one single patent. Standard
Errors are robust to outliers in the case of the OLS results in the first three columns.
39
2.5.3 Technological Impact
This section discusses the results of a set of generalized negative binomial
models for the technological impact of inventions (forward citations).
Table 2.9 reports the estimations for the technological impact of inventions
by considering only the Unconventionality measure and the other indicators of
novelty. Unconventionality is positively associated with forward citations.
Original inventions and those based on new combination (NR) also received
more forward citations. In line with expectations, interdependence and
cumulative usage are negatively associated with technological impact. The
dispersion of unconventionality is lower compared to the other indicators.
Table 2.10 reports the estimations for the technological impact using all
variables. Both median Unconventionality and minimum Unconventionality
are positively associated with future citations. This finding indicate that
unconventionality, both at median value and at its most unconventional effort,
is associated with higher impact on future technological developments.
However, when they are introduced together in the analysis, median
Unconventionality turns negative and significant, whereas minimum
Unconventionality remains positive. Inventions combining components in an
unconventional fashion are on average more cited. The effect is more
pronounced for those inventions that are unconventional in their most
unconventional combination (minimum unconventionality) as compared to
inventions that are unconventional at the core of their combinations (median
unconventionality). In line with Uzzi et al., (2013), this may suggest that
inventions combining unconventional combinations within an established
framework may benefit from the highest impact. This result is also in line with
Schilling and Greene (2011), who argue that it suffices a very small amount of
unconventional combinations to connect large bodies of knowledge, that
otherwise would remain distant.
Higher interdependence and cumulative usage of components are
associated with lower impact. In line with expectations, higher score of
originality and new pairwise combinations on average receive significantly
more forward citations. Compared to the other indicators of novelty, the results
show that Unconventionality has a lower dispersion. This may suggest that
measures based on the first combination are riskier and originate from a
40
process of experimentations characterized by potentially many failures.
Unconventionality measure instead captures not only the inventions at are at
the extreme of the continuum of novelty (most and least unconventional) but it
also includes those inventions that are in between.
Impact is positively associated with the number of claims in a patent used
in the literature as a further indication of the originality of an invention. For
what concern reference to prior art, the number of backward citations as well
as the number of patent classes therein and references to previously
unconnected scientific fields have a positive influence on future impact. This
finding is in line with the view that inventions spanning across a wide spectra
of the knowledge space receive a higher number of citations. The ratio of
citations coming from non-patent literature is negatively associated with
impact. This result has to be understood in combination with the coefficient
associated with the number of backward citations, indicating that patents
drawing mostly from outside the patent literature have a limited impact on
future inventions13
.
Finally, inventions from larger teams receive a larger number of future
citations, whereas inventions by lone inventors and large applicants receive
less citations, ceteris paribus.
All in all, these results provide evidence that unconventionality is
associated with higher impact, especially when it is related to the most creative
act, as long as it remains embedded in established frameworks.
13 Regressions include 21 year dummies and 37 technology dummies; all dummies are jointly
statistically significant. Regressions include also controls (dummies) for missing information
concerning the age of the backward citations and whether the backward citations is made of one
single patent. In this regression we also control for the number of claims reported in the focal inventions. The over-dispersion parameter, unreported, is significantly different from zero. High
level of conventionality as well as the variable Min Conv and increase the dispersion. However
L_Conv and Min Conv decrease the dispersion in the full model. Interdependence decrease the dispersion, Originality and NR increase it. Note that the dispersion parameter is shown only for the
main variables of interest.

41
Table 2.9: Generalized negative binomial regressions estimating the impact of
inventions: comparison with exiting indicators.
Model 1 Model 2 Model 3 Model 4 Model 5 Model 6
Unconven. 0.132*** 0.108***
(0.002) (0.002)
Interdependence -0.065*** -0.061*** (0.001) (0.001)
Originality 0.122*** 0.059***
(0.003) (0.003) NR 0.285*** 0.260***
(0.007) (0.007)
Cumu_Usage -0.000*** 0.000*** (0.000) (0.000)
Constant 2.335*** 1.869*** 1.891*** 1.800*** 1.815*** 2.386***
(0.017) (0.016) (0.019) (0.016) (0.016) (0.020)
lnalpha
Unconven. -0.023*** -0.019***
(0.002) (0.002)
Interdependence -0.022*** -0.020***
(0.001) (0.002)
Originality 0.110*** 0.092*** (0.004) (0.004)
NR 0.097*** 0.079***
(0.008) (0.008)
Cumu_Usage 0.000*** 0.000***
(0.000) (0.000)
Constant 0.115*** 0.210*** 0.056** 0.190*** 0.197*** -0.004 (0.022) (0.021) (0.025) (0.021) (0.021) (0.027)
Observations 2,037,731 2,037,731 1,690,973 2,037,731 2,037,731 1,690,973
Pseudo R2 0.0190 0.0189 0.0192 0.0187 0.0184 0.0202
Log Lik. -7.14e+06 -7.14e+06 -6.04e+06 -7.15e+06 -7.15e+06 -6.04e+06 Chi squared 1.75e+05 1.73e+05 1.49e+05 1.71e+05 1.68e+05 1.61e+05
*, **, and *** indicate respectively 10%, 5% and 1% statistical significance. Regressions include 21 year dummies and 37 technology dummies; all dummies are jointly statistically significant. Regressions
include also controls (dummies) for missing information concerning the age of the backward citations and
whether the backward citations is made of one single patent. In this regression we also control for the number of claims reported in the focal inventions. The over-dispersion parameter, is significantly different
from zero.

42
Table 2.10: Generalized negative binomial regressions estimating the impact of inventions.
Model 1 Model 2 Model 3 Model 4 Model 5 Model 6 Model 7 Model 8
Med. Unconven. 0.074*** -0.041*** -0.152*** -0.174*** -0.168*** -0.173*** -0.042***
(0.002) (0.003) (0.003) (0.003) (0.003) (0.003) (0.003)
Min Unconven. 0.100*** 0.137*** 0.303*** 0.307*** 0.321*** 0.327*** 0.124*** (0.002) (0.003) (0.003) (0.003) (0.003) (0.003) (0.003)
Interdependence -0.026*** -0.014***
(0.001) (0.001) Originality 0.065*** -0.007**
(0.003) (0.003)
NR 0.252*** 0.198*** (0.006) (0.006)
Avg_Cumu_Usage -0.000*** 0.000
(0.000) (0.000) NTO -0.024*** -0.025*** -0.025*** -0.044***
(0.001) (0.001) (0.001) (0.002)
NSO 0.142*** 0.143*** 0.143*** 0.115*** (0.010) (0.009) (0.009) (0.007)
Citations 0.225*** 0.223*** 0.223*** 0.228***
(0.002) (0.002) (0.002) (0.002) Science -0.025*** -0.025*** -0.025*** 0.017***
(0.005) (0.005) (0.005) (0.006)
Component 0.039*** 0.030*** 0.027*** 0.025*** (0.000) (0.000) (0.000) (0.001)
Age -0.000** -0.000** -0.000** -0.000
(0.000) (0.000) (0.000) (0.000) Spread Age 0.000* 0.000** 0.000** -0.000
(0.000) (0.000) (0.000) (0.000) No Patent -0.125*** -0.131*** -0.132*** -1.342*
(0.014) (0.014) (0.014) (0.747)
Team 0.033*** 0.033*** 0.033*** 0.036***

43
(0.001) (0.001) (0.001) (0.001)
Experience -0.000 -0.000 -0.000 0.000**
(0.000) (0.000) (0.000) (0.000) Single Inventor -0.039*** -0.038*** -0.039*** -0.036***
(0.003) (0.003) (0.003) (0.003)
Assignee -0.006*** -0.007*** -0.007*** -0.009*** (0.000) (0.000) (0.000) (0.001)
Self -0.048*** -0.048*** -0.049*** -0.057***
(0.003) (0.003) (0.003) (0.003) claims 0.013*** 0.013*** 0.013*** 0.012***
(0.000) (0.000) (0.000) (0.000)
Constant 1.251*** 1.363*** 1.341*** 2.260*** 2.266*** 2.223*** 2.238*** 1.396*** (0.018) (0.018) (0.018) (0.017) (0.020) (0.017) (0.017) (0.021)
lnalpha
Med Unconvent -0.039*** -0.025*** -0.010** -0.015*** -0.023*** -0.020*** 0.002 (0.002) (0.004) (0.004) (0.004) (0.004) (0.004) (0.004)
Min Unconvent -0.038*** -0.016*** -0.030*** -0.016*** -0.013*** -0.012*** -0.036***
(0.002) (0.004) (0.004) (0.004) (0.003) (0.003) (0.004) Interdependence -0.025*** -0.031***
(0.001) (0.002)
Originality 0.110*** 0.064*** (0.004) (0.004)
NR 0.103*** 0.033***
(0.008) (0.008) Avg_Cumu_Usage 0.000*** 0.000***
(0.000) (0.000)
(0.012) (0.012) (0.012) (0.008) Constant 0.033 0.039 0.021 0.046** -0.083*** 0.020 0.046** 0.064**
(0.025) (0.025) (0.025) (0.022) (0.027) (0.023) (0.023) (0.030)
N 2037026 2037026 2037026 2037731 1690973 2037731 2037731 1690504
*, **, and *** indicate respectively 10%, 5% and 1% statistical significance.
44
2.6 Discussion and Conclusion
In this study we investigate the origins of unconventional combinations of
knowledge components. Unconventional or novel combinations are largely
believed to be at the foundation of breakthrough inventions as they establish
new connections between distant and overlooked domains of knowledge. In so
doing, they remove obstacles and bottlenecks to the combinatorial power of
research and development efforts, thus favoring an upsurge of follow on
inventions.
By considering the inventive process as a process of recombinant search, in
our analysis, we first discuss the concept of distance in the search process and
then how it influences the extent of unconventionality in the inventive process.
As inventors typically search locally, they will mostly recombine
technological components in a conventional manner, i.e. according to the
structure with which relationships have proved to work in the past. By
extension, most inventions will be the outcome of conventional combinations.
We thus propose a measure to determine the distance among the elements of
the technological space - Unconventionality measure. We borrow the concept
and operationalization of relatedness from the literature on product market
diversification (Teece et al., 1994) and adapt it to our purpose in the same
fashion as in Breschi et al. (2001) and Nesta and Saviotti (2005). We use
patent documents at USPTO between 1975 and 2000 to measure
unconventionality in combinations, in inventions at the core of their
combinatorial effort (median) and at the most unconventional instance
(minimum). Our approach rests on a fairly stable feature of the patent system,
the patent classification, which is only marginally subject to variations, and
therefore more reliable in the determination of the measure. We claim that this
indicator captures the extent of unconventionality in the recombinant process
over the technological landscape.
Our results confirm that most of the recombinant and inventive activities
are grounded in conventional efforts, with some rare instances of
unconventional connections. Furthermore, we show that average
conventionality decrease over time providing indirect evidence that

45
unconventional combinations may contribute to shifts of the technological
paradigms.
We identified the main drivers of distance in the search process, which we
expected to be responsible for unconventional combinations. We find that
patents that take a broader view by citing a widespread spectrum of previous
results, both in science and technology, have a higher chance to identify
unconventional connections. Moreover, patents having no backward citations
of any kind are more conventional. Unconventionality is more likely to occur
with experience, and in large organizations.
We provide suggestive evidence on the relationship between
unconventional combinations and future impact. We observe a premium on
future impact from unconventionality: inventions embodying conventional
combination in their core but carrying forward unconventional combinations in
their most unconventional acts are cited more by future patent applications
than conventional inventions.
The contributions of this study are manifold. From a theoretical standpoint,
the results are in line with the body of work on the theory of recombinant
invention and creativity in general. This stream posit that agents mostly work
in the neighborhood of their competences. Combinations mostly occur with
components whose associations have proved to be effective by past use.
Inventors eventually experiment with a limited set of components at a time
(Fleming, 2001). Much like in Schilling and Greene (2011), this outcome
confirms that novel and unconventional combinations are at the origin of high
impact solutions as they bridge deep pools of coherent and established
knowledge. Unconventional combinations bring together distant concepts and
ideas, reshaping the associative framework within which concepts are related
and rendering associations that had been overlooked suddenly feasible.

46

47
Chapter 3
Sailing in all Winds: Technological Search over the Business Cycle✵
3.1 Introduction
The Global Financial Crisis of 2007-200914
has showed how deep recessions
may affect the ability of firms to persistently invest in innovation, with
important consequences for long-term competitiveness and economic growth
(OECD, 2012). Despite the heterogeneous response across countries and
sectors, a large fraction of firms in the European Union have curtailed their
R&D expenses, calling for a deeper understanding of the effects of crises on
the innovative strategies of firms (Filippetti & Archibugi, 2011). The scholarly
debate on the effects of economic crises, business cycle in general, and
innovation, has identified a pro-cyclical relationship and the centrality of
financial constraints in the R&D investment decisions of firms (Aghion &
Saint-Paul,1998; Aghion et al., 2012; Campello et al., 2010).
✵ This chapter is based on working paper, joint with Antonio della Malva (KU Leuven) and
Massimo Riccaboni (IMT Lucca / KU Leuven). We thank Gino Cattani, Reinhilde Veugelers for
their valuable comments and suggestions as well as participants at the internal seminars at MSI-
KU Leuven, the 3rd KTO workshop at SKEMA Business School, the XXXI EGOS Conference,
the 5th SEEK Conference in ZEW, the T2S Annual Conference in Dublin , the Large-scale Crises:
1929 vs. 2008 Conference in Ancona and the 50th Anniversary SPRU Conference at the
University of Sussex. We also thank Andrea Morescalchi for assistance on the first version. 14 The 2007-2009 Financial Crisis motivated this study however due to data constraint our analysis
only include the period 1980-2000. The measure of conventionality that we use in this study to
assess the recombination process only include inventions up to 2000 before the introduction of new technological classes that can influence our results. We leave to future research the expansion
of our dataset and hence the inclusion of the 2007-2009 Financial Crisis.

48
In this study we extend this line of research by exploring the relationship
between the inventive process and business cycle. We argue that tighter
economic conditions not only affect the propensity of firms to invest in R&D,
but also shape the type of inventions that are pursued and generated. In
response to a decline in output and profits, firms can be expected to focus on
less challenging roads through local search in the attempt to innovate
incrementally. Innovations departing from conventional technological
paradigms have a fundamental impact on society (Dosi, 1982) motivating this
study to investigate the recombination process along the business cycle.
Inventions are the final result of a process of search and recombination of
knowledge into new domains of applications or reconfiguration of existing
knowledge into novel combinations (Fleming, 2001). The search for novel
combinatorial possibilities usually occurs in the proximity of firms’
competences through local search, characterized by lower levels of risks and
uncertainty as it builds on past failures, extant competences and previous
successful solutions (Cyert & March, 1963; Simon, 1978). However,
connections of pieces of knowledge that are already highly related, or
complementary, are likely to hinder the possibility of producing impactful
inventions (Perkins, 1995). Unlike local search, distant search explores new
and unfamiliar technological domains, with greater possibilities of extending
the range of combinatorial alternatives (Katila & Ahuja, 2002). The ultimate
result of this process is that inventions are more likely to include new, atypical
or original coupling relationships characterized by higher level of
(un)conventionality (Levinthal & March, 1993; Simonton, 1999; Schilling,
2005; Katila & Chen, 2009). Compared to local, distant search is a costly
activity, characterized by higher levels of uncertainty and failures as it requires
more efforts in the selection and integration of relevant knowledge (Fleming,
2001). Although inventions resulting from local search have a positive impact
on productivity growth (Baumol, 2002), novel or breakthrough innovations,
resulting from distant search, prevent from core rigidities traps with positive
impacts on performances and long term competitiveness (March, 1991;
Leonard-Barton, 1992).
To study how firms adapt their search strategies to the business cycle, we
analyze the variation of the degree of unconventionality in patented inventions
at the USPTO over the business cycle between 1980 and 2000. For this

49
purpose, we have assembled an original database which links patent data from
the USPTO (Li et al., 2014) to financial information of firms listed in
Compustat and macro-economic data related to the business cycle from the
NBER-CES Manufacturing Industry database. To capture the degree of
technological unconventionality, we employ a measure of relatedness of
knowledge components recombined in inventions (see Chapter 1 and
Appendix A for the derivation of the measure). In line with the extant literature
acknowledging the link between economic growth and impactful innovations,
we also consider the technological impact of inventions by analyzing the
relationship between business cycle and unconventionality on forward patent
citations. Unlike previous studies which used measures of innovation input and
output, aggregated at the level of countries, sectors and firms, our approach
relates individual inventions, and their characteristics, to the phases of the
business cycle, allowing for a finer analysis of the relationship.
Our results indicate that, during contractive phases, firms retrench from
novel inventive activities. Inventions generated during the recessive phase of
the cycle embed more established combinations, resulting from a process of
search which is more localized in the technological space. Therefore, not only
are downturns associated with a reduction in the amount of innovative inputs
and outputs, as the financial constraint arguments predict, but also the resulting
output is characterized by lower levels of novelty. We further investigate some
mechanisms that affect the relationship between inventiveness and the business
cycle by analyzing the extent to which the decision to cancel or postpone novel
inventive projects depends on the reliance on external financing and the
technological competences of firms. We find that the retrenchment from
unconventional inventive activities is pronounced among financially
constrained firms, whereas unconstrained firms do not change their inventive
behavior along the business cycle. Looking at the technological portfolio of
firms, we notice that firms become more conservative in their inventive efforts
in the core of their technological competences. Finally, impact-wise, the results
suggest that the consequences of retrenching from novel inventive activities
can be most harmful for financially constrained firms. We claim that this is
due to the fact that they are forced to cancel or postpone projects in the core of
their technological competences.
50
This study extends the scholarly debate that has mainly dealt on the impact
of recessions on the input side of innovation, i.e. R&D expenditures (Barlevy,
2004, 2007; Ouyang, 2011; Aghion et al., 2012; Amore, 2015; Pauvnov, 2012;
Filippetti and Archibugi, 2011). Our findings also contribute to a more recent
stream of literature that has focused on innovation outputs and on the
effectiveness of technology policies (Hud & Hussinger 2015; Berchicci et al.,
2013; Cincera et al., 2010; Ouyang, 2011; Fabrizio & Tsolmon 2014). Finding
that managers are less willing to embark in novel inventive activities during
downturns, characterized by higher uncertainty, indicates that the reduced
profitability and the lower availability of resources experienced by firms affect
investment decisions not only at the extensive margins (the amount of
resources dedicated to innovation expressed by a change in the size of the
portfolio), but also at the intensive margins (the riskiness of the inventive
projects being pursued, expressed by the degree of unconventionality in the
surviving portfolio). These results extend the literature on the behavioral
theory of the firm in general and the role of slack resources in particular (Cyert
& March, 1963; Troilo et al., 2014). An increase in uncertainty following
challenging economic conditions shortens the time horizon with which
managers make their investment decisions (Kahneman & Lovallo, 1993),
especially with regards to innovation, as they prefer to invest in projects whose
returns are more predictable.
From a policy perspective, the evidence that firms engage in less novel
inventive projects during contractive phases, in particular financially
constrained firms, call for an active role of policy makers not only to sustain
the level of R&D investments but also to intervene in the decisions and
incentives of which type of innovation to pursue (Mazzuccato, 2015). Indeed,
a recent contribution by Hud and Hussinger (2015) has documented a
crowding-out effect from subsidy recipients in Germany during the last
financial crisis, especially among SMEs. Our result add to their finding
suggesting that firms may use R&D subsidies to finance less novel projects.
The remainder of the paper is organized as follows. The next section
presents a review of the literature on the relationship between innovation and
business cycles. Section 3.3 describes the data and the empirical model whose
results are discussed in section 3.4. The chapter concludes with section 3.5

51
with a summary of the main findings and a discussion of the policy
implications.
3.2 Innovation and the Business Cycle
Dating back to Schumpeter (1939), scholars have questioned the relationship
between business cycles and innovation. Two competing arguments have
emerged. A first approach states a counter-cyclical relationship between
downturns and innovations, i.e. innovation increases during downturns. This
argument is based on a lower opportunity costs that firms can exploit for
investing in innovation (Saint-Paul, 1997; Aghion & Saint-Paul, 1998). Firms
have higher incentives to allocate internal resources to the development of
innovations via new products (Berchicci et al., 2013). As returns from existing
product lines and activities decline, firms are more prone to search for new
market niches less affected by the downturn, reducing the risks through
diversification. Geroski and Walters (1995) advocate that firms have higher
incentives to innovate when the loss associated with a decline in current
activities is larger than the relative returns to be gained from implementing
new product or process. The introduction of new products during downturns
enables firms to establish a leading position in the eyes of consumers when the
demand recovers (Steenkamp & Fang, 2011). Firms also have higher
incentives to introduce cost-saving process innovations in order to reduce the
costs of production and therefore match the lower demand. Moreover, the
advantages stemming from more efficient production processes can provide
firms with an advantage when the economy recovers (Saint-Paul, 1997).
A second perspective theorizes a pro-cyclical relationship, stating that
innovative activities decrease during downturns due to a reduction in resources
allocated to R&D. Following this argument, profit-maximizing firms will time
their innovation activities to periods of high-demand to capture higher profits
(Schleifer, 1986). As the demand for goods and services decreases during
downturns, firms usually experience a reduction in profits. The reduced
profitability translates in fewer resources, especially liquidity, which limits
firms' ability to invest in innovation (Barlevy, 2007; Fabrizio & Tsolmon,
2014). Moreover, the availability of external resources to finance innovation,
such as bank loans, decline as financial institutions may deleverage from

52
existing investments and be more reluctant to finance risky projects (Aghion et
al., 2012). The limited amount of liquidity and a higher perceived risk, bias
firms' decisions in the pursuing more conservative approaches, whose returns
are certain and closer in time (Bovha Padilla et al., 2009).
The empirical evidence has mostly documented a pro-cyclical relationship
between general economic, industry-specific fluctuations and input/output
measures of innovation (Barlevy 2007; Geroski & Walters, 1995; Ouyang,
2011; Fabrizio & Tsolmon, 2014). Using data for manufacturing sectors over
four decades, Ouyang (2011) finds that the cyclical pattern of R&D
investments is due to the existence of financial constraints that limit the ability
of firms to sustain high levels of R&D during downturns. However, the author
finds that sectors react negatively to positive shocks in the economy,
advancing that the opportunity cost argument, despite not being predominant,
is also in place. Using a sample of French firms, Aghion et al. (2012)
complement these findings by showing that the effect of financial constraints is
not uniform across firms and sectors. The relationship between R&D and
business cycle is pro-cyclical for firms with higher dependence on external
capital and fewer collaterals and in sectors more exposed. Moreover, the
authors find that the ratio of R&D to total investments is counter-cyclical,
supporting the view that firms limit the negative effects of cash-flow
fluctuation on R&D by relying on internal reserves of cash (Himmelberg &
Petersen, 1994). Using patents as measure of output, Geroski and Walters
(1995) find that in the UK patent output clusters around periods of boom over
a period of 40 years. The results suggest that economic fluctuations drive
inventive activities, in line with the view that firms time their innovative
activities with periods of high customer demand. Along these lines, Fabrizio
and Tsolmon (2014) show that the relationship between business cycles and
patenting differs across sectors. The authors use firm data from Compustat
from 1975 to 2002 to show that the relationship is positively moderated by the
likelihood of imitation and the rate of product obsolescence of sectors.
Berchicci et al., (2013) have analyzed the relationship between industry
fluctuation and types of innovation, namely product and process innovation.
The results of this study suggest that the opportunity cost and the financial
constraint arguments co-exist when product and process innovations are
considered separately. The authors show that, for a panel of Italian firms,

53
product innovation is most likely to occur during downturns, therefore
supporting the counter-cyclical argument. During industry downturn, firms
engage in product innovation while holding back on process innovation
(Berchicci et al., 2013). The authors suggest that engaging in process
innovation is less likely since it may be not profitable to improve the efficiency
of producing existing lines of products whose value is dropping. Process
innovation is thus more likely to coincide with upturns, as the financial
constraint argument indicates (Devinney, 1990).
Based on the first line of argument, we would expect firms to engage in
distant search during the contractive phases of the industry cycle. Firms
incentives to orchestrate more unconventional innovations would be higher
during this phase due to a decrease in profitability on existing products. Firms
may also experience an excess of slack resources that may be reallocated to
more explorative search at lower marginal costs.
Based on the second line of argument, we would expect firms to be less
prone to engage in distant search due to higher constraints in financial
resources. Moreover, due to a lower demand, firms may perceived the
exploration of new domains as a riskier activity relative to periods of more
favorable market conditions.
3.3 Data and Methodology
Our research strategy tracks the degree of Unconventionality of patent
production over time with respect to the technological portfolio and financial
characteristics of firms, as well as economic conditions in the manufacturing
industry business cycles. The unit of analysis is represented by the single
patent15
. We use data on utility patents granted by the United States Patent and
Trademark Office (USPTO) between 1980 and 200016
(Li et al., 2014). The
15 The focus of this study is the recombination process which is manifested in the final invention.
As a consequence our analysis are patent based as allow us to examine the recombination process
at a more disaggregated level. Firm level analysis are provided in the appendix for robustness checks. 16 We consider only granted patents between 1980 and 2000 in order to guarantee consistency in
the conventionality measure used in this Chapter. In 2001 new technological classes were introduced and for consistency we only computed conventionality measure up to 2000. Details on
the derivation of the measure are available in the Appendix to this Chapter and in Chapter I.

54
database includes procedural information about patents (i.e. publication and
application number, grant and application date, claims), inventor and assignee
data and complete references to the technological classes and subclasses
according to the US Patent Classification (USPC) system. The USPC system is
articulated in more than 400 classes, representing broad technological fields,
and about 100,000 subclasses, that point to specific technological divisions
within each class. Patent subclasses identify, in our framework, the knowledge
components available for the search and recombination process (Fleming,
2001). We complement the dataset with the relational table of patents and
firms from Orbis Bureau Van Dijk. Orbis provides information on about
70.000 listed companies. We matched the patent dataset with firms' financial
accounts database and we used the companies' sector of operation to retrieve
sector-level information.17
We matched firm-level data with the NBER-CES
Manufacturing Industry Database, which contains annual industry-level data
(i.e. number of workers, total payroll, value added) for the U.S. manufacturing
sector from 1958 to 2009 (Becker et al., 2013).18
Our final dataset comprises
166,168 patent observations belonging to 1,077 US firms with at least one
listed activity operating in the manufacturing sector between 1980 and 2000.
Table 3.1 reports the summary statistics.
3.3.1 Dependent Variables
We measure the degree of unconventionality (Unconventionality) in the
technological space by the extent to which an invention is the result of a search
and recombinant process that departs from established and conventional
practices. Leveraging on the concept of relatedness, previously used to assess
the diversification of business activities (Teece et al., 1994) and technological
portfolios of firms (Breschi et al., 2003; Nesta & Saviotti 2005), we define as
novel those combinations of knowledge components embedded in inventions
that are distant in the knowledge space, or rarely coupled together. We
conceptualize distance as the strength of the relationship among the
17 The exclusion from Compustat of non-listed firms may generate possible sample selection bias
as typically smaller firms are not included. However, the potential bias is diminished by the fact that normally US firms have a high recourse to stock markets and R&D is concentrated in publicly
listed firms which enable Compustat to have a reliable coverage on long historical data and
extensive financial and operating accounts for a large time window, 1950-2013. 18 The manufacturing sector includes a large concentration of R&D investments which ranges
between 70-80% (Barlevy, 2007).

55
components underlying inventions. Hence, two components will be close in
the technology space, if their joint occurrence is highly frequent. This is likely
to be the outcome of a systemic search towards related or familiar paradigms.
Conversely, two components are more distant if their joint occurrence in
previous inventions is rarer with respect to what a random process would
predict. The combination of strongly related components indicates that
inventions build on an established technological base, as opposed to the
combination of distant and rarely combined elements in the knowledge space
which are associated with more novel inventions. Based on the USPTO patents
population and its classification system, we derive a patent-based measure of
unconventionality by computing the yearly frequency of the joint occurrence19
of each possible combination of subclasses within the same patent. We then
compare the observed occurrence to the outcome of a purely random process.20
3.3.2 Independent Variables
Drawing on prior studies about innovation and business cycles (Barlevy, 2007;
Fabrizio & Tsolmon, 2014), we compute nominal gross output by summing
annual value added and material costs for each of the three-digit SIC industries
in the NBER Manufacturing and Productivity database (Bartelsman & Gray,
1996). Then we calculate the annual real gross output (RO) for each industry
by dividing the nominal gross output by each industry’s shipments deflator as
provided by the NBER database. We use the variation of the natural log of real
gross output (lagged by 1 year) to identify Contraction21
(e.g. negative growth
rate of RO). As we are mostly interested in the relationship between search
strategies and the downturn phases of the business cycle, we multiply
19 Note that we identify the joint occurrence of the components at year t and observe the
recombinations of these two components with other technologies in the knowledge space in the previous 5 years. See Chapter 1 and Appendix B for details on the derivation of the measure. 20 As an example, the patent "US6180351", assigned to Agilent Technologies Inc., has a high
degree of unconventionality in the knowledge recombination process. In 1999 (application year) this patent recombined two components, i.e. database maintenance principles [class 707/200] and
nucleic acid base hybridization processes [class 435/6 for molecular biology and microbiology],
that were previously used mostly independently. 21 In line with previous studies (de Rassenfosse & Guellec 2009; Hall et al.,1986; Kondo, 1999)
we use a one year lag of this variable. These studies have showed that R&D investments create
patent applications within a time lag of about a year and half. Results with two years lag are provided in Appendix B.

56
Contraction by (-1), higher value are associated with a deeper contraction in
Real Output.
Positive growth is output is captured by the variable Expansion. However,
firms may have different responses to a variation in the growth rate of RO
depending on the total level of output at which the variation occurs. Hence, we
also include in our empirical setting the natural log of real gross output lagged
by 1 year (RO).
3.3.3 The role of Financial constraints
Due to the inherent riskiness and uncertainty, innovations, in particular
novel inventions, are more difficult to finance through external sources of
capital than other types of investments (Amore et al., 2013; Hall & Lerner,
2010; Peia, 2016). These problems are exacerbated during downturns, when
profitability and availability of internal finance decrease and the financial
sector lends a lower share of their total asset (Himmelberg & Petersen, 1994).
Moreover, financially constrained firms will be more exposed to credit
shortage during downturns (Aghion et al., 2012). It follows that during
recessions retrenchment from original inventions is expected to be more
pronounced in firms which mostly depend on external capital. To understand
how the degree of unconventionality varies according to the dependence on
external finance, we use the Kaplan and Zingales Index (1997) that measure
firms' dependence on external financial capital. The Index is a linear
combinations of cash flow, market value, debt, dividends, cash holding and
assets.22
Firms with fewer availability of liquid assets, lower ratio of cash flow
and dividends to assets, higher ratio of debt to assets and Tobin's Q are
22The Kaplan and Zingales Index is defined as:
it0.283Q3.139LEVPPE
CHE1.315
PPE
Div39.368
PPE
CF1.002KZ it
1it
it
1it
it
1it
itit
where cash flow (CF) is the sum of Income before extraordinary items and depreciation and
amortization (Compustat IB+ DP items), dividends (Div) common and preferred (Compustat
DVC+DVP items), CHE refers to cash and short term investment. These variables are normalized
by lagged PPE. Leverage (LEV), is the ratio of long term debt (DLTT item) and debt in current liabilities (DLC item) to stockholders equity (SEQ item). Tobin's Q (Q) is the ratio of total asset
(AT), Market Value of Equity (CSHO*PRCC_F) minus the book value of equity (CEQ) and
deferred taxes (TXDB) to total assets. According to Kaplan and Zingales (1997), firms are financially constrained as the wedge between internal and external funds increases with increasing
cost in rising external sources of capital.

57
expected to be more financially constrained and hence have more difficulties
in financing their ongoing operations when economic conditions tighten. High
values of the Index flag firms that rely heavily on external sources of funds
and are characterized by high debt, low cash-flow and low dividends whereas
lower value are associated with more resilient firms. We use the median value
of the index to split the sample according to firms' reliance on external finance
(Table 3.2).
3.3.4 The Competences of the firm
The perceived risks and uncertainty related to distant search are not
uniform across the technological portfolio of firms (Brusoni et al., 2001).
Firms indeed mostly operate in the core of their technological competences,
being those technologies in which they dedicate a large amount of resources
and have secured a strong advantage. Conversely, non-core technologies are
associated with activities aimed at expanding the technological base of the firm
(Granstrand et al., 1997). Core technologies can support the ramification in
new technological domains by allowing a more efficient search for solutions
(Granstrand et al., 1997; Katila & Chen, 2009). Technologies in this set of
activities are frequently recombined and are usually linked to the upgrade of
existing products or to ongoing R&D projects. On the other hand, technologies
that are at the periphery of the firm's activities entail a deeper experimentation
process functional to the exploration of new technologies, knowledge and
ideas that lead over time to the development of new products or processes
(Gatignon et al., 2002). As the exploration phase requires time, these activities
are usually associated with more time to market.
To measure whether inventions belong to the core versus the peripheral
competences of the firm, we use the Revealed Technology Advantage (RTA)
index (Patel & Pavitt, 1997), calculated on the 36 technology categories
proposed by Hall et al. (2001). Patents are assigned to technological categories
using their primary patent class23
(Li et al., 2014). The RTA index has been
computed at the company level. It is given by the firm's share of patents in a
particular technology divided by the share of patents in that technology at the
23 USPTO assigns patents to "Original Class" or primary classes on the base of the broadest claim reported in the patent. This class best describe the inventive step of the patent and is generally
reported in bold font in the first position on the front page of a patent (USPTO, 2003).

58
USPTO level. We labeled as Core all those technology fields whose RTA is
above one and Non-core those with values less or equal to one. It turns out that
the distribution of patents is highly skewed with 88% of inventions in the core
technologies of firms (Table 3.3).
3.3.5 Control variables
We introduce a battery of controls concerning the invention (patents) and
the firms. On the invention side, we account for the extent to which the focal
patent builds on prior knowledge using backward citations (Citations). We
calculate the natural logarithm (plus 1) of the number of backward citations to
prior art. However, original recombination of components might be the result
of completely new combinations which are not based on pre-existing
knowledge (Ahuja & Lampert, 2001). Hence, we also account for the
possibility that inventions do not cite prior art (No Prior Citations). The
degree of novelty characterizing each invention is a positive function of the
number of knowledge components that are recombined. In our framework, the
Number of Technological Components are represented by (the natural log of)
the number of technological subclasses on which the patent is based. Drawing
on the organizational literature, we also include a set of controls for the
inventive process at the level of inventive teams. Since knowledge is
distributed among individuals, teams may facilitate the recombination of
competences and hence draw solutions from a more diversified pool (Singh &
Fleming, 2010). We capture the composition of teams by accounting for the
number of inventors in every patent, Team. We also control for the experience
of inventors by considering (the natural logarithm of) the total number of
patents of the most prolific inventor in the team, i.e. Experience. We also
include company characteristics that may influence the propensity to engage in
novel search strategies. Large firms have been found to be path dependent,
usually confined within their established routines and practices showing
resistance towards new or more radical solutions (Hill and Rothaermel, 2003).
Yet, they also build on a larger knowledge base from which they can easily
diversify their technological portfolio (Leten et al., 2007). Hence, we control
for the firm inventive size Assignee Size, computed as the (log plus one) of the
total number of patents at the USPTO in the year of the focal invention. The
concentration of firms' R&D portfolios may affect the knowledge
recombination process. Hence, we control for the technological Concentration

59
of firms over technological classes through the use of the Herfindahl index of
concentration. This measure will take the value of one for firms having a very
concentrated patent portfolio, whereas it will approach zero for technologically
diversified firms. We also identify patent whose assignee show a tendency to
cut in R&D during the contraction phases of the cycle. These firms may be
more sensitive to fluctuations in the industry and prone to engage in local
search (Cut in R&D). We finally add dummies for Year, Technologies and
Sectors to account for possible trends over time and differences among
technologies and sectors. Summary statistics of the variables are showed in
Table 3.1. Table 3.2 presents summary statistics for low versus high
financially constrained. Table 3.3 presents the correlation among the variables.
60
3.4 Results
In our empirical strategy we focus on the effect of business cycle on the type f
knowledge recombination undertaken by firms. The unit of analysis is
represent by the patent (Appendix B reports the firm level analyses that
provide a better understanding on the intensive and extensive margins).
Specifically, we distinguish between the growing and contractive phases of the
business cycle, controlling for invention, inventors and organizational
characteristics as well as years, technologies dummies and firm fixed effects
Table 3.4-( model 1). Demand driven factors play a significant role in the
timing and characteristics of innovations (Fabrizio & Tsolmon, 2014). During
downturns, demand decline. The main consequence is that firms could
perceive distant search as highly risky and uncertain relative to the expansion
phases of the cycle. Hence, firms become more sensitive to risks associated
with novel inventions which are likely to be postponed to the upturns of the
cycle (Yang et al., 2004; Steenkamp & Fang, 2011). As we cannot directly test
any effect due to changes in the behavior of consumers, in Table 3.5 we shed
light on the relationship between unconventionality and downturns by focusing
on the financial health of firms (model 2). In model 3 we show the estimations
for patent in the portfolio of firms having a tendency to cut during the
contractive phases of the cycle versus those that do not have this tendency. The
retrenchment from novel projects does not impact the entirety of technological
competences of firms. Firms develop specialized competences in core
activities where the exposure to risks is lower due to a robust and cumulated
knowledge base (Nickerson & Zenger, 2004). Along this line, we distinguish
between core and non-core inventions to highlight potential differences
between this set of firms' activities during the contractive and growing phases
of the cycle (model 4). In a second set of regressions we use the same models
to investigate how the technological impact of inventions is influenced by the
reorientation of firms’ search strategies along the business cycle (Table 3.6)

61
Table 3.1: Summary statistics
Description Variables Obs. Mean Std.
Dev.
Min Max
Higher values are associated to more atypical
combinations
Unconventionality 166,168 -3.543 0.619 -6.679 -1.316
RO t-1 Real Output 166,168 10.422 1.545 5.255 13.61
(R.O t - R.O t-1/ R.t t-1) > 0 Expansion 166,168 0.012 0.015 0 0.112
(R. O t - R. O t-1/ R.O t-1 ) < 0 Contraction 166,168 0.001 0.004 0 0.107
Ln(number of bwc.cits+1) Citations 166,168 2.418 0.896 0 7.064
No prior citations No Prior Citations 166,168 0.008 0.093 0 1
Ln of the number of technological subclasses
recombined
Components. 166,168 1.441 0.561 0.693 5.099
Number of inventors in the team Team 166,168 2.371 1.565 1 34
Ln (tot. number of patents of most prolific inventor in
a team)
Experience 166,168 15.965 29.05 1 485
1- Hirschman-Herfindah index Diversification 166,168 0.120 0.114 0.0138 1
Ln(tot. number of patents) by the firms Patent Portfolio Size 166,168 4.882 1.717 0 7.470
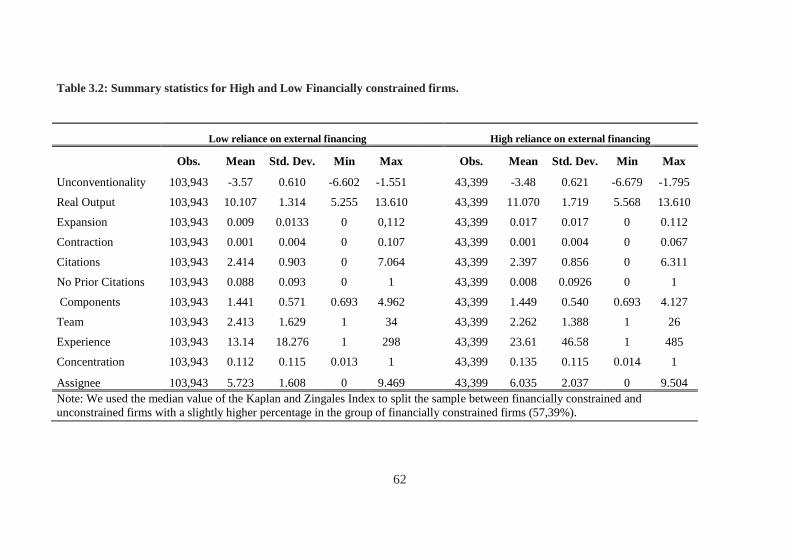
62
Table 3.2: Summary statistics for High and Low Financially constrained firms.
Low reliance on external financing High reliance on external financing
Obs. Mean Std. Dev. Min Max Obs. Mean Std. Dev. Min Max
Unconventionality 103,943 -3.57 0.610 -6.602 -1.551
43,399 -3.48 0.621 -6.679 -1.795
Real Output 103,943 10.107 1.314 5.255 13.610
43,399 11.070 1.719 5.568 13.610
Expansion 103,943 0.009 0.0133 0 0,112
43,399 0.017 0.017 0 0.112
Contraction 103,943 0.001 0.004 0 0.107
43,399 0.001 0.004 0 0.067
Citations 103,943 2.414 0.903 0 7.064
43,399 2.397 0.856 0 6.311
No Prior Citations 103,943 0.088 0.093 0 1
43,399 0.008 0.0926 0 1
Components 103,943 1.441 0.571 0.693 4.962
43,399 1.449 0.540 0.693 4.127
Team 103,943 2.413 1.629 1 34
43,399 2.262 1.388 1 26
Experience 103,943 13.14 18.276 1 298
43,399 23.61 46.58 1 485
Concentration 103,943 0.112 0.115 0.013 1
43,399 0.135 0.115 0.014 1
Assignee 103,943 5.723 1.608 0 9.469 43,399 6.035 2.037 0 9.504
Note: We used the median value of the Kaplan and Zingales Index to split the sample between financially constrained and
unconstrained firms with a slightly higher percentage in the group of financially constrained firms (57,39%).
63
3.4.1 Technological Search Over the Business Cycle
Table 3.5 shows the results of our main analysis of the effect of business
cycles on the type of inventions. In model 1 the coefficient of Real Output
suggest that a higher level of Output is associated with more unconventional
inventions in line with the pro-cyclical view (Fabrizio & Tsolomon, 2014).
The coefficient of Expansion suggests that a 1% increase in total Output
generates an increase in the level of unconventionality equal to 0.082%. The
coefficient of Contraction indicate that a 1% decrease in Output produces a
decline in the level of Unconventionality of 0.077%. A Chow test confirms
that these coefficients are statistically different from each other. These results
indicate that during contractive phases of the cycle, towards the trough, firms
retrench from more novel inventions, recombining components in a more
conventional way through the use of established combinations. Downturns
therefore are not only associated with a reduction in R&D expenditures, as
extensively discussed in literature, but also to a decrease in the degree of
unconventionality characterizing the search and recombination of knowledge
which result in less innovative outputs.24
It is relevant to note that
Unconventionality varies proportionally less in recessions. Hence, firms
response to a variation in the level of Output is not symmetric, a variation in
the output of the same magnitude generate different responses in downturns
and in upturns. The decline in unconventionality is proportionally lower during
contractions phases compare to the increase in unconventionality in
expansions.
The controls are in line with our expectations. Inventions based on a larger
number of components recombine elements in the technological space which
are more distant providing possibilities for more novel solutions. Finally,
inventions originating from larger teams are based on less novel technological
combinations. This result, surprisingly at first, can be explained by the fact that
larger teams have the advantage of recombining components from a broad set
of competences, but also require a common "language" before integrating very
distant domains.
24 In a separate regression, available in Appendix B (Table B.1), we investigated the evolution of
the number of patents.

64
In line with the pro-cyclical relationship between business cycle and
innovation, managers are more cautious with regards to risky investments,
such as original innovative projects, during the contractive periods of the
cycle. Firms may focus on problems which leverage on established knowledge
domains and require the exploitation of existing solutions; they are therefore
reluctant to pursue innovative projects based on the exploration of new
technological domains through distant search (Cyert & March, 1963; Troilo et
al., 2014). Two main factors play a role in the pro-cyclical relationship
between novel inventions and the business cycle. On the supply side, firms
experience a reduction of resources to allocate to innovation during downturns.
On the other side, firms facing lower availability of resources are more
concerned about efficiency than efficacy, favoring more conservative projects
(Himmelberg & Petersen, 1994).
3.4.2 Technological Search over the Business Cycle: the role of financial constraints and firms' competences
Model (2) in Table 3.5 reports the results for the two subsamples. The
coefficient for Contraction is significant only for firms with high dependence
on external finance. A 1% decrease in Output produce a decline of 0.08% for
firms that are financially constrained. The reaction of low financially
constrained firms to variations in the level of Output (expansion and
contraction) remain similar in magnitude. A Chow test confirm that the
response of low and financially constrained firms is statistically different.
This finding supports the view that the decrease in demand and profitability
occurring during downturns mostly affects the innovation strategies of
financially constrained firms, which are hindered from undertaking novel
inventive projects, characterized by higher risks and uncertainty. Financially
resilient firms instead do not change significantly their strategies during
downturns and are able to sustain similar levels of unconventionality in their
inventions. These results suggest that the availability of slack resources is
critical for the pursuit of novel projects based on the exploration of new
technological domains. Firms with higher slack resources are more likely to
engage in innovative activities characterized by distant search as organizations
are less concerned about immediate returns (Danneels, 2008; Levinthal &

65
March, 1981). Nohria and Gulati (1996) argue that slack resources allows
firms to pursuit innovative projects associated with higher levels of uncertainty
but also a potentially high pay-off. Financially constrained firms might also
have a harder time in retaining top scientists with a consequent decrease in the
innovativeness of firms patenting strategies (Hombert & Matray, 2016).
Model 3 differentiate between patents belonging to assignee that tend to cut
in R&D during the contractive phases of the cycle versus those firms that do
not show this tendency. The coefficient of Contraction is significant only for
firms that cut in R&D (a 1% decrease in Output produces a reduction in
unconventionality of 0.06%).
Model (4) in Table 3.5 shows that, during the contractive phases of the
cycle, firms cut back on novel inventions in the core of their technological
competences (-0.08%), whereas the retrenchment in non-core activities is not
significant. Also for this set of regression the Chow test confirm that the
coefficient for Core and Non-core are statistically different from each other.
During downturns firms select carefully their R&D projects to limit potential
risks, thus reducing their exposure. It follows that during downturns, when the
availability of resources decreases and firms become more sensitive to
expected returns, firms will selectively cut back on more uncertain projects
and reorient scarcer resources on projects characterized by more predictable
outcomes. As most of the patents belong to the core competences of the firms,
it is likely that firms will hold back innovative product in this set of activities.

66
Table 3.2 Correlation Table
1 2 3 4 5 6 7 8 9 10 11
1 Unconvention 1.0000
2 Real Output 0.1827* 1.0000
3 Expansion 0.1313* 0.4862* 1.0000
4 Contraction -0.0853* -0.2372* -0.2632* 1.0000
5 Citations 0.0410* -0.0197* 0.0078* -0.0237* 1.0000
6 no Bwd cits 0.0042 0.0052* -0.0142* -0.0091* -0.2547* 1.0000
7 Components 0.2155* 0.0323* 0.0092* -0.0370* 0.1204* 0.0052* 1.0000
8 Team 0.0323* -0.0204* -0.0424* -0.0375* 0.1544* 0.0067* 0.0926* 1.0000
9 Experience 0.0802* 0.2151* 0.1082* -0.0590* 0.1046* 0.0120* 0.1110* 0.1526* 1.0000
10 Concentration 0.0263* -0.0778* 0.0406* -0.0583* 0.1842* 0.0073* 0.0356* 0.0692* 0.1276* 1.0000
11 Assigne 0.1024* 0.4312* 0.1747* -0.1054* -0.0658* -0.1139* 0.0314* 0.0326* 0.1856* -0.4452* 1.0000

67
Table 3.4: Estimations for technological search over the business cycle. OLS models for the degree of Unconventionality.
All Low KZ High KZ Cut R&D Non Cut R&D Core Non Core
Model 1 Model 2 Model 3 Model 4
Real Output 0.0899*** 0.0895*** 0.0829*** 0.0752*** 0.0795*** 0.0938*** 0.0490***
(0.0032) (0.0043) (0.0076) (0.0056) (0.0044) (0.0034) (0.0098)
Expansion -0.7923*** -0.9712*** -0.5963* -1.0775*** -0.8543*** -0.8678*** -0.2935 (0.1522) (0.2211) (0.3267) (0.2678) (0.1957) (0.1607) (0.4741)
Contraction 1.2091*** 1.1576** 1.1004 1.3258*** -0.6826 1.1630*** 1.1204
(0.3869) (0.5154) (0.9574) (0.4443) (0.8881) (0.4098) (1.1709) Citations -0.0103*** -0.0093*** -0.0110*** 0.0031 -0.0196*** -0.0121*** -0.0005
(0.0018) (0.0023) (0.0037) (0.0028) (0.0024) (0.0019) (0.0057)
No Bwd Cits -0.0179 -0.0100 0.0215 -0.0072 -0.0314 -0.0236 0.0095 (0.0164) (0.0203) (0.0353) (0.0257) (0.0212) (0.0173) (0.0504)
Components 0.2182*** 0.2170*** 0.2343*** 0.2072*** 0.2258*** 0.2121*** 0.2482***
(0.0027) (0.0034) (0.0056) (0.0041) (0.0037) (0.0029) (0.0081) Team -0.0030*** -0.0032*** 0.0002 0.0036** -0.0084*** -0.0042*** 0.0056*
(0.0010) (0.0012) (0.0020) (0.0015) (0.0013) (0.0010) (0.0031)
Experience -0.0000 -0.0004*** 0.0001* -0.0001 0.0001* 0.0000 0.0002 (0.0001) (0.0001) (0.0001) (0.0001) (0.0001) (0.0001) (0.0002)
Concentration -0.1711*** -0.2080*** 0.1176 -0.0434 -0.2507*** -0.1647*** -0.2267
(0.0358) (0.0497) (0.0779) (0.0569) (0.0474) (0.0362) (0.2348) Assignee 0.0002 0.0057* 0.0051 0.0053 -0.0049 -0.0005 0.0033
(0.0023) (0.0030) (0.0047) (0.0035) (0.0031) (0.0024) (0.0067)
Constant -4.9184*** -4.8989*** -5.2361*** -4.0849*** -4.7838*** -4.9274*** -5.7305***
(0.0896) (0.0959) (0.5705) (0.5642) (0.1037) (0.0901) (0.6127)
N 166168 103943 43399 77432 88736 146559 19609
R2 0.1730 0.1575 0.2251 0.1700 0.1586 0.1790 0.1659
Standard errors in parentheses* p < 0.1, ** p < 0.05, *** p < 0.01
The models report the results of the Ordinary Least Square on the median value of the degree of novelty in patents. Models include 20 year, 36 technology and sector dummies. Models also include controls (dummies) for missing information about backward citations. All models include firm fixed effects.

68
3.4.3 Technological Search over the Business Cycle: Technological Impact
The analysis so far has highlighted a reduction in the level of technological
novelty during downturns, especially for financially constrained firms and in
core research activities. The implications for firm performance however
remain unclear and may depend on the ability of firms to choose effectively
the projects to pursue during downturns. Due to reduced availability of
resources, firms may be more efficient in the selection of innovative projects,
reducing their involvement in riskier projects and focusing on inventions with
more certain outcome (Almeida et al., 2013). However, novelty, and the
uncertainty underlying it, is usually associated to inventions with both higher
failure rates and higher impact. Therefore one should expect firms, especially
those with limited access to financial resources, to be more selective in the
pursuit of novel projects and therefore generate novel inventions with higher
impact during downturn, due to the discontinuation of more uncertain projects.
In this section we analyze the relationship between the business cycle and
the technological impact of the inventions as measured by forward citations25
(Trajtenberg, 1990). If firms are more efficient in the selection of projects, we
should expect novel inventions generated during negative variations of output
to receive more forward citations, as unproductive projects are discontinued or
postponed. Moreover, this premium should be higher for novel inventions
from financially constrained firms.
The models in Table 3.6 show that the coefficient for the degree of
unconventionality is not significant in model (1). This result is possibly due to
the lower level of unconventionality, and consequent impact, of inventions
during downturns. Model 1 shows that expansion phases, namely positive
variation of the output, are associated with higher number of forward citations.
In model (2) we split the sample according to the dependence on external
financial capital. The results indicate that the decision to discontinue novel
projects is not associated with the availability of financial resources in
contractive phases while an increase in the number of forward citations is
25 In this section we rely on the same regression models to investigate the effect of search strategies
on the (natural logarithm plus one of the) number of the forward citations received by patents.

69
observed for low and high financially constrained firms inventing in
innovation during pro-cyclical phases.
The coefficient of the degree of unconventionality in inventions is negative
in non-core activities while it is positively associated with forward citations in
non-core technologies (model 4). This finding is consistent with the view that
unconventionality in non-core areas is potentially associated with more
explorative inventive approaches, providing the basis for the development of
future inventions. Indeed, these inventions receive a higher number of forward
citations, indicative of a higher technological importance and economic
significance. Model 4 also shows that positive variation of the output are
associated with higher forward citations in the core and non-core activities
whereas negative variations in output are associated with lower forward
citations in non-core activities only.
Overall the results suggest that inventions characterized by higher level of
unconventionality developed in non-core areas have a higher impact. Firms are
however risk averse showing sensitivity in the contractive phases by cutting on
unconventional inventions characterized by higher risk and an unpredictable
outcome.
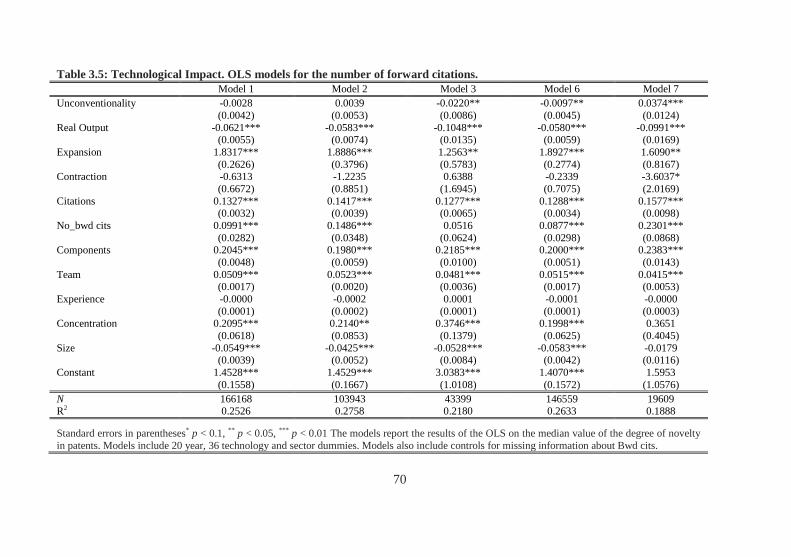
70
Table 3.5: Technological Impact. OLS models for the number of forward citations.
Model 1 Model 2 Model 3 Model 6 Model 7
Unconventionality -0.0028 0.0039 -0.0220** -0.0097** 0.0374***
(0.0042) (0.0053) (0.0086) (0.0045) (0.0124)
Real Output -0.0621*** -0.0583*** -0.1048*** -0.0580*** -0.0991*** (0.0055) (0.0074) (0.0135) (0.0059) (0.0169)
Expansion 1.8317*** 1.8886*** 1.2563** 1.8927*** 1.6090**
(0.2626) (0.3796) (0.5783) (0.2774) (0.8167) Contraction -0.6313 -1.2235 0.6388 -0.2339 -3.6037*
(0.6672) (0.8851) (1.6945) (0.7075) (2.0169)
Citations 0.1327*** 0.1417*** 0.1277*** 0.1288*** 0.1577*** (0.0032) (0.0039) (0.0065) (0.0034) (0.0098)
No_bwd cits 0.0991*** 0.1486*** 0.0516 0.0877*** 0.2301***
(0.0282) (0.0348) (0.0624) (0.0298) (0.0868) Components 0.2045*** 0.1980*** 0.2185*** 0.2000*** 0.2383***
(0.0048) (0.0059) (0.0100) (0.0051) (0.0143)
Team 0.0509*** 0.0523*** 0.0481*** 0.0515*** 0.0415*** (0.0017) (0.0020) (0.0036) (0.0017) (0.0053)
Experience -0.0000 -0.0002 0.0001 -0.0001 -0.0000
(0.0001) (0.0002) (0.0001) (0.0001) (0.0003) Concentration 0.2095*** 0.2140** 0.3746*** 0.1998*** 0.3651
(0.0618) (0.0853) (0.1379) (0.0625) (0.4045)
Size -0.0549*** -0.0425*** -0.0528*** -0.0583*** -0.0179 (0.0039) (0.0052) (0.0084) (0.0042) (0.0116)
Constant 1.4528*** 1.4529*** 3.0383*** 1.4070*** 1.5953
(0.1558) (0.1667) (1.0108) (0.1572) (1.0576)
N 166168 103943 43399 146559 19609 R2 0.2526 0.2758 0.2180 0.2633 0.1888
Standard errors in parentheses* p < 0.1, ** p < 0.05, *** p < 0.01 The models report the results of the OLS on the median value of the degree of novelty
in patents. Models include 20 year, 36 technology and sector dummies. Models also include controls for missing information about Bwd cits.

71
3.5 Discussion and Concluding Remarks
Innovation dynamics tend to be pro-cyclical, with a sizeable contraction of
R&D investments during downturns. This pattern has serious implications for
long term R&D efforts and growth. This study contributes to the debate on
pro-cyclical versus counter-cyclical innovation by showing a re-composition
of patent portfolios during downturns toward less novel inventions, especially
as far as financially constrained firms are concerned. Reduced profitability
form ongoing projects, lower availability of external funding and higher level
of uncertainty affect firms' decisions with regards to R&D investments and
innovation search strategies at large. Our results are consistent with empirical
evidence showing that in the contractive phases of the cycle, firms tend to be
more risk averse. They have higher preferences towards inventions that build
on more established knowledge bases that are expected to provide close in
time returns.
From a theoretical standpoint, our results provide interesting insight in the
debate on the relationship between innovation and business cycle. We found
that the negative phases of the business cycle are associated with lower degree
of unconventionality. This implies that during economic downturns, the
recombination process is characterized by local search as knowledge
components are recombined among familiar and less riskier technological
domains. This especially occurs in financially constrained firms and core
technologies. This finding is linked to the vast economic literature describing
the effects of financial constraints on the ability of firms to undertake more
novel inventive processes when environmental conditions are most
challenging.
From the managerial point of view, the results of this study advocate the
design of proper strategies that sustain adequate level of innovation during
contractive phases. Deep pocket firms should be aware of the risk of canceling
or postponing projects with higher uncertainty during recession phases as
competition from competing technologies may decrease.
From a policy perspective, our results inform that the contractive phases of
the cycle not only limit the amount of R&D investments in innovation but,
more importantly, change investments decisions, with a higher preferences

72
towards more conservative and less impactful innovation projects. This finding
may inspire future research on the design of policies that are not limited to the
economic support to R&D through tax incentives and credit packages but are
also able to drive firms' incentives towards more explorative innovation that
have higher social returns. Research in this direction should also focus on a
better understanding the extent to which firms reshape their patent portfolio in
a more efficient way by cutting less valuable project and carry on most
promising and eventually novel ones. This would be in turn a very interesting
aspect to consider in the design of innovation policies.
This study is not without limitations. As recognized in the literature,
patents data have the major drawback of capturing only successful inventions.
Besides, they don't have a uniform value and not all sectors are equally patents
intensive (Cohen et al., 2000). Yet, patents data reveal major and important
innovations patterns. Moreover, patent classification system is rather stable
over time and regularly updated making it a reliable source for the
computation of the level of unconventionality in the recombination of
knowledge. In this analysis we consider only the primary patent class which
make difficult to clearly differentiate between core and non -core activities of
the firms. In our analysis we try to identify the heterogeneity of firms reactions
to variation in the level of output by considering the role of financial
constraints. However, other sources of heterogeneity can play a role in shaping
the relationship between type of innovation and business cycle. Future research
will further extend the richness of the dataset by including and differentiating
between single and multi-business firms using Compustat segment-level data.
The rational is that multi-business firms are likely to be less exposed to
negative shocks. The scope of future research is to provide further insights on
how recombination process are reshaped along the business cycle. Hence, it is
interesting to consider potential premium associated with better performances
(i.e. sales) in the aftermath of downturn for firms that are able to sustain
adequate levels of technological innovation.
In this analysis we tackle the role of market concentration on the level of
patent unconventionality. Future research may emphasize further this aspect
driven by the rational that during expansion competition may increase
innovation because firms have incentives to increase their technological lead
over rivals (Aghion et al., 1998). However, a decrease in competition during
73
the contractive phases may translate in a decline of patent race pushing more
resilient firms to invest in unconventional innovations.
The impact of economic recessions on innovation is not homogeneous
among industries. In complex industries as in the information technologies,
economic crises may serve as an opportunity to reallocate resources to new
projects and to build a forthcoming market demand for more radical products.
Thus future research may explore the relation between search process and
business cycle in different industries.
Although its limitations, this study contributes to a stream of research
aiming at advancing the understanding of the search process along the business
cycle, a topic that have important implications for economic recovery and
growth.

74

75
Chapter 4
Sowing Failures, Reaping Success? Evidence from Pharmaceutical R&D Projects
4.1 Introduction
In November 2016 Eli Lilly announced that its potential blockbuster drug
against Alzheimer's disease, Solanuzemab (Sola), expected to generate about
$1.6bn in sales by 2020, failed once again the Phase III clinical trial. After two
previous failed attempts in 2012, Eli Lilly decided to retest the drug targeting
2100 patients with mild Alzheimer. Although the drug performed slightly
better than individuals taking a placebo, the improvement was too small to be
considered as statistically significant26
(Chen et al., 2016). The announcement
of the failure caused a sudden drop by 10.5% in Eli Lilly’s stock price and a
fall by 5% in the stock price of Biogen, which is developing a rival drug,
Aducanumab27
. Eli Lilly has been working on a drug for Alzheimer's disease
for 15 years, spending about $3bn in the past three decades on experimentation
and drug development.
Sola is only one of the many examples of drugs that have repeatedly failed
in late clinical trials reflecting the intrinsic experimental nature inherent to
drug development processes characterized by soaring costs and uncertain
26 https://investor.lilly.com/releasedetail.cfm?ReleaseID=1000871 27 https://www.ft.com/content/ec01d882-b618-11e6-ba85-95d1533d9a62
76
outcomes28
. The estimated average pre-tax industry cost per new drug approval
(inclusive of failures and capital costs) amount to over USD 2.5 billion per
marketed drug (Di Masi et al., 2016). Therefore, the pharmaceutical industry
represents one of the key examples of an innovation context marked by
uncertainty, high failure rates, repeated trials, and long development
trajectories. Drug development is an innovation process where organizations
built on cumulative knowledge and experience (Scotchmer, 2004). These
conditions induce pharmaceutical firms to specialize in certain domains to
exploit specialized knowledge cumulated over time and the existing
competences developed from previous trials conducted in-house and by others
firms (Cyert & March, 1963; Simon, 1978, Herriot et al., 1985).
As widely described in the literature, organizations can use their previous
experience to identify potential inefficiencies and effective practices, and
adjust them in follow up R&D projects (Haunschild & Sullivan, 2002). The
organizational learning literature has stressed the important role of learning
from positive and negative experience as one of the mechanisms that can
improve firms’ subsequent innovation process, and at the same time generate
knowledge spillovers to other firms operating in related technological areas
(Teerlak & Gong, 2008; Francis & Zheng, 2010; Levinthal & March, 1993). It
has been advocated that firms can learn from failures in a process of trial and
error (Tucker & Edmondson, 2003; Chesbrough, 2010) and be guided by the
motto "Fail often in order to succeed sooner"29
. Prior studies have emphasized
the experimental nature of learning by analyzing the role of catastrophic
failures such as in the case of the design and organization of the value chain of
the Airbus A380 (Dörfler & Baumann, 2014) and the orbital launch of
Columbia in 2003 (Madsen & Desai, 2010).
Studies in this stream of research have focused on the role of experience
from failure on performances enhancements (Ingram & Baum, 1997;
Haunschild & Miner, 1997; Baum & Dahlin, 2007) disregarding, with only
few exceptions, mechanisms of learning from successful experience (Hoetker
& Agarwal, 2007; Magazzini et al., 2012). Since organizations have a
28 For a more comprehensive example see the report from the FDA "22 case studies where phase 2
and phase 3 trials had divergent results", retrieved from "file:///C:/Users/Daniela/Downloads/1%204%2016%20final%20final%20(1).pdf 29 This statement is from Tom Kelley, general manager of IDEO.

77
tendency to de-emphasize negative outcomes and to highlight positive results
(Levinthal & March, 1993; Denrell, 2003), there are arguments to suggest that
learning from success may be more salient than learning from failures.
Existing studies have however not systematically compared the extent to
which firms learn from prior failures and successes.
This paper contributes to the literature by investigating to what extent
pharmaceutical firms learn from prior failures and successes in their
subsequent drug development efforts through either in-house experiential
learning or through vicarious learning (learning from the experience of other
firms). Relevant experience in related prior drug development efforts is
identified by considering prior drug development projects of which the
underlying patent is cited by the patent that is exploited in the current focal
drug development project. This study examines whether (i) learning from
successes is more decisive than learning from failures; ii) experiential learning
is more important than vicarious learning. Unlike previous studies adopting
aggregated measures of experience at the organizational level (Kim et al.,
2007; Ingram & Baum, 1997; Darr et al., 1995), we leverage a comprehensive
and detailed micro-level dataset on drug development projects to examine the
relationship between the probability that a drug development is successful and
prior relevant experience in drug development efforts.
Results show that projects that build on firms’ previous successful efforts
have a higher likelihood to generate marketable drugs, while building on prior
failures reduces this likelihood. A similar pattern, though much weaker in
magnitude, is observed for drug development projects building on prior related
projects of other firms. The findings of this study show that contrary to
common wisdom, previous failures increase the incidence of failures. This
pattern may be related to the higher potential market value of risky projects.
Projects targeted to certain disease like Alzheimer face less competition due to
the lack of existing drugs in the markets for the cure of this disease. At the
same time, they represent fruitful opportunities of investments given the higher
associated rewards. As a consequence, firms may be willing to accept higher
failure rates linked to the experimentations in this high risk markets. In turn the
experimentation in this type of markets also requires a deeper search efforts in
order to understand the cause-effects linkages related to the cure of the disease.
The results also point out a certain degree of organizational inertia as firms

78
continue familiar research trajectories. In addition to informing the literature
on organizational learning and innovation, our study facilitates a more nuanced
view on the learning mechanisms playing a role in the pharmaceutical sector.
The remainder of this paper is organized as follows. The next section
presents the relevant literature on organizational learning theory and develops
our two main research questions. In Section 3 we describe the data and report
descriptive statistics. Section 4 presents the empirical results. The final section
discusses the results and the potential implications.
4.2 Theory and Research Questions
4.2.1 Organizational Learning
Organizations learn through a dynamic process where information and
knowledge are acquired, generated, interpreted, stored and retrieved (Huber,
1991; Senge, 1990). A key insight of organizational learning theory is that
organizations adapt their knowledge base in response to lessons drawn from
past experience and cumulated knowledge (Cyert & March, 1963; Huber,
1991; Levitt & March, 1988). Depending on the extent of adaptation, the
learning process may generate minor adjustments and refinements of existing
routines through exploitation of previous knowledge or rather significant
changes of existing practices through exploration of alternatives approaches
(March, 1991). Changes in organizational knowledge is typically observable
by improvement in future performances (Argote, 1999; Baum & Ingram.,
1998). Hence, organizations' ability to learn and adapt has been recognized as
an important source of competitive advantage (Senge, 1990; Redding &
Catalenello, 1994) in particular when knowledge generated through learning is
difficult to imitate quickly (Baumard & Starbuck, 2005).
The learning process is usually triggered by feedback received from the
environment and performance below aspirations that calls for adaptation of
strategies, and search for improved solutions (Cyert & March, 1992; Nelson &
Winter, 1982; Levitt & March, 1988; Simon, 1978; Stalk et al., 1992).
Through performance feedback, organizations set benchmarks or reference
points to reinforce actions and decisions that generated a positive outcome
79
while questioning those that lead to negative results (Levitt & March, 1988;
Cyert & March, 1992).
Theorists from the behavioral theory of the firm define aspirations as the
lowest level of performance acceptable by organizational decision makers
(Greve, 2003). The decision process is thus driven by aspirations which are
used to appraise organizational performance into successful or negative
outcomes (Cyert & March, 1963). Organizational learning literature has
typically considered learning from prior aggregated organizational experiences
(Argote & Epple, 1990; Darr et al., 1995) whereas other studies looking at
more disaggregated dimensions have mostly analyzed responses to failed
experiences (Desai, 2015; Haunschild & Sullivan, 2002). However, as
suggested by the behavioral theory of the firm, organizations may respond
differently to failed and successful experiences calling for a comparison
between learning from success and failures.
4.2.2 Learning from Failures and Success
Although the important role of experience has been acknowledged in
organizational theory (Cyert & March, 1963; Levinthal & March, 1993), the
bulk of studies have typically focused on the role of failed experience on
subsequent performances by looking at knowledge generated by accidents
(Madsen & Desai, 2010; Desai, 2015; Haunschild & Sullivan, 2002; Desai
2016; Dörfler & Bauman, 2014), errors (Ramanujam & Goodman, 2003),
product recalls (Haunschild & Rhee, 2004; Rhee & Haunschild, 2001),
strategy failures (Chuang & Baum, 2003). This stream of literature has
acknowledged the importance of investigating failures to understand the root
causes, identify potential inefficiencies and design proper procedures in
subsequent trials. Researchers in this stream of research advocate that negative
catastrophic experiences stimulate "problemistic searches" for new solutions
leading to a significant change of the status quo, away from the comfort zone
of what the firm has already tried (Maslach, 2016; Cyert & March, 1963; Lant,
1992; March & Shapira, 1992).
Cyert and March (1963) suggest that organizations have stronger incentives
to change their actions in reaction to failures through behavioral innovation.

80
Organizational learning in response to failure is characterized by a sense of
urgency, especially for large failures, that is likely to trigger the search and
adoption of new knowledge (Cameron, 1984; March, 1981). By questioning
the practices and strategies that lead to negative outcomes, failures are
expected to stimulate a search towards routes that wouldn't have been taken
otherwise. Baum and Dahlin (2007) suggest that organizations performing far
from their aspiration levels engage in more distant search following failure
experience relative to those that meet the desired aspirations. Greve 2003
demonstrates empirically that performance below aspiration not only makes
decision makers search for solutions, it also makes them more likely to try
inherently risky solutions.
Following this logic, organizations should tolerate some degree of failure
in order to gain valuable new knowledge and discover new learning
opportunities for their innovation strategies (Leonard-Barton, 1995;
Edmondson, 2011). A number of studies have provided initial indirect
evidence of the learning effects from failures. Magazzini et al., (2012)
examined the value of patents resulting from pharmaceutical R&D projects
and found that patents from both successful and failed R&D projects generate
a higher number of forward patent citations than those from projects not
entering clinical trials. Khanna et al. (2016) is an exception in examining how
‘small’ failures, proxied by voluntary patent expiration, affect the amount and
quality of firms R&D output. They find that small failures are associated with
a decrease in patent applications but with an increase in their quality measured
by forward citations.
The above arguments contrast with the theoretical argumentation that
learning from failures is not an automatic process, as organizations are usually
reluctant to openly share and divulge their own mistakes (Husted &
Michailova 2002; Cannon & Edmonson, 2001). Thus, organizational learning
is considered as myopic since firms often tend to overlook failures and
overemphasize knowledge generated by previous successes (Levinthal &
March, 1993). This is largely due to cognitive limitations and to a different
approach to learning from failures and success. Miller and Ross, (1975)
asserted, for instance, that individuals are much more likely to ascribe success
to personal capability and failure to luck, than they are to attribute success to
luck and failures to a deficit in ability. Similarly, Edmonson (2011, 2005)

81
suggested that individuals deal with mistakes by looking for explanations that
support their existing beliefs, detaching themselves from the real causes of
failures.
Among studies stressing the importance of learning from failures, a number
have argued that organizations may fail to learn from failed experience by
generating incorrect lessons (Baumard & Starbuck, 2005; Staw et al., 1981).
For instance, Eli Lilly was ready to discard is chemotherapy drug Alimta after
failure in clinical trials. Only after a deeper investigation it was found out that
the failure was due to a deficiency in folic acid in patients used in the trials. By
simply associating folic acid with Alimta the problem was solved (Edmonson,
2005). In this regard, Edmonson (2005) emphasizes the importance of identify,
analyze and experiment failures. Other studies have instead identified
organizational and psychological barriers that hinder learning from failures
(Cannon & Edmonson, 2001; 2005). On the flip side of learning from failures,
Levinthal and March (1993) highlight that although firms can benefit from
failures through explorative search, they have to be careful not to end up in a
continuous cycle where failures result in more failures. Firms that respond to
failure by constantly searching for new technology, develop limited knowledge
on a domain which can lead to an increase in the risk of future failures. This
cycle of failures can also be generated by the fact that compared to previous
success, failures are the evidence of what is not properly working out of many
possibilities without necessarily narrowing down avenues for future
development on right trajectories.
Relatively few studies have examined whether firms benefit from
knowledge generated by previous successes (Madsen & Desai., 2010;
Magazzini et al., 2012; Hoetker & Agarwal., 2007). Successful outcomes
represent the proof that previous decisions and practices worked well (D'Este
et al., 2014) and that search for alternative solutions or development of further
knowledge is unnecessary to reach the desired aspiration level (Lant, 1992;
March & Shapira, 1992). Building on previous success trigger decision makers
to search locally in the proximity of their existing knowledge leading to a
refinement of previous assumptions and actions (Maslach, 2016). This strategy
allow firms to economize on scarce resources and search cost while at the
same time reducing uncertainty on the decision making process as the cause-
effects linkages are well known and became established in organizational

82
practices (Cyert & March, 1963; Shaver et al., 1997; Gimeno et al. 2005).
However, learning from repeated success can also have a flip side as it
increases self confidence that the expected aspiration levels will be reached.
Based on cognitive limitations, organizations tend to attribute success to the
quality of their decisions, actions and managerial capabilities, ignoring other
circumstances and external factors that may have influenced the outcome
(Miller & Ross, 1975). This may lead to the underestimation of risks and
limited opportunities to adapt to technological changes and to respond to
unexpected results (Levinthal & March, 1993). Hence, drawing solutions only
from past success may trap firms into organizational rigidity and inertia. This
may actually increase the likelihood of future failures, since the opportunities
to adapt and look for alternative approaches are limited by the
institutionalization of existing routines (Baumard & Starbuck, 2005; Madsen
& Desai, 2010).
Although organizational theory has drawn attention to the opportunities
and caveats of learning from failures and success, the actual ability of
organizations to capitalize on knowledge from positive and negative outcomes
remains empirically underexplored (Magazzini et al., 2012; Baumard &
Starbuck, 2005; Staw et al., 1981). Moreover, extant literature has rarely
focused on a direct comparison of organizational learning from success and
failure, with a few exceptions.
Haunshild and Sullivan (2002) focused on accident rates of U.S. airlines
proxy organizational experience in the field by the time the firms was
operating in the sector. They find that established firms were less likely to
experience accidents than younger firms but without a clear distinction on the
effects of previous success and failures. Haunschild and Rhee (2004) analyzed
automobile recalls on the likelihood of future recalls. They found that
experience on prior automobile production decreases the rate of future recalls
suggesting learning.
Madsen and Desai (2010) instead provided a direct comparison of learning
from failures and success by analyzing the orbit launch accident in 2003. They
found that launch vehicle companies learn more effectively from failure
experience than from success in line with the argument that failures intensify
search activities in urgency circumstances (Wildavsky, 1998).

83
This study augments understanding on the role of learning from success
and failure in previous drug development projects in the pharmaceutical
industry, for which both failures and success are intrinsic components. In this
context successes are rare but have an important impact on firms
performances, while failures occur frequently leading to serious losses of
capital due to the large investments required for experimentation. This pushes
firms to learn from their previous mistakes and from the knowledge that is
generated from previous successful experimentation.
A first focal question for research hence is whether pharmaceutical firms
have a higher propensity to learn from success than from failure in their drug
development efforts (RQ1).
4.2.3 Vicarious Learning
Organizational learning theory advocates that organizations learn and develop
knowledge not only through their direct experience - experiential learning - but
also through the observation of the experience of other organizations -
vicarious learning - by imitating or avoiding specific practices or strategies
(Baum & Dahlin, 2007; Cyert & March, 1963; Greve, 1998; Levitt & March,
1988; Ancona & Bresman, 2007; Hatinschild & Miner, 1997; Huber, 1991;
Levitt & March, 1988; Madsen & Desai, 2010; Miner et al., 2008; Meyer &
Scott, 1983). Inferential learning occur by selectively copy others firms in a
mimetic way (Katila & Chen, 2008) or for example by observing R&D
activities of competitors, interpreting and copying other's firm search (Katila,
2002). Observing other firms' search can also work as a signal of opportunities
(Katila & Chen, 2008).
While direct experience with a certain task generates deep and tacit
knowledge that may improve future performances in subsequent trials (Argote
et al., 1990; Argote, 1996; Pisano & Bolmer, 2001), this is expected to be less
so when firms learn vicariously by imitating successful experience and best
practices of other firms (Conell & Cohn, 1995; Haunschild & Miner, 1997) or
by analyzing failures of other firms (Baum et al., 2000; Beckman &
Haunschild, 2002; Kim, 2000; Miner et al., 1999). In the case of vicarious
learning firms do not obtain the same level of detailed information and

84
firsthand experience as with direct experiential learning. Since firms lack
direct access to other firms’ knowledge repositories, other firms’ actions
influence firm strategy by changing expectations about current and future
outcomes (Strang & Macy, 2001). The literature on vicarious learning through
inference has debated the limits of this mechanism, as it can lead firms ns to
adapt their practices or to take decisions on the basis of expectations rather
than more objective facts (Abrahamson & Fairchild, 1999). On the other hand,
vicarious learning may still be beneficial as firms can integrate new valuable
knowledge in their practices in high uncertainty environments when
experiential knowledge alone is not sufficient to interpret the current state of
the world (Beckman & Haunschild, 2002). The integration of new knowledge
can be facilitated when the other firms work in a common domain, sharing
comparable knowledge bases, organizational forms and routines (Hannan &
Carroll, 1992; Miner et al., 1999).
Research focusing on vicarious learning from other firms' failures have
empirically shown that failures decrease as the number of prior failures
experienced by similar firms increases (Baum & Dahlin, 2007; Chuang &
Baum, 2003; Haunschild & Sullivan, 2002; Ingram & Baum, 1997; Kim &
Miner, 2007). Failures have a signaling role, indicating promising and less
promising trajectories of experimentation under uncertainty (Hoetker &
Agarwal, 2007). In this regard, Krieger (2016) examines how
biopharmaceutical firms react to news about competitors' failures in clinical
trial and showed that firms react to failures from related projects in the same
market (disease indications) and technology (inhibitor or antagonist
approaches) by doubling their propensity to terminate their projects. Failure in
different markets but in the same technology also increase significantly the exit
rate, whereas failures in the same market but in different technologies does not
affect projects survival rates.
Although failures by other firms can provide salient information about
efficacy of the compounds, firsthand experience in the pharmaceutical industry
may still play a prominent role as firms can leverage tacit knowledge from
their explorative research on the compound and their experimental experience.

85
A second focal question for research is then to examine whether
pharmaceutical firms learn more from their own drug development experience
than from other firms' experience (RQ2).
4.3 Data
4.3.1 Research Setting: Innovation in the Pharmaceuthical Industry
The drug development process is structured as a chain of well-defined phases
in which the firm leading the project need to achieve precise milestones
reporting the results of the study to the FDA and to the Center for Drug
Evaluation (CDER) in the US (see Figure 1). The development of a new drug
relies heavily on basic research usually conducted during the discovery phase.
This phase includes the screening of potential compounds that are biological
active for the medical treatment of a disease. The next step is the preclinical
phase aimed at collecting information on dosing and toxicity level by testing
the compounds on living animals. In case the test show lack of toxicity, the
firm file an Application for the Investigation of New Drug (IND) to the FDA

86
Figure 1: Drug development Process with Example. Data are extracted from several sources: DiMasi et al., 2003; Campbell 2005;
AlfForum, Abrantes et al., 2004; Mestre et al., 2012.

87
and proceed further to the Clinical trials for human tests. Clinical trials are
organized into three main phases with different requirements and costs. In
Phase I the drug is administered to a restricted number of healthy volunteers to
identify potential toxicity issues in humans. If the drug doesn’t show any major
side effect it is administered to a larger number of volunteers with the specific
disease object of the study, Phase II. This phase determines drug effectiveness
and stability as well as the appropriate dosage. During Phase III the drug is
administered to a larger sample of patients that are monitored over time to
determine the drug effectiveness on a larger scale and potential side effects
that didn't arise in previous phases. A New Drug Application (NDA) is filed if
all phases are successfully completed to provide scientific reports on the drug
effectiveness and safety in contrasting the diseases compared to pre-existing
drugs. In case of approval, the drug is made available for prescription to
patients and goes into pre-registration and registration phases until it is finally
marketed. However, even after the drug is launched, the company is still
responsible to report any potential side effect raised after the approval in order
to withdrawn from the market possible toxic drugs30
.
The pharmaceutical industry is characterized by high technological
uncertainty, extensive costs and risks. Typically, only 22% of compounds that
are tested in clinical trials conclude with a successful market launch (DiMasi et
al., 2003). In absolute number, for every 250 compounds that enter pre-clinical
testing, 5 advance to clinical testing and only 1 is eventually approved by the
Food and Drug Administration (FDA) (Campbell, 2005). Uncertainty in the
drug development is also related to the length of the project that takes on
average 12 years from the research lab to the market (EFPIA, 2014) with
possible failures occurring also in later stages of development.
Researchers have showed that between 2007 and 2010 on a sample of 83
projects in Phase III, almost 90% of the failures across all therapeutic areas
were attributed to safety reasons (21%), or to a lack of efficacy (66%) in
demonstrating a statistically significant improvement versus placebo
(Arrowsmith, 2011). Similar trends are found in a more recent contribution by
Harrison (2016) who document that in the period 2013-2013, there were 218
30 Some well-knon cases of market withdrawal are the Fen-Pen recalled in 1997 after 24 years in the market; Cerivastatin by Bayer, recalled in 2001 after causing 10000 deaths; Rofecoxib by
Merk in 2004 or Valdecoxib by Pfizer in 2005.

88
failures in Phase I/II. Of these, 52% of drugs fail due to a lack of efficacy
while 24% of failures are due to lack of safety. The majority of failures occur
for the medical treatment of complex pathology especially cancer and neuro-
degeneration (DiMasi, 2003; Julia, 2013). During the drug development
process, pharmaceutical firms sustain extensive investments that have rapidly
surged over time from 231 million of US $ in 1987 to over US $ 800 million in
2000 (DiMasi et al., 2003; Adams & van Brantner, 2006). The highest share of
R&D is concentrated in Phase III with about 32.1% of investments (EFPIA,
2014) making failures at this stage very costly for organizations.
4.3.2 Sample and Data
To explore the role of success and failures in drug development, we
leverage on the Pharmaceutical Industry Database (PHID) maintained at IMT
Institute for Advanced Studies in Lucca (Italy). This database provides fine-
grained data on more than 30,000 pharmaceutical R&D projects including their
Anatomical Therapeutic Chemical (ATC) classification, the indication on the
treated disease, the development history of the project, the company leading
the project as well as other companies that were involved during the trial as
licensor or licensee. This database relies on information collected from
governmental agencies, industry conferences, press relies, contacts with firms.
For a subset of 9,496 projects, the PHID database also reports the associated
patent publication number used by the firm to protect the compound under
development31
. We enrich the patent information by extracting the patent
family relative to each patent publication number from PATSTAT (version
2013) matching 9,165 projects that are associated with at least one patent
family (96.51% of projects reporting a patent). We further cleaned the
subsample remaining with 8,243 projects whose development process occurred
in countries having comparable standards and procedures (Europe, Japan,
USA, North America, Canada) or whose final drug has been marketed
worldwide. We use patent data to link, via citations, the focal project to
previous research efforts as well as controlling for knowledge spillovers that
31 The information over patent is available only for a subsample since natural compound are excluded from patent protection. The information on patents is available in the database where a
patent search has been conducted for each compound and one or more patents were identified.

89
can generate an advantage for the successful outcome of the focal project. The
theoretical and empirical literature in innovation suggests that patent citations
represent a source of knowledge spillover (Trajtenberg, 1990). This literature
also posits that highly cited patents are the most innovative as other firms are
willing to imitate their ideas (Carpenter & Narin, 1983; Narin, Rose and
Olivastro, 1989; Trajtenberg, 1990). In the pharmaceutical industry, patents are
a good proxy of innovation, not only because compounds are patented early-on
in the development process, but also because the propensity to patent is
amongst the highest across industries (Arundel and Kabla, 1998; Campbell,
2005; Jaffe, 1989; Cohen et al., 2000) and represent an important source of
technological advantage in this industry (Levin et al., 1987).
The rich amount of information included in the dataset, allows us to control
for a series of patent-projects characteristics as well as organizational factors
that may affect the final stage of follow-up compounds. After the cleaning
procedure our sample includes 8,243 focal projects linked to 8,112 distinct
patent families32
. However, we restrict our analysis only to focal projects
whose development process initiated between 1980 and 2005 to allow enough
time in clinical trials,33
remaining with 7,350 projects linked to 7,042 patent
families and lead by 1,374 distinct firms (Table 4.1).
Table 4.2 provides some summary statistics about project performances in
clinical trials. A large majority of focal projects in our sample has failed
(35.58%) whereas only a smaller fraction has reached the final stage in the
development(21.47%). A high fraction are still in progress (ongoing) or have
never been officially discontinued being listed as ongoing despite no
development update for long periods of time (42.95%).This trend is consistent
with prior literature, acknowledging the high attrition rates and uncertainty
characterizing the drug development process (DiMasi, 2003; Kola & Landis,
2004). The average length of projects ranges on average from 8 years for failed
32 The relationship between focal project and patent is one-to-many. In our analysis we considered
all the patents associated to the projects. 33 In order to enable learning mechanisms to take place we restricted the analysis to the focal
projects that started after the cited.

90
projects up to 14 years for successful projects, a trend that find consistency
with previous studies (Abrantes-Metz et al., 2004). 34
There are 3,851of focal projects (52.39%) that built on previous research
efforts citing 3,720 existing projects. The large majority of firms in our sample
have between one and fifty projects for a total of 4,239 distinct projects. There
are 20 large pharmaceutical companies with more than 50 projects that alone
contribute to a total of 3,111 projects (Table 4.1).
34 For projects with market drugs we extract also the first date of sales. The average length of
projects with marketed drugs then is 11 years, consistent with the trend described in the literature.

91
Table 4.1: Most representative firms
Num
Proj. Succ. Fail Ong
Num
Proj. Succ. Fail
Ong.
Takeda 56 9 29 18 Bayer 144 46 46 52
Johnson & Johnson 58 15 17 26 Novartis 149 39 81 29
Mitsubishi Tanabe Pharma 58 13 20 25 AstraZeneca 162 46 78 38
Boehringer Ingelheim 66 23 36 7 Astellas 167 61 63 43
Eisai 83 24 40 19 AbbVie 203 69 55 79
Daiichi Sankyo 89 38 25 26 Bristol-Myers 216 44 86 86
Actavis 91 51 15 25 Merck & Co 243 47 83 113
Roche 94 6 61 27 Sanofi 243 26 176 41
Amgen 106 20 34 52 GlaxoSmithKline 320 81 117 122
Lilly 114 8 42 64 Pfizer 449 45 160 244

92
4.3.3 Dependent Variable
In our analysis we measure learning as the cumulated experience generated by
previous R&D efforts, direct and vicarious, that operate to produce better
outcomes in following attempts.
Projects status. Successful projects are those that are lunched in the market or
are in the process of registration or pre-registration. Failed projects are those
that have been discontinued or suspended during development trials. Our third
group is represented by all the projects that are still in the preclinical or clinical
trials (ongoing projects). Every project, along the development process, may
go through different status at different time, for different indications and in
different markets. Therefore, to correctly identify the status we analyzed the
development history of every project and we classified as Success those
projects that have at least one success, as Failure those projects that have
experienced only failed events while projects that have experience both a
success and a failure in their development history are classified as success
since at least for one indication or in certain geographical market have been
approved by the FDA35
. The remaining projects that along their development
path did not experience any success or failure are classified as Ongoing (this
group is not considered in the main analysis but will be presented in the
Appendix Table A.6). Figure 4.2 and 4.3 show the distribution over time of
the projects by starting and outcome date. Table 4.2 reports the final phase
reached by focal and cited project before termination. Table 4.4 reports the
status of focal projects that build on previous efforts versus those that do not.
35 The projects that have both a Failure and a Success event in their development history are in
total 509. In non reported regression we tried different classification for our dependent variable with results robust to alternative classifications. As an example Dronabinol in its development
history has a successful events, namely being marketed for treating anorexia nervosa, nausea and
vomiting related problems. During its development history, clinical trials have been started also to cure migraine and dementia but with unsuccessful outcome. However, since at least for one
indication the experimentation was successful, Dronabinol is classified as Success.

93
05
01
00
150
200
Num
On
go
ing S
ucce
ss F
ailu
res
1980 1990 2000 2010 2020Status Date
sumFail sumOng
sumSucc
Number of Projs by Group Status
Figure 2: : Number of Successful/Failed and Ongoing projects over time.
Table 4.2: Final Phase reached by the focal and the cited project before
termination.
FINAL PHASE OF
FOCAL BEFORE
TERMINATION
FINAL PHASE OF
CITED BEFORE
TERMINATION
Freq % Freq %
Discovery 6 0.23 3 0.23
Preclinical 829 31.70 387 29.25
Clinical 8 0.31 5 0.38
Phase I 486 18.59 238 17.99
Phase II 936 35.79 478 36.13
Phase III 330 12.62 205 15.50
Terminated 20 0.76 7 0.53
Tot 2615 100 1,323
We extracted the most advanced phase reached by the project before
termination in countries having comparable standards (Europe, Japan, USA,
North America, Canada). This enable us to know at which phase in the trial
process the failure has occurred.
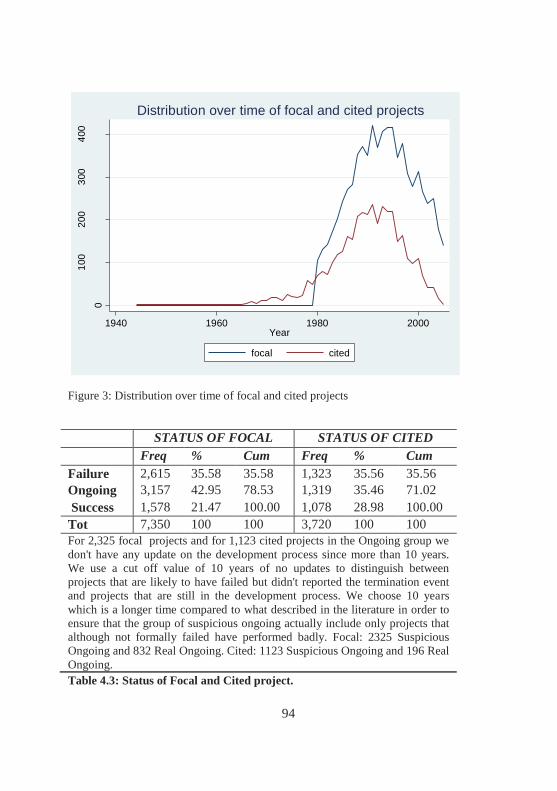
94
0
100
200
300
400
Fre
q. of fo
ca
l/cited
prjs.
1940 1960 1980 2000Year
focal cited
Distribution over time of focal and cited projects
Figure 3: Distribution over time of focal and cited projects
Table 4.3: Status of Focal and Cited project.
STATUS OF FOCAL STATUS OF CITED
Freq % Cum Freq % Cum
Failure 2,615 35.58 35.58 1,323 35.56 35.56
Ongoing 3,157 42.95 78.53 1,319 35.46 71.02
Success 1,578 21.47 100.00 1,078 28.98 100.00
Tot 7,350 100 100 3,720 100 100
For 2,325 focal projects and for 1,123 cited projects in the Ongoing group we
don't have any update on the development process since more than 10 years.
We use a cut off value of 10 years of no updates to distinguish between
projects that are likely to have failed but didn't reported the termination event
and projects that are still in the development process. We choose 10 years
which is a longer time compared to what described in the literature in order to
ensure that the group of suspicious ongoing actually include only projects that
although not formally failed have performed badly. Focal: 2325 Suspicious
Ongoing and 832 Real Ongoing. Cited: 1123 Suspicious Ongoing and 196 Real
Ongoing.

95
Table 4.4: Status of focal projects that build on previous projects versus those that
don't built on previous projects
4.3.4 Independent Variables
Reliance on previous projects: we analyze the reliance of the focal project on
previous research efforts via patent citations. We distinguish Building on own
projects, when focal project cites patents linked to projects developed by the
same Lead Company, from Building on others' projects, when instead the
focal build on research efforts by other firms. Self-citations refer to the ability
of the firm to build on previous experiences and knowledge with possible
benefits on following research projects36
(Hall et al., 2001). Literature has also
considered citations of other organizations as a good proxy of knowledge
flows (Jaffe et al., 2000). We further distinguished between citation to
previous Successful, Failed and Ongoing efforts both by the Same Lead as
well as other firms' projects (Building on own Failure / Success / Ongoing
versus Building on others' Failure / Success / Ongoing)37
. We distinguish Self-
36 Nerkar (2003) uses a similar approach and consider patent citations as a proxy for knowledge
recombination - patents citing previous patents using knowledge embodied in the cited ones. 37 In order to avoid multicollinearity we use exclusive dummies only among the two main set of
independent variables: Building on own previous own projects and Building on previous projects
by other firms. As an example, the variable "Building on own Failure" flags focal projects that only built further on their own previous failures. At the same time the focal can also build on
previous failure by other firms or previous success by others.
Focal projects that built on
previous R&D efforts
Focal projects that DONT
built on previous R&D
efforts
Freq. % Freq. %
Failure 1,340 34.80 1,275 36.44
Ongoing 1,637 42.51 1,520 43.44
Success 874 22.70 704 20.12
3,851 100 3,499 100
The 52.39% of focal projects built on previous R&D efforts via patent citations
with a success ratio equal to 22%. Patent citation link may identify
incremental development projects, whereas non-linked patents may be based
on true innovations and new drug development opportunities. However, the
success rate in the two group is quite similar ruling out this possibility.

96
citations from citations to other organizations since they convey different
patterns of knowledge diffusion and learning mechanisms. On one side self-
citations measure the extent to which the organization is able to benefit from
its previous research efforts in a cumulative way (Hall et al., 2001). On the
other side, citations to other firms' efforts capture the extent to which the focal
firm built on external knowledge through vicarious learning. Table 4.5 reports
the citation patterns whereas Table 4.6 shows the success ratio of focal projects
building on previous R&D efforts.
Table 4.5: Citations patterns.
Table 4.6: Success Ratio
Building on:
Success Ongoing Early Fail Late Fail
Focal:
Success 679 272 182 254
Ongoing 701 968 614 666
Early Fail 11 509 306 277
Late Fail 636 291 238 308 There are 3851 focal projects that built on previous research efforts, Repetition
in the citation patterns in this table are possible due to multiple citations per
focal project. On average focal cites 2 previous projects while the average
number of cited patent families is 15.
Freq. Succ Succ. Ratio
(%)
Focal building on Success
Focal building on Failures
Focal building on Succ. & Fail
Focal building on Ongoing
1039 440 42,34%
1223 112 9,15%
986 190 19,26%
603 60 9,95%

97
4.3.5 Control Variables
We introduce a series of control variables related to the project, the associated
patents as well as firms' characteristics.
4.3.5.1 Project Controls
The drug development projects may refer to several Medical Indications and
Anatomical Therapeutic Chemical Classification (ATC). The Indication refers
to the use of the drug for treating a certain disease. For instance, diabetes is an
indication for insulin or stated in another way insulin is indicated for the
treatment of diabetes. The ATC points to the active ingredients of drugs
according to the organ or system on which they act and their pharmacological
and chemical properties. In the ATC classification System drugs are classified
into 5 levels: the first indicates the anatomical main group (metabolism "A";
cardiovascular system "C", and so forth), the second level indicates the
therapeutic main group, up to the last level indicating the chemical substance.
A drug that targets diabetes may for example report indications also for obesity
and other metabolic disease and it is usually associated to ATC classes A10X,
Drug used in Diabetes, A10L, Alpha-glycosidase Inhibitor, A84, Anti-obesity
preparation. This study uses ATC- 3 level to identify the relevant drug market
in line with standard procedure commonly used by the European Commission
and pharmaceutical companies. A drug in ATC-3 class can only be substitute
with another drug in the same ATC-3 class but not by a drug in a ATC-2 level
even if pointing at the same Therapeutic Indication. For instance drugs in
ATC-3: A10B and A10A are both associated to the treatment of diabetes but
use different target action (insulin versus non-insulin), therefore they are not
substitute. The inclusion of multiple indication and ATC per project might
increase the possibility of success as scientists may leverage on a common
knowledge and testing models on the same molecule applied to Indication
sharing similar biological characteristics. Therefore we control for the Number
of Indication and ATC classes associated to the project (Table 4.7).
The risk embedded in the development of a drug in the ATC classes can
vary over time. We measure a dynamic ATC Success Rate associated with
each ATC included in each project by computing the share between Successful

98
project over the total project with known outcome (Success and Failure) before
the starting date of the focal projects.38
We also control for the R&D Opportunity in ATC by taking into account
the total number of projects by other firms in the same ATC having a time
overlap with the focal project (R&D competition in ATC). We also control for
the possibility that unobserved characteristics of therapeutic areas may
generate different project outcomes by considering the most representative
ATC Classes in our sample associated to more than 30 projects (87 ATC
dummies). Projects that are more recent in time may be less likely to have a
final outcome status, either being marketed or terminated. To control for year
effects, we include Starting Year dummies.
Table 4.7: Number of Indication and ATC Classes of focal projects
4.3.5.2 Patent Controls
Our sample includes development projects of compounds that are protected by
patent law. Chandy et al., (2006) et al., suggested that the ability of
pharmaceutical firms to translate patents into final drugs is higher for firms
that develop an intermediate number of drug-related patents. Thus, we include
in our control variables the Number of Patent families the focal project is
associated to, while also identifying, through dummies, projects that share the
same patent family (Same Patent Family). In this study patent families are
also useful to capture additional knowledge from previous patents via citations.
We include the total Number of Backward Citations (Bwd cits) to other
patent families and also a control for the citation to Non Patent Literature
(Citing NPL Scientific) in the form of scientific references as existing studies
38 In case of multiple ATC per project we computed the mean of (ATC Success Index).
Number of Indications Number of ATCs
Freq. % Freq. %
1 3,931 53.48 5,357 72.88
2 1,609 21.89 1,439 19.58
≥3 1,810 24,60 554 7.55
7,350 100 7,350 100

99
have shown an important link between science and technology (Narin et al.,
1997; Griliches, 1986; Koenig, 1983; Van Looy et al., 2003). Patent
information also allows us to observe whether the focal project build on
previous research efforts, the characteristics of the projects it builds on as well
as other related patents. We consider the average quality of cited patent family
proxy by the Forward citation. As failure may be linked to the intrinsic quality
of both the focal and the cited patent. More novel or original patents are
usually associated with a higher risk. To control for these factors we include
the Originality measure by Trajtenberg et al., (1997) based on the spread of
backward citations to technological classes. Novelty is also associated with the
number of elements that are combined within patents, thus we control for the
number of technological components that are recombined within the focal and
cited patent39
. We also flag common characteristics between focal and
previous projects by identifying projects developing drugs in at least one
common therapeutic area reported (Same ATC focal cited).
Patents embody valuable knowledge upon which firms rely for the
development of drugs. Therefore, we control for knowledge spillovers by
identify the projects in which the company leading the R&D project is also the
owner of the patent protecting the compound (Same Company Lead-Patent)
4.3.5.3 Firm Controls
Large firms have been found to be path dependent, usually confined within
their established routines and practices showing resistance towards new
explorative solutions (Hill & Rothaermel, 2003). Yet, they also build on a
larger knowledge base that allow them to leverage on direct failed ad
successful events, benefit from scope economies on related projects, and better
assessment of potential risks. The concentration of R&D portfolios of firms in
specific therapeutic areas may increase the likelihood of a project to reach the
market.
Danzon et al., (2005) show that firms with focus experience rather than
broad knowledge are able to leverage economies of scope with higher
probability of completing Phase III in clinical trials. Hence, we control for the
Concentration of firm portfolio over ATC classes pointing to the span of firm
39 These measures are computed at the family level.
100
research strategies using the Hirschman-Herfindahl index. Note that each
projects may include multiple ATC classes thus we capture the breadth of
projects portfolio using a fractional count and then collapsing everything at
firm level40
. This measure will take the value one for firms having a very
concentrated project portfolio, whereas it will approach zero for more
diversified firms.
Nerkar and Roberts (2004), find that experience in proximal technologies
has a positive effect on commercial success of new pharmaceutical products.
Hence, we control for the firm success ratio by computing the number of failed
projects over time prior the starting date of the focal (Firm Failures Ratio).
Since this variable is not cumulative, it controls for a different propensity of
the focal firm to succeed or failed over time, possibly due to experience41
.
Projects that are more recent in time may be less likely to have a final outcome
status, either being marketed or terminated. Finally, to capture variation in
trends across firms and ATC classes over time, we also use Firms, ATC and
Starting Year dummies. Table 4.8 provides an overview of the variables with
a short description and summary statistics.
40 For the derivation of the Index see: Gruber, M., Harhoff, D., & Hoisl, K. (2013). Knowledge
recombination across technological boundaries: scientists vs. engineers. Management Science, 59(4), 837-851. 41 We also used an alternative and more direct measure of experience by computing the cumulative
years of firm activity in the focal ATC in previous projects (Years of Experience in ATC).To control for firm-year unobserved effects we use the ratio of failed project prior the starting year of
the focal. The main results are robust in both specification.

101
Table 4.8: Overview of Variables, their description and summary statistics for the
group of Failure and Success excluding ongoing (4193 obs)
Variable Description Measure Obs Mean Std. Dev.
Project Status Status of the focal projects
(Success/Failure) Dummy 4193 0.376 0.484
Building on:
Focal projects building on
previous own failed,
successful or ongoing projects.
(Focal Lead=Lead of
previous proj.)
Exclusive Dummies
Self Failure 4193 0.052 0.222
Self Success 4193 0.031 0.175
Self Succ.& Fail. 4193 0.057 0.233
Self Ongoing 4193 0.014 0.117
Building on:
Focal projects building on
previous failed, successful or
ongoing projects by other firms.
(Focal Lead≠Lead of
previous proj.)
Others' Failure
Exclusive
Dummies+
4193 0.118 0.322
Others' Success 4193 0.157 0.364
Others' Succ & Fail.
4193 0.137 0.344
Others' Ongoing 4193 0.047 0.213
Focal Projects
controls:
Num. Indication Number of Indications
Number of
Indications 4193 2.35 2.49
Num. ATC Class Number of ATC classes
Number of
ATC classes 4193 1.428 0.765
Num. Families Number of patent families
Number of
families 4193 1.137 0.407
Sharing the same patent
The focal project is associated to a patent family
shared by other focal
projects. Extent to which same technological efforts
are re-used.
Dummy 4193 0.201 0.401
Focal Patent
Controls: Patent Originality Originality Index
3793 0.829 0.137
Number of
Components
3888 41.02 76.84
Same Company -
patent
The lead company and the
owner of the patent are the
same entity (Jaccard similarity)
Dummy 4193 0.922 0.289

102
Citations controls:
Cite NPL -
Scientific. Lit.
Extent to which the focal
project refers to Scientific NPL.
Dummy 4193 0.802 0.398
Bwd cit. Extent to which the focal
project builds on previous
technological efforts
Number of
Backward patent
references
4193 2.31 0.973
Cited Patent
controls:
Fwd cit. Average quality of cited
patent family
Mean of Fwd
citations 5year 4193 8.74 8.035
Patent Originality Originality Index
3808 0.806 0.103
Number of
Components 3835 28.55 36.403
Same Company -
patent
The lead company and the
owner of the patent in focal
projects are the same entity (Jaccard similarity)
Dummy 4193 0.0922 0.289
Same ATC focal-
previous proj. Focal building on previous projects having at least 1
ATC class in common (via
patent citations)
Dummy 4193 0.349 0.476
ATC Controls:
ATC success rate Number of Successful
projects in ATC prior to the
starting of the focal project
Number of Success in ATC
4193 0.469 0.237
R&D competition in ATC
Number of projects by other firms in the ATC with time
overlap
Number of
projects 4193 5.62 1.664
Firm Controls:
Failure Ratio over time
Number of failed projects
over time prior the focal 4193 1.05 1.22
Breadth of
firmactivities Breadth of the focal Lead's research activities
1-Herfindahl Index
4193 0.118 0.179

103
Table 4.9 11: Correlation table

104
4.4 Results
In our empirical strategy we focus on the effects that learning from previous
R&D efforts has on the outcome of current drug development projects. The
unit of analysis is therefore represented by the single project. In our empirical
analysis we use logit model and take the likelihood of achieving project
success (approval and market introduction of the drug) as the dependent
variable. We exclude ongoing projects to focus on projects with a clearly
defined outcome (in the appendix we examine ongoing status as an additional
outcome, using a multinomial logit specification Table C.5). The estimates on
prior success and failure indicate the likelihood of success of focal projects
that build on previous projects versus those focal projects that do not build on
prior projects of the focal or other firms. In Tables 4.10 and 4.12 we consider
all citations linked to previous projects. In Tables 4.11 and 4.13 we instead
control for the timing of the citation. In order to do that, we redefine the
independent variables to take into account only citation linkages where the
focal project ends after the cited projects (projects that ends before the cited
are flagged by the dummy Projects before cited outcome). Models 1 show the
results when only the control variables are considered. Models 2 presents the
estimations of the full model.
Our first research question proposes to examine whether pharmaceutical
firms have a higher propensity to learn from success rather than from failures.
Table 4.10 shows that previous successful attempts (both by the focal firm and
by other firms) have a positive and significant effect on the likelihood of
achieving a successful outcome in focal drug development projects. We find
the opposite result when the focal project builds on previous failures or
ongoing projects. In other words, the estimates indicate that failure experience
has a tendency to trigger future failures whereas previous success induces
further success. The increase in the odds of achieving a successful outcome
given previous success is substantially high (189%) for own success and about
42% for others firms' success. Prior failure instead decrease the odds of
success, by 50% for the coefficient (own Failure) and 37% for other firms'
failure. The strong results for prior success provide a confirmative answer to

105
research question 1, while the negative effect of failure contrast with prior
research findings on learning from large failures.
Table 4.10: Estimations for experiential and vicarious learning
on project status
Model 1 Model 2
Self Failure -0.7033***
(0.2500)
Others' Failure -0.4666**
(0.1973)
Self Success 1.0643***
(0.2576)
Others' Success 0.3574**
(0.1668)
Self Succ. & Failure 0.1532
(0.2579)
Others' Succ. & Failure -0.3599*
(0.2139)
Self Ongoing -0.8032**
(0.3411)
Others' Ongoing -0.4418*
(0.2391)
Num Indication
0.2634***
0.2603***
(0.0263) (0.0261)
Num ATC classes 0.9800** 1.0038**
(0.4801) (0.4857)
Num Patent Family 0.5677*** 0.5980***
(0.1457) (0.1445)
Shared patent Family -0.5597*** -0.5637***
(0.1613) (0.1624)
Focal Patent originality -1.8145*** -1.6375***
(0.4446) (0.4431)
Focal Patent Num.Comp. -0.0006 -0.0005
(0.0006) (0.0006)
Focal Lead=Focal Pat -0.6037*** -0.5965***
(0.1450) (0.1468)
Citing NPL Scientific 0.1024 0.1056
(0.1159) (0.1171)
Bwd Cits 0.4072*** 0.4206***
(0.0612) (0.0688)
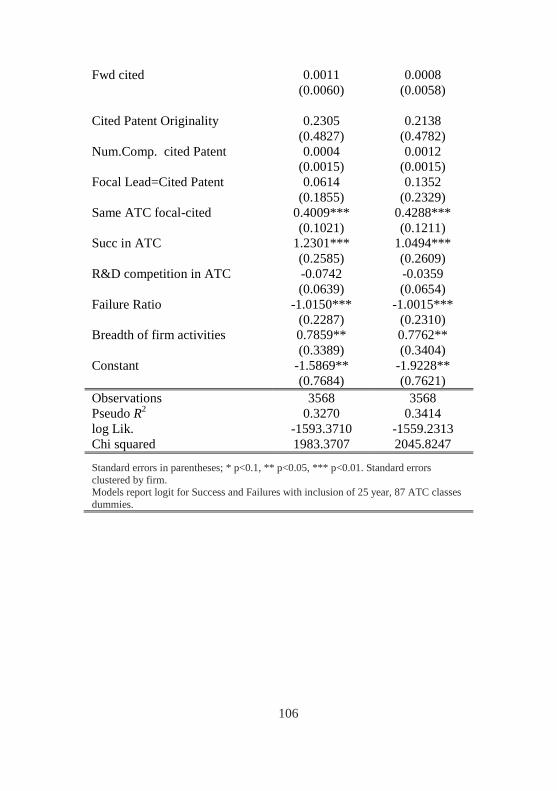
106
Fwd cited 0.0011 0.0008
(0.0060) (0.0058)
Cited Patent Originality
0.2305
0.2138
(0.4827) (0.4782)
Num.Comp. cited Patent 0.0004 0.0012
(0.0015) (0.0015)
Focal Lead=Cited Patent 0.0614 0.1352
(0.1855) (0.2329)
Same ATC focal-cited 0.4009*** 0.4288***
(0.1021) (0.1211)
Succ in ATC 1.2301*** 1.0494***
(0.2585) (0.2609)
R&D competition in ATC -0.0742 -0.0359
(0.0639) (0.0654)
Failure Ratio -1.0150*** -1.0015***
(0.2287) (0.2310)
Breadth of firm activities 0.7859** 0.7762**
(0.3389) (0.3404)
Constant -1.5869** -1.9228**
(0.7684) (0.7621)
Observations 3568 3568
Pseudo R2 0.3270 0.3414
log Lik. -1593.3710 -1559.2313
Chi squared 1983.3707 2045.8247
Standard errors in parentheses; * p<0.1, ** p<0.05, *** p<0.01. Standard errors
clustered by firm. Models report logit for Success and Failures with inclusion of 25 year, 87 ATC classes
dummies.

107
Table 4.11: Estimations for experiential and vicarious learning on project
status. Time Restriction
Model 1 Model 2
Cites Self Failure -0.6089**
(0.2575)
Cites Others' Failure -0.2919
(0.2063)
Cites Self Success 1.5979***
(0.3639)
Cites. Others' Success 0.5949***
(0.1913)
Cites Self Success and Failure 0.3124
(0.2679)
Cites Others' Succ&Failure -0.2619
(0.2265)
Cites Self Ongoing -0.7875**
(0.3436)
Cites Others' Ongoing -0.3655
(0.2451)
Project before cited outcome
-0.8634***
-0.8283***
(0.1561) (0.1879)
Num Indication 0.2622*** 0.2601***
(0.0264) (0.0260)
Num ATC classes 0.9506** 0.9527*
(0.4788) (0.4869)
Num Patent Family 0.5528*** 0.5727***
(0.1479) (0.1442)
Shared patent Family -0.5487*** -0.5801***
(0.1634) (0.1718)
Focal Patent originality -1.8058*** -1.6527***
(0.4521) (0.4606)
Focal Patent Number of
Comp.
-0.0006 -0.0004
(0.0006) (0.0006)
Focal Lead=Focal Pat
-0.6233***
-0.6116***
(0.1437) (0.1452)
Citing NPL Scientific 0.0822 0.0816
(0.1174) (0.1162)

108
Bwd cits 0.3820*** 0.3662***
(0.0617) (0.0676)
fwd cited 0.0007 0.0001
(0.0061) (0.0058)
Cited Patent Originality 0.2543 0.2637
(0.4794) (0.4798)
Num. Comp. of cited Patent 0.0002 0.0010
(0.0015) (0.0015)
Focal Lead=Cited Patent 0.0772 0.0863
(0.1812) (0.2259)
Same ATC focal-cited 0.5302*** 0.5202***
(0.1118) (0.1311)
Succ in ATC 1.2495*** 1.1178***
(0.2698) (0.2740)
R&D competition in ATC -0.0903 -0.0562
(0.0649) (0.0661)
Failure Ratio -1.0000*** -0.9749***
(0.2280) (0.2288)
Breadth of firm activities 0.7978** 0.7532**
(0.3395) (0.3375)
Constant -1.4437* -1.7596**
(0.7812) (0.7886)
Observations 3568 3568
Pseudo R2 0.3325 0.3478
log Lik. -1580.3527 -1544.0172
Chi squared 1945.5579 1977.0382
Standard errors in parentheses; * p<0.1, ** p<0.05, *** p<0.01. Standard errors
clustered by firm.
Models report logit for Success and Failures with inclusion of 25 year, 87 ATC
classes dummies.
The independent variables only include citations where the focal project ended after the cited. Focal projects that end before are included in the dummy Projects before
cited outcome.

109
In the second research question, we proposed to examine whether there is a
stronger influence from previous own success or failure than from other firms’
experience. A Wald test confirms that other firms’ prior success has a smaller
effect on success than firms’ own prior success. Similarly, the difference in
coefficients of own and other firms’ failure is significant as well. Citing
ongoing projects has similar effects as citing failures. The difference in the
coefficients between prior own and other firms’ success provides a
confirmative answer to research question 2. Imposing a stricter time ordering
between focal and prior projects (Table 4.11) leads to a similar pattern as in the
models showed in Table 4.10, but with the effects generally larger in
magnitude for citing previous own and others' success.
Control variables reveal results that are overall consistent with our
expectations. Focal projects with more medical indications and therapeutic
areas have a higher probability to succeed as well as projects with more than
one patent family. These variables shows the same trends and magnitude also
in Tables 4.12 and 4.13. The reuse of the same patent family among several
projects increases the incidence of failure, which is likely to be due to the
lower costs of reusing the same patent for several projects allowing more risks
to be taken through local search (the effects of reusing the same patent is better
examined in the Appendix, Tables C.3 and C.4). The other controls at the
patent level suggest that a higher originality of the focal patent on which the
project is based, decrease the likelihood of success of the drug. This result
suggests that projects that build further on patents that are original (combining
knowledge from different sources) may have a higher intrinsic risk and distant
search which may explain a higher failure rate. As found in previous studies
(Narin et al., 1997) backward citations to patents increase the likelihood of
success. A generally higher success ratio for projects in the same ATC
significantly drives the success rate as well. Interesting is the positive effect of
projects having the same ATC of the cited project suggesting that building
further on common ATC classes facilitates learning and leads to a higher
probability of success due to specific experience in the therapeutic category.
Firms that develop specialized expertise in certain fields can limit the
probability of failures since they can build further on cumulated knowledge.
This finding is in line with studies pointing to the refinement of performance
through repeated experience (Argote, 1996) and to the benefits of developing

110
focused experience enabling firms to rely on economies of scope (Danzon et
al., 2005). In line with expectation, a higher success rate in the ATC increase
the likelihood of success. At firm level, higher failure rates prior the starting
date of the focal projects decrease the likelihood of success. Other control
variables have no significant effects.
Given the importance of within-ATC class learning shown in Tables 4.10
and 4.11, we provide in Table 4.12 further insights on the effect of previous
success and failure depending on whether prior projects cover the same ATC
class or not. Interestingly, the negative effect of previous failures is limited to
prior own and other failures in different ATCs by other firms', while it is not
significant when prior projects cover the same ATC. The results also indicate
that the probability of project success is enhanced in case prior experience
relates to firms’ own and others firms' projects within the same ATC class.
Table 4.12: Estimations for experiential and vicarious learning on ATC
Model 1 Model 2
Self Same ATC Failed -0.1645
(0.2790) NO Self Same ATC Failed 0.1585
(0.1556)
Self Different ATC Failed -0.3654 (0.2690)
No Self Different ATC Failed -0.5343***
(0.1715)
Self Same ATC success 0.7179***
(0.2436)
No Self Same ATC Success 0.7608***
(0.1198)
Self Different ATC Success 0.2101
(0.2349) No Self Different ATC Success -0.0256
(0.1532)
Self Same ATC Ongoing -0.3479 (0.3213)
No Self Same ATC Ongoing -0.0213
(0.1720)
Self Different ATC Ongoing -0.1114
(0.2764)
No Self Different ATC Ongoing -0.2729 (0.1730)
Num Indication 0.2640*** 0.2667***
(0.0261) (0.0269) Num ATC classes 0.9704** 1.0192**

111
(0.4763) (0.5152)
Num Patent Family 0.5647*** 0.6072***
(0.1479) (0.1502) Shared patent Family -0.5350*** -0.5070***
(0.1579) (0.1663)
Focal Patent originality -1.8362*** -1.6799*** (0.4500) (0.4449)
Focal Patent Number of Comp. -0.0007 -0.0005
(0.0006) (0.0006) Focal Lead=Focal Pat -0.6162*** -0.6080***
(0.1437) (0.1506)
Citing NPL Scientific 0.1226 0.0984 (0.1163) (0.1192)
Bwd cits 0.4640*** 0.4670***
(0.0604) (0.0725)
fwd cited 0.0046 0.0036
(0.0059) (0.0059)
Cited Patent Originality 0.3000 0.1797 (0.4848) (0.4881)
Num. Comp. of cited Patent 0.0005 0.0013
(0.0015) (0.0015) Focal Lead=Cited Patent 0.1734 0.2290
(0.1794) (0.2134)
Succ in ATC 1.2952*** 1.0039*** (0.2512) (0.2625)
R&D competition in ATC -0.0825 -0.0391
(0.0645) (0.0668) Failure Ratio -1.0141*** -0.9813***
(0.2306) (0.2344)
Breadth of firm activities 0.8277** 0.8091**
(0.3384) (0.3418)
Constant -1.7576** -2.0055***
(0.7569) (0.7665)
Observations 3568 3568 Pseudo R2 0.3239 0.3457
log Lik. -1600.6820 -1548.9970
Chi squared 1928.4928 2140.3781
Standard errors in parentheses; * p<0.1, ** p<0.05, *** p<0.01. Standard errors
clustered by firm. Results of logit for Success and Failures and include 25 year and 87 ATC classes
dummies.
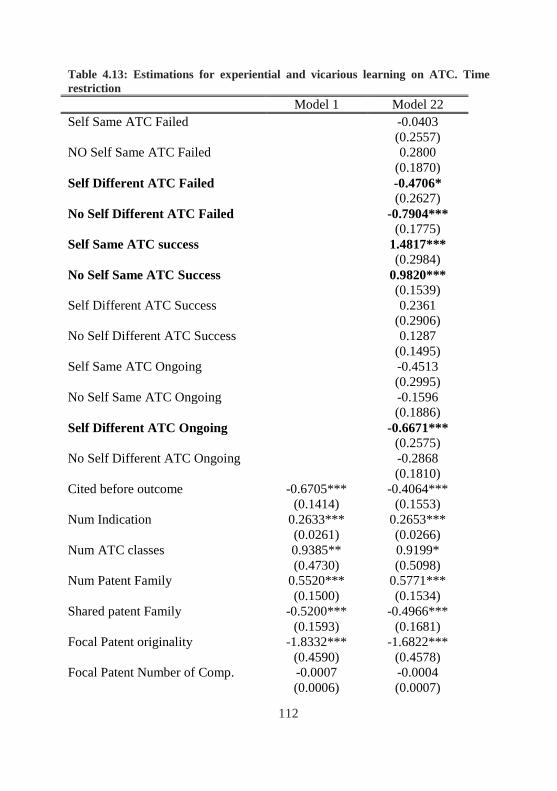
112
Table 4.13: Estimations for experiential and vicarious learning on ATC. Time
restriction
Model 1 Model 22
Self Same ATC Failed -0.0403
(0.2557)
NO Self Same ATC Failed 0.2800
(0.1870)
Self Different ATC Failed -0.4706*
(0.2627)
No Self Different ATC Failed -0.7904***
(0.1775)
Self Same ATC success 1.4817***
(0.2984)
No Self Same ATC Success 0.9820***
(0.1539)
Self Different ATC Success 0.2361
(0.2906)
No Self Different ATC Success 0.1287
(0.1495)
Self Same ATC Ongoing -0.4513
(0.2995)
No Self Same ATC Ongoing -0.1596
(0.1886)
Self Different ATC Ongoing -0.6671***
(0.2575)
No Self Different ATC Ongoing -0.2868
(0.1810)
Cited before outcome -0.6705*** -0.4064***
(0.1414) (0.1553)
Num Indication 0.2633*** 0.2653***
(0.0261) (0.0266)
Num ATC classes 0.9385** 0.9199*
(0.4730) (0.5098)
Num Patent Family 0.5520*** 0.5771***
(0.1500) (0.1534)
Shared patent Family -0.5200*** -0.4966***
(0.1593) (0.1681)
Focal Patent originality -1.8332*** -1.6822***
(0.4590) (0.4578)
Focal Patent Number of Comp. -0.0007 -0.0004
(0.0006) (0.0007)

113
Focal Lead=Focal Pat -0.6355*** -0.6323***
(0.1428) (0.1509)
Citing NPL Scientific 0.1102 0.0757
(0.1175) (0.1206)
Bwd cits 0.4590*** 0.4456***
(0.0610) (0.0725)
fwd cited 0.0053 0.0042
(0.0061) (0.0060)
Cited Patent Originality 0.3290 0.1846
(0.4829) (0.4797)
Num. Comp. of cited Patent 0.0004 0.0014
(0.0015) (0.0015)
Focal Lead=Cited Patent 0.2186 0.2602
(0.1737) (0.2089)
Succ in ATC 1.3260*** 1.0747***
(0.2578) (0.2670)
R&D competition in ATC -0.0961 -0.0499
(0.0653) (0.0667)
Failure Ratio -1.0009*** -0.9546***
(0.2303) (0.2354)
Breadth of firm activities 0.8483** 0.8139**
(0.3385) (0.3454)
Constant -1.6889** -1.9843**
(0.7638) (0.7831)
Observations 3568 3568
Pseudo R2 0.3274 0.3562
log Lik. -1592.2983 -1524.1035
Chi squared 1914.9722 2045.0624 Standard errors in parentheses (clustered by firm); * p<0.1, ** p<0.05, *** p<0.01. 25 year and 87 ATC dummies
4.5 Discussion and Conclusion
The knowledge that both failures and success convey is of paramount
importance in the drug development process due to knowledge advancements
and spillovers that can benefit the focal as well as competing firms (Hoetker &
Agarwal, 2007). Although prior studies have stressed the role of balancing
learning from failures and success (Levinthal & March, 1993) empirical
114
research has focused, with few exceptions (Madsen & Desai., 2010; Magazzini
et al., 2012) on benefits generated from failures (Desai, 2015; Haunschild and
Sullivan, 2002; Eggers, 2014). This study extends our understanding of
learning from failures and successes by examining the effect that learning from
previous failed or successful drug developments efforts has on the success rate
of related subsequent projects. It compares the roles of firms’ experiential
learning with that of vicarious learning from other firms’ prior related drug
development efforts. The pharmaceutical industry provides an interesting
setting as failures and successes are generally disclosed, while the high
propensity to patent and the fact that drug development projects relate to
specific patents allow to identify linkages between projects through patent
citations.
We find that both prior success in related drug development efforts of the
focal firm and prior success of other firms positively affect the probability of
success of subsequent drug development efforts. Contrary to common wisdom
on learning from failures, our findings suggest that prior failures lead to a
greater likelihood that firms fail again in their drug development efforts with a
similar pattern observed for other firms’ prior failures. For both learning from
success and failures, direct experiential learning effects are larger than
vicarious learning effects.
We offer a number of potential explanations for these findings. First, the
results point to a degree of inertia in firms’ drug development strategies when
failing in R&D. In the pharmaceutical industry, firms specialize in therapeutic
areas, and previous investments and cumulated knowledge may lead to
escalating commitments and reluctance to withdraw from a development
trajectory, in particular in the context of high expected, although very
uncertain, returns (Maslach, 2016; Nerkar & Roberts, 2004). One illustration is
Eli Lilly, which embarked on further trials for its Sola drug although having
experienced two previous failures in Phase III trials. Given the high investment
sustained, one possible explanation of why failures drive further failures is that
pharmaceutical firms may tend to replicate previous trajectories since the costs
of starting projects, or diversify them in related indications within the same
ATC-3 or through the reuse of the same patents, are lower. Thus firms may
have incentives to start new projects even though they are likely to fail. This
explanation is further supported by the findings that the patterns of prior

115
failures and following failures are only visible for drug development projects
sharing the same ATC and the finding that projects sharing the same patent
family are more likely to fail, pointing to higher failures when firms are
expected to face lower costs. Results show that firms tend to learn from
success in the same ATC which point on one side to a resolved uncertainty of
experimentation by the existence of previous success and on the other to
possible imitations among pharmaceutical firms. On the other hand, firms
encounter a higher probability of failure when they build on failures in
different ATC since there may still be uncertainty about proper compounds to
cure certain diseases.
A second explanation is that pharmaceutical firms may continue with failed
lines of research because the expected gains in case of success are very high,
compensating the higher risk of failure. A marketable drug for the treatment of
a disease for which a drug is still not available, as in the case of Alzheimer,
can provide very high profits. Therefore, the higher risk associated with
failures may be mitigated by the greater expected returns if the firm can market
a drug that has no competitors in the market. In contrast, building on previous
success, although increasing the probability of a positive outcome, is likely to
implies more incremental rewards since there are already competing drugs in
the market. This is in line with previous studies suggesting that being the first
to introduce an innovative product on the market is positively associated with
sales (Grabowski & Vernon, 1990; Roberts, 1999). In the pharmaceutical
industry, managers select experimentation of compounds that are most
promising, taking into account commercial considerations and the probability
of success (Arora, 2009).
We examined the power of this explanation by analyzing yearly sales for
successful projects (10% of the total sample), distinguishing between projects
building on previous failure versus and projects building on previous
successes. Computations on drug sales launched since 2003 in the US based on
IMS data, reveal that average yearly sales value in the US is 7.6% higher for
drugs citing failures only (686 versus 638 million US dollars). While this is in
line with expectations, the magnitude of this difference is too small to consider
this a major explanation for the observed patterns.

116
A last explanation for firms' behavior in building on previous failures is
that there is no treatment of certain diseases on the market, such that as a
consequence pharmaceutical firms experimenting on the cure of these disease
have no other choice than building further on previous failures. In these
circumstances, failures may give insights about the possible causes of what
went wrong in previous experimentation but do not narrow down many other
alternatives that the firms need to search through before finding the right route.
Hence, failure may lead to subsequent failure.
The explanations presented are drawn mainly on technical reasons that lead
firms to suspend or discontinue their projects. However, firms strategic
decisions related to competition may also play a role and need further
investigation.
Although these explanations may be part of the answer for the patterns
observed, our results also suggest further research on alternative explanations
on the incentives for building on previous failures. We note that the absence of
a significant negative effect of learning from failures for projects that share the
same ATC suggests that positive learning effects may occur for the most
related projects, but may be outweighed by cost considerations.
Our study contributes to the organizational learning theory by
demonstrating that pharmaceutical firms have the possibility to improve
significantly their performance if they build on prior successes, while our
results also emphasize the difficulties in learning from failures. Our study
provides a different perspectives on the finding by Magazzini et al., (2012)
showing that failed projects receive more patent citations and highlight that the
fact that patented compounds are followed up in future related drug
development does not mean that the knowledge they convey increases the
probability of success.
Our study informs the policy debate on the advantages and disadvantages
of enforcing disclosure on the reasons for unsuccessful trials. Recognizing the
value of information from clinical trials, the FDA has released in 2007 an
Amendment Act to include the results of trials of successful drug in public
registers. Along these lines, in September 2016 the FDA has extended this Act
(FDAAA801) by requiring the submission of results information for trials of
unapproved products. Our findings indicate that these new regulations may be
117
helpful. If firms have a better understanding of the reasons behind other firms’
prior failures, they may fail less in their subsequent drug development.
This study also presents limitations. The design of this study enables us to
capture only partially the mechanisms through which learning operates.
Through the use of citations between focal patents underlying drug
development projects, the analysis benefits from the understanding of which
kind of prior research the focal firm builds on, but the analysis may not capture
broader learning processes. Also, our analysis does not take into account the
organizational context in which learning takes place (Argote and Todorova
2007) nor how effectively knowledge disseminates across units involved in the
experimentation process.
Notwithstanding the findings of this study, additional research is necessary
to improve our understanding of the complex relationship between previous
success and failures and the performance of subsequent R&D projects.

118

119
Chapter 5
Concluding Remarks and Direction for Future Research
5.1 Summary of main findings
This dissertation draws on, and contributes to, the innovation literature that
conceives innovation as a search and recombination process based on
cumulative experience and constrained by cognitive limitations, uncertainty
and challenges of value appropriation. Although there has been a fruitful
discussion on firms' search processes in the existing literature, the question of
how the external environment influences firms' search process remains still
underexplored (Katila & Chen, 2009, Leten et al., 2016). This dissertation
contributes to a better understanding of the crucial role of environmental
characteristics in shaping the direction and success of firms' search process
through the studies presented in Chapter 2, 3 and 4.
Chapter 2 explores the process of search and knowledge recombination
over the entire technological landscape. This chapter presents a new measure
of the extent to which knowledge is combined in an unconventional way.
Compared to existing measures, built on patent citations, the indicator
presented in this chapter focuses on the actual combinations of knowledge
components (proxied by USPTO patent classes) within inventions. The
analysis uncovers that a large fraction of patents is based on conventional
knowledge recombination, pointing towards local search. Inventions that build
on more novel combinations are rare but also more cited. In particular,
inventions that search in established frameworks but introduce a disruptive
combination in their most creative effort. The correlation with existing novelty
measures like ‘originality’ by Trajtenberg et al., (1997) and ‘new first

120
combinations’ by Verhoeven et al., (2016) is only weakly related, suggesting
that they capture different dimensions of knowledge recombination.
Chapter 3 analyzes how unfavorable economic conditions shape the search
process that firms pursue. This chapter provides interesting insights relevant
for debate on the pro-cyclicality or the counter-cyclicality of innovation.
Results suggest that contractive phases of the business cycle are associated
with more conventional recombination, signaling local search strategies. Firms
respond asymmetrically to expansions and contractive phases of the sector
business cycle showing overall a pro-cyclical trend both at the intensive (a
decrease in unconventionality) and at the extensive margins (an overall
decrease in the rate of patenting). This process is not uniform across the whole
technological portfolio of firms but it is concentrated in firms’ core
technologies. Moreover, not all firms retrench from explorative activities, but
only financially constrained firms.
Chapter 4 examines when and to what extent pharmaceutical firms learn
from others' firms failures and success in their subsequent drug development
efforts. Utilizing comprehensive and detailed information on pharmaceutical
firms’ global drug development projects we find that projects that build on
firms’ previous successful projects have a higher likelihood to generate
marketable drugs, while building on prior failures reduces this likelihood. A
similar pattern, though weaker in magnitude, is observed for drug development
projects building on prior projects of other firms in their environment through
vicarious learning.
Two general conclusions can be drawn from the studies presented in the
dissertation. The studies confirm the tendency of firms to search mostly in
local or familiar domains. Chapter 2 shows a general tendency towards local
search through the recombination of knowledge according to established
schemas. Chapter 3 shows that firms are sensitive to the contraction phases of
the business cycle and respond by reducing more explorative search and the
intensity of inventive activities in general. In addition, in Chapter 4 it was
observed that local search, measured as drug development in existing or
related ATC classes, can increase the likelihood of drug development success.
The dissertation also contributes to the debate on the pay-off from local
versus distant search (Gavetti, 2012; Winter, 2012). Prior studies have focused

121
on the implications of local or distant search processes on firms' competitive
advantage and survival. Two main streams of literature have emerged. The
first stream of literature highlights the myopic and cognitive biases driving
firm activities. The second stresses the importance of introducing variety into
organizational routines in order to mitigate the local-search trap. The studies in
this dissertation are consistent with the notion of higher innovation rewards
associated with distant search. Chapter 2 highlights that novel inventions that
are based on established paradigms but at the same time introduce a disruptive
combination are on average more cited. This finding confirms that local search
with distant ‘jumps’ provides advantages in terms of technological impact.
Chapter 4 shows that local search through the reuse of related ATC classes,
while increasing the rate of drug development success, is also associated with
relatively smaller marketing rewards. Markets requiring distant search may
provide higher economic rewards, as no prior drugs are available, pushing
firms to accept higher failure rates.
5.2 Limitations and avenues for future research
This dissertation is subjected to a number of limitations that open up
possibilities for future research. First, the studies of this dissertation use patent
data as main source of information about innovation. As recognized in the
literature, patents data have the major drawback of capturing only successful
inventions. Besides, they do not have a uniform value and not all sectors are
equally patents intensive (Cohen et al., 2000). Yet, patents data reveal major
and important innovations patterns.
The citation approach used in Chapter 4 may be an imperfectly trace
learning. The design of the study reported in Chapter 4 captures only partially
the mechanisms through which the environment, via vicarious learning, shapes
the search process. Nonetheless, citations helped in identifying the kind of
prior research the focal firm builds in terms of prior projects, patents and
scientific literature.
A first avenue for research is in stream of literature on the origins and
measurement of radical innovations (Fleming, 2001; Rosenberg, 1982; Ahuja
& Lampert, 2001; Schoenmakers & Duysters, 2010). This stream of literature
discusses whether radical innovations originate from totally new knowledge or

122
from new combinations of existing knowledge. The most prominent view is
that "innovation combines components in a new way, or that it consists in
carrying out new combinations" (Schumpeter, 1939, p.88). Empirical studies
based on patent data have investigated the combination of technological and
knowledge components within inventions, utilizing a number of different
measures with the challenge to use patent information to delineate the
boundaries of the recombination process. This stream of literature represents
an interesting avenue for future work for refining and improving existing
measures as well as provide a better understanding of their explanatory power.
The measure proposed in Chapter 2 points in this direction. Recent efforts
exploit text mining techniques that allow to capture technical and scientific
components reported in patents (Magerman et al., 2010). Qualitative work
would also provide a better understanding of the recombination process.
A second avenue for future research deals with the investigation of the
search process at the inventor level. While the overall strategy of firms is
highly important in determining how inventive search is performed, individual
inventors are at the core of inventions. Inventors with a diversified knowledge
base may see promising routes of research that other don't notice. In addition,
understanding the importance of diversity in an inventor team may contribute
to the debate about the "fantastic four" or the "superman" role of the inventor
in the search and recombination process (Taylor & Greve, 2006). Future
research could inspire improved human resource practices conducive to
different search strategies.
Another area of research relates to the study of regulations in the
pharmaceutical industry and their effects on the success of drug development.
In September 2016 the FDA has extended a prior Act (FDAAA801) requiring
the submission of results of trials of unapproved products. If this disclosure
leads firms to have a better understanding of the reasons behind other firms’
prior failures, they may fail less in their subsequent drug development.
Legislation that stimulates the development of orphan drugs may also
influence the success rate in the pharmaceutical industry. Pammolli et al.,
(2011) highlight that since 1990 the R&D productivity in the pharmaceutical
industry has decreased. Future research focusing on the learning effects of
previous R&D efforts could assist in understanding this relative productivity
decline in order to inspire remediating policy instruments.
123
A last avenue for future research is triggered by the unexpected finding in
Chapter 2 that large firms are better at producing unconventional combinations
compared to small firms. Further research would contribute to the debate on
whether radical innovations are generated by large or small firms. Earlier
studies have suggested that young firms develop breakthrough innovations
(Henderson, 1993; Prusa & Schmitz, 1991). However, large firms are better at
diversifying risks and have greater scale and scope advantages. The results in
Chapter 2 go against this conventional view and call for further research
investigating the role of size and incumbency in the inventive search process.
Apart from organizational structure, further research may investigate whether
and how large firms leverage a diversified technological base to combine deep
competencies in core fields with knowledge from non-core fields. The debate
might benefit from moving beyond a mere distinction based on size and
incumbency and include a range of environmental factors that might drive
search outside extant paradigms.
The study discussed in Chapter 3 provides an interesting ground for future
research. Firms postpone or hold back more unconventional innovation during
downturns. However, they may also become more efficient in selecting the
most promising projects discontinuing those that have a lower value or that are
eventually more incremental. This would be an important aspect to consider
for the design and implementation of innovation policies. The study in Chapter
3 uses as proxy of impact the forwards citations. However, it would be
interesting to provide deeper insights about other measures of firms
performances (Tobin's Q ratio for example) in order to understand the
premium of firms that either don't cut back in R&D or un novelty. As common
practice in the literature, this study uses industry business cycle. Future works
may complement the analysis with macro level shocks.

124
Appendix A
Appendix to Chapter 2
A.1 Analytical derivation of the Unconventionality measure
Teece et al. (1994) developed measures of relatedness and coherence for the
diversification activities of firms. In the present study these measures are
adapted to describe the diversification patterns in the knowledge space
(Breschi et al., 2003; Nesta & Saviotti, 2005; Piscitello, 2005). Following
Teece et al. (1994), let 1ikC if invention k has membership in patent class i,
and 0 otherwise. The number of inventions with membership in class i is
k
iki Cn . It follows that the joint occurrence of each possible combination
of subclasses within the same patent over the whole universe of USPTO
patents granted in the previous five years is:
jk
k
ikijt CCJ (A.1)
where Jijt provides the number of inventions having simultaneously
membership in class i and class j. Raw counts of the number of inventions
having membership in each couple of patent classes, however, cannot be taken
directly as a measure of relatedness. Classes must be present at a rate greater
than what one would expect if combinations were made at random.
We first computed the conditional probability that a patent belongs to class
i given that it also belongs to class j, P(i|j)=Jij/nj where nj represents the
number of patents citing class j only. The main issue is that P(i|j) and P(j|i) are
not equal as ni is different from nj. The fact that ni≠nj implies that Jij increases
with the relatedness of i and j, but also with ni and nj, the number of inventions
having membership in each class of the couple determining potential
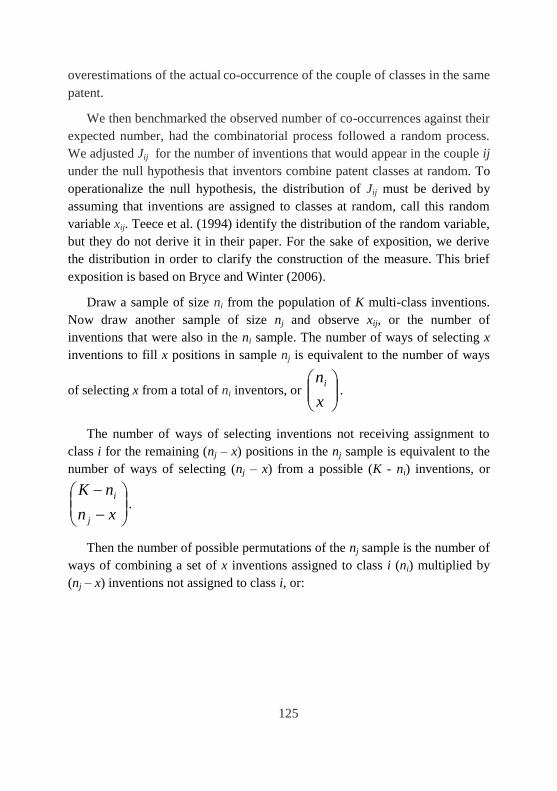
125
overestimations of the actual co-occurrence of the couple of classes in the same
patent.
We then benchmarked the observed number of co-occurrences against their
expected number, had the combinatorial process followed a random process.
We adjusted Jij for the number of inventions that would appear in the couple ij
under the null hypothesis that inventors combine patent classes at random. To
operationalize the null hypothesis, the distribution of Jij must be derived by
assuming that inventions are assigned to classes at random, call this random
variable xij. Teece et al. (1994) identify the distribution of the random variable,
but they do not derive it in their paper. For the sake of exposition, we derive
the distribution in order to clarify the construction of the measure. This brief
exposition is based on Bryce and Winter (2006).
Draw a sample of size ni from the population of K multi-class inventions.
Now draw another sample of size nj and observe xij, or the number of
inventions that were also in the ni sample. The number of ways of selecting x
inventions to fill x positions in sample nj is equivalent to the number of ways
of selecting x from a total of ni inventors, or
x
ni.
The number of ways of selecting inventions not receiving assignment to
class i for the remaining (nj – x) positions in the nj sample is equivalent to the
number of ways of selecting (nj – x) from a possible (K - ni) inventions, or
xn
nK
j
i.
Then the number of possible permutations of the nj sample is the number of
ways of combining a set of x inventions assigned to class i (ni) multiplied by
(nj – x) inventions not assigned to class i, or:

126
x
ni
xn
nK
j
i
42. (A.2)
The number of different samples of size nj that can be drawn from K is
jn
K
. The number of possible permutations of the nj sample divided by the
number of ways of choosing a sample of size nj is the probability that x
inventions from population K are assigned to both class i and class j. Thus, the
number xij of inventions having membership in both class i and class j is a
hypergeometric random variable with probability given by:
j
j
ii
ij
n
K
xn
nK
x
n
xXP (A.3)
whit mean43
:
K
nnXE
ji
ijij (A.4)
42 Since sample nj was fixed as the number of inventions in class j, inventions assigned to class i in this quantity are de facto also assigned to class j. 43 Since sample nj was fixed as the number of inventions in class j, inventions assigned to class i in
this quantity are de facto also assigned to class j. 43For intuition of the mean, assume that nj inventions in K have been assigned to class j. Now
randomly assign inventions in K to class i. The probability that any one invention receives a class i
assignment is K
ni
. Since there are nj inventions in K, each with probability K
ni
of being assigned
to class i, the expected number of inventions assigned to both class i and class j is
K
nn i
j
.

127
and variance:
112
K
nK
K
n ji
ijij (A.5)
The difference between Jij and the expected value of the random variable,
provides the basis for the final measure of conventionality in combinations:
ij
ijij
ij
J
(A.6)
where the difference between the observed and the expected occurrence of
the couple of classes (Jij-μij) is divided by the standard deviation of the
observed incidence. When this difference is positive and large, it indicates that
the combination of pairs of patent classes in multi-class inventions is
systematic, typical or conventional. Thus, large values of the difference are
associated to couple of classes-subclasses that are systematically recombined
together and over-represented in the sample, hence based on local search
strategies. On the other hand, small or even negative values of this difference
indicates that unexpectedly few inventions have successfully combined the
focal couple, suggesting that the combination thereof is not systematic,
unconventional or unconventional pointing to search strategies that connect
more distant pieces of knowledge.
From (A.5), we can derive the degree of conventionality of the patent z, az,
as the simple average of the measure τij for all combinations of technologies
(i,j) whose the patent has membership.
1
1 1
1 m
i
m
ij
ijzn
alityonventionaInventionC
, (A.7)
where n is the number of the patent’s subclass combinations and m is the
combination index. For instance, if a patent has four subclasses, then m is
equal to six, since this is the number of subclass combinations (4(4-1)/2).
Hence, m=1, …, 6. We transform this measure by adding its minimum value

128
and taking the natural log plus 1. We finally multiply this measure by (-1) so
that higher value are associated to novel combination of knowledge.
A.2 Conventionality across years and technologicies
Appendix A.2 details the Table 2.2 and Table 2.3 reported in Chapter 2. The
tables reported in this Appendix show the distribution of conventionality
across applications years for several technological categories. Consistently
with Table 2.2 in Chapter2, also these tables show a decrease in the level of
conventionality over time.
Table A.7 reports the summary statistics of conventionality distinguishing
for the frequency of combinations occurring at the level of all technologies
recombined within a single patent. This table shows that conventionality is
lower for combinations that are rarely recombined. The standard deviation
associated to technologies frequently recombined decrease with the use. This
summary statistics may suggest that combinations that rarely occur entail a
higher level of risk that decreases with usage.
Table A. 8 shows the average tau for the most representatives technologies
at dyadic level. In particular, it shows the average conventionality resulted
from the recombination of these technologies, i.e. Drug technology
recombined with communication has a conventionality of 14.5.

129
Table A.1: Conventionality over time in Drugs
appyear mean sd N
appyear mean sd N
1980 38.753 30.486 3,986
1991 29.026 23.425 7,941
1981 36.530 28.270 4,231
1992 28.884 22.047 9,138
1982 37.713 27.534 4,458
1993 32.727 28.661 10,872
1983 36.862 26.412 4,408
1994 35.249 31.244 14,850
1984 37.164 28.587 5,263
1995 39.507 35.379 22,989
1985 36.030 29.189 5,677
1996 24.365 20.976 13,921
1986 32.774 23.127 5,906
1997 29.615 26.635 17,417
1987 32.605 25.267 6,583
1998 26.697 22.937 16,844
1988 32.304 26.536 6,924
1999 28.439 24.967 19,220
1989 32.185 26.761 7,595
2000 32.275 29.086 20,569
1990 30.958 25.702 7,913
Tot 32.109 27.785 21,6705
Table A.2: Conventionality over time in Computer Hardware & Software
appyear mean sd N
appyear mean sd N
1980 60.131 40.057 2,618
1991 40.416 29.572 5,945
1981 57.551 39.645 2,884
1992 37.436 29.482 6,035
1982 58.140 43.561 3,059
1993 35.567 26.540 6,772
1983 51.605 39.039 2,888
1994 33.918 27.256 9,217
1984 52.560 39.474 3,232
1995 33.241 28.583 12,288
1985 51.014 38.060 3,282
1996 30.128 30.607 13,265
1986 48.342 35.540 3,594
1997 27.867 24.977 15,902
1987 48.471 33.889 4,318
1998 24.615 22.120 16,478
1988 46.880 33.607 4,973
1999 24.256 22.964 18,969
1989 45.810 32.123 5,213
2000 25.568 27.456 21,896
1990 42.732 31.091 5,816
Total 34.318 30.950 168,644

130
Table A.3: Conventionality over time in Information Storage
appyear mean sd N appyear mean sd N
1980 50.878 37.195 1,910 1991 32.309 25.716 4,368
1981 49.308 35.254 2,038 1992 30.170 19.811 4,422
1982 46.710 35.181 2,244 1993 29.949 24.235 4,921
1983 43.543 34.797 1,978 1994 29.591 21.331 6,554
1984 43.369 38.403 1,920 1995 29.646 22.626 7,530
1985 39.738 32.967 2,272 1996 30.217 28.030 8,700
1986 39.840 29.660 2,628 1997 29.704 25.545 11,433
1987 39.873 28.519 2,967 1998 26.188 29.630 10,792
1988 38.783 32.944 3,511 1999 25.628 27.936 11,444
1989 37.312 30.315 3,536 2000 27.177 34.519 12,564
1990 34.229 28.606 3,737 Total 31.759 29.479 111,469
Table A.4: Conventionality over time Semiconductors
appyear mean sd N appyear mean sd N
1980 45.314 26.277 1,269 1991 32.166 22.167 4,516
1981 47.253 28.401 1,104 1992 31.028 19.051 4,422
1982 45.261 26.849 1,182 1993 28.639 17.742 4,469
1983 43.166 22.153 1,385 1994 29.595 19.306 5,684
1984 44.217 28.556 1,638 1995 28.929 21.128 6,956
1985 42.037 23.944 1,665 1996 28.322 21.560 7,176
1986 41.281 23.610 1,812 1997 30.356 26.108 9,123
1987 42.830 29.11 2,300 1998 27.902 23.290 9,516
1988 40.805 25.218 3,212 1999 24.883 20.803 10,468
1989 35.891 20.227 3,488 2000 24.104 23.523 11,366
1990 32.721 19.249 3,963 Total 30.861 23.413 96,714

131
Table A.5: Conventionality over time in Material Processing & Handling
Table A.6. Conventionality over time inMaterial Processing & Handling
appyear mean sd N appyear mean sd N
1980 51.117 37.185 5,983 1991 46.005 37.927 7,533
1981 51.617 38.252 5,515 1992 45.935 39.840 7,247
1982 51.392 38.417 5,452 1993 46.337 39.869 6,909
1983 50.969 38.016 5,330 1994 48.794 40.848 7,148
1984 52.898 39.417 5,559 1995 49.858 43.519 7,294
1985 51.990 38.900 6,201 1996 52.338 43.796 7,360
1986 49.709 37.231 6,220 1997 55.185 47.758 8,294
1987 50.164 39.351 6,326 1998 54.303 49.084 7,759
1988 47.881 37.377 6,926 1999 54.740 48.461 8,373
1989 47.395 37.147 7,220 2000 55.632 53.123 8,607
1990 45.250 34.312 7,238 Total 50.522 41.838 144,494
Table A.6: Conventionality over time in Communications
appyear mean sd N appyear mean sd N
1980 54.019 40.681 3,677 1991 38.350 28.650 7,310
1981 51.662 38.905 3,714 1992 36.604 27.544 7,696
1982 51.394 38.157 3,753 1993 35.398 26.485 8,229
1983 50.589 37.698 3,648 1994 33.889 27.291 10,563
1984 48.161 35.214 3,836 1995 32.073 26.737 12,876
1985 47.243 35.680 4,349 1996 30.026 25.499 14,737
1986 47.344 37.834 4,588 1997 28.506 25.491 17,944
1987 45.080 32.525 5,014 1998 26.562 24.877 19,054
1988 44.198 34.240 5,638 1999 27.443 27.260 21,282
1989 42.279 32.010 6,521 2000 28.570 31.718 23,108
1990 40.139 29.127 6,854 Total 34.621 30.684 194,391

132
Table A.7: Summary statistics of Conventionality distinguishing for the frequency
of combinations occurring at the couple level
Frequency N Mean Std. Dev. Min Max
≤ 5 29,190,002 44.08 62.355 -5.968 993.33
> 5 17,765,275 47.027 51.971 -5.398 993.33
This table shows that the average Conventionality is lower for combinations that are rarely
recombined together.

133
Table A.8: Distribution of Conventionality for the combination between the most representative technologies
Tecnology definition 1 2 3 4 5 6 7 8 9 10 11
1 Agriculture, Food,
Textiles 71.729 35.792 39.788 66.888 73.050 32.064 32.403 69.597 36.485 53.205 40.174 47.309
2 Organic Compounds 35.792 40.585 28.477 21.569 17.502 24.988 28.971 36.551 28.785 38.212 37.951 47.373
3 Resins 39.788 28.477 37.335 16.681 23.699 17.857 27.226 28.436 30.202 27.272 19.411 27.727
4 Communications 66.888 21.569 16.681 45.930 20.839 20.591 14.553 36.345 26.501 32.284 22.089 34.621
5 Computer Hardware
& Software 73.050 17.502 23.699 20.839 34.854 17.181 16.628 30.112 27.921 42.513 18.227 34.318
6 Computer Peripherals 32.064 24.988 17.857 20.591 17.181 38.132 15.955 19.744 22.695 17.269 17.706 30.584
7 Drugs 32.403 28.971 27.226 14.553 16.628 15.955 35.894 36.560 15.634 18.347 18.494 32.109
8 Electrical Devices 69.597 36.551 28.436 36.345 30.112 19.744 36.560 61.261 36.716 37.674 27.971 44.266
9 Nuclear & X-rays 36.485 28.785 30.202 26.501 27.921 22.695 15.634 36.716 68.781 40.754 25.165 37.891
10 Power Systems 53.205 38.212 27.272 32.284 42.513 17.269 18.347 37.674 40.754 59.110 25.435 41.244
11 Semiconductor
Devices 40.174 37.951 19.411 22.089 18.227 17.706 18.494 27.971 25.165 25.435 34.774 30.861
47.309 47.373 27.727 34.621 34.318 30.584 32.109 44.266 37.891 41.244 30.861
Note: in contrast with Table 2.1 and 2.2, this table shows the average Conventionality for the combination occurring among the most
representative technologies taking a coupling perspective which is the base for the construction of the measure.
Lowest Conventionality among the combination of technologies are n bold. The last column and row report the average at the invention level.

134
Appendix B
Appendix to Chapter 3
Appendix B: Additional analysis at firm level
Appendix B reports extra analysis at the level of the firm. Tables B.1 and B.2
show the trend in unconventionality at different lags of Real Output.
Table B.3 reports the estimators at the firm level of overall patent production.
In Table B.4 and B.5 we focus on the patent production by differentiating
between low and high financially constrained firms.
Table B.6 reports the estimations for the weighted unconventionality. This set
of analysis has the objective to differentiate between intensive and extensive
margins. Also in this set of analysis we differentiate between low and high
financially constraints (Table B.8) and identify also firms that retrench from
local search in innovation through a cut in R&D Table (B.7).
Table B indicates a cut in patent production during the contractive phases of
the cycle (-0.262%). Table B.7 shows that firm that cut in R&D may have a
different sensitivity to the contractive period of the cycle. Table B.6 details the
finding based on patent level analysis suggesting that the decrease in
unconventionality is not due to a general decline at the extensive margins but
also at the intensive.

135
Table B.1: Estimations for technological search over the business cycle. OLS models for the degree of Unconventionality
Model 1 Model 2 Model 3 Model 4 Model 5 Model 6
Real Output 0.0855*** 0.0896*** 0.0865*** 0.0899*** (0.0031) (0.0032) (0.0031) (0.0032)
Expansion 0.0165 -0.8865*** -0.7923***
(0.1461) (0.1492) (0.1522) Contraction 0.8487** 1.6078*** 1.2091***
(0.3791) (0.3793) (0.3869)
Citations -0.0103*** -0.0101*** -0.0101*** -0.0103*** -0.0103*** -0.0103*** (0.0018) (0.0018) (0.0018) (0.0018) (0.0018) (0.0018)
no Bwd Cits -0.0171 0.0201 0.0199 -0.0173 -0.0180 -0.0179
(0.0164) (0.0163) (0.0163) (0.0164) (0.0164) (0.0164) Components 0.2182*** 0.2182*** 0.2182*** 0.2182*** 0.2182*** 0.2182***
(0.0027) (0.0027) (0.0027) (0.0027) (0.0027) (0.0027)
Team -0.0031*** -0.0045*** -0.0045*** -0.0031*** -0.0031*** -0.0030***
(0.0010) (0.0010) (0.0010) (0.0010) (0.0010) (0.0010)
Experience 0.0000 0.0001 0.0001 -0.0000 0.0000 -0.0000
(0.0001) (0.0001) (0.0001) (0.0001) (0.0001) (0.0001) Concentration -0.1675*** -0.2139*** -0.2144*** -0.1715*** -0.1675*** -0.1711***
(0.0358) (0.0359) (0.0359) (0.0358) (0.0358) (0.0358)
Assignee Size 0.0007 0.0184*** 0.0182*** 0.0005 0.0002 0.0002 (0.0023) (0.0022) (0.0022) (0.0023) (0.0023) (0.0023)
Constant -4.8803*** -4.0632*** -4.0622*** -4.9167*** -4.8876*** -4.9184***
(0.0894) (0.0844) (0.0844) (0.0896) (0.0894) (0.0896)
N 166168 166168 166168 166168 166168 166168 R2 0.1728 0.1690 0.1690 0.1730 0.1729 0.1730
Standard errors in parenthes* p < 0.1, ** p < 0.05, *** p < 0.01
The models report the results of the Ordinary Least Square on the median value of the degree of novelty in patents. Models include 20 year, 36 technology
and sector dummies. Models also include controls (dummies) for missing information about backward citations. All models include firm fixed effects.
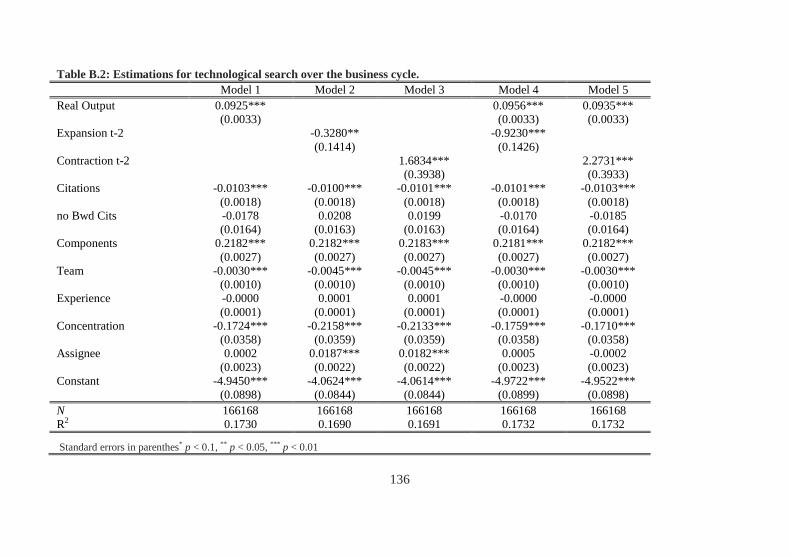
136
Table B.2: Estimations for technological search over the business cycle.
Model 1 Model 2 Model 3 Model 4 Model 5
Real Output 0.0925*** 0.0956*** 0.0935***
(0.0033) (0.0033) (0.0033)
Expansion t-2 -0.3280** -0.9230***
(0.1414) (0.1426)
Contraction t-2 1.6834*** 2.2731***
(0.3938) (0.3933)
Citations -0.0103*** -0.0100*** -0.0101*** -0.0101*** -0.0103***
(0.0018) (0.0018) (0.0018) (0.0018) (0.0018)
no Bwd Cits -0.0178 0.0208 0.0199 -0.0170 -0.0185
(0.0164) (0.0163) (0.0163) (0.0164) (0.0164)
Components 0.2182*** 0.2182*** 0.2183*** 0.2181*** 0.2182***
(0.0027) (0.0027) (0.0027) (0.0027) (0.0027)
Team -0.0030*** -0.0045*** -0.0045*** -0.0030*** -0.0030***
(0.0010) (0.0010) (0.0010) (0.0010) (0.0010)
Experience -0.0000 0.0001 0.0001 -0.0000 -0.0000
(0.0001) (0.0001) (0.0001) (0.0001) (0.0001)
Concentration -0.1724*** -0.2158*** -0.2133*** -0.1759*** -0.1710***
(0.0358) (0.0359) (0.0359) (0.0358) (0.0358)
Assignee 0.0002 0.0187*** 0.0182*** 0.0005 -0.0002
(0.0023) (0.0022) (0.0022) (0.0023) (0.0023)
Constant -4.9450*** -4.0624*** -4.0614*** -4.9722*** -4.9522***
(0.0898) (0.0844) (0.0844) (0.0899) (0.0898)
N 166168 166168 166168 166168 166168
R2 0.1730 0.1690 0.1691 0.1732 0.1732
Standard errors in parenthes* p < 0.1, ** p < 0.05, *** p < 0.01

137
Table B.3 : Estimations for Patent Production over the business cycle.
Model 1 Model 2 Model 3
ln_pat ln_pat ln_pat
Real Output 0.2979*** 0.3015*** 0.2984***
(0.0200) (0.0196) (0.0200)
Expansion 0.2108 0.6397
(0.7732) (0.8024)
Contraction 2.8418* 3.1839**
(1.5399) (1.5986)
Concentration -0.6384*** -0.6360*** -0.6371***
(0.0649) (0.0649) (0.0649)
R&D Intensity 0.0001 0.0001 0.0001
(0.0001) (0.0001) (0.0001)
No R&D Intensity 0.1370* 0.1327* 0.1314
(0.0804) (0.0804) (0.0804)
Size 0.6914*** 0.6931*** 0.6932***
(0.0323) (0.0323) (0.0323)
KZ 0.0244 0.0252 0.0250
(0.0205) (0.0205) (0.0205)
Cons -3.5944*** -3.6327*** -3.6062***
(0.2727) (0.2706) (0.2727)
N 6080 6080 6080
R2 0.8616 0.8617 0.8617
Standard errors in parentheses; * p<0.1, ** p<0.05, *** p<0.01
The models report the results of the OLS on the natural logarithm of the patent count by
firm and Year. Models include 20 year and sector dummies including also controls
(dummies) for missing information on the number of employees, sales and R&D. Standard
errors are clustered by firm. This analysis is built on the same dataset used in the main set
of regressions but the observations have been now collapsed by firm and Year. Drawing
on Fabrizio and Tsolmon (2014) we use the Ln Real Output at time t and t-1. Results show
a pro-cyclical trend.

138
Table B.4: Estimations for patent production based on R&D cut.
Cut in R&D Non Cut in R&D
Model 1 Model 2
ln_pat ln_pat
Real Output 0.4015*** 0.2700***
(0.0378) (0.0247)
Expansion -0.6989 1.5572
(1.3076) (1.0321)
Contraction 3.8692* 2.1455
(1.9827) (2.8301)
Concentration -0.7114*** -0.6107***
(0.1089) (0.0812)
R&D Intensity -0.0000 0.0001
(0.0003) (0.0001)
No R&D Intensity 0.3023*** -0.0284
(0.1164) (0.1124)
Size 0.7065*** 0.7042***
(0.0480) (0.0449)
KZ 0.0454 0.0012
(0.0305) (0.0280)
Constant -3.0960*** -3.3312***
(0.4563) (0.3178)
N 2567 3513
R2 0.8666 0.8566
Standard errors in parentheses; * p<0.1, ** p<0.05, *** p<0.01
The models report the results of the OLS on the natural logarithm of the patent
count by firm and Year. Models include 20 year and sector dummies including
also controls (dummies) for missing information on the number of employees,
sales and R&D. Standard errors are clustered by firm. Drawing on Fabrizio and
Tsolmon (2014) we use the Ln Real Output at time t and t-1. Results show a pro-
cyclical trend.
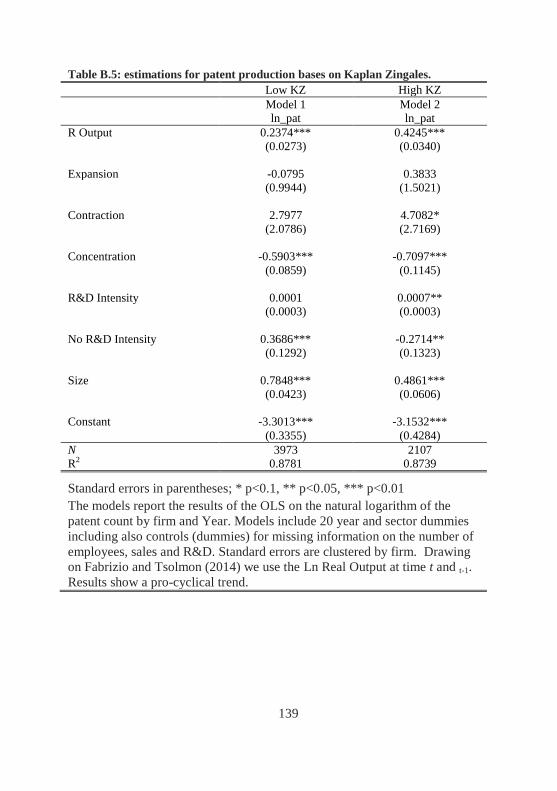
139
Table B.5: estimations for patent production bases on Kaplan Zingales.
Low KZ High KZ
Model 1 Model 2
ln_pat ln_pat
R Output 0.2374*** 0.4245***
(0.0273) (0.0340)
Expansion -0.0795 0.3833
(0.9944) (1.5021)
Contraction 2.7977 4.7082*
(2.0786) (2.7169)
Concentration -0.5903*** -0.7097***
(0.0859) (0.1145)
R&D Intensity 0.0001 0.0007**
(0.0003) (0.0003)
No R&D Intensity 0.3686*** -0.2714**
(0.1292) (0.1323)
Size 0.7848*** 0.4861***
(0.0423) (0.0606)
Constant -3.3013*** -3.1532***
(0.3355) (0.4284)
N 3973 2107
R2 0.8781 0.8739
Standard errors in parentheses; * p<0.1, ** p<0.05, *** p<0.01
The models report the results of the OLS on the natural logarithm of the
patent count by firm and Year. Models include 20 year and sector dummies
including also controls (dummies) for missing information on the number of
employees, sales and R&D. Standard errors are clustered by firm. Drawing
on Fabrizio and Tsolmon (2014) we use the Ln Real Output at time t and t-1.
Results show a pro-cyclical trend.

140
Table B.6: Estimation for the weighted conventionality.
Model 1 Model 2 Model 3
Real Output 0.3351*** 0.3351*** 0.3354***
(0.0252) (0.0247) (0.0252)
Expansion -0.4312 -0.0615
(0.9728) (1.0098)
Contraction 2.7773 2.7444
(1.9379) (2.0119)
Concentration -0.9587*** -0.9577*** -0.9575***
(0.0817) (0.0817) (0.0817)
R&D Intensity 0.0001 0.0001 0.0001
(0.0001) (0.0001) (0.0001)
No R&D Intensity 0.1538 0.1488 0.1489
(0.1011) (0.1012) (0.1012)
Size 0.7575*** 0.7590*** 0.7590***
(0.0406) (0.0406) (0.0406)
KZ 0.0335 0.0340 0.0340
(0.0259) (0.0258) (0.0259)
Constant -5.7054*** -5.7130*** -5.7156***
(0.3432) (0.3406) (0.3432)
N 6080 6080 6080
R2 0.8417 0.8418 0.8418
Standard errors in parentheses; * p<0.1, ** p<0.05, *** p<0.01
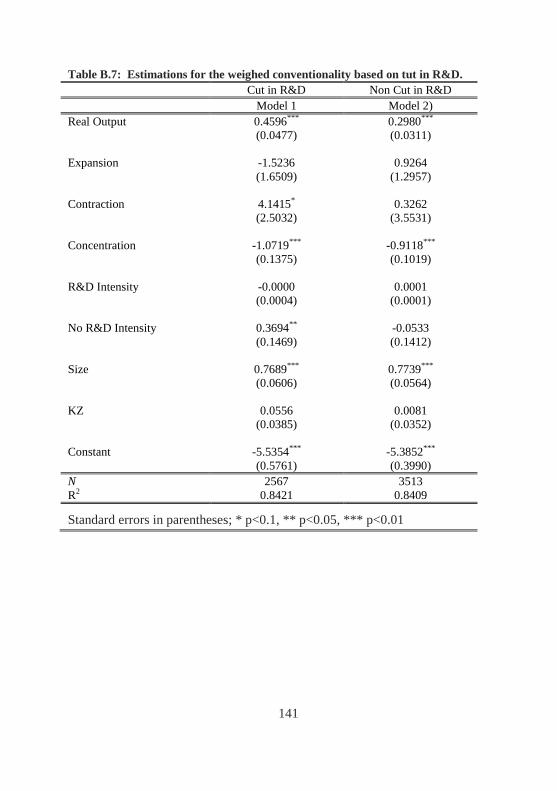
141
Table B.7: Estimations for the weighed conventionality based on tut in R&D.
Cut in R&D Non Cut in R&D
Model 1 Model 2)
Real Output 0.4596*** 0.2980***
(0.0477) (0.0311)
Expansion -1.5236 0.9264
(1.6509) (1.2957)
Contraction 4.1415* 0.3262
(2.5032) (3.5531)
Concentration -1.0719*** -0.9118***
(0.1375) (0.1019)
R&D Intensity -0.0000 0.0001
(0.0004) (0.0001)
No R&D Intensity 0.3694** -0.0533
(0.1469) (0.1412)
Size 0.7689*** 0.7739***
(0.0606) (0.0564)
KZ 0.0556 0.0081
(0.0385) (0.0352)
Constant -5.5354*** -5.3852***
(0.5761) (0.3990)
N 2567 3513
R2 0.8421 0.8409
Standard errors in parentheses; * p<0.1, ** p<0.05, *** p<0.01
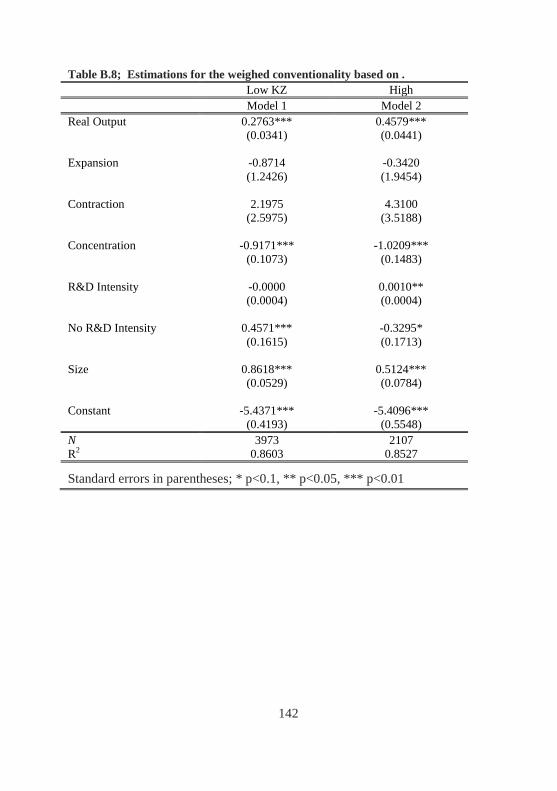
142
Table B.8; Estimations for the weighed conventionality based on .
Low KZ High
Model 1 Model 2
Real Output 0.2763*** 0.4579***
(0.0341) (0.0441)
Expansion -0.8714 -0.3420
(1.2426) (1.9454)
Contraction 2.1975 4.3100
(2.5975) (3.5188)
Concentration -0.9171*** -1.0209***
(0.1073) (0.1483)
R&D Intensity -0.0000 0.0010**
(0.0004) (0.0004)
No R&D Intensity 0.4571*** -0.3295*
(0.1615) (0.1713)
Size 0.8618*** 0.5124***
(0.0529) (0.0784)
Constant -5.4371*** -5.4096***
(0.4193) (0.5548)
N 3973 2107
R2 0.8603 0.8527
Standard errors in parentheses; * p<0.1, ** p<0.05, *** p<0.01

143
Appendix C
Appendix to Chapter 4
This section presents additional regression tables that validate the findings
discussed in Chapter 4 and rule out alternative explanations.
Table C.1 uses the same model specification of Table 4.10 but includes
firm dummies in order to exclude potential trends at the level of the firm. This
specification was not preferred as our base model because the inclusion of firm
fixed effects leads to the necessary omission of firms with only one project in
the sample. The number of observations drops by about 1000. The results on
the learning variables are consistent with findings reported in Chapter 4. All in
all, citing previous failure (Self and Non Self) increases the incidence of
failure with the coefficient of Self being larger. A contrasting pattern is shown
for building further on previous Success. The coefficient of citing others’
success and failure and ongoing projects, significant at p<0.1 in Table 4.10 is
not significant when we include firm dummies.
Table C.2 uses the same specification of Table 4.11 with the inclusion of
timing restriction on the citation patterns. Overall results are consistent with
what shown in Table 4.11 although with smaller coefficients and lack of
significance for the variables of citing previous ongoing projects.
Table C.3 provides insights into the effects of the reuse of the same patent
on the likelihood of success. In this model specification learning derive from
previous R&D projects and from prior started same-patent projects (set of
dummies for Prior Self/Non Self with same Family). We also include a control
for the number of projects sharing the same patent that are initiated
simultaneously Num. Sim. Projs. Overall the results are consistent with
learning generated from building on previous projects only. In particular Self
Failure and Self Ongoing in prior same family reduce the chances of success of
the focal projects. Prior Success in the same Family instead increase the
likelihood of success especially for prior Success by other firms. The

144
coefficients for prior failures by other firms is statistically significant and is
positively associated with success of the focal projects.
Table C.4 uses the same specification of Table C.3 but the independent
variables are built on the restricted version that, for the set of independent
variables of focal building on previous projects, doesn't consider the links to
previous projects terminated after the focal. These cases are captured by the
dummy "focal terminated before cited". Also the restricted models give to an
important extent similar results for prior projects using the same family. These
results emphasize that building on multiple patents having similar
characteristics reduces the likelihood of success. This patterns may also
suggest that firms may use previous similar patents to reduce costs.
Table C.5 reports results of a multinomial logit model that includes the
category of ongoing project in the dependent variable. In particular, our
dependent variable includes the following categories: Success and Failures as
defined in Section 4.3 and Ongoing projects. For Ongoing project we note that
31.63% of these projects didn't reported any update regarding the development
process for more than 10 years. Hence, we also treat the different ongoing
projects separately by making a distinction between real ongoing projects
(11.32%), reporting a recent update on status, and Suspicious ongoing whose
last update on the development phase is before 1995. Results show that for the
Success category, showed in the last column, the incidence of success is driven
by building on previous success (self/Non Self) while failures decrease this
incidence. The coefficients have similar magnitude to those showed in our
baseline logit models.
Table C.6 reports the frequencies in the three models that are used in the
supplementary regression analysis reported in Table C.7. This set of
regressions employs several different timing of citations patterns to ensure
robustness of inferences to different time window and to check possible
variations and different learning mechanisms.
In particular, as shown in Figure C.1, in Model 1 we consider the citations
to projects that have reached their outcome before the starting date of the focal
project. In Model 2 the focal project starts before the outcome date of the cited
project but ends after, whereas in Model 3 the focal project starts and reaches
its final status before the outcome date of the cited. Since a focal project can

145
cite multiple related projects the inclusion of the focal in one of the timing
restriction is not exclusive. As it is possible to note the likelihood of success
from building on previous related success increase in Model 1 when the focal
project relies on at least one related projects that has been marketed, knowing
in this way the final outcome before starting the experimentation. Also citing
previous failure (Self/Non Self) has a smaller negative coefficient in Model 1
compared to Model 3.
In non reported analysis, we also account for potential learning from
collaboration with other firms by controlling for potential other firms
(licensors and licensees) involved in the project. Results for the main variable
of interest remain, while the involvement of other firms increased the
likelihood of success in line with prior studies stressing the role of alliances in
increasing the probability of project success (Danzon et al., 2005; Hoang et al.,
2010).
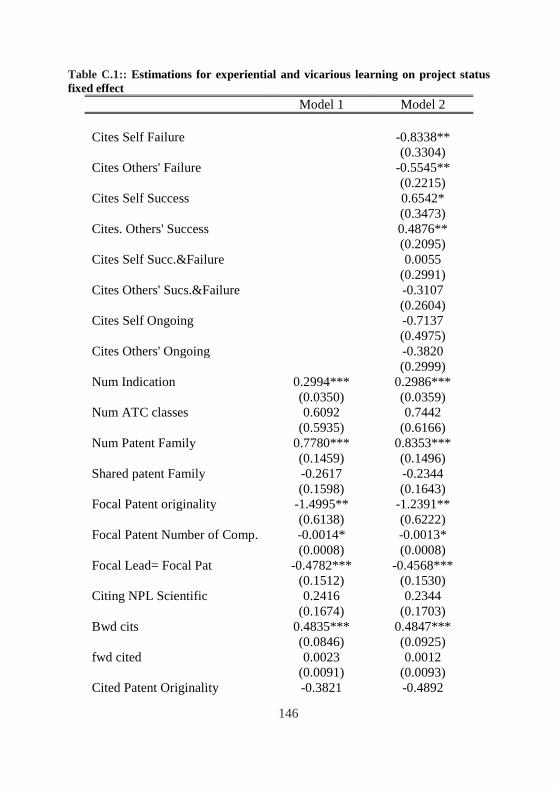
146
Table C.1:: Estimations for experiential and vicarious learning on project status
fixed effect
Model 1 Model 2
Cites Self Failure -0.8338**
(0.3304)
Cites Others' Failure -0.5545**
(0.2215)
Cites Self Success 0.6542*
(0.3473)
Cites. Others' Success 0.4876**
(0.2095)
Cites Self Succ.&Failure 0.0055
(0.2991)
Cites Others' Sucs.&Failure -0.3107
(0.2604)
Cites Self Ongoing -0.7137
(0.4975)
Cites Others' Ongoing -0.3820
(0.2999)
Num Indication 0.2994*** 0.2986***
(0.0350) (0.0359)
Num ATC classes 0.6092 0.7442
(0.5935) (0.6166)
Num Patent Family 0.7780*** 0.8353***
(0.1459) (0.1496)
Shared patent Family -0.2617 -0.2344
(0.1598) (0.1643)
Focal Patent originality -1.4995** -1.2391**
(0.6138) (0.6222)
Focal Patent Number of Comp. -0.0014* -0.0013*
(0.0008) (0.0008)
Focal Lead= Focal Pat -0.4782*** -0.4568***
(0.1512) (0.1530)
Citing NPL Scientific 0.2416 0.2344
(0.1674) (0.1703)
Bwd cits 0.4835*** 0.4847***
(0.0846) (0.0925)
fwd cited 0.0023 0.0012
(0.0091) (0.0093)
Cited Patent Originality -0.3821 -0.4892

147
(0.6824) (0.6874)
Num. Comp. of cited Patent
-0.0010
0.0000
(0.0018) (0.0019)
Focal Lead-Cited Patent 0.1876 0.4042
(0.2120) (0.2524)
Same ATC focal-cited 0.2982** 0.3246*
(0.1366) (0.1729)
Succ in ATC 1.5248*** 1.3410***
(0.3551) (0.3663)
R&D competition in ATC -0.0071 0.0245
(0.0741) (0.0752)
Failure Ratio 3.2947*** 3.3365***
(0.5355) (0.5411)
Breadth of firm activities 5.7370 6.2945
(18.1048) (18.0917)
Constant -4.0579 -4.9941
(15.4220) (15.4074)
Observations 2721 2721
Pseudo R2 0.4163 0.4286
log Lik. -1058.8472 -1036.5508
Chi squared 1510.4974 1555.0901
Standard errors in parentheses; * p<0.1, ** p<0.05, *** p<0.01
Logit model for Success and Failures. Models include 25 year, 87
ATC classes and Firm dummies.

148
Table C.2: Estimations for experiential and vicarious learning on project status
fixed effect. Time restriction.
Model 1 Model 2
Cites Self Failure -0.6571*
(0.3462)
Cites Others' Failure -0.2636
(0.2357)
Cites Self Success 1.3381***
(0.4533)
Cites. Others' Success 0.7567***
(0.2373)
Cites Self Success and
Failure
0.2692
(0.3136)
Cites Others' Success and
Failure
-0.1553
(0.2747)
Cites Self Ongoing -0.5849
(0.4998)
Cites Others' Ongoing -0.2340
(0.3099)
Project before cited outcome -1.1175*** -1.0284***
(0.2212) (0.2600)
Num Indication 0.2966*** 0.2961***
(0.0349) (0.0356)
Num ATC classes 0.4833 0.5903
(0.5887) (0.6073)
Num Patent Family 0.7676*** 0.7930***
(0.1465) (0.1491)
Shared patent Family -0.2702* -0.2958*
(0.1615) (0.1663)
Focal Patent originality -1.4609** -1.2494**
(0.6140) (0.6212)
Focal Patent Number of
Comp.
-0.0013* -0.0013
(0.0008) (0.0008)
Focal Lead=Focal Pat -0.4795*** -0.4428***
(0.1529) (0.1548)
Citing NPL Scientific 0.2078 0.1859
(0.1688) (0.1707)
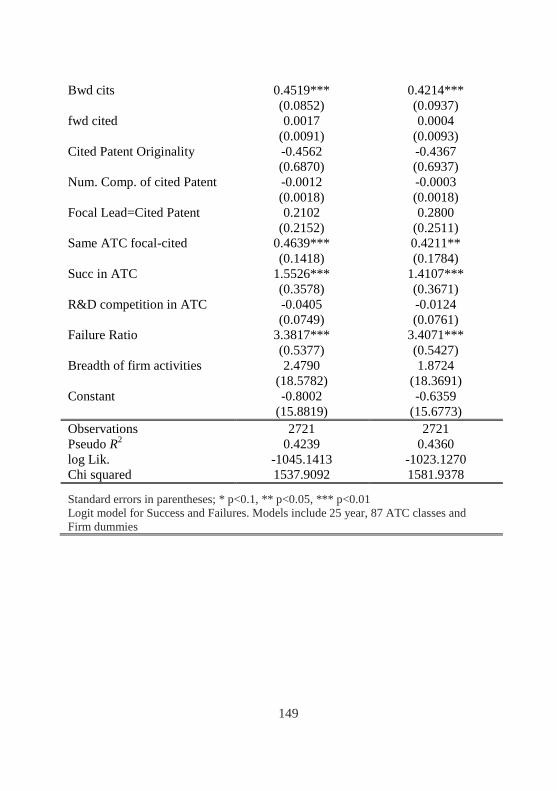
149
Bwd cits
0.4519***
0.4214***
(0.0852) (0.0937)
fwd cited 0.0017 0.0004
(0.0091) (0.0093)
Cited Patent Originality -0.4562 -0.4367
(0.6870) (0.6937)
Num. Comp. of cited Patent -0.0012 -0.0003
(0.0018) (0.0018)
Focal Lead=Cited Patent 0.2102 0.2800
(0.2152) (0.2511)
Same ATC focal-cited 0.4639*** 0.4211**
(0.1418) (0.1784)
Succ in ATC 1.5526*** 1.4107***
(0.3578) (0.3671)
R&D competition in ATC -0.0405 -0.0124
(0.0749) (0.0761)
Failure Ratio 3.3817*** 3.4071***
(0.5377) (0.5427)
Breadth of firm activities 2.4790 1.8724
(18.5782) (18.3691)
Constant -0.8002 -0.6359
(15.8819) (15.6773)
Observations 2721 2721
Pseudo R2 0.4239 0.4360
log Lik. -1045.1413 -1023.1270
Chi squared 1537.9092 1581.9378
Standard errors in parentheses; * p<0.1, ** p<0.05, *** p<0.01
Logit model for Success and Failures. Models include 25 year, 87 ATC classes and
Firm dummies

150
Table C.3:: : Estimations for experiential and vicarious learning on project status.
PATENT REUSE
Model 1 Model
Cites Self Failure -0.6007**
(0.2620)
Cites Others' Failure -0.4933**
(0.2006)
Cites Self Success 1.0581***
(0.2504)
Cites. Others' Success 0.3006*
(0.1716)
Cites Self Succ.&Failure 0.2686
(0.2494)
Cites Others' Succ. & Failure -0.3530
(0.2185)
Cites Self Ongoing -0.6985**
(0.3478)
Cites Others' Ongoing -0.4236*
(0.2378)
Prior Self Fail Same Fam -0.4258
(0.3558)
Prior No Self Fail Same Fam 0.7721**
(0.3630)
Prior Self Succ Same Fam 1.2523**
(0.6258)
Prior No Self Succ Same
Fam
1.8612***
(0.5124)
Prior Self Ong.Same Fam -0.8870**
(0.4171)
Prior No Self Ong. Same
Fam
0.9178**
(0.3960)
Num Sim Proj -0.8801*** -1.1482***
(0.2609) (0.2517)
Num Indication 0.2624*** 0.2551***
(0.0262) (0.0258)
Num ATC classes 0.9589** 1.0174**
(0.4711) (0.4864)
Num Patent Family 0.6257*** 0.6395***

151
(0.1446) (0.1423)
Shared patent Family -0.3987** -0.5978***
(0.1611) (0.2104)
Focal Patent originality -1.7542*** -1.3435***
(0.4453) (0.4327)
Focal Patent Number of
Comp.
-0.0006 -0.0005
(0.0006) (0.0006)
Focal Lead=Focal Pat -0.6130*** -0.5380***
(0.1450) (0.1446)
Citing NPL Scientific 0.0996 0.1023
(0.1157) (0.1191)
Bwd cits 0.4230*** 0.3973***
(0.0609) (0.0685)
fwd cited 0.0021 0.0017
(0.0059) (0.0059)
Cited Patent Originality 0.2571 0.1690
(0.4833) (0.4784)
Num. Comp. of cited Patent 0.0004 0.0012
(0.0016) (0.0015)
Focal Lead= Cited Patent 0.0620 0.0767
(0.1840) (0.2129)
Same ATC focal-cited 0.3731*** 0.4062***
(0.1016) (0.1228)
Succ in ATC 1.2555*** 1.1719***
(0.2598) (0.2862)
R&D competition in ATC -0.0761 -0.0407
(0.0645) (0.0655)
Failure Ratio -1.0135*** -1.0434***
(0.2301) (0.2311)
Breadth of firm activities 0.7932** 0.7906**
(0.3368) (0.3353)
Constant -1.8176** -2.2249***
(0.7736) (0.7634)
Observations 3568 3568
Pseudo R2 0.3304 0.3549
log Lik. -1585.1867 -1527.2433
Chi squared 2036.1545 2174.7218
Standard errors in parentheses; * p<0.1, ** p<0.05, *** p<0.01. Logit model for Success
and Failures. Models include 25 year, 87 ATC classes and Firm dummies
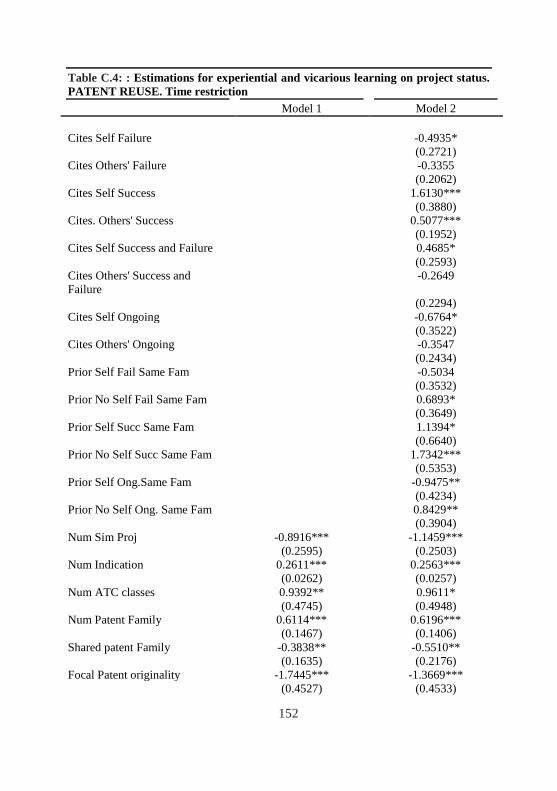
152
Table C.4: : Estimations for experiential and vicarious learning on project status.
PATENT REUSE. Time restriction
Model 1 Model 2
Cites Self Failure -0.4935*
(0.2721)
Cites Others' Failure -0.3355
(0.2062)
Cites Self Success 1.6130***
(0.3880)
Cites. Others' Success 0.5077***
(0.1952)
Cites Self Success and Failure 0.4685*
(0.2593)
Cites Others' Success and
Failure
-0.2649
(0.2294)
Cites Self Ongoing -0.6764*
(0.3522)
Cites Others' Ongoing -0.3547
(0.2434)
Prior Self Fail Same Fam -0.5034
(0.3532)
Prior No Self Fail Same Fam 0.6893*
(0.3649)
Prior Self Succ Same Fam 1.1394*
(0.6640)
Prior No Self Succ Same Fam 1.7342***
(0.5353)
Prior Self Ong.Same Fam -0.9475**
(0.4234)
Prior No Self Ong. Same Fam 0.8429**
(0.3904)
Num Sim Proj -0.8916*** -1.1459***
(0.2595) (0.2503)
Num Indication 0.2611*** 0.2563***
(0.0262) (0.0257)
Num ATC classes 0.9392** 0.9611*
(0.4745) (0.4948)
Num Patent Family 0.6114*** 0.6196***
(0.1467) (0.1406)
Shared patent Family -0.3838** -0.5510**
(0.1635) (0.2176)
Focal Patent originality -1.7445*** -1.3669***
(0.4527) (0.4533)

153
Focal Patent Number of Comp. -0.0006 -0.0004
(0.0006) (0.0006)
Focal Lead=Focal Pat -0.6335*** -0.5565***
(0.1434) (0.1435)
Citing NPL Scientific 0.0786 0.0797
(0.1173) (0.1175)
Bwd cits 0.3987*** 0.3493***
(0.0615) (0.0671)
fwd cited 0.0018 0.0010
(0.0061) (0.0058)
Cited Patent Originality 0.2854 0.2219
(0.4796) (0.4789)
Num. Comp. of cited Patent 0.0002 0.0009
(0.0015) (0.0015)
Same Company Lead-Patent 0.0776 0.0177
(0.1799) (0.2098)
Same ATC focal-cited 0.5030*** 0.4925***
(0.1116) (0.1324)
Succ in ATC 1.2748*** 1.2315***
(0.2713) (0.2919)
R&D competition in ATC -0.0921 -0.0585
(0.0656) (0.0665)
Failure Ratio -0.9972*** -1.0176***
(0.2292) (0.2294)
Breadth of firm activities 0.8026** 0.7760**
(0.3367) (0.3333)
Project before cited outcome -0.8727*** -0.7763***
(0.1574) (0.1928)
Constant -1.6786** -2.0898***
(0.7874) (0.7881)
Observations 3568 3568
Pseudo R2 0.3360 0.3603
log Lik. -1571.9455 -1514.5365
Chi squared 2013.0377 2071.2262
Standard errors in parentheses; * p<0.1, ** p<0.05, *** p<0.01. Logit model for Success
and Failures. Models include 25 year, 87 ATC classes and Firm dummies

154
Table C.5: : Multinomial Logit
Model 1 Model 2 Model 3 Self Failure -0.4416** -0.6190** -0.7297***
(0.2235) (0.2834) (0.2509) Others' Failure 0.1888* 0.2776* -0.4969***
(0.1067) (0.1625) (0.1830)
Self Success 0.1236 0.2913 1.0141*** (0.3194) (0.3477) (0.2438)
Others' Success 0.1165 0.0029 0.3329**
(0.1335) (0.1956) (0.1596) Self Succ.&Fail 0.0417 -0.3501 0.0259
(0.2522) (0.3614) (0.2687)
Others' Succ.&Fail
-0.0888 0.0776 -0.3141
(0.1847) (0.2164) (0.1958)
Self Ongoing 0.9029*** 0.4039 -0.8348** (0.2686) (0.3619) (0.3744)
Others' Ongoing 0.0472 0.1603 -0.4045*
(0.1513) (0.2055) (0.2198) Num Indication -0.1619*** -0.1632*** 0.1013*** 0.1031*** 0.2573*** 0.2537***
(0.0268) (0.0273) (0.0266) (0.0269) (0.0262) (0.0263)
Num ATC classes
0.4753 0.5059 1.1707** 1.1827* 0.8493** 0.8947**
(0.5890) (0.5848) (0.5958) (0.6162) (0.4127) (0.4166)
Num Patent Family
-0.3210* -0.3156* 0.8092*** 0.8200*** 0.5521*** 0.5875***
(0.1681) (0.1673) (0.1515) (0.1508) (0.1393) (0.1372) Shared patent
Family
0.3963*** 0.4040*** -0.2127 -0.1801 -0.6151*** -0.5837***
(0.0935) (0.0929) (0.1566) (0.1616) (0.1532) (0.1455) Focal Patent
originality
-0.1827 -0.2181 -0.2855 -0.3757 -1.5536*** -1.3892***
(0.3554) (0.3668) (0.6347) (0.6321) (0.3694) (0.3667) Focal Number of
Comp.
-0.0011** -0.0011** -0.0004 -0.0005 -0.0005 -0.0003
(0.0005) (0.0006) (0.0007) (0.0007) (0.0006) (0.0005) Focal Lead=
Focal Pat
0.0690 0.0644 -0.0462 -0.0606 -0.5859*** -0.5859***
(0.1107) (0.1081) (0.1327) (0.1326) (0.1332) (0.1337) Citing NPL
Scientific
0.1801* 0.1818* 0.5257** 0.5303** 0.0701 0.0595
(0.0949) (0.0942) (0.2062) (0.2087) (0.1135) (0.1148)
Bwd cits -0.1402*** -0.1270** -0.1035 -0.1005 0.3866*** 0.4018***
(0.0507) (0.0539) (0.0704) (0.0753) (0.0568) (0.0640)
fwd cited 0.0055 0.0050 -0.0058 -0.0065 0.0040 0.0039 (0.0049) (0.0049) (0.0070) (0.0072) (0.0059) (0.0057)
Cited Patent
Originality
-0.4224 -0.3710 0.6516 0.7077 -0.1853 -0.1904
(0.3186) (0.3113) (0.7109) (0.7087) (0.4287) (0.4220)
Num. Comp. of -0.0001 0.0000 -0.0007 -0.0007 0.0004 0.0009

155
cited
(0.0010) (0.0011) (0.0015) (0.0015) (0.0015) (0.0014)
Focal Lead=Cited
Patent
-0.0527 -0.0599 -0.1916 -0.0270 0.0020 0.0821
(0.1679) (0.1883) (0.2064) (0.2279) (0.1744) (0.2175) Same ATC focal-
cited
0.0439 0.0042 0.0640 0.0399 0.3620*** 0.3707***
(0.0818) (0.1006) (0.1214) (0.1373) (0.0961) (0.1156) Succ in ATC -1.0005*** -1.0340*** 0.9042** 0.9420** 1.1622*** 0.9508***
(0.2778) (0.2777) (0.4570) (0.4614) (0.2698) (0.2686)
R&D competition in
ATC
-0.2723*** -0.2761*** 0.3697*** 0.3743*** -0.0724 -0.0458
(0.0686) (0.0671) (0.0987) (0.0978) (0.0640) (0.0631)
Failure Ratio -0.8413*** -0.8087*** -1.0340*** -0.9905*** -1.1033*** -1.0536***
(0.1906) (0.1845) (0.2075) (0.2070) (0.2058) (0.2054)
Breadth of firm activities
-0.1522 -0.1660 -0.8482*** -0.8517*** 0.9126*** 0.8747**
(0.2545) (0.2534) (0.2869) (0.2888) (0.3492) (0.3448)
Constant 10.202 0.9875 -5.3671*** -5.3898*** -1.4224* -1.6788** (0.8942) (0.8904) -10.590 -10.639 (0.7284) (0.7178)
Multinomial Logit. All models includes 7350 observations. The Pseudo R2 of Model 1 is 0.2450, of
Model 2 is 0.2531. The base group is Failure. Standard errors clustered by Firm. No restriction
applied on timing of citations.
.
Figure C.1: Models taking into account different timing

156
References
Abrahamson, E., & Fairchild, G. (1999). Management fashion: Lifecycles,
triggers, and collective learning processes. Administrative Science
Quarterly, 44, 708 740.
Adams, C. P., & Brantner, V. V. (2006). Estimating the cost of new drug
development: is it really $802 million?. Health Affairs, 25(2), 420-428.
Aghion, P., & Saint-Paul, G. (1998). Virtues of bad times: interaction between
productivity growth and economic fluctuations. Macroeconomic Dynamics,
2 (3), 322-344.
Aghion, P., Askenazy, P., Berman, N., Cette, G., & Eymard, L. (2012). Credit
constraints and the cyclicality of R&D investment: Evidence from France.
Journal of the European Economic Association, 10(5), 1001- 1024.
Ahuja, G., & Morris Lampert, C. (2001). Entrepreneurship in the large
corporation: A longitudinal study of how established firms create
breakthrough inventions. Strategic Management Journal, 22(6‐7), 521-543.
Almeida, H., Hsu, P. H., & Li, D. (2013). Less is more: Financial constraints
and innovative efficiency. Available at SSRN 1831786.
Amore, M. D. (2015). Companies learning to innovate in recessions. Research
Policy, 44(8), 1574-1583.
Amore, M. D., Schneider, C., & Žaldokas, A. (2013). Credit supply and
corporate innovation. Journal of Financial Economics, 109(3), 835-855.
Ancona, D., & Bresman, H. (2013). X-teams: How to build teams that lead,
innovate, and succeed. Harvard Business Press.
Argote, L. (1996). Organizational learning curves: persistence, transfer and
turnover. International Journal of Technology Management, 11(7-8), 759-
769.
Argote, L. (1999). Organizational learning: Creating, retaining and transferring
knowledge. New York: Kluwer Academic
Argote, L., Beckman, S. L., & Epple, D. (1990). The persistence and transfer
of learning in industrial settings. Management Science, 36(2), 140-154.

157
Arora, A., Gambardella, A., Magazzini, L., & Pammolli, F. (2009). A breath of
fresh air? Firm type, scale, scope, and selection effects in drug
development. Management Science, 55(10), 1638-1653.
Arrowsmith J. (2011). Trail watch: Phase III and submission failures: 2007-
2010. Nature Reviews Drug Discovery 10, 87.
Arts S, Veugelers R. (2013). The technological origins and novelty of
breakthrough inventions, FEB Research Report - MSI_1302.
Arthur, W. B. (2007). The structure of invention. Research policy, 36(2), 274-
287.
Arundel A. and Kabla I. (1998). What percentage of innovations are patented?
Empirical estimates from European firms. Research Policy, 27, 127-141.
Barlevy, G. (2004). The cost of business cycles under endogenous growth.The
American Economic Review, 94(4), 964-990.
Barlevy, G. (2007). On the Cyclicality of Research and Development. The
American Economic Review, 1131- 1164.
Bartlesman, E., & Gray, W. B. (1996). The NBER manufacturing productivity
database.
Baum, J. A., & Dahlin, K. B. (2007). Aspiration performance and railroads'
patterns of learning from train wrecks and crashes. Organization Science,
18(3), 368-385.
Baumard, P., & Starbuck, W. H. (2005). Learning from failures: Why it may
not happen. Long Range Planning, 38(3), 281-298.
Baumol, W. (2002). The free-market innovation machine: Analyzing the
growth miracle of capitalism. New Jersey: Princeton University Press, 1-
307.
Becker, R., Gray, W., & Marvakov, J. (2013). NBER-CES Manufacturing
Industry Database: Technical Notes. NBER Working Paper, 5809.
Berchicci, L., Tucci, C.L., & Zazzara, C. (2013). The Influence of Industry
downturns on the propensity of product versus process innovation.
Industrial and Corporate Change, 23(2), 429-465.
Bovha Padilla, S., Damijan, J. P., & Konings, J. (2009). Financial Constraints
and the Cyclicality of R&D investment: Evidence from Slovenia.
Breschi, S., Lissoni, F., & Malerba, F. (2003). Knowledge-relatedness in firm
technological diversification. Research Policy, 32(1), 69-87.

158
Brusoni, S., Prencipe, A., & Pavitt, K. (2001). Knowledge Specialization,
Organizational Coupling, and the Boundaries of the Firm: Why Do Firms
Know More Than They Make? Administrative Science Quarterly, 46(4),
597-621.
Bryce, D. J., & Winter, S. G. (2009). A general interindustry relatedness index.
Management Science, 55(9), 1570-1585.
Campbell J.J. (2005). Understanding Pharma. A Primer on How
Pharmaceutical Companies Really Work. Pharmaceutical Institute, Inc.,
Raleigh, NC.
Campello, M., Graham, J. R., & Harvey, C. R. (2010). The real effects of
financial constraints: Evidence from a financial crisis. Journal of Financial
Economics, 97(3), 470-487.
Carnabuci, G. & Operti, E. (2013). Where do firms' recombinant capabilities
come from? Intraorganizational networks, knowledge, and firms' ability to
innovate through technological recombination. Strategic Management
Journal, 34, 1591–1613.
Cannon, M. D., & Edmondson, A. C. (2001). Confronting failure: Antecedents
and consequences of shared beliefs about failure in organizational work
groups. Journal of Organizational Behavior,22(2), 161-177.
Cannon, M. D., & Edmondson, A. C. (2005). Failing to learn and learning to
fail (intelligently): How great organizations put failure to work to innovate
and improve. Long Range Planning, 38(3), 299-319.
Cassimon, D., De Backer, M., Engelen, P. J., Van Wouwe, M., & Yordanov,
V. (2011). Incorporating technical risk in compound real option models to
value a pharmaceutical R&D licensing opportunity. Research Policy,
40(9), 1200–1216.
Chen, Y. F., Ma, X., Sundell, K., Alaka, K., Schuh, K., Raskin, J., & Dean, R.
A. (2016). Quantile regression to characterize solanezumab effects in
Alzheimer's disease trials. Alzheimer's & Dementia: Translational
Research & Clinical Interventions, 2(3), 192-198.
Chesbrough, H. (2010). Business model innovation: opportunities and barriers.
Long range planning, 43(2), 354-363.
Chiou, J. Y., Magazzini, L., Pammolli, F., & Riccaboni, M. (2012). The value
of failures in pharmaceutical R&D.
159
Chuang, Y. T., & Baum, J. A. C. (2003). It's all in the name: Failure-induced
learning by multiunit chains. Administrative Science Quarterly, 48, 33-59.
Cincera, M., Cozza, C., Tübke, A., & Voigt, P. (2010). Doing R&D or not,
that is the question (in a crisis…) (No. 2010-12). Directorate Growth &
Innovation and JRC-Seville, Joint Research Centre.
Cohen, W.M., Klepper, S. (1996a). “Firm size and the nature of innovation
within industries: The case of process and product R&D”. Review of
Economics and Statistics 78, 232–243.
Cohen, W.M., Klepper, S. (1996b). “A reprise of size and R&D”. Economic
Journal 106, 925–951.
Cohen, W. M., & Levinthal, D. A. (1990). Absorptive capacity: A new
perspective on learning and innovation. Administrative Science Quarterly,
128-152.
Cohen, W. M., Nelson, R. R., & Walsh, J. P. (2000). Protecting their
intellectual assets: Appropriability conditions and why US manufacturing
firms patent (or not) (No. w7552). National Bureau of Economic Research.
Christensen, C. M. (1998). Du Pont Kevlar Aramid industrial fiber
(abridged).HBS Case 698079, Harvard Business School Press, cambridge,
MA.
Cyert, R. M., & March, J. G. (1963). A behavioral theory of the firm.
Englewood Cliffs, NJ, 2.
Cyert, R.M., & March, J. G. (1992). A Behavioral Theory of the Firm (2 ed.).
Wiley-Blackwell
Dahlin, K.B. and Behrens, D.M. (2005). When is an invention really radical?:
Defining and measuring technological radicalness. Research Policy, 34(5),
717-737.
Danneels, E. (2008). Organizational antecedents of second‐order competences.
Strategic Management Journal, 29(5), 519-543.
Danzon, P. M., Nicholson, S., & Pereira, N. S. (2005). Productivity in
pharmaceutical–biotechnology R&D: the role of experience and alliances.
Journal of health economics, 24(2), 317-339.
Darr, E., Argote, L., & Epple, D. (1995). The acquisition, transfer, and
depreciation of knowledge in service organizations: Productivity in
franchises. Management Science, 31, 1750-1762.

160
de Rassenfosse, G., & Guellec, D. (2009). Quality versus quantity: Strategic
interactions and the patent inflation. In 4th annual conference of the EPIP
association.
Denrell, J. (2003). Vicarious learning, undersampling of failure, and the myths
of management. Organization Science, 14(3), 227-243.
Desai, V. (2014). Learning through the distribution of failures within an
organization: evidence from heart bypass surgery performance. Academy of
Management Journal, 58(4), 1032-1050.
D'este, P., Marzucchi, A., & Rentocchini, F. (2014). Exploring and Yet Failing
Less: The Role of Exploitation and Human Capital to Foster Learning from
Exploration. Paper presented at the DRUID Society Conference.
Devinney, T. M. (1990). New products over the business cycle. Journal of
Product Innovation Management, 7(4), 261-273.
DiMasi, J. A., Grabowski H.G., & Hansen R.W. (2016). Innovation in the
pharmaceutical industry: new estimates of R&D costs. Journal of health
economics 47, 20-33.
DiMasi, J. A., Hansen, R. W., & Grabowski, H. G. (2003). The price of
innovation: new estimates of drug development costs. Journal of health
economics, 22(2), 151-185.
Dosi, G. (1982). Technological paradigms and technological trajectories: a
suggested interpretation of the determinants and directions of technical
change. Research Policy, 11(3), 147-162.
Dosi, G., (1988). Sources, procedures, and microeconomic effects of
innovation. Journal of Economic Literature, 26, 1120–1171.
Dosi, G., Grazzi, M., & Moschella, D. (2015). What do firms know? What do
they produce? A new look at the relationship between patenting profiles
and patterns of product diversification. Small Business Economics, 1-17.
Edmondson, A. C. (2011). Strategies for learning from failure. Harvard
business review, 89(4), 48-55.
EFPIA - European Federation of Pharmaceutical Industries and Associations,
(2014). The Pharmaceutical Industry in Figures.
http://www.efpia.eu/Figures_2014_Final.pdf/
Eggers, J. P. (2012). Falling flat failed technologies and investment under
uncertainty. Administrative Science Quarterly, 57(1), 47-80.

161
Eggers, J. P. (2014). Competing technologies and industry evolution: The
benefits of making mistakes in the flat panel display industry. Strategic
Management Journal, 35(2), 159-178.
Fabrizio K.R., & Tsolmon, U. (2014). An Empirical Examination of the
Procyclicality of R&D Investment and Innovation. Review of Economics
and Statistics, 96(4), 662-675.
Fagerberg, J. (2004). Innovation: a guide to the literature. Georgia Institute of
Technology.
Filippetti, A., & Archibugi, D. (2011). Innovation in times of crisis: National
Systems ofInnovation, structure, and demand. Research Policy, 40(2), 179-
192.
Fleming, L. (2001). Recombinant Uncertainty in Technological Search.
Management Science, 47(1), 117-132.
Fleming, L., & Sorenson, O. (2001). Technology as a complex adaptive
system: evidence from patent data. Research Policy, 30(7), 1019-1039.
Fleming, L. & Sorenson, O. (2004). Science as a map in technological search.
Strategic Management Journal, 25, 909-928.
Fleming, L., Mingo, S. and Chen, D. (2007). Collaborative Brokerage,
Generative Creativity and Creative Success. Administrative Science
Quarterly, 52(3), 443-475.
Francis, J., & Zheng, C. (2010). Learning vicariously from failure: The case of
major league soccer and the collapse of the North American Soccer
League. Group & Organization Management, 35(5), 542-571.
Gandhi, L., & Jänne, P. A. (2012). Crizotinib for ALK-rearranged non–small
cell lung cancer: a new targeted therapy for a new target. Clinical Cancer
Research, 18(14), 3737-3742.
Gatignon, H., Tushman, M. L., Smith, W., & Anderson, P. (2002). A structural
approach to assessing innovation: Construct development of innovation
locus, type, and characteristics. Management Science, 48(9), 1103-1122.
Gavetti, G. (2012). PERSPECTIVE—Toward a behavioral theory of
strategy. Organization Science, 23(1), 267-285.
Geroski, P. A., & Walters, C. F. (1995). Innovative activity over the business
cycle. The Economic Journal, 916-928.
Gimeno, J., R.E. Hoskisson, B.D. Beal & Wan, W.P. (2005). Explaining the
Clustering of International Expansion Moves: a critical test in the U.S.

162
Telecommunications industry. Academy of Management Journal, 48, 297-
319.
Grabowski H., Vernon J. (1990). A new look at the returns and risks in
pharmaceutical R&D. Management Science 36(7), 804–821.
Granstand O., Patel P. & Pavitt K. (1997). Multi-technology corporations: why
they have" distributed" rather than" distinctive core" competencies.
California Management Review, 39(4), 8.
Grant, R. M. (1996). Toward a knowledge-base theory of the firm. Strategic
Management Journal, 17, 109–122.
Greve, H. R. (1998). Performance, aspirations, and risky organizational
chance. Administrative Science Quarterly, 43, 58-86.
Greve, H. R., & Taylor, A. (2000). Innovations as catalysts for organizational
change: Shifts in organizational cognition and search. Administrative
Science Quarterly,45(1), 54-80.
Greve, H. R. (2003). A behavioral theory of R&D expenditures and
innovations: Evidence from shipbuilding. Academy of management
journal,46(6), 685-702.
Griliches Z. (1986). Productivity, R&D, and basic research at the firm level in
the 1970s. American Economic Review 76(1), 141-154.
Gruber, M., Harhoff, D., & Hoisl, K. (2013). Knowledge recombination across
technological boundaries: scientists vs. engineers. Management Science,
59(4), 837-851.
Hall, B. H., & Lerner, J. (2010). The financing of R&D and innovation.
Handbook of the Economics of Innovation, 1, 609-639.
Hall, B. H., Griliches, Z., & Hausman, J. A. (1986). Patents and R and D: Is
There a Lag?. International Economic Review, 265-283.
Hall, B. H., Jaffe, A. B., & Trajtenberg, M. (2001). The NBER patent citation
data file: Lessons, insights and methodological tools (No. w8498). National
Bureau of Economic Research.
Hannan, M. T., & Carroll, G. R. 1992. Dynamics of organizational
populations: Density, legitimation, and competition. New York: Oxford
University Press.
Hargadon, A. (2004). Brokers of Innovation: Lessons from the Past. Focus.
8(1) 32-35.

163
Hargadon, A., & Sutton, R. I. (1997). Technology brokering and innovation in
a product development firm. Administrative Science Quarterly, 716-749.
Harhoff, D., Narin, F., Scherer, F. M., & Vopel, K. (1999). Citation frequency
and the value of patented inventions. Review of Economics and statistics,
81(3), 511-515.
Harrison, R. K. (2016). Phase II and phase III failures: 2013-2015.Nature
Reviews Drug Discovery,15(12), 817-818.
Haunschild, P. R., & Sullivan, B. N. (2002). Learning from complexity:
Effects of prior accidents and incidents on airlines' learning. Administrative
Science Quarterly, 47(4), 609-643.
Henderson, R. M., & Clark, K. B. (1990). Architectural innovation: The
reconfiguration of existing product technologies and the failure of
established firms. Administrative Science Quarterly, 9-30.
Henderson, R.M., Cockburn, I. (1996). “Scale, scope, and spillovers:
Determinants of research productivity in the pharmaceutical industry”.
RAND Journal of Economics 27, 32–59.
Herriott, S. R., Levinthal, D., & March, J. G. (1985). Learning from experience
in organizations. The American Economic Review, 75(2), 298-302.
Hill, C. W. L., & Rothaermel, F. T. (2003). The Performance of Incumbent
Firms in the Face of Radical Technological Innovation. Academy of
Management Review, 28 (2),257-274.
Himmelberg, C. P., & Petersen, B. C. (1994). R&D and internal finance: A
panel study of small firms in high-tech industries. The Review of
Economics and Statistics, 38-51.
Hoetker, G., & Agarwal, R. (2007). Death hurts, but it isn't fatal: The postexit
diffusion knowledge created by innovative companies. Academy of
Management Journal, 50(2), 446-467.
Hombert, J., & Matray, A. (2015). The Real Effects of Lending Relationships
on Innovative Firms and Inventor Mobility. Available at SSRN 2082403.
Huber, G. P. (1991). Organizational learning: The contributing processes and
the literatures. Organization Science, 2(1), 88-115.
Hud, M., & Hussinger, K. (2015). The impact of R&D subsidies during the
crisis. Research Policy, 44(10), 1844-1855.
Husted, K., & Michailova, S. (2002). Diagnosing and fighting knowledge-
sharing hostility. Organizational Dynamics, 31(1), 60-73.

164
Ingram, P., & Baum, J. A. (1997). Chain affiliation and the failure of
Manhattan hotels, 1898-1980. Administrative Sicence Quartely, 42, 68-
102.
Jaffe, A. B., & Trajtenberg, M. (2002). Patents, citations, and innovations: A
window on the knowledge economy. MIT press.
Jaffe, A. B., Trajtenberg, M., & Fogarty, M. S. (2000). The meaning of patent
citations: Report on the NBER/Case-Western Reserve survey of patentees
(No. w7631). National Bureau of Economic Research.
Julia, B. (2013). The great neuro-pipeline ‘brain drain’(and why Big Pharma
hasn’t given up on CNS disorders). Drug Discovery, 9.
Kahneman, D., & Lovallo, D. (1993). Timid choices and bold forecasts: A
cognitive perspective on risk taking. Management Science, 39(1), 17-31.
Kaplan, S. N., & Zingales, L. (1997). Do investment-cash flow sensitivities
provide useful measures of financing constraints?. The Quarterly Journal
of Economics, 169-215.
Kaplan, S., & Vakili, K. (2015). The double‐edged sword of recombination in
breakthrough innovation. Strategic Management Journal, 36(10), 1435-
1457.
Katila, R., & Ahuja, G. (2002). Something old, something new: A longitudinal
study of search behavior and new product introduction. Academy of
ManagementJjournal, 45(6), 1183-1194.
Katila, R., & Chen, E. L. (2008). Effects of search timing on innovation: The
value of not being in sync with rivals. Administrative Science
Quarterly,53(4), 593-625.
Keijl, S., Gilsing, V. A., Knoben, J., & Duysters, G. (2016). The two faces of
inventions: The relationship between recombination and impact in
pharmaceutical biotechnology. Research Policy, 45(5), 1061-1074.
Kelley, D. J., Ali, A., & Zahra, S. A. (2013). Where Do Breakthroughs Come
From? Characteristics of High-Potential Inventions. Journal of Product
Innovation Management, 30, 1212–1226.
Khanna, R., Guler, I., & Nerkar, A. (2016). Fail often, fail big, and fail fast?
Learning from small failures and R&D performance in the pharmaceutical
industry. Academy of Management Journal, 59(2), 436-459.

165
Kim, J. Y. J., & Miner, A. S. (2007). Vicarious learning from the failures and
near-failures of others: Evidence from the US commercial banking
industry. Academy of Management Journal, 50(3), 687-714.
Klepper, S., & Thompson, P. (2010). Disagreements and intra-industry
spinoffs. International Journal of Industrial Organization, 28(5), 526-538.
Koenig MED. (1983). A bibliometric analysis of pharmaceutical research.
Research Policy, 12(1), 15-36.
Kogut, B., & Zander, U. (1992). Knowledge of the firm, combinative
capabilities, and the replication of technology. Organization science, 3(3),
383-397.
Kola, I., & Landis, J. (2004). Can the pharmaceutical industry reduce attrition
rates?. Nature reviews Drug discovery, 3(8), 711-716.
Kondo, M. (1999). R&D dynamics of creating patents in the Japanese industry.
Research Policy, 28(6), 587-600.
Krieger, J.L. (2016) Trials and Terminations: Learning from Competitors’
R&D Failures. Working paper.
Lanjouw, J. O., & Schankerman, M. (1999). The quality of ideas: measuring
innovation with multiple indicators (No. w7345). National Bureau of
Economic Research.
Lant, T. K. (1992). Aspiration level adaptation: An em pirical exploration.
Management Science, 38, 623-644.
Leonard-Barton, D. (1992). Core capabilities and core rigidities: a paradox in
managing new product development. Strategic Management Journal,
13(S1), 111-125.
Leonard-Barton, D. (1995). Wellsprings of knowledge: building and sustaining
the sources of innovation. Boston Massachusetts, Harvard Business School
Press.
Leten, B., Belderbos, R., & Van Looy, B. (2007). Technological
diversification, coherence, and performance of firms. Journal of Product
Innovation Management, 24(6), 567-579.
Leten, B., Belderbos, R., & Looy, B. V. (2016). Entry and technological
performance in new technology domains: Technological opportunities,
technology competition and technological relatedness. Journal of
Management Studies, 53(8), 1257-1291.

166
Levin, R. C., Klevorick, A. K., Nelson, R. R., Winter, S. G., Gilbert, R., &
Griliches, Z. (1987). Appropriating the returns from industrial research and
development. Brookings papers on economic activity, 1987(3), 783-831.)
Levinthal, D. A., & March, J. G. (1993). The myopia of learning. Strategic
Management Journal, 14(S2), 95-112.
Levinthal, D., & March, J. G. (1981). A model of adaptive organizational
search. Journal of Economic Behavior & Organization, 2(4), 307-333.
Levitt, B., & March, J. G. (1988). Organizational learning. Annual review of
sociology, 319-340.
Li, G.C., Lai, R., D'Amour, A., Doolin, D.M., Sun, Y., Torvik, V.I., Yu, A.Z.,
& Fleming, L. (2014). Disambiguation and co-authorship networks of the
U.S. patent inventor database (1975-2010). Research Policy, 43(6), 941-
955.
Madsen, P. M., & Desai, V. (2010). Failing to learn? The effects of failure and
success on organizational learning in the global orbital launch vehicle
industry. Academy of Management Journal, 53(3), 451-476.
Magazzini, L., Pammolli, F., & Riccaboni, M. (2010). Learning from failures
or failing to learn? Lessons from pharmaceutical R&D. European
Management Review, 9(1), 45-58.
Magerman, T., Van Looy, B., & Song, X. (2010). Exploring the feasibility and
accuracy of Latent Semantic Analysis based text mining techniques to
detect similarity between patent documents and scientific
publications. Scientometrics, 82(2), 289-306.
Maggitti, P. G., Smith, K. G., & Katila, R. (2013). The complex search process
of invention. Research Policy, 42(1), 90-100.
March J. G., & Shapira, Z. 1992. Variable risk preferences and the focus of
attention. Psychological Review, 99: 172-183.
March, J. G. (1991). Exploration and exploitation in organizational learning.
Organization Science, 2(1), 71-87.
Maslach, D. (2016). Change and persistence with failed technological
innovation. Strategic Management Journal, 37(4), 714-723.
Mazzucato, M. (2015). The entrepreneurial state: Debunking public vs. private
sector myths. Anthem Press.
Mestre-Ferrandiz, J., Sussex, J., & Towse, A. (2012). The R&D cost of a new
medicine. London: Office of Health Economics.

167
Meyer, J.W. and Scott, W.R. 1983. Organizational environments: Ritual and
Rationality. Beverly Hills, CA: Sage.
Miller, D. T., & Ross, M. (1975). Self-serving biases in the attribution of
causality: Fact or fiction?. Psychological bulletin, 82(2), 213.
Miner, A. S., Ciuchta, M. P., & Gong, Y. 2008. Organizational routines and
organizational learning. In M. C. Becker (Ed.), Handbook of organizational
routines: 152-186. Cheltenham, U.K.: Elgar.
Miner, A. S., Kim, J., Holzinger, I. W., & Haunschild, P. (1999). Fruits of
failure: Organizational failure and population-level learning. In A. S. Miner
& P. Ander son (Eds.), Advances in strategic management, vol. 16: 187-
220. Greenwich, CT: JAI Press
Mullen B., Johnson C. and Salas E. (1991). Productivity Loss in Brainstorming
Groups: A Meta-Analytic Integration. Basic and Applied Social
Psychology, 12: 3-23.
Narin F., Hamilton K.S., & Olivastro, D. (1997). The increasing linkage
between U.S. technology and public science. Research Policy 26(3), 317-
330.
Neckar, A. (2003). Old is gold? The value of temporal exploration in the
creation of new knowledge. Management Science, 49, 211-229.
Nelson, R.R. & S.G. Winter (1982): An evolutionary theory of economic
change, Cambridge MA, Harvard University Press.
Nemet, G. F., & Johnson, E. (2012). Do important inventions benefit from
knowledge originating in other technological domains?. Research Policy,
41(1), 190-200.
Nerkar, A., & Roberts, P. W. (2004). Technological and product‐market
experience and the success of new product introductions in the
pharmaceutical industry. Strategic Management Journal, 25(8‐9), 779-799.
Nesta, L., & Saviotti , P.P. (2005). Coherence of the knowledge base and the
firm's innovative performance: evidence from the U.S pharmaceutical
industry. Journal of Industrial Economics, 53(1), 123-142.
Nickerson, J. A., & Zenger, T. R. (2004). A knowledge-based theory of the
firm—The problem-solving perspective. Organization Science, 15(6), 617-
632.
Nohria, N., & Gulati, R. (1996). Is slack good or bad for innovation?. Academy
of management Journal, 39(5), 1245-1264.

168
OECD publishing (2009).Green Growth: Overcoming the Crisis and Beyond.
OECD, Paris.
OECD publishing (2012). Innovation in the crisis and beyond. Ch. 1 in OECD
Science, Technology and Industry Outlook, OECD, Paris.
Oriani, R., & Sobrero, M. (2008). Uncertainty and the market valuation of
R&D within a real options logic. Strategic Management Journal, 29, 343–
361.
Ouyang, M. (2011). On the Cyclicality of R&D. The Review of Economics and
Statistics, 93(2), 542-553.
Owens, P. K. et al. A decade of innovation in pharmaceutical R&D: the
Chorus model. Nat. Rev. Drug Discov. 14, 17–28 (2015).
Pammolli, F., Magazzini, L., & Riccaboni, M. (2011). The productivity crisis
in pharmaceutical R&D. Nature reviews Drug discovery, 10(6), 428-438.
Patel, P., & Pavitt, K. (1997). The technological competencies of the world's
largest firms: complex and path-dependent, but not much variety. Research
Policy, 26(2), 141-156.
Pavitt, K. (1988). International patterns of technological
accumulation. Strategies in global competition, 126-157.
Paulus, P., B. Nijstad, eds. (2003). Group creativity: An introduction. Group
Creativity: Innovation Through Collaboration. Oxford University Press,
New York.
Paunov, C. (2012). The global crisis and firms’ investments in innovation.
Research Policy, 41(1), 24-35.
Peia, O. (2016). Banking crises, R&D investments and slow recoveries. R&D
Investments and Slow Recoveries (April 8, 2016).
Perkins, D. N. (1995). Insight in minds and genes. R.J. Sternberg and J.E.
Davidson, eds. The nature of insight. MIT Press, Cambridge, MA, 495-534
Pisano, G. P., Bohmer, R. M., & Edmondson, A. C. (2001). Organizational
differences in rates of learning: Evidence from the adoption of minimally
invasive cardiac surgery. Management Science, 47(6), 752-768.
Polanyi, M (1962) “The Republic of Science: Its Political and Economic
Theory”, Minerva, 1, 54-74.
Prusa, T. J., & Schmitz, J. A. (1991). Are new firms an important source of
innovation?: Evidence from the PC software industry. Economics
Letters, 35(3), 339-342.

169
Ramanujam, R., & Goodman, P. S. (2003). Latent errors and adverse
organizational consequences: A conceptualization. Journal of
Organizational Behavior, 24(7), 815-836.
Redding, J.C. and R.F. Catalanello, 1994. Strategic Readiness: The Making of
the Learning Organization. Jossey-Bass Publishers, San Francisco.
Roberts P. (1999). Product innovation, product-market competition and
persistent profitability in the U.S. pharmaceutical industry. Strategic
Management Journa,l 20(7), 655–670.
Rosenkopf, L., & Neckar, A. (2001). Beyond local search: boundary-spanning,
exploration, and impact in the optical disk industry. Strategic Management
Journal, 22 (4), 287–306.
Saint-Paul, G. (1997). Business cycles and long-run growth. Oxford Review of
Economic Policy, 13(3), 145-153.
Scannell, J.W., Blanckley A., Boldon, H., Warrington, B. (2012). Diagnosing
the decline i pharmaceutical R&D efficiency. Nature Reviews Drug
Discovery 11, 191-200.
Schilling M., & Phelps, C.C. (2007). Interfirm collaboration networks: The
impact of large-scale network structure on firm innovation, Management
Science, 1113-1126.
Schilling M., Greene E. (2011). Recombinant search and breakthrough idea
generation: An analysis of high impact papers in the social sciences.
Research Policy, 40 (10), 1321–1331.
Schilling, M. A. (2005). A "small-world" network model of cognitive insight.
Creativity Research Journal, 17(2-3), 131-154.
Schleifer A. (1986). Implementation Cycles. The Journal of Political
Economy. 94(6), 1163-1190.
Schoenmakers, W., & Duysters, G. (2010). The technological origins of
radical inventions. Research Policy, 39, 1051-1059.
Schumpeter, J. A. (1934). The theory of economic development: An inquiry
into profits, capital, credit, interest, and the business cycle (Vol. 55).
Transaction publishers.
Schumpeter, J. (1939). Business Cycles: A Theoretical, Historical and
Statistical Analysis of the Capitalist Process (New York: McGrawHill).
Scotchmer, S., (2004). Innovation and incentives. Cambridge, MA: MIT
Press.

170
Senge, P. (1990). The fifth discipline. The Art & Practice of Learning
Organization. Doupleday Currence, New York.
Shane, S. (2001). Technological opportunities and new firm
creation. Management science, 47(2), 205-220.
Shaver J.M., W. Mitchell and B. Yeung. (1997). The effect of own-firm and
other-firm experience on foreign direct investment survival in the United
States, 1987-92. Strategic Management Journal, 18 811-824
Simon, H. A. (1978). Rationality as process and as product of thought. The
American Economic Review, 1-16.
Simon, H. A. (1982). Models of bounded rationality: Empirically grounded
economic reason (Vol. 3). MIT press.
Simonton, D. K. (1999). Creativity as blind variation and selective retention: Is
the creative process Darwinian?. Psychological Inquiry, 10(4), 309-328.
Singh, J., & Fleming, L. (2010). Lone inventors as sources of breakthroughs:
Myth or reality?. Management Science, 56(1), 41-56.
Sitkin, S. B. (1992). Learning through Failure: The Strategy of Small Losses.
Research in organizational behavior, 14, 231-266.
Stalk, G., Evans, P., & Shulman, L. E. (1991). Competing on capabilities: the
new rules of corporate strategy. Harvard business review, 70(2), 57-69.
Staw, B. M. (1976). Knee-deep in the big muddy: A study of escalating
commitment to a chosen course of action. Organizational behavior and
human performance, 16(1), 27-44.
Staw, B. M., Sandelands, L. E., & Dutton, J. E. (1981). Threat rigidity effects
in organizational behavior: A multilevel analysis. Administrative Science
Quarterly, 501-524.
Steenkamp J., & Fang E. (2011). The Impact of Economic Contractions on the
Effectiveness of R&D and Advertising: Evidence from U.S. Companies
Spanning Three Decades. Marketing Science, 30(4), 628-645.
Strang, D., & Macy, M. W. (2001). In search of excellence: Fads, success
stories, and adaptive emulation. American Journal of Sociology, 107,147-
182.
Stuart, T. E., & Podolny, J. M. (1996), Local search and the evolution of
technological capabilities. Strategic Management. Journal, 17, 21–38.
171
Taylor, A., & Greve, H. R. (2006). Superman or the fantastic four? Knowledge
combination and experience in innovative teams. Academy of Management
Journal, 49(4), 723-740.
Teece DJ., Rumelt, R., Dosi, G., & Winter, S. (1994). Understanding corporate
coherence: Theory and evidence. Journal of Economic Behavior &
Organization, 23(1), 1-30.
Teece, D. J., Pisano, G., & Shuen, A. (1997). Dynamic capabilities and
strategic management. Strategic management journal, 509-533.
Terlaak, A., & Gong, Y. (2008). Vicarious learning and inferential accuracy in
adoption processes. Academy of Management Review, 33(4), 846-868.
Trajtenberg, M. (1990). A penny for your quotes: patent citations and the value
of innovations. The Rand Journal of Economics, 172-187.
Trajtenberg, M., Henderson, R., & Jaffe, A. (1997). University versus
corporate patents: A window on the basicness of invention. Economics of
Innovation and new Technology, 5(1), 19-50.
Troilo, G., De Luca, L. M., & Atuahene-Gima, K. (2014). More Innovation
with Less? A Strategic Contingency View of Slack Resources, Information
Search, and Radical Innovation. Journal of Product Innovation
Management, 31(2), 259-277.
United States Patent and Trademark Office (2003). Ex- aminer handbook to
the U.S. patent classi- fication system, http://uspto.ustpo.gov/web/
offoces/pac/dapp/sir/co/examhbk/index.html, accessed 25 February 2017.
Uzzi B., Mukherjee S., Stringer M., Jones B. (2013). Atypical Combinations
and Scientific Impact. Science, 342, 468-472.
Van de Poel, I. (2003). The transformation of technological regimes. Research
Policy, 32(1), 49-68
Van Looy B, Zimmermann E, Veugelers R, Verbeek A, Mello J, Debackere K.
2003. Do science-technology interactions pay off when developing
technology? Scientometrics, 57(3), 355-367.
Verhoeven, D., Bakker, J., & Veugelers, R. (2016). Measuring technological
novelty with patent-based indicators. Research Policy, 45(3), 707-723.
Weitzman, M. L. (1998). Recombinant growth. Quarterly Journal of
Economics, 113(2), 331-360.
Winter, S. G. (2012). Purpose and progress in the theory of strategy:
Comments on Gavetti. Organization Science, 23(1), 288-297

172
Yang, B., N. D. Burns and C. J. Backhouse (2004), Management of
uncertainty through postponement. Taylor & Francis: Abingdon,
ROYAUME-UNI.

173
Unless otherwise expressly stated, all original material of whatever nature created by Daniela Silvestri and included in this thesis, is licensed under a Creative Commons Attribution
Noncommercial Share Alike 2.5 Italy License. Check creativecommons.org/licenses/by-nc-sa/2.5/it/ for the legal code of the full license.
Ask the author about other uses.