Embed Size (px)
Citation preview

CONFIDENTIAL AND PROPRIETARYAny use of this material without specific permission of McKinsey & Company is strictly prohibited
26.08.2020
AmCham Automotive Conference
Seamless urban mobility in a COVID19 world

McKinsey & Company 2
COVID-19 is, first and foremost, a global humanitarian challenge.Thousands of health professionals are heroically battling the virus, putting their own lives at risk. Governments and industry are working together to understand and address the challenge, support victims and their families and communities, and search for treatments and a vaccine.
Companies around the world need to act promptly. This document is meant to help senior leaders understand the COVID-19 situation, and take steps to protect their employees, customers, supply chains, and financial results.
Read more on McKinsey.com
McKinsey & Company 2

McKinsey & Company 3
The Imperative of our Time“Timeboxing” the Virus and the Economic Shock
Safeguard our lives
1a. Suppress the virus as fast as possible
1b. Expand testing, quarantining and treatment capacity
1c. Find “cures”; treatment, drugs, vaccines
Imp
er
ati
ve
s
2 Safeguard our livelihoods
2a. Support people and businesses affected by lockdowns
2b. Prepare to get back to work safely when the virus abates
2c. Prepare to scale the recovery away from a -8 to -13% trough
1
Source: McKinsey analysis, in partnership with Oxford Economics
~ -8 to -13% Economic
Shock
1a1b
1c
2a
2b
2c

McKinsey & Company 4 Source: McKinsey surveys of global executives
Executives have wide-ranging expectations of global outcomes: Global economy
1. “Thinking globally, please rank the following scenarios in order of how likely you think they are to occur over the course of the next year”; % of total global respondents; Monthly surveys: April 2–April 10, 2020, N=2,079; May 4–May 8, 2020, N=2,452; June 1–5, N=2,174
Virus spread and public health response
Effective response, but (regional) virus resurgence
Broad failure of public health interventions
Rapid and effective controlof virus spread
Knock-on effects and economic policy response
Ineffective interventions
Partially effective interventions
Highly effective interventions
A3
A1 A2
A4 B1
B2
B3 B4 B5
World April →May → June surveys
15→13→16%
11→14→12%
3→2→2%
16→17→19%
31→36→33%
9→7→7%
6→4→5%
6→5→5%
2→1→1%

McKinsey & Company 5 Source: McKinsey surveys of global executives
Executives have wide-ranging expectations of global outcomes: China
1. Monthly surveys: April 2–April 10, 2020, N=2,079, 113 in China; May 4–May 8, 2020, N=2,452, 133 in China; June 1–5, N=2,174, 118 in China
Virus spread and public health response
Effective response, but (regional) virus resurgence
Broad failure of public health interventions
Rapid and effective controlof virus spread
Knock-on effects and economic policy response
Ineffective interventions
Partially effective interventions
Highly effective interventions
A3
A1 A2
A4 B1
B2
B3 B4 B5
China April →May → June surveys
19→19→25%
8→6→7%
6→2→3%
22→32→23%
13→16→16%
9→5→4%
13→14→13%
5→6→6%
4→2→4%

McKinsey & Company 6
-2
-8
-10
-14
0
-6
-12
-4
+Q11 +Q7 +Q8 +Q2 +Q1 +Q3 +Q4 +Q5 +Q6 +Q9 +Q10 +Q12 +Q13 +Q14
Pace of decline of economic activity in Q2 2020 is likely to be the steepest since decline since WWIIHigh frequency indicators for the US-based example show the drop has already started in Q1
Source: Historical Statistics of the United States Vol 3, Bureau of economic analysis, McKinsey team analysis, in partnership with Oxford Economics
Scenario A3
Global financial crisis
73 oil shock
81 recession
Scenario A1
United States, comparison of post-WWII recessions% real GDP draw-down from previous peak
COVID-19 Update

McKinsey & Company 7
Getting ahead of the crisis
What we know for sure
Macro-economic disruption on a scale not seen since our grandparents
By and large, radical acceleration of existing trends
Discrete events disruption industries and businesses
That will take a long (unknown) time to fully play out and will evolve in stages, there is no one finish line
On the other side of the long tunnel, we come out in a different world
Implications
Can’t manage purely as a crisis because this won’t go away like a normal crisis…new operating model
Your budget is kaput and tough to write a new one: need a dynamic, contingent response
Three months is the new year—4x speeding up of the corporate calendar
Need a plan ahead team to get ahead and manage across multiple horizons and scenarios
You are probably solving for a different end game with new threats and new opportunities

McKinsey & Company 8

McKinsey & Company 9
Mobility Market Model is the starting point to assessCOVID-19 effects on mobility
The Mobility Market Model is combined with forecasts from the McKinsey Global Institute on the impact of COVID-19 on global economy.
Based on market observations and the expertise of our global team of mobility experts, the most likely Post-COVID mobility scenario is determined for each region.
The Mobility Market Model is McKinsey’s most granular and comprehensive model covering people mobility globally.
The model is grounded in data from2,800+ cities around the world, and delivers market forecasts on vehicle miles, unit sales, revenue pools.
Mid-term outlook > Modelling fundamentals
S haring
E lectrification
C onnectivity
A utonomous

McKinsey & Company 10
The mobility transition is accelerated by four main drivers which are used as modelling parameters in our model
Regulation
Surcharges/taxes
City center car bans
Tech readiness
EV cost competitiveness
AV cost competitiveness
Consumer Acceptance
Transport mode switch rate
Car retention share
Macroeconomic Impact
GDP
Population growth
Conventional car sales & parc Mobility transition
Impact
Rising GDP & growing population drive car sales in underdeveloped markets
Higher GDP & growing population lead to an increase in miles travelled
City center bans and congestion charges disincentivize private vehicle ownership
Shared and electric mobility benefit from regulation (e.g., emission, tax exemptions for shared vehicles)
Competitive shared & autonomous mobility offering replace private vehicles
Early market maturity & cost competitiveness of autonomous driving tech boosts shared mobility
With attractive shared, electric and autonomous options, Privately owned (ICE) vehicles become less appealing
Large share of consumers make rational choice of switching to EVs and shared AVs at price parity
Source: McKinsey Center for Future Mobility – Mobility Market Model
Modelling parameters
Mid-term outlook > Modelling fundamentals

McKinsey & Company 11
Impact of COVID-19 on the ACES trends differ by trends and region – overall neutral to negative impact
Mid-term outlook > Next Normal
Trend intensified Trend slowed down Trend comparable to pre-COVID
Mid-term Short-term
Consolidation expected by M&A activities (esp. in micromobility), while cities might not take back all restrictions for private vehicles
General slow down expected (Demand drop expected to recover not before mid 2021, financial pressure on start-ups, regulations focused on social distancing), small modifications to reduce risk of infection (e.g., face masks, riders required to sit in back seat)
EV sales back to pre-Covid projections by 2022 in EU and CN; Uncertainty in the US, depending on future regulatory landscape & oil price development
EV market share slightly higher than Pre-COVIDfueled by new incentives (CN, EU) and OEMs fulfilling CO2 targets (EU), with regional slow-down (esp. in parts of the US)
Consolidation in the startup and software tech space; “buy” more likely than build” for OEMs
Limited impact expected as many programs have already been decided and will not be halted
S haring
E lectrification
C onnectivity
A utonomous
Delay in development (“months”) partial consolidation to be expected, eventually increase in cooperation, however importance still high (e.g., contactless delivery)
Testing temporarily suspended; OEM investments expected to slow down
Source: McKinsey Center for Future Mobility
Preliminary

McKinsey & Company 12
European mobility market hit hard by the crisis
Crisis years 2020/21
Auto factories closed
Remote working and closed borders lead to a standstill
Shift away from shared mobility and public transit
in fear of infection
Stocks plummet
Government incentives to stimulate the
purchase of new (electric) vehicles
Consumer acceptance
Investments in Autonomous Driving tech cut back in favor
of short-term cash management
Macroeconomic impact
Tech readiness
Regulation
CO2 emission regulation not loosened, penalty payments eventually deferred / reduced
Source: McKinsey Center for Future Mobility
Demand drop and shortage of capital puts pressure on start ups
Mid-term outlook > market observations today
Europe
Preliminary 06.05.2020

McKinsey & Company 13
In Europe, shared mobility and electric vehicles may see greater uptake post-crisis
One option for a “next normal” 2024
Auto industry recovered
Consumers use multiple modes of transport, including shared mobility solutions
Car sales slightly below pre-crisis levels
Major city centers are car-free
Shared and electric mobility sees an uptake in urban environments
Development of Autonomous-driving technology slows
down
Shared (micro-) mobile market consolidated, and healthy market winners emerged
Consumer acceptance
Macroeconomic impact
Tech readiness
Regulation
Europe
Mid-term outlook > Next NormalPreliminary 06.05.2020

McKinsey & Company 14
COVID-19 is shaking up the U.S. mobility industry
Crisis years 2020/21
Auto factories closed, workers laid off
Decrease in people miles
travelled to remote working
Shift away from shared mobility and public transit to reduce risk of infection
Uptake in single occupancy modes
Stocks and oil prices plummet
$2 trillion Economic stimulus package may help some players
Consumer acceptance
Demand drop and shortage of capital puts pressure
on start ups
AV testing temporarily suspended
Macroeconomic impact
Tech readiness
Regulation
Federal CO2 fleet targets for 2025 suspended
Mid-term outlook > market observation todays
United States
Preliminary 06.05.2020

McKinsey & Company 15
Trends in the U.S. may lead to the continued dominance of road travel and lower electric-vehicle uptake
One option for a “next normal” 2024
Auto industry recovered and plants reopened
Road-based mobility dominates, adoption of electric vehicles might level off
Car sales back to pre-crisis levels Policies to reduce private car ownership are dropped
Loosened emission regulation slows down mobility transition
AV and mobility players landscape Market consolidates, healthy
market winners emerged
Consumer acceptance
Macroeconomic impact
Tech readiness
Regulation
Players double down AV tech
United States
Mid-term outlook > Next NormalPreliminary 06.05.2020

McKinsey & Company 16
Chinese automotive market has already begun to recover
Crisis years 2020/21
Temporary shutdown of auto factories, slight supply restrictions
Slowing global demand leads to a decline in exports
Emission regulations likely not loosened
Consumer acceptance
Demand drop and shortage of capital puts pressure
on start ups
Crisis catalyzes introduction of autonomous delivery robots as
enabler of social distancing
Macroeconomic impact
Tech readiness
Regulation
Extended state subsidies and tax breaks for
New Energy Vehicles (i.e., electric vehicles)
Shift away from shared mobility and public transit
in fear of infection
Source: McKinsey Center for Future Mobility
Mid-term outlook > market observations today
China
Preliminary 06.05.2020

McKinsey & Company 17
Electric mobility will hit the ground running
Car sales recovered quickly, but growing at a slower pace
due to strict regulation
Consumer acceptance
Macroeconomic impact
Tech readiness
Regulation
One option for a “next normal” 2024
License plate lottery
Shared and electric mobility dominates urban environments
Consumers use multiple modes of transport
AV and mobility players landscape
Market consolidated, healthy market winners emerged
Players double down AV tech
Source: McKinsey Center for Future Mobility
China
Mid-term outlook > Next NormalPreliminary 06.05.2020

McKinsey & Company 18

McKinsey & Company 19
Supply chain shocks are often impossible to predict, but happen with regularity
Ability to anticipate (lead time)
Mag
nit
ud
e o
f sh
ock (
$U
S)
Millions
Trillions
10s of billions
No lead time Months or moreDays Weeks
100s of billions
More frequent Less frequent
Hypothetical, grounded in fact A four-part framework to understand disruptions
Expected frequency of a disruption (in years) by duration
1-2 weeks
1-2 months
2.8 Years
2.0 Years
2-4 weeks
2+ months 4.9 years
3.7 Years
Based on expert interviews, n=35
Disruption duration
Source: Expert interviews, literature reviews, press search, McKinsey Global Institute analysis
Surprise disruptions
Surprise catastrophes Global crises
Anticipable disruptions
Terrorism
Acute climate event
Major geophysical
Global militaryconflictFinancial
Crisis
Regulation
Systemic cyber attack
Idiosyncratic (e.g., supplier bankruptcy)
Theft
Counterfeit
Localmilitary conflict
Common cyber attack
Chronicclimate change
Man-made disaster
Pandemic
Trade war
Meteoroid strike Super volcano or earthquake
Extreme pandemic
Extreme terrorism
Solar storm

20
What does strong supply chain
resilience look like?
E2E visibility on risks across the value chain from tier N supplier to customers
Regular stress-testing and reassessment
Supply chain resilience is on the CEO agenda
2
3 4
1
Targeted actions to reduce vulnerability and exposure to shocks
McKinsey & Company

McKinsey & Company 21
Attributes and approaches that make a value chain more/less resilient
• Planning and supplier network
• Transportation and logistics
• Product complexity
• Financial resiliency
• Supply chain organizational effectiveness
Unexpected events that disrupt the value chain
• Force majeure
• Macropolitical
• Malicious actor
• Idiosyncratic
Unexpected value chain disruptions can cause operational and/or financial impact
VulnerabilityShockValue chain risk
Supply chain risk has impact when unexpected events meet vulnerabilities in the supplier network or operations
Source: McKinsey Global Institute analysis

McKinsey & Company 22
Value chains have different exposure to shocks based on their geographic footprint, factors of production, and other factorsResults for select value chains
Overall exposure to
shocks* PandemicLarge-scale cyber-attack Geophysical**
Climate heat shock
Climate flood shock
Trade dispute
Automotive 14 6 9 12 21 18 6
Communication equipment 1 13 3 2 16 7 2
Computer and electronics 6 15 5 4 14 14 9
Aerospace 8 2 1 18 20 21 5
Semiconductors 9 19 6 1 18 23 1
Machinery and equipment 18 9 10 20 17 20 7
Medical device 23 22 8 22 22 22 3
* Full analysis considered 23 value chains; ** e.g., earthquake, tsunami
Disruption risk Better WorseLow High X = Rank in exposure among 23 value chains
Source: McKinsey Global Institute analysis
McKinsey & Company 23
Auto has a ten-year expected value of shock worth 56% of one-years earnings Net present value of expected losses over a 10 year period (% annual EBITDA)1
1. Based on estimated probability of severe disruption (constant across industries) and proportion of revenue at risk due to a shock (varies across industries). Amount is equivalent to one-year’s revenue, i.e., is not recurring over the modelled ten-year period. Calculated by aggregating the cash value of expected shocks over a ten year period based on averages of production-only and production-and-distribution scenarios multiplied by the probability of the event occurring for a given year based on expert input on disruption frequency. The expected cash impact is discounted based on each industry’s weighted average cost of capital2. Based on weighted average revenue of top 25 companies by market cap
NPV of expected losses1
over 10 years (% annual EBITDA)
66.8
56.1
46.7
45.5
41.7
40.5
39.9
39.0
38.9
37.9
34.9
30.0
24.0
Auto
Aerospace (commercial)
Mining
Glass and cement
Petroleum products
Computers and electronics
Electrical equipment
Machinery and equipment
Textiles and apparel
Medical equipment
Food and beverages
Chemicals
Pharmaceuticals
Average
42%
Companies can invest significantly in resilience measures – and come out ahead financially
Source: McKinsey Global Institute analysis

McKinsey & Company 24
Geographic diversification and transparency are the major levers that executives identify to increase the resiliency
Source: McKinsey survey of global Supply Chain leaders (May 15 – 22, 2020)
Main options to increase SC resilience – Automotive & assebly (n=173)
Diversifying geographic footprint of supply network
Increasing transparency throughout the value chain
Increasing supplier operational and/or financial resilience
Qualifying additional suppliers to build redundancy
Increasing the share of production and/or supplier network located domestically
17%
29%
41%
35%
44%
29%
24% Bringing more of our production in-house and/or acquiring key suppliers
Changing product design (i.e., to reduce complexity, to increase substitutability of parts)
McKinsey & Company 25
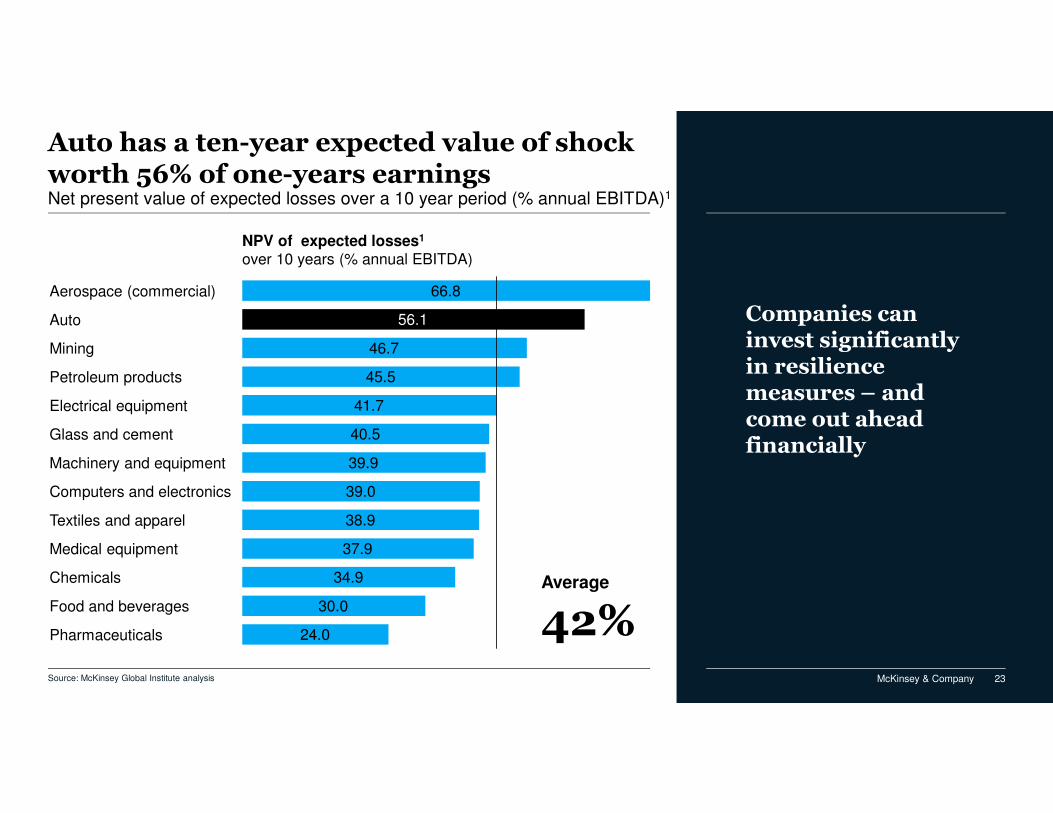
Auto trade in EU and North America is more regionalized than APAC
Intra-regional auto trade by region, 2018
60%
Global
65%
North America
39%
Asia-Pacific
Source: UN Comtrade, McKinsey Global Institute analysis
54
47
1
49
0
45
46
48
51
50
52
53
1995
52.1
53.3
2000
53.3
05
49.7
10
46.7
15
50.4
2019e
3.7 pp
Share of intraregional goods trade in total trade (exports + imports), (1995-2019)Percent
74%
EU27 + UK

McKinsey & Company 26
Low estimate High estimate risk
Low estimate High estimate opportunity
Shifting auto value chains could create opportunities and risks across regionsValue of auto value chain that could shift
North America EU + UK Asia-Pacific
Source: McKinsey Global Institute analysis
$80 - $110 billion Trade that could shift in to the region
Trade that could shift away from the region
$30 - $45 billion
$50 - $65 billion
$105 - $140 billion
$50 - $65 billion
$95 - $130 billion
Each square = $5 billion
We consider eight economic and three non-economic factors that could influence the propensity of a value chain to shift:
Economic� Shifts already unfolding� Capital intensity and economies of scale� Knowledge intensity and specialized
supplier ecosystems� Access to natural resources� Demand growth� Product complexity and substitutability of
inputs� Regionalization of the value chain� Trade intensity
Non-economic� National security� National competitiveness� Self-sufficiency
Opportunity Imports from outside the region adjusted for the feasibility to shift
Risk Exports to outside the region adjusted for the feasibility to shift
Methodology

McKinsey & Company 27
Automobile manufacturers have very similar supply chain structures – and significant overlapAuto companies rely on complex, multi-tiered and interconnected networks
Number of known Tier 1–2 suppliers1
2,427Toyota only
2,347GM only
Shared
1,474
General MotorsRevenue: $137 billion (2019)
GM relies on a similarly sized but more tiered supplier network
ToyotaRevenue: $278 billion (2019)
Toyota relies on a similarly sized but more clustered supplier network
GM
GM’s supplier ecosystem is
deeper3, implying it has potentially less visibility across
sub-tiers
Toyota’s supplier ecosystem is
more clustered2, meaning it is
potentially more exposed to bottlenecks
Toyota
Auto parts manufacturers
Chemicals manufacturers
Auto systems & technology manufacturers
Electronics manufacturers
Steel manufacturers
Auto parts manufacturers
Chemicals manufacturers
Auto systems & technology manufacturers
Electronics manufacturers
Steel manufacturers
1. Based on regulatory and other public disclosures filings; excludes private companies; due to data limitations, some suppliers may be excluded. The results provide a relative overview of connectivity and network structure compared to other companies with similar data availability
2. Clustering is based on the clustering coefficient network, which measures the degree to which nodes cluster together and form interconnected sub-groups.
3. Depth is measured through the network diameter, which is a measure of network size that accounts for the overall structure by measuring the longest shortest path in the network.
Source: Bloomberg, McKinsey Global Institute analysis

McKinsey & Company 28
What CEOs should ask themselves about supply chain resilience
Do we have visibility to the vulnerabilities that exist for the entire supply chain - from our suppliers to our customers and everything in between ?
1
Is my organization reimaging the way we evaluate and mitigate SC vulnerabilities – are we re-optimizing or pushing to re-imagine? Are we utilizing industry 4.0 levers?
Is SC Resilience a topic discussed at the highest levels in the organization and are you evaluating trade-offs to make informed decisions on the type and speed of mitigation plans?
2
3
When making strategic decisions for the organization (e.g., network footprint, sourcing strategy) do you proactively consider SC risks in addition to financial implications?
4

Read the report, Risk, resilience, and rebalancing in global value chains:
http://www.mckinsey.com/valuechainsreport
For a deeper dive, see our climate risk case study, Could climate become the
weak link in your supply chain?
https://mck.co/climatesupplychain
Thank you!
For general MGI inquiries, please contact: [email protected]