Embed Size (px)
Citation preview

fmars-06-00283 June 4, 2019 Time: 15:59 # 1
REVIEWpublished: 05 June 2019
doi: 10.3389/fmars.2019.00283
Edited by:Tong Lee,
NASA Jet Propulsion Laboratory(JPL), United States
Reviewed by:David Sandwell,
University of California, San Diego,United States
Meredith Westington,Office of Coast Survey NOAA,
United States
*Correspondence:Anne-Cathrin Wölfl
Specialty section:This article was submitted to
Ocean Observation,a section of the journal
Frontiers in Marine Science
Received: 01 November 2018Accepted: 15 May 2019
Published: 05 June 2019
Citation:Wölfl A-C, Snaith H,
Amirebrahimi S, Devey CW,Dorschel B, Ferrini V, Huvenne VAI,
Jakobsson M, Jencks J, Johnston G,Lamarche G, Mayer L, Millar D,Pedersen TH, Picard K, Reitz A,
Schmitt T, Visbeck M, Weatherall Pand Wigley R (2019) Seafloor
Mapping – The Challenge of a TrulyGlobal Ocean Bathymetry.
Front. Mar. Sci. 6:283.doi: 10.3389/fmars.2019.00283
Seafloor Mapping – The Challenge ofa Truly Global Ocean BathymetryAnne-Cathrin Wölfl1* , Helen Snaith2, Sam Amirebrahimi3, Colin W. Devey1,Boris Dorschel4, Vicki Ferrini5, Veerle A. I. Huvenne6, Martin Jakobsson7,Jennifer Jencks8, Gordon Johnston9, Geoffroy Lamarche10,11, Larry Mayer12,David Millar13, Terje Haga Pedersen14, Kim Picard15, Anja Reitz1, Thierry Schmitt16,Martin Visbeck1, Pauline Weatherall17 and Rochelle Wigley12
1 GEOMAR Helmholtz Centre for Ocean Research Kiel, Kiel, Germany, 2 British Oceanographic Data Centre, NationalOceanography Centre, Southampton, United Kingdom, 3 FrontierSI, Melbourne, VIC, Australia, 4 Alfred Wegener Institute,Helmholtz Centre for Polar and Marine Research, Bremerhaven, Germany, 5 Lamont–Doherty Earth Observatory, ColumbiaUniversity, Palisades, NY, United States, 6 National Oceanography Centre, Marine Geoscience, Southampton,United Kingdom, 7 Department of Geological Sciences, Stockholm University, Stockholm, Sweden, 8 National Centersfor Environmental Information, National Oceanic and Atmospheric Administration, Boulder, CO, United States, 9 VentureGeomatics Limited, Sutton, United Kingdom, 10 National Institute of Water and Atmospheric Research (NIWA), Wellington,New Zealand, 11 School of Environment, The University of Auckland, Auckland, New Zealand, 12 Center for Coastaland Ocean Mapping, University of New Hampshire, Durham, NH, United States, 13 Fugro USA Marine, Inc., Frederick, MD,United States, 14 Kongsberg Maritime AS, Subsea Division, Horten, Norway, 15 Geoscience Australia, Symonston, ACT,Australia, 16 Service Hydrographique et Océanographique de la Marine, Brest, France, 17 British Oceanographic Data Centre,National Oceanography Centre, Liverpool, United Kingdom
Detailed knowledge of the shape of the seafloor is crucial to humankind. Bathymetrydata is critical for safety of navigation and is used for many other applications. Inan era of ongoing environmental degradation worldwide, bathymetry data (and theknowledge derived from it) play a pivotal role in using and managing the world’soceans in a way that is in accordance with the United Nations Sustainable DevelopmentGoal 14 – conserve and sustainably use the oceans, seas and marine resources forsustainable development. However, the vast majority of our oceans is still virtuallyunmapped, unobserved, and unexplored. Only a small fraction of the seafloor has beensystematically mapped by direct measurement. The remaining bathymetry is predictedfrom satellite altimeter data, providing only an approximate estimation of the shapeof the seafloor. Several global and regional initiatives are underway to change thissituation. This paper presents a selection of these initiatives as best practice examplesfor bathymetry data collection, compilation and open data sharing as well as the NipponFoundation-GEBCO (The General Bathymetric Chart of the Oceans) Seabed 2030Project that complements and leverages these initiatives and promotes internationalcollaboration and partnership. Several non-traditional data collection opportunitiesare looked at that are currently gaining momentum as well as new and innovativetechnologies that can increase the efficiency of collecting bathymetric data. Finally,recommendations are given toward a possible way forward into the future of seafloormapping and toward achieving the goal of a truly global ocean bathymetry.
Keywords: bathymetry, seafloor, mapping, GEBCO, seabed 2030, SDG14
Frontiers in Marine Science | www.frontiersin.org 1 June 2019 | Volume 6 | Article 283

fmars-06-00283 June 4, 2019 Time: 15:59 # 2
Wölfl et al. A Truly Global Ocean Bathymetry
INTRODUCTION
The world’s oceans cover 71% of the Earth. This is about 362million square kilometers of the total surface area (Eakins andSharman, 2010), but only a small fraction has been mapped bydirect observation. The last few years have seen a resurgence inthe recognition of the importance of seafloor mapping and manynational and international initiatives are currently underway.Recent tragedies such as the disappearance of Malaysia Airlinesflight MH370 as well as natural disasters, habitat loss and theincreasing demand for offshore energy and marine resourceshave highlighted the need for better knowledge of the seafloor(e.g., Smith et al., 2017). In 2015, the sustainable developmentof our oceans was targeted in the sustainable developmentgoals (SDG) of the United Nations (UN) that aim to achieve abetter and more sustainable future for all by 2030. Goal 14 –Life below water – aims to conserve and sustainably use theoceans, seas and marine resources through enhanced scientificknowledge and research capacity amongst other things (UnitedNations, 2015). In 2017, the UN proclaimed the Decade ofOcean Science for Sustainable Development (2021–2030) topromote sustainable ocean management highlighting the needfor ocean observation and ocean research. At the same time,the Nippon Foundation-GEBCO Seabed 2030 Project issuedthe challenge to survey the ocean floor across the globe by2030. In addition, inter-governmental agreements, including theGalway Statement (2013) for the North Atlantic and the BelémStatement (2017) for the whole Atlantic, seek to encouragecollaborative ocean research with bathymetric mapping at theircore. All of these initiatives have provided a strong push tobetter understand our oceans and have also increased awarenessof the advantages of data sharing, by both research andcommercial sectors, to reduce duplication of effort and mitigateenvironmental impacts.
Despite collecting data for centuries and, in recent decades,the introduction of new and improved sounding techniques, thedepth of the ocean has been determined over less than 18%of the seafloor using echo-sounders at a resolution of about1 km (Mayer et al., 2018). The current rate of progress is notsufficient to complete the task of mapping the world’s oceans inthe near future without international collaboration, appropriatestrategies and significant technological developments. Large partsof the area beyond the limits of national jurisdiction, wherethe international seabed authority (ISA) organizes and controlsresource-related activities on the seabed and subsoil (UnitedNations, 1982), are still unmapped. Exceptions are areas ofinterest for the marine industry and exploration areas thatare allocated to contractors by the ISA for exploring deep-seamineral resources. Seafloor exploration is also well-advancedin exclusive economic zones (EEZs) of coastal states that havethe capabilities and facilities to conduct mapping surveys.For a better understanding of the marine environment andthe development of sustainable ocean management regimes,a comprehensive and systematic survey of the world’s oceanfloor is essential.
This paper reviews the efforts made so far to produce a trulyglobal ocean bathymetry map derived from direct observation.
An overview of the current state of seafloor mapping is presentedwith a main focus on large-scale ocean mapping solutions.Starting with an outline of the history of seafloor mappingleading up to recent developments including data compilationefforts, it highlights the importance of bathymetric data and givesexamples of their use for societal and environmental benefits.Then a selection of repositories and syntheses is presentedas best practice examples for bathymetry data compilation,archiving of source data, data discoverability and availability.All these initiatives require a strategy that can combine theefforts to accomplish the task of mapping the world’s oceans.The Nippon Foundation-GEBCO Seabed 2030 Project aspires tofacilitate this through global coordination and capacity building,and is briefly introduced in this context. The challenge ofmapping the gaps will be discussed and the seafloor communitynetwork with its main linkages illustrated. Finally, an outlookis given toward the future of seafloor mapping, includingkey recommendations.
THE HISTORY OF SEAFLOOR MAPPING
How Do We Map?Bathymetry deals with the topography of the seafloor. The historyof this branch of hydrography goes back more than 3,000 years,with the first evidence of water depth measurements in historicalrecords from ancient Egypt (Theberge, 1989). The first measuringdevices were sounding poles and lines with weights attachedto them. The first large-scale scientific application using leadweights occurred during the HMS Challenger oceanographicexpedition around the globe in the 1870s. Such “plumb-line”measurements were the standard practice until the beginning ofthe 20th century.
The foundation for replacing plumb-lines with acoustictechniques was laid at the end of the 15th century, when Leonardoda Vinci discovered that ship noise could be heard under waterfrom afar, thereby discovering that sound travels under water(Urick, 1983). Nowadays, a large proportion of the informationwe receive from ocean environments is brought to us by soundwaves, similar to the information carried by electromagneticwaves above water. The trigger for further development ofunderwater acoustic techniques in the beginning of the 20thcentury was the need to detect underwater objects, exemplified bythe search for the Titanic that sank in 1912, as well as submarinewarfare during World War I (Lurton, 2002). This time marks thestart of the echo sounding era.
Single Beam Echo-Sounders (SBES)The development of SBESs constituted a significant improvementin terms of accuracy and efficiency over earlier equipment.SBESs are configured with piezoelectric crystal- or ceramic-basedtransducers that can generate and receive acoustic signals. Thedepth of the seafloor is determined by measuring the two-waytravel time of a sound wave that is sent toward the seafloor andback. This technique combined with accurate measurements ofacoustic wave travel time laid the foundation for this success story(Mayer, 2006).
Frontiers in Marine Science | www.frontiersin.org 2 June 2019 | Volume 6 | Article 283

fmars-06-00283 June 4, 2019 Time: 15:59 # 3
Wölfl et al. A Truly Global Ocean Bathymetry
Multibeam Echo-Sounders (MBES)Multibeam echo-sounder systems became publically availablein the 1970s (e.g., Glenn, 1970; Renard and Allenou, 1979),coincident with the development of the satellite-based navigationsystem global positioning system (GPS), enabling high spatialaccuracy for environmental measurements globally. Multibeamsystems radiate a fan of sound and listen to the returning echoesof the emitted signals in narrow sectors perpendicular to that fan,resulting in the mapping of a swath of seafloor instead of justa line. They have the advantage of collecting higher-resolutionbathymetric data and of making mapping efforts much moreefficient, by mapping an area in a much shorter time compared toSBESs. Modern systems can have many hundreds of beams andcan achieve swath angles between 120 and 150 degrees.
The area on the seafloor that an acoustic beam ensonifies ismainly dependent on beam widths of the transmit and receivebeams, the opening angle chosen by the surveyor and the waterdepth. Small angles and shallow water depths generally result insmaller “acoustic footprints” and therefore higher-resolution datathan large angles and deeper water depths, due to the expansionof the beam as it travels through the water column (Lurton, 2002).This means that very high-resolution data can be obtained usingships in shallow water, but that the resolution decreases withincreasing water depth. In deep water, vehicles operated near theseafloor can address this challenge.
Satellite-Derived Bathymetry (SDB)Two other seafloor mapping techniques are used in coastalenvironments. Collecting bathymetric data with ship-basedsystems in shallow water is substantially more time-consumingand hazardous than collecting deep-water data. SDB frommultispectral satellite imagery, developed in the 1970s, can beused to map shallow areas where water clarity permits. Satelliteplatforms collect data in multiple spectral bands, spanningthe visible through infrared portions of the electromagneticspectrum. Water depth estimations are based on the attenuationof radiance as a function of depth and wavelength in the watercolumn (Pe’eri et al., 2014; IHO and IOC, 2018).
Light Detection and Ranging (LIDAR)Another option to map shallow areas is the use of bathymetricLIDAR, a technique that transmits laser pulses from an airborneplatform and measures their return. The water depth is calculatedfrom the time difference between the reflection from the watersurface and the reflection from the seafloor (Irish and White,1998). However, the use of such optical solutions is limited toshallow areas with optimal water clarity.
Satellite AltimetryThe first altimetric satellites were launched in the 1970s.Altimeters do not directly measure ocean depth, but the heightof the ocean’s surface, which is affected, among other things, bythe gravitational effects of topographic features on the seafloor.When the first satellite-altimetry derived digital terrain model(DTM) was first released it revolutionized the study of platetectonics. Altimetry data have far lower horizontal resolutionthan ship’s bathymetry and provide depth estimates which are
inherently under-determined. They can, however, reveal largegeomorphological features of the ocean floor. Resolution offeatures with horizontal scales as small as 6–9 km can be achievedunder ideal conditions in the deep ocean (Sandwell et al., 2006).Smith and Sandwell (1997) published a topographic map ofthe world’s oceans with a resolution between 1 and 12 km,by combining depth soundings from ships and marine gravitydata from satellite altimetry. The gravity models on which thetopographic maps are based have been updated several timessince (Sandwell et al., 2014).
Current Developments and Future PlansIn order to convert depth soundings into a bathymetricsurface, several steps need to be taken. There is a trendtoward the development of effective automation routines thatinclude data acquisition, vessel-to-shore data transmission anddata processing. The Shell Ocean Discovery XPRIZE challenge(2015–2019) – Discovering the Mysteries of the Deep Sea –designed to accelerate innovation for the rapid and unmannedexploration of the seafloor, is one example that addresses aneed for new technologies in order to meet the goals of variousocean initiatives.
Autonomous SystemsModern multibeam echo-sounders have a size and powerconsumption that makes them suitable for autonomousoperations. The use of autonomous surface vehicles (ASV) andautonomous underwater vehicles (AUV) equipped with suchechosounders can release ships from dedicated mapping activities(Figure 1). The time and human resources (and therefore costs)associated with the ship-based acquisition of bathymetric datacan be considerable. Industry-leading companies are developingvessel-to-shore communication systems to reduce the numberof people needed on board and at the same time enable fullsurvey operability (e.g., Haugen, 2018). Improved vessel-to-shorecommunication not only provide means to remotely controlsurvey operations, but can also ensure rapid and autonomousdelivery of newly acquired multibeam data to research institutes,
FIGURE 1 | Artistic impression of an AUV performing a deep-sea multibeamsurvey (courtesy of Tom Kwasnitschka/Nico Augustin, GEOMAR).
Frontiers in Marine Science | www.frontiersin.org 3 June 2019 | Volume 6 | Article 283

fmars-06-00283 June 4, 2019 Time: 15:59 # 4
Wölfl et al. A Truly Global Ocean Bathymetry
survey companies and ideally data repositories. Communicationmay still be limited by bandwidth and high costs restricting thetransfer of the large volumes of data. An alternative strategy isto process data automatically on the vessel and create productsthat are small enough to be easily transferred over the availableconnection (e.g., Hamilton, 2018).
Making data acquisition autonomous can also reduce safetyrisks by allowing operators to stay away from hazardoussituations and still access traditionally inaccessible regions, e.g.,under ice or navigationally complex areas, such as shallow waters,steep slopes or volcanic areas (e.g., Lucieer et al., 2016; Carlon,2018). Furthermore, in deep water AUVs and remotely operatedvehicles (ROV) can obtain multibeam data with a much higherresolution than ship-based systems, since they are not limited tothe sea surface (Wynn et al., 2014; Kelley et al., 2016; Lucieerand Forrest, 2016) with the most advanced vehicles reachingwater depths of almost 11,000 m (e.g., Bowen et al., 2007). WhileROVs are remotely piloted and powered from a ship, AUVsoperate independently, with their range only limited by theironboard power supply (Huvenne et al., 2018). The deploymentof these near-bottom mapping systems is currently still inefficientfor the mapping of large areas, partly because of their slowspeeds compared to ships. However, in the case of AUVs thiscan be compensated for by multiple vehicles working in tandem.Furthermore, the positioning accuracy for AUVs is still limited,and at present, they are not able to make ship-based surveysobsolete, since it is still essential to roughly understand thebathymetry of an area before a submersible can be sent downtoward the seafloor.
Automated Data Processing and Quality AssuranceThe processing of raw multibeam data into a high-quality dataproduct, often a gridded DTM at the best possible resolution,can take a considerable amount of time and resources for datacleaning, integration of auxiliary data and gridding (Lamarcheet al., 2016). Multiple efforts are underway to accelerate thisprocess, especially with regard to ever-increasing data volumes.With adequate data density achieved by overlapping surveylines, statistical filters can be used for automated data cleaningto identify and exclude spikes or outliers, but with marginaltime benefit. Modern bathymetry processing software all offersome level of filters and automation, but careful human reviewof the product is still needed. In an effort to further improveefficiency of data cleaning and processing, the CUBE (CombinedUncertainty Bathymetry Estimate) model was developed (Calderand Mayer, 2003). As part of this procedure, the TPU (TotalPropagated Uncertainty) is calculated for each sounding, whichcombines information about positional accuracy, environmentalconditions and system performance into one value. The TPU isused to weight the contributions of each sounding to the estimateof depth at a defined position (grid node). Apart from this,other automatic methods for reliably reducing the volume of thebathymetric data have been proposed (e.g., Rezvani et al., 2015).Generally speaking, the automated processing of multibeamdatasets, while potentially offering ways to minimize processingand other resources associated with acquisition, may in somecases result in loss of information and propagation of errors.
Furthermore, in order to ensure fit-for-purpose bathymetricdata, a quality assurance (QA) process is needed. It usuallyencompasses manual effort and working with a number ofdifferent tools to verify and validate acquired data against arange of issues like file corruption, accuracy and consistency,coverage holes or artifacts in the data. The IHO has alreadydeveloped Standards for Hydrographic Surveys (InternationalHydrographic Bureau, 2008) that provide minimum standards tohelp improve the safety of navigation. However, in comparisonwith other technologies, seabed mapping has less standardizationacross the community. Hence, a QA process can contribute tobuilding best practices of data acquisition and processing andfacilitates the compilation of collected data.
WHY DO WE NEED BATHYMETRICDATA?
Knowledge of bathymetry is important for a wide variety ofuses starting with the fundamental understanding of geologicaland oceanographic processes affecting our planet. Early echo-sounding profiles across the Atlantic Ocean for instance enabledBruce Heezen and Marie Tharp to understand the relationshipbetween mid-ocean ridges and earthquake seismicity and playedan important part in the recognition of one of the most significantparadigm shifts in science – the development of the hypothesis ofseafloor spreading and plate tectonics (Hess, 1962).
A seabed mapping user survey conducted in 2018 byGeoscience Australia and FrontierSI captured information fromnational and international stakeholders across all sectors. Itrevealed that habitat mapping and hydrographic charting werethe most common applications for the use of high-resolutionbathymetric data (Amirebrahimi et al., in press).
Seafloor bathymetry is essential for safety of navigation andfor establishing the limits of the extended continental shelf(ECS) under the United Nations Convention on Law of theSea (UNCLOS) (Jakobsson et al., 2003). This exemplifies that adetailed knowledge of a nation’s coastal bathymetry is also vitalfor political and commercial purposes. A few other examples forthe use of bathymetric data are looked at in more detail below.
MH370The recent loss of Malaysia Airlines flight MH370 hashighlighted the lack of detailed bathymetry in large areas ofthe world’s oceans. The existing data in the search area werebased on a bathymetric model derived from marine gravityinformation estimated from satellite-altimetry combined withsonar soundings (Smith and Sandwell, 1997). At the time ofthe search for the fuselage, single and multibeam data coveragein the area was insufficient to deploy deep-water instrumentsto provide a detailed inspection of the seafloor (Picard et al.,2017) and so ship-based bathymetric data had to be collected.By comparing this newly acquired high-resolution data withthe modeled data (Figure 2), it was found that 38% of thegrid cells differed vertically from the high-resolution data bymore than 100 m with maximum differences of 1900 m(Picard et al., 2018).
Frontiers in Marine Science | www.frontiersin.org 4 June 2019 | Volume 6 | Article 283

fmars-06-00283 June 4, 2019 Time: 15:59 # 5
Wölfl et al. A Truly Global Ocean Bathymetry
FIGURE 2 | Plan view of the Diamantina trench seafloor area in the Southeast Indian Ocean. The curtain image shows from top to bottom the data resolutionincrease between altimetry derived bathymetry data, sourced from the SRTM15_PLUS model (Olson et al., 2016), and multibeam bathymetry, gridded at 110 mhorizontal resolution, that was acquired to assist the search for Malaysia Airline flight MH370. Image modified from the MH370 storymap (Australian Government,2017).
Hazard StudiesMarine geohazards are not only of concern to coastalcommunities, but also to industries dealing with marineinfrastructure. Geohazard assessments in the marine realm aremainly based on bathymetric data. Although only a snapshotin time, bathymetric data deepens the understanding of theseafloor fabric and helps to identify potential risks linked tohazardous processes, such as slope failures or turbidity currents,and with repeat surveys, can be used to monitor seafloorchanges over time (Chiocci et al., 2011). Clearly, bathymetricresolution appropriate to the target features is required. Themorphology of the seafloor is also linked to the formationand propagation of tsunamis and is of vital importance in thecontext of tsunami forecasting. Generally, bathymetric datarepresent a fundamental dataset for addressing the growingchallenges associated with climate change (Stocker et al., 2013;Fenty et al., 2016).
Ocean Circulation ModelsBathymetric data are also fundamental to our ability to modelocean circulation, with the predicted location of key circulationfeatures, such as the separation point of the Gulf Stream fromthe United States’ coast, being critically dependent on accuratetopography representation in the model in question (Thompsonand Sallée, 2012; Gula et al., 2015). Similarly, accurate oceanmodels can have a major impact on the ability of climate modelsto simulate global phenomena such as El Niño events (e.g.,Santoso et al., 2011). The resolution requirements of bathymetrydata for the models are limited by the resolution that the oceanmodels themselves are able to achieve. As this resolution isincreasing all the time, there is a growing need for better-resolvedseafloor bathymetry.
Seafloor InstallationsMarine infrastructure development, such as cable laying, pipelineand platform installation, rig anchoring, or deploymentof machines requires high-resolution bathymetric data.Environmental assessments, a requirement prior to any industrialactivity affecting the seafloor, starts with a geomorphometricanalysis of the region. The need for high-resolution bathymetricdata for monitoring of seabed activities will increase in thefuture (Clark et al., 2017; Ellis et al., 2017). Identification andcharacterization of areas suitable for seafloor mining also relyon precise bathymetric information (e.g., Hein et al., 2009). Forinstance, areas of seafloor mineralization from hydrothermal ventsystems can be predicted using high-resolution bathymetric data.
Marine ConservationPrecise seafloor information, foremost high-resolutionbathymetric data, is required to work toward the goal ofprotecting at least 10% of the world’s oceans by 2020 (UNConvention on Biodiversity Aichi Target 11, Sala et al., 2018)and to support the achievement of SDG 14 – Life below water –of the Agenda 2030 for Sustainable Development. Marineprotected areas (MPA) are designated for the protection of themarine environment, but in most cases their initial designationand the development of management plans is hampered by alack of accurate knowledge about the distribution of marinespecies and habitats. The direct visual observation of every partof the seafloor for this purpose is an unrealistic expectation,hence environmental parameters are increasingly used forhabitat predictions (Howell et al., 2011 Rengstorf et al., 2014).Particularly for benthic species, bathymetry has turned out tobe one of the main driving factors behind species distribution.In addition to depth information, associated variables such
Frontiers in Marine Science | www.frontiersin.org 5 June 2019 | Volume 6 | Article 283

fmars-06-00283 June 4, 2019 Time: 15:59 # 6
Wölfl et al. A Truly Global Ocean Bathymetry
as slope, aspect, curvature and terrain variability have beendemonstrated to act as significant predictors in benthic speciesdistribution models (Wilson et al., 2007). Particularly in areaswhere biological information is absent, the availability of reliablebathymetric data provides environmental managers with thechance to create a basic habitat map to guide the development ofmanagement plans.
BATHYMETRIC DATA SOURCES
One large source, by area, of high-quality bathymetric data isfrom research cruises, undertaken by a range of research andgovernment institutions across the globe. Data are traditionallyheld by the host institutions and used for specific researchpurposes. Exceptions are individual agreements with, forexample, funding agencies that oblige institutions to make theirdata publicly available after a certain amount of time. With morewidely accepted data sharing policies, institutions are encouragedto archive their data on central open-access repositories andportals, where data can be easily discovered and freely accessedfor wider purposes. This way data are collected once and canbe used many times. Sharing these data for re-use ensures thatnew data acquisition efforts can focus on unmapped regions andmaximizes return on public investment.
Within a country’s EEZ, national hydrographic offices areusually responsible for the mapping efforts. For many parts ofthe world, these are closely linked to military organizations,reflecting the key importance of bathymetry for naval and defenseoperations. Hydrographic offices are legally responsible for thesafety of navigation under the International Convention for thesafety of life at sea (SOLAS) 1974. Given the physical constraintson gathering large areas of bathymetry in shallow water describedabove, these data are often expensive to acquire in terms of ship-time. Some national hydrographic offices are joining a growingtrend of granting access to their holdings. However, the sensitivityrelated to national security of some of these data is limiting accessto bathymetric information.
Another source of significant amounts of bathymetric data iscommercial survey companies. As commercial exploration andexploitation of the marine environment becomes more extensive,commercial survey companies operate to provide high-resolutionsurvey data to their commercial customers. Whilst the extent ofthese data may be limited to areas with potential for economicdevelopment, they are often of very high resolution and highquality. Since the customers are usually the data owners, it hasbeen uncommon on the past for these data to be made availablein the public domain. Some survey companies, however, arespearheading an effort to communicate the wider significanceand societal benefit of these data to their customers, openingup the possibility of significantly increased public access to thesedata in the future.
Transit Data – Making the Most of EveryNautical MileResearch vessels that operate internationally usually have longtransit routes, whether transiting from port to study area
or between different study areas. Often these routes leadthem through international waters, where data recording isunrestricted. Several nations have procedures in place to collectsuch data and make them publicly available.
In the United States, the Rolling Deck to Repository (R2R)Program was initiated in 2009 to ensure that all underwaydata acquired aboard the United States Academic ResearchFleet is documented and archived in public repositories. Datafrom each cruise are routinely submitted by the vessel operatorto R2R which ensures delivery to the appropriate nationalrepository. This project has resulted in a significant increase ofmultibeam data made available at the International HydrographicOrganization Data Centre for Digital Bathymetry (IHO DCDB).In 2011, the Multibeam Advisory Committee, was formed tohelp coordinate fleet-wide multibeam calibrations and systemmonitoring for the United States Academic Research Fleet andto develop and make publicly available tools and best practicesfor operational procedures that promote the acquisition of high-quality multibeam data. These projects share the common goal ofpromoting high-quality publicly available data and encourage theacquisition of transit data.
In 2015, three German research vessels (RV Maria S. Merian,RV Meteor, and RV Sonne) started to collect multibeam dataon their transit routes, mapping approximately 200,000 km2
every year. Recently, RV Polarstern, a fourth German researchvessel and the Dutch RV Pelagia have announced an intentionto join this approach. The transit data are sent to GEOMARHelmholtz Centre for Ocean Research Kiel, Germany, wherethe data are processed and several data products created. Thedata are integrated into the international Pangaea Data Publisherfor Earth and Environmental Science as well as into the IHODCDB. Data collection is actively supported by the ship’s crewand usually by the chief scientists. Of key importance for gettingthis support has been the commitment to make the data freelyavailable for all.
Another supporting example that transit matters is the searchfor flight MH370. Seabed mapping contractors were asked andagreed very early on to acquire data (at no cost) during transitbetween the search area and the port-of-call, and where possible,to build on the coverage. After over 3 years of operation, transitdata accounted for ∼432,000 km2, the equivalent of 1.5 time thesearch area (238,000 km2). This data was of similar resolution tothe search area, however, it is of lesser quality and density due tothe nature of transit acquisition. Overall, the data collected for thesearch of the flight MH370 was made freely available, but still onlyaccounts for 1% of the Indian Ocean seafloor (Picard et al., 2017).
Crowdsourced BathymetryThe IHO has a history of encouraging both innovative waysto gather data and data maximizing initiatives to gain a betterunderstanding of the bathymetry of the seas, oceans and coastalwaters. In 2014, the IHO, at its Fifth Extraordinary InternationalHydrographic Conference, recognized that traditional surveyvessels alone could not be relied upon to solve our data deficiencyissues and agreed there was a need to encourage and supportall mariners in an effort to “map the gaps.” One outcome ofthe conference was an initiative to support and enable mariners
Frontiers in Marine Science | www.frontiersin.org 6 June 2019 | Volume 6 | Article 283

fmars-06-00283 June 4, 2019 Time: 15:59 # 7
Wölfl et al. A Truly Global Ocean Bathymetry
and professionally manned vessels to collect crowdsourcedbathymetry (CSB) to be used as a powerful source of informationto supplement the more rigorous and scientific bathymetriccoverage generated by hydrographic offices, industry, andresearchers around the world.
An IHO CSB Working Group, comprising internationalscientific, governmental and commercial hydrographic experts,was tasked by the IHO to draft a guidance document meantto empower as many mariners as possible to map the gaps inthe bathymetric coverage of the world’s ocean. The document,which will become an adopted IHO publication in 2019, describeswhat constitutes CSB, the installation and use of data loggers,preferred data formats, and instructions for submitting data tothe IHO DCDB. The document also provides information aboutdata uncertainty to help data collectors and data users betterunderstand quality and accuracy issues with CSB. The workinggroup is now focusing on developing an outreach plan coveringthe “why, what, where, and how” to encourage all vessels at sea tocollect bathymetric data as part of a mariner’s routine operations.
Under the guidance of the working group, NOAA’s nationalcenters for environmental information (NCEI) has implementedthe ability to archive, discover, display and retrieve globalcrowdsourced bathymetric data contributed from marinersaround the world. These data reside in the IHO DCDB whichoffers access to archives of oceanic, atmospheric, geophysical,and coastal data (Jencks et al. “Citizen-Science for the Future:Advisory Case Studies from Around the Globe,” this issue).
Release of Data From National ArchivesMany countries hold large amounts of bathymetric data, but itis often difficult to get access to this data. Countries providingunrestricted access to their data holdings are still an exception.A country’s bathymetric data might ideally be archived in anational data repository, but in reality is often distributed overseveral data archives and institutional repositories throughoutthe country. Few of these archives have open access policies,accordingly, the data are not freely available for others. Data thatare freely available are often not directly downloadable, they areonly available upon request. Another challenge is that nationaldata archives are often only known in the respective country butnot abroad, which makes it difficult to find data.
The availability of bathymetric data is regulated by eachcountry’s national legislation. If a country decides to makeits data available, the question remains of how to make thedata discoverable and accessible to the interested user. Severalbathymetric syntheses, some of which are described below, areaddressing this question. Another collaborative approach hasbeen started by the EU Horizon 2020 research and innovationproject AtlantOS Optimizing and Enhancing the IntegratedAtlantic Ocean Observing System. The project covers variousdisciplines, including seafloor mapping, with the objective ofenhancing ship-based observing networks. Within this approach,several European data centers are working together to tracedeep-sea bathymetric data and integrate them to the IHODCDB in order to make them accessible and usable for thespecialist and non-specialist user. A standard workflow regardingdata integration into the IHO DCDB, including metadata
provision and data transfer, has been successfully established forfuture data transfer.
Release of Private and Commercial DataA source of bathymetric data that has, until recently, been poorlyexploited, is the wealth of data being collected by commercialsurveying companies. For the most part, these data are ownedby the customers of the survey companies that collect them. Asa result, the primary survey data cannot be placed in the publicdomain or contributed to mapping projects without the expresspermission of those customers.
Based on their user survey, Amirebrahimi et al. (in press)highlighted that most participating organizations are willingto contribute to national or international mapping initiatives.However, this is usually done on a case-by-case basis. Theunwillingness of private companies or their clients to have theirdata contributed to public domain was directly linked to thefinancial side of data capture and establishing appropriate licensefor use of the data. By covering the cost of data acquisition,organizations often consider the data their intellectual propertyand accordingly, are not willing to easily share them with others.Additional barriers for releasing data may include but are notlimited to security considerations and confidentiality of data.The perceived sensitivity of the data is sometimes so high thatorganizations are not even willing to publish the coverage or themetadata of the survey data.
GEBCO is working to build relationships with surveycompanies and their customers to release the data they holdor own. The first agreement was made in early 2018 withFugro, a large offshore company providing geotechnical andsurvey services, who acquire vast quantities of bathymetric datawith a global fleet of ocean-going survey vessels. As they movevessels from project to project, they also have the opportunityto collect data during transits as a form of CSB contribution.Since commencing the program, over 167,000 km2 of multibeambathymetric data have been contributed to the IHO DCDB.
In addition, Fugro has begun to make their customers awareof this approach and has begun to explore if there are any termsunder which they might consider donations of data. In manycases, as mentioned above, these datasets may contain market-sensitive information and when this is the case, it is determinedif a reduction in resolution and/or a delay in release may mitigateany data sensitivity concerns. In the first instance, provisionof simple metadata to allow identification of the area of datacoverage and data characteristics is a step forward in identifyingthe areas of seafloor that have already been surveyed, even if thedata cannot yet be released.
Following the success of the Fugro initiative, furthercollaborations are now being developed with other commercialpartners. The best-practice being developed, promoting publicaccess to the transit data through IHO DCDB combined withpotentially limited release of commercially sensitive data, isnow being encouraged across the marine survey industry. It isexpected that this approach will not eliminate the need for marinesite characterization services, but rather increase its demand.Only through a comprehensive mapping of the ocean will areas ofinterest become known. The expectation is that within those areas
Frontiers in Marine Science | www.frontiersin.org 7 June 2019 | Volume 6 | Article 283

fmars-06-00283 June 4, 2019 Time: 15:59 # 8
Wölfl et al. A Truly Global Ocean Bathymetry
of interest, high-resolution mapping services will still be requiredto support marine projects and activities.
BATHYMETRIC DATA REPOSITORIESAND SYNTHESES
Data centers act as central repositories for the secure archiving ofsource data and ideally provide resources for data discoverabilityand access. There are many international, regional and nationalrepositories, including some national hydrographic offices,that serve this function. While we recognize the effortsof some nations in building and managing national datacenters [e.g., Australia with the Geoscience Australia’s MarineData Portal, Japan with DARWIN from the Japan Agencyfor Marine-Earth Science and Technology (JAMSTEC), orFrance with data.shom.fr from the French Hydrographic andOceanographic Service], we have deliberately chosen to focuson one international data repository and several bathymetricsyntheses providing bathymetric data products. In this section,we will introduce some examples and examine their widerinternational linkages regarding data sharing as demonstrationsof best practices. The examples presented here are not intendedas an exhaustive list.
The IHO DCDBThe International Hydrographic Organization Data Centre forDigital Bathymetry (IHO DCDB) was established in 1990 tosteward the worldwide collection of bathymetric data. The intentwas for the center to archive and share, freely and withoutrestrictions, raw unedited single- and multibeam bathymetricdata acquired by hydrographic, oceanographic and other vessels.In the original proposal, the former NOAA national geophysicaldata center (NGDC), now the NCEI, agreed to “operate aworldwide digital data bank of oceanic bathymetry on behalf ofthe Member States of the IHO.”
Almost 30 years later, NCEI and the DCDB remain committedto providing easy, open access to the wealth of data from a varietyof sectors (e.g., industry, government, academia, crowdsourceefforts) for long-term archive, stewardship, and public use.Enabling users to locate and access the data they need iscritical in maximizing the re-use of data. NCEI accomplishesthis with quality standard metadata registered in catalogs tosupport search and discovery, map services that can be usedby anyone as building blocks in custom web applications, andby developing and hosting web map applications that providean intuitive interface to display, select, and download manydifferent types of data.
The public can discover bathymetric data from the IHODCDB Digital Bathymetry viewer (Figure 3). There is also theoption to display a multibeam bathymetry mosaic of NCEI’sbathymetry holdings with elevation values and color shaded reliefvisualizations as well as the single-beam sounding density. Thedata sets are freely accessible and the majority can be directlydownloaded. Along with displaying the DCDB’s bathymetricdata holdings, the viewer also shows the locations of dataaccessible from other repositories (e.g., AusSeabed, Canadian
Hydrographic Service, EMODnet Bathymetry, MAREANO)through the ingestion of their web services. Global seafloormapping campaigns, such as The Galway Initiative and Seabed2030, can use this viewer as a tool for identifying where dataalready exist to reduce costly, duplicative surveying efforts.In addition to encouraging countries, organizations, academia,industry, and individuals to contribute their data, the DCDB alsostrongly encourages other repositories to make their web servicesavailable so that their data holdings can be more broadly shared.
EMODnet BathymetryAn example for a regional bathymetric synthesis for Europe isthe European marine observation and data network (EMODnet).This initiative aims at assembling and granting access toEuropean marine data, data products and metadata from diversesources originating from organizations in countries aroundEuropean seas (Miguez et al. “EMODnet: Roles and Visions,”this issue). The EMODnet Bathymetry Project is an example ofa regional approach that develops and provides a bathymetricDTM for the European seas. The DTM is made publiclyavailable for downloading, whereas access to the source datamight be restricted. User access to source data, generally athigher resolution than the DTM, might be granted by the dataprovider directly upon request, depending on the national and/ordistribution policy of the hosting organization. With this respect,licenses detailing simple acknowledgment of the source data(more than often through DOI identification) tend to generalize.The grid resolution of the model has increased since the earlystages of the project from ∼500 m in 2010, ∼250 m in 2015 to∼115 m in 2018. Each grid cell has a reference to the sourcedata – bathymetric survey via Common Data Index, compositeDTM via the Sextant catalog, and GEBCO in case of gaps – usedfor determining the water depth. The model is produced fromaggregated surveys, collated by a network of contributors frommarine research institutes, hydrographic services, governmentagencies and private companies. In 2018, over 27,000 surveydata sets from 42 providers and 140 composite DTMs from 28providers were included.
The overall EMODnet DTM is generated from thecompilation of the data sources available through a commonlyadopted methodology (Emodnet Bathymetry, 2009). Dataproviders provide metadata and make sure their data areprocessed for erratic soundings and remaining bias. They sampleand pre-grid their datasets with a common software tool intodata files which are handed over to so-called basin coordinators.The task of the coordinators consists of selecting and thenmerging selected datasets for their basin, and building the mostrealistic and accurate regional basin DTM by ensuring a coherentand smooth transition between data sources. Finally, basincoordinators provide their regional DTM to an integrator forcomposing the full DTM (Figure 4).
GMRTThe Global Multi-Resolution Topography (GMRT, Ryan et al.,2009) Synthesis is a global, multi-resolutional Digital ElevationModel (DEM) that includes edited ship-based multibeam dataat full spatial resolution (∼100 m in the deep sea). It began as
Frontiers in Marine Science | www.frontiersin.org 8 June 2019 | Volume 6 | Article 283

fmars-06-00283 June 4, 2019 Time: 15:59 # 9
Wölfl et al. A Truly Global Ocean Bathymetry
FIGURE 3 | The IHO DCDB Bathymetry viewer which displays bathymetric data holdings (including multibeam bathymetry, shown here) from NOAA NCEI, along withdata from other repositories, in order to support ongoing international seafloor mapping efforts.
FIGURE 4 | EMODnet Bathymetry grid (version 2018) around the European waters (www.emodnet-bathymetry.eu) and schematic representation of the tasks androles of each of the contributors of the EMODnet Bathymetry distributed infrastructure.
the Ridge Multibeam Synthesis in 1992 at Columbia University’sLamont-Doherty Earth Observatory and is funded primarilyby the United States National Science Foundation (NSF). Itsinitial purpose was to support research at mid-ocean ridges by
synthesizing available bathymetric data into composite grids andimages. In 2003, the focus of the compilation was extended toinclude the Southern Ocean, and GMRT was initiated with amulti-resolutional architecture maintained in three projections.
Frontiers in Marine Science | www.frontiersin.org 9 June 2019 | Volume 6 | Article 283

fmars-06-00283 June 4, 2019 Time: 15:59 # 10
Wölfl et al. A Truly Global Ocean Bathymetry
Since 2005, GMRT has provided free public access to curatedgridded ocean bathymetric and terrestrial elevation data insupport of global scientific investigations.
A core principle in the design of GMRT is to make elevationdata products accessible to specialist and non-specialist usersalike while providing full attribution to data sources, and accessto source data for advanced users. Access to GMRT is providedthrough a web application called GMRT MapTool, several webservices, and the java-based GeoMapApp desktop application.All of these tools and applications allow access to griddedelevation data in the form of grids, points, and profiles, as wellas images and metadata information. Data can be extractedand downloaded from GMRT at user-defined resolutions in avariety of formats.
Terrestrial and bathymetric elevation components combinedinto GMRT are managed independently, which enables updatingcontent on different schedules. New versions of GMRT arereleased twice each year and typically ∼2 million km2 of newmultibeam data coverage is added annually. Most curatorialeffort for GMRT is focused on preparing and integratingmultibeam data that are publicly available through the IHODCDB. Multibeam data processing and curation efforts arefocused on the needs of the United States Research Community,with an emphasis on data collected by the United States AcademicResearch Fleet both during transits and surveys.
Data curation efforts include ping editing, sound velocitycorrections, adjustments of attitude sensor offsets, the review andassessment of the data in the context of the high-resolution globalcompilation, and other adjustments necessary to create high-quality grids of multibeam data at 100 m resolution or better.Source sonar files that were gridded into the compilation arealso available for download. GMRT v.3.6, which was releasedin December 2018, includes edited multibeam data from 1,046research cruises, conducted between 1980 – 2018 aboard 29different vessels operated by 26 different institutions (Figure 5).This includes more than 225,000 swath data files with more than31 billion input soundings, which together cover an estimatedarea of > 31 Million km2 (8.6%) of the global ocean.
GEBCOThe general bathymetric chart of the oceans (GEBCO) makesavailable a range of bathymetric data sets and data products.It operates under the joint auspices of the internationalhydrographic organization (IHO) and the intergovernmentaloceanographic commission (IOC) of UNESCO (United NationsEducational, Scientific and Cultural Organization).
The GEBCO chart series has its origins at the beginning ofthe 20th Century with the initiation of the first chart series byPrince Albert I of Monaco in 1903. Through the 20th Century,five paper editions of the GEBCO chart series were produced(Figure 6). In response to the need for digital products, thefirst edition of the GEBCO Digital Atlas was published on CD-ROM in 1994. In 2003 the Centenary Edition of the GEBCODigital Atlas was produced and included GEBCO’s first griddedbathymetric product, the GEBCO One Minute Grid.
Published in April 2019, GEBCO’s latest grid, GEBCO_2019,is a global terrain model at 15 arc-second intervals, which
near the equator is about half a kilometer. This is the firstGEBCO grid produced under the framework of the NipponFoundation-GEBCO Seabed 2030 Project. The GEBCO_2019Grid uses Version 1 of the SRTM (Shuttle Radar TopographyMission)15_PLUS data set (Olson et al., 2014) as its base. Thisdata set is a fusion of land topography with measured andestimated seafloor topography. The data set is augmented withbathymetric data sets developed by the four Seabed 2030 RegionalCenters and the international seafloor mapping community.
GEBCO makes available a range of bathymetric products andservices, including:
– GEBCO_2019 grid. A global terrain model at 15 arc-second intervals.
– Gazetteer of Undersea Feature Names. A digital data setgiving the name, generic feature type and geographiclocation of names of features on the seafloor.
– GEBCO world map. The map shows the bathymetry of theworld’s ocean floor in the form of a shaded relief color map.It is based on the GEBCO_08 Grid and can be accessedas an image file.
– GEBCO web map service (WMS). The GEBCO grid isavailable as a WMS, a means of accessing geo-referencedmap images over the internet.
– IHO-IOC GEBCO Cook Book. The Cook Book is atechnical reference manual containing information on thedevelopment of bathymetric grids and related topics.
The current generation of GEBCO gridded data products isreliant on a range of regional and global mapping projects. GMRTroutinely contributes to GEBCO data products. EMODnetBathymetry is another contributor, together with internationalbathymetric chart of the arctic ocean (IBCAO) and internationalbathymetric chart of the southern ocean (IBCSO). Regional gridswere also provided for the Caspian, Black, Baltic and WeddellSeas, and for the parts of the Pacific, Atlantic and Indian Oceansby a variety of national agencies and international projects(Weatherall et al., 2015). This collaboration within GEBCO,taking advantage of regional mapping expertise, is fundamentalto the production of a global high-quality gridded bathymetry.
INTERNATIONAL COLLABORATION INGLOBAL MAPPING
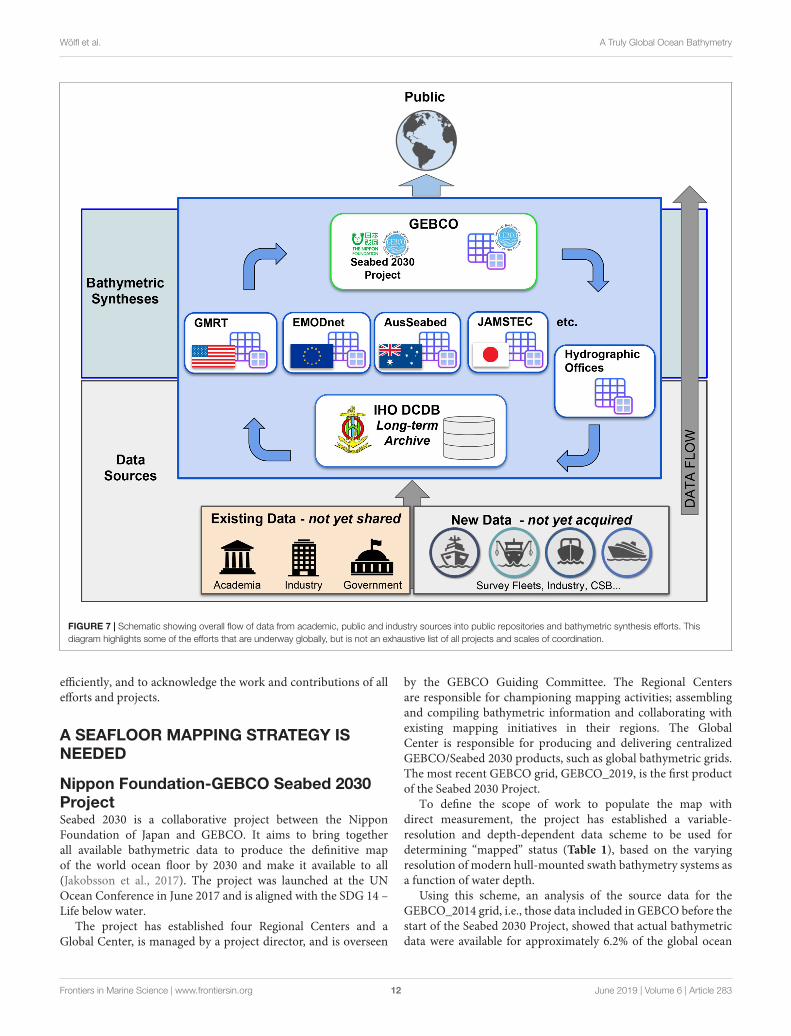
From the descriptions of the example initiatives above, synergiesbetween regional and worldwide bathymetric synthesis effortsis self-evident. Figure 7 shows the general flow of data fromdata sources into publicly accessible repositories and bathymetricsyntheses, and how various synthesis efforts relate to one another.The IHO DCDB serves as the long-term repository for globalbathymetric data, that can receive, archive and make availableexisting data that is not yet shared as well as newly acquireddata. Data sources including CSB as well as bathymetric datafrom the science and the private sector have been described indetail above. In turn, regional and global bathymetric synthesisprojects and initiatives provide quality controlled data products,such as GMRT and EMODnet, are important building blocks
Frontiers in Marine Science | www.frontiersin.org 10 June 2019 | Volume 6 | Article 283

fmars-06-00283 June 4, 2019 Time: 15:59 # 11
Wölfl et al. A Truly Global Ocean Bathymetry
FIGURE 5 | Global extent of curated multibeam sonar data included in GMRT v3.6. Data have been reviewed, processed and gridded at 100 m. Combined withgridded data sets at a variety of resolutions and complemented by the GEBCO basemap, GMRT provides seamless access to global multi-resolutional bathymetricand elevation data.
FIGURE 6 | The Mid-Atlantic Ridge as Portrayed in GEBCO charts since 1903 (courtesy of Anthony Pharaoh, IHO).
that contribute to Seabed 2030 and the GEBCO global map. Alldata products are delivered directly to the public, shared amongsyntheses, and are ultimately assembled at Seabed 2030 into new
regional data products that feed into GEBCO global products.Coordination between and among these efforts is important toavoid duplication of effort, to bring all data sources together
Frontiers in Marine Science | www.frontiersin.org 11 June 2019 | Volume 6 | Article 283
fmars-06-00283 June 4, 2019 Time: 15:59 # 12
Wölfl et al. A Truly Global Ocean Bathymetry
FIGURE 7 | Schematic showing overall flow of data from academic, public and industry sources into public repositories and bathymetric synthesis efforts. Thisdiagram highlights some of the efforts that are underway globally, but is not an exhaustive list of all projects and scales of coordination.
efficiently, and to acknowledge the work and contributions of allefforts and projects.
A SEAFLOOR MAPPING STRATEGY ISNEEDED
Nippon Foundation-GEBCO Seabed 2030ProjectSeabed 2030 is a collaborative project between the NipponFoundation of Japan and GEBCO. It aims to bring togetherall available bathymetric data to produce the definitive mapof the world ocean floor by 2030 and make it available to all(Jakobsson et al., 2017). The project was launched at the UNOcean Conference in June 2017 and is aligned with the SDG 14 –Life below water.
The project has established four Regional Centers and aGlobal Center, is managed by a project director, and is overseen
by the GEBCO Guiding Committee. The Regional Centersare responsible for championing mapping activities; assemblingand compiling bathymetric information and collaborating withexisting mapping initiatives in their regions. The GlobalCenter is responsible for producing and delivering centralizedGEBCO/Seabed 2030 products, such as global bathymetric grids.The most recent GEBCO grid, GEBCO_2019, is the first productof the Seabed 2030 Project.
To define the scope of work to populate the map withdirect measurement, the project has established a variable-resolution and depth-dependent data scheme to be used fordetermining “mapped” status (Table 1), based on the varyingresolution of modern hull-mounted swath bathymetry systems asa function of water depth.
Using this scheme, an analysis of the source data for theGEBCO_2014 grid, i.e., those data included in GEBCO before thestart of the Seabed 2030 Project, showed that actual bathymetricdata were available for approximately 6.2% of the global ocean
Frontiers in Marine Science | www.frontiersin.org 12 June 2019 | Volume 6 | Article 283

fmars-06-00283 June 4, 2019 Time: 15:59 # 13
Wölfl et al. A Truly Global Ocean Bathymetry
TABLE 1 | Seabed 2030 resolution targets at different depth ranges(Mayer et al., 2018).
Depth Grid-cell size
0–1,500 m 100 × 100 m
1,500–3,000 m 200 × 200 m
3,000–5,750 m 400 × 400 m
5,750–11,000 m 800 × 800 m
grid cells, 6% of those in international waters, and 5.7% inEEZ. More than two thirds of the data contribution is forgrid cells in the 3000–5750 m depth range (Figure 8). Usingthe same scheme, the recently released GEBCO_2019 producthas almost 15% of the depth-dependent resolution grid cellsbased on actual data.
Early priorities of the project include identification of existingdata that are not yet included in GEBCO products, usingsources outlined earlier. Seabed 2030 is working on buildingrelationships with the survey companies and their customersto release the data they hold or own for use in generatingthe next generation of GEBCO products. Furthermore, it iscritical that a concerted effort is made to identify other availablesources and how they can be accessed. Achieving this aim,however, is challenging, especially where the data require to betransferred either via internet or in physical storage devices.First-hand experience in the AusSeabed initiative in Australia
has highlighted that transfer of large acoustic seabed dataover the internet is difficult for many organizations and canbe barrier to accessing these data for producing consistent,consolidated products. In addition, QA of the data prior tosubmission is necessary to ensure the data can be easily integratedwith other existing data. Manual work for preparing andintegrating the data and making them available on these end-point portals is another challenge that can become complicatedby the variety of proprietary and open formats commonly usedin the community.
The Seabed 2030 Project also has, as part of its mission,a requirement to work with the wider bathymetry communityto develop strategies for effective mapping. Working throughexisting partnerships, such as IBCAO and IBCSO, explorationefforts are already being concentrated on those areas with noswath bathymetry coverage (Jakobsson et al., 2012; Arndt et al.,2013). The Regional Mapping Committees being developed insupport for the project Regional Centers will aim to expand theseefforts to global international waters.
Mapping the GapsAt present, the chances are still high that any particularmultibeam survey will cover unmapped terrain, especially inthe deep sea remote from much frequented shipping lanes.In the long term a more strategic approach from the seafloormapping community is needed, especially in international waters,
FIGURE 8 | Percentage of the Seabed 2030 target depth-dependent resolution global grid that would be considered “mapped” using the GEBCO_2014 sourcedata, split by contribution from each depth range: calculated as percentage of grid cells in the global ocean, in international waters and in exclusive economic zones(EEZ; all data in Antarctic waters are considered to be outside countries’ EEZs).
Frontiers in Marine Science | www.frontiersin.org 13 June 2019 | Volume 6 | Article 283

fmars-06-00283 June 4, 2019 Time: 15:59 # 14
Wölfl et al. A Truly Global Ocean Bathymetry
in order to avoid duplication of effort, efficiently utilize sea-goingassets, and to mitigate environmental impacts associated withat-sea operations, such as ocean noise. But how do we choosewhere to map? An initial attempt has been made by Wölflet al. (2017) by identifying target areas for future mappinginitiatives in the North Atlantic based on multibeam datadensity and carefully chosen and publicly available marineenvironmental parameters.
Furthermore, there are regions within the ocean that are ofspecial interest for different kinds of stakeholder groups andit seems reasonable to prioritize those regions. However, it isalso important to focus on those regions that are of interestfor coastal states that have neither the capabilities nor thefacilities to perform large mapping surveys with the systems usedby large research institutions and industry. The focus of newtechnological developments is mainly on automation processes,higher-resolution and enhanced data quality at acquisition.Making the technology affordable for a wider range of user groupscurrently seems to be of secondary importance but should betackled as a priority as well.
OUTLOOK AND RECOMMENDATIONS
Understanding the seafloor and associated processes is closelylinked to its bathymetry. Mapping the gaps in the world’soceans will better our knowledge of the seafloor and theoceans in general. This knowledge is a significant contributionto the development of sustainable ocean management plansand allows us to respond appropriately to modern challenges,such as environmental degradation in the marine realm,climate change, geohazards and a growing ocean industry.This paper shows the importance of bathymetric data for avariety of applications, and describes the importance of manyinitiatives and projects that focus on compiling bathymetricdata into publicly available archives and syntheses. Althoughthese initiatives have slightly different approaches and goals,they all have in common a commitment to data sharing, and tomaking data and metadata discoverable and publicly availablefor all. It is clear that mapping the world’s ocean is not a taskthat can be tackled by one sector or project alone, and thatcollaboration and coordination across sectors and at a varietyof scales is needed. Seabed 2030 is a project borne of thisrecognition, as presented at the Forum for Future Ocean FloorMapping, held in Monaco in June 2016. Significant internationalcollaborative efforts already in place within GEBCO, and thebathymetric syntheses described are important components ofglobal mapping initiatives.
The success of future mapping efforts will be reliant on thecontinuation of these existing efforts and appropriate mappingstrategies to provide ever-increasing volumes of high qualitydata from throughout the global oceans. Increasing the flow ofexisting, and new, high-quality data through the IHO DCDB andother recognized data centers from across the marine communityincluding the international research community, the commercialsector and via crowdsourcing programs, will provide a hugeboost to the data availability. The development of more efficient
solutions for data transfer and data processing will be necessaryto keep pace with increasing data volumes.
In sum, an increase in data gathering activities combinedwith effective targeting of future mapping programs and latesttechnology developments, as well as efficient data processingchains and mapping expertise will be needed if we are ever todeliver knowledge of the seafloor comparable to our knowledgeof the land surface.
Based on this paper, the following recommendationsregarding the future of seafloor mapping are given:
• Promotion of collaboration and transparencyamong all sectors.
• Further development of open access data policiesfor all sectors.
• Provision of bathymetric data sets to publicly accessibleonline repositories, or lower resolution products ormetadata information in case of sensitive data.
• Further strategy development regarding new bathymetricdata collection to effectively fill the gaps, leaving a lowenvironmental impact.
• Explore and use opportunities for “underway” datacollection, such as transit data and CSB data acquisition.
• Promote standards and establish a QA process forbathymetric data in the community.
• Continuous incorporation of updated bathymetricinformation into ocean management plans.
• Promote technology developments, regarding enhanceddata quality, but also address the needs of low budget usergroups by developing low budget solutions.
AUTHOR CONTRIBUTIONS
Structure and basic content of the manuscript came from A-CWand HS. The section ‘Bathymetric data repositories and syntheses’was compiled by JJ, TS, VF, and PW. All authors wrote or editeddifferent text sections, reviewed the manuscript and contributedto the responses to the reviewer’s comments.
FUNDING
A-CW has received funding from the European Union’s Horizon2020 Research and Innovation Program under grant agreementno. 633211 (AtlantOS). VH was supported by the CLASSprogramme (NERC Grant No. NE/R015953/1). GL’s contributionwas funded by the Nippon Foundation-GEBCO Seabed 2030Project and by the New Zealand Strategic Science InvestmentFunded (SSIF) programme Marine Geological Resources ofNIWA. This manuscript is published with the permission of theCEO, Geoscience Australia.
ACKNOWLEDGMENTS
The authors would like to thank two reviewers for theirconstructive comments that significantly helped to improvethis manuscript.
Frontiers in Marine Science | www.frontiersin.org 14 June 2019 | Volume 6 | Article 283

fmars-06-00283 June 4, 2019 Time: 15:59 # 15
Wölfl et al. A Truly Global Ocean Bathymetry
REFERENCESAmirebrahimi, S., Picard, K., and Quadros, N. (in press). Multibeam Echo Sounder
Data Acquisition in Australia and Beyond —- User Needs Summary. Record2019/XX. Symonston, ACT: Geoscience Australia.
Arndt, J. E., Schenke, H.-W., Jakobsson, M., Nitsche, F. O., Buys, G., Goleby,B., et al. (2013). The international bathymetric chart of the southern ocean(IBCSO) version 1.0 – a new bathymetric compilation covering circum-antarctic waters. Geophys. Res. Lett. 40, 1–7. doi: 10.1002/grl.50413
Australian Government (2017). The Data Behind the Search for MH370. Availableat: https://geoscience-au.maps.arcgis.com/apps/Cascade/index.html?appid =038a72439bfa4d28b3dde81cc6ff3214 (accessed April 6, 2019).
Bowen, A., Yoerger, D., and Whitcomb, L. (2007). “Hybrid ROV for 11,000 meteroperations,” in Proceedings of the Symposium on Underwater Technology andWorkshop on Scientific Use of Submarine Cables and Related Technologies,Tokyo, 206–207.
Calder, B. R., and Mayer, L. A. (2003). Automatic processing of high-rate, high-density multibeam echosounder data. Geochem. Geophys. Geosyst. 4
Carlon, R. (2018). Going where no humans should go – unmanned surface vehiclesmonitoring kilauea volcano lava flow. Hydro Int. 22, 23–25.
Chiocci, F. L., Cattaneo, A., and Urgeles, R. (2011). Seafloor mapping for geohazardassessment: state of the art. Mar. Geophys. Res. 32, 1–11. doi: 10.1007/s11001-011-9139-8
Clark, M. R., Rouse, H. L., Lamarche, G., Ellis, J. I., and Hickey, C. (2017).Preparation of Environmental Impact Assessments: General Guidelines forOffshore Mining and Drilling with Particular Reference to New Zealand. ReportNo: NIWA Science and Technology Series. Wellington: NIWA.
Eakins, B. W., and Sharman, G. F. (2010). Volumes of the World’s Oceans fromETOPO1. Boulder, CO: NOAA National Geophysical Data Center.
Ellis, J., Clark, M., Rouse, H., and Lamarche, G. (2017). Environmentalmanagement frameworks for offshore mining: the New Zealand approach. Mar.Policy 84, 178–192. doi: 10.1016/j.marpol.2017.07.004
Emodnet Bathymetry (2009). Guidelines for Metadata, Data and DTM QA/QC.Europe: EMODnet.
Fenty, I., Willis, J. K., Khazendar, A., Dinardo, S., Forsberg, R., Fukumori, I., et al.(2016). Oceans melting greenland: early results from NASA’S ocean-ice missionin greenland. Oceanography 29, 72–83. doi: 10.5670/oceanog.2016.100
Glenn, M. F. (1970). Introducing an operational multi-beam array sonar. Int.Hydrogr. Rev. 47:35.
Gula, J., Molemaker, M. J., and McWilliams, J. C. (2015). Gulf stream dynamicsalong the southeastern U.S. Seaboard. J. Phys. Oceanogr. 45, 690–715. doi:10.1175/JPO-D-14-0154.1
Hamilton, T. (2018). Improving survey efficiency through real-time surveyvisualization. Fredericton, NB: Teledyne CARIS Incorporated
Haugen, J. J. (2018). Expanding operations over the horizon - optimising workflowson the maritime information highway. Hydro Int. 22, 27–29.
Hein, J. R., Conrad, T. A., and Dunham, R. E. (2009). Seamount characteristics andmine-site model applied to exploration- and mining-lease-block selection forcobalt-rich ferromanganese crusts. Mar. Georesour. Geotechnol. 27, 160–176.doi: 10.1080/10641190902852485
Hess, H. H. (1962). “History of ocean basins,” in Petrologic Studies: A Volume toHonor, eds A. F. Buddington, A. E. J. Engel, H. L. James, and B. F. Leonard(Boulder, CO: Geological Society of America), 599–620. doi: 10.1130/petrologic.1962.599
Howell, K. L., Holt, R., Endrino, P., and Stewart, H. (2011). When the species isalso a habitat: comparing the predictively modelled distributions of Lopheliapertusa and the reef habitat it forms. Biol Conserv. 144, 2656–2665. doi: 10.1016/j.biocon.2011.07.025
Huvenne, V. A. I., Robert, K., Marsh, L., Lo Iacono, C., Le Bas, T. P., and Wynn,R. B. (2018). “ROVs and AUVs,” in Submarine Geomorphology, eds A. Micallef,S. Krastel, and A. Savini (Heidelberg: Springer), 93–108.
IHO and IOC (2018). The IHO-IOC GEBCO Cook Book. Monaco: IHO.International Hydrographic Bureau (2008). IHO Standards for Hydrographic
Surveys, 5th Edn. Monaco: IHO.Irish, J. L., and White, T. E. (1998). Coastal engineering applications of high-
resolution lidar bathymetry. Coast. Eng. 35, 47–71. doi: 10.1016/S0378-3839(98)00022-2
Jakobsson, M., Allen, G., Carbotte, S. M., Falconer, R., Ferrini, V., Marks, K., et al.(2017). The Nippon Foundation - GEBCO - Seabed 2030: Roadmap for FutureOcean Floor Mapping. Available at: https://www.gebco.net/documents/seabed_2030_roadmap_v10_low.pdf (accessed July 27, 2018).
Jakobsson, M., Mayer, L., and Armstrong, A. (2003). Analysis of data relevant toestablishing outer limits of a continental shelf under law of the sea article 76.Int. Hydrogr. Rev. 4, 1–18.
Jakobsson, M., Mayer, L. A., Coakley, B. J., Dowdeswell, J. A., Forbes, S.,Fridman, B., et al. (2012). The international bathymetric chart of the arcticocean (IBCAO) version 3.0. Geophys. Res. Lett. 39:L12609. doi: 10.1029/2012GL052219
Kelley, C., Kerby, T., Sarradin, P., Sarrazin, J., and Lindsay, D. J. (2016).“Submersibles and Remotely Operated Vehicles,” in Biological Sampling in theDeep Sea, eds M. R. Clark, M. Consalvey, and A. A. Rowden (Hoboken, NJ:Wiley Blackwell).
Lamarche, G., Orpin, A., Mitchell, J., and Pallentin, A. (2016). “Benthic habitatmapping,” in Biological Sampling in the Deep Sea, eds M. R. Clark, M. Consalvey,and A. A. Rowden (Hoboken, NJ: Wiley-Blackwell).
Lucieer, V. L., and Forrest, A. L. (2016). “Emerging mapping techniques forautonomous underwater vehicles (AUVs),” in Seafloor Mapping AlongContinental Shelves: Research and Techniques for Visualizing BenthicEnvironments, eds W. C. Finkl and C. Makowski (Cham: Springer InternationalPublishing).
Lucieer, V. L., Nau, A. W., Forrest, A. L., and Hawes, I. (2016). Fine-Scale sea icestructure characterized using underwater acoustic methods. Remote Sens. 8:821.doi: 10.3390/rs8100821
Lurton, X. (2002). An Introduction to Underwater Acoustics, Principles andApplications. Cham: Springer.
Mayer, L. (2006). Frontiers in seafloor mapping and visualization. Mar. Geophys.Res. 27, 7–17. doi: 10.1007/s11001-005-0267-x
Mayer, L., Jakobsson, M., Allen, G., Dorschel, B., Falconer, R., Ferrini, V., et al.(2018). The nippon foundation—GEBCO seabed 2030 project: the quest to seethe world’s oceans completely mapped by 2030. Geosciences 8:63. doi: 10.3390/geosciences8020063
Olson, C. J., Becker, J. J., and Sandwell, D. T. (2014). “A new global bathymetrymap at 15 arcsecond resolution for resolving seafloor fabric: SRTM15_PLUS,”in Proceedings of the AGU Fall Meeting Abstracts 2014, San Francisco, CA.
Olson, C. J., Becker, J. J., and Sandwell, D. T. (2016). SRTM15_PLUS: Data Fusionof Shuttle Radar Topography Mission (SRTM) Land Topography with Measuredand Estimated Seafloor Topography (NCEI Accession 0150537). Version 1.1.Asheville: NOAA National Centers for Environmental Information.
Pe’eri, S., Parrish, C., Azuike, C., Alexander, L., and Armstrong, A. (2014). Satelliteremote sensing as reconnaissance tool for assessing nautical chart adequacyand completeness. Mar. Geod. 37, 293–314. doi: 10.1080/01490419.2014.902880
Picard, K., Brooke, B. P., Harris, P. T., Siwabessy, P. J. W., Coffin, M. F., Tran, M.,et al. (2018). Malaysia Airlines flight MH370 search data reveal geomorphologyand seafloor processes in the remote southeast Indian Ocean. Mar. Geol. 395,301–319. doi: 10.1016/j.margeo.2017.10.014
Picard, K., Smith, W. H., Tran, M., Siwabessy, J. P., and Kennedy, P. (2017).Increased resolution bathymetry in the southeast indian ocean. HydroInternational Magazine. Available at: https://www.hydro-international.com/content/article/increased-resolution-bathymetry-in-the-southeast-indian-ocean (accessed September 28, 2017).
Renard, V., and Allenou, J. P. (1979). SeaBeam multibeam echo sounding injean charcot: description, evaluation and first results. Intern. Hydrog. Rev. 1,35–67.
Rengstorf, A. M., Mohn, C., Brown, C., Wisz, M. S., and Grehan, A. J. (2014).Predicting the distribution of deep-sea vulnerable marine ecosystems usinghigh-resolution data: considerations and novel approaches. Deep Sea Res. PartI Oceanogr. Res. Pap. 93, 72–82. doi: 10.1016/j.dsr.2014.07.007
Rezvani, M.-H., Sabbagh, A., and Ardalan, A. A. (2015). Robust automaticreduction of multibeam bathymetric data based on M-estimators. Mar. Geod.38, 327–344. doi: 10.1080/01490419.2015.1053639
Ryan, W. B. F., Carbotte, S. M., Coplan, J. O., O’Hara, S., Melkonian, A., Arko, R.,et al. (2009). Global multi-resolution topography synthesis. Geochem. Geophys.Geosyst. 10, 1525–2027. doi: 10.1029/2008GC002332
Frontiers in Marine Science | www.frontiersin.org 15 June 2019 | Volume 6 | Article 283

fmars-06-00283 June 4, 2019 Time: 15:59 # 16
Wölfl et al. A Truly Global Ocean Bathymetry
Sala, E., Lubchenco, J., Grorud-Colvert, K., Novelli, C., Roberts, C., and Sumaila,U. R. (2018). Assessing real progress towards effective ocean protection. Mar.Policy 91, 11–13. doi: 10.1016/j.marpol.2018.02.004
Sandwell, D. T., Müller, R. D., Smith, W. H. F., Garcia, E., and Francis, R. (2014).New global marine gravity model from Cryo-Sat-2 and jason-1 reveals buriedtectonic structure. Science 346, 65–67. doi: 10.1126/science.1258213
Sandwell, D. T., Smith, W. H. F., Gille, S., Kappel, E., Jayne, S., Soofi, K., et al.(2006). Bathymetry from space: rationale and requirements for a new, high-resolution altimetric mission. C. R. Geosci. 338, 1049–1062. doi: 10.1016/j.crte.2006.05.014
Santoso, A., Cai, W., England, M. H., and Phipps, S. J. (2011). The role ofthe indonesian throughflow on ENSO dynamics in a coupled climate model.J. Clim. 24, 585–601. doi: 10.1175/2010JCLI3745.1
Smith, W., Marks, K., and Schmitt, T. (2017). Airline flight paths over theunmapped ocean. EOS 98
Smith, W. H. F., and Sandwell, D. T. (1997). Global seafloor topography fromsatellite altimetry and ship depth soundings. Science 277, 1957–1962.
Stocker, T. F., Qin, D., Plattner, G.-K., Tignor, M., Allen, S. K., Boschung, J.,et al. (2013). Climate Change 2013: The Physical Science Basis. Cambridge:Cambridge University Press.
Theberge, A. E. (1989). “Sounding pole to sea beam,” in Paper Presented at the 1989ASPRS/ACSM Annual Convention Surveying and Cartography, (Silver Spring,MD: NOAA Central Library), 334–346.
Thompson, A. F., and Sallée, J.-B. (2012). Jets and topography: jet transitions andthe impact on transport in the antarctic circumpolar current. J. Phys. Oceanogr.42, 956–972. doi: 10.1175/jpo-d-11-0135.1
United Nations (1982). Convention on the Law of the Sea (UNCLOS). Availableat: http://www.un.org/depts/los/convention_agreements/texts/unclos/unclos_e.pdf (accessed December 10, 1982).
United Nations (2015). Transforming Our World: the 2030 Agenda for SustainableDevelopment. Available at: https://sustainabledevelopment.un.org/post2015/transformingourworld/publication (accessed October 21, 2015).
Urick, R. J. (1983). Principles of Underwater Sound, 3rd Edn. New York, NY:McGraw-Hill.
Weatherall, P., Marks, K. M., Jakobsson, M., Schmitt, T., Tani, S.,Arndt, J. E., et al. (2015). A new digital bathymetric model of theworld’s oceans. Earth Space Sci. 2, 331–345. doi: 10.1002/2015ea000107
Wilson, M. F. J., O’Connell, B., Brown, C., Guinan, J. C., and Grehan, A. J.(2007). Multiscale terrain analysis of multibeam bathymetry data for habitatmapping on the continental slope. Mar. Geod. 30, 3–35. doi: 10.1080/01490410701295962
Wölfl, A.-C., Jencks, J., Johnston, G., Varner, J. D., and Devey, C. D.(2017). Where to go next? Identifying target areas in the northatlantic for future seafloor mapping initiatives. J. Ocean Technol. 12,28–42.
Wynn, R. B., Huvenne, V. A. I., Le Bas, T. P., Murton, B. J., Connelly, D. P., Bett,B. J., et al. (2014). autonomous underwater vehicles (AUVs): their past, presenceand future contributions to the advancement of marine geoscience. Mar. Geol.352, 451–468. doi: 10.1016/j.margeo.2014.03.012
Conflict of Interest Statement: GJ was employed by company VentureGeomatics Limited. DM was employed by company Fugro USA Marine, Inc.TP was employed by company Kongsberg Maritime AS. SA was employed bycompany FrontierSI. All other authors declare no competing interests.
Copyright © 2019 Wölfl, Snaith, Amirebrahimi, Devey, Dorschel, Ferrini, Huvenne,Jakobsson, Jencks, Johnston, Lamarche, Mayer, Millar, Pedersen, Picard, Reitz,Schmitt, Visbeck, Weatherall and Wigley. This is an open-access article distributedunder the terms of the Creative Commons Attribution License (CC BY). The use,distribution or reproduction in other forums is permitted, provided the originalauthor(s) and the copyright owner(s) are credited and that the original publicationin this journal is cited, in accordance with accepted academic practice. No use,distribution or reproduction is permitted which does not comply with these terms.
Frontiers in Marine Science | www.frontiersin.org 16 June 2019 | Volume 6 | Article 283