Embed Size (px)
Citation preview

Record 2015/24 | GeoCat 79136
Seabed environments, shallow sub‑surface geology and connectivity, Petrel Sub‑basin, Bonaparte Basin, Timor SeaInterpretative report from marine survey GA0335/SOL5463
Nicholas, W. A., Carroll, A., Picard, K., Radke, L., Siwabessy, J., Chen, J., Howard, F. J. F., Dulfer, H., Tran, M., Consoli, C., Przeslawski, R., Li, J., Jones, L. E. A.
APPLYING GEOSCIENCE TO AUSTRALIA’S MOST IMPORTANT CHALLENGES www.ga.gov.au


Seabed environments, shallow sub-surface geology and connectivity, Petrel Sub-basin, Bonaparte Basin, Timor Sea Interpretative report from marine survey GA0335/SOL5463
GEOSCIENCE AUSTRALIA RECORD 2015/24
Nicholas, W. A., Carroll, A., Picard, K., Radke, L., Siwabessy, J., Chen, J., Howard, F. J. F., Dulfer, H., Tran, M., Consoli, C., Przeslawski, R., Li, J., Jones, L. E. A.

Department of Industry, Innovation and Science Minister for Resources, Energy and Northern Australia: The Hon Josh Frydenberg MP Assistant Minister for Science: The Hon Karen Andrews MP Secretary: Ms Glenys Beauchamp PSM
Geoscience Australia Chief Executive Officer: Dr Chris Pigram This paper is published with the permission of the CEO, Geoscience Australia
© Commonwealth of Australia (Geoscience Australia) 2015
With the exception of the Commonwealth Coat of Arms and where otherwise noted, this product is provided under a Creative Commons Attribution 4.0 International Licence. (http://creativecommons.org/licenses/by/4.0/legalcode)
Geoscience Australia has tried to make the information in this product as accurate as possible. However, it does not guarantee that the information is totally accurate or complete. Therefore, you should not solely rely on this information when making a commercial decision.
Geoscience Australia is committed to providing web accessible content wherever possible. If you are having difficulties with accessing this document please email [email protected].
ISSN 2201-702X (PDF)
ISBN 978-1-925124-85-9 (PDF)
GeoCat 79136
Bibliographic reference: Nicholas, W.A., Carroll, A., Picard, K., Radke, L., Siwabessy, J., Chen, J., Howard, F.J.F., Dulfer, H., Tran, M., Consoli, C., Przeslawski, R., Li, J. & Jones, L.E.A. 2015. Seabed environments, shallow sub-surface geology and connectivity, Petrel Sub-basin, Bonaparte Basin, Timor Sea: Interpretative report from marine survey GA0335/SOL5463. Record 2015/24. Geoscience Australia, Canberra. http://dx.doi.org/10.11636/Record.2015.024

Contents
Executive Summary .................................................................................................................................. 1
1 Introduction ............................................................................................................................................ 3 1.1 Scope and aims ............................................................................................................................... 3
1.1.1 Survey area and outline of this report ........................................................................................ 6
2 Setting.................................................................................................................................................... 7 2.1 Regional geology ............................................................................................................................. 7 2.2 Flat Top 1 well .................................................................................................................................. 7 2.3 Modern marine environments ........................................................................................................11 2.4 Evolution of the Quaternary Bonaparte Shelf ................................................................................12 2.5 Regional evidence of hydrocarbon seepage .................................................................................15 2.6 Evidence of seepage within the Petrel Sub-basin .........................................................................15
3 Methods ...............................................................................................................................................18 3.1 Overview ........................................................................................................................................18
3.1.1 Geomorphic feature mapping ...................................................................................................18 3.1.2 Pockmark identification and mapping ......................................................................................19 3.1.3 Relationships among backscatter, hardness and pockmarks ..................................................19 3.1.4 Sedimentology ..........................................................................................................................20 3.1.5 Seabed sediment geochemistry ...............................................................................................20 3.1.6 Isotopic composition of carbonates ..........................................................................................21 3.1.7 Headspace gas and organic soluble matter compounds .........................................................21
3.2 Ecological analyses .......................................................................................................................22 3.2.1 Biological analyses ...................................................................................................................22 3.2.2 Towed underwater imagery ......................................................................................................22 3.2.3 Mollusc identification ................................................................................................................22
3.3 Radiocarbon dating ........................................................................................................................23 3.4 Acoustic sub-bottom profiles ..........................................................................................................23
4 Results: Seabed properties, geomorphology and habitats .................................................................24 4.1 Seabed geomorphology and sediments of Area 1 ........................................................................24
4.1.1 Geomorphology ........................................................................................................................24 4.1.2 Relationships between seabed features and acoustic hardness .............................................28 4.1.3 Surface sediment composition and texture ..............................................................................32 4.1.4 Vibrocore sediments (<3.5 m depth) ........................................................................................32 4.1.5 Radiocarbon chronology ..........................................................................................................40 4.1.6 Surface sediment geochemistry ...............................................................................................41 4.1.7 Carbonate isotopes of brown pellets ........................................................................................43 4.1.8 Silver in seabed surface sediments .........................................................................................47 4.1.9 Head-space gas carbon compounds and carbon isotopes ......................................................48 4.1.10 Taraxerol and other immature compounds ............................................................................52
4.2 Benthic habitats of Area 1 ..............................................................................................................52 4.2.1 Towed Video Imagery ..............................................................................................................54
4.3 Seabed geomorphology and sediments of Area 2 ........................................................................58 4.3.1 Relationships between seabed features and acoustic hardness .............................................61
Seabed environments, shallow sub-surface geology and connectivity, Petrel Sub-basin iii

4.3.2 Surface sediment composition and texture ..............................................................................61 4.4 Benthic habitats of Area 2 ..............................................................................................................61
5 Results: Sub-surface geology .............................................................................................................65 5.1 Shallow sub-surface geology: Area 1 ............................................................................................70
5.1.1 Overview of data collected .......................................................................................................70 5.1.2 Seismic velocities in sub-bottom profiles .................................................................................70 5.1.3 Reflectors: general observations ..............................................................................................71
5.2 Sub-surface acoustic stratigraphy: Area 1 .....................................................................................72 5.2.1 Acoustic units ...........................................................................................................................72 5.2.2 Acoustic anomalies ..................................................................................................................73
5.3 Connectivity of the seabed and shallow geology: Area 1 ..............................................................78 5.3.1 Buried Channels .......................................................................................................................78 5.3.2 Pockmarks ................................................................................................................................80 5.3.3 Low-lying ridges .......................................................................................................................80
5.4 Shallow sub-surface geology: Area 2 ............................................................................................84 5.4.1 Overview of data collected .......................................................................................................84 5.4.2 Seismic velocities in sub-bottom profiles, Area 2 .....................................................................86 5.4.3 Reflectors: general observations, Area 2 .................................................................................87
5.5 Sub-surface acoustic stratigraphy: Area 2 .....................................................................................89 5.5.1 Acoustic units ...........................................................................................................................89 5.5.2 Acoustic anomalies ..................................................................................................................89
5.6 Connectivity of the seabed and shallow geology: Area 2 ..............................................................91 5.6.1 Terraced northeast of Flat Top 1 well ......................................................................................91 5.6.2 Ridges ......................................................................................................................................93 5.6.3 Hummocky channelised areas and pockmarks on plains ........................................................97 5.6.4 Pockmarks associated with banks and ridges .........................................................................97 5.6.5 Debris accumulations ...............................................................................................................97
6 Interpretation and discussion ............................................................................................................100 6.1 Evolution of seabed environment: Area 1 ....................................................................................100
6.1.1 Overview.................................................................................................................................100 6.1.2 Palaeoenvironment ................................................................................................................100
6.2 Evolution of seabed environments: Area 2 ..................................................................................105 6.2.1 Overview.................................................................................................................................105 6.2.2 Palaeoenvironment ................................................................................................................105
6.3 Seabed evidence for fluid migration processes ...........................................................................107 6.3.1 Geochemical evidence for fluid seepage and sedimentary processes at the seabed ...........108 6.3.2 Potential fluid migration pathways to seabed .........................................................................112 6.3.3 Origin of gases in the seabed and shallow sub-surface sediments .......................................113 6.3.4 Pockmark genesis ..................................................................................................................114
7 Summary ...........................................................................................................................................116
8 Future work and recommendations ...................................................................................................117
9 Acknowledgements ...........................................................................................................................118
10 References ......................................................................................................................................119
Post-processing of bathymetry data .................................................................................126 Appendix A
Pockmark identification and mapping ...............................................................................127 Appendix B
Summary of geochemistry processing and analytical techniques ....................................128 Appendix C
iv Seabed environments, shallow sub-surface geology and connectivity, Petrel Sub-basin

Executive Summary
The Petrel Sub-basin has been investigated by Geoscience Australia (GA) as part of the Australian Government funded National Low Emissions Coal Initiative (NLECI) to accelerate the development and deployment of low emissions coal technologies including geological sequestration of CO2.This report provides an analysis and evaluation of links between potential fluid seepage at the seabed and shallow geology, and of habitats in two areas of the Petrel Sub-basin, Bonaparte Basin, northern Australia.
This project involved the integration of physical, chemical and biological data to characterise the seabed and its shallow sub-surface geology. The primary aims were to:
• Assist in the assessment of seal integrity by identifying possible migration pathways for CO2 from the potential reservoir in the shallow sub-surface (<100 m depth) directly below the seabed.
• Identify and map seabed environments and habitats to provide a baseline for potential environmental impacts arising from future CO2 injection and storage.
In May 2012 the marine survey GA0335 (SOL5463) was undertaken in collaboration with the Australian Institute of Marine Science (AIMS) to acquire seabed and shallow sub-surface data in two shelf locations within the Petrel Sub-basin. Area 1 is located towards the centre of the Petrel Sub-basin and Area 2 is on the eastern side of the Petrel Sub-basin. Data was collected to characterise the bathymetry, geomorphology, sediment composition and chemistry, habitats and biological communities, sub-surface stratigraphy, acoustic anomalies and connectivity of seabed features to shallow sub-surface geological features including faults and fluid migration pathways.
At approximately the same time, a 2D reflection seismic survey, GA0336, was completed over the Petrel Sub-basin. Data from this survey was utilised to provide basin-scale context for the acoustic sub-bottom profiles acquired during the GA0335 marine survey.
Area 1 was chosen as it is above the 800 m CO2 seal boundary. It is positioned where buried channels may be located allowing an assessment of potential sedimentary controlled migration pathways . Area 2 is located above basin-scale faults that underlie the Flat Top bank structure (e.g. Gibson-Poole et al., 2002; Consoli et al., 2014). This provides an opportunity to study the structural connectivity of the deeper and shallower succession. The two study areas are located close to areas previously investigated by Geoscience Australia in the eastern Joseph Bonaparte Gulf (Anderson et al., 2011, Heap et al., 2010, Przeslawski et al., 2011). Data from previous GA studies were utilised to provide additional information on the seabed.
The primary finding of this study is that there is no evidence for migration of thermogenic hydrocarbons from the deeper Petrel Sub-basin to the seabed in the two surveyed areas. However, the results do indicate fluid migration from the shallow sub-surface to the seabed. This shallow fluid migration is likely driven by the formation of CO2 gas in the shallow sub-surface.
Area 1 lies in water depths of 78–102 m, has low relief, and is characterised by plains, shallow palaeochannels, low-lying ridges and fields of shallow pockmarks. Single pockmarks and pockmark clusters <1 m deep are present on the plains, tightly clustered pockmarks are located adjacent to some low-lying ridges, and loosely clustered pockmarks, some up to 2 m deep, exist within
Seabed environments, shallow sub-surface geology and connectivity, Petrel Sub-basin 1

palaeochannels. These features are interpreted to be associated with global changes in sea-level. The seabed in Area 1 comprises a relict estuarine/coastal plain environment that was rapidly inundated by the sea following the Last Glacial Maximum (LGM) sea-level lowstand.
Seabed habitats in Area 1 include barren sediments, bioturbated sediments, and mixed patches. Benthic assemblages generally correspond with the seabed geomorphology. The results suggest that the low-lying ridges have been a stable environment which has enabled their colonisation by benthic organisms while surface sediments of the seabed are mobile. At two sampling stations within palaeochannels the high proportion of bivalve molluscs, including Spisula and Anadara, indicates that estuarine conditions once existed at this site. Overall, no distinct faunal assemblage was associated with seabed pockmarks in this study area; this is likely to be at least partly the result of low sampling resolution.
The near-surface in Area 1, as observed in vibrocores, was found to consist of laminated silts with the mangrove indicator compound taraxerol present. These shallow sub-surface sediments are dominated by CO2 gases, most likely formed from the biogenic breakdown of organic matter deposited during or immediately after the LGM. It is likely that these biogenic gases are the source of fluids driving pockmark formation in the surface seabed sediments of Area 1, and this process is likely ongoing. Additional sources of fluid driving pockmark formation are likely to exist below the many buried sub-aerially exposed and weathered surfaces commonly incised by palaeochannels, visible in the shallow geology.
In some regions of Area 1, vertical and sub-vertical zones of enhanced reflectors are observed in the sub-bottom profiles, potentially indicating fluid flow. However these are generally layer-bound suggesting there is no significant direct seepage from depth through the shallow sub-surface to the seabed. Indirect seepage is possible, the extent of which could not be quantified. A possible indication of fluid flow from the deeper sedimentary basin was identified on sub-bottom profiles at one location, underlying a low-lying, possibly carbonate, ridge. A silver anomaly was noted in the surface sediments of the same ridge. This may suggest fluid flow from depth, or recycling of organically mediated fluids through the shallow sub-surface.
Area 2 is located in water depths of 28–89 m, and is dominated by three major banks. Other seabed features identified include ridges, plains, terraces and pockmarks which occur as individual entities and in clusters. Clusters of pockmarks are present on and adjacent to ridges. The location of pockmarks on ridges may suggest some relationship between pockmarks and ridge evolution. However, pockmarks are also common in inter-bank areas suggesting there are likely other factors involved. Acoustic masking of sub-surface strata in Area 2 is significant, obscuring the relationship between shallow and deep structures.
Deep seated hydrocarbon migration has been suggested to play a role in the formation of carbonate banks in the Timor Sea (O’Brien et al., 2002). Thus the co-location of carbonate banks and ridges over deep-seated faults in Area 2 may suggest some connectivity between the seabed and the underlying basin. If the formation of carbonate banks and ridges has been influenced by fluid migration from depth, this may imply that there is some structural control on fluid movement in the shallow sub-surface, particularly in Area 2. However, fluid migration is not always structurally controlled, particularly in unconsolidated sedimentary strata. Pinchout zones are also possible fluid conduits, and the regional seal appears to pinch out against the banks in Area 2. Moreover, no sedimentary or geochemical evidence indicative of active seepage of thermogenic hydrocarbons derived from the deeper sedimentary succession was found at the seabed.
Future work coring the upper 200–300 m of the sedimentary succession in the Petrel Sub-basin would provide evidence to better understand the relationship between the seabed/shallow sub-surface geology and the underlying basin succession.
2 Seabed environments, shallow sub-surface geology and connectivity, Petrel Sub-basin
1 Introduction
As part of a national strategy to support the reduction of greenhouse gas emissions into the atmosphere, the Australian Government implemented two programs in 2011, the National Low Emission Coal Initiative (NLECI) and the National CO2 Infrastructure Plan (NCIP). These four year programs aim to accelerate the identification of sites suitable for the geological storage of CO2 (geosequestration) in sedimentary basins, and support uptake of geosequestration exploration blocks. In support of these programs, Geoscience Australia has undertaken pre-competitive data acquisition and regional geological studies to assess offshore basins for their geosequestration potential.
The Petrel Sub-basin of the Bonaparte Basin (Timor Sea, northern Australia), has been assessed by Geoscience Australia as part of the NLECI program (Figure 1.1). In 2012, Geoscience Australia completed a marine survey, GA0335/SOL5463 in collaboration with the Australian Institute of Marine Science (AIMS). The survey acquired seabed and shallow geological data to assist in the assessment of the Petrel Sub-basin as a potential CO2 storage site, and to provide baseline geological and ecological information on the seabed environments and habitats.
1.1 Scope and aims In order to assess a basin for potential geosequestration a range of geological information is required. To this end, shallow sub-surface (<100 m depth) geology and seafloor characterisation data acquired on marine survey GA0335/SOL5463, are integrated with data from previous Geoscience Australia-led surveys in the Timor Sea to address two key aims:
1. Assist in the assessment of seal integrity by identifying hydrocarbon seepage at the seabed, and possible migration pathways for CO2 from the reservoir to the seabed.
2. Identify and map seabed environments and habitats to provide a baseline for assessing potential environmental impacts arising from future CO2 injection and storage.
The following key science questions guided the design of the data acquisition program:
• Are there structures on the seabed that may affect the interpretation of seismic data and the assessment of seal integrity (e.g. reefs, banks or ridges, causing pull-up effects), and are these structures indicative of seepage from the underlying sedimentary basin and therefore suggestive of compromised seal integrity?
• Are there surface expressions of faulting on the seafloor that are connected to sub-surface features and which may indicate compromised regional seal integrity?
Seabed environments, shallow sub-surface geology and connectivity, Petrel Sub-basin 3

• Are there seabed habitats and associated biota present across the area overlying the CO2 supercritical1 boundary that may indicate natural hydrocarbon leakage and, therefore, a poor quality regional seal2; and which may be impacted by potential disturbance and seepage associated with CO2 injection and storage?
• Are there buried channel systems in the vicinity of the area overlying the supercritical boundary that may provide migration pathways for CO2 or other fluids?
This study focuses on the integration of data from the seabed and shallow sub-surface (<100 m depth). Deeper geological structures and their possible connectivity with shallower features are discussed briefly but not interpreted in detail.
1 The supercritical boundary in the Petrel Sub-basin occurs at approximately 750 m depth (below the seafloor) where injected CO2 changes from a liquid to a gas as it migrates into shallower, less pressurised strata (Consoli et al., 2014).
2 Evidence of thermogenic hydrocarbons at the seabed has been used here as a surrogate for evidence of potential migration pathways from deeper geology because hydrocarbons are usually located at depth, and may migrate to the seafloor.
4 Seabed environments, shallow sub-surface geology and connectivity, Petrel Sub-basin

Figure 1.1. Location of the Petrel Sub-basin, Bonaparte Basin, northern Australia. Location of surveyed areas Area 1 and Area 2 from the current study, and the location of Areas A–D from previous surveys GA0322/SOL4934 (Heap et al., 2010) and GA0325/SOL5117 (Anderson et al., 2011) are indicated.
Seabed environments, shallow sub-surface geology and connectivity, Petrel Sub-basin 5

1.1.1 Survey area and outline of this report
The GA0335 survey area comprised two locations within the PTRL-01 2009 Greenhouse Gas Acreage Release Area (now closed) of the Petrel Sub-basin, Bonaparte Basin (Figure 1.1). The study areas were specifically chosen to address the four key science questions above.
Area 1 was chosen for its location above the 800 m CO2 seal boundary, marking the approximate location of the CO2 supercritical boundary within the Petrel Sub-basin. It is also positioned where buried channels may be located (Figure 1.1) as buried channels may provide possible conduits for the up-channel (up-dip) migration of injected CO2 related plume fluids following injection below the regional CO2 seal. Area 1 is located centrally between the coast and the geographic centre of Bonaparte Basin, where the seabed slopes gently (<1°) toward the basin centre in water depths of 78–102 m. Initial observations indicate a seabed characterised by palaeochannels, plains, low-relief ridges and pockmarks (Carroll et al., 2012).
Area 2 is located above well-known basin-scale faults that are adjacent to, or underlie, Flat Top bank (e.g. Gibson-Poole et al., 2002; Consoli et al., 2014). The Flat Top 1 petroleum exploration well is located in the middle bank within Area 2 and provides stratigraphic information for this work (Australian Aquitaine Petroleum Pty Ltd, 1970).
In this report, Area 1 and Area 2 are described separately as the geomorphology and sampling density in each area is markedly different. Observations on seabed features and samples in each area are described, followed by observations of the sub-surface data. An integrated interpretation for each area is then presented. Finally, a brief discussion is presented using conceptual models for the development of connectivity between the seabed and sub-surface features in the Petrel Sub-basin.
6 Seabed environments, shallow sub-surface geology and connectivity, Petrel Sub-basin

2 Setting
2.1 Regional geology The Bonaparte Basin is located on the broad continental margin of northern and northwestern Australia. This sedimentary basin is predominantly located offshore, covers an area of approximately 270,000 km2 and contains several structural elements (George and Cauquil, 2010). Bonaparte Basin is bounded by the Browse Basin to the southwest, and the Arafura and Money Shoal Basins to the northeast along the Darwin Shelf (George and Cauquil, 2010). The northern margin to the Bonaparte Basin is the Timor Trough (Figure 2.1), with water depths of ≥3000 m. The Petrel Sub-basin comprises the southeastern part of the Bonaparte Basin, and is bounded by the Malita Graben, Sahul Syncline, Londonderry High and Darwin Shelf offshore (Edwards et al., 2000), and by the Proterozoic Kimberley and Sturt blocks onshore. The Bonaparte Basin is underlain by Proterozoic crystalline basement sills and volcanics, and underwent extension (rifting) during the Devonian to Carboniferous (Gunn et al., 1995).
The Petrel Sub-basin contains a thick succession of Paleozoic and Mesozoic sediments (Kennard et al., 2002). Within this succession (Figure 2.2, Figure 2.3), the Jurassic Plover and Elang formations and the Early Cretaceous Sandpiper Sandstone are potentially suitable for CO2 storage (Consoli et al., 2014). Marine shales of the Flamingo Group form the seal for Plover Formation and Elang Formation reservoirs in the Petrel Sub-basin. The Sandpiper Sandstone is overlain by the Cretaceous Bathurst Island Group, the latter providing the regional seal for CO2 sequestration, and includes shales and carbonates of the Echuca Shoals, Wangarlu and Darwin Formation. The Bathurst Island Group regional seal occurs at shallower depths (<800 m) in the southern and eastern parts of the sub-basin than in the centre of the sub-basin (>800–2500 m). The post-Cretaceous history of the Bonaparte Basin has been documented in several seismic-based regional studies (e.g. Keep et al., 2002; Keep et al., 2007; Kennard et al., 2002), most recently by Bourget et al. (2012).
2.2 Flat Top 1 well Flat Top 1 exploration well provides deep stratigraphic control in the northeastern part of the Petrel Sub-basin, on the central bank of Area 2, directly to the south of Flat Top Bank (Figure 1.1and Figure 2.6). Flat Top 1 exploration well was drilled by Australian Aquitaine Petroleum Pty Ltd. in 1970 to provide information on the stratigraphy, structure and thickness of the Permian–Triassic sedimentary succession. The well reached a total depth of 2174 m in Proterozoic quartzitic basement after penetrating a thick section of Cretaceous Bathurst Island Group, the Late Jurassic-Early Cretaceous Flamingo Group and Plover Formation, the lower Permian–Triassic succession and the Carboniferous Kuriyippi Formation. Gas indications were detected in the Bathurst Island Group, Flamingo Group, Hyland Bay Subgroup and Keyling Formation. However, a sample taken at 1473.4 m within the Torrens Formation only recovered dissolved gas in formation water and the well has been classified as a dry well. The Flat Top 1 well completion report provided information on the age, nature and sub-surface thickness of the strata in Area 2.
Seabed environments, shallow sub-surface geology and connectivity, Petrel Sub-basin 7

Figure 2.1. The Bonaparte Basin, including the Petrel Sub-basin, and survey areas.
8 Seabed environments, shallow sub-surface geology and connectivity, Petrel Sub-basin

Figure 2.2. Stratigraphic column for the Petrel Sub-basin, adapted from the Bonaparte Basin Biozonation and Stratigraphy Chart 34 (Kelman et al., 2014). Geologic Time Scale after Gradstein et al. (2012) Sea-level curve adapted from Hardenbol et al 1998; Haq & Al-Qahtani, 2005; Haq & Schutter, 2008..
Seabed environments, shallow sub-surface geology and connectivity, Petrel Sub-basin, Bonaparte Basin, Timor Sea 9

Figure 2.3. Cross-section of the Bonaparte Basin through the Petrel Sub-basin. The relative locations of the study areas, located slightly to the south of this line within the former greenhouse gas acreage release area PTRL-01 (now closed) are also indicated. Across the east and southeast of the Petrel Sub-basin, the stratigraphic units thin towards the sub-basin margin. The regional CO2 seal, Bathurst Island Group, is highlighted. The location of seismic line is shown on Figure 2.1. Interpretation after Colwell & Kennard (2001).
10 Seabed environments, shallow sub-surface geology and connectivity, Petrel Sub-basin, Bonaparte Basin, Timor Sea
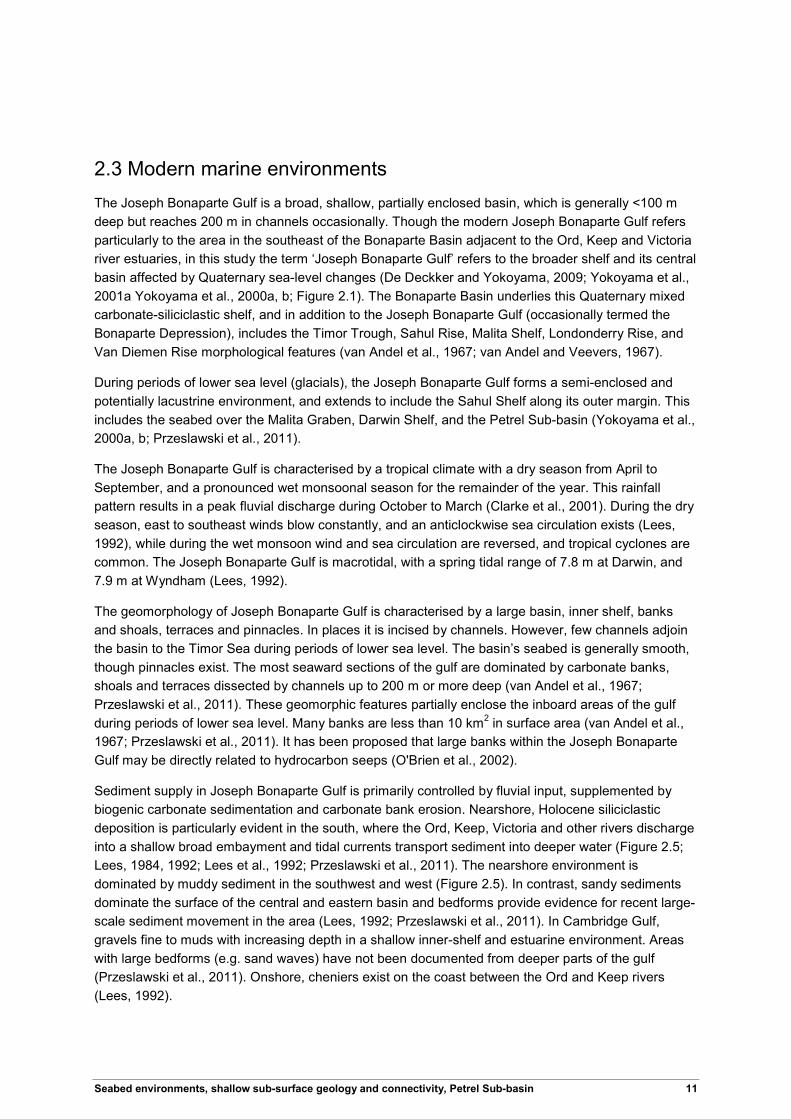
2.3 Modern marine environments The Joseph Bonaparte Gulf is a broad, shallow, partially enclosed basin, which is generally <100 m deep but reaches 200 m in channels occasionally. Though the modern Joseph Bonaparte Gulf refers particularly to the area in the southeast of the Bonaparte Basin adjacent to the Ord, Keep and Victoria river estuaries, in this study the term ‘Joseph Bonaparte Gulf’ refers to the broader shelf and its central basin affected by Quaternary sea-level changes (De Deckker and Yokoyama, 2009; Yokoyama et al., 2001a Yokoyama et al., 2000a, b; Figure 2.1). The Bonaparte Basin underlies this Quaternary mixed carbonate-siliciclastic shelf, and in addition to the Joseph Bonaparte Gulf (occasionally termed the Bonaparte Depression), includes the Timor Trough, Sahul Rise, Malita Shelf, Londonderry Rise, and Van Diemen Rise morphological features (van Andel et al., 1967; van Andel and Veevers, 1967).
During periods of lower sea level (glacials), the Joseph Bonaparte Gulf forms a semi-enclosed and potentially lacustrine environment, and extends to include the Sahul Shelf along its outer margin. This includes the seabed over the Malita Graben, Darwin Shelf, and the Petrel Sub-basin (Yokoyama et al., 2000a, b; Przeslawski et al., 2011).
The Joseph Bonaparte Gulf is characterised by a tropical climate with a dry season from April to September, and a pronounced wet monsoonal season for the remainder of the year. This rainfall pattern results in a peak fluvial discharge during October to March (Clarke et al., 2001). During the dry season, east to southeast winds blow constantly, and an anticlockwise sea circulation exists (Lees, 1992), while during the wet monsoon wind and sea circulation are reversed, and tropical cyclones are common. The Joseph Bonaparte Gulf is macrotidal, with a spring tidal range of 7.8 m at Darwin, and 7.9 m at Wyndham (Lees, 1992).
The geomorphology of Joseph Bonaparte Gulf is characterised by a large basin, inner shelf, banks and shoals, terraces and pinnacles. In places it is incised by channels. However, few channels adjoin the basin to the Timor Sea during periods of lower sea level. The basin’s seabed is generally smooth, though pinnacles exist. The most seaward sections of the gulf are dominated by carbonate banks, shoals and terraces dissected by channels up to 200 m or more deep (van Andel et al., 1967; Przeslawski et al., 2011). These geomorphic features partially enclose the inboard areas of the gulf during periods of lower sea level. Many banks are less than 10 km2 in surface area (van Andel et al., 1967; Przeslawski et al., 2011). It has been proposed that large banks within the Joseph Bonaparte Gulf may be directly related to hydrocarbon seeps (O'Brien et al., 2002).
Sediment supply in Joseph Bonaparte Gulf is primarily controlled by fluvial input, supplemented by biogenic carbonate sedimentation and carbonate bank erosion. Nearshore, Holocene siliciclastic deposition is particularly evident in the south, where the Ord, Keep, Victoria and other rivers discharge into a shallow broad embayment and tidal currents transport sediment into deeper water (Figure 2.5; Lees, 1984, 1992; Lees et al., 1992; Przeslawski et al., 2011). The nearshore environment is dominated by muddy sediment in the southwest and west (Figure 2.5). In contrast, sandy sediments dominate the surface of the central and eastern basin and bedforms provide evidence for recent large-scale sediment movement in the area (Lees, 1992; Przeslawski et al., 2011). In Cambridge Gulf, gravels fine to muds with increasing depth in a shallow inner-shelf and estuarine environment. Areas with large bedforms (e.g. sand waves) have not been documented from deeper parts of the gulf (Przeslawski et al., 2011). Onshore, cheniers exist on the coast between the Ord and Keep rivers (Lees, 1992).
Seabed environments, shallow sub-surface geology and connectivity, Petrel Sub-basin 11

2.4 Evolution of the Quaternary Bonaparte Shelf The morphology of the modern Joseph Bonaparte Gulf is the result of inherited faulted and sub-aerially exposed Cretaceous to Neogene strata modified by Quaternary sea-level changes (van Andel and veevers, 1965; Kennard et al., 2002; Keep et al., 2002; Keep et al., 2007). During the glacial-interglacial cycles of the Quaternary, much of Joseph Bonaparte Gulf would have been sub-aerially exposed because of global changes in sea level (Yokoyama et al., 2001a, b; Bourget et al., 2012; Bourget et al., 2013; Figure 2.4). While detailed evidence on the sea-level history of Joseph Bonaparte Gulf prior to the Last Glacial Maximum (LGM) is limited, data from sediment cores provide a record of lower sea level related to the LGM (Yokoyama et al., 2000a, 2001a, 2001b; Peltier, 2002; De Deckker and Yokoyama, 2009). Faunal, palaeo-environmental and radiocarbon dating evidence indicate a transition from marginal semi-open marine to brackish conditions, indicative of an isolated and enclosed basin, at about 21.3 cal ka BP, with sea level at that time approximately 125 m below present within the central gulf (Yokoyama et al., 2000b). This suggests that sediments deposited during this interval were isolated from the Timor Sea, and protected from significant wave action (Yokoyama et al., 2000a). During glacial low-stands when sea level was 120–130 m below present, much of the Joseph Bonaparte Gulf would have been sub-aerially exposed, with the central basin potentially existing as a partially isolated marine influenced lake (Lewis et al., 2013; Bourget et al., 2013). It has been suggested that erosion and in-situ weathering during periods of lower sea level resulted in the development of a suite of calcic nodules, the ‘brown pellet suite’ identified by van Andel and Veevers (1967) that were preferentially deposited on the inner shelf (van Andel and Veevers, 1967; Lees, 1992).
12 Seabed environments, shallow sub-surface geology and connectivity, Petrel Sub-basin

Figure 2.4. Quaternary global sea-levels in relation to the survey areas. a) Joseph Bonaparte Gulf (JBG) with Last Glacial Maximum (LGM) sea level lowstand shoreline indicated (125 m contour), locations of cores collected by Yokoyama et al. (2001a) and survey areas; b) oxygen isotope based sea-level curve for the past 3 Ma (after Bintanja and van de Wal, 2008) indicating a general lowering of sea-level over the Quaternary (green line); c) and d) are seabed profiles across Joseph Bonaparte Gulf indicating the relative heights of the survey areas with respect to the last glacial maximum sea level.
Seabed environments, shallow sub-surface geology and connectivity, Petrel Sub-basin 13

Figure 2.5. Modelled mud a) sand b) and gravel c) distributions in the Timor Sea region overlain on hillshaded bathymetry (Li, 2012). Mud dominated sediments predominate in the inboard Joseph Bonaparte Gulf. Gravel dominated sediments are most common adjacent to carbonate banks (e.g. Flat Top Bank), and in higher energy tidally dominated environments.
14 Seabed environments, shallow sub-surface geology and connectivity, Petrel Sub-basin

2.5 Regional evidence of hydrocarbon seepage Though there are few records of observed natural hydrocarbon seepage in the marine environment in Australia (Logan et al., 2010), potential hydrocarbon seepage-related slicks were identified using Synthetic Aperture Radar (SAR; O’Brien et al., 2001) in the Timor and Arafura Seas over the Browse and Bonaparte basins. O’Brien et al. (2001) used a framework of 55 Radar Sat Wide 1 Beam Mode SAR scenes to map possible slicks and provide a regional understanding of potential hydrocarbon seepage and migration over 365,000 km2 of the sea surface. Large groups of slicks were observed on the Yampi Shelf, Heywood Shoals and Ashmore Platform, along the boundary between the Browse and Bonaparte basins, and in the southern Bonaparte Basin.
O’Brien et al. (2001, 2002) suggested a causal link between the numerous carbonate banks in the Timor Sea and the presence of hydrocarbon seepage. Active hydrocarbon seepage has been identified on the Yampi Shelf in the Browse Basin (Jones et al., 2005; Rollet et al., 2006), a macrotidal tropical carbonate shelf. Seepage on the Yampi Shelf was noted to be directly related to tidal cycles and the height of the water column, with the most vigorous seepage during the low ebb tide (Rollet et al., 2006). Pockmark fields and gas in core samples provided evidence of microbial gas generation in an area with sub-surface geophysical indicators for fluid migration (Rollet et al., 2009).
In contrast, seepage-related features in the Arafura Sea (Money Shoal Basin; Logan et al., 2006) were noted to be primarily passive (Rollet et al., 2009). Logan et al. (2006) noted that pockmark fields were visible in areas of soft sediment with benthos covering less than 5% of the area, while harder substrates without pockmarks had high biodiversity with sea whips, soft corals, hydroids, crinoids and octocorals. The development of pockmarks was suggested to be related to sediment type, microbial gas production in the shallowest sub-surface, and a supply of fluids from the underlying sedimentary basin. Microbial gas was suggested to have been sourced largely from the breakdown of organic matter within mangrove-derived sediment (Grosjean et al., 2007). Furthermore, a zone of possible hydrocarbon seepage was indicated by the coincidence of shallow gas indicators, faulting and a zone of poor-quality seismic data (Rollet et al., 2009).
2.6 Evidence of seepage within the Petrel Sub-basin Hydrocarbons that seep from sub-surface reservoirs may exist in the water column, on the sea surface and at the seabed, and are commonly identified in ‘sniffer’ surveys whereby geochemical methods are utilised to detect their presence. Pockmarks are particularly common seep indicators in unconsolidated sediments in many parts of the world (Judd and Hovland, 2007). Regional sniffer survey data within the Petrel Sub-basin were acquired during Bureau of Mineral Resources (BMR) Surveys 99 and 100, both undertaken in 1991 (Bickford et al., 1992; Bishop et al., 1992; O'Brien et al., 2000). Significant (up to 220 times background) and relatively localised seepage was detected directly over the Petrel 1A well (Figure 2.3), with a large plume extending to the southeast (O'Brien et al., 2000). However, this seepage was likely the result of a leaky well head or sub-sea completion, as the Petrel 1 well blew out during drilling in 1969 (O'Brien et al., 2000). In contrast, sniffer anomalies around the Tern gas condensate accumulation were considered natural (Figure 2.6; Bickford et al., 1992; Bishop et al., 1992; O'Brien et al., 2000) as the composition of these anomalies is consistent with condensate seepage. A number of anomalies with relatively high propane and butane concentrations were also encountered in the southern Petrel Sub-basin.
Seabed environments, shallow sub-surface geology and connectivity, Petrel Sub-basin 15

Pockmarks up to 1.5 m deep were identified during previous marine surveys of the Joseph Bonaparte Gulf by Geoscience Australia (Heap et al., 2010; Anderson et al., 2011; Przeslawski et al., 2011). Limited evidence suggested that some pockmarks may be active (Heap et al., 2010). This included the open morphology of pockmarks, and the presence of buried channels and hence possible gas migration pathways underlying the pockmarks in some instances. These shallow subsurface (<100 m) features were identified in sub-bottom profiles acquired during surveys GA0322/SOL4934 (Heap et al., 2010) and GA0325/SOL5117 (Anderson et al., 2011).
Pockmarks have also been identified in the Malita Graben during a site investigation for exploration wells Durville 1 and Laperouse 1, in water depths of ~100 m (George and Cauquil, 2010). Individual pockmarks up to 60 m wide and 4 m deep, occur on flat seabed adjacent to banks up to 35 m high. More commonly, these depressions have diameters of ~20 m, and depths of 2.5 m. No evidence was presented by George and Cauquil (2010) to indicate that these depressions were active pockmarks.
16 Seabed environments, shallow sub-surface geology and connectivity, Petrel Sub-basin

Figure 2.6. Location of Petrel Sub-basin, previous survey areas, gas fields, and locations at which shallow cores were previously recovered (Yokoyama et al., 2001a). Core GC5, the principal stratigraphic core of Yokoyama et al., 2001a is located in the central basin.
Seabed environments, shallow sub-surface geology and connectivity, Petrel Sub-basin 17

3 Methods
3.1 Overview Most of the data discussed in this study were acquired during the 2012 marine survey of the Petrel Sub-basin (SOL5463/GA0335; Carroll et al., 2012). Details of the methods used for data and sample acquisition, and post-survey analysis are described in the post-survey report (Carroll et al., 2012). Methods additional to those are reported herein. Data from this study are available online at http://www.ga.gov.au/about/what-we-do/projects/energy/bonaparte-co2-storage.
Additional data used for this study include unpublished geochemistry data from samples obtained on previous surveys, and bathymetry data from these same surveys (SOL4934/GA0322, Heap et al., 2010; and SOL5117/GA0325, Anderson et al., 2011). Observations on unpublished bathymetric data from transects across Joseph Bonaparte Gulf during these previous Geoscience Australia surveys were also used.
The sedimentology, chemistry and biological sampling methods used are standard seabed habitat sampling protocols that collect samples at point locations on the seabed (Przeslawski et al., 2011). In this study analyses also focused on investigating the presence of seep-related material in sediment, geochemical and biological samples. Authigenic carbonate is a catch-all term used to denote carbonate rock formed from the in situ and inorganic precipitation or recrystalisation of carbonate minerals (Sun and Turchyn, 2014), and is particularly common in seep environments (Bian et al., 2013; Hovland et al., 2005; Hovland et al., 1987; Judd and Hovland, 2007). To that end, grab samples were inspected for the presence of authigenic carbonate and samples of potential interest were submitted for carbon and oxygen isotopic analysis.
Multibeam bathymetry was gridded at 2 m resolution to provide detailed information on seabed characteristics. Geomorphic features identified from multibeam bathymetry data were investigated to determine their sub-surface characteristics and relationship with any faults or seepage features (e.g. chimneys, gas migration pathways) visible in sub-bottom profiles and regional seismic lines.
Acoustic sub-bottom profile data were analysed to determine the presence of structural discontinuities and features indicative of fluid flow in the shallow sub-surface. The aim was to enable the integrated analysis of sub-bottom profile data with the basin-scale reflection seismic data from survey GA0336. The acoustic sub-bottom profiling system (Applied Acoustics Squid 2000 sub-bottom profiler with 24 channel geoeel) was chosen to provide resolution and penetration up to 100 m below seabed, significantly better penetration when compared to the previous system used by GA, (an Applied Acoustics SCP-1200 sub-bottom profiler; Heap et al., 2010; Anderson et al., 2011).
3.1.1 Geomorphic feature mapping
Local-scale geomorphic features were identified manually in the processed multibeam sonar data using standard ArcGIS 10 tools using concepts and terms developed by Heap and Harris (2008), Judd and Hovland (2007) and Przeslawski et al. (2011). See Appendix A for detailed multibeam data processing methodology. Local-scale features are generally differentiable using metre-scale contours at scales of tens to hundreds of metres, and are smaller than regional-scale geomorphic features classified by Heap and Harris (2008).
18 Seabed environments, shallow sub-surface geology and connectivity, Petrel Sub-basin

The following definitions were utilised to map geomorphic features in this study. Definitions are adapted from Heap and Harris (2008) and Judd and Hovland (2007).
1. Banks – areas of elevated seafloor with one or more steep sides;
2. Terraces – relatively flat or gently sloping seafloor bounded by a moderately sloping rise on one side, and a moderately steep drop on the other side;
3. Plains – extensive flat or gently sloping areas;
4. Palaeochannels – tapered depressions on the shelf characterised by laterally converging sidewalls of increasing depth;
5. Ridges – elongate, narrow and elevated features with steep sides;
6. Scarps – steep slope separating areas with gentler slope;
7. Pockmarks – completely enclosed, convex-downward seafloor depressions with a circular to elliptical planform and moderate to steep (>5°) sidewalls.
3.1.2 Pockmark identification and mapping
Pockmarks are depressions on the seafloor that form because of active or past focused fluid flow from the sub-surface to the seabed and water column (Hovland et al., 2002, Judd and Hovland, 2007). Pockmarks are therefore a fundamental indicator of fluid flow at the seabed, and as such they were specifically targeted in this study for detailed identification and mapping. Pockmarks were visually identified from multibeam bathymetry and backscatter data using standard ArcGIS Tools. In order to successfully identify pockmarks a representative portion of Area 1 was initially selected from the full bathymetric dataset to develop a method suitable for the seabed morphology and in particular, for the shallowness of depressions. The central portion of Area 1 was chosen for this because motion-related bathymetric noise and large variations in geomorphology (geomorphological noise) were largely absent. The methods used on the selected area were subsequently applied to all of Area 1 and Area 2 to identify and quantify pockmarks.
The following procedure was employed to map pockmarks:
• create a slope map of the bathymetry;
• contour the slope map using 1° intervals (initially);
• identify sinks (enclosed depressions), using the ArcGIS 10.1 Sink tool;
• contour bathymetry at 0.1 m intervals to aid the identification of depressions;
• visually identify depressions, where 0.1 m bathymetric contours and slope ≥ 5° occur together, and a sink is present at, or directly adjacent to, the centre of the contours (using the ArcGIS tool Raster Calculator).
For more detailed information on the pockmark identification process, refer to Appendix B.
3.1.3 Relationships among backscatter, hardness and pockmarks
Backscatter angular response obtained during multibeam sonar mapping is a measure of the seabed backscatter strength, described as a function of the beam angle. It can be used to measure the relative hardness and roughness of the seabed and its surface constituents. Relationships between backscatter values, seabed hardness and pockmarks were analysed by extracting backscatter angular response curves for Areas 1 and 2, and determining probability values for the respective relationships to hardness
Seabed environments, shallow sub-surface geology and connectivity, Petrel Sub-basin 19
and pockmarks. The angular response curves from the raw multibeam data were extracted using the multibeam backscatter CMST-GA MB Process v10.10.17.0 toolbox software, co-developed by the Centre for Marine Science and Technology (CMST) at Curtin University of Technology and Geoscience Australia and described in Gavrilov et al. (2005a, 2005b), Parnum (2007), and Parnum and Gavrilov (2011). Backscatter values from port and starboard swaths were processed separately to remove the backscatter angular dependence. The average angular response curves were derived based on the port and starboard data, with a 50% overlap in a 1° bin of incidence angle (Gavrilov et al., 2005a; Gavrilov et al., 2005b; Parnum, 2007; Parnum and Gavrilov, 2011). Over 89,000 angular response curves were produced from the two survey areas by averaging every 100 consecutive pings. The full response curves were used for the angular response analysis, at one-degree intervals.
Underwater towed-video footage, bathymetry data and backscatter mosaics were used to locate seabed areas with pockmarks in Area 1 and hard-bottom seabed in Area 2, for which the angular backscatter response curves were extracted. Reference angular backscatter response curves were then derived from the average curve for the seabed with pockmarks in Area 1, and the lowest angular response curve for the hard-bottom seabed found mainly in Area 2. Each reference curve was compared to all other curves within the survey area for incidence angles between 0° and 60°, using the Kolmogorov-Smirnov goodness of fit technique to estimate the probability value (p-value). Finally, the Inverse Distance Weighted (IDW) interpolation technique was used to produce a continuous layer of p-values for each study area. For seabed with pockmarks, these probability values were used to test if there was a relationship between the reference angular response curve (i.e. the average curve) and all other angular backscatter response curves. If there were no relationship (i.e. the null hypothesis) these values would be the same. For hard-bottomed seabed, the null hypothesis was that the reference curve (i.e. the lowest angular response curve) was lower than all other angular response curves. The null hypothesis was tested at a 5% significance level against the interpolated p-values.
3.1.4 Sedimentology
The textural, chemical and isotopic compositional characteristics of seabed sediment samples collected during the GA0335 survey were analysed to provide information on sediment type and depositional environment. Eleven seabed sediment samples, ten from Area 1 and one from Area 2, were visually described, noting grain size, sorting and sedimentary composition, then subsequently analysed at Geoscience Australia laboratories. Twenty five grain size measurements were undertaken on seabed and vibrocore sediment samples by wet sieving to determine mud (<63 µm), sand (63–2000 µm) and gravel (>2000 µm) fractions as a percentage of dry weight. A representative sub-sample (approximately 1 g) of the gravel-free sediment was analysed by laser diffraction using a Malvern Mastersizer 2000 to characterise the mud and sand fractions. The final results are expressed as a percentage of the total particle volume, and are the average value derived from three measurements on each sample. Sediment grain size parameters including mean, median, standard deviation, skewness and kurtosis were calculated. Carbonate content in the sediment grain size samples was determined using the carbonate bomb method (Müller and Gastner, 1971).
3.1.5 Seabed sediment geochemistry
Ten seabed sediment samples from Area 1, collected specifically for their sediment chemistry properties in separate grab samples to those for biology and sedimentology, were analysed following methods described in the post-survey report (Carroll et al., 2012), Radke et al. (2011), and tabulated in Appendix C. Due to inclement conditions, no sediment geochemistry samples were collected for analysis from Area 2. Variables
20 Seabed environments, shallow sub-surface geology and connectivity, Petrel Sub-basin

measured include major, minor and trace elements, pigments, carbon and nitrogen concentrations and isotopes, pore-water constituents, oxygen consumption and carbon dioxide production rates, as well as a range of derived parameters including enrichment factors relative to average upper continental crust.
3.1.6 Isotopic composition of carbonates
The molecular weight fractionation of isotopes of carbon and oxygen during physical (e.g. evaporation) or chemical (e.g. precipitation) processes gives rise to different isotopic compositions. This is expressed for carbon as δ13C and for oxygen as δ18O. δ13C and δ18O values are ratios of light to heavy isotopes of an element (i.e. the ratio of 16O to18O and 12C to13C). For carbonates, carbon and oxygen isotopic ratios can provide information on the processes and sources of elements within the carbonate molecule, for example marine water versus freshwater.
Carbon and oxygen isotopic and chemical analyses were performed on 26 carbonate samples obtained in grab samples, and from carbonate recovered in rotary drill core samples (SOL4934, Heap et al., 2010). These included eight samples from Area 1 of GA0335/SOL5463 (Carroll et al., 2012), three from the marine survey GA0325/SOL5117 (Anderson et al., 2011) and fifteen from SOL4934 (Heap et al., 2010). These analyses were undertaken to understand the origin of carbonate materials in Joseph Bonaparte Gulf, and to determine if sub-surface fluid had contributed to carbonate precipitation. Samples from Area 1 were analysed together with samples previously collected in order to gain a regional perspective on seabed processes, and to ascertain whether there are differences in the carbonate composition of samples from carbonate banks and unconsolidated sediment at the seabed, particularly in seabed with pockmarks. Carbon and oxygen isotopes were measured at the laboratories of Environmental Isotopes Pty. Ltd., Sydney.
Each carbonate sample submitted for δ13C and δ18O analysis consisted of one or more individual pellets obtained from sediment grab samples (Figure 4.12). These pellets ranged from light grey to red-brown in colour. They consisted of a range of textures from a composite assemblage of individual granules, to single, and angular to very rounded grains.
In addition to the granule to pebble sized sediment used in these samples, three fragments, each cut from an individual cobble-sized carbonate clast were also analysed. These were recovered in the benthic dredge at station 053 from Area D during previous surveys SOL 4934 and 5117 (Heap et al., 2010; Anderson et al., 2011). These carbonate clasts were laminated on a sub-millimetre scale, pink in colour internally and light grey on the surface. One additional sample consisted of brown, to red-brown, granules and pebbles recovered from rotary drill core, taken from the side of a carbonate bank in Area C (Figure 4.13; Heap et al., 2010). The presence of brown ‘pellets’ encased in carbonate, in the rotary drill core from the near surface of a carbonate bank suggests that they were formed in situ.
3.1.7 Headspace gas and organic soluble matter compounds
Eight samples from three shallow vibrocores from Area 1 were analysed to provide information on gases present in the shallow sub-surface sediment. The type of gases and organic matter present can indicate whether these compounds are associated with thermogenic hydrocarbon sources at depth, or from more recent biogenic gases derived from biodegradation of organic matter at shallow depths. In this study, analyses focused on:
• the composition and isotopic values of headspace gas, and
• the type and concentration of organic soluble matter (i.e. lipid biomarkers) within the sediments.
Seabed environments, shallow sub-surface geology and connectivity, Petrel Sub-basin 21

One set of samples collected for headspace gas was transported frozen in tins and analysed by TDI-Brooks, College Station, Texas, USA. Concentrations in ppm were reported for C1-C5 hydrocarbons and CO2. A duplicate set of samples is archived at GA at -80°C. The concentration and type of organic soluble matter in these core samples were analysed with Gas Chromatography (GC) and Gas Chromatography Mass Spectrometry (GC/MS) at GA. The analysis of three samples for stable carbon isotopes within the headspace gas, and lipid content, was also completed at GA.
3.2 Ecological analyses
3.2.1 Biological analyses
In the laboratory, elutriated samples and sub-sampled whole fractions were examined under a dissecting microscope in the marine ecology laboratory at GA, and all intact animals were separated. Animals were identified to Operational Taxonomic Unit (OTU) by a single ecologist, with voucher specimens photographed and separated in a reference library. Polychaetes and molluscs have been lodged at the Museum and Art Gallery, Northern Territory (MAGNT), where taxonomists will archive and identify the specimens to species level. All other taxa will be sent to appropriate institutions pending agreements.
3.2.2 Towed underwater imagery
Seabed habitats were broadly classified based on video observations into three main categories (cf. Przeslawski et al., 2011):
• Barren sediments: Sediment is flat with little evidence of infaunal (bioturbation) or epifaunal activity (<20 individual epifauna over the entire transect);
• Bioturbated sediments: Sediment shows at least a moderate level of infaunal and epifaunal activity with characteristic trails and burrows (lebensspurren) and low cover of epifauna (>20 individuals over the transect; up to 15 individuals per 15 seconds estimated over the course of the video);
• Mixed patches (octocorals and sponges): Rocky outcrops supporting locally abundant patches of octocorals and sponges that occupy a proportion of at least 20% of the transect (up to 25 individuals per 15 seconds), interspersed with areas of soft sediment and low epifaunal cover. Rocky outcrops may be covered with a thin veneer of sediment, however, epibenthic growth of sessile organisms indicates that some hard substrate is present.
While towed-video imagery was obtained in transects across the seabed, the Ultra Short BaseLine (USBL) positioning equipment on the towed-video was not functional, and therefore it is not possible to directly correlate between seabed features observed in bathymetry, and mounds of sediment, ripples and discrete fauna and flora visible in the towed-video imagery.
3.2.3 Mollusc identification
Biological information including the identification of individual species is important for understanding present and past seabed environments. The identification of gastropoda and bivalvia from two grab samples recovered from Area 1 was undertaken at the Museum and Art Gallery, Northern Territory, by Dr Richard Willan. A representative number of the identified samples were photographed at the marine ecology laboratory, Geoscience Australia.
22 Seabed environments, shallow sub-surface geology and connectivity, Petrel Sub-basin

3.3 Radiocarbon dating Radiocarbon dating of biogenic material was undertaken to provide chronological information on the timing of deposition of sediments in Areas 1 and 2, and to understand further the recent history of the broader Joseph Bonaparte Gulf region. Samples were chosen from vibrocores collected for this study, during survey GA0335/SOL5463 (Carroll et al., 2012), and from survey SOL4934 (Heap et al., 2010). Ten samples, seven consisting of a single disarticulated valve from a bivalve mollusc, one of a gastropod, one of a single piece of wood and one of plant matter, were dated using Accelerator Mass Spectrometry (AMS) at the Radiocarbon Laboratory, University of Waikato, New Zealand. The University of Waikato follows the protocols of the University of California Keck-CCAMS laboratory for sample preparation (Beverly et al., 2010). Calibrated ages on organic matter were obtained using OxCal v4 2.2 (Bronk Ramsey, 2013), and the marine reservoir offset (ΔR) of 60 ± 31 was used together with the Marine 09 14C curve and OxCal v4 2.2 to obtain calibrated ages on marine shells (Reimer et al., 2009).
3.4 Acoustic sub-bottom profiles During the survey, multichannel seismic reflection processing was conducted with Paradigm Geophysical’s Disco/Focus software. Processing included geometry definition with correction to actual source-receiver offsets, mute of leaked timing pulse, band pass filtering, and surface-related multiple elimination on shot records. Following a CDP sort, interactive velocity analysis was carried out on the first line in order to determine a representative stacking velocity function for Area 1. Observation of the relative motion of the sparker and streamer led to the idea of using non-surface consistent trim statics to align reflections prior to stack, which improved the data, particularly in rougher seas. Migration was necessary for sharper delineation of small channels, which appeared as classic ‘bow-ties’ on the stack section. Processed data were output as SEG-Y files and loaded into Kingdom software. These SEG-Y files were subsequently used for selection of sampling sites (Jones, 2014).
Final processing was completed post-survey to improve the data by tailoring statics gates and velocity functions to digitised water bottom. However, the most significant improvement came with the recognition of latent high frequencies in the data above 1000 Hz. The use of minimum entropy deconvolution enhanced the high frequency content and collapsed the source wavelet removing ghosting. Statics corrections were applied to adjust to mean sea level, correcting for the source and streamer depth and the effect of tides (which were interpolated from GPS elevations).
Final SEG-Y files of the migrated data were produced with relevant trace headers populated and a full EBCDIC header with metadata on acquisition and processing (Carroll et al., 2012). However, it must be noted that it is impossible to completely compensate for acquisition limitations by digital multi-channel processing, and thus the quality of the final product ranges from poor to excellent. The final processed sub-bottom profile data were imported into the computer software package GeoFrame for interpretation and analysis. Following procedures described by Lafferty et al. (2006) and Kim et al. (2008), the processed acoustic sub-bottom profiling data were analysed by manually picking the principal acoustic units and identifying acoustic anomalies.
Seabed environments, shallow sub-surface geology and connectivity, Petrel Sub-basin 23

4 Results: Seabed properties, geomorphology and habitats
The seabed and shallow sub-surface in the survey areas differ greatly, with large banks and ridges present in Area 2, while in contrast Area 1 is located on a generally low-gradient flat seabed. Due to the inclement weather only one sediment sample was acquired in Area 2, thus while sediment characteristics could be compared with geomorphic features in Area 1, this was not possible in Area 2. Additionally, the main focus of this survey was to provide observations and data on seepage in the shallow sub-surface (<100 m) from below the regional seal in Area 1.
4.1 Seabed geomorphology and sediments of Area 1 The seabed in Area 1 is characterised by low relief, in water depths ranging from 78 m in the southeast to 102 m in the northwest. Three principal regional-scale geomorphic features were identified from the bathymetry (Figure 4.1): plains, valleys (channels) and ridges (Figure 4.2 and Table 4.1). These are locally overlain by smaller local-scale geomorphic elements including pockmarks, ridges, and additional depressions potentially related to channel switching.
Table 4.1. Principal geomorphic features in Area 1 based on ArcGIS polygon mapping.
Area (km2) Percentage of area (%) Depth range (m) Mean depth
(m ± 1σ) Slope (° ± 1σ)
Plain 415.6 88.3 78–97 88 ± 3 0.2 ± 0.2
Channel 53.0 11.3 81–102 91 ± 3 0.8 ± 0.7
Ridge 1.9 0.4 81–90 85 ± 2 1.05 ± 0.5
Total 470.5 100.00 78–102 88 ± 3 0.3 ± 0.4
4.1.1 Geomorphology
Plains comprise ~88% of the seafloor of Area 1, and are dissected by branching, and rare anastomosing and discontinuous channels, which cover approximately 11% of Area 1. Channels are aligned in a northwest-southeast direction (Figure 4.1, Figure 4.2), and range in size from tens of centimetres deep and tens of metres wide, to six metres deep and up to one kilometre wide.
Low-lying ridges occur on the western and northwestern sections of the plains. These are approximately 0.5 m high and 150–200 m wide, and increase in height from west to east, and from north to south. Low-lying ridges in Area 1 trend roughly northeast–southwest, but a single ridge in the southern section has an approximately north–south trend.
24 Seabed environments, shallow sub-surface geology and connectivity, Petrel Sub-basin

Figure 4.1. Seabed bathymetry, sample locations and position of multichannel sub-bottom lines in Area 1.
Shallow depressions are numerous on the plains and in palaeochannels in Area 1, many of which are identified as pockmarks (Figure 4.2, Table 4.2; Nicholas et al., 2014). Pockmarks are particularly common in the northern half of Area 1. On the plains these are generally less than 1 m deep. Pockmarks occur as individual features (unit pockmarks) as clusters on plains and in channels, and as composite pockmarks on plains. The identified pockmarks are concentrated in the northern half of Area 1, most commonly within or adjacent to channels (Figure 4.2). Slopes at the centre of unit pockmarks range from 5–10°. On the plains, the northwestern rims of many composite pockmarks are slightly lower than the corresponding southeastern rim, such that the outline of many large composite pockmarks on the plains appears semi-circular. This also is true for many unit pockmarks. Pockmarks also occur in the swales between low-lying ridges in the western section of Area 1 (Figure 4.2).
Seabed environments, shallow sub-surface geology and connectivity, Petrel Sub-basin 25

Additional features visible on the seabed include low-lying, generally northwest trending ridges cross-cut by palaeochannels. Pockmarks are located in the swales between these ridges. Small depressions occur at several locations on the plains adjacent to the palaeochannels. These may be drowned oxbow lakes and are potentially indicative of channel switching.
Table 4.2. Characteristics of pockmarks in Area 1.
Individual (unit) depressions
Composite depressions
Cluster of closely-spaced depressions
Large individual (standard) depressions
Area (m2) 100–150 1500–3500 1500–3500 160,000–275,000
Width (m), (mean ± 1σ)
14 ± 7 (1 σ) 180 ± 30 (1 σ) 170 ± 60 (1 σ) (up to 850 m)
420 ± 150 (1 σ)
Depth range (m) (mean ± 1σ)
0.5 ± 0.2 (plains) 0.6 ± 0.5 (valleys)
0.5 ± 0.2 0.5 ± 0.2 0.6 ± 0.5
Slope (° ± 1σ)
6.3 ± 1.6 Measured on unit depressions only
Measured on unit depressions only
Maximum slopes given by unit depressions within these larger features, otherwise slopes generally 1–3°
Backscatter range (dB)
-27 ± 2 Measured on unit depressions only
Measured on unit depressions only
Measured on unit depressions only
Description Single shallow depressions <1 m depth, commonly located within a broader depression, or as an individual depression in a cluster.
Composed of two or more individual small depressions at or near the centre of a larger, generally sub-circular depression occurring on plains only. Maximum depth marginally deeper by few tens of cm than for individual depressions.
Clusters of closely spaced small shallow depressions. Generally are not located within broader depressions, unlike the composite form (Type II which contain Type I).
Broad, very shallow depressions, generally 1–2 m depth. Sourced from sediments a few metres below those on the plains, but not exhibiting substantially different sub-surface characteristics. Commonly have Type I depressions toward their centres.
Relationship to previously published pockmark classifications
Equivalent to Unit Pockmarks (Hovland et al., 2002; Judd and Hovland, 2007)
Equivalent to Composite Pockmarks (Hovland et al., 2002; Judd and Hovland, 2007), consisting of one or more unit pockmarks within a larger very shallow depression.
Similar to Composite Pockmarks (Hovland et al., 2002), but potentially forming where there is limited sediment at the seabed.
Similar to Standard Pockmarks (Hovland et al., 2002), except they are substantially shallower than other Standard Pockmarks. The co-location within these of Type I depressions indicates a genetic similarity to Type 1 and II depressions.
26 Seabed environments, shallow sub-surface geology and connectivity, Petrel Sub-basin

Figure 4.2. Geomorphic environments of Area 1, with the locations of individual pockmarks and pockmark clusters indicated. Pockmarks are dominantly located adjacent to, or within palaeochannels.
Seabed environments, shallow sub-surface geology and connectivity, Petrel Sub-basin 27

4.1.2 Relationships between seabed features and acoustic hardness
The backscattering of multibeam signals from the seabed is a response to the roughness and slope of the seabed, and roughness is a property dependant on the composition, size and angularity of the seabed sediment and any consolidated rock present. Because the slope of the seabed in Area 1 is <1° (mean of 0.3 ± 0.4°), variations in the backscatter response are therefore predominantly caused by lithological properties (composite roughness) rather than slope effects (Jackson et al., 1986; Goff et al., 2005). Backscatter values for Area 1 range from -32 to -25 dB (Figure 4.3), indicating that the surface stratum in all of Area 1 had similar properties in terms of hardness and composition. In comparison, the seabed on the banks in Area 2 had backscatter values of -19 ± 0.4 dB, indicating a significantly harder/rougher composition than those of Area 1 (Figure 4.3a and b; Figure 4.4). Higher than average backscatter values (i.e. less negative) are present in the southeast corner of Area 1, adjacent to some palaeochannels in the northern portion of this area, and around low-lying ridges. Notably, lower values were observed in some palaeochannels and across the flat-lying plains.
In general, channels had slightly higher backscatter values than plains (Figure 4.4). On average, pockmarks in Area 1 had slightly higher backscatter values (-29 ± 2 dB) than the adjacent seabed; this suggests the centres of pockmarks have slightly harder and/or rougher sediment. Indeed, backscatter data appears to be a reasonable visual indicator for pockmark distribution, and there is a good fit between the angular backscatter response curves and those identified using a semi-automated ArcGIS-based method (Kolmogorov-Smirnov goodness of fit = 82.15%; Figure 4.5).
28 Seabed environments, shallow sub-surface geology and connectivity, Petrel Sub-basin

Figure 4.3. a) Reference angular backscatter response curves for pockmarks (blue line, derived from Area 1) and hard bottom (green line, derived from Area 2); b) Comparison of mean backscatter response curves between Area 1 and Area 2. The range of response values is greater for Area 2, which is indicative of a greater range of substrate lithologies. This observation is consistent with the range of geomorphic features present.
Seabed environments, shallow sub-surface geology and connectivity, Petrel Sub-basin 29
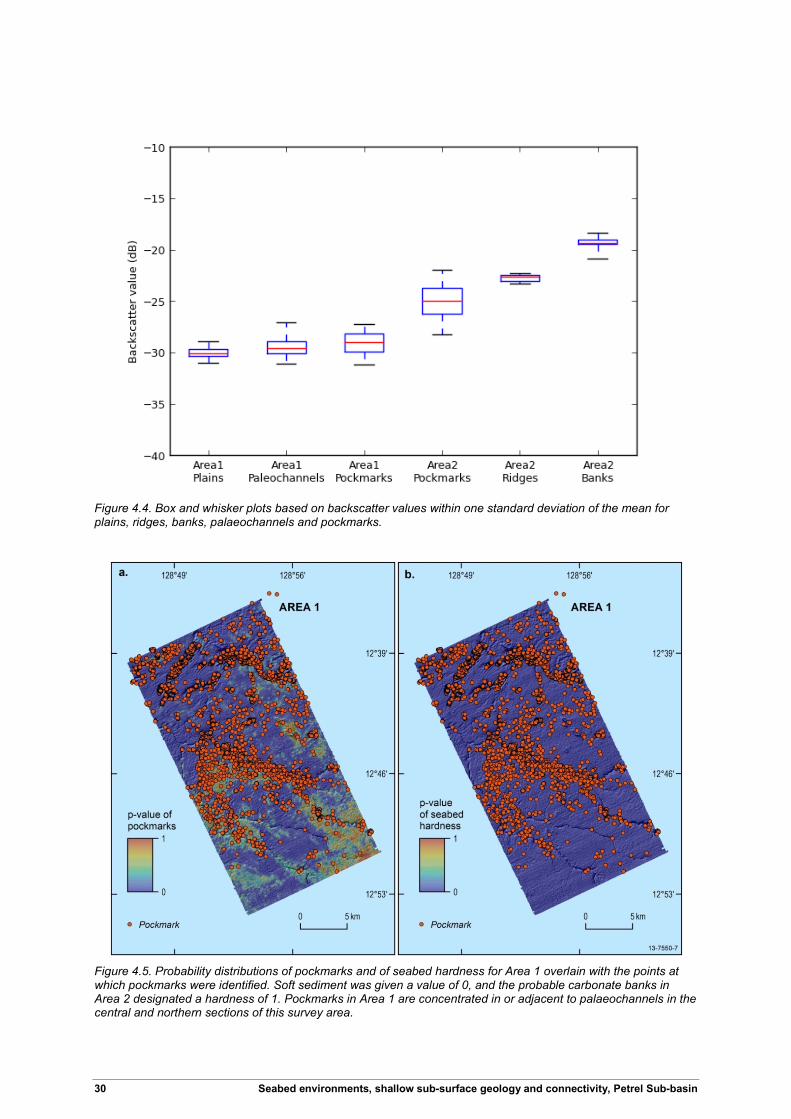
Figure 4.4. Box and whisker plots based on backscatter values within one standard deviation of the mean for plains, ridges, banks, palaeochannels and pockmarks.
Figure 4.5. Probability distributions of pockmarks and of seabed hardness for Area 1 overlain with the points at which pockmarks were identified. Soft sediment was given a value of 0, and the probable carbonate banks in Area 2 designated a hardness of 1. Pockmarks in Area 1 are concentrated in or adjacent to palaeochannels in the central and northern sections of this survey area.
30 Seabed environments, shallow sub-surface geology and connectivity, Petrel Sub-basin

Figure 4.6. Grey-scale, hill-shaded seabed morphology (left panel) with seabed backscatter values (right panel) from Area 1. Locations are: a) area of palaeochannels in northwestern Area 1 adjacent to low-lying ridges and pockmark clusters, b) low-lying ridge, c) low-lying carbonate(?) ridge, and d) palaeochannels on flat-lying plains in the southeastern section of Area 1.
Seabed environments, shallow sub-surface geology and connectivity, Petrel Sub-basin 31

4.1.3 Surface sediment composition and texture
Seabed sediment samples from Area 1 were dominantly poorly to very poorly sorted, gravelly to muddy sand, with a sand content of 58–89% by volume (Figure 4.7). Prior to analysis the consistency of the sediment samples was slightly sticky, and cohesive. The bulk calcium carbonate (CaCO3) concentration was 24–81%. Using the sand-silt-clay ternary classification scheme (Shepard, 1954), the non-gravel component of the samples analysed by laser granulometry (<1.4 mm size) were classified as silty sand. Though the number of samples collected was low, the grain size data suggest that palaeochannels had higher concentrations of sand, and lower proportions of mud (Table 4.3). The gravel component in the sediment samples was largely composed of bioclastic carbonate (shells and other organic debris). Rare granule sized carbonate grains were also present. At two sampling stations in palaeochannels (stations 05 and 06), the gravel component was composed of bivalve and gastropod shells. The majority of individual shells noted at stations 05 and 06 (Appendix Table C.2), were characteristic of inshore, intertidal and estuarine habitats, with both samples having >50% of small, moderately to well preserved Spisula sp., and examples of Anadara granosa (~20%). These species are indicative of sandy to silty, estuarine (sub-tidal to intertidal) habitats (Faulkner, 2010; Wildsmith et al., 2011; Tweedley et al., 2012). In the sediment samples from Area 1 at least two new mollusc species for the region, Frigidocardium sp. and Cryopecten sp. were also identified. At stations 04, 06, 11, 12, and 13, silt and sand sized organic fragments were recovered in biological grab samples after elutriation (Figure 4.8).
Large sedimentary bedforms were not observed in Area 1. However, a few small asymmetric ripples in coarse sand were observed in towed-video within valleys with wavelengths estimated at 20–30 cm.
4.1.4 Vibrocore sediments (<3.5 m depth)
Vibrocores up to 3.6 m long were recovered at stations 05, 06, 07, 08, and 13 in Area 1 (Figure 4.1, Figure 4.9 and Table 4.4). These were used to obtain headspace gas samples (geochemistry cores) or stratigraphic information (sedimentology cores). The longest vibrocore retained for sedimentology was 2.9 m in length. In three of the stratigraphic cores (05VC02, 06VC04 and 13VC09) the sand and gravel fractions were dominated by, or totally composed of dark brown to black organic matter. In vibrocore 06VC04 organic material was present in all sub-samples, including the top of the core. In samples with organic matter present, the dominant size class was mud (silt and clay grain sizes combined, silt dominant), while in contrast most other samples were dominated by sand. As at the seabed, in vibrocores, gravel-sized particles (i.e. >2.0 mm diameter) were rare, and either consisted of plant matter, shells or rarer angular granules of carbonate-cemented sediment.
32 Seabed environments, shallow sub-surface geology and connectivity, Petrel Sub-basin

Table 4.3. Seabed sediment characteristics. Mean, standard deviation, mode, kurtosis and skewness refer to values derived from laser granulometry measurements of grain size.
Sample number
Station number
Geomorphic element
Water depth (m) Gravel % Sand % Mud % CaCO3 % Mean (µm) Standard
deviation (1σ) Mode Kurtosis Skewness
2132390 14 Plains 83.2 11.10 68.78 20.12 68.75 601.48 515.44 1105.28 -0.648 0.668
2132303 09 Plains 85.7 9.73 75.62 14.65 64.32 476.24 437.00 756.14 0.613 1.141
2132334 12 Plains 86.4 12.24 71.06 16.70 66.93 458.68 424.82 573.21 0.818 1.19
2132413 15 Ridge 40.7 20.69 65.26 14.04 80.64 704.81 528.31 1035.58 -0.926 0.26
2132315 10 Ridge 77.6 11.47 73.92 14.61 72.05 447.94 416.02 549.05 0.921 1.196
2132261 07 Ridge 80.4 15.52 57.99 26.49 67.01 453.01 470.08 888.10 0.264 1.067
2132175 04 Ridge 85.5 5.32 74.89 19.79 32.99 347.95 340.31 368.51 2.487 1.47
2132352 13 Palaeochannel 85.4 14.45 83.09 2.46 66.49 587.59 427.48 537.87 0.277 0.958
2132283 08 Palaeochannel 90.3 16.17 72.96 10.87 48.78 315.19 290.76 238.96 3.717 1.755
2132194 05 Palaeochannel 93.1 6.23 89.38 4.40 23.87 510.64 374.49 353.22 1.48 1.323
2132232 06 Palaeochannel 96.14 12.95 79.10 7.95 55.38 437.47 406.40 257.44 1.54 1.429
Seabed environments, shallow sub-surface geology and connectivity, Petrel Sub-basin 33
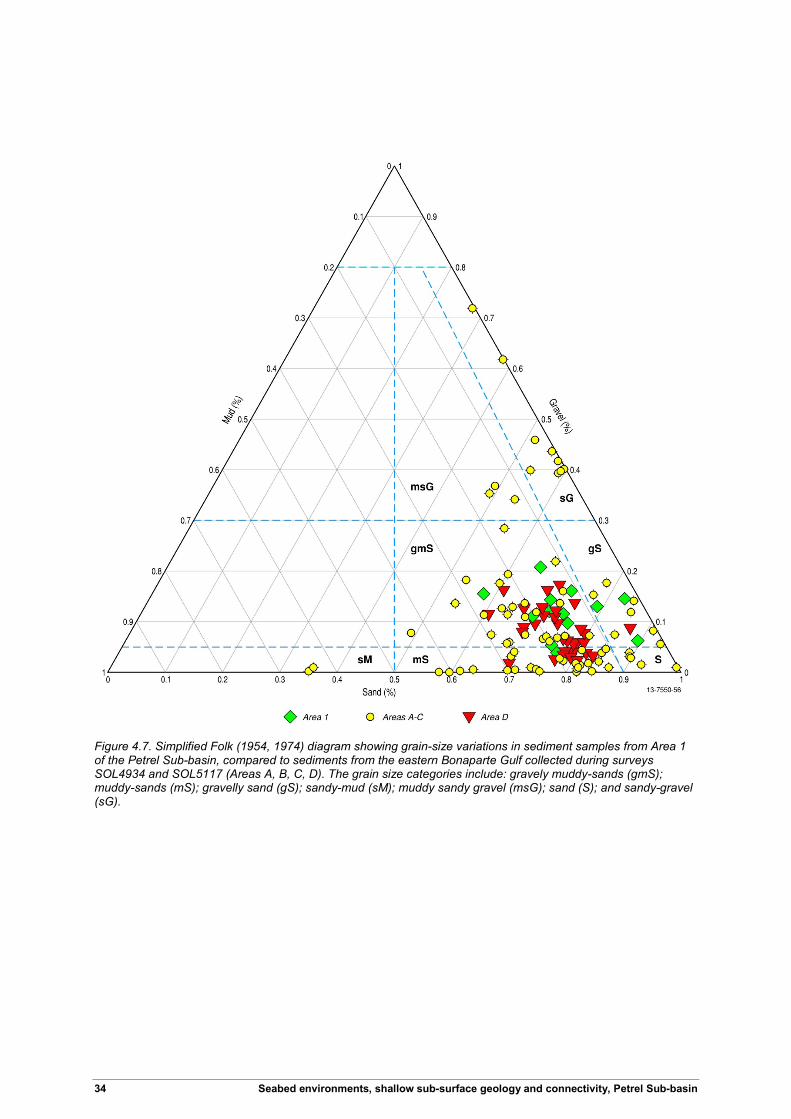
Figure 4.7. Simplified Folk (1954, 1974) diagram showing grain-size variations in sediment samples from Area 1 of the Petrel Sub-basin, compared to sediments from the eastern Bonaparte Gulf collected during surveys SOL4934 and SOL5117 (Areas A, B, C, D). The grain size categories include: gravely muddy-sands (gmS); muddy-sands (mS); gravelly sand (gS); sandy-mud (sM); muddy sandy gravel (msG); sand (S); and sandy-gravel (sG).
34 Seabed environments, shallow sub-surface geology and connectivity, Petrel Sub-basin

Figure 4.8. Location map and representative seabed textures from surveyed stations in Area 1. a) apparent indurated or cemented shell-rich coarse sand to gravel unit in an area incised by palaeochannels located in the northwest of Area 1, in water depth of 96 m; b and c) two views of mounds of unconsolidated sediment in 94 m water depth, some composed of clasts of cemented or lithified sediment, located in a zone of pockmarks; d) sand ripples within a palaeochannel, and e) An example of plant matter (dark colour) in sediment from biological grab samples (SOL5463_04GR01) and vibrocores (SOL5463_13VC09) recovered from the seabed in Area 1 (water depth ~85 m). Magnification x 6.5. Similar plant matter was recovered from biological elutriate taken from grab samples from stations: 4, 6, 7, 8, 9, 10, 12 and 13 from Area 1.
Seabed environments, shallow sub-surface geology and connectivity, Petrel Sub-basin 35

Figure 4.9. Stratigraphic log of vibrocore 13VC09 showing a coarse sand unit at the seabed overlying organic-rich laminated silt sized sediment. This vibrocore taken from the same location as the sediment in Figure 4.8e.
36 Seabed environments, shallow sub-surface geology and connectivity, Petrel Sub-basin
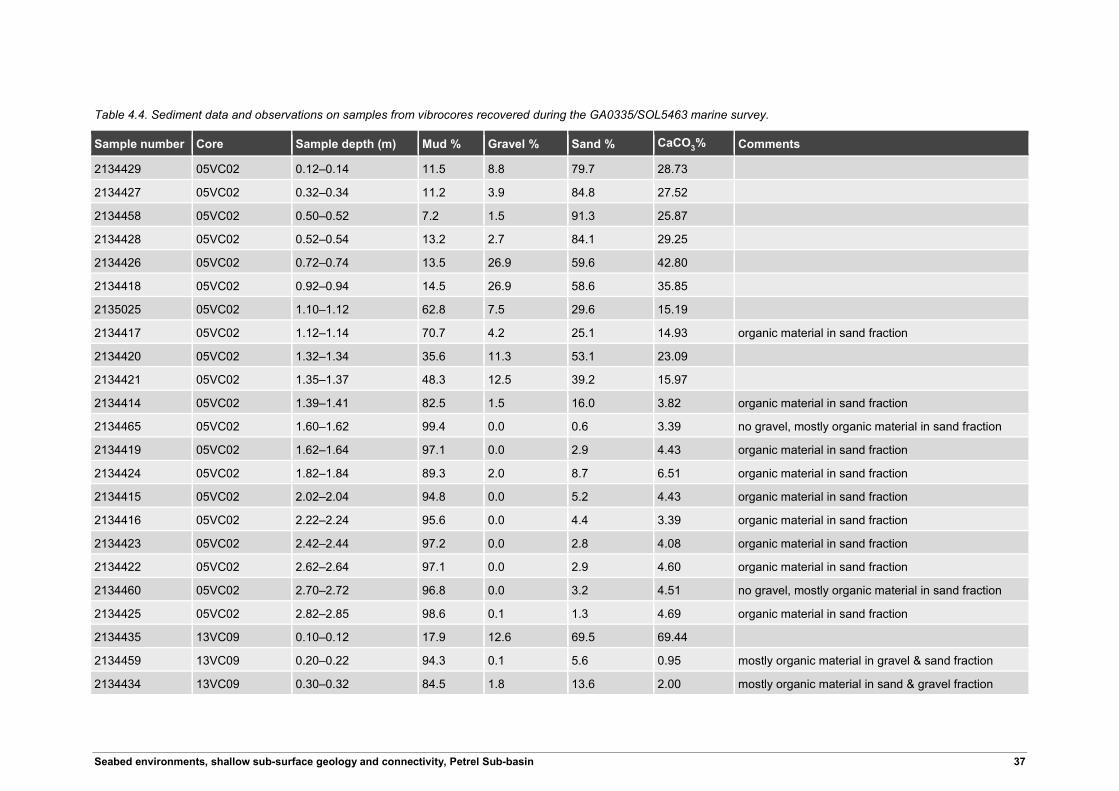
Table 4.4. Sediment data and observations on samples from vibrocores recovered during the GA0335/SOL5463 marine survey.
Sample number Core Sample depth (m) Mud % Gravel % Sand % CaCO3% Comments
2134429 05VC02 0.12–0.14 11.5 8.8 79.7 28.73
2134427 05VC02 0.32–0.34 11.2 3.9 84.8 27.52
2134458 05VC02 0.50–0.52 7.2 1.5 91.3 25.87
2134428 05VC02 0.52–0.54 13.2 2.7 84.1 29.25
2134426 05VC02 0.72–0.74 13.5 26.9 59.6 42.80
2134418 05VC02 0.92–0.94 14.5 26.9 58.6 35.85
2135025 05VC02 1.10–1.12 62.8 7.5 29.6 15.19
2134417 05VC02 1.12–1.14 70.7 4.2 25.1 14.93 organic material in sand fraction
2134420 05VC02 1.32–1.34 35.6 11.3 53.1 23.09
2134421 05VC02 1.35–1.37 48.3 12.5 39.2 15.97
2134414 05VC02 1.39–1.41 82.5 1.5 16.0 3.82 organic material in sand fraction
2134465 05VC02 1.60–1.62 99.4 0.0 0.6 3.39 no gravel, mostly organic material in sand fraction
2134419 05VC02 1.62–1.64 97.1 0.0 2.9 4.43 organic material in sand fraction
2134424 05VC02 1.82–1.84 89.3 2.0 8.7 6.51 organic material in sand fraction
2134415 05VC02 2.02–2.04 94.8 0.0 5.2 4.43 organic material in sand fraction
2134416 05VC02 2.22–2.24 95.6 0.0 4.4 3.39 organic material in sand fraction
2134423 05VC02 2.42–2.44 97.2 0.0 2.8 4.08 organic material in sand fraction
2134422 05VC02 2.62–2.64 97.1 0.0 2.9 4.60 organic material in sand fraction
2134460 05VC02 2.70–2.72 96.8 0.0 3.2 4.51 no gravel, mostly organic material in sand fraction
2134425 05VC02 2.82–2.85 98.6 0.1 1.3 4.69 organic material in sand fraction
2134435 13VC09 0.10–0.12 17.9 12.6 69.5 69.44
2134459 13VC09 0.20–0.22 94.3 0.1 5.6 0.95 mostly organic material in gravel & sand fraction
2134434 13VC09 0.30–0.32 84.5 1.8 13.6 2.00 mostly organic material in sand & gravel fraction
Seabed environments, shallow sub-surface geology and connectivity, Petrel Sub-basin 37

Sample number Core Sample depth (m) Mud % Gravel % Sand % CaCO3% Comments
2134432 13VC09 0.50–0.52 95.1 0.5 4.4 0.26 mostly organic material in sand & gravel fraction
2134433 13VC09 0.70–0.72 88.9 3.2 7.9 0.61 mostly organic material in sand & gravel fraction
2134430 13VC09 0.89–0.91 92.2 3.0 4.8 0.69 mostly organic material in sand & gravel fraction
2134431 13VC09 1.10–1.12 95.7 0.3 4.0 0.17 mostly organic material in sand & gravel fraction
2134437 13VC09 1.30–1.32 88.2 2.8 9.0 0.43 mostly organic material in sand & gravel fraction
2134438 13VC09 1.50–1.52 94.2 2.1 3.7 0.17 mostly organic material in sand & gravel fraction
2134464 13VC09 1.60–1.62 93.1 1.1 5.8 0.61 mostly organic material in gravel & sand fraction
2134436 13VC09 1.70–1.72 91.8 2.7 5.5 0.43 mostly organic material in sand & gravel fraction
2134441 07VC06 1.04–0.16 6.4 11.5 82.0 78.47
2134440 07VC06 0.24–0.26 6.3 67.6 26.1 83.33
2134439 07VC06 0.34–0.36 7.4 52.1 40.5 84.46
2134443 08VC07 0.07–0.11 10.6 42.2 47.2 60.94
2134461 08VC07 0.18–0.20 20.9 11.2 67.8 51.82
2134445 08VC07 0.27–0.31 16.9 52.2 30.9 58.25
2134442 08VC07 0.33–0.35 50.3 26.4 23.2 14.58
2134466 08VC07 0.40–0.43 88.6 6.4 4.9 1.04
2134444 08VC07 0.53–0.55 93.6 0.1 6.3 3.56
2134448 06VC04 0.03–0.06 74.9 1.9 23.2 13.72 organic material in sand fraction
2134451 06VC04 0.24–0.26 88.5 0.7 10.8 4.51 organic material in sand fraction
2134463 06VC04 0.31–0.34 56.2 5.6 38.1 29.77 organic material in sand fraction
2134450 06VC04 0.44–0.46 94.0 0.7 5.3 6.60 organic material in sand fraction
2134452 06VC04 0.64–0.66 92.2 0.3 7.5 6.42 organic material in sand fraction
2134454 06VC04 0.84–0.86 97.7 0.1 2.2 2.69 organic material in sand fraction
2135486 06VC04 0.91–0.93 97.2 0.0 2.8 2.43 no gravel, mostly organic material in sand fraction
38 Seabed environments, shallow sub-surface geology and connectivity, Petrel Sub-basin

Sample number Core Sample depth (m) Mud % Gravel % Sand % CaCO3% Comments
2134455 06VC04 1.11–1.13 97.6 0.1 2.3 2.86 organic material in sand fraction
2134449 06VC04 1.31–1.33 97.6 0.0 2.4 28.65 organic material in sand fraction
2134453 06VC04 1.51–1.53 97.5 0.1 2.3 3.56 organic material in sand fraction
2134446 06VC04 1.71–1.73 99.0 0.0 1.0 3.21 organic material in sand fraction
2134462 06VC04 1.89–1.91 98.2 0.0 1.8 2.60 no gravel, organic material in sand fraction
2134447 06VC04 1.91–1.93 97.6 0.0 2.4 2.69 organic material in sand fraction
2134456 07VC05 0.00–0.05 33.4 28.8 37.9 61.20
2134467 07VC05 0.16–0.20 23.8 52.8 23.4 76.04
2134457 07VC05 0.20–0.23 40.7 22.6 36.7 56.42
Seabed environments, shallow sub-surface geology and connectivity, Petrel Sub-basin 39

4.1.5 Radiocarbon chronology
Samples for radiocarbon dating were chosen from the grab samples and vibrocores collected on this and previous surveys. Vibrocore 13VC09 was particularly interesting for chronology, with approximately 1.8 m of laminated organic-rich silty sediments overlain by <10 cm of coarse shelly sand. An erosional unconformity separated the organic-rich silts and the overlying shelly sand unit. An Ostrea sp. shell fragment was recovered from the base of the sand unit above the unconformity. The Ostrea was dated to 12,577 ± 29 14C years BP. A wood fragment at the top of the organic-rich silt unit below the unconformity was dated to 12,954 ± 37 14C years BP (Table 4.5), whilst organic matter from just above the base of the core (1.69 m depth) was dated to 13,263 ± 45 14C years BP. At stations 05 and 06, Spisula sp. valves recovered from surface sediment in palaeochannels were dated to 13,429 ± 31 and 18,664 ± 40 14C years BP (Table 4.5) Additional dated shells and their ages include Murex sp (2536 ± 25 14C years BP) Corbula sp. (9991 ± 25 14C years BP), Chlamys (1040 ± 25 14C years BP) and Glycymeris sp (1418 ± 25 14C years BP).
Table 4.5. Accelerator Mass Spectrometry (AMS) radiocarbon ages on selected materials from Area 1. Laboratory Numbers shown are University of Waikato Radiocarbon Laboratory numbers.
Laboratory number Sample ID Species Water
depth (m)
Depth below seabed (m)
Geomorphic environment
14C age 1σ Cal age 1σ
Wk-35725 SOL5463/ 13VC09
Spisula sp. 93.1 0 Palaeochannel: intertidal
13,429 31 15,670 590
Wk-35726 SOL5463/ 05GR07
Spisula sp. 96.1 0 Palaeochannel: intertidal
18,664 40 21,760 350
Wk-35727 SOL5463/ 05GR04
Ostrea sp.? 85.3 0.12 Palaeochannel: shallow marine
12,577 29 13,960 190
Wk-35728 SOL5463/ 13VC09
wood 85.3 0.14 Palaeochannel: lacustrine
12,954 37 15,480 460
Wk-37168 SOL5463/ 13VC09
mangrove plant matter
85.3 1.69 Palaeochannel: intertidal to brackish
13,263 45 16,140 810
Wk-37168 SOL4934/ 015VC01
Corbula sp. 109.0 0.34 Shallow marine 13,263 45 16,140 810
Wk-37164 SOL4934/ 015VC01
Spisula sp. 109 0.72 Intertidal 18,664 40 21,761 350
Wk-37165 SOL4934/ 053VC14
Murex sp. 50 0.04 Shallow marine 2536 25 2145 190
Wk-37166 SOL4934/ 053VC14
Chlamys sp 50 0.09 Shallow marine 1040 25 573 100
Wk-37167 SOL4934/ 062VC15
Glycymeris sp 45 0.06 Shallow marine 1418 25 891 150
40 Seabed environments, shallow sub-surface geology and connectivity, Petrel Sub-basin

4.1.6 Surface sediment geochemistry
Ca, Al, and Si comprise 65 ± 9% of the elemental composition of sediment samples from Area 1. These are similar to Area D sample compositions in the eastern Bonaparte Basin (Figure 4.10, Table 4.6; GA0322/SOL4934, Heap et al., 2010; and GA0325/SOL5117, Anderson et al., 2011). In both areas sediment from pockmarked seabed had higher gravel and sand content, higher Si, and lower Ca and Mg. Furthermore, the pattern and abundance of Rare Earth Elements (REE’s) in surface sediments from Area 1 were also similar to sediments from Area D, (Figure 4.11; SOL4934/GA0322, Heap et al., 2010; and SOL5117/GA0325, Anderson et al., 2011).
Figure 4.10. CaO-Al2O3-SiO2 triplot (mol %) indicative of carbonate (CaO), clay (Al2O3) and quartz (SiO2) mineralogy respectively. Most pockmark data are aligned at ~3% Al2O3. * denotes that CaO concentrations were corrected for seawater salts using XRF trace element Cl values. The Petrel Sub-basin data is shown in comparison to pockmarked and non-pockmarked sediments from Areas D in the eastern Bonaparte Gulf (Figure 1.1) collected during the SOL4934 and SOL5117 surveys (Heap et al., 2010; Anderson et al., 2011). Data from Daly and Victoria Rivers are also shown for comparison (de Caritat and Cooper, 2011).
Seabed environments, shallow sub-surface geology and connectivity, Petrel Sub-basin 41

Table 4.6. Results of t-tests and Mann Whitney U (MWU) tests comparing sediment compositions from pockmarked and non-pockmarked seabed from Area 1, Petrel Sub-basin, and Area D (SOL4093 and SOL5117), eastern Joseph Bonaparte Gulf. The values in samples from Area 1 are shown as a range due to the low numbers of samples. The non-outlier ranges (from box and whisker plots) are shown for the non-pockmarked seabed samples from Area 1, with the outlying value provided in parentheses.
Variable Area 1 range: no pockmarks (n=6)
Area 1 range: pockmarks in palaeochannels (n=3)
Area D: non-pockmarked sediment Mean ± 1σ (n=28)
Area D: pockmarked sediment Mean ± 1σ (n=9)
Test type p-value
Gravel (%) 5.3–15.5 6.2–16.2 8.6 ± 4.7 4.7 ± 2.5 t-test 0.02
Sand (%) 57.9–83.1 73–89.3 72.1 ± 9.4 79.2 ± 3.8 t-test 0.03
CaCO3 (%) 59.9–70.9 (32.9) 25.8–56.9 62.6 ± 6.4 56.8 ± 3.4 t-test 0.01
Si (ppt) 70.64–136.36 (271.18) 164.38–291.18 111.05 ± 26.16 149.38 ± 23.26 t-test 0.0004
*Ca (ppt) 225.98–270.73 (126.79) 101.35–216.18 24,366 ± 23.68 212.79 ± 154.52 t-test 0.0008
*Mg (ppt) 12.95–14.99 (8.65) 7.94–10.80 15.80 ± 0.00 14.86 ± 0.01. t-test 0.01
P (ppm) 615–746 (436) 406–611 506.9 ± 54.8 461.1 ± 0.03 t-test 0.02
*Sr (ppm) 1573–1971 (858) 710–1425 1640 ± 21 1478 ± 87 MWUt 0.02
Ge (ppm) 0.3–0.58 0.36–0.65 0.33 ± 0.1 0.41 ± 0.09 t-test 0.03
Zr (ppm) 56.2–71.9 (91.8) 82.5–127.5 116.83 ± 27.85 169.92 ± 23.49 t-test 0.00001
Hf (ppm) 1.4–2.5 2.1–3.5 0.43 ± 0.11 4.03 ± 0.06 t-test 0.00003
*Indicates that the seawater concentration was subtracted from the total concentration by using the Cl concentration of the XRF trace
42 Seabed environments, shallow sub-surface geology and connectivity, Petrel Sub-basin, Bonaparte Basin, Timor Sea

Figure 4.11. Chondrite-normalised REE profile of average bulk sediment from all samples recovered from Area 1, normalised to average bulk sediment (<2 mm) from the Daly River catchment (de Caritat and Cooper, 2011). The Petrel Sub-basin data is shown in comparison to pockmarked and non-pockmarked sediments from Areas A and D in the eastern Bonaparte Gulf (Figure 1.1) collected during the SOL4934 and SOL5117 surveys (Heap et al., 2010; Anderson et al., 2011).
4.1.7 Carbonate isotopes of brown pellets
Van Andel and Veevers (1967) described a ‘brown pellet suite’ of carbonate granules and pebbles from the central Joseph Bonaparte Gulf which may be related to weathering and diagenetic effects. Similar ‘pellets’ were observed in sediment samples collected during this study. These samples were analysed for carbon and oxygen isotopes to see if there is any evidence of groundwater seepage in the Joseph Bonaparte Gulf.
Seabed environments, shallow sub-surface geology and connectivity, Petrel Sub-basin 43

Figure 4.12. Examples of the brown pellet samples used to determine the carbon and oxygen isotope values in carbonate sediment from the seabed in Joseph Bonaparte Gulf.
Figure 4.13. Photograph of rotary drill core 001RD001 from Area C, eastern Bonaparte Basin (Figure 1.1), recovered in water depths of 25 m on the side of a carbonate bank forming the western side of a deep valley (~170 m water depth) (Heap et al., 2010) . Prominent in this, and three other similar short drill cores are large numbers of brown-coloured granule to pebble-sized sediments, and fossil shells at various stages of diagenesis. Top of core (seabed) to the left, tape measure for scale.
44 Seabed environments, shallow sub-surface geology and connectivity, Petrel Sub-basin

Most ‘brown pellet’ carbonate samples analysed, including those from Area 1 had δ13C and δ18O values consistent with Keith and Weber’s 272-sample compilation of Cambrian to Quaternary age marine limestones, though the δ18O values were near the heavy end of this range (Keith and Weber, 1964; Table 4.7). However, brown pellets from stations 04A and 048A of Area D (from previous surveys SOL4934 and SOL5117) had values that were consistent with Keith and Weber’s 158-sample compilation of non-marine limestones (Keith and Weber, 1964). Samples from Area 1 and Area D have intermediate δ18O and δ13C values between freshwater and marine samples (Figure 4.14), with a linear correlation, and line of best fit of δ18O = 0.26* δ13C - 4.0 (R2 =0.64; P<0.01). These results suggest that carbonate nodules formed in a lacustrine/brackish environment, and such environments would have existed only during periods of glacially influenced low sea levels. The influence of groundwater on this system is unknown, but it would be expected that groundwater and sub-aerial processes would interact with carbonates in a lowstand setting.
Figure 4.14. Stable isotopes, δ18O and δ13C data from Joseph Bonaparte Gulf carbonate samples, plotted with isotopic values from Quaternary marine and freshwater carbonates for comparison (Keith and Weber, 1964). All but one sample from Area 1 plot within the ‘marine’ range, while those from the other locations display a greater variation, potentially indicative of their interaction with meteoric water.
Seabed environments, shallow sub-surface geology and connectivity, Petrel Sub-basin 45

Table 4.7. Stable carbon and oxygen isotope values in carbonate sediment from the Joseph Bonaparte Gulf, and from analytical standards. Isotope data are presented relative to reference standards Vienna Pee Dee Belemnite (VPDB) and Vienna Standard Mean Ocean Water (VSMOW).
Laboratory number Survey Sample ID Survey
grid δ13C ‰ VPDB
δ18O ‰ VPDB
δ18O ‰ VSMOW
K17368 SOL5463 06GR07 Area 1 1.06 -5.60 25.15
K17369 SOL5463 07GR10 Area 1 0.14 -5.82 24.92
K17370 SOL5463 09GR16 Area 1 2.13 -4.31 26.47
K17371 SOL5463 10GR19 Area 1 0.78 -5.00 25.77
K17372 SOL5463 12GR23 Area 1 1.25 -5.11 25.65
K17373 SOL5463 13GR26 Area 1 -1.05 -5.70 25.04
K17374 SOL5463 14GR29 Area 1 1.67 -3.34 27.47
K17375 SOL5463 15GR32 Area 1 1.63 -1.64 29.23
K17356 SOL4934 025GR038 B -0.66 -4.98 25.78
K17357 SOL4934 028GR044 B 1.05 -1.61 29.26
K17358 SOL4934 035GR063 C -0.28 -3.45 27.37
K17359 SOL4934 040GR074 C -2.04 -4.10 26.70
K17360 SOL4934 042GR080 D -0.07 -3.32 27.50
K17361 SOL4934 045GR086 D 0.90 -3.66 27.15
K17362 SOL4934 047GR090 D -1.69 -4.46 26.32
K17363 SOL4934 048GR092 D -2.73 -4.92 25.85
K17364 SOL4934 049GR094 D 0.22 -3.37 27.45
K17376 SOL4934 001RD001 C 0.17 -2.86 27.97
K17377 SOL4934 039RD004 C -0.83 -4.18 26.61
K17378 SOL4934 053BS040 D 0.88 -3.89 26.91
K17379 SOL4934 053BS040 D 0.95 -3.90 26.90
K17380 SOL4934 053BS040 D 1.06 -4.40 26.38
K17365 SOL5117 004GR008 D -3.58 -4.98 25.79
K17366 SOL5117 018GR036 D -0.35 -3.92 26.88
K17367 SOL5117 024GR048 A -0.34 -4.47 26.31
mean ± 1σ -0.02 ± 1.39 -4.09 ± 1.08 26.71 ± 1.11
K17381 CSIRO carbonate standard (mean ± 1σ) -13.46 ± 0.20 -5.26 ± 0.21 25.50 ± 0.22
K17382 ANU-PRM-2 standard (mean ± 1σ) 1.15 ± 0.15 -17.63 ± 0.09 12.74 ± 0.09
46 Seabed environments, shallow sub-surface geology and connectivity, Petrel Sub-basin

4.1.8 Silver in seabed surface sediments
The silver concentration in Area 1 samples varied between 0.05 and 0.09 ppm, but at station 07 was 0.54 ppm; Figure 4.15). The silver concentrations at station 07 are enriched by approximately 11 times over the average crustal abundance (0.05–0.08 ppm; McLennon, 2001), approximately 5 times higher than typical shelf sediments (McKay and Pederson, 2008), and by at least 18 times over the abundance in the Daly and Victoria River catchments (<0.03 ppm; de Caritat and Cooper, 2011).
Figure 4.15. Location of silver (Ag) anomaly in Area 1 of the Petrel Sub-basin. Silver enrichment factors are presented relative to average crustal abundance (McLennon, 2001). The elevated silver concentration observed in sediments sampled at station 07 were collected on the margin of a low-lying carbonate(?) ridge.
Seabed environments, shallow sub-surface geology and connectivity, Petrel Sub-basin 47

4.1.9 Head-space gas carbon compounds and carbon isotopes
Eight sediment samples in three cores from stations 05, 06 and 13 were found to be suitable to analyse head-space gases present (cores 05VC01, 06VC03, 13VC08). The results indicate that the head-space gases are dominated by CO2, with concentrations ranging from 200 ppm to 4400 ppm (Table 4.8). C1–C5 hydrocarbons (methane, ethane, propane, butane and pentane) were detected in trace concentrations with total C1–C5 1.58–6.60 ppm. In comparison, typical natural gas from the Petrel Sub-basin is dominated by methane with concentrations typically >90,000 ppm (90 mol %), while CO2 values are approximately <5 ppm.
Table 4.8. Gas composition of head space gas samples (analysed at TDI-Brooks).
Site Station 05 (05VC01) Station 06 (06VC03) Station 13 (13VC08)
Sample # 2132220 2132215 2132210 2132253 2132248 2132379 2132374 2132368
Depth (m) 0.7–0.9 1.7–1.9 2.7–2.9 0.5–0.7 3.5–3.7 0.2–0.4 1.2–1.4 2.2–2.4
Methane 2.42 2.9 2.66 1.34 5.69 1.87 2.15 3.38
Ethane 0.16 0.14 0.12 0.09 0.52 0.07 0.08 0.14
Propane 0.07 0.09 0.06 0.05 0.19 0.06 0.04 0.09
i-Butane 0 0.01 0.01 0.01 0.01 0.01 0.01 0.01
n-Butane 0.02 0.01 0.03 0.02 0.04 0.01 0.01 0.01
neo-Pentane 0.01 0.01 0.01 0.01 0.01 0.01 0 0
i-Pentane 0.08 0.09 0.1 0.06 0.13 0.05 0.09 0.07
n-Pentane 0.01 0.03 0.04 0.01 0.01 0.01 0.01 0.01
CO2 447 1675 1158 198 928 396 4436 1172
4.1.9.1 Head-space gas CO2 isotope values
The CO2 component of head-space gas samples from this study are depleted in 13C with respect to the Vienna Pee Dee Belemnite standard (VPDB; Coplen et al., 2006). For example, δ13C is ~ -25‰ VPDB in core 05VC01 and ~ -45‰ VPDB in cores 06VC03 and 13VC08. The stable carbon isotope composition of hydrocarbon gases (CH4) could not be measured due to their very low concentrations.
The stable carbon isotope values of the CO2 in head-space gas samples (Figure 4.14; Table 4.7) are more negative than those observed in gas from Jurassic and Cretaceous strata within the Vulcan Sub-basin (Bonaparte Basin) which has a mean δ13C of -3.91 (Geoscience Australia, 2001) but similar to bacterial oxidation of methane reference values (Table 4.9).
48 Seabed environments, shallow sub-surface geology and connectivity, Petrel Sub-basin

Table 4.9. Stable carbon isotope values in head-space gas CO2 (this study) and for comparison for δ13C from natural sources from Laughrey & Baldassare (2003).
Site Sample number Depth (m) δ13C CO2 (‰ VPDB)
Station 05 (vibrocore 05VC01) 2132213 1.7–1.9 -25.34
Station 06 (vibrocore 06VC03) 2132245 3.5–3.7 -44.80
Station 13 (vibrocore 13VC08) 2132372 1.2–1.4 -44.87
Atmospheric CO2 -8.00
Volcanic degassing -8.00
Thermal destruction of carbonates 4.00 to -5.00
Thermal degradation of organic matter -8.00 to -12.00
Bacterial oxidation of methane -20.00 to -59.00
CO2 in coal bed gases 18.60 to -26.60
Seabed environments, shallow sub-surface geology and connectivity, Petrel Sub-basin 49
4.1.9.2 Biomarkers in sediments: n-alkanes
Normal alkanes (n-alkanes) are important constituents of crude oils and condensates and occur in young sediments sourced from a biological origin, mostly from C3 plants. N-alkanes were present in all vibrocore samples, and dominated by odd number n-alkanes from C22 to C31 with Odd Even Predominance (OEP) values >2.6 in all three vibrocores (Figure 4.16, Table 4.10). Six of the eight samples had OEP values >5, which is suggestive of peat, rather than lignite or bituminous coals, and indicative of bacterial gas production (Hunt, 1996). These Carbon Preference Index (CPI) values indicate an immature sediment source. Total n-alkane concentrations are variable, with station 13 (vibrocore 13VC08) samples having much higher n-alkane total concentrations than station 05 (vibrocore 05VC01) and station 06 (vibrocore 06VC03) samples (Table 4.10). The predominance of higher molecular weight carbon chains (C27 and above) indicate these are sourced predominantly from terrestrial vascular plants. Additionally, an odd over even carbon number predominance is characteristic of organic sediment derived from non-marine environments, and suggest the presence of epicuticular leaf waxes from higher plants (Reddy et al., 2000).

Figure 4.16. Representative examples of the concentrations of n-alkanes in sediment samples from stations 06 (06VC03) and station 13 (13VC08). Note the dominance of higher molecular weight carbon chains, and the strong predominance of odd over even long carbon chains in these samples. OEP = Odd over Even Predominance.
Figure 4.17. Total concentration of n-alkanes identified in samples from vibrocores 05VC01 (sample numbers 2132209, 2132214, 2132219), 06VC03 (2132247, 2132252) and 13VC08 (2132373, 2132367, 2132378).
50 Seabed environments, shallow sub-surface geology and connectivity, Petrel Sub-basin

Table 4.10. Concentration of n-alkanes in core samples from Area 1, Petrel Sub-basin this study in ng/g dry sediment (i.e. ppb).
Core Sample number Depth (m) n-C22 n-C23 n-C24 n-C25 n-C26 n-C27 n-C28 n-C29 n-C30 n-C31 Total* OEP**
05VC01
2132219 0.6–0.7 1.05 1.08 0.60 1.41 0.60 2.38 0.54 2.79 0.90 4.20 15.55 4.05
2132214 1.6–1.7 15.57 20.04 5.95 58.12 11.93 133.91 17.88 169.57 36.85 215.69 685.51 6.24
2132209 2.6–2.7 15.15 18.70 3.54 42.66 10.70 96.96 8.85 105.49 20.61 166.41 489.07 7.61
06VC03 2132252 0.4–0.5 2.22 6.52 3.77 41.15 6.82 94.46 10.18 109.99 21.94 248.57 545.63 7.81
2132247 3.4–3.5 1.64 2.21 2.50 4.01 3.40 8.57 4.80 12.85 5.12 19.51 64.62 2.65
13VC09
2132378 0.1–0.2 3.29 7.36 4.79 49.22 9.05 101.02 13.96 172.31 44.61 294.73 700.33 6.10
2132367 1.1–1.2 6.04 15.27 9.76 157.13 24.36 328.05 43.53 707.86 150.36 1262.63 2704.99 7.53
2132373 2.1–2.2 5.88 12.28 6.90 107.38 16.37 219.95 24.77 413.97 85.00 821.40 1713.90 8.03
Seabed environments, shallow sub-surface geology and connectivity, Petrel Sub-basin, Bonaparte Basin, Timor Sea 51
* Sum of n-C22 to n-C31 ** OEP = Odd over Even Predominance n-C27+6*n-C29+n-C31)/(4*n-C28+4*n-C30 (Scalan and Smith, 1970; Tissot and Welte, 1984).

4.1.10 Taraxerol and other immature compounds
Taraxerol, an indicator compound for mangroves (Versteegh et al., 2004; Grosejean et al., 2007; Figure 4.18), was present in all vibrocore sediment samples. The concentration of taraxerol was not quantified, but taraxerol peaks in the chromatographs indicate taraxerol present in very high concentrations compared to other compounds identified. The additional compounds identified include n-alkanols and sterols, and indicate immature and direct biological input during the time of deposition of sediments in the shallow sub-surface of Area 1.
Figure 4.18. Representative chromatogram with taraxerol, a lipid biomarker for mangroves (Versteegh et al., 2004; Grosjean et al., 2007).
4.2 Benthic habitats of Area 1 A total of 953 individual infauna representing more than 100 species were collected from 21 grabs at ten sampling stations (Figure 4.19 Figure 4.20 and Figure 4.21). Crustaceans dominated assemblages with 66% of individuals, followed by polychaetes with 25% of individuals. The remaining taxa included nematodes, echinoderms, and molluscs as well as epifaunal organisms such as cnidarians, sponges, and bryozoans. Most species collected from survey SOL5463 were also found in the northeastern Bonaparte Gulf during the SOL4934 and SOL5117 surveys. Only 13% (10 out of 78) of crustacean species collected were unique to SOL5463, and all of these were singletons or doubletons (i.e. occurred only once or twice in the sample set). Infaunal assemblages were not statistically different across the geomorphic features (ANOSIM: R = 0.096, p = 0.134). However, a non-metric multidimensional scaling (n-MDS) plot of the data shows that biological assemblages from ridges are differentiable from ridge margins, plains and palaeochannels assemblages (Figure 4.19). In this plot plains assemblages are grouped within the area covered by palaeochannels, suggesting a greater similarity between these assemblages compared to ridges.
52 Seabed environments, shallow sub-surface geology and connectivity, Petrel Sub-basin

Figure 4.19. A 2-dimensional non-metric multidimensional scaling (n-MDS) plot of square-root transformed data from grab samples collected on survey GA0322/SOL4934 (Heap et al., 2010). Each point represents the biological assemblage from a given grab. The distance between points denotes degree of similarity between grabs, with closer points representing grabs with more similar assemblages. Plots are colour-coded based on a) station number to show similarities across replicate grabs, and b)interpreted geomorphic features. All singletons were excluded from analyses, as well as all polychaetes, nematodes, echinoderms, and molluscs for which species-level identification are still pending. Stress = 0.22.
Seabed environments, shallow sub-surface geology and connectivity, Petrel Sub-basin 53

4.2.1 Towed Video Imagery
Based on towed video imagery, benthic habitats in the eastern Joseph Bonaparte Gulf were previously classified into three principal categories (see Przeslawski et al., 2011). Similarly, observations and data from Area 1 suggested a tripartite division of seabed environments: barren sediment, bioturbated sediment and mixed patches with octocorals and sponges. For further details on these subdivisions see Section 3.2.2.
Relatively diverse patches of mixed octocorals and sponges including soft corals, gorgonians and whips were recorded from video observations on the majority of low-lying ridge features in Area 1 (i.e. stations 2, 4 and 7) at depths ranging between 82 m and 89 m (Figure 4.22a, b), and at station 15 in Area 2 at depths ranging between 46 m and 60 m (Figure 4.24a, b). These patches were commonly interspersed with areas of soft sediment and were found in low densities on relatively flat seabed. Bioturbated sediments with lebensspurren were observed on plains, palaeochannels and low-lying ridges (i.e. stations 5–9, 11, 14 and 15) at depths ranging between 46 m and 96 m (Figure 4.22c–g; Figure 4.24c–h). Few epifauna (e.g. octocorals, sponges and hydroids) were recorded at these locations. Relatively flat expanses of barren sediment with little bioturbation and <10 individual epifauna were recorded in one towed video transect over a palaeochannel at station 5.
Benthic assemblages appear to correspond with geomorphic features to some extent. For example, low-relief ridges supported mixed patches of octocorals and sponges, reflecting stable substrate for their colonisation and growth (Figure 4.23). In contrast, plains and palaeochannels supported lower densities of epifauna and a higher occurrence of bioturbation (Figure 4.23). Scleractinian corals (i.e. hard corals) which include small free-living solitary corals as well as larger reef-forming corals secrete a solid aragonite crystal exoskeleton which distinguishes them from other types of anthozoans, such as soft corals. Small solitary corals possibly belonging to the family Flabellidae were observed in densities of <3 individuals per transect in towed underwater video footage on plains at stations 9 and 14, and in one palaeochannel at station 13 in Area 1 (Figure 4.22d). Three coral colonies possibly belonging to the family Dendrophyliidae were identified at station 13 (Figure 4.22c).
Depressions on the seabed and sediment mounds were observed in underwater video footage at the seabed of disconnected palaeochannel features in the northern section of Area 1 (Figure 4.20). These are the same areas where pockmarks were identified from bathymetry data (figure reference). No distinctive epifauna were recognised to be associated with these features.
54 Seabed environments, shallow sub-surface geology and connectivity, Petrel Sub-basin

Figure 4.20. Images of small mixed sediment mounds at stations 05 (inset a, boxes 1 and 2) and 08 (inset b, box 3) from towed video in palaeochannels adjacent to shallow pockmarks in Area 1. These locations were either biologically barren, or bioturbated.
Seabed environments, shallow sub-surface geology and connectivity, Petrel Sub-basin 55

Figure 4.21. False colour bathymetry of Area 1 overlaid with a) infauna composition, b) species abundance and c) species richness. Species richness refers to the number of species in a sample, while species abundance refers to the number of individuals of a given species as a percentage of all of the individuals in the sample.
56 Seabed environments, shallow sub-surface geology and connectivity, Petrel Sub-basin

Figure 4.22. Video images and still photographs of representative epifauna on seabed environments in Area 1: (a and b) sponge and octocoral patches (STN02cam01); (c) dendrophillid coral attached to a lace bryozoan (STN13cam09b); (d) solitary coral (cf. Truncatoflabellum sp) on bioturbated sediments (STN09cam07a); (e–f) flounder and cuttlefish on soft bioturbated sediments (STN06cam11a); (g) sponge and hydroid on soft bioturbated sediments, and; (h) rippled sediments (STN13cam09). Apart from at the crests of the ripples, sediment in all cases consists of poorly sorted, bioclast-rich sand with minor silt content.
Seabed environments, shallow sub-surface geology and connectivity, Petrel Sub-basin 57

Figure 4.23. False-colour bathymetry (a) and geomorphology (b) of Area 1 overlaid with broad scale benthic classifications. Sampling locations indicated by dots; dot colour indicates habitat type based on still images.
4.3 Seabed geomorphology and sediments of Area 2 The seabed in Area 2 lies in water depths of 28 m to 89 m, and is characterised by flat-topped banks, ridges, terraces and plains (Figure 4.24, Figure 4.25 and Table 4.11). Pockmarks are present on or adjacent to large ridges and hummocks, and on plains and lower slopes of banks. Area 2 has moderate to high relief (Figure 4.24. Plains are the dominant seabed feature comprising 58.2% of the mapped area of Area 2 (Table 4.11). Regions of the plains have a rugose texture, particularly in the deeper areas between banks, and adjacent to the western side of the southern-most bank. Three distinct flat-topped banks covering 22.9% of the area are present in Area 2, including the southern portion of Flat Top Bank, and the central bank which Flat Top 1 penetrates. A terrace in the eastern section of Area 2 covers 11.2% of the mapped area and is elevated approximately 5 m above the surrounding plains, at a mean water depth of 61 m. The terrace margin is scarp-like (near vertical) in places. Ridges cover 6.9% of the area and have mean slopes of 2.22°. The largest ridges are located on Flat Top Bank, and in the west and southeast of the area, with smaller ridges scattered throughout. Ridges trend predominantly NE–SW and NNW–SSE. Some are asymmetric in cross-section, with a steeper north-facing slope.
58 Seabed environments, shallow sub-surface geology and connectivity, Petrel Sub-basin

Figure 4.24. Location of multichannel acoustic sub-bottom (sparker) profiles in Area 2.
Table 4.11. Principal geomorphic features in Area 2 based on ArcGIS polygon mapping.
Area (km2) Area (%) Depth range (m) Mean depth (m ± 1σ) Slope (° ± 1σ)
Plain 105.46 58.23 33–87 66 ± 3 0.55 ± 0.7
Ridge 11.91 6.58 23–71 53 ± 2 2.23 ± 2.0
Bank 41.41 22.86 27–89 41 ± 8 1.04 ± 1.4
Terrace 20.35 11.24 41–74 61 ± 3 0.66 ± 0.7
Total 181.09 100.00 23–89 59 ± 12 0.84 ± 1.3
Seabed environments, shallow sub-surface geology and connectivity, Petrel Sub-basin 59
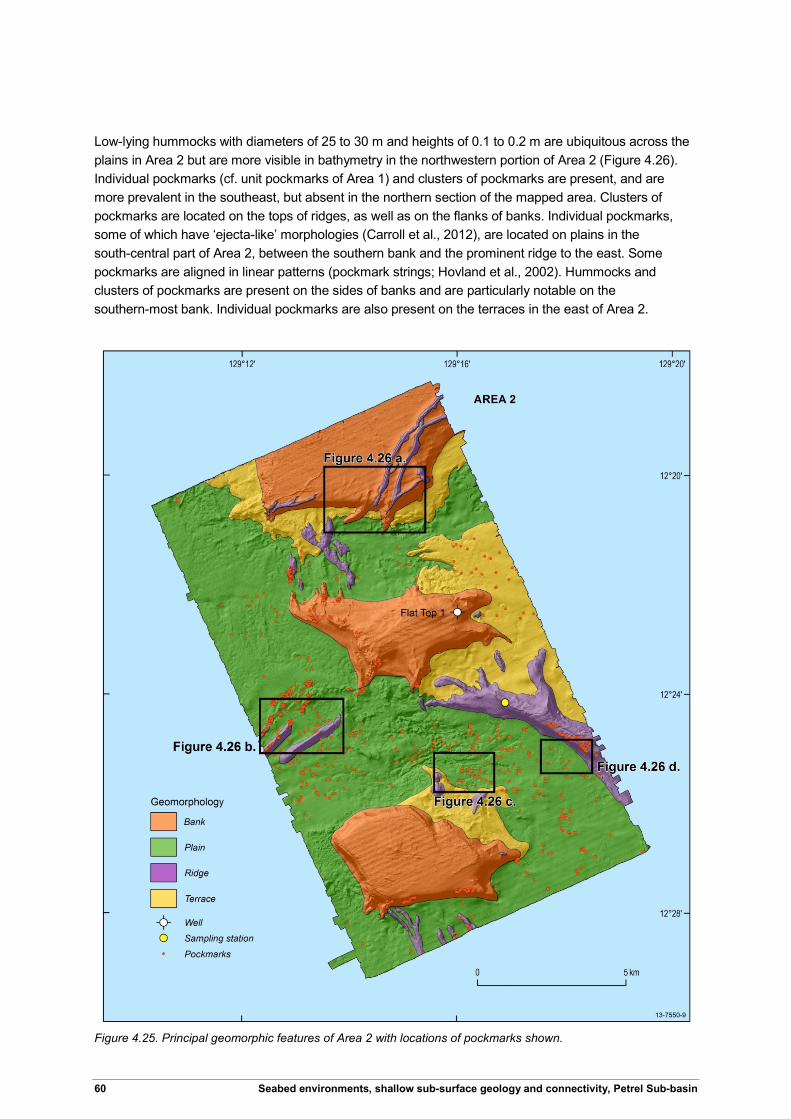
Low-lying hummocks with diameters of 25 to 30 m and heights of 0.1 to 0.2 m are ubiquitous across the plains in Area 2 but are more visible in bathymetry in the northwestern portion of Area 2 (Figure 4.26). Individual pockmarks (cf. unit pockmarks of Area 1) and clusters of pockmarks are present, and are more prevalent in the southeast, but absent in the northern section of the mapped area. Clusters of pockmarks are located on the tops of ridges, as well as on the flanks of banks. Individual pockmarks, some of which have ‘ejecta-like’ morphologies (Carroll et al., 2012), are located on plains in the south-central part of Area 2, between the southern bank and the prominent ridge to the east. Some pockmarks are aligned in linear patterns (pockmark strings; Hovland et al., 2002). Hummocks and clusters of pockmarks are present on the sides of banks and are particularly notable on the southern-most bank. Individual pockmarks are also present on the terraces in the east of Area 2.
Figure 4.25. Principal geomorphic features of Area 2 with locations of pockmarks shown.
60 Seabed environments, shallow sub-surface geology and connectivity, Petrel Sub-basin

4.3.1 Relationships between seabed features and acoustic hardness
Banks and scarps in Area 2 are characterised by relatively high backscatter values between -19 dB and -22 dB (Figure 4.26, Figure 4.27). Terraces and plains have backscatter values of approximately -30 dB. Ridges have intermediate values between these extremes. The backscatter values from this survey area reflect a range of substrates from soft to hard, and indicate that the seabed is composed of areas of soft unconsolidated sediment (e.g. plains and terraces), areas of mixed sediment (e.g. ridges) and areas of hard substrate (e.g. scarp and banks).
Of particular interest in terms of possible evidence for fluid flow, are the backscatter values within pockmarks and for hummocks. Backscatter values are commonly -25 to -26 dB within the central part of identified unit pockmarks and -27 to -30 dB for areas of plains without pockmarks, suggesting that the centres of pockmarks are harder than the surrounding seabed. This is the same relationship between pockmarks and backscatter as observed in Area 1.
4.3.2 Surface sediment composition and texture
A single sediment sample was recovered from station 15 in Area 2. This consisted of very poorly sorted silty medium sand with both relict and fresh shell debris. Chemical analysis was not undertaken on the sample.
4.4 Benthic habitats of Area 2 Observations of video transects at station 15 indicate that at the location of the towed video, the ridge was characterised by mixed patches of octocorals and sponges and soft bioturbated sediments (Figure 4.28 and Figure 4.29).
Seabed environments, shallow sub-surface geology and connectivity, Petrel Sub-basin 61

Figure 4.26. Comparison of greyscale hill-shaded bathymetry and backscatter images for Area 2. Clearly visible in the bathymetry (left) are ridges, hummock fields and pockmarks. In the corresponding backscatter images (right), many more circular features are visible than were identified as pockmarks. Hummocks have a discrete, softer backscatter response.
62 Seabed environments, shallow sub-surface geology and connectivity, Petrel Sub-basin

Figure 4.27. Probability (p-value) of pockmarks in Area 2, and of seabed hardness.
Figure 4.28. Locations of identified video communities in Area 2.
Seabed environments, shallow sub-surface geology and connectivity, Petrel Sub-basin 63

Figure 4.29. Still photographs of representative epifauna on seabed environments in Area 2: (a and b) sponge and octocoral patches (STN15cam12); (c–e) sparsely distributed sponges, octocorals and hydroids on soft bioturbated sediments (STN15cam12); (g and h) bioturbated sediments (STN15cam13).
64 Seabed environments, shallow sub-surface geology and connectivity, Petrel Sub-basin

5 Results: Sub-surface geology
The aim of acoustic sub-bottom profiling of the shallow sub-surface was to investigate regional seal breaches and potential fluid pathways by providing high-resolution images tying the sea floor multibeam bathymetry map to regional seismic reflection data (Figure 5.1 and Figure 5.2). In Area 1, 42 acoustic sub-bottom profiles were collected in water depths of 78 to 102 m (Figure 4.1). In contrast, nine acoustic sub-bottom profiles were collected in Area 2, in water depths of 30 to 75 m (Figure 4.24). These high-resolution data allowed the delineation of stratigraphic architecture in the top 100 m of sediment beneath the seabed in Area 1, with reasonable agreement between the sub-bottom and seismic profiles achieved.
Acoustic units are defined using reflector geometries, spatial relationships, amplitude, continuity and frequency as seen in sub-bottom profiles. Thus, acoustic units provide an indication of the stratigraphic architecture in the sub-surface sediments. Acoustic anomalies (Table 5.2) are features or zones in the sub-bottom profiles with acoustic characteristics that are markedly different from those observed in the immediately adjacent data. Anomalies commonly encountered included zones of acoustic signal attenuation, dimming and brightening. These anomalies may indicate faulting, the presence of gas or other fluids, cemented lithologies, or simply anomalous data.
Seabed environments, shallow sub-surface geology and connectivity, Petrel Sub-basin 65

Figure 5.1. a) Seismic line GA0336/110 with principal reflector (H1) identified in sub-bottom profiles highlighted. H1 extends across Area 1 but is not present in Area 2. b) The same reflector on seismic line GA0336/113, orthogonal to line GA0336/110. The maximum depth of sub-bottom profiler penetration is also shown on a); location of seismic lines shown on Figure 5.2.
66 Seabed environments, shallow sub-surface geology and connectivity, Petrel Sub-basin

Figure 5.2. Location diagram of sub-bottom profile lines collected during the marine survey GA0335/SOL5463 and seismic lines collected during the seismic survey GA0336.
Seabed environments, shallow sub-surface geology and connectivity, Petrel Sub-basin 67
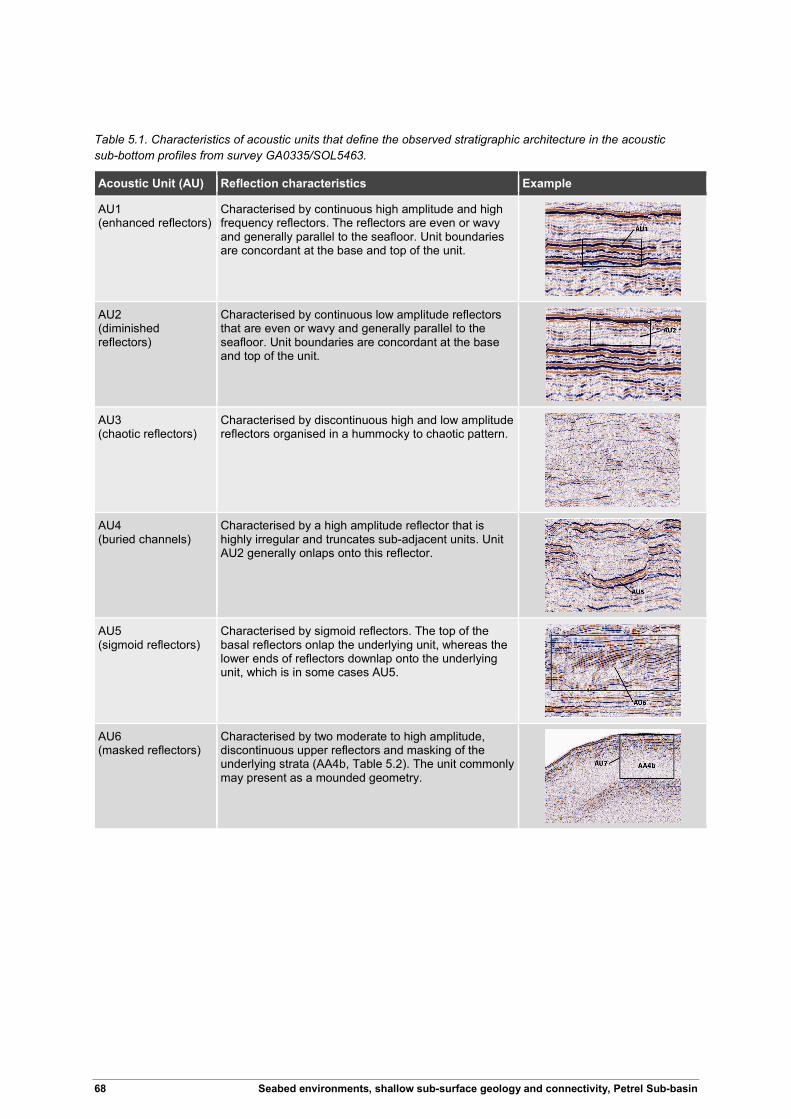
Table 5.1. Characteristics of acoustic units that define the observed stratigraphic architecture in the acoustic sub-bottom profiles from survey GA0335/SOL5463.
Acoustic Unit (AU) Reflection characteristics Example
AU1 (enhanced reflectors)
Characterised by continuous high amplitude and high frequency reflectors. The reflectors are even or wavy and generally parallel to the seafloor. Unit boundaries are concordant at the base and top of the unit.
AU2 (diminished reflectors)
Characterised by continuous low amplitude reflectors that are even or wavy and generally parallel to the seafloor. Unit boundaries are concordant at the base and top of the unit.
AU3 (chaotic reflectors)
Characterised by discontinuous high and low amplitude reflectors organised in a hummocky to chaotic pattern.
AU4 (buried channels)
Characterised by a high amplitude reflector that is highly irregular and truncates sub-adjacent units. Unit AU2 generally onlaps onto this reflector.
AU5 (sigmoid reflectors)
Characterised by sigmoid reflectors. The top of the basal reflectors onlap the underlying unit, whereas the lower ends of reflectors downlap onto the underlying unit, which is in some cases AU5.
AU6 (masked reflectors)
Characterised by two moderate to high amplitude, discontinuous upper reflectors and masking of the underlying strata (AA4b, Table 5.2). The unit commonly may present as a mounded geometry.
68 Seabed environments, shallow sub-surface geology and connectivity, Petrel Sub-basin

Table 5.2. Acoustic anomalies and their interpretation identified within the sub-bottom profiles.
Acoustic Anomaly (AA) Reflection characteristics Example
AA1 (fault)
Characterised by discontinuity and vertical displacement of parallel to sub-parallel reflectors. In places, the anomaly coincides with seismic masking. The vertical extent of the anomaly ranges from 2 m to 45 ms TWT.
AA2 (microfaulting)
Characterised by short discontinuities of vertically stacked parallel reflectors. The vertical extent of the anomaly is generally less than 5 ms TWT.
AA3a (pull-down)
Characterised by vertically stacked parallel reflectors showing a pull-down effect.
AA3b (pull-up)
Characterised by vertically stacked parallel reflectors showing a pull-up effect.
AA4a (brightening)
Characterised by high amplitude bright reflectors.
AA4b (masking)
Characterised by acoustic signal attenuation or loss. This dimming or masking effect evidenced by low amplitude disorganised reflectors.
Seabed environments, shallow sub-surface geology and connectivity, Petrel Sub-basin 69

5.1 Shallow sub-surface geology: Area 1
5.1.1 Overview of data collected
Forty two acoustic sub-bottom profiles were acquired in Area 1, with one additional line acquired at the northeastern margin of the area during transit. The profiles collected were aligned either parallel or orthogonal to seismic lines from survey GA0336. Five lines were obtained in a northwest–southeast direction (Carroll et al., 2012). The remaining 35 sub-bottom profile lines are oriented in a southwest-northeast direction (Figure 4.1, Figure 5.2).
5.1.2 Seismic velocities in sub-bottom profiles
Seismic velocities provide information on the physical properties of stratigraphic units, and may provide information on the composition of strata and the presence of fluids. In Area 1 the Water-Bottom Multiple (WBM) visible in acoustic sub-bottom profiles occurred at approximately at 80–90 m beneath the seabed. Four layers were recognised between the Water Bottom (WB, seabed) and the WBM. The derived acoustic p-wave velocities for the four layers were in the range of 1650 ms-1 to 1775 ms-1 (Figure 5.3). These values are indicative of strata that are water saturated and to some extent unlithified (Figure 5.4).
Figure 5.3. P-wave seismic velocities derived from acoustic sub-bottom data from marine survey SOL5463 (Jones, 2014) for Area 1. WB (water bottom) refers to the seabed, WBM = water bottom multiple, below which attenuation of signal makes it difficult to differentiate among strata.
70 Seabed environments, shallow sub-surface geology and connectivity, Petrel Sub-basin
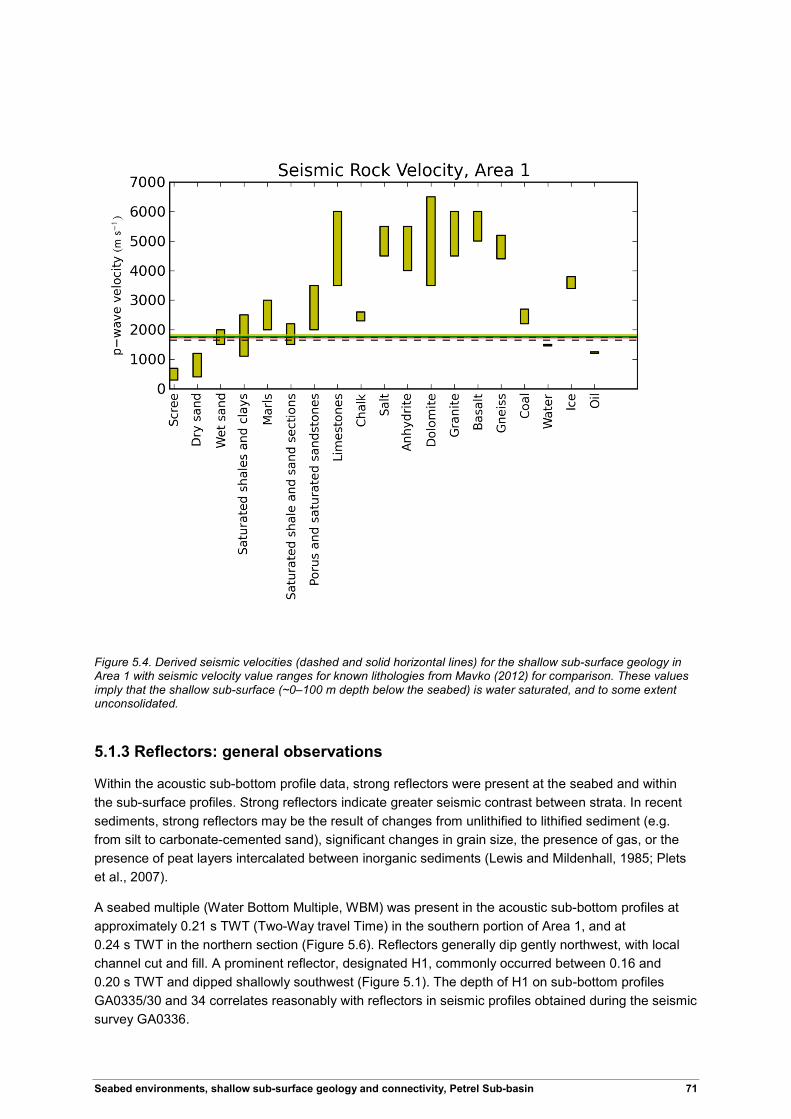
Figure 5.4. Derived seismic velocities (dashed and solid horizontal lines) for the shallow sub-surface geology in Area 1 with seismic velocity value ranges for known lithologies from Mavko (2012) for comparison. These values imply that the shallow sub-surface (~0–100 m depth below the seabed) is water saturated, and to some extent unconsolidated.
5.1.3 Reflectors: general observations
Within the acoustic sub-bottom profile data, strong reflectors were present at the seabed and within the sub-surface profiles. Strong reflectors indicate greater seismic contrast between strata. In recent sediments, strong reflectors may be the result of changes from unlithified to lithified sediment (e.g. from silt to carbonate-cemented sand), significant changes in grain size, the presence of gas, or the presence of peat layers intercalated between inorganic sediments (Lewis and Mildenhall, 1985; Plets et al., 2007).
A seabed multiple (Water Bottom Multiple, WBM) was present in the acoustic sub-bottom profiles at approximately 0.21 s TWT (Two-Way travel Time) in the southern portion of Area 1, and at 0.24 s TWT in the northern section (Figure 5.6). Reflectors generally dip gently northwest, with local channel cut and fill. A prominent reflector, designated H1, commonly occurred between 0.16 and 0.20 s TWT and dipped shallowly southwest (Figure 5.1). The depth of H1 on sub-bottom profiles GA0335/30 and 34 correlates reasonably with reflectors in seismic profiles obtained during the seismic survey GA0336.
Seabed environments, shallow sub-surface geology and connectivity, Petrel Sub-basin 71

The stacked, generally layer-bound, stratigraphy was subdivided into representative Acoustic Units (AU). Acoustic units were punctuated in some places by layer-bound and rarer cross-layer Acoustic Anomalies (AA). In some areas a particularly shallow ghost reflector was located directly beneath the present seabed.
No major faults appear to pass through the sub-surface strata (<100 m depth) from the Bathurst Island Group regional seal on the seismic imagery (Figure 5.1). Layer 4 as identified from sub-bottom seismic velocity data (Figure 5.3) appears to refer to the strata between H1 and the WBM in the sub-bottom profiles. H1 is most likely a compound unconformity surface.
5.2 Sub-surface acoustic stratigraphy: Area 1
5.2.1 Acoustic units
Two sub-bottom profiles (GA0335/030 and GA0335/034) parallel to the long axis of Area 1 were selected to illustrate the main acoustic units interpreted here as they are representative of the acoustic sub-bottom profiles from Area 1 (Figure 5.5, Figure 5.6). The sub-surface strata generally dip to the northwest and the stratigraphy was more complex in the northeast of Area 1 than in the southwest. This complexity was also observed in sub-bottom lines orthogonal to lines GA0335/030 and GA0335/034 such as GA0335/006.
The seafloor multiple occurs at 220–240 ms TWT. Below this the acoustic sub-bottom profiles from Area 1 are not informative due to attenuation of reflector signals. Only the upper 100 ms TWT of the profiles below the seabed is interpretable. The stratigraphic contacts between acoustic units appear conformable. The thickness of the enhanced reflectors acoustic facies (AU1, Table 5.1) was usually less than 5 ms TWT, but up to 13 ms TWT. The diminished reflectors acoustic facies (AU2) tended to be somewhat thicker, up to 35 ms TWT, but more frequently 10–20 ms TWT. The frequency of both units increased towards the north of Area 1. Throughout Area 1, a regional horizon, H1, was observed at approximately 200 ms TWT (Figure 5.6). H1 was generally underlain by attenuated reflectors and discontinuous, chaotic, high and low-amplitude reflectors (AU3).
AU1 was generally characterised by one to three high-amplitude and continuous reflectors, whereas AU2 was characterised by multiple continuous or discontinuous reflectors of lower amplitude. The combined thickness of a stacked AU1 and AU2 succession was up to 0.025 s TWT in Area 1, this is in contrast to Area 2 where AU2 are thinner and more variable, reducing the stacked AU1 and AU2 thickness.
The generally flat-lying and prominent reflectors marking AU1 were incised by buried channels (AU4) filled with AU2. On acoustic sub-bottom profile GA0335/034, the channels were mostly incised into the same sub-bottom reflector. In contrast, the incision by channels visible in acoustic sub-bottom profile GA0335/030 occurred within several different acoustic sub-bottom reflectors (Figure 5.6).
AU3 was approximately 0.040 ms TWT thick in Area 1 and characterised by hummocky to chaotic reflectors that are faint due to signal attenuation. The top of AU3 was defined by a contact with AU1; the base of unit AU3 could not be delineated due to the seabed multiple.
AU5 and AU6 were only found within Area 1. Where AU4 occurred at the seafloor, it coincided with channels that were clearly visible on the bathymetry. AU4 contained a strong basal reflector that cut through underlying reflectors, truncated adjacent facies and extended up to 100 m laterally. The unit generally formed 100—200 m long depressions that were infilled with AU2 and/or AU5. AU5 was generally composed of sigmoidal reflectors varying in strength and continuity.
72 Seabed environments, shallow sub-surface geology and connectivity, Petrel Sub-basin

5.2.2 Acoustic anomalies
Three types of acoustic anomaly were identified. These were microfaulting (AA2), brightening (AA4a), and masking (AA4b) (Figure 5.6, Table 5.2). Brightening (AA4a) was the most prevalent anomaly in line GA0335/034, particularly within acoustic facies AU3. Acoustic features and other anomalies within AU3 were difficult to observe due to increasing signal attenuation with depth. Some acoustic masking (AA4b) below the seafloor ridges is also observed, particularly on the western side of the study area. Brightening was evident below some zones of acoustic masking (Figure 5.6).
More intermittent anomalies include sharp pull down anomalies and seafloor ghosting which occurs just below the seafloor reflector (Figure 5.6b). The potential pull-down (AA3a) occurring at the base of the sigmoid reflectors of AU5 is believed to be a processing artefact caused by the steep geometry of the sub-surface features in combination with the pulse footprint. However, on other sub-bottom profiles, such as GA0335/06, v-shaped pulldowns appear to propagate upwards across multiple reflectors (i.e. they are not layer-bound) and do not reach the seabed. Of particular importance for the recognition of gas-charged strata is the presence or absence of reversed polarity across reflectors, with reversed polarity being a key indicator of gas presence. No reversals in polarity were found in any of the acoustic sub-bottom profiles
Seabed environments, shallow sub-surface geology and connectivity, Petrel Sub-basin 73

Figure 5.5. Locations of acoustic sub-bottom lines and sampling stations from GA survey GA0335 referred to in subsequent sections.
74 Seabed environments, shallow sub-surface geology and connectivity, Petrel Sub-basin

Figure 5.6. a) Acoustic sub-bottom profiles GA0335/030 and GA0335/034 extending from the northwest to the southeast b) Interpreted acoustic facies and anomalies of the sub-bottom profile shown in a). Location of sub-bottom profiles shown on Figure 5.5.
Seabed environments, shallow sub-surface geology and connectivity, Petrel Sub-basin, Bonaparte Basin, Timor Sea 77

5.3 Connectivity of the seabed and shallow geology: Area 1 In general, geomorphic features at the seabed of Area 1 show little direct structural connection to deep faults. That is, faults visible in seismic data do not appear to propagate to the seabed but tend to terminate at approximately 0.23–0.24 s TWT depth (Figure 5.8). The following sections provide examples of connectivity between key geomorphic features at the seabed and shallow geological features identified in sub-bottom profiles. Examples of inferred possible linkages between deep-seated structures and shallower features are also discussed.
5.3.1 Buried Channels
Buried channels present beneath the seabed are particularly common in the northern part of Area 1 (Figure 5.7, Figure 5.8). They range in width from 200 m to 1000 m. The thickness of fill most commonly ranges from 0.01 to 0.02 s TWT. There is no evidence of a relationship between the location of channels on the seabed and faulting below the water bottom multiple (Figure 5.8), nor evidence that buried channels have exploited planes of weakness associated with faults. That is, channels have not incised into faults within the shallow sub-surface sedimentary strata.
Figure 5.7. Section of acoustic sub-bottom profile GA0335/014, with multiple buried channels present, some examples of which are indicated. The seismic facies AU5 most commonly forms the base of the buried channels. Location of line shown in Figure 5.5.
78 Seabed environments, shallow sub-surface geology and connectivity, Petrel Sub-basin

Figure 5.8. a) Section of acoustic sub-bottom profile GA0335/022 showing a buried channels with apparent masking (AA4b) beneath it b) Seismic profile GA0336/116 with large faults (AA1) visible. Individual strata visible in the uppermost portion of the acoustic sub-bottom profiles are not visible here in the related seismic image. The faults do not appear to propagate to the seabed, instead appearing to be truncated. Location of lines shown in Figure 5.5.
Seabed environments, shallow sub-surface geology and connectivity, Petrel Sub-basin 79

5.3.2 Pockmarks
5.3.2.1 Pockmark clusters in seabed channels
Pockmarks in palaeochannels are generally clustered loosely, particularly in the northwest of Area 1 (Figure 4.2, Figure 5.9). Examples of these include two representative pockmark clusters crossed by acoustic sub-bottom profile line GA0335/006 as shown in Figure 5.9. No large acoustic anomalies underlie the pockmark clusters, but small faults (AA1) in strata (<10 ms TWT in height) occur within the uppermost acoustic units in the shallow sub-surface (Figure 5.9a). This acoustic sub-bottom profile in particular (Figure 5.9a) has many vertical blank lines, indicating uniform seismic characteristics, vertically cross-cutting wavy to flat-lying reflectors. These are acoustically similar to gas chimneys identified in the Aegean Sea and associated with pockmarks (25–50 ms TWT depth; Dondurur et al., 2011) but are significantly smaller (<10 ms TWT depth) and predominantly located in the upper 20 ms TWT of this profile. These may be locations of fracture propagation and de-watering (cf. Moss et al., 2012). No direct connection between these potential fluid-related features and deeper structures was identified.
5.3.2.2 Pockmark clusters on plains
In addition to the loose clusters of pockmarks in seabed channels, pockmark clusters are present on the plains, particularly in the central and northern sections of Area 1 (Figure 5.9, Figure 5.10). The pockmark cluster illustrated in Figure 5.10 is some 850 m long and parallel to a low-lying ridge. This pockmark cluster is over several buried channels which in turn are over relatively flat-lying reflectors. These flat reflectors are interrupted in places by acoustic masking (AA4b) suggesting possible trapped gas. None of these anomalies show a direct connection with deeper structures, however they may be associated with velocity pull-downs which could represent fluid migration pathways. Within the shallowest sub-surface (~0.01 s TWT) microfaulting (AA2) is present but does not extend through the underlying channel units (Figure 5.10a). Although the pockmark clusters do not appear to be directly structurally linked with deeper structures, particularly the Bathurst Island Group regional seal, it is possible for fluids derived from the deeper sedimentary succession to reach the seabed if interconnected by permeable strata and/or fault zones.
5.3.3 Low-lying ridges
Low-lying ridges located in the central-eastern part of Area 1 are underlain by a prominent fault (AA1) at depth that displaces the Bathurst Island Group strata (Figure 5.11). On seismic line GA0336/113, this fault is present below 0.23 s TWT, but above this reflectors are generally laterally continuous. Therefore there is no evidence in the acoustic sub-bottom profiles for large discrete faults reaching the seafloor or any seabed evidence for faulting. Hence the ridges at the seabed are interpreted to have formed independently of faulting.
80 Seabed environments, shallow sub-surface geology and connectivity, Petrel Sub-basin

Figure 5.9. a) Seabed and sub-surface with pockmark clusters within a palaeochannel on sub-bottom profile GA0335/006. b) Enlargement of the sub-bottom profile GA0335/006 showing no large acoustic anomalies beneath the pockmark clusters. As illustrated here, the laterally continuous strong reflector H1 is actually several reflectors closely spaced, and in places incised by channels. Location of lines shown in Figure 5.5.
Seabed environments, shallow sub-surface geology and connectivity, Petrel Sub-basin 81

Figure 5.10. a) Acoustic sub-bottom profile GA0335/006 showing the sub-surface beneath a surficial pockmark cluster in the northern part of Area 1. b) Enlargement of the sub-bottom profile shown in a). Location of lines shown in Figure 5.5.
82 Seabed environments, shallow sub-surface geology and connectivity, Petrel Sub-basin

Figure 5.11. a) Acoustic sub-bottom line GA 0335/015 beneath low-lying carbonate(?) ridges on the northeastern side of Area 1. b) A portion of the regional seismic line GA 336/113 with faults (AA1) that rise towards, but do not reach, the seafloor. Location of lines shown in Figure 5.5.
Seabed environments, shallow sub-surface geology and connectivity, Petrel Sub-basin 83

5.4 Shallow sub-surface geology: Area 2
5.4.1 Overview of data collected
Nine sub-bottom profiles, oriented approximately in a northeast–southwest direction, were obtained in Area 2 at an average spacing of 1.6 km (Figure 5.2). Two of the sub-bottom profiles are parallel to seismic lines from the GA0336 survey, including the seismic line passing through the location of Flat Top 1 well (GA0336/110). In contrast to Area 1 significant masking of the shallow sub-surface was evident in all acoustic sub-bottom profiles from this survey area making observations on these data limited (Figure 5.12).
Figure 5.12. Overview of the principal features associated with acoustic sub-bottom profiles in Area 2. Location of lines shown in Figure 5.13.
84 Seabed environments, shallow sub-surface geology and connectivity, Petrel Sub-basin

Figure 5.13. Location of acoustic sub-bottom profiles in Area 2, and the location of sampling station 15 on a prominent ridge.
Seabed environments, shallow sub-surface geology and connectivity, Petrel Sub-basin 85

5.4.2 Seismic velocities in sub-bottom profiles, Area 2
In Area 2, the acoustic sub-bottom velocity data indicate three layers are present beneath the seabed, and above the WBM (Jones, 2014). However, these results are the average of all the acoustic sub-bottom profiles, and do not tell us about strata underlying specific features, such as Flat Top Bank. The top two layers have interval times of 15 and 20 ms respectively, while the base of unit three coincides with the WBM. The slightly higher velocities for Area 2, compared to Area 1, are most likely the due to the presence of carbonate in the shallow sub-surface, particularly in the uppermost unit (Australian Aquitaine Pty Ltd., 1970).
Figure 5.14. Calculated seismic velocities from acoustic sub-bottom data, Area 2 (Jones, 2014).
86 Seabed environments, shallow sub-surface geology and connectivity, Petrel Sub-basin

Figure 5.15. Derived seismic velocities (dashed and solid horizontal lines) for the shallow sub-surface geology in Area 2. Despite having higher seismic velocities as compared to Area 1, these values imply that the shallow sub-surface (~ 0-100 m below seabed) is water saturated, and to some extent unconsolidated, similar to Area 1. Seismic velocity values from Mavko (2012).
5.4.3 Reflectors: general observations, Area 2
Reflectors in the sub-bottom profiles from Area 2 are difficult to identify in most cases due to widespread masking of the acoustic signal. Reflectors are clearer away from the banks, less so adjacent to banks and ridges and completely masked underneath banks and ridges. For example on sub-bottom profile GA0335/046 acoustic penetration on the western side of the area extends to ~185 ms TWT (Figure 5.16), but masking obscures the sub-surface beneath the adjacent banks and ridges (Figure 5.12).
Seabed environments, shallow sub-surface geology and connectivity, Petrel Sub-basin 87

Figure 5.16. a) Acoustic sub-bottom profile GA0335/046 west Area 2. b) The interpreted acoustic facies and anomalies of the sub-bottom profile shown in a). Location of line shown on Figure 5.13.
88 Seabed environments, shallow sub-surface geology and connectivity, Petrel Sub-basin

5.5 Sub-surface acoustic stratigraphy: Area 2
5.5.1 Acoustic units
Four acoustic units were present in the acoustic sub-bottom profiles from Area 2: AU1, AU2, AU4 and AU6. Of these units alternating successions AU1 and AU2 were most prevalent in the eastern section of sub-bottom line GA0335/046 (Figure 5.16). Acoustic unit AU2 is predominant within these successions. At the scale used in the profile, the AU1 reflectors show broad scale concavity. The depth of the reflectors changes by about 5 ms TWT for 400 m of horizontal change. Based on an averaged acoustic speed of 1500 ms-1, the slope is approximately 0.6 degrees. On the western section of sub-bottom line GA0335/046, approximately 2000 m from its end, AU1 units converge with onlap from the west. Between 130 and 180 ms TWT, the extent of onlap is difficult to resolve due to acoustic masking (AA4b). AU3 underlies AU1 at around 170 ms TWT and is delimited at depth by the seafloor multiple. AU6 is present between 3200 m and 3400 m.
5.5.2 Acoustic anomalies
Three acoustic anomalies (AA1, AA4a, AA4b) are observed on sub-bottom profile GA0335/046 (Figure 5.16, Table 5.2). Two faults (AA1) are present and traceable throughout unit AU1 because of the quality of the reflectors. The truncation and displacement of the reflectors specific to the faults are visible around 1200 m and 3000 m. The vertical displacement, up to 2 ms TWT, is discernible from 125 to 155 ms TWT and 115 to 130 ms TWT. Brightening (AA4a) is present throughout AU2, AU3 and AU6 units. Masking (AA4b) occurs between 2000 and 2900 m.
The eastern side of the sub-bottom profile GA0335/046 is characterised by acoustic penetration to the seabed multiple at approximately 160 ms TWT (Figure 5.17). AU1 is visible between 120 and 150 ms TWT with its reflectors undulating more than the same units observed in the west, potentially indicating kinking (Figure 5.17). AU3 and AU6 are also present. The dominant anomalies are brightening and masking with brightening observed in distinct zones between 7300 m and 9500 m. The amount of masking occurs to varying degrees throughout GA0335/046. When not part of a broader AU6 unit, masking is best observed between 8500 m and 8900 m.
Brightening anomalies observed on either side of the fault at 9050 m occur at different depths and with angles (Figure 5.17). To the west of the fault the reflectors dip approximately 2.9° while to the east they dip 0.9° (based on 1500 ms-1 acoustic velocity). The vertical offset between the eastern and western reflectors is about 12 ms TWT. The eastern set appears to have been displaced down, illustrated by the downward inflection of the reflectors located along the western margin of the fault. Beyond this area the reflectors are difficult to trace.
Seabed environments, shallow sub-surface geology and connectivity, Petrel Sub-basin 89

Figure 5.17. a) Acoustic sub-bottom profile GA0335/046 east, Area 2. b) The interpreted acoustic facies and anomalies of the sub-bottom profile shown in a). Location of line shown on Figure 5.13.
90 Seabed environments, shallow sub-surface geology and connectivity, Petrel Sub-basin

5.6 Connectivity of the seabed and shallow geology: Area 2 The Flat Top 1 well is located within Area 2 and provides a link between shallow sub-surface and deep geology (Figure 5.1). The dominant seabed features in Area 2 are carbonate banks, ridges, terraces and plains. Apparent faults (AA1) in the shallow sub-surface (<200 ms TWT) of Area 2 underlie or are adjacent to banks. These banks and ridges are located over faults that occur within the Bathurst Island Group. Many of these faults are polygonal faults which are well connected vertically and horizontally and may locally promote gas flow through to the seabed compromising the seal efficacy of the Bathurst Island Group (Consoli et alet al., 2014; Seebeck et al., 2015). However, there is little apparent linkage between the deep basin-scale faults observed on seismic, the shallower faults and anomalies in acoustic sub-bottom profiles, and geomorphic features at the seabed. Pockmarks and other seafloor features do not appear to be directly structurally linked to deep faults.
Immediately beneath the banks and ridges, the shallow seismic reflectors within the acoustic sub-bottom profiles are characterised by a potential pull-up effect (AA3b), while the deeper units within the shallow sub-surface are often obscured by acoustic masking (AA4b). Masking may be due to the presence of lithified near-surface carbonate sediments, and/or gas. Indeed, masking is generally stronger in the acoustic sub-bottom profiles directly beneath banks and ridges than that observed in other areas of the seafloor. Determining the depth to which cemented carbonate extends is difficult because of acoustic masking, however, in Flat Top 1 (Figure 5.1), carbonate extends to ~46 m below the seafloor (Australian Aquitaine Petroleum Pty Ltd, 1970) or approximately 45 ms TWT below the seabed (based on an average acoustic velocity of 1950 ms-1). There is no discrete reflector in the sub-bottom profiles at this depth indicating a transition from the carbonate (coquina) identified by Australian Aquitaine petroleum Pty Ltd (1970) to the underlying unit. Thus it was not possible to definitively identify strata noted in the well completion report within the acoustic sub-bottom data collected on GA0335.
5.6.1 Terraced northeast of Flat Top 1 well
Unlike most of Area 2 the predominately flat, but locally rugose terrace, northeast of the central bank is underlain by a thick (50 ms TWT) differentiable sequence of interbedded high and low amplitude reflectors (AU1 and AU2; Figure 5.18). Faults (AA1) with a maximum displacement of 7 ms TWT and a vertical zone of brightening (AA4a) are present along the edge of the bank. Seismic profiles across Area 2 indicate a number of faults are present which trend orthogonal to the seismic sections and typically do not rise to the seabed. However, a large fault rising from 0.8 s TWT below Area 2 aligns well with the zone of bright reflectors visible in GA0335/048 (Figure 5.18). The co-location of the central bank above this fault may suggest a connection from depth to the seafloor to the margin of this bank. However, it is not possible from the sub-bottom profile data to conclude that this particular fault is directly related to bank formation. Vertical exaggeration of these acoustic sub-bottom profiles makes faults appear near-vertical. However when vertical exaggeration is accounted for these faults typically have dips of ~20–30°, significantly shallower than the near-vertical, deeper, basin-scale faulting evident in co-located seismic profiles (e.g. seismic line BG91-08, Figure 5.18b). Whether the shallow faults are splays connected to deeper faults is unknown.
Seabed environments, shallow sub-surface geology and connectivity, Petrel Sub-basin 91

Figure 5.18. a) Acoustic sub-bottom profile GA0335/048 showing the interpreted faulting (AA1) and stratified shallow sub-surface immediately northeast of Flat Top 1 well. b) Seismic line BG-91/08 with faulting indicated directly beneath the location of GA0335/048. Location of lines shown on Figure 5.13.
92 Seabed environments, shallow sub-surface geology and connectivity, Petrel Sub-basin
5.6.2 Ridges
There are several prominent ridges in Area 2 including those on the southern margin of Flat Top Bank, smaller ridges on the margins of the other banks and on the seabed to the west of the central bank (Figure 5.13).
5.6.2.1 Narrow ridges on the southern margin to Flat Top Bank
The shallow sub-surface of the steep-sided, narrow ridges found on the southern margin of Flat Top Bank are characterised by acoustic masking (AU6; Figure 5.19). Evidence of a pre-existing surface, particularly on the eastern side of the easternmost ridge is visible in Figure 5.19. Prominent faults (AA1) are present at depths of 0.2–1.0 ms TWT beneath the Flat Top Bank. It is noted that though that not all faults underlie a ridge and none appear to directly reach the seabed.
Beneath the prominent northwest–southeast-trending ridge located in the east of Area 2, faults (AA1) are traceable in the seismic section up to ~125 ms TWT. This suggests that the eastern ridge may be linked to faults at depth. However significant masking in the immediate sub-surface of the ridge (Figure 5.20) makes a it impossible to identify if linkages between the ridge and deeper faulting exist.
Seabed environments, shallow sub-surface geology and connectivity, Petrel Sub-basin 93

Figure 5.19. a) Sub-bottom profile GA0335/050 showing the southwestern end of ridges at the edge of the Flat Top Bank. b) Section of seismic profile GA0336/210 that intersects the southwestern end of a narrow ridge on the Flat Top Bank. Location of lines are illustrated on Figure 5.13.
94 Seabed environments, shallow sub-surface geology and connectivity, Petrel Sub-basin

Figure 5.20. Sub-bottom profile GA0335/045 showing extensive masking (AU6). Location of line shown on Figure 5.13.
5.6.2.2 Ridges on plains
Approximately east-west aligning ridges are present in the west of Area 2. Because the acoustic sub-bottom profiles trend parallel to these ridges establishing relationships between the ridges and faulting is difficult. The sub-surface is characterised by relatively flat to slightly kinked, high and low amplitude reflectors (AU1 and AU2). One fault displaced by ~8 ms TWT, downthrown to the west and at 100–170 ms TWT is visible in sub-bottom profile GA0335/047 (Figure 5.21a). In the seismic profile GA0336/110 (Figure 5.21b) three major faults extend from approximately 70 ms TWT to 370 ms TWT depth with one underlying the fault identified in GA0335/047. A potential pull-down anomaly (AA3a) is also observed on profile GA0335/047 near the fault suggesting vertical and lateral fluid migration originating from the fault (Figure 5.21a). Although no direct evidence for faulting at the seabed is observed in the bathymetry this area of Area 2 has a strong spatial correlation between faults and ridges. However the fault appears to propagate at least partially orthogonal to the strike of the ridges.
Seabed environments, shallow sub-surface geology and connectivity, Petrel Sub-basin 95

Figure 5.21. a) Sub-bottom profile GA0335/047 showing a fault (AA1) and potential pull-down (AA3a). b) Seismic profile GA0336/110 showing faults and their relationship to ridges at the seabed. The strike of ridges is parallel to the acoustic sub-bottom and seismic lines. Location of lines shown on Figure 5.13.
96 Seabed environments, shallow sub-surface geology and connectivity, Petrel Sub-basin

5.6.3 Hummocky channelised areas and pockmarks on plains
The plains in the central part of Area 2 have a complex seabed morphology, and are characterised by hummocks, channels, pockmarks and pockmark clusters (Figure 5.22). At the scale observable on the acoustic sub-bottom profiles it is not possible to differentiate individual hummocks at the seabed. Where pockmarks and pockmark clusters have been identified in the bathymetry the acoustic sub-bottom profile response appears similar to the seabed without these features. There are no obvious fluid flow indicators or prominent acoustic anomalies (i.e. faults) present in the immediate sub-surface underlying the pockmarks and pockmark clusters. The subsurface is characterised by either high or low amplitude reflectors, or acoustic masking (AU1, AU2, or AA4b) with masking weaker than that present under banks and ridges. As indicated earlier, many faults are visible in the seismic profiles but their relationship to the seabed is not clear in the sub-bottom profiles. Thus, pockmark formation is likely to be driven by less visible fluid transport processes, including the up-dip migration of fluids and gases.
5.6.4 Pockmarks associated with banks and ridges
The strata underlying banks and ridges with pockmark clusters are generally obscured by acoustic masking (AU6; Figure 5.23). However, seismic profile GA0336/112 and sub-bottom profiles GA0335/043 and GA0334/044 show reflectors that appear faulted beneath pockmarks on the plains adjacent to the banks and ridges. In sub-bottom profile GA0335/043 a vertical zone of brightening (AA4a), potentially indicating fluid flow, occurs on the margin of a ridge near pockmarks (Figure 5.23a). If fluid flow was related to pockmarks this could imply lateral migration of fluid in the near-surface to the seabed as fluid moves to the location of the pockmarks. Therefore there is potential evidence for structural linkage between the seabed and the shallow sub-surface and for fluid flow though it is not possible to identify links with deeper structures.
5.6.5 Debris accumulations
On the western margin of the southern bank the plains have a higher rugosity than at other locations which could indicate debris accumulations. Acoustic sub-bottom profile GA0335/043 reveals that this areas is underlain by AU1 and AU2 as seen in other areas (Figure 5.23). The edge of the bank appears faulted but this may also be a result of the onlap of sediments. The junction between the bank and plain may be a zone of weakness and therefore a zone suited to fluid migration. Localised areas of reflector brightening (AA4a) occur adjacent to this potential zone. The formation of debris deposits could therefore be linked with weakness at the bank’s margin and possibly associated with fluid migration. However no direct evidence for a linkage with deeper structures and processes was observed.
Seabed environments, shallow sub-surface geology and connectivity, Petrel Sub-basin 97

Figure 5.22. a) Section of acoustic sub-bottom line GA0335/043 which is moderately masked at the centre, with slight diminishing out of the reflector signals above and below the masking by acoustic turbidity. b) Enlargement of the sub-bottom profile shown in a). Location of line shown on Figure 5.13.
98 Seabed environments, shallow sub-surface geology and connectivity, Petrel Sub-basin

Figure 5.23. a)Section of acoustic sub-bottom line GA0335/043 with some disturbance of the seabed reflector in an area of seabed with pockmarks. b) A section of corresponding seismic line GA0336/112. While there are numerous faults on the seismic image (0.25–0.50 s TWT), most do not reach the base of the acoustic sub-bottom profiles, and none reach the seabed. Note that the shallowness of pockmarks means they are not visible on the acoustic sub-bottom profiles. Location of lines shown on Figure 5.13.
Seabed environments, shallow sub-surface geology and connectivity, Petrel Sub-basin 99

6 Interpretation and discussion
6.1 Evolution of seabed environment: Area 1
6.1.1 Overview
The preservation of geomorphic features such as palaeochannels and coastal ridges together with sediments representative of a marginal marine to coastal setting on the seabed of Area 1 (Figure 4.2) indicates that the present seabed habitats have formed on relict landscapes. These landscapes became submerged during the marine transgression that followed the LGM (19‒22 ca kal BP; Yokoyama et al., 2001a, b; Yokoyama et al., 2000a, b). The geomorphic features discernible, together with the interpretation of seabed samples and data suggest a drowned coastal plain system within Area 1 that has been little modified by post-transgression sedimentation (Figure 6.1). The fauna identified from Area 1 are similar to those identified in earlier studies of the Eastern Bonaparte Gulf (Heap et al., 2010; Anderson et al., 2011; Przeslawski et al., 2011).The habitats here are formed on relict features that have been colonised following the post-glacial transgression.
6.1.2 Palaeoenvironment
The preservation of large numbers of mollusc shells, particularly Spisula cf. trigonella, and Anadara granosa indicate brackish to marine, intertidal to estuarine conditions within the palaeochannels of Area 1 at the time of their deposition. The occurrence of taraxerol in the immediate sub-surface of palaeochannel sediments indicates the presence of mangroves prior to the development of the present silty-sand veneer on the seabed. The mangroves and other plant matter contributed to the high organic matter content of the near-surface sediments, and within the seabed sediment veneer in places (Figure 4.8, Figure 6.1).
100 Seabed environments, shallow sub-surface geology and connectivity, Petrel Sub-basin

Figure 6.1. Conceptual model of Area 1, Petrel Sub-basin. The lowermost strata observed in the acoustic sub-bottom profiles, presented at depths of 80–90 m here, are likely of Pliocene to Pleistocene age. The depicted locations of buried surfaces and possible fluid migration are largely based on observations of acoustic anomalies in the sub-bottom profiles. Vertical exaggeration = 8x.
The truncation of low-lying ridges on the seabed by palaeochannels in the western and northern parts of Area 1 suggests the presence of multiple generations of geomorphological features at the seabed. In towed video, the surfaces of some ridges were observed to be cemented or lithified to some extent, with estuarine mollusc remains such as Anadara and Turitella spp. present within those strata. Together, the geomorphic characteristics and the molluscan fauna suggest lithified coastal ridges, similar to those documented at the upper beach face, Karumba, Gulf of Carpentaria (Nicholas, 2012). The occurrence of relict estuarine fauna and beach ridges at the present-day seabed, and minimal modern marine muddy sediment, is further evidence of the very low sedimentation rates in Area 1. Furthermore, sedimentology data from shallow vibrocores indicate that mottled silty clays and organic-rich silts of likely estuarine and coastal plain origin are veneered thinly by recent sand deposits, with no evidence for present-day sedimentation. The seabed environments of Area 1 appear to be sediment starved and relict, and their current form is likely to be the cumulative result of several episodes of sub-aerial exposure and marine deposition, over multiple cycles of eustatic change.
The seabed in Area 1 is directly underlain by marine and marginal marine sediments up to 2 m thick deposited during Marine Isotope Stages (MIS) 3, 2 and 1 (core GC-09, Yokoyama et al., 2001a; this study). The best chronological evidence for this from the current study is from vibrocore 13VC09 at station 13, where mangrove-rich sediments (at 0.14–1.7 m) dated to between 16.1 and 15.5 cal ka BP
Seabed environments, shallow sub-surface geology and connectivity, Petrel Sub-basin 101

(MIS 2), and are overlain by shallow marine to marginal marine sediments dated to 14 cal ka BP (MIS 2; Table 4.5). Radiocarbon ages from GC-09 range between 40 and 49 ka BP (MIS 3; Yokoyama et al., 2001a). Thus the development of an estuarine environment at this location suggests a period of stationary or slowly changing sea levels after the LGM (~22-19 ka BP) lowstand, prior to the post-glacial transgression at this location (Figure 6.2; Clark et al., 1996; Yokoyama et al., 2001a; Deschamps et al., 2012; Lewis et al., 2013).
At the time of palaeochannel formation, Area 1 may have been similar to the present-day Daly River, Northern Territory, where it enters the sea at Anson Bay (Figure 1.1). Potentially the closest modern-day analogue, the Daly River coastal plain features a prominent recurved chenier plain, juxtaposed with mangrove-fringed shorelines and estuarine channels (Chappell, 1993). The findings of the current study suggest that similar mangrove-rich environments existed over 100 km offshore from the modern shoreline when the sea level was 90–110 m lower than present.
The sub-surface geology in Area 1 is characterised by stacked sedimentary successions whose upper and lower boundaries are commonly marked by prominent, laterally continuous reflectors. Of these, the reflector H1 is particularly prominent. This reflector dips gently to the northwest (Figure 6.3) at 0.07°, an angle steeper than the present seabed which dips at 0.03° to the west. Channel cut and fill is observed at multiple stratigraphic levels in the sub-surface geology in Area 1. Seismic velocities indicate that the shallow sub-surface stratigraphic units (to ~100 m below the seabed), are to some extent unlithified.
It is likely that the stratigraphic successions overlying reflector H1 represent successive lowstand 4th 5th and 6th order sequences. Channel incision suggests reflector H1 represents a period of sub-aerial exposure, weathering and fluvial incision accompanying the lowstand, when the palaeoshoreline would have been located to the west of Area 1. At this location, incision by sub-marine channels seems unlikely, but cannot definitively be ruled out. As Area 1 is relatively close to the lowstand shoreline, and the substrate gradient is very low, the period of sub-aerial exposure is likely to have been short-lived. Thus, it is likely that incision only occurred when sea level was at or near recent minima values (90–125 m below modern sea level), and the seabed exposed (mean depth 88 m below present sea-level). Based on the calculated seismic velocities (Figure 5.3) H1 is approximately 65 m below the seabed or 153 m below modern sealevel. Global LGM sea levels range between 120 m and 135 m (Murray-Wallace and Woodroofe, 2014) and similar low stand values have been indicated for previous glacials since the mid Quaternary (Lisiecki and Raymo, 2007). As the H1 reflector, which indicates the last period of sub-aerial exposure, is found ≥20 m below the level of recent past low sea levels, this suggests subsidence has occurred recently within the Petrel Sub-basin. This subsidence may be related to sediment compaction and de-watering processes, in addition to tectonic reorginazation. Colwell and Kennard suggested 100‒200 m of tectonic subsidence for the Petrel Sub-basin during the Tertiary (66‒2.6 Ma; Colwell and Kennard, 1996). This may suggest that while the majority of subsidence occurred before the strata forming H1 were deposited, subsidence is continuing – however, this requires further research to elucidate this matter.
102 Seabed environments, shallow sub-surface geology and connectivity, Petrel Sub-basin

Figure 6.2 Radiocarbon ages on core and grab samples from the Joseph Bonaparte Gulf (Table 4.5), overlaid on the sea-level envelope for Australia (adapted from Lewis et al., 2013). Coloured symbols this study; greyscale symbols from Yokoyama et al., (2001a).
Seabed environments, shallow sub-surface geology and connectivity, Petrel Sub-basin 103

Figure 6.3. Structural surface of reflector H1 showing depth in metres beneath a) the seabed and b) sea level in Area 1. Two-way travel time has been converted to depth using an acoustic velocity of 1500 ms-1. c) Plot of depth of the seafloor (1.) and the depth of reflector H1 (2.) from south to north across Area 1.
104 Seabed environments, shallow sub-surface geology and connectivity, Petrel Sub-basin

6.2 Evolution of seabed environments: Area 2
6.2.1 Overview
Seabed environments and geomorphic features in Area 2 occur at shallower depths (28‒89 m), and have significantly greater relief than in Area 1 (Figure 6.4).
Banks and ridges in Area 2 have a complex history. As with Area 1, this includes oscillations in eustatic sea-level. The mixed patches of octocorals and sponges (Figure 4.29) are similar to assemblages observed previously from the Eastern Bonaparte Gulf (Przeslawski et al., 2011). The geomorphology is dominated by relict features that have been sub-aerially exposed and re-colonised many times by marine organisms during the Quaternary. Flat Top 1 well data indicates that the core of the central bank consists of Cretaceous strata capped by a thin Miocene or younger sedimentary succession (Figure 5.1). Basin bounding faults are present in this general area.
Hummocks similar to those of Area 2 have been recorded on the coast of Holland, facing the North Sea (Passchier and Kleinhans, 2005) and in the Gulf of Carpentaria adjacent to shallow reefs (Heap et al., 2006). The hummocks identified in the Dutch coastal area had wavelengths of 20‒40 m, and heights of 0.15‒0.25 m; these values are similar to those of hummocks from Area 2. Hummocks on the Dutch coast occurred within the shoreface area, in water depths of 12‒18 m (Passchier and Kleinhans, 2005). Seabed sediment and bathymetry data from that study indicated that hummocks of this scale were storm-generated. Based on wave data collected during their survey, with data collected before, during and after a large seasonal storm, Passchier and Kleinhans (2005) calculated that such hummocks are generated when current velocities are between 0.6 and 0.7 ms-1, and have described the hummocks as ‘combined flow megaripples’ generated by the combined interaction of waves and currents during storm events. Based on the work of Passchier and Kleinhans (2005), it appears likely that the hummocks in Area 2 are storm generated bedforms, though there may be other, unknown processes involved.
6.2.2 Palaeoenvironment
There is limited information on the shallow sub-surface of Area 2, and determining the timing of faulting is difficult because precise ages for the shallow sub-surface strata have not been determined. Flat Top 1 offers some age control for the central bank. Hard calcareous cemented coquina were observed between 0 and 47 m, and is underlain by 87 m of fine to very fine, pyritic sand interbedded with clay (Australian Aquitaine Petroleum Pty Ltd., 1970). These strata overlie Wangarlu Formation of the Cretaceous Bathurst Island Group which, based on regional seismic data, lies 100 m below the seabed on the central bank (Consoli et al., 2014), and 180 m in Flat Top 1 (Australian Aquitaine Petroleum Pty Ltd., 1970). The seismic velocities calculated for the acoustic sub-bottom profiles (mean values; Jones, 2014) suggest the water bottom multiple is approximately 106 m below the seabed.
Seabed environments, shallow sub-surface geology and connectivity, Petrel Sub-basin 105

Figure 6.4. Conceptual model of Area 2, Joseph Bonaparte Gulf, showing seabed and shallow geology. Vertical exaggeration = 8x.
Onshore, similar coquina deposits are present in Fog Bay. These consist of consolidated coquina beach sand deposits, raised above mean sealevel, of Quaternary age (Hughes and Senior, 1973; Hughes, 1978). As in the Flat Top 1 and Petrel 1 wells, these uppermost Cenozoic strata unconformably overlie the Cretaceous Bathurst Island Group regional seal, the latter represented in Flat Top 1 well by the Wangarlu Formation (Consoli et al., 2014). That is, there is an unconformity and substantial time gap between the underlying Bathurst Island Group and the overlying Quaternary strata.
Thus the banks and potentially the large ridge in Area 2 have a core of Mesozoic strata, are onlapped by younger sedimentary strata, and are likely to have only a thin Quaternary cover. These banks in particular will have been exposed to sub-aerial conditions for a greater length of time than the seabed in Area 1, and are therefore potentially weathered to a greater extent. Weathering products including calcrete several metres thick are more likely to be developed in this setting, and contribute to poor signal return in the acoustic sub-bottom profile data. Where faults are present at or near the seabed, it is most likely that faulting is post Cretaceous, and of probable Quaternary age in Area 2.
106 Seabed environments, shallow sub-surface geology and connectivity, Petrel Sub-basin

6.3 Seabed evidence for fluid migration processes The morphology of shallow seabed depressions in the study area appears consistent with pockmark craters formed through sudden fluid expulsion in unlithified sediments (Moss et al., 2012; Hasiotis et al., 1996; Judd and Hovland, 2007; Hovland et al., 2010). Though shallow, their maximum slopes are similar to shallow pockmarks in the Nyegga pockmark field and those on the Turkish eastern Black Sea (Hjelstuen et al., 2010; Çifçi et al., 2003).
The classification of pockmarks has the potential to provide information on their mode of formation and relationship to fluids present beneath the seabed. Pockmarks have previously been classified based on size, morphology and adjacency (Hovland et al., 2002; Judd and Hovland, 2007). Unit pockmarks (1–10 m wide, <0.6 m deep), larger standard (normal) pockmarks (10–700 m wide, 1–45 m deep) and composite pockmarks were recognized, with composite pockmarks formed by the merging of individual pockmarks (Hovland et al., 2002; Judd and Hovland, 2007). Based on size, individual shallow depressions in Area 1 are similar to the unit pockmarks of Hovland et al. (2002) and Judd and Hovland (2007) except they are wider with widths of 20–30 m. Composite pockmarks identified here are similar to the composite pockmarks of Judd and Hovland (2007), except that they consist of small unit pockmarks rather than the larger standard pockmarks. In the Joseph Bonaparte Gulf, unit pockmarks are commonly partially merged, exhibiting a cross-cutting relationship at the location of each composite pockmark suggesting repeated expulsion of fluids. The size of larger depressions in palaeochannels in Area 1 suggests that these may be standard pockmarks (Hovland et al., 2002). However, many are not significantly deeper than the unit pockmarks on the plains, and are viewed here as being genetically similar to those on plains, rather than a distinct type formed through a separate process.
Most pockmarks are located adjacent to palaeochannels and proximal to drowned coastal ridges. These morphologies occur in areas of seabed which are interpreted to be directly underlain by organic-rich deposits of estuarine origin. Seabed gradients in Area 1 are low (<1°) hence the backscatter intensity values vary predominantly in response to lithological properties (e.g. composite roughness) rather than to slope (Goff et al., 2005; Jackson et al., 1986). Because roughness is directly related to grain size and texture, the observed backscatter response (Figure 4.6) may indicate that pockmarks, particularly those on plains, have comparatively coarser sediment at their centres. These characteristics suggest a winnowing process following expulsion of material and the formation of craters (c.f. Hovland et al., 2002). They may also suggest the presence of carbonate forming at the centre of pockmarks, but no samples of such material was recovered. Furthermore the high CO2 content in vibrocore samples may suggest the breakdown of CaCO3 in the shallow sub-surface, in addition to the respiration of organic matter (Hellings et al., 2000). In addition, the low CO2 content in the Petrel field gas (~5%), the absence of CH4, and the strongly depleted δ13C values of CO2 from the shallow cores recovered in Area 1 compared to typical δ13C values in CO2 derived from hydrocarbon fields (e.g. δ13CCO2= 8‰ at Petrel 7: Chen et al., 2014; see also Hoşgörmez, et al., 2014; Prinzhofer and Huc, 1995) indicates that the CO2 in headspace gas from Area 1 is unrelated to the Petrel gas field.
It has been suggested that bedload-derived sediment is particularly important for infilling pockmarks (Pau and Hammer, 2013). Thus the sediment starved setting, with minimal bedload transport observed may at least partially explain the open morphology of pockmarks in the Joseph Bonaparte Gulf, as pockmarks may remain unfilled for prolonged periods post-expulsion. This implies that the pockmarks are not necessarily continually or regularly expelling fluid. The observation that particularly shallow pockmarks exist in areas with relatively thin deposits of surface sediment is consistent with other studies, where deeper pockmarks have been found to only form in thick unconsolidated sediment, and shallow pockmarks are located in areas of thinner unconsolidated sediment cover (Brothers et al., 2012; Moss et al., 2012; Judd and Hovland, 2007).
Seabed environments, shallow sub-surface geology and connectivity, Petrel Sub-basin 107

6.3.1 Geochemical evidence for fluid seepage and sedimentary processes at the seabed
The sedimentological and geochemical results provide further insights into the controls on the formation of pockmarks and the evolution of the seabed, particularly in Area 1. Because of the geomorphological (Figure 6.5), textural and chemical similarities between Area 1 and Area D, and as Area D was previously noted to be a location of pockmarks and shallow sub-surface gas, it was deemed necessary to find out whether sediment in Area 1 was related to modern or ancient environments and processes (Figure 6.6) in this study (Heap et al., 2010; Przeslawski et al., 2011). By doing so, the aim was to determine if evidence for leakage from the hydrocarbon sources within the Petrel Sub-basin exist.
The presence of pockmarks on the seabed would suggest that fluid is, or had been, ejected from the sub-surface. Additionally, there was a general propensity for higher SiO2 and lower CaCO3 in the sediment samples from seabed with pockmarks in both Area 1 and Area D (Table 4.6). The sediment type, texture, inorganic chemical composition and REE abundances in Area 1 are very similar to that of Area D sampled during the previous marine surveys SOL4934 and SOL5117 (Heap et al., 2010; Anderson et al., 2011; Przeslawski et al., 2011). In Area D, there were no differences between pockmarked and non-pockmarked seabed REE abundances. However, sediments from pockmarked seabed had higher Zr, Hf, Si, Ge concentrations and sand content, and lower gravel and carbonate content, and Ca, Mg, Sr and P concentrations, than non-pockmarked seabed (Table 4.6). Seabed sediments from Area 1 had REE patterns which were relatively flat (Figure 4.11), and are compositionally similar to seabed sediment from Area D and to bulk sediment (<2 mm fraction) from the nearby Daly River catchment. Sediment samples from Area A of the SOL4934 and SOL5117 surveys also had generally similar REE patterns, although the overall abundances of REE were lower. Moreover, sediment from pockmarked seabed in Area A had statistically higher REE concentrations than sediment from non-pockmarked seabed.
Table 6.1. Summary of geochemical characteristics of pockmarked and non-pockmarked Joseph Bonaparte Gulf sediments from Area 1 this study, and Area A and Area D (Anderson et al., 2011; Heap et al., 2010).
Area Non-pockmarked sediments Pockmarked sediments Both Compared to other areas
Area 1 lower SiO2 and higher CaCO3
higher SiO2 and lower CaCO3
REE’s same in pockmarked vs. non-pockmarked
same REE’s as Area D, and as Daly River sediments
Area D • higher Si • lower CaCO3, Ca, Mg,
Sr, and P • lower gravel and
carbonate sediment content
• higher Zr, Hf, Ge, and Si
• lower CaCO3 • higher sand content
REE’s same in pockmarked vs. non-pockmarked
Same REE’s as Area 1, and as Daly River sediments
Area A lower REE’s higher REE’s Overall abundance of REE’s lower than Area 1 and Area D, but same REE pattern
108 Seabed environments, shallow sub-surface geology and connectivity, Petrel Sub-basin
These results indicate that in Area A, fluids forming the pockmarks may have been sourced from REE-rich sediments in the shallow sub-surface and could be either physically bringing high-REE particles to the surface or, precipitating high-REE secondary minerals at the seabed. Alternatively, it may be that a winnowing process which occurs during expulsion is concentrating heavier minerals with higher REEs in the pockmarks or a lower REE surface cover is being eroded by the fluid expulsion event, exposing higher REE sediments below. Lower REE-bearing sediments overall as seen in Area A may indicate a change in sediment source mixing, where contributions from other low-REE sediment sources dilute the relatively higher REE Daly River sourced sediments in the top layer of sediments, which are underlain by the ‘purer’ Daly River sediments. Alternatively, if REE’s in the Daly River sediments are concentrated in grains which are relatively less mobile hydrodynamically, or have low preservation potential and so degrade over short distances, the most distal area, Area A may have failed to receive as many of the REE-bearing grains, and so have lower REE’s overall. In Area 1 and Area D the relatively depleted CaCO3, Ca, Mg, Sr, and P values in pockmarked sediments suggests dissolution or physical removal of granular carbonate sediments during expulsion; the relatively elevated SiO2 values suggests physical winnowing during expulsion preferentially concentrating more durable silica based grains in the pockmarks. The higher metal content may be either linked to expelled fluid composition and subsequent precipitation of secondary minerals at the seabed, or like silica, linked to physical winnowing processes.
The anomalous silver concentration recorded in sediment from station 07 of Area 1 is of interest, as similar anomalies were also observed in the offshore northern Perth Basin, southwestern Australia, at sites of likely hydrocarbon seepage (Radke, personal comment). Silver is delivered to marine sediments as part of the organic particle flux and is a constituent of marine shales (McKay and Pederson, 2008). While silver concentrations higher than lithogenic values originating from biogenic sources have been reported in shallow marine sediments (e.g. 1.5 ppm; McKay and Pederson, 2008), the concentrations in 133 samples from the previous surveys SOL4934 and SOL5117 in the eastern Bonaparte Basin were(with one exception) below the analytical limit of detection (0.6 ppm). Moreover, silver was not correlated with barium in this dataset as would be expected if the observed silver concentration was the result of organic particle flux (McKay and Pedersen, 2008). Differences in chloroplastic equivalent concentrations between the sediments from Area 1 (7.2 ± 2.6 ppb) and sediments of the eastern Bonaparte Basin (5.8 ± 3.8 ppb) were not statistically significant. Therefore a recent biogenic source for the elevated silver is unlikely. Although igneous activity is not evident in the Petrel Sub-basin, and although lead and zinc are not elevated in the sample, hydrothermal or epithermal activity as a source or transport mechanism for the silver may be a possibility. This is because a radiolarian-rich, 52 m thick marine shale, the Darwin Formation, is present at depth within the Bathurst Island Group, identified in the Flat Top 1 well and potentially also located beneath the seabed ridge in Area 1 (Mory, 1991). This may be a possible source of the anomalous silver. While a fault visible in seismic data below 0.24 s TWT extends through the Bathurst Island Group up toward the seabed under the low-lying ridges in Area 1 (Figure 5.10) and so could provide a conduit for silver-bearing fluids to bring Darwin Formation sourced silver sourced to the surface, this fault does not appear to penetrate the top 100 m or so of strata. However, other faults are present in the immediate vicinity near the seabed (Section 5.6).
Seabed environments, shallow sub-surface geology and connectivity, Petrel Sub-basin 109

Figure 6.5. Spatial correlation of seabed geomorphic features and observations from sub-bottom profiles in Area D of the previous GA surveys SOL4934 and 5117, located to the northeast of Area 1 in the current study. In Area 1 gas is noted to occur in sediments beneath palaeochannels on the seabed, and pockmarks are concentrated within, and adjacent to, palaeochannels.
110 Seabed environments, shallow sub-surface geology and connectivity, Petrel Sub-basin
Methane-Derived Authigenic Carbonates (MDAC, e.g. nodules, pavements and cements) commonly form in methane seep environments by the anaerobic oxidation of methane (Paull and Ussler, 2008; Judd and Hovland, 2007). The comparatively low percentage of CaCO3 in sediment samples from pockmarked seabed in Area 1, despite towed-video evidence that carbonate clasts are present in some localities, appears lower than that of MDAC which would typically present with CaCO3 values in the range of 48‒100% (aragonite and dolomite, mean of 60 ± 33%; Magalhães et al., 2012). No carbonate pavement was observed, and the low CaCO3 values may suggest that either methane is not venting to the seabed or that the seabed is aerobic in these areas. Indeed, the aerobic oxidation of methane produces H+ ions which promote CaCO3 dissolution rather than production (Paull and Ussler, 2008), which may explain the low CaCO3 values observed.
The paired oxygen and carbon isotope values obtained from the granule to pebble sized sediment samples analysed are intermediate between freshwater and marine carbon and oxygen isotope values from elsewhere (Keith and Weber, 1964). The observed values may indicate a lacustrine palaeoenvironment of deposition. This is a reasonable interpretation in the Joseph Bonaparte Gulf, as during the LGM the central basin became partially, and potentially totally isolated from the global ocean. The observed carbon isotope δ13C range of -3.58 to +2.13 indicates that the source of carbon in these granules is dominantly marine. The more negative δ13C values suggest that carbon sourced from sub-aerial and lacustrine or meteoric settings is also present. These values also indicate that thermogenic hydrocarbons are not involved in the formation of these samples. While all of the samples from Area 1 have positive δ13C values, consistent with a marine source for the carbonate, samples from the previous surveys plot across the positive and negative δ13C axis, suggesting a more complex history, likely tied to variations in sea-level and sub-aerial exposure during lowstands. Variations in δ13C and δ18O values are probably due to differences in temperature, water salinity, and isotopic exchange between carbonate sediments and sedimentary rock, and meteoric waters.
Southwest of the Bonaparte Basin, Jones et al. (2009) noted that carbonate concretions associated with pockmarks in sandwaves were derived from the recycling of seawater across the sediment-water interface as isotope values, carbonate composition and petrographic analyses discounted methanogenic or meteoric water influences. Brown pellet samples from station 04A in Area D were enriched in As, Fe, Mn, V, Cr, Pb, Mo and REE’s (Figure 4.11, Table 4.6) compared to seabed sediment from other parts of Area D. Moreover, the 0.03 Mg/Ca ratio and 0.002 Sr/Ca ratios of the pellets were considerably lower than those of other marine carbonate sediments in the eastern Bonaparte Basin which have values of 0.062 for Mg/Ca and 0.008 for Sr/Ca (Radke et al., 2014). The geochemical evidence suggests the potential importance of meteoric water in the formation of brown pellets as many of the sampled locations would have been sub-aerially exposed during glacial lowstands. The interaction of meteoric water with carbonates during glacial lowstands could also explain the dissolution cavities observed in drill core. Van Andel and Veevers (1967) noted a close similarity between the pellets and kunkar soil concretions, and postulated that the pellets formed during sub-aerial exposure of the shelf.
No dissolved CO2, salinity or dissolved inorganic carbon anomalies were detected in porewater from surface sediment or shallow vibrocore sediment samples from Area 1 (Figure 6.6). Salinity levels varied within a narrow range (35.4 ± 0.2‰), and are indicative of seawater. However, during the surveys SOL4934 and SOL5117 anomalously high dissolved CO2 was observed in samples from pockmarked seabed in Area D (station 56A; Figure 6.6). The relationship between CO2 concentration and porosity illustrated in Figure 6.6 highlights the effect of restricted porewater exchange on dissolved CO2 possibly derived from organic matter breakdown in near-surface sediments. One plausible explanation for the lower CaCO3 content of seabed sediments from pockmarked areas in Area 1 is the dissolution of CaCO3 in shallow sub-surface sediments by CO2-charged porewater arising from the non-methanogenic decomposition of organic matter. The CaCO3-depleted sub-surface sediment would then be delivered to the seabed during expulsion events such as pockmark formation.
Seabed environments, shallow sub-surface geology and connectivity, Petrel Sub-basin 111

Figure 6.6. The relationship between porewater TCO2 and porosity in seabed sediments from grab samples (0 cm to 2 cm depth) from Area 1 of the Petrel Sub-basin and the eastern Bonaparte Gulf. There is a clear trend of increasing porosity with increasing TCO2 present. Station 56A (Area D; green dot) had an anomalously high dissolved CO2 concentration and is associated with a pockmark. Station 56B (Area A: yellow dot) had an anomalously low salinity (24 PSU) and dissolved CO2 concentration. The fresher porewater at this site was attributed to seepage from an unknown source (Przeslawski et al., 2011).
6.3.2 Potential fluid migration pathways to seabed
The integrated analyses of multibeam sonar, sub-bottom profile and reflection seismic data indicate that faulting within the Petrel Sub-basin has not caused displacement at the seabed within Area 1, but may have affected Area 2 (Figure 5.1). Deep-seated faults that intersect the Cretaceous Bathurst Island Group regional seal are not directly linked to low-lying ridges at the seabed within Area 1. Normal faults, many of those being polygonal in nature, terminate at ~0.24 s TWT below a laterally continuous reflector marking a regional unconformity in Area 1. It is possible that signal attenuation and acoustic masking, especially below the water bottom multiple in seismic and sub-bottom profile
112 Seabed environments, shallow sub-surface geology and connectivity, Petrel Sub-basin

data may be obscuring linkages between faults at depth and features in the shallow sub-surface and at the seabed. However, the available evidence suggests these links do not exist.
Fluid migration in unconsolidated or partly consolidated sediments may not be restricted to faults or fault zones, as fluid migration can readily occur through unconsolidated sediments (Barnicoat et al., 2009). In some sub-bottom profiles, particularly in sub-bottom line GA0335/06, acoustic pull-down anomalies suggest localised fluid flow upward from deeper sections, but there is no obvious surface expression of fluid expulsion at the seabed. As such, the anomalies may indicate that fluid seepage may have been active in the recent past, but are not active at present. Areas of reflector brightening are generally small and layer-bound, and do not form a continuous pathway to the seabed. However, the expulsion of fluids to the seabed does not necessarily involve vertical pathways, and fluid flow may occur laterally, potentially along dipping structures/strata or along palaeochannels.
The banks and ridges in Area 2 are commonly located over faults at depth. O'Brien et al. (2002) suggest the relationship between carbonate banks and faults strongly suggests fluid seepage as being significant in the formation of banks. In this study it has not been possible to identify such a link, although the observed association between faults and ridges, and between faults and acoustic pull-downs or reflector brightening does suggest up-fault fluid migration.
There is no visible direct connection between pockmarks and major faults below Area 1 or Area 2. However, some clusters of pockmarks appear to be associated with shallow faulting. At the edge of banks and ridges in Area 2, the association of pockmarks with shallow faulting and reflector brightening indicates up-fault or cross-fault fluid migration as a possible cause of pockmark formation. Furthermore, permeability links between deep faults and the seabed may be facilitated by networks of smaller faults, and in soft permeable sediment may occur without any faults. The scale of observation and resolution of sub-bottom profile data, and acoustic masking hinders the positive identification of potential fluid migration pathways at depths greater than 0.01 s TWT.
6.3.3 Origin of gases in the seabed and shallow sub-surface sediments
The high organic matter content of sediments within the palaeochannels of Area 1 suggests that biogenic gas, derived from the breakdown of organic matter, may be an important source of fluid driving the formation of pockmarks in the study area.
Headspace gas analyses indicate that the seabed sediments in Area 1 were dominated by CO2 rather than CH4 gases. Furthermore, the very high Odd over Even Predominance ratio (OEP) indicates that the n-alkanes in the sediments are very immature with values generally in the range of six to eight. Mature hydrocarbons, by contrast, commonly have OEP values around one (Scalan and Smith, 1970; Tissot and Welte, 1984). The high CO2 concentration in the organic-rich sediments and their very light carbon isotopic composition are interpreted to be the product of bacterial consumption of organic matter. Additionally, the high concentrations of taraxerol in the sub-surface sediment indicate the presence of mangrove deposits. In summary, the evidence suggests that mangrove environments developed under estuarine conditions during the last sea-level lowstand within palaeochannels, resulting in the deposition of organic-rich sediments in sheltered environments. The breakdown of organic matter then generated biogenic gas, mostly CO2 with minor methane, within the shallow sub-surface sediments.
Seabed environments, shallow sub-surface geology and connectivity, Petrel Sub-basin 113

6.3.4 Pockmark genesis
Within the study area, pockmarks are the only features that conclusively indicate fluid migration from the sub-surface to the seabed. Pockmarks form when the force of locally buoyant fluids within unconsolidated sedimentary strata abruptly overcome the trapping capillary seal of fine-grained sediment at, or just below the seabed, and these fluids and fluidised sediment are released to the seabed and water column. The formation of a depression at the seabed during this process is a result of the seabed sediments becoming ‘quick’, whereby porewater pressure rises and results in a loss in cohesiveness of the sediment with the effective stress near zero. Fluid from beneath the seabed, and/or currents at the seabed remove the quickened sediment and leave a depression, a process termed self-scouring (Hovland et al., 1987; Hovland et al., 2005; Judd and Hovland, 2007; Cathles et al., 2010; Andrews et al., 2010; Brothers et al., 2011). These depressions are termed pockmarks. Once formed, pockmarks can be maintained by slow porewater and gas seepage, and/or seabed currents (Cathles et al., 2010; Hovland et al., 2010), or through lack of infilling sediments in sediment starved environments.
On the similarly macro-tidal Yampi Shelf the intensity and activity of modern seepage was found to vary in response to tidal processes, with seepage activity noted as being strongest during low ebb tides (Rollet et al., 2006). Although no direct visual evidence of active seepage was noted in the Joseph Bonaparte Gulf, and therefore the relationship of pockmarks to tidal forces remains uncertain, the step-like asymmetry of pockmark morphology on the plains of Area 1 (southeastern pockmark margins higher than the northwestern margins) may be suggestive of slumping following fluid expulsion (cf. Hasiotis et al., 1996). Such a process would occur if a volume of gas-laden fluid, initially trapped under a seal, is released to the seabed; the loss of fluid combined with the mass of overlying water and sediment column potentially re-sealing the near-surface seabed, and not allowing immediate recharge of that near-surface zone. However, most pockmarks in recent sediment appear to have a downcurrent scour (Andrews et al., 2010; Brothers et al., 2011). Thus, the step-like asymmetry of pockmarks in Area 1 is potentially related to tidally-induced scouring processes operating during the expulsion of material. That is, in addition to the low volume of sediment potentially available to infill pockmarks, their open form could also be due to ongoing expulsion of porewater and gas by tidal and current forces (Hovland et al., 2010; Brothers et al., 2011). Many pockmarks in Joseph Bonaparte Gulf may therefore be active, or recently so.
Shallow pockmarks are present in clusters up to 850 m wide on the plains, and also in clusters in channels. The proximity of many unit pockmarks, either as clusters or as part of composite pockmarks suggests that each cluster is sourced from a single feeder source. These sources have not clearly been identified from acoustic sub-bottom data in the immediate shallowest subsurface (<0.01 ms TWT). However, there are apparent gas-charged zones in the shallow subsurface (~0.1 ms TWT depth). These are potential sources of gas to the seabed.
Pockmarks predominantly occur at water depths of 85–95 m in Area 1, and 60–70 and 40–45 m in Area 2. The development of pockmarks within the study areas, therefore, must have occurred after the last glacial maximum because during the last glacial maximum sea levels were below that of the study areas, pockmarks can only form in sediment where there is an overlying waterbody, and the age of the sediment underlying the pockmarks is several thousand years younger than the last glacial maximum which lasted from 23-19 ka BP (Figure 6.2). In Area 1 radiocarbon ages on estuarine and coastal plain sediments underlying pockmarks found in palaeochannels indicates the pockmarks formed sometime after 15.5 cal ka BP, when sea level was approximately 80 m or less below present, and following a rapid sea-level rise during or after Meltwater Pulse 1A (Yokoyama et al., 2001a; Lewis et al., 2013; Deschamps et al., 2012).
114 Seabed environments, shallow sub-surface geology and connectivity, Petrel Sub-basin

It is possible that the permeability of the moderately cohesive, fine-grained and in places organic-rich sediments within and near the palaeochannels is sufficiently low for gas to be trapped temporarily within those source strata. The generally sandy nature of the seabed sediment veneer however, suggests that unless gas is presently being formed and stored in the shallow sub-surface, any ‘old’ gas would be lost to the water column quickly. Venting to the seabed would occur episodically, and potentially frequently, as the shear strength of the hosting sediment and hydrostatic load of the water column exerting downward pressure is exceeded by the increasing interstitial pore pressure caused by gas production. This may be the reason that strong indicators of gas were not generally present in the acoustic sub-bottom profiles. Compactional dewatering of the sediment over time may also contribute to fluid expulsion at the seabed.
Given the evidence for the generation of biogenic CO2-dominated gases, it seems likely that the brightening of reflectors and the acoustic pull-up and masking anomalies observed in sub-bottom profiles are due to the presence of biogenic gas in the shallowest sub-surface sediments. However, brightening may also be due to the presence of calcite-cemented sand, or the presence of peat. The evidence from towed-video does suggest the presence of cemented sedimentary strata in the sub-surface, and the presence of partially decomposed organic matter. As suggested by the strong reflectors in the sub-bottom profiles, gas may be trapped by less permeable, buried, sub-aerial weathering surfaces or zones of carbonate cementation. Mangroves and mangrove swamps occur in intertidal areas, most commonly concentrated along the margins of estuaries. As indicated by the mangrove indicator-rich sediments in vibrocore 13VC09, mangrove derived strata underlie some of the palaeochannels on the seabed. Where sealed by impermeable sediment, a weathering surface, or cemented sediments, the stacked incised channels and their sedimentary fill may provide effective short term reservoirs for biogenic gas in the shallow sub-surface, as well as being potential sources of gas themselves if weathered, indurated and\or fine-grained strata provide a seal. Buried channels will also be a potential conduit for lateral migration of gas-rich fluids because of their permeable nature. However, the generally low dip (<1°) and multiple incision events suggests that in the short term, reservoir processes may dominate over large scale lateral migration, but requires further examination.
Finally, the observed potential linkages between shallow subsurface acoustic anomalies and deeper basinal faults, particularly in Area 2, indicate that the possibility of fluid migration from the deeper strata toward the seabed cannot be discounted. Previously collected Synthetic Aperture Radar (SAR) data indicated hydrocarbon slicks at the sea surface within the Petrel Sub-basin, immediately to the south and east of the study area (Barrett et al., 2004). However, sedimentary and geochemical evidence suggests that there is no active seepage of fluids originating from the deeper strata of the basin within the study areas.
Seabed environments, shallow sub-surface geology and connectivity, Petrel Sub-basin 115

7 Summary
Area 1 of the Petrel Sub-basin is located on a sediment-starved section of shelf formed through the marine inundation of a Quaternary lowstand estuarine/coastal plain system (Figure 6.1). The low-relief shelf is dominated by expansive seabed plains, estuarine palaeochannels, low-lying ridges, and individual and clustered pockmarks. Except for pockmarks, these features are relict and have been little modified by deposition since the post-glacial marine transgression. In contrast, recent pockmark formation began after this area was inundated by rising seas following the last glacial maximum, and pockmark formation is likely ongoing.
Seabed habitats include areas of barren and bioturbated sediments, and mixed patches of sponges and octocorals. Benthic assemblages generally correspond with the seabed geomorphology. In particular, low-lying ridges are associated with relatively high biodiversity, reflecting the substrate stability associated with this seabed feature.
The shallow sub-surface geology of Area 1 is characterised by stacked sequences of gently northwest-dipping to flat-lying, well-stratified sediments, locally incised by palaeochannels. Although shallow faulting was observed, no significant structural linkages with deep faults were identified in the shallow sub-surface sediments. Moreover, no direct linkages between seabed features and deep-seated faults could be discerned.
Area 2 of the Petrel Sub-basin is dominated by three large carbonate banks, smaller ridges and a terrace surrounded by plains (Figure 6.4). Individual and clustered pockmarks occur on the margins of banks, and on and adjacent to ridges. The banks and ridges are located over faults at depth, but no direct structural relationship was observed in the acoustic sub-bottom profiles between these in the seismic imagery.
Brightening of sub-bottom profile reflectors, acoustic pull-up and masking anomalies, and evidence from the vibrocores suggests that some gas may be present within the shallow sub-surface sediments in both Area 1 and Area 2, possibly trapped by indurated weathering surfaces, zones of carbonate cementation or in buried organic matter. The presence of acoustic anomalies suggests that upward fluid migration from faults at depth toward the seabed may have occurred. In Area 2, the co-location of banks and ridges with major faults at depth, despite the lack of direct structural connectivity, may suggest a potential role for up-fault fluid migration in the formation of these seabed features. However, it may simply be that the presence of uplifted fault blocks of indurated sediment provides sufficient habitat for reef formation to occur. Furthermore, sedimentary and geochemical evidence at the seabed indicates no active seepage of thermogenic hydrocarbons derived from the deeper sedimentary succession. Thus there is no definitive evidence for fluid flow from strata beneath the CO2 supercritical boundary within the study areas.
In Area 1, the likely source of fluids driving pockmark formation appears to be biodegradation of mangrove-derived organic matter within Quaternary estuarine sediments in and adjacent to palaeochannels in the shallow sub-surface. The resulting biogenic gas is dominated by CO2. Additional fluids may also have been generated through sediment compaction and dewatering processes.
116 Seabed environments, shallow sub-surface geology and connectivity, Petrel Sub-basin
8 Future work and recommendations
The data presented here enabled a first pass assessment of the seabed, the shallow sub-surface, and the links between deeper strata and the seabed in both areas. There are opportunities to refine our understanding of these areas.
The short vibrocores acquired in this study did not penetrate far enough into the sedimentary strata to enable a correlation between the surficial sedimentary strata and the seismic strata in the sub-bottom profiles. . Coring of the upper 200–300 m of the sedimentary succession would ideally be undertaken to enable this correlation, and to allow investigation of the evolutionary history, and depositional relationship between Area 1 and Area 2.. Obtaining samples from deeper below the seabed would also allow more conclusive analyses on hydrocarbons (e.g. headspace gas) and geochemistry (e.g. to test the origin of the observed silver anomaly in seabed sediments).
Additional suites of analyses could be undertaken on longer cores to further address some of the key science questions. These additional techniques include:
• Fetrographic and fluid inclusion assessment of carbonate samples to analyse formation history and determine if there has been thermogenic degassing in the bank/ridge localities in the past.
• Further petrographic and geochemical analysis of secondary mineralisation in surface sediments and deeper sub-surface samples, and chemistry of the fluid expelled is needed to better understand the origin of fluids expelled from pockmarks, and the nature of the sediment-fluid interaction at the pockmark.
• Biomarker analyses and petrographic analysis of concretions to assess if any methanotropic organisms have been active in the past, would definitively determine if hydrocarbon oxidation has occurred in the vicinity of pockmarks observed in the study areas (similar to Jones et al., 2009 geochemistry/petrography analyses).
The detection of hydrocarbons in water column samples would provide important observations on current seepage. Furthermore, the application of shallow seismic techniques specifically tuned to image carbonate strata would improve our knowledge of the carbonate banks and shoals and underlying carbonate-rich strata in this area.
The analysis of seabed samples and data, particularly using the new high-resolution bathymetry data, has highlighted that while very high resolution bathymetry data provides enhanced understanding of the seabed, additional seabed sampling is needed to understand the habitats and geology at similar resolution to the bathymetry. Thus it is recommended that in any further survey of this area additional seabed samples are acquired, with sample locations targeted using our new understanding of the geomorphological and geological history of the area.
Seabed environments, shallow sub-surface geology and connectivity, Petrel Sub-basin 117

9 Acknowledgements
This study was undertaken as part of the Australian Government’s National Low Emission Coal Initiative (NLECI) administered by the then Department of Industry. The authors wish to thank the Master and crew of the RV Solander and scientific staff at the Australian Institute of Marine Science, especially Marcus Stowar and Dr Andrew Heyward, for their support in conducting survey SOL5463 (GA0335). We also thank GA Field and Engineering Support staff Matthew Carey, Andrew Hislop and Steve Hodgkin and staff at Pearl Marine Engineering Pty Ltd in Darwin for their logistical support. Thanks to Mark Matthews and Dean Forrest (IXSURVEY) for their assistance with multibeam data acquisition during Leg 1 and Ian Atkinson (GA) for his exceptional onshore support with the multibeam system. We thank Dr Richard Willan for mollusc identification, and Dr Chris Glasby for curating specimens at the Museum and Art Gallery, Northern Territory. Many thanks to GA staff Dr Scott Nichol, Dr Alfredo Chirinos, Ray DeGraaf and Rebecca Jeremenko for assistance with survey planning; Dr Diane Jorgensen for assistance with seismic interpretation; Anne Fleming, Michele Spinoccia, Leonie Jones, and Mike Sexton for assistance with multibeam and sub-bottom profiling processing; Christian Thun, Abby Loiterton, Tony Watson, and Ian Long for the provision of and/or assistance with laboratory analyses; and Theo Chiotis, Veronika Galinec, Bianca Reese, and Daniel Rawson for their assistance with graphics. Bridgette Lewis and Dr Scott Nichol provided invaluable advice and comments on this report prior to publication. This record is published with the permission of the Chief Executive Officer of Geoscience Australia.
118 Seabed environments, shallow sub-surface geology and connectivity, Petrel Sub-basin

10 References
Anderson, T.J., Nichol, S., Radke, L., Heap, A.D., Battershill, C., Hughes, M., Siwabessy, P.J., Barrie, V., Alvarez de Glasby, B., Tran, M., Daniell, J. & Shipboard Party, 2011. Seabed environments of the eastern Joseph Bonaparte Gulf, Northern Australia: GA0325/Sol5117 - Post-Survey Report. Geoscience Australia, Record 2011/08, 58 pp
Australian Aquitaine Petroleum Pty Ltd, 1970. Flat Top No. 1, P17 - Northern Territory, Well Completion Report, unpublished.
Andrews, B. D., Brothers, L. L. & Barnhardt, W. A. 2010. Automated feature extraction and spatial organization of seafloor pockmarks, Belfast Bay, Maine, USA. Geomorphology, 124, 55-64.
Barnicoat, A. C., Sheldon, H. A. & Ord, A. 2009. Faulting and fluid flow in porous rocks and sediments: implications for mineralisation and other processes. Mineralium Deposita, 44, 705‒718.
Barrett, A. G., Hinde, A. L. & Kennard, J. M. 2004. Undiscovered resource assessment methodologies and application to the Bonaparte Basin. In: Ellis, G. K., Baillie, P. W. & Munson, T. J., eds. Timor Sea Symposium: Timor Sea Petroleum Geoscience, 2004, Darwin, Northern Territory. Northern Territory Geological Survey, 353‒372.
Beverly, R. K., Beaumont, W., Tauz, D., Ormsby, K. M., von Reden, K. F., Santos, G. M. & Southon, J. R. 2010. The Keck Carbon Cycle AMS Laboratory, University of California, Irvine: Status report. Radiocarbon, 52, 301‒309.
Bian, Y., Feng, D., Roberts, H. H. & Chen, D. 2013. Tracing the evolution of seep fluids from authigenic carbonates: Green Canyon, northern Gulf of Mexico. Marine and Petroleum Geology, 44, 71‒81.
Bickford, G. P., Bishop, J. H., O'Brien, G. W. & Heggie, D. T. 1992. Light hydrocarbon geochemistry of the Bonaparte Basin; including the Sahul Syncline, Malita Graben and Northern Petrel Sub-basin: Rig Seismic survey 99. Geoscience Australia Record, 1992/50, Canberra, Australia: 257 pp.
Bintanja, R., & van de Wal, R. S. W. 2008. North American ice-sheet dynamics and the onset of 100,000 –year glacial cycles. Nature, 454, 869-872.
Bishop, J. H., O'Brien, G. W., Bickford, G. P. & Heggie, D. T. 1992. Light Hydrocarbon geochemistry of the Bonaparte Basin, including the Sahul Syncline, Malita Graben and southern Petrel Sub-basin; Rig Seismic Survey 100. Geoscience Australia Record, 1992/47, Canberra, Australia, 168 pp.
Bronk Ramsey, C. 2013. OxCal 4.2. http://c14.arch.ox.ac.uk/oxcal. (last accessed 7 Feb 2013). Bourget, J., Ainsworth, R. B., Backe, G. & Keep, M. 2012. Tectonic evolution of the northern
Bonaparte Basin: impact on continental shelf architecture and sediment distribution during the Pleistocene. Australian Journal of Earth Sciences, 59, 877‒897.
Bourget, J., Nanson, R., Ainsworth, R. B., Courgeon, S., Jorry, S. J. & Al-anzi, H. 2013. Seismic stratigraphy of a Plio-Quaternary intra-shelf basin (Bonaparte Shelf, NW Australia). In: Keep, M. & Moss, S. J., eds. The Sedimentary Basins of Western Australia IV: Proceedings of the Petroleum Exploration Society of Australia Symposium, Perth, WA.
Brothers, L. L., Kelley, J. T., Belknap, D. F., Barnhardt, W. A., Andrews, B. D., Legere, C. & Hughes Clarke, J. E. 2012. Shallow stratigraphic control on pockmark distribution in north temperate estuaries. Marine Geology, 329-331, 34-45.
Brothers, L. L., Kelley, J. T., Belknap, D. F., Barnhardt, W. A. & Koons, P. O. 2011. Pockmarks: self-scouring seep features? In: Proceedings of the 7th International Conference on Gas Hydrates (ICGH 2011), Edinburgh, Scotland, United Kingdom, July 17–21. Paper no. 326, 10 pp.
Carroll, A. G., Jorgensen, D. C., Siwabessy, P. J. W., Jones, L. E. A., Sexton, M. J., Tran, M., Nicholas, W. A., Radke, L., Carey, M. P., Howard, F. J. F., Stowar, M. J., Heyward, A. J., Potter, A. & Shipboard Party. 2012. Seabed environments and shallow geology of the Petrel Sub-basin, northern Australia: SOL5463 (GA0335) - post survey report. Geoscience Australia Record, 2012/66, 112 pp.
Seabed environments, shallow sub-surface geology and connectivity, Petrel Sub-basin 119
Cathles, L. M., Su, Z. & Chen, D. 2010. The physics of gas chimney and pockmark formation, with implications for asssessment of seafloor hazards and gas sequestration. Marine and Petroleum Geology, 27, 82‒91.
Chappell, J. 1993. Contrasting Holocene sedimentary geologies of lower Daly River, northern Australia, and lower Sepik-Ramu, Papua New Guinea. Sedimentary Geology, 83, 339‒358.
Chen, J., Edwards, D., Hong, Z., Jinadasa, N., Sohn, J. & Palatty, P. 2014. Organic geochemistry of marine sediments from seabed survey SOL5463 in the petrel Sub-basin, Bonaparte Basin, Northern Australia. Life, Environments and Resources, AOGC2014: the 18th Australian Organic Geochemistry Conference, 30 November-2 December, Adelaide ,79-80.
Clark, P. U., Alley, R. B., Keigwin, L. D., Licciardi, J. M., Johnsen, S. & Wang, H. 1996. Origin of the first global meltwater pulse following the last glacial maximum. Paleoceanography, 11, 563‒577.
Clarke, J. D. A., Bone, Y., Cann, J. H., Davies, M., Macphail, M. K. & Wells, F. 2001. Post-glacial biota from the inner part of southwest Joseph Bonaparte Gulf. Australian Journal of Earth Sciences.48, 63-79.
Consoli, C., Higgins, K., Jorgensen, D., Khider, K., Lescinsky, D., Morris, R. & Nguyen, V. 2014. Regional assessment of the CO2 storage potential of the Mesozoic succession in the Petrel Sub-basin, Northern Territory, Australia. Geoscience Australia Record, 2014/11, 83 pp.
Colwell, J.B. & Kennard, J.M. (Editors), 1996—Petrel Sub-basin Study 1995–1996: Summary Report. Australian Geological Survey Organisation Record, 1996/40, 122 pp.
Colwell, J. B. & Kennard, J. M. 2001. Line drawings of AGSO-Geoscience Australia’s regional seismic profiles, offshore northern and northwestern Australia. AGSO-Geoscience Australia Record, 2001/036, 174 pp.
Coplen, T. B., Brand, W. A., Gehre, M., Gröning, M. & Meijer, H. A. J. 2006. New guidelines for δ13C measurements. Analytical Chemistry, 78, 2439‒2441.
de Caritat, P. & Cooper, M., 2011. National Geochemical Survey of Australia: The Geochemical Atlas of Australia. Geoscience Australia Record, 2011/20 (2 Volumes), 557 pp.
De Deckker, P. & Yokoyama, Y. 2009. Micropalaeontological evidence for Late Quaternary sea-level changes in Bonaparte Gulf, Australia. Global and Planetary Change, 66, 85‒92.
Deschamps, P., Durand, N., Bard, E., Hamelin, B., Camoin, G., Thomas, A. L., Henderson, G. M., Okuno, J. & Yokoyama, Y. 2012. Ice-sheet collapse and sea-level rise at the Bølling warming 14,600 years ago. Nature, 483, 559‒564.
Dondurur, D., Ҫifҫi, G., Drahor, M. G. & Coşkun, S. 2011. Acoustic evidence of shallow gas accumulations and active pockmarks in the Izmir Gulf, Aegean Sea. Marine and Petroleum Geology, 28, 1505‒1516.
Edwards, D. S., Kennard, J. M., Preston, J. C., Summons, R. E., Boreham, C. J. & Zumberge, J. E. 2000. Bonaparte Basin: Geochemical characteristics of hydrocarbon families and petroleum systems. AGSO Research Newsletter, 11 pp.
Faulkner, P. 2010. Morphometric and taphonomic analysis of granular ark (Anadara granosa) dominated shell deposits of Blue Mud Bay, northern Australia. Journal of Archaeological Science, 37, 1942‒1952.
Folk, R. L. 1954. The distinction between grain size and mineral composition in sedimentary rock nomenclature. Journal of Geology, 62, 344-359.
Folk, R. L. 1974. Petrology of sedimentary rocks. Hemphill Publishing Company, Austin, Texas. 184 pp.
Gavrilov, A. N., Duncan, A. J., McCauley, R. D., Parnum, I. M., Penrose, J. D., Siwabessy, P. J. W., Woods, A. J., & Tseng, Y-T. 2005a. Characterization of the Seafloor in Australia's Coastal Zone using acoustic techniques. Proceedings of the International Conference Underwater Acoustic Measurements: Technologies & Results, Crete, Greece, 1075‒1080.
Gavrilov, A. N., Siwabessy, P. J. W., & Parnum, I. M. 2005b. Multibeam echo sounder backscatter analysis, Centre for Marine Science and Technology, Perth, Australia, CA3.03.
George, T. & Cauquil, E. 2010. A multi-disciplinary site investigation for the assessment of drilling geohazards and environmental impact within the northern Bonaparte Basin. Preview, 148, 41‒44.
120 Seabed environments, shallow sub-surface geology and connectivity, Petrel Sub-basin

Geoscience Australia. 2001. Natural gas analyses: Bonaparte Basin. Canberra. https://data.gov.au/dataset/natural-gas-analyses-bonaparte-basin
Gibson-Poole, C. M., Lang, S. C., Streit, J. E., Kraishan, G. M. & Hillis, R. R. 2002. Assessing a basin’s potential for geological sequestration of carbon dioxide: an example from the Mesozoic of the Petrel Sub-basin, NW Australia. In: Keep, M. & Moss, S. J. eds. The Sedimentary Basins of Western Australia 3. Petroleum Exploration Society of Australia, Perth. 439-463.
Goff, J. A., Austin Jr., J. A., Gulick, S., Nordfjord, S., Christensen, B., Sommerfield, C., Olson, H. & Alexander, C. 2005. Recent and modern marine erosion on the New Jersey outer shelf. Marine Geology, 216, 275-296.
Gradstein, F. M., Ogg, J. G., Schmitz, M. D. & Ogg, G. M. 2012. The Geologic Time Scale 2012. Elsevier, 1176 pp.
Grosjean, E., Logan, G. A., Rollet, N., Ryan, D. A. & Glenn, K. 2007. Geochemistry of shallow tropical marine sediments from the Arafura Sea, Australia. Organic Geochemistry, 38, 1953‒1971.
Gunn, P. J., Brodie, R. C., Mackey, T. & O'Brien, G. W. 1995. Evolution and structuring of the Joseph Bonaparte Gulf as delineated by aeromagnetic data. Exploration Geophysics, 26, 255‒261.
Haq, B. U. & Al-Qahtani, A. M. 2005. Phanerozoic cycles of sea-level change on the Arabian Platform. GeoArabia, 10, 127-160.
Haq, B. U. & Shutter, S. R. 2008. A chronology of Paleozoic sea-level changes. Science, 322, 64-68. Hardenbol, J., Thierry, J., Farley, M. B., Jacquin, T., de Graciansky, P. C. & Vail, P. 1998. Mesozoic
and Cenozoic sequence chronostratigraphic framework of European basins. In: Hardenbol, J., Thierry, J., Farley, M. B., Jacquin, Th., de Graciansky, P. C. & Vail, P. R. eds. Mesozoic and Cenozoic sequence stratigraphy of European basins. SEPM Special Publication, 60, 3-13.
Hasiotis, T., Papatheodorou, G., Kastanos, N. & Ferentinos, G. 1996. A pockmark field in the Patras Gulf (Greece) and its activation during the 14/7/93 seismic event. Marine Geology, 130, 333‒344.
Heap, A. D., Nichol, S., Przeslawski, R., Radke, L. & Whiteway, T. 2012. Seabed mapping to support long-term CO2 storage in offshore Australia. Geohab 2012. Orcas Island, Washington, USA.
Heap, A. D., Przeslawski, R., Radke, L., Trafford, J., Battershill, C. and Shipboard Party. 2010. Seabed environments of the eastern Joseph Bonaparte Gulf, Northern Australia: SOL4934 Post Survey Report. Geoscience Australia Record 2010/09, 81 pp.
Heap, A. D. & Harris, P. T. 2008. Geomorphology of the Australian margin and adjacent seafloor. Australian Journal of Earth Sciences, 55, 555‒585.
Heap, A., Harris, P., Passlow, V., Wassenberg, T., Hughes, M., Sbaffi, L., Mathews, E., Fellows, M., Fountain, L., Porter-Smith, R., Daniell, J., Buchanen, C. & Robertson, L. 2006. Sources and sinks of terrigenous sediments in the Southern Gulf of Carpentaria – post survey report. Geoscience Australia Record 2006/11, 106 pp.
Hellings, L., Van den Dreissche, K., Baeyens, W., Keppens, E. & Dehairs, F. 2000. Origin and fate of dissolved inorganic carbon in interstitial waters of two freshwater intertidal areas: A case study of the Scheldt Estuary, Belgium. Biogeochemistry, 51, 141–160.
Hjelstuen, B. O., Haflidason, H., Sejrup, H. P. & Nygård, A. 2010. Sedimentary and structural control on pockmark development - evidence from the Nyegga Pockmark Field, NW European margin. Geo-Marine Letters, 30, 221–230.
Hoşgörmez, H., Yalҫin, M. N., Soylu, C. & Bahtiyar, İ. 2014. Origin of the hydrocarbon gases carbon dioxide and hydrogen sulphide in Dodan Field (SE-Turkey). Marine and Petroleum Geology, 57, 433-444.
Hovland, M., Talbot, M. R., Qvale, H., Olaussen, S. & Aasberg, L. 1987. Methane-related carbonate cements in pockmarks of the North Sea. Journal of Sedimentary Research, 57, 881-892.
Hovland, M., Gardner, J. V. & Judd, A. G. 2002. The significance of pockmarks to understanding fluid flow processes and geohazards. Geofluids, 2, 127–136.
Hovland, M., Svensen, H., Forsberg, C. F., Johansen, H., Fichler, C., Fosså, R., Jonsson, R. & Rueslåtten, H. 2005. Complex pockmarks with carbonate-ridges off mid-Norway: Products of sediment degassing. Marine Geology, 218, 191–206.
Seabed environments, shallow sub-surface geology and connectivity, Petrel Sub-basin 121

Hovland, M., Heggland, R., De Vries, M. H. & Tjelta, T. I. 2010. Unit pockmarks and their potential significance for predicting fluid flow. Marine and Petroleum Geology, 27, 1190–1199.
Hughes, R. J. 1978. The geology and mineral occurrences of Bathurst Island, Melville Island, and Cobourg Peninsula, Northern Territory. Bureau of Mineral Resources, Geology and Geophysics, Bulletin 177, 72 pp.
Hughes, R. J. & Senior, B. R. 1973. Progress report on the geology of the Bathurst Island, Melville Island, Cobourg Peninsula, and Fog Bay 1:250 000 sheet areas, Northern Territory. Bureau of Mineral Resources, Geology and Geophysics, Record 1973/052, 68 pp.
Hunt, J. M. 1996. Petroleum Geochemistry and Geology, 2nd edition. W. H. Freeman Co, New York. 743 pp.
Jackson, D. R., Winebrenner, D. P. & Ishimaru, A. 1986. Application of the composite roughness model to high-frequency bottom backscattering. Journal of the Acoustical Society of America, 79, 1410-1422.
Jones, L. E. A. 2014. Petrel Sub-basin Marine Survey (GA0335/SOL5463): Sub bottom profiler processing report. Geoscience Australia Record, 2014/48, 48 pp.
Jones, A. T., Logan, G. A., Kennard, J. M., O’Brien, P. E., Rollet, N., Sexton, M. & Glenn, K. C. 2005. Geoscience Australia Survey 267, Post Survey Report: Testing natural hydrocarbon seepage detection tools on the Yampi Shelf, northwestern Australia. Geoscience Australia Record, 2005/15, 59 pp.
Jones, A. T., Kennard, J. M., Logan, G. A., Grosjean, E. & Marshall, J. 2009. Fluid expulsion features associated with sand waves on Australia's central North West Shelf. Geo-Marine Letters, 29, 233–248.
Judd, A. G. & Hovland, M. 2007. Seabed fluid flow: the impact on geology, biology and the marine environment, Cambridge, Cambridge University Press, 475 pp.
Keep, M., Clough, M. & Langhi, L. 2002. Neogene tectonic and structural evolution of the Timor Sea, NW Australia. In, Keep, M., Moss, S. J. eds. The evolution and dynamics of the Australian Plate: Geological Socitey of Australia Special Publication, 22, 303–312.
Keep, M., Harrowfield, M. & Crowe, W. 2007. The Neogene tectonic history of the North West Shelf, Australia. Exploration Geophysics, 38, 151–174.
Keith, M .L. and Weber, J. N. 1964. Carbon and oxygen isotopic composition of selected limestones and fossils. Geochimica et Cosmochimica Acta, 28, 1787–1816.
Kelman, A. P., Edwards, D. S., Kennard, J. M., Laurie, J. R, Lepoidevin, S., Lewis, B., Mantle, D. J. & Nicoll, R. S. 2014. Bonaparte Basin Biozonation and Stratigraphy, Chart 34, Geoscience Australia. https://www.ga.gov.au/products/servlet/controller?event=GEOCAT_DETAILS&catno=76687 (last accessed 8 January 2014).
Kennard, J. M., Deighton, I., Edwards, D. S., Boreham, C. J. and Barrett, A. G., 2002. Subsidence and thermal history modelling: new insights into hydrocarbon expulsion from multiple petroleum systems in the Petrel Sub-basin, Bonaparte Basin. In: Keep, M. and Moss, S. (Editors), The Sedimentary Basins of Western Australia 3: Proceedings of the Petroleum Exploration Society of Australia Symposium, Perth, 409–437.
Kim, D., Lee, G., Lee, G. & Park, S. 2008. Sediment echo types and acoustic characteristics of gas-related acoustic anomalies in Jinhae Bay, southern Korea. Geosciences Journal, 12, 47–61.
Lafferty, B., Quinn, R. & Breen, C. 2006. A side-scan sonar and high-resolution Chirp sub-bottom profile study of the natural and anthropogenic sedimentary record of Lower Lough Erne, northwestern Ireland. Journal of Archaeological Science, 33, 756–766.
Laughrey, C. D. & Baldassare, F. J. 2003. Some applications of isotope geochemistry for determining sources of stray carbon dioxide. Environmental Geosciences, 10, 107-122.
Lees, B. G. 1984. Holocene terrigenous sedimentation in an epicontinental sea: Joseph Bonaparte Gulf, Northern Australia. PhD Thesis, University of Sydney, 367 pp.
Lees, B. G. 1992. Recent terrigenous sedimentation in Joseph Bonaparte Gulf, Northwestern Australia. Marine Geology, 103, 199-213.
122 Seabed environments, shallow sub-surface geology and connectivity, Petrel Sub-basin

Lees, B. G., Yanchou, L. & Price, D. M. 1992. Thermoluminescence dating of dunes at Cape St. Lambert, East Kimberleys, northwestern Australia. Marine Geology, 106, 131-139.
Lewis, K. B. & Mildenhall, D. C. 1985. The late Quaternary seismic, sedimentary, and palynological stratigraphy beneath Evans Bay, Wellington Harbour. New Zealand Journal of Geology and Geophysics, 7, 299-313.
Lewis, S. E., Sloss, C. R., Murray-Wallace, C. V., Woodroffe, C. D. & Smithers, S. 2013. Post-glacial sea-level changes around the Australian margin: a review. Quaternary Science Reviews, 74, 115–138.
Li, J. 2012. Seabed gravel, mud and sand content in the Petrel Sub-basin in the Australian continental EEZ 2012. Geoscience Australia dataset.
Lisiecki, L. E. & Raymo, M. E. 2007. Plio-Pleistocene climate evolution: trends and transitions in glacial cycle dynamics. Quaternary Science Reviews, 26, 56-69.
Logan, G. A., Rollet, N., Glenn, K., Grosjean, E., Ryan, G. J. & Shipboard Party. 2006. Shallow gas and benthic habitat mapping, Arafura Sea: Geoscience Australia Marine Survey 282 Post-Survey Report. Geoscience Australia Record, 2006/19, 338 pp.
Logan, G. A., Jones, A. T., Kennard, J. M., Ryan, G. J. & Rollet, N. 2010. Australian offshore natural hydrocarbon seepage studies, a review and re-evaluation. Marine and Petroleum Geology, 27, 26–45.
Magalhães, V. H., Pinheiro, L. M., Ivanov, M. K., Kozlova, E., Blinova, V., Kolganova, J., Vasconcelos, C., McKenzie, J. A., Bernasconi, S. M., Kopf, A. J., Díaz-del-Río, V., González, F. J. & Somoza, L. Formation processes of methane-derived authigenic carbonates from the Gulf of Cadiz. Sedimentary Geology, 243-244, 155-168.
Mavko, G. 2012. GP262 Rock Physics, course notes: Parameters that influence seismic velocity: conceptual overview of rock and fluid factors that impact seismic velocity and impedance. https://pangea.stanford.edu/courses/gp262/Notes/8.SeismicVelocity.pdf. Last accessed 11 August 2014.
McLennon, S. M. 2001. Relationship between the trace element composition of sedimentary rocks and upper continental crust. Geochemistry, Geophysics and Geosystems 2, 2000GC000109.
McKay, J. L. and Pederson, T. F. 2008. The accumulation of silver in marine sediments: A link to biogenic Ba and marine productivity. Global Biogeochemical Cycles, 22, 1–17.
Mory, A. J. 1991. Geology of the offshore Bonaparte Basin, northwestern Australia. Geological Survey of Western Australia, Report No. 29, 57 pp.
Moss, J. L., Cartwright, J., Cartwright, A. & Moore, R. 2012. The spatial pattern and drainage cell characteristics of a pockmark field, Nile Deep Sea Fan. Marine and Petroleum Geology, 35, 321–336.
Müller, G. & Gastner, M. 1971. The “Karbonate Bombe”; A simple device for the determination of the carbonate content in sediments, soils and other materials. Neues Jahrbuch für Mineralogie-Monatshefte, 10, 466-469.
Murray-Wallace, C. V. & Woodroofe, C. D. 2014. Quaternary sea-level changes. Cambridge University Press, Cambridge, 504 pp.
Nichol, S. L., Howard, F. J. F, Kool, J., Stowar, M., Bouchet, P., Radke, L., Siwabessy, J., Przeslawski, R., Picard, K., Alvarez de Glasby, B., Colquhoun, J., Letessier, T. & Heyward, A. 2013. Oceanic Shoals Commonwealth Marine Reserve (Timor Sea) biodiversity survey: GA0339/SOL5650 post-survey report. Geoscience Australia Record 2013/38, 112 pp.
Nicholas, W. A. 2012. Aminostratigraphy of semi-enclosed basins. PhD thesis, University of Wollongong, 285 pp.
Nicholas, W. A., Nichol, S.L., Howard, F.J.F., Picard, K., Dulfer, H., Radke, L. C., Carroll, A. G., Tran, M. & Siwabessy, P. J. W. 2014. Pockmark development in the Petrel Sub-basin, Timor Sea, Northern Australia: Seabed habitat mapping in support of CO2 storage assessments. Continental Shelf Research, 83, 129-142.
Seabed environments, shallow sub-surface geology and connectivity, Petrel Sub-basin 123
O'Brien, G., Webster, M., Lawrence, G., Williams, A., Lee, J. & Burns, S. 2000. Hydrocarbon Migration and Seepage in the Timor Sea and Browse Basin North West Shelf Australia: An Integrated SAR, Geological and Geochemical Study. AGSO-Geoscience Australia Record 2001/011, 116 pp.
O'Brien, G. W., Glenn K., Lawrence G., Williams A. K., Webster M., Burns S. & Cowley R. 2002. Influence of Hydrocarbon Migration and Seepage on Benthic Communities in the Timor Sea, Australia. APPEA Journal, C, 225–240.
Passchier, S. & Kleinhans, M. G. 2005. Observations of sand waves, megaripples, and hummocks in the dutch coastal area and their relation to currents and combined flow conditions. Journal of Geophysical Research, 110, FO4S15, doi:10.1029/2004JF000215, 15 pp.
Parnum, I. M., 2007. Benthic habitat mapping using multibeam sonar systems. Ph.D. Thesis, Curtin University of Technology, Western Australia, 213 pp.
Parnum, I. M. & Gavrilov, A. N. 2011. High-frequency multibeam echo-sounder measurements of seafloor backscatter in shallow water: Part 1 –Data acquisition and processing. International Journal of the Society for Underwater Technology, 30, 3–12.
Pau, M. & Hammer, Ø. 2013. Sediment mapping and long-term monitoring of currents and sediment fluxes in pockmarks in the Oslofjord, Norway. Marine Geology, 346, 262–273.
Paull, C. K. & Ussler, W. 2008. Re-evaluating the significance of seafloor accumulations of methane-derived carbonates: Seepage or erosion indicators. Proceedings of the 6th International Conference on gas Hydrates (ICGH 2008), Vancouver, British Columbia, Canada, July 6–10, 2008, 1–12.
Peltier, W. R. 2002. On eustatic sea level history: Last Glacial Maximum to Holocene. Quaternary Science Reviews, 21, 377–396.
Plets, R. Dix, J. Bastos, A. & Best, A. 2007. Characterization of buried inundated peat on seismic (Chirp) data, inferred from core information. Archaeological Prospection, 14, 261-272.
Prinzhofer, A. A. & Huc, A. Y. 1995. Genetic and post-genetic molecular and isotopic fractionations in natural gases. Chemical Geology, 126, 281-290.
Przeslawski, R., Daniell, J., Anderson, T., Barrie, J.V., Battershill, C., Heap, A., Hughes, M., Li, J., Potter, A., Radke, L., Siwabessy, J., Tran, M., Whiteway, T. & Nichol, S. 2011. Seabed Habitats and Hazards of the Joseph Bonaparte Gulf and Timor Sea, Northern Australia. Geoscience Australia Record, 2011/40, 69 pp.
Radke, L. C., Heap, A. D., Douglas, G., Nichol, S., Trafford, J., Li, J. & Przeslawski, R. 2011. A geochemical characterisation of deep-sea floor sediments of the northern Lord Howe Rise. Deep Sea Research II, 58, 909–921.
Radke, L.C., Pappas, W. & Webber, E., 2014. Seafloor environments of the eastern Timor Sea, Northern Australia: Inorganic chemistry of seabed sediments. Geoscience Australia, Canberra. http://dx.doi.org/10.4225/25/54B8657D7C8B8
Reddy, C. M., Eglinton, T. I., Palić, R., Benitez-Nelson, B. C., Stojanović, G., Palić, I., Djordjević, S. & Eglinton, G. 2000. Even carbon number predominance of plant wax n-alkanes: a correction. Organic Geochemistry, 31, 331-336.
Reimer, P. J., Baillie, M. G. L., Bard, E., Bayliss, A., Beck, J. W., Blackwell, P. G., Bronk Ramsey, C., Buck, C. E., Burr, G. S., Edwards, R. L., Friedrich, M., Grootes, P. M., Guilderson, T. P., Hajdas, I., Heaton, T. J., Hogg, A. G., Hughen, K. A., Kaiser, K. F., Kromer, B., McCormac, F. G., Manning, S. W., Reimer, R. W., Richards, D. A., Southon, J. R., Talamo, S., Turney, C. S. M., van der Plicht, J. & Weyhenmeyer, C. E. 2009. INTCAL09 and Marine09 radiocarbon age calibration curves, 0–50,000 years cal BP. Radiocarbon, 51, 1111–1150.
Rollet, N., Logan, G. A., Kennard, J. M., O’Brien, P. E., Jones, A. T. & Sexton, M. 2006. Characterisation and correlation of active hydrocarbon seepage using geophysical data sets: an example from the tropical carbonate Yampi Shelf, northwest Australia. Marine and Petroleum Geology, 23, 145–164.
Rollet, N., Logan, G. A., Ryan, G., Judd, A. G., Totterdell, J. M., Glenn, K., Jones, A. T., Kroh, F., Struckmeyer, H. I. M., Kennard, J. M. & Earl, K. L. 2009. Shallow gas and fluid migration in the northern Arafura Sea (offshore Northern Australia). Marine and Petroleum Geology, 26, 129–147.
124 Seabed environments, shallow sub-surface geology and connectivity, Petrel Sub-basin
Scalan, R. S. & Smith, J. E. 1970. An improved measure of the odd-to-even predominance in the normal alkanes of sediment extracts and petroleum. Geochimica et Cosmochimica Acta, 34, 611–620.
Seebeck, H., Tenthorey, E., Consoli, C., And Nicol, A. 2015. Polygonal faulting and seal integrity in the Bonaparte Basin, Australia. Marine and Petroleum Geology, 60, 120–135.
Shepard, F. P. 1954. Nomenclature based on sand silt clay ratios. Journal of Sedimentary Petrology, 24, 151–158.
Sun, X. & Turchyn, A. V. 2014. Significant contribution of authigenic carbonate to marine carbon burial. Nature Geoscience, 7, 201-204.
Tissot, B. P. & Welte, D. H. 1984. Petroleum formation and occurrence, Berlin, Springer-Verlag, 699 pp.
Tweedley, J. R., Warwick, R. M., Valesini, F. J., Platell, M. E. & Potter, I. C. 2012. The use of benthic macroinvertebrates to establish a benchmark for evaluating the environmental quality of microtidal, temperate southern hemisphere estuaries. Marine Pollution Bulletin, 64, 1210–1221.
van Andel, T. H. & Veevers, J. J. 1965. Submarine morphology of the Sahul Shelf, Northwestern Australia. Geolgocial Society of America Bulletin, 76, 695-700.
van Andel, T. H. & Veevers, J. J. 1967. Morphology and sediments of the Timor Sea. Department of National Development, Bureau of Mineral Resources, Geology and Geophysics Bulletin 83, 186 pp.
van Andel, T. H., Heath, G. R., Moore, T. C. & Mcgeary, D. F. R. 1967. Late Quaternary history, climate, and oceanography of the Timor Sea, Northwestern Australia. American Journal of Science, 265, 737–758.
Versteegh, G. J. M., Schefub, E., Dupont, L., Marret, F., Sinninghe Damaste, J. S. & Jansen, J. H. F. 2004. Taraxerol and Rhizophora pollen as proxies for tracking past mangrove ecosystems. Geochimica et Cosmochimica Acta, 68, 411–422.
Wildsmith, M. D., Rose, T. H., Potter, I. C., Warwick, R. M. & Clarke, K. R. 2011. Benthic macroinvertebrates as indicators of environmental deterioration in a large microtidal estuary. Marine Pollution Bulletin, 62, 525–538.
Yokoyama, Y., Lambeck, K., De Deckker, P., Johnston, P. & Fifield, L. K. 2000a. Timing of the Last Glacial Maximum from observed sea-level minima. Nature, 406, 713–716.
Yokoyama, Y., Esat, T. M., Lambeck, K., & Fifield, L. K. 2000. Last ice age millennial scale climate changes recorded in Huon Peninsula corals. Radiocarbon, 42, 383-402.
Yokoyama, Y., De Deckker, P., Lambeck, K., Johnston, P. & Fifield, L. K. 2001a. Sea-level at the Last Glacial Maximum: evidence from northwestern Australia to constrain ice volumes for oxygen isotope stage 2. Palaeogeography, Palaeoclimatology, Palaeoecology, 165, 281–297
Yokoyama, Y., Purcell, A., Lambeck, K. & Johnston, P. 2001b. Shore-line reconstruction around Australia during the Last Glacial Maximum and Late Glacial Stage. Quaternary International, 85, 9–18.
Seabed environments, shallow sub-surface geology and connectivity, Petrel Sub-basin 125

Post-processing of bathymetry data Appendix A
The quality of the multibeam bathymetry acquired during the marine survey SOL5463 was high, therefore, post-processing of the raw data was kept to a minimum. Swath data was processed through Caris HIPS/SIPS version 7.1 in the following steps:
• A vessel configuration file was created where the co-ordinates of the motion sensor and DGPS antenna and patch test offsets were recorded.
• A new project was then created and the vessel configuration file was attached to the project file.
• The raw swath sonar data, in raw.all format, for each line was then imported into the project and the vessel information assigned to the data.
• The motion sensor, DGPS and heading data were then cleaned using a filter that averaged adjacent data to remove artefacts.
• Different sound velocity profiles data for each block were attached to the corresponding raw swath sonar data files to correct the depths for changes in the speed of sound through the water column.
• Then, a new blank field area was defined that specified the geographic area of study and the coordinate system used. The coordinate system used for the study areas was WGS84 UTM 52S.
• The data was cleaned by applying several filters that removed any remaining spikes in the bathymetry data using user defined threshold values. A visual inspection of the data for each line was then undertaken where artefacts and noisy data not removed by the filtering process were removed manually using Swath and subset editor modules of the Caris HIPS/SIPS software.
• All the data for each bathymetric point; motion sensor, DGPS, heading, tide and sound velocity profile data were merged to produce the final processed data file. A weighted grid of the processed data was then created for each block.
• The GPS tide was computed and applied to correct for tidal variations.
• The processed data was finally exported as grid soundings or false-colour images for presentation and reporting, and as final processed data in GSF and ASCII XYZ formats, at 2 m resolution.
• Using CARIS Base editor 4.0, the grids were exported as ESRI ASCII grid then imported to Arc Catalogue/Arc Info to create a raster file for all five grids.
126 Seabed environments, shallow sub-surface geology and connectivity, Petrel Sub-basin

Pockmark identification and mapping Appendix B
Pockmark identification was undertaken by initial visual inspection of bathymetric and backscatter data, and using standard ArcGIS Tools. A representative portion of Area 1 was then cropped from the larger bathymetric dataset to remove areas with significant motion-related noise and variations in geomorphology, to identify, analyse and interpret pockmarks in greater detail. The central part of Area 1 was chosen for this purpose, because of the high concentration of pockmarks in this portion of Area 1. Once the bathymetric data was cleaned, the methods used on the cropped area were applied to all of Area 1 to identify and quantify pockmarks in Area 1 in a consistent manner.
Pockmarks were spatially located using the following procedure:
• Create a slope map of the cropped bathymetry;
• Contour the slope map using 1° intervals (initially);
• Identify sinks, using the ArcGIS 10.1 Sink tool;
• Contour bathymetry at 0.1 m intervals to aid in the identification of pockmarks;
• Visually identify potential pockmarks, where 0.1 m bathymetric contours and slope contours ≥ 5° occur together, and a sink is present at, or directly adjacent to, the centre of the contours (using Raster calculator).
Further details are as follows:
• Thirty two representative profiles were initially drawn across randomly chosen semi-circular to circular depressions (particularly visible in hill-shaded imagery) using standard ArcGIS 10 tools, to identify criteria for identifying pockmarks.
• The mean slope over the entire cropped area was calculated at 0.53°. In contrast, the measured slopes from the representative profiles drawn over depressions were typically in the range of 2.6–10.4°.
• A value of 5° was chosen as the minimum value of slope that defined a seafloor depression as a pockmark. Using a value of 5° reduced visible noise in the bathymetry image, while allowing the inclusion of most observed seafloor depressions with moderately steep slopes as pockmarks.
• The Sink tool in ArcGIS 10.1 was employed to locate sinks (areas having unidentified flow direction; cf. Andrews et al. 2010), which were then used to identify potential pockmarks. Commonly, sinks in elevation data are thought of as an incorrect value lower than the values of surrounding cells. However, in combination with slope values, sinks also provide a way to identify the location of enclosed depressions such as pockmarks.
• The ArcGIS 10.1 Raster Calculator was used to identify the locations of sinks where they were adjacent to slopes of 5° or more.
• The final identification of pockmarks was undertaken visually, targeting depressions where a sink, a closed 0.1 m contour and a slope ≥5° coincided.
• The centroid of individual sink cells was not used for identifying pockmarks, as this method resulted in multiple points being located, commonly within a single depression. This is because an individual ‘sink’ may comprise more than one 2 x 2 m cell.
Seabed environments, shallow sub-surface geology and connectivity, Petrel Sub-basin 127

Summary of geochemistry processing and analytical techniques Appendix C
Appendix Table C.1. Details of shipboard/laboratory processing and analytical techniques used to prepare and analyse the geochemistry sub-samples. The sub-sample codes (C_B1 etc.) correspond to the file extension assigned to the sub-sample types in the MARS database (e.g. SOL5463/014GR029C_B1).
Sub-sample Shipboard processing Parameters measured Laboratory pre-processing
Analytic procedures and sample post-processing
C_B1 (Chlorins Porosity (0–2 cm) Mineralogy)
7.5 ml samples of surface sediment (0–2 cm) were syringed into plastic container wrapped in aluminium foil. The samples were frozen.
Porosity and wet/dry bulk densities (0.0–2.0 cm)
Freeze-dry Weight difference after drying and after correction for seawater salts (porosity) and normalisation to wet/dry volumes (bulk density).
Total chlorins and chlorin indices
Triple extraction in 100% acetone after freeze-drying and grinding (in dark).
Fluorometry
Mineralogy 10% zinc oxide added to dried samples
X-Ray diffraction
C_B2 (Chlorophyll abc)
4 ml samples of surface sediment (0-0.5 cm) were syringed into plastic bags. The samples were wrapped in aluminium foil and frozen.
Chlorophyll a,b,c and phaeophytin
Thaw in refrigerator and then extracted in 90% acetone
Extracts analysed by spectrophotometry (630, 647, 664 and 750 nm). Individual pigments quantified by trichometric equations and expressed on a per gram dry weight (g dry wt) basis utilising data from C_B3.
C_B3 (Porosity (0–0.5 cm))
4 ml samples of surface sediment (0–0.5 cm) were syringed into plastic bags. Samples were frozen.
Porosity and wet/dry bulk densities (0–0.5 cm)
Freeze-dry Weight difference after drying and after correction for seawater salts (porosity) and normalisation to wet/dry volumes (bulk density).
C_C1 (SOD)
Bulk sub-sample (6.5 ml) of surface sediment (0–2 cm) incubated in BOD bottles for ~24 hrs in the dark at SST. Dissolved oxygen concentrations (and saturation values) were measured at the start and finish of each incubation.
Sediment oxygen demand
N/A Results expressed on a per g dwt basis utilising C_B1 results.
128 Seabed environments, shallow sub-surface geology and connectivity, Petrel Sub-basin, Bonaparte Basin, Timor Sea

Sub-sample Shipboard processing Parameters measured Laboratory pre-processing
Analytic procedures and sample post-processing
C_C2 (Dissolved inorganic carbon flux)
Salinity, temperature and pH were measured on pore waters extracted from sub-samples C_D1. These pore waters were then filtered (0.45 µm) into 3 ml gas-tight vials (pre-charged with 0.025 HgCl2) within 1 hr of collection (T=0). The procedure was repeated on pore waters from an additional bulk sample collected as per C_D1 and incubated for ~24 hrs at SST (T=1). All samples were refrigerated prior to laboratory analysis.
CO2 production rates Samples brought to room temperature in dark.
1. Dissolved inorganic carbon (DIC) determined using a DIC analyser and infrared-based CO2 detector.(Geoscience Australia) 2. CO2 production rates calculated by concentration differences (T=1 – T=0) over the incubation period, after correction for CaCO3 fluxes. Results expressed on a per g dwt basis utilising C_B1 data.
C_D1 (Elements Carbonate Surface Area)
Surface sediment (0–2 cm) was syringed into acid-washed falcon vials. Pore waters were removed within 1 hr of collection. Residual sediment was frozen for transport to the laboratory.
Major, minor, trace and rare earth elements
1. Freeze-dry 2. Grind in agate mill
X-Ray Fluorescence and ICP AES (Geoscience Australia)
Bulk carbonate 1. Freeze-dry 2. Grind
Carbonate Bomb (Geoscience Australia)
Particle surface area 1. Freeze dry 2. Slow heating to 350oC (12 hours).
5-point BET (Geoscience Australia)
TOC, TN and C & N isotopes
1. Freeze-dry 2. Grind 3. Acid treatment
Mass spectrometry
C_E1 (Surface sediment)
Surface sediment (~0–2 cm) was scooped into plastic bag. Samples were immediately frozen.
N/A N/A N/A
C_E2 (Biomaker)
Surface sediment (~0–2 cm) was scooped into metal tin using a metal spoon. The tin was filled with sediment to ~1/3. The tins were sealed and immediately frozen.
Biomarkers 1. Freeze-dry 2. Hand-grind 3. Solvent extraction
Gas chromatography and Mass Spectrometry
Seabed environments, shallow sub-surface geology and connectivity, Petrel Sub-basin, Bonaparte Basin, Timor Sea 129

Appendix Table C.2 Mollusc identifications. Molluscan remains in two grab samples 05-RG-04 and 06-GR-07 from palaeochannels in Area 1 were identified by Dr Richard Willan, from the Museum and Art Gallery, Northern Territory (MAGNT).
MAGNT registration number Species Family Habitat Comment
SOL5463/05GR04
P.49810 Haustator cingulifer Turritellidae Benthic; offshore; fully marine
P.49811 Clypeola sp. 1 Calyptraeidae Benthic; offshore; fully marine
P.49812 Phos textum Buccinidae Benthic; offshore; fully marine
P.49813 Nassarius cf. clathrus Nassariidae Benthic; offshore; fully marine
P.49814 Mitrella sp. 1 Columbellidae Benthic; offshore; fully marine
P.49815 Pterynotus acanthopterus Muricidae Benthic; offshore; fully marine
P.49816 Neocancilla clathrus Mitridae Benthic; offshore; fully marine
P.49817 Vexillum cf. amanda Costellariidae Benthic; offshore; fully marine
P.49818 Unedogemmula indica Turridae Benthic; offshore; fully marine
P.49819 Eucithara sp. 1 Conidae Benthic; offshore; fully marine
P.49820 Eucithara sp. 2 Conidae Benthic; offshore; fully marine
P.49821 Heterocithara sp. 1 Conidae Benthic; offshore; fully marine
P.49822 Diacavolinia longirostris Cavoliniidae Holoplanktonic
P.49823 Leionucula orecta Nuculidae Benthic; offshore; fully marine
P.49824 Nuculana corbuloides Nuculanidae Benthic; offshore; fully marine
P.49825 Nuculana electilis Nuculanidae Benthic; offshore; fully marine
P.49826 Nuculana novaeguineensis Nuculanidae Benthic; offshore; fully marine
P.49827 Yoldia narthecia Nuculanidae Benthic; offshore; fully marine
P.49828 Arca navicularis Arcidae Benthic; offshore; fully marine
P.49829 Anadara granosa Arcidae Benthic; inshore; estuarine
130 Seabed environments, shallow sub-surface geology and connectivity, Petrel Sub-basin, Bonaparte Basin, Timor Sea

MAGNT registration number Species Family Habitat Comment
P.49830 Anadara rufescens Arcidae Benthic; offshore; fully marine
P.49831 Limopsis sp. 1 Limopsidae Benthic; offshore; fully marine
P.49832 Plicatula chinensis Plicatulidae Benthic; offshore; fully marine
P.49833 Propeamussium sp. 1 Propeamussiidae Benthic; offshore; fully marine
P.49834 Cryptopecten sp. 1 Pectinidae Benthic; offshore; fully marine Probably a new species; at least a new record for Australia
P.49835 Limaria sp. 1 Limidae Benthic; offshore; fully marine
P.49836 Planostrea pestigris Ostreidae Benthic; offshore; fully marine
P.49837 Melliteryx sp. 1 Galeommatidae Benthic; offshore; fully marine
P.49838 Borniola sp. 1 Galeommatidae Benthic; offshore; fully marine
P.49839 Cardiolucina eucosmia Lucinidae Benthic; offshore; fully marine Can also occur inshore in semi-estuarine muds
P.49840 Salaputium rhomboides Crassatellidae Benthic; offshore; fully marine
P.49841 Carditella torresi Carditidae Benthic; offshore; fully marine
P.49842 Pleuromeris sp. 1 Carditidae Benthic; offshore; fully marine
P.49843 Frigidocardium sp. 1 Cardiidae Benthic; offshore; fully marine Probably a new species; at least a new record for Australia
P.49844 Theora nasuta Semelidae Benthic; offshore; fully marine
P.49845 Enigmotellina sp. 1 Tellinidae Benthic; offshore; fully marine
P.49846 Macoma sp. 1 Tellinidae Benthic; offshore; fully marine
P.49847 Macoma sp. 2 Tellinidae Benthic; offshore; fully marine
P.49848 Dosinia tumida Veneridae Benthic; offshore; fully marine
P.49849 Placamen tiara Veneridae Benthic; offshore; fully marine
P.49850 Timoclea infans Veneridae Benthic; offshore; fully marine
Seabed environments, shallow sub-surface geology and connectivity, Petrel Sub-basin, Bonaparte Basin, Timor Sea 131

MAGNT registration number Species Family Habitat Comment
P.49851 Gouldiopa sp. 1 Veneridae Benthic; offshore; fully marine
P.49852 Spisula cf. trigonella Mactridae Benthic; inshore; estuarine
P.49853 Myadora pulleinei Myochamidae Benthic; offshore; fully marine
P.49854 Pseudoneaera sp. 1 Cuspidariidae Benthic; offshore; fully marine
P.49855 Vertambitus torridus Verticordiidae Benthic; offshore; fully marine
SOL5463/06GR07
P.49856 Scisurella sp. 1 Scisurellidae Benthic; offshore; fully marine
P.49857 Haustator cingulifer Turritellidae Benthic; offshore; fully marine
P.49858 Gyrineum lacunatum Ranellidae Benthic; offshore; fully marine
P.49859 Biplex pulchellum Ranellidae Benthic; offshore; fully marine
P.49860 Nassarius cf. castus Nassariidae Benthic; offshore; fully marine
P.49861 Mitrella sp. 1 Columbellidae Benthic; offshore; fully marine
P.49862 Ancillista cingulata Olividae Benthic; offshore; fully marine
P.49863 Unedogemmula indica Turridae Benthic; offshore; fully marine
P.49864 Eucithara sp. 2 Conidae Benthic; offshore; fully marine
P.49865 Heterocithara sp. 1 Conidae Benthic; offshore; fully marine
P.49866 Diacavolinia longirostris Cavoliniidae Holoplanktonic
P.49867 Leionucula superba Nuculidae Benthic; offshore; fully marine
P.49868 Nuculana electilis Nuculanidae Benthic; offshore; fully marine
P.49869 Yoldia narthecia Nuculanidae Benthic; offshore; fully marine
P.49870 Anadara granosa Arcidae Benthic; inshore; estuarine
P.49871 Limopsis sp. 1 Limopsidae Benthic; offshore; fully marine
132 Seabed environments, shallow sub-surface geology and connectivity, Petrel Sub-basin, Bonaparte Basin, Timor Sea

MAGNT registration number Species Family Habitat Comment
P.49872 Plicatula chinensis Plicatulidae Benthic; offshore; fully marine
P.49873 Propeamussium sp. 1 Propeamussiidae Benthic; offshore; fully marine
P.49874 Cryptopecten sp. 1 Pectinidae Benthic; offshore; fully marine Probably a new species; at least a new record for Australia
P.49875 Spondylus victoriae Spondylidae Benthic; offshore; fully marine
P.49876 Malleus albus Malleidae Benthic; offshore; fully marine
P.49877 Neotrigonia uniophora Trigoniidae Benthic; offshore; fully marine
P.49878 Chama fibula Chamidae Benthic; offshore; fully marine
P.49879 Cardiolucina eucosmia Lucinidae Benthic; offshore; fully marine
P.49880 Mactromya sp. 1 Mactromyidae Benthic; offshore; fully marine
P.49881 Carditella torresi Carditidae Benthic; offshore; fully marine
P.49882 Acrosterigma impolitum Cardiidae Benthic; offshore; fully marine
P.49883 Frigidocardium sp. 1 Cardiidae Benthic; offshore; fully marine Probably a new species; at least a new record for Australia
P.49884 Semele sp. 1 Semelidae Benthic; offshore; fully marine
P.49885 Spisula cf. trigonella Mactridae Benthic; inshore; estuarine
P.49886 Timoclea infans Veneridae Benthic; offshore; fully marine
P.49887 Gouldiopa sp. 1 Veneridae Benthic; offshore; fully marine
P.49888 Gouldiopa sp. 2 Veneridae Benthic; offshore; fully marine
P.49889 Circe sp. 1 Veneridae Benthic; offshore; fully marine
P.49890 Anisocorbula sp. 1 Corbulidae Benthic; offshore; fully marine
P.49891 Cucurbita cymbium Gastrochaenidae Benthic; offshore; fully marine
Seabed environments, shallow sub-surface geology and connectivity, Petrel Sub-basin, Bonaparte Basin, Timor Sea 133