Embed Size (px)
Citation preview

Sea Level Rise Projections / Local Government Implications
Charitha Pattiaratchi1
Oceans Graduate School and The UWA Oceans InstituteThe University of Western Australia
Sea Level variability in Western Australia

NOT Climate change but TIDES
“In the next eight years our water level is going to increase by about 25 cm, which is much higher than the mean water level increase for the last 115 years.”

Coastal Hazards
LandslidesEarthquakes
Astronomical Tides Storm
systems
Climate Change
Tsunamis
Sea level changes
Longer term sea level variability (non-tidal)
Storm SurgesSurface Waves
Coastal flooding Beach Stability Coastal Amenity

Extreme sea levels

Mean sea level
‘Beach’ Scale
Storm Surges
Relative MSLSeasonal + Inter-annual Nodal tidesENSO (El Nin0/La Nina)
Basin ScaleShelf Scale
‘Energy’ @ Beach
Wave Climate

Sea Level Fluctuations
Lowest WL–0.1m CD
Daily Range 0.4 – 0.6m
Highest WL +1.9m CD
Tide(t)+
Sea Level (t) = Surge(t) +
Mean Sea Level(t)
Range = 2m
Fremantle Tide Spectrum
1950-2010
0.0
0.2
0.4
0.6
0.8
1.0
Wat
er le
vel r
ange
(m)
seic
hes
tsun
ami
diur
nal t
ides
surg
es
annu
al
inte
r-an
nual
noda
l tid
es
glob
al w
arm
ing
/ 10
0 yr
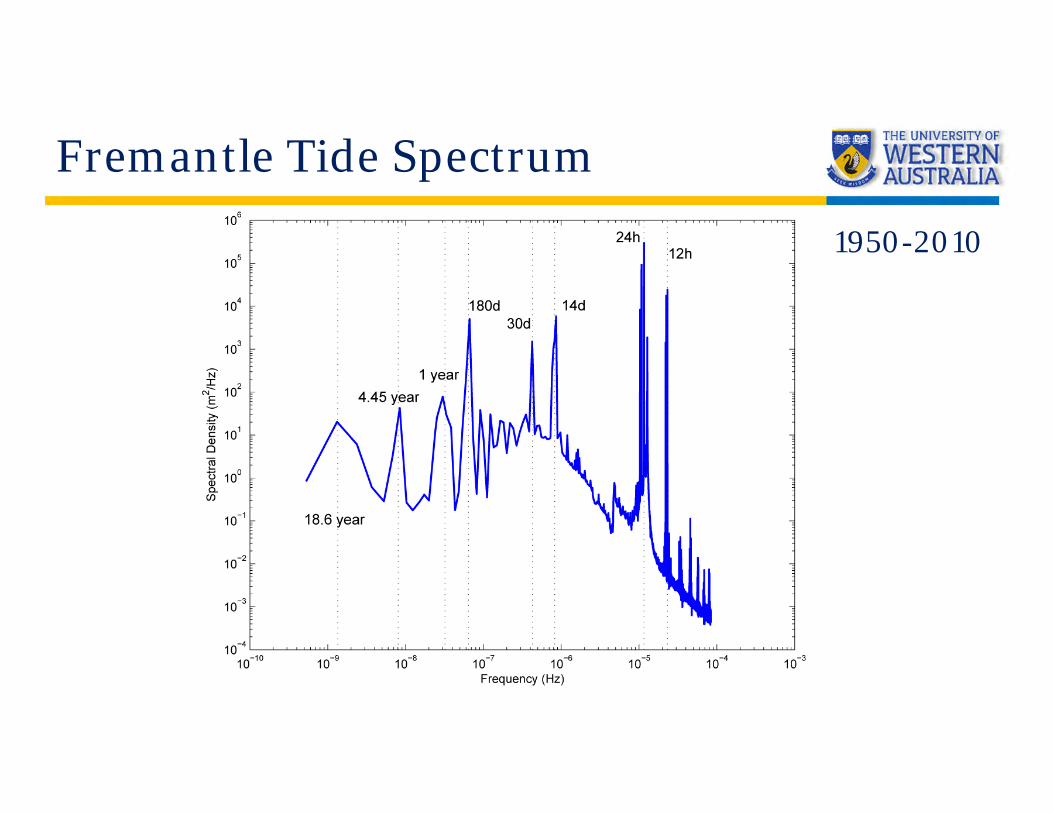
Water level variability at Fremantle
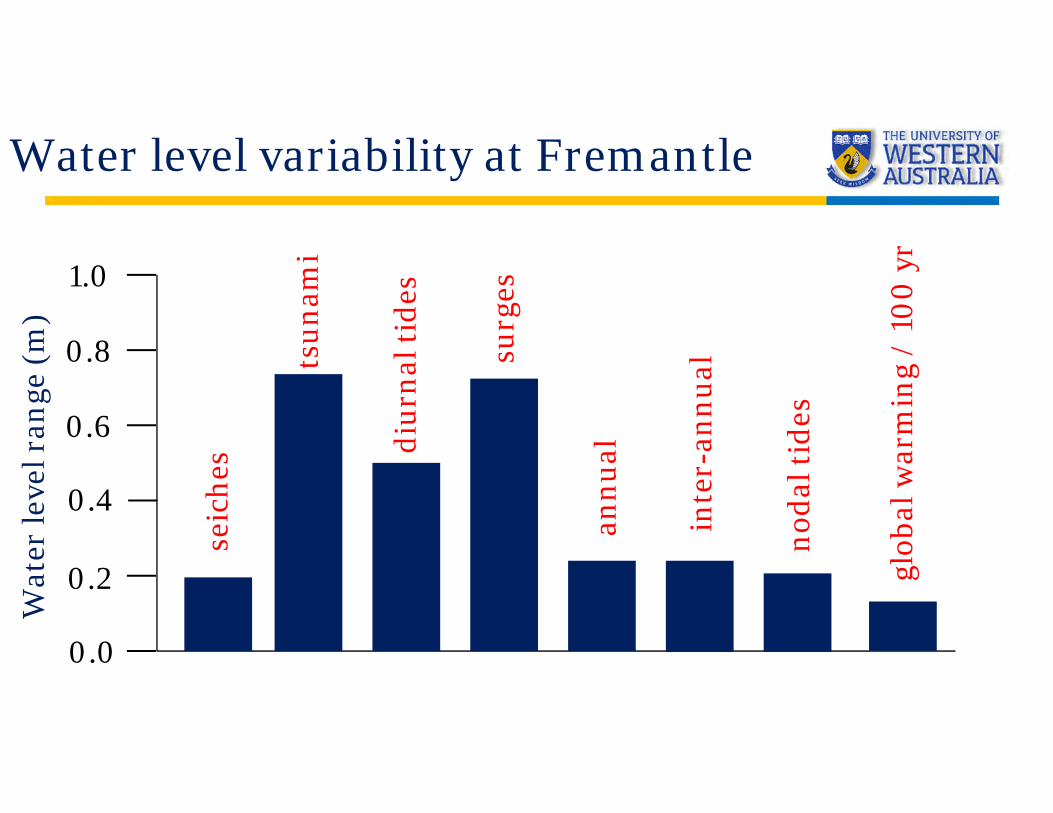
Fremantle: mean sea level
0.20 cm
Mean rate of increase: 1.7 mm/year (1897-2018)= 20.7 cm

Australian tides

Fundamental Tidal Frequencies
All tidal frequencies are linear combination of 6 fundamental frequencies
𝑓 𝑛 𝑓 + 𝑛 𝑓 + 𝑛 𝑓 + 𝑛 𝑓 + 𝑛 𝑓 + 𝑛 𝑓 + 𝑛 𝑓 ni are positive/negative integers
Period Sourcef1 1 Lunar day Local mean lunar timef2 1 month Moon’s mean longitudef3 1 year Suns’ mean longitudef4 8.847 years Longitude of the moon’s perigeef5 18.613 years Longitude of the moon’s ascending nodef6 20,940 years Longitude of the sun’s perigee

The lunar orbital plane is (23.5 + 5o) of the equator
The cycle of variation is from 18.5o (23.5o-5o) to 28.5o (23.5o+5o) and is defined as the nodal cycle
23.5°
±5°
18.6 yr nodal cycleLong-period tides:
Haigh et al., 2011

Diurnal tides: characteristics
O’Callaghan, Pattiaratchi & Hamilton, 2010
Tropic tides(moon: max declination)
Equatorial tides(moon: min declination)
Spring tides(moon-sun: syzygy)
Neap tides(moon-sun : quadrature)

Global distribution of tidal conditions
Semi-diurnal
diurnal
mixed
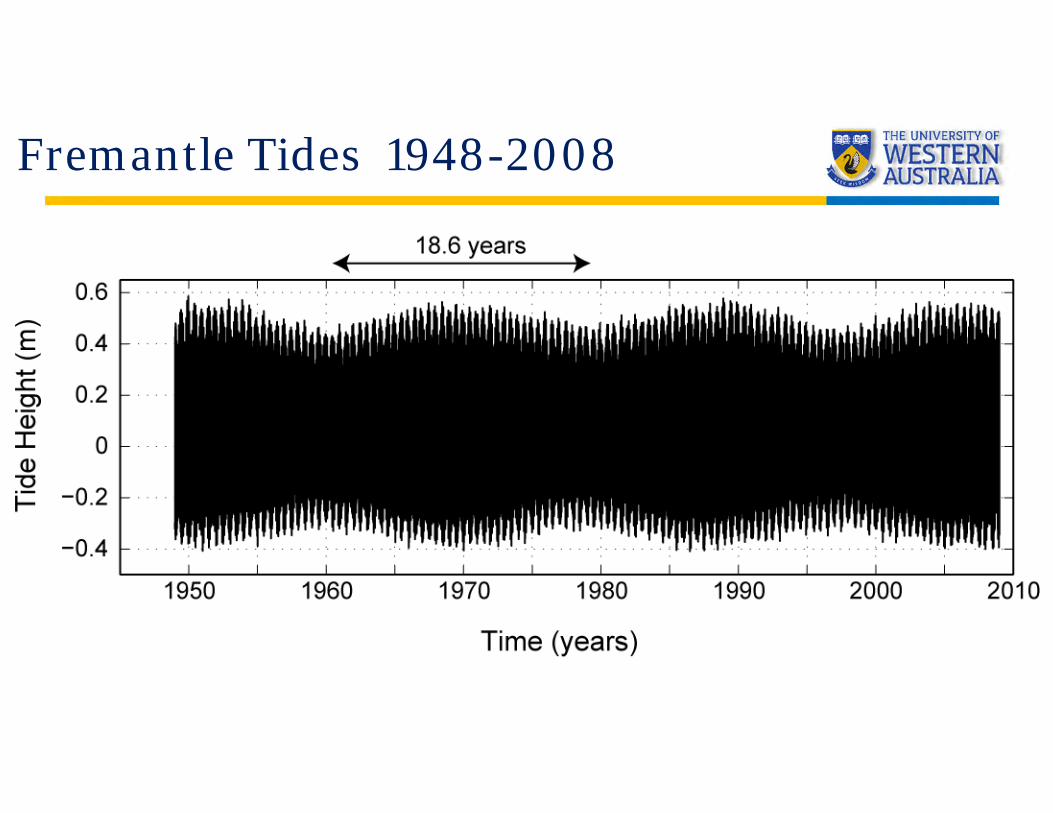
Fremantle Tides 1948-2008

-60
-40
-20
0
20
40
60
1900 1910 1920 1930 1940 1950 1960 1970 1980 1990 2000 2010
50% 20% 10% 5% 2% 1%
Measurements: Fremantle

18.6 years
Measurements: Fremantle
Ivan Haigh

4.4 years
Broome
Measurements: Broome
Ivan Haigh

Latitudinal variation
Ivan Haigh

Shows bursts of activity, and progressive change
Sea Level Rise
Fremantle High WL Exceedance
Eliot, 2012
2025 2043 2062Next high water years:

Month
Seasonal Changes: steric height
Ocean currents Max: 0.20m
Pattiaratchi & Eliot, 2008

Carnarvon

Inter-annual Variability
25cmEl Niño
La Niña
Post 1966: 1 unit SOI = ~13 mm mean sea level. No relationship prior to 1966

ARI
ENSO
18.6 yr nodal tidal cycle
Extreme sea levels: a range of processes
ARI

Inter-annual Variability

Sea level & beach width: Cottesloe
Lake, 2018

Sea level & beach width: Mosman
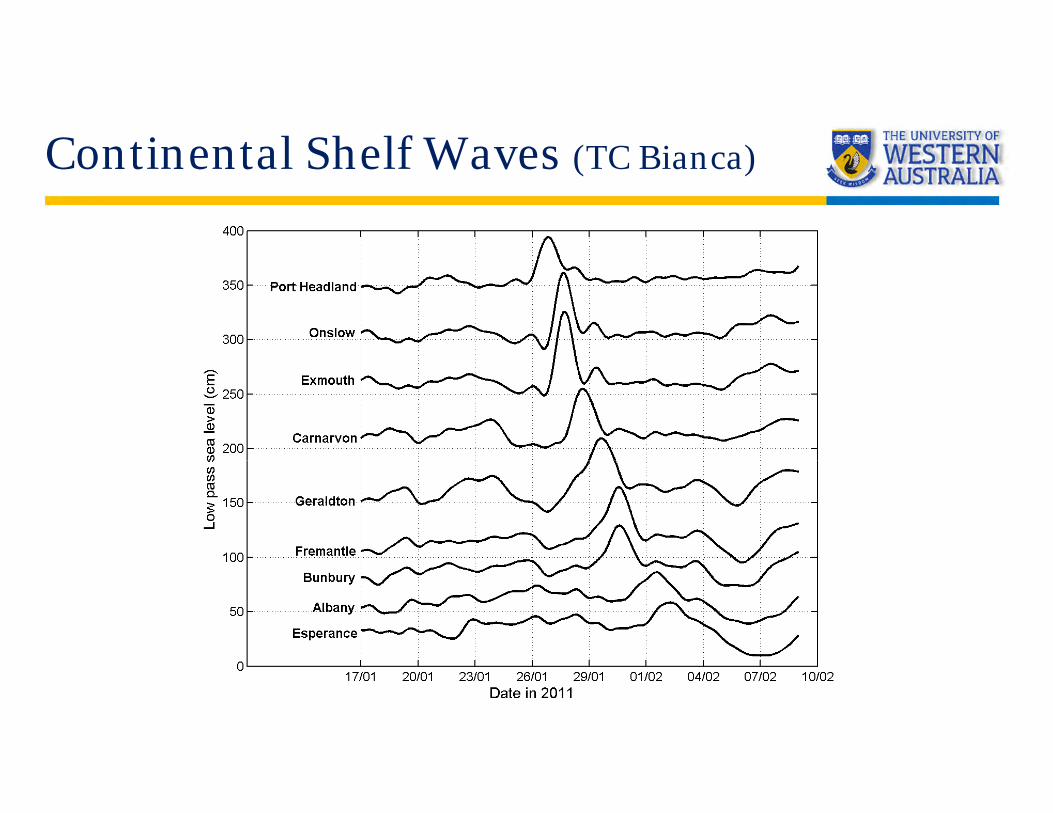
Continental Shelf Waves (TC Bianca)
Tropical low

Tropical Cyclone BiancaImpacts @ Yanchep Beach
17 January 31 January
5 m


Global mean sea level rise
MSLR (m) RCP ScenariosRCP2.5 RCP4.5 RCP6.0 RCP8.5
Median 0.40 0.47 0.48 0.6390%likelyrange
[-0.1 - 0.16] [0.32 - 0.63] [0.33 - 0.63] [0.45 - 0.82]
Projected global MSLR (m) in period 2081-2100Relative to levels averaged over period 1986-2005
(Church et al., 2013).
MSLR (m) RCP ScenariosRCP2.6 RCP4.5 RCP8.5
2030 0.12 0.12 0.122090 0.38
[0.22 - 0.55]0.46
[0.30 - 0.64]0.61
[0.40 - 0.84]
Projected Fremantle MSLR (m) in period 2081-2100

Fremantle Sea Level: Acceleration ?

Global Mean Sea LevelFremantle
Newlyn
Church & White
It will be several decades before a discernable sea level rise acceleration in individual TG records are detected due mainly to inter-annual to multi-decadal variability

http://sealevelx.ems.uwa.edu.au/
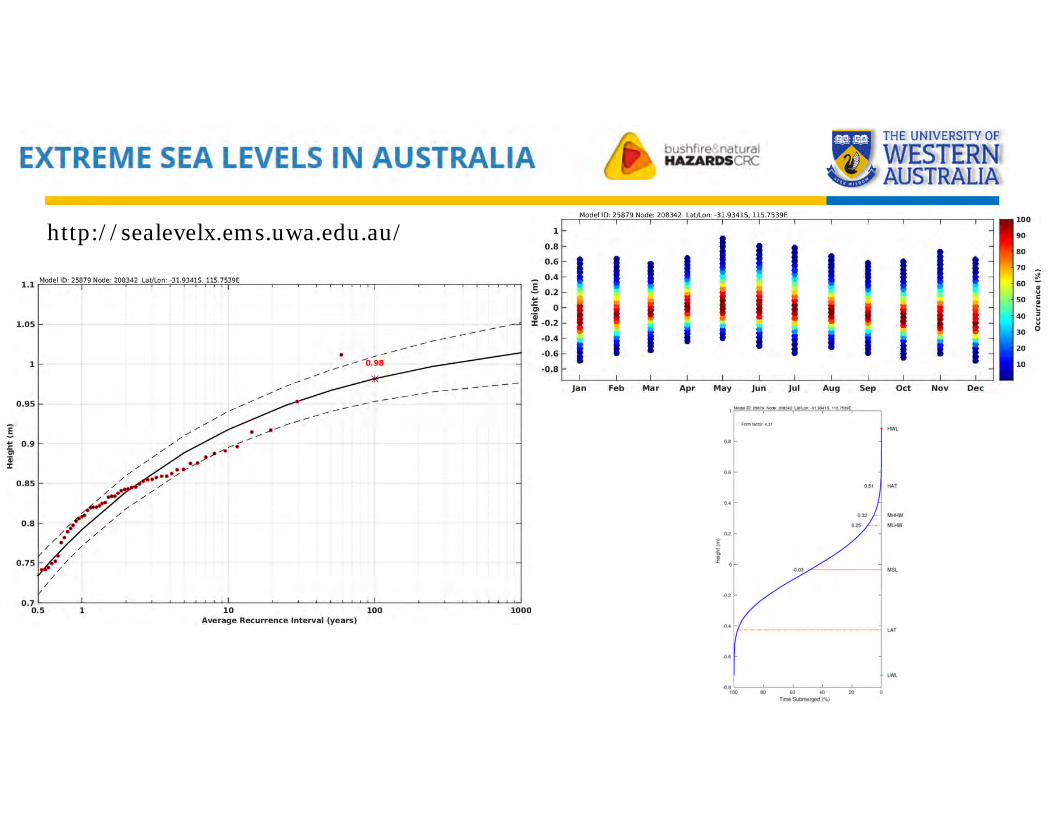
http://sealevelx.ems.uwa.edu.au/

Conclusions
• Mean sea level has many components. It is important to understand local processes contributing to sea level.
• Expect an increase in mean water levels over next 8 years due to tidal effects
• Implications for coastal flooding, beach stability and coastal infrastructure
Low High1960 19691979 19881998 20062016 20252035 2043

Thank You