Embed Size (px)
Citation preview
SDG indicator 15.3.1Proportion of land that is degraded over total land area
The UNCCD is the custodian agency leading an Inter-Agency Advisory Group on 15.3.1
composed of our key partner FAO as well as the CBD, UNFCCC, UNEP and UNSD
to further refine the methodology and data tools/options for this indicator

Established Methodology
The methodology for the three sub-indicators is well established and
recognized in the scientific literature, multilateral agreements and other
international processes (essential climate and biodiversity variables)
Land cover (ISO standard) – flexible classification system provides
compatibility in terms of aggregation/disaggregation, between existing/future
monitoring, and can accommodate national circumstances
Land productivity – well-established methods for the use of vegetation
indices (NDVI) to evaluate trends in net primary productivity (NPP) –
variety of corrections techniques given national circumstances (rainfall, cloud
cover, growing season, and other inter-annual variability, etc.)
Carbon stocks – IPCC published methodology (IPCC, 2006) for carbon stocks
can be employed to estimate the change in stocks based on land cover change
or national calculations based on FAO SOC cookbook
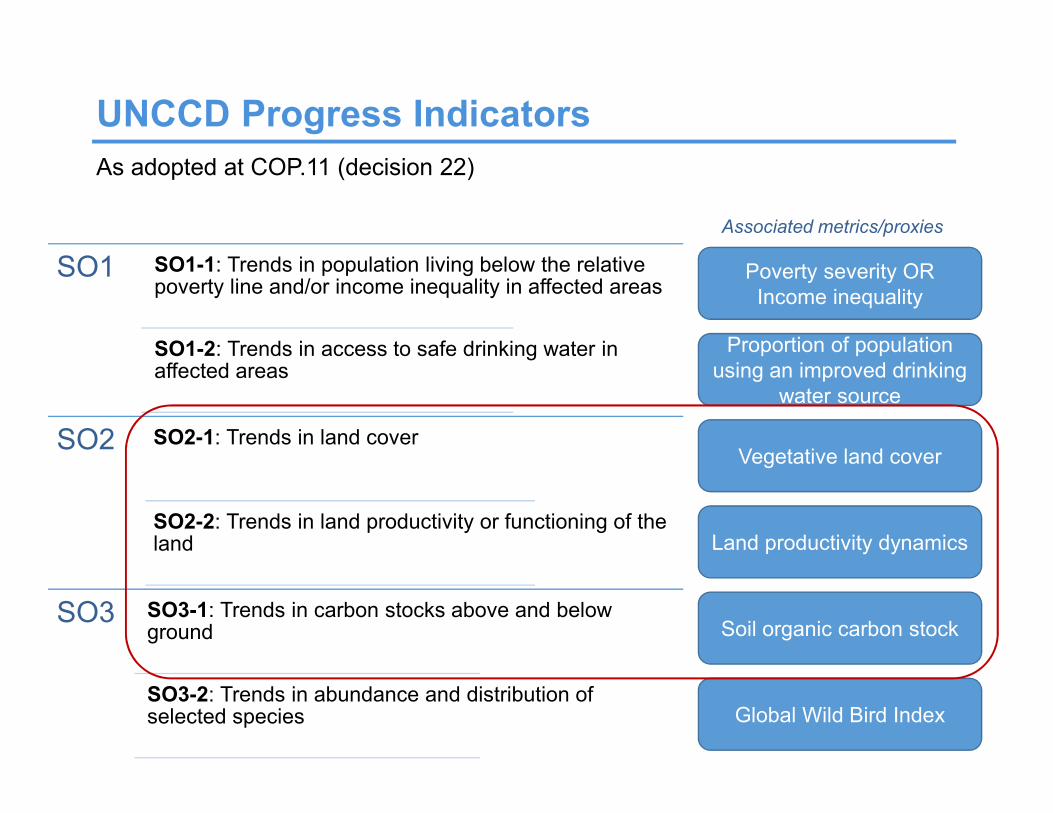
UNCCD Progress Indicators
As adopted at COP.11 (decision 22)
SO1 SO1-1: Trends in population living below the relative poverty line and/or income inequality in affected areas
SO1-2: Trends in access to safe drinking water in affected areas
SO2 SO2-1: Trends in land cover
SO2-2: Trends in land productivity or functioning of the land
SO3 SO3-1: Trends in carbon stocks above and below ground
SO3-2: Trends in abundance and distribution of selected species
Poverty severity OR
Income inequality
Proportion of population
using an improved drinking
water source
Vegetative land cover
Land productivity dynamics
Soil organic carbon stock
Global Wild Bird Index
Associated metrics/proxies

Secretariat’s Support
The COP requested the UNCCD secretariat, in cooperation with relevant
specialized institutions, to:
• Compile and make available to affected country Parties national estimates
of the metrics/proxies associated with these indicators from available
global datasets as default data for validation in accordance with the
procedure established in decision 22/COP.11;
• Prepare methodological guidelines and provide technical assistance to
affected country Parties on the compilation and use of such default data;
• Undertake measures aimed at strengthening the capacities of affected
Parties to validate, replace or reject the default data.
(decision 15/COP.12)

Responsibility of National Authorities
1. Setting the baseline to determine the initial status of the sub-indicators.
2. Detecting and validating the type of change in each of the sub-indicators per land
unit (e.g., pixel, polygon).
3. Deriving the indicator by summing all areas subject to “negative” change (i.e.,
degraded) and dividing by the total land area using “One Out, All Out” area-based
approach where if any of the sub-indicators is determined to show significant negative
change, it is considered degraded.

Good Practice Guidance
Good Practice Guidance (GPG) is now being developed based on the
established methods for deriving the three sub-indicators together with a
method of computation for SDG indicator 15.3.1
• GPG is intended to allow countries to select the most appropriate
datasets for the sub-indicators and determine their own pathway for
deriving the indicator
• Significant negative change (i.e., land degradation) is to be determined
by national authorities
External review and consultation with the IAEG-SDGs Working Group on
Geospatial Information (including GEO/CEOS), NSOs/countries (CEEA/GGIM)
and other stakeholders. Future collaboration with data providers to build
national capacities, set standards and increase frequency of reporting.

Data Collection &
AvailabilityEngaging NSOs in data collection, validation and reporting
For some countries, data on land cover are being collected by National
Statistical Systems; for many, land cover data is spread among different
statistical fields (agriculture, environment, forestry, etc.) and related agencies
or ministries. Many of national space agencies have land cover products.
For land productivity and carbon stocks, data collection remains with
specialized institutions at the national, regional and global levels.
National official data sources will be used to the greatest extent possible, and
complemented by data derived from Earth observation and geospatial
information with availability back to at least 2000.
Default data will be sent to national teams or focal points to be shared and
validated with NSOs and then reported back to the UNCCD
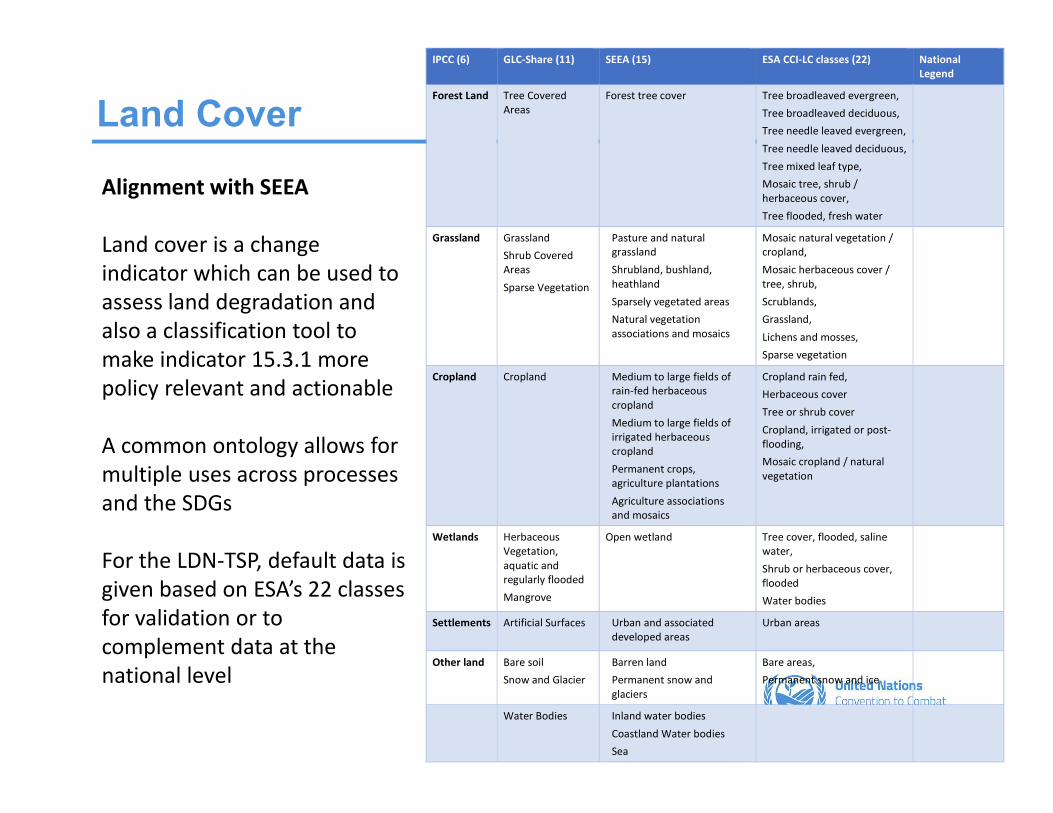
Land Cover
IPCC (6) GLC-Share (11) SEEA (15) ESA CCI-LC classes (22) National
Legend
Forest Land Tree Covered
Areas
Forest tree cover Tree broadleaved evergreen,
Tree broadleaved deciduous,
Tree needle leaved evergreen,
Tree needle leaved deciduous,
Tree mixed leaf type,
Mosaic tree, shrub /
herbaceous cover,
Tree flooded, fresh water
Grassland Grassland
Shrub Covered
Areas
Sparse Vegetation
Pasture and natural
grassland
Shrubland, bushland,
heathland
Sparsely vegetated areas
Natural vegetation
associations and mosaics
Mosaic natural vegetation /
cropland,
Mosaic herbaceous cover /
tree, shrub,
Scrublands,
Grassland,
Lichens and mosses,
Sparse vegetation
Cropland Cropland Medium to large fields of
rain-fed herbaceous
cropland
Medium to large fields of
irrigated herbaceous
cropland
Permanent crops,
agriculture plantations
Agriculture associations
and mosaics
Cropland rain fed,
Herbaceous cover
Tree or shrub cover
Cropland, irrigated or post-
flooding,
Mosaic cropland / natural
vegetation
Wetlands Herbaceous
Vegetation,
aquatic and
regularly flooded
Mangrove
Open wetland Tree cover, flooded, saline
water,
Shrub or herbaceous cover,
flooded
Water bodies
Settlements
Artificial Surfaces Urban and associated
developed areas
Urban areas
Other land Bare soil
Snow and Glacier
Barren land
Permanent snow and
glaciers
Bare areas,
Permanent snow and ice
Water Bodies Inland water bodies
Coastland Water bodies
Sea
Alignment with SEEA
Land cover is a change
indicator which can be used to
assess land degradation and
also a classification tool to
make indicator 15.3.1 more
policy relevant and actionable
A common ontology allows for
multiple uses across processes
and the SDGs
For the LDN-TSP, default data is
given based on ESA’s 22 classes
for validation or to
complement data at the
national level

Upgrading Tier Status of Indicator
Currently Tier III –methodology development to be finalized with metadata
available for review at least one month before Nov 2017 IAEG-SDGs meeting
>Engaging with NSOs in the methodological development (Short-term)
Tier II: indicator is conceptually clear, has an internationally established
methodology and standards are available but data are not regularly produced
by countries
>International standards approved by a governing body (Long-term)
Tier I: indicator is conceptually clear, has an internationally established
methodology and standards are available and data are regularly produced by
countries (>50%)
The Way Forward
Engage NSOs where there is a convergence of SEEA pilot and LDN-TSP countries (8-10)
Ask CEEA members (30) to formalize collaboration and help validate methodology at
country level as we seek to align reporting processes and create int’l standards
Engage with NSO representatives involved in LDN-TSP national teams (~50)
The GPG and metadata document
The UNCEEA and in particular its technical committee, which has been established
to work on advancing the methodology of the SEEA, could serve as one body to
engage the statistical community considering its membership and its mandate.
• Review the revised GPG to be made available in mid-July
• Review and support for the revised metadata document to be submitted to IAEG-
SDGs in mid-September