Embed Size (px)
Citation preview
SDAccel EnvironmentDebugging Guide
UG1281 (v2018.2) June 6, 2018
ATTENTION! SDAccel Development Environment 2018.2 XDF users: Click here to view the 2018.2.xdf version of this guide.
Revision HistoryThe following table shows the revision history for this document.
Section Revision Summary06/06/2018 Version 2018.2
General updates Initial Xilinx release.
Revision History
UG1281 (v2018.2) June 6, 2018 www.xilinx.com [placeholder text]SDAccel Debugging Guide 2Send Feedback
Table of ContentsRevision History...............................................................................................................2
Chapter 1: Introduction to Debugging in SDAccel.......................................4Execution Model of an SDAccel Application.............................................................................4SDAccel Build Process................................................................................................................. 6SDAccel Debug Flow Overview.................................................................................................. 8
Chapter 2: SDAccel Debug Features................................................................... 12SDAccel Software Debug.......................................................................................................... 12Utilities for Hardware Debugging........................................................................................... 19Hardware Debugging Using ChipScope.................................................................................21
Chapter 3: Debug Techniques................................................................................25Functional Verification (Software Emulation)........................................................................ 25Debugging in Hardware Emulation........................................................................................ 29System Verification, Hardware Hangs.................................................................................... 33
Appendix A: Additional Resources and Legal Notices............................. 47Xilinx Resources.........................................................................................................................47Documentation Navigator and Design Hubs.........................................................................47References..................................................................................................................................48Please Read: Important Legal Notices................................................................................... 49
UG1281 (v2018.2) June 6, 2018 www.xilinx.com [placeholder text]SDAccel Debugging Guide 3Send Feedback
Chapter 1
Introduction to Debugging inSDAccel
This book is intended to introduce the SDAccel™ debugging capabilities. The goal is to providedetailed instructions on how to analyze any failure encountered within the SDAccel flow. It isimportant to note, if no tool problem is encountered and the behavior of the design is deemedfunctionally correct, you should look for answers in the SDAccel Environment Profiling andOptimization Guide (UG1207) to determine if the performance of the design can be furtherimproved.
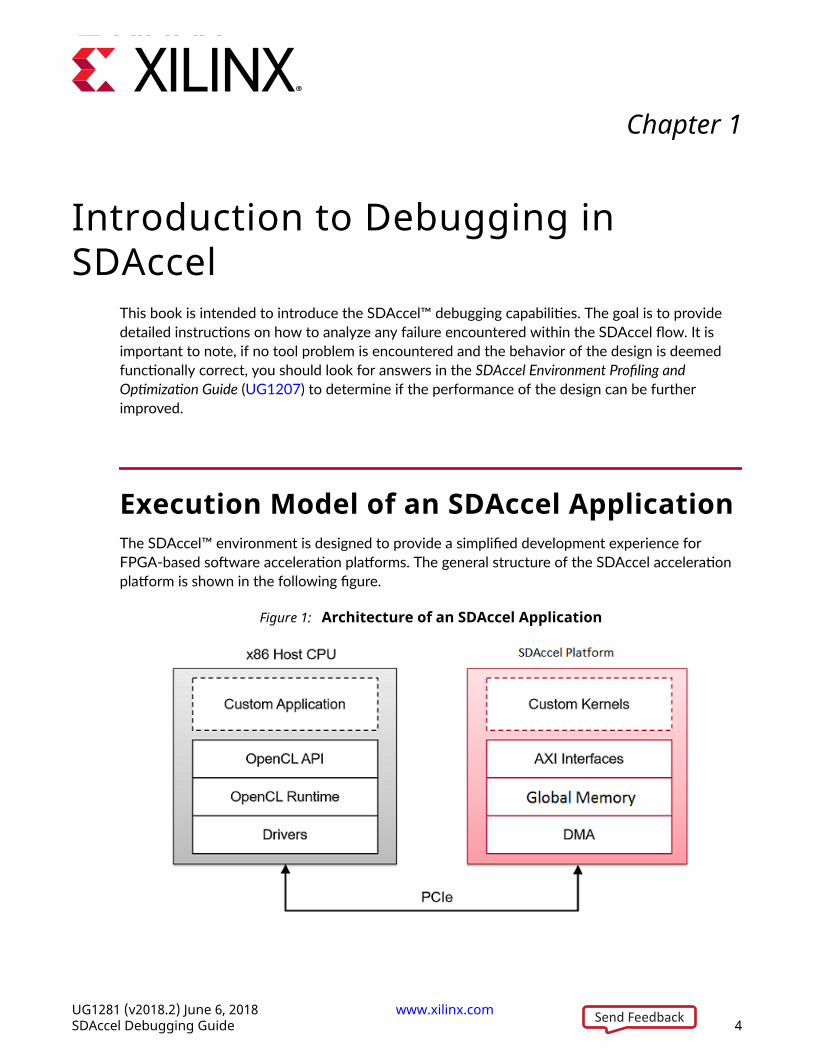
Execution Model of an SDAccel ApplicationThe SDAccel™ environment is designed to provide a simplified development experience forFPGA-based software acceleration platforms. The general structure of the SDAccel accelerationplatform is shown in the following figure.
Figure 1: Architecture of an SDAccel Application
Chapter 1: Introduction to Debugging in SDAccel
UG1281 (v2018.2) June 6, 2018 www.xilinx.com [placeholder text]SDAccel Debugging Guide 4Send Feedback
The custom application is running on the host x86 server and uses OpenCL™ API calls to interactwith the FPGA accelerators. The SDAccel run time manages those interactions. The application iswritten in C/C++ using OpenCL APIs. The custom kernels are running within a Xilinx® FPGAthrough the SDAccel run time that manages interactions between the host application and theaccelerator. Communication between the host x86 machine and the SDAccel accelerator boardoccurs across the PCIe® bus.
The SDAccel hardware platform contains global memory banks. The data transfer from the hostmachine to kernels and from kernels to the host happens through these global memory banks.The kernels running on the FPGA can have one or more memory interfaces. The connection fromthe memory banks to those memory interfaces are programmable and determined by linkingoptions of the compiler.
The SDAccel execution model follows these steps:
1. The host application writes the data needed by a kernel into the global memory of theSDAccel hardware platform, through the PCIe interface.
2. The host programs the kernel with its input parameters.
3. The host application triggers the execution of the kernel function on the FPGA.
4. The kernel performs the required computation, reading and writing data from global memoryas necessary.
5. Kernels write data back to the memory banks, and notify the host that it has completed itstask.
6. The host application reads data back from global memory into the host memory space, andcontinues processing as needed.
The FPGA can accommodate multiple kernel instances at one time; either different types ofkernels or multiple instances of the same kernel. The SDAccel OpenCL run time transparentlyorchestrates the communication between the host application and the kernels in the FPGAs. Thenumber of instances of a kernel is variable and determined by the host program and compilationoptions.
Chapter 1: Introduction to Debugging in SDAccel
UG1281 (v2018.2) June 6, 2018 www.xilinx.com [placeholder text]SDAccel Debugging Guide 5Send Feedback
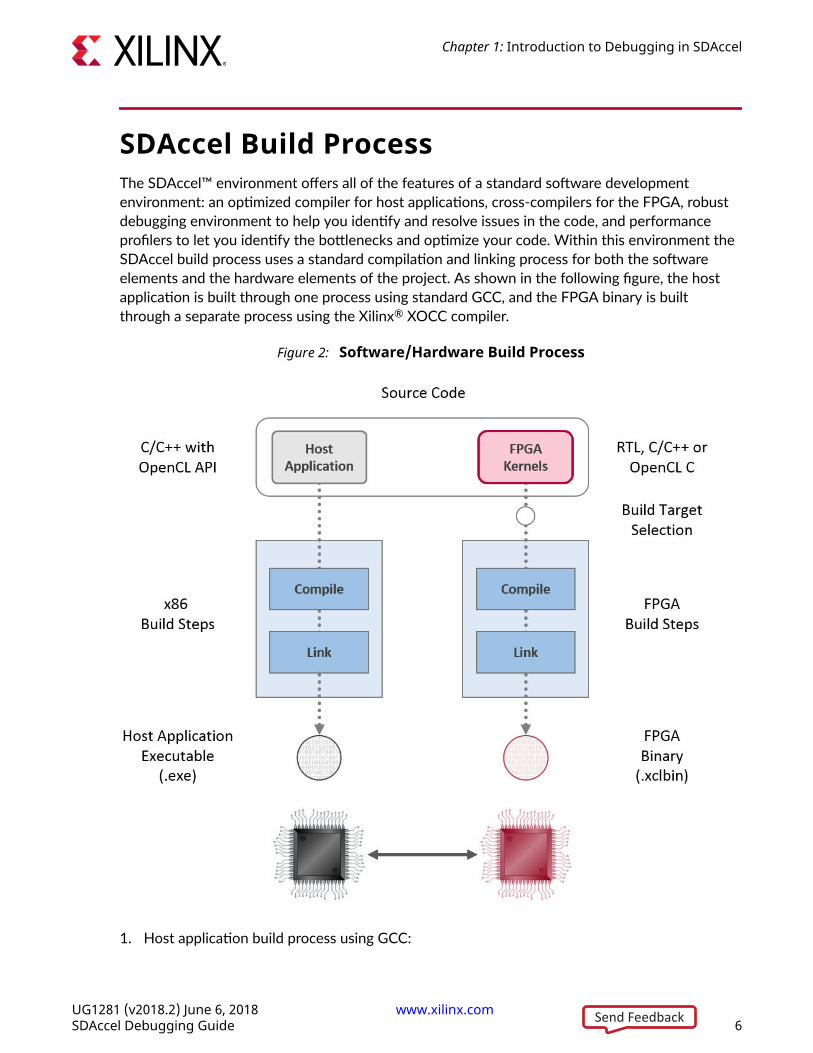
SDAccel Build ProcessThe SDAccel™ environment offers all of the features of a standard software developmentenvironment: an optimized compiler for host applications, cross-compilers for the FPGA, robustdebugging environment to help you identify and resolve issues in the code, and performanceprofilers to let you identify the bottlenecks and optimize your code. Within this environment theSDAccel build process uses a standard compilation and linking process for both the softwareelements and the hardware elements of the project. As shown in the following figure, the hostapplication is built through one process using standard GCC, and the FPGA binary is builtthrough a separate process using the Xilinx® XOCC compiler.
Figure 2: Software/Hardware Build Process
1. Host application build process using GCC:
Chapter 1: Introduction to Debugging in SDAccel
UG1281 (v2018.2) June 6, 2018 www.xilinx.com [placeholder text]SDAccel Debugging Guide 6Send Feedback
• Each host application source file is compiled to an object file (.o).
• The object files (.o) are linked with the Xilinx SDAccel runtime shared library to create theexecutable (.exe).
2. FPGA build process using XOCC:
• Each kernel is independently compiled to a Xilinx object (.xo) file.
○ C/C++ and OpenCL C kernels are compiled for implementation on an FPGA using theXOCC compiler. This step leverages the Vivado® HLS compiler. The same pragmas andattributes supported by Vivado HLS can be used in C/C++ and OpenCL C kernel sourcecode to specify the desired kernel micro-architecture and control the result of thecompilation process.
○ RTL kernels are compiled using the package_xo utility. The RTL kernel wizard in theSDAccel environment can be used to simplify this process.
• The kernel .xo files are linked with the hardware platform (.dsa) to create the FPGAbinary (.xclbin). Important architectural aspects are determined during the link step. Inparticular, this is where connections from kernel ports to global memory banks areestablished and where the number of instances for each kernel is specified.
○ When the build target is software or hardware emulation, as described below, xoccgenerates simulation models of the device contents.
○ When the build target is the system, or actual hardware, xocc generates the FPGAbinary for the device leveraging the Vivado® Design Suite to run synthesis andimplementation.
Note: The xocc compiler automatically uses the Vivado HLS and Vivado Design Suite tools to build thekernels to run on the FPGA platform. It uses these tools with pre-defined settings which have proven toprovide good quality of results. Using the SDAccel environment and the xocc compiler does not requireknowledge of these tools. However, hardware savvy developers can fully leverage these tools and use alltheir available features to implement kernels.
Build Targets
The SDAccel build process generates the host application executable (.exe) and the FPGAbinary (.xclbin). The SDAccel build target defines the nature of FPGA binary generated by thebuild process.
SDAccel provides three different build targets, two emulation targets used for debug andvalidation purposes and the default hardware target used to generate the actual FPGA binary:
• Software Emulation (sw_emu): Both the host application code and the kernel code arecompiled to run on the x86 processor. This allows iterative algorithm refinement through fastbuild and run loops. This target is useful to identify syntax issues, perform source-leveldebugging of the kernel code running together with application and verify the behavior of thesystem.
Chapter 1: Introduction to Debugging in SDAccel
UG1281 (v2018.2) June 6, 2018 www.xilinx.com [placeholder text]SDAccel Debugging Guide 7Send Feedback
• Hardware Emulation (hw_emu): The kernel code is compiled into a hardware model (RTL)which is run in a dedicated simulator. This build and run loop takes longer but provides adetailed, cycle-accurate, view of kernel activity. This target is useful for testing thefunctionality of the logic that will go in the FPGA and for getting initial performanceestimates.
• System (hw): The kernel code is compiled into a hardware model (RTL) and is thenimplemented on the FPGA device, resulting in a binary that will run on the actual FPGA.
SDAccel Debug Flow OverviewThis section presents the general debug flow of SDAccel™. It will take the reader through thegeneral steps of a proven development process. This process allows the user to focus rapidly onpotential errors in the design. This sets the baseline for developers indicating where to start if anerror occurs in their adopted development steps.
The Debug Flow described here assumes that an SDAccel platform board is installed and theinitial setup checks have passed. It is possible to configure the SDAccel environment to workwith custom hardware platforms that will require a platform DSA which defines the foundationalcomponents of the board.
The SDAccel™ environment provides application-level debug features which allow the host code,the kernel code, and the interactions between them to be efficiently debugged. Therecommended application-level debugging flow consists of three levels of debugging that can besummarized as:
1. Software Emulation
2. Hardware Emulation
3. Hardware Execution
This three-tiered approach allows debugging the host and kernel code, and their interactions, atdifferent levels of abstraction. Each of the execution models described below are supportedthrough the SDAccel GUI as well as through a batch flow using basic compile time and run-timesetup options.
Software Emulation
Purpose: Algorithm verification
Execution Model: During software emulation, all processes are running pure C/C++ models.OpenCL™ Kernel models are transformed to execute concurrently.
Chapter 1: Introduction to Debugging in SDAccel
UG1281 (v2018.2) June 6, 2018 www.xilinx.com [placeholder text]SDAccel Debugging Guide 8Send Feedback
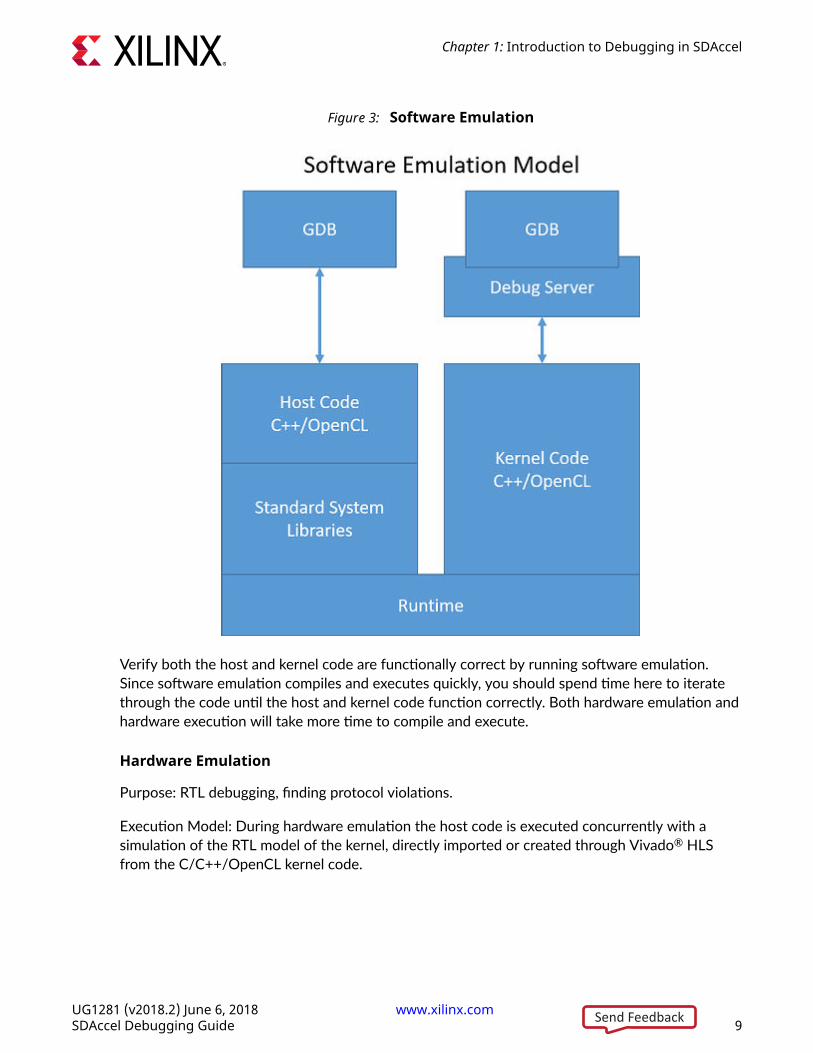
Figure 3: Software Emulation
Verify both the host and kernel code are functionally correct by running software emulation.Since software emulation compiles and executes quickly, you should spend time here to iteratethrough the code until the host and kernel code function correctly. Both hardware emulation andhardware execution will take more time to compile and execute.
Hardware Emulation
Purpose: RTL debugging, finding protocol violations.
Execution Model: During hardware emulation the host code is executed concurrently with asimulation of the RTL model of the kernel, directly imported or created through Vivado® HLSfrom the C/C++/OpenCL kernel code.
Chapter 1: Introduction to Debugging in SDAccel
UG1281 (v2018.2) June 6, 2018 www.xilinx.com [placeholder text]SDAccel Debugging Guide 9Send Feedback
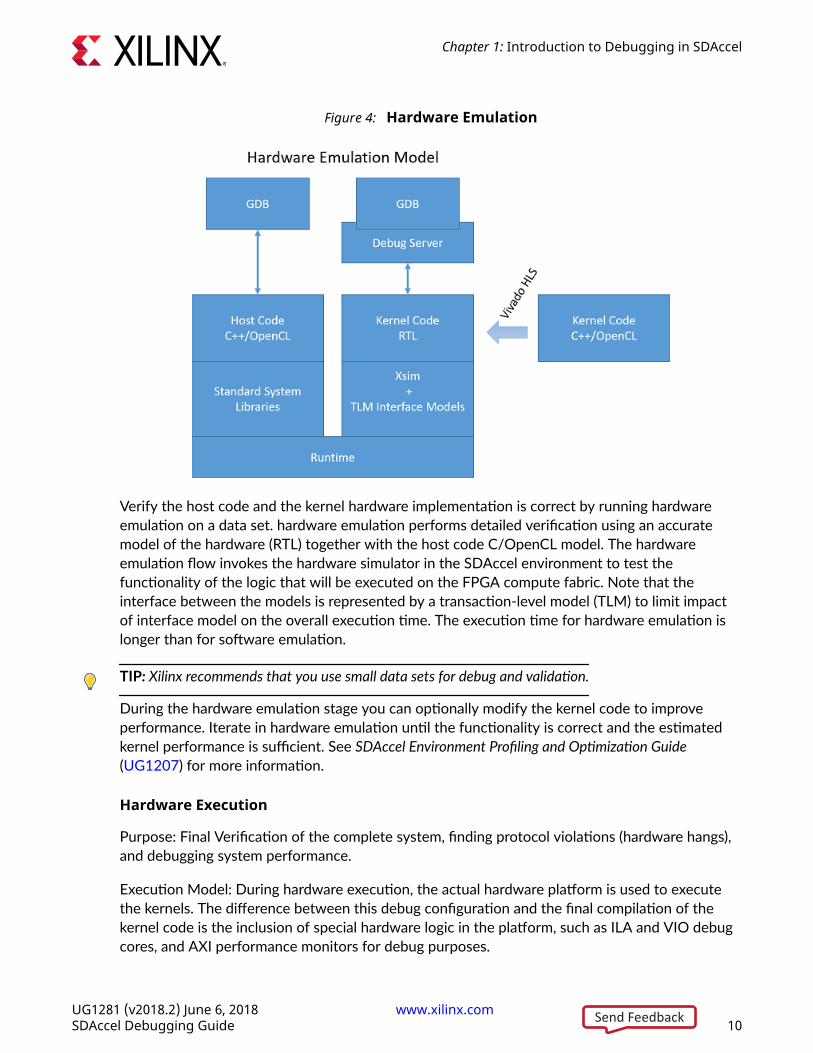
Figure 4: Hardware Emulation
Verify the host code and the kernel hardware implementation is correct by running hardwareemulation on a data set. hardware emulation performs detailed verification using an accuratemodel of the hardware (RTL) together with the host code C/OpenCL model. The hardwareemulation flow invokes the hardware simulator in the SDAccel environment to test thefunctionality of the logic that will be executed on the FPGA compute fabric. Note that theinterface between the models is represented by a transaction-level model (TLM) to limit impactof interface model on the overall execution time. The execution time for hardware emulation islonger than for software emulation.
TIP: Xilinx recommends that you use small data sets for debug and validation.
During the hardware emulation stage you can optionally modify the kernel code to improveperformance. Iterate in hardware emulation until the functionality is correct and the estimatedkernel performance is sufficient. See SDAccel Environment Profiling and Optimization Guide(UG1207) for more information.
Hardware Execution
Purpose: Final Verification of the complete system, finding protocol violations (hardware hangs),and debugging system performance.
Execution Model: During hardware execution, the actual hardware platform is used to executethe kernels. The difference between this debug configuration and the final compilation of thekernel code is the inclusion of special hardware logic in the platform, such as ILA and VIO debugcores, and AXI performance monitors for debug purposes.
Chapter 1: Introduction to Debugging in SDAccel
UG1281 (v2018.2) June 6, 2018 www.xilinx.com [placeholder text]SDAccel Debugging Guide 10Send Feedback
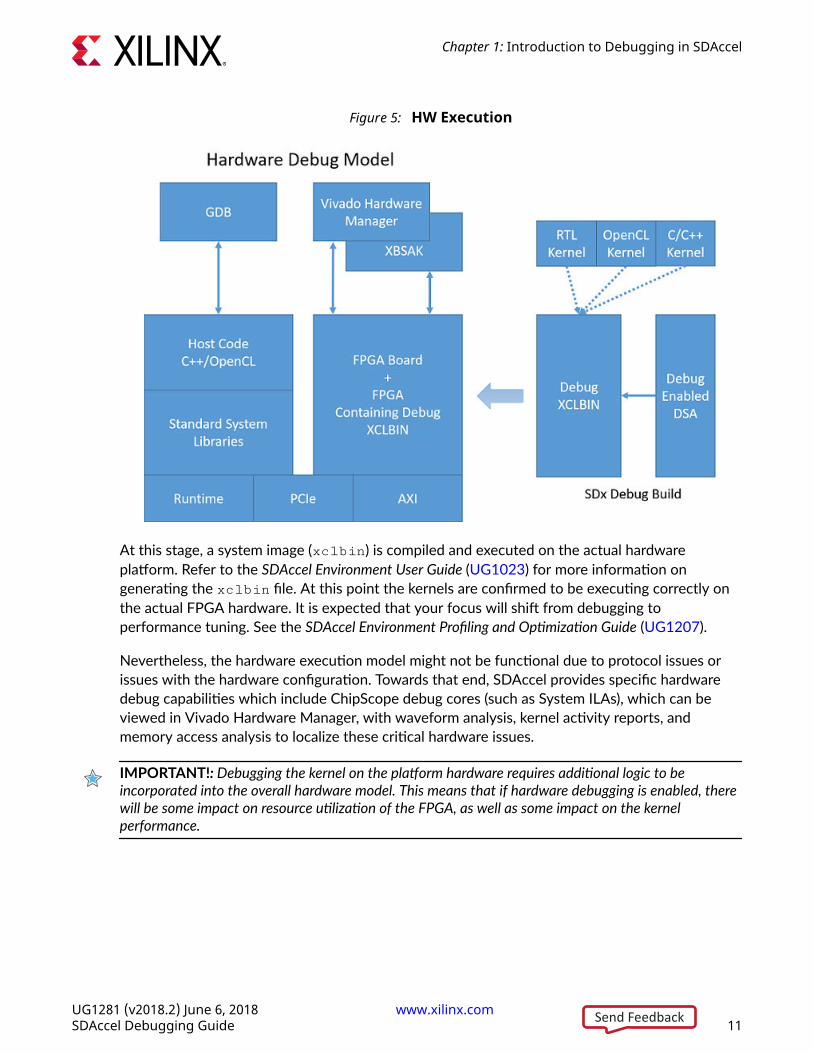
Figure 5: HW Execution
At this stage, a system image (xclbin) is compiled and executed on the actual hardwareplatform. Refer to the SDAccel Environment User Guide (UG1023) for more information ongenerating the xclbin file. At this point the kernels are confirmed to be executing correctly onthe actual FPGA hardware. It is expected that your focus will shift from debugging toperformance tuning. See the SDAccel Environment Profiling and Optimization Guide (UG1207).
Nevertheless, the hardware execution model might not be functional due to protocol issues orissues with the hardware configuration. Towards that end, SDAccel provides specific hardwaredebug capabilities which include ChipScope debug cores (such as System ILAs), which can beviewed in Vivado Hardware Manager, with waveform analysis, kernel activity reports, andmemory access analysis to localize these critical hardware issues.
IMPORTANT!: Debugging the kernel on the platform hardware requires additional logic to beincorporated into the overall hardware model. This means that if hardware debugging is enabled, therewill be some impact on resource utilization of the FPGA, as well as some impact on the kernelperformance.
Chapter 1: Introduction to Debugging in SDAccel
UG1281 (v2018.2) June 6, 2018 www.xilinx.com [placeholder text]SDAccel Debugging Guide 11Send Feedback
Chapter 2
SDAccel Debug FeaturesIn this chapter, you will examine different features of the SDAccel™ environment supportingdebugging efforts. This chapter introduces the debugging tools available to analyze the projectand perform debugging. The next chapter illustrates debug techniques using the featuresdescribed here.
SDAccel Software DebugSDAccel™ supports typical software-like debugging for the host as well as kernel code. This flowis supported during software and hardware emulation and allows the use of break points and theanalysis of variables as commonly done during software debugging.
Note: The host code can still be debugged in this mode even when the actual hardware is executed.
GUI Debug FlowRunning SDAccel™ in the GUI flow provides easy access to the debug capabilities. As shown in Debug Command Line Flow, setting up an executable for debugging requires many steps whenperformed manually. These steps are handled by the GUI when you use the GUI Debug Flow.
Note: The SDAccel Debug Flow uses several different shells during debugging. This requires that the shellsetup scripts such as .bashrc or .cshrc do not interfere with the SDAccel Setup such as theLD_LIBRARY_PATH.
Preparing the executable for debugging requires that you change the build configurations toenable the application of debug flags. You can set these options through the Project View. Thereare two check boxes provided in the Options section for the active build configuration. Oneenables host debug builds while the other enables debugging of the kernels. The checkboxes arenamed Host debug and Kernel debug respectively.
Chapter 2: SDAccel Debug Features
UG1281 (v2018.2) June 6, 2018 www.xilinx.com [placeholder text]SDAccel Debugging Guide 12Send Feedback
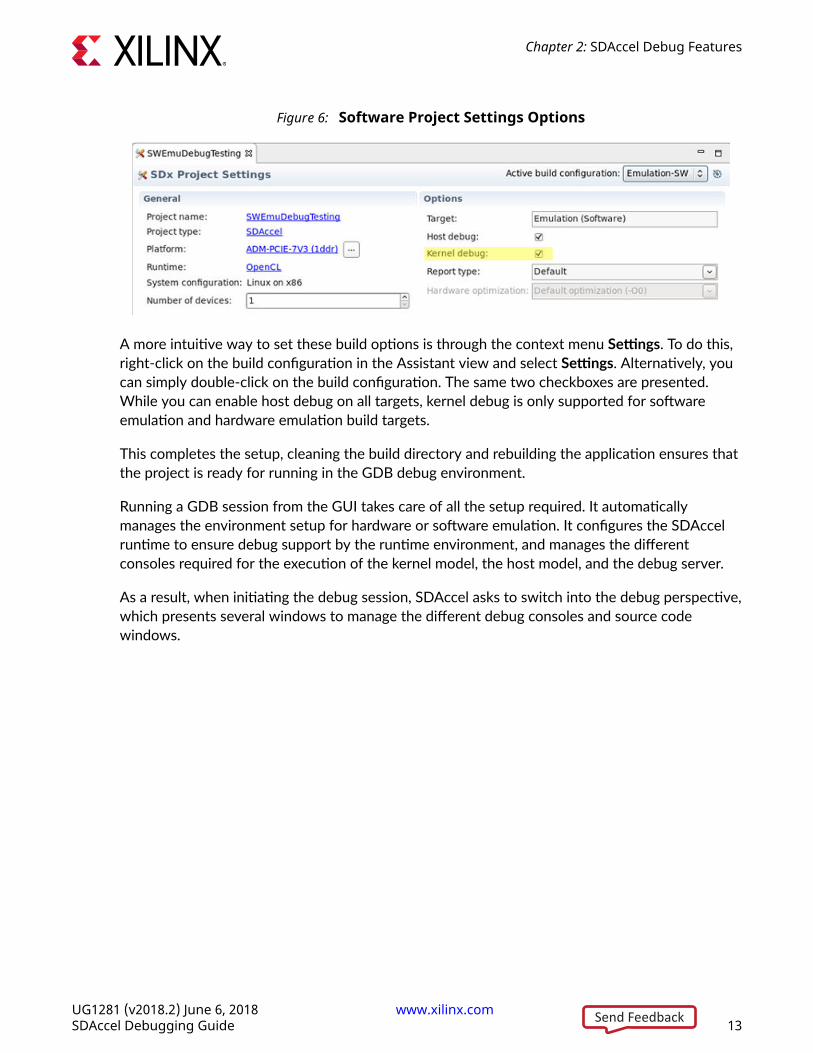
Figure 6: Software Project Settings Options
A more intuitive way to set these build options is through the context menu Settings. To do this,right-click on the build configuration in the Assistant view and select Settings. Alternatively, youcan simply double-click on the build configuration. The same two checkboxes are presented.While you can enable host debug on all targets, kernel debug is only supported for softwareemulation and hardware emulation build targets.
This completes the setup, cleaning the build directory and rebuilding the application ensures thatthe project is ready for running in the GDB debug environment.
Running a GDB session from the GUI takes care of all the setup required. It automaticallymanages the environment setup for hardware or software emulation. It configures the SDAccelruntime to ensure debug support by the runtime environment, and manages the differentconsoles required for the execution of the kernel model, the host model, and the debug server.
As a result, when initiating the debug session, SDAccel asks to switch into the debug perspective,which presents several windows to manage the different debug consoles and source codewindows.
Chapter 2: SDAccel Debug Features
UG1281 (v2018.2) June 6, 2018 www.xilinx.com [placeholder text]SDAccel Debugging Guide 13Send Feedback
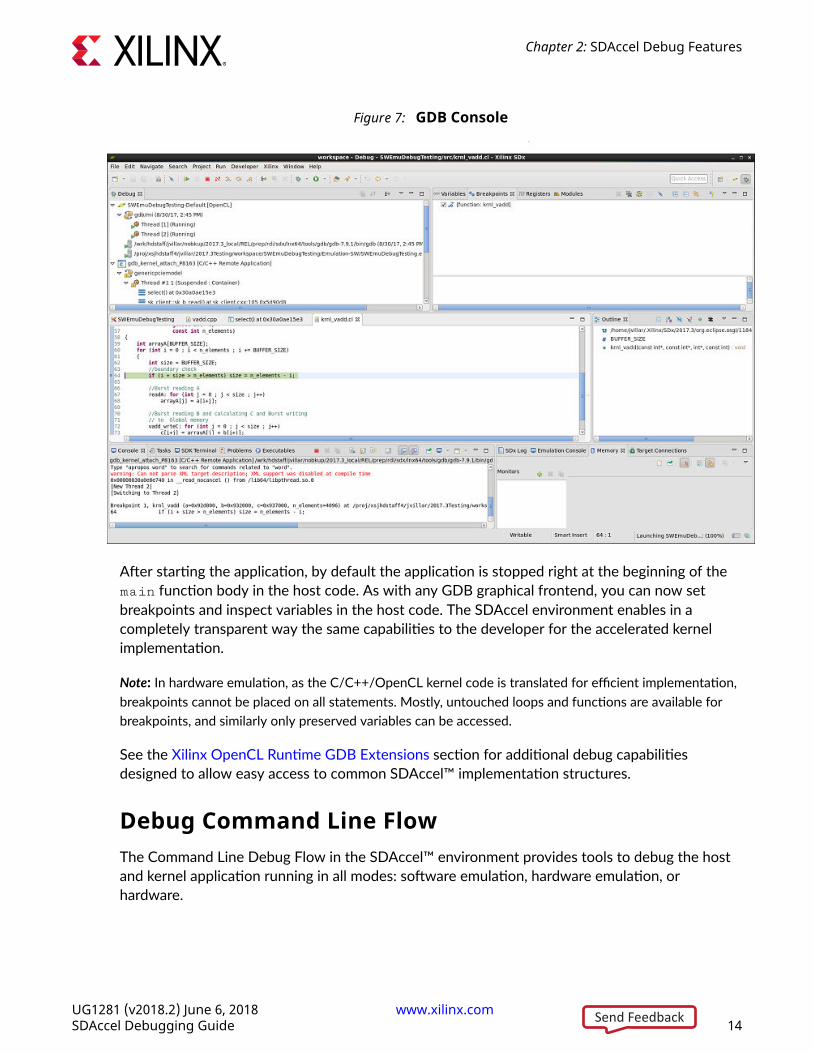
Figure 7: GDB Console
After starting the application, by default the application is stopped right at the beginning of themain function body in the host code. As with any GDB graphical frontend, you can now setbreakpoints and inspect variables in the host code. The SDAccel environment enables in acompletely transparent way the same capabilities to the developer for the accelerated kernelimplementation.
Note: In hardware emulation, as the C/C++/OpenCL kernel code is translated for efficient implementation,breakpoints cannot be placed on all statements. Mostly, untouched loops and functions are available forbreakpoints, and similarly only preserved variables can be accessed.
See the Xilinx OpenCL Runtime GDB Extensions section for additional debug capabilitiesdesigned to allow easy access to common SDAccel™ implementation structures.
Debug Command Line FlowThe Command Line Debug Flow in the SDAccel™ environment provides tools to debug the hostand kernel application running in all modes: software emulation, hardware emulation, orhardware.
Chapter 2: SDAccel Debug Features
UG1281 (v2018.2) June 6, 2018 www.xilinx.com [placeholder text]SDAccel Debugging Guide 14Send Feedback
Note: The host code can be debugged using this feature in the hardware execution mode only.
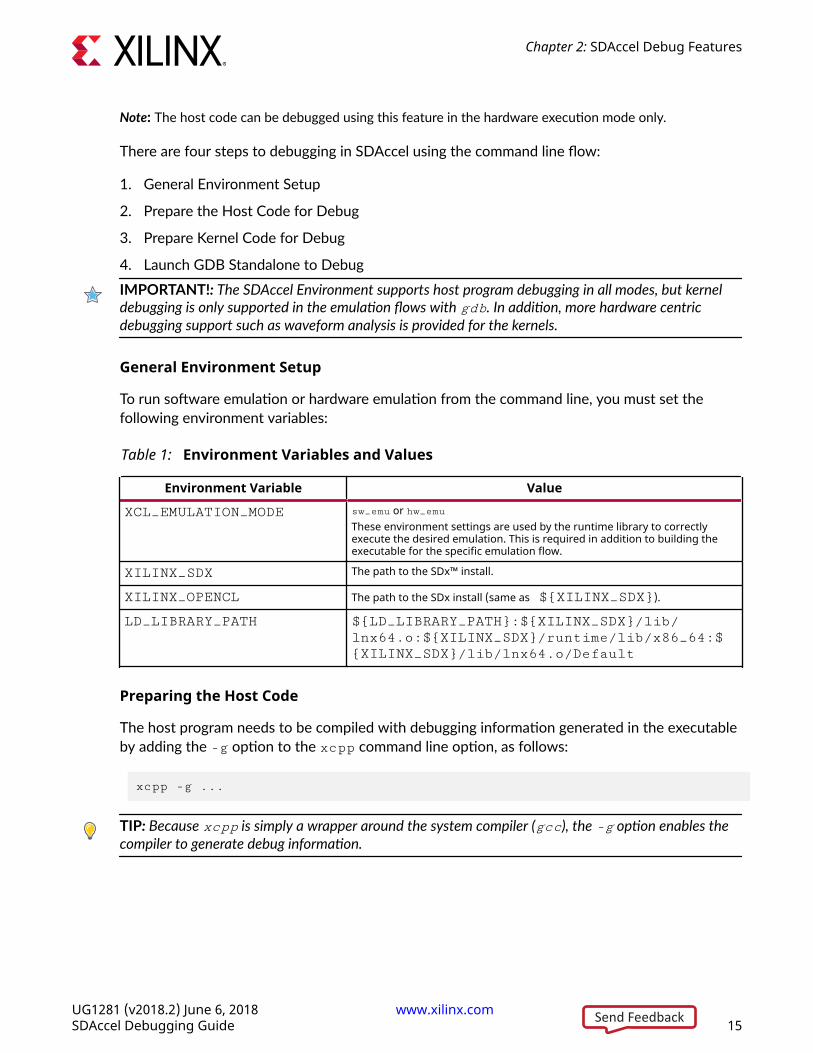
There are four steps to debugging in SDAccel using the command line flow:
1. General Environment Setup
2. Prepare the Host Code for Debug
3. Prepare Kernel Code for Debug
4. Launch GDB Standalone to Debug
IMPORTANT!: The SDAccel Environment supports host program debugging in all modes, but kerneldebugging is only supported in the emulation flows with gdb. In addition, more hardware centricdebugging support such as waveform analysis is provided for the kernels.
General Environment Setup
To run software emulation or hardware emulation from the command line, you must set thefollowing environment variables:
Table 1: Environment Variables and Values
Environment Variable Value
XCL_EMULATION_MODE sw_emu or hw_emuThese environment settings are used by the runtime library to correctlyexecute the desired emulation. This is required in addition to building theexecutable for the specific emulation flow.
XILINX_SDX The path to the SDx™ install.
XILINX_OPENCL The path to the SDx install (same as ${XILINX_SDX}).
LD_LIBRARY_PATH ${LD_LIBRARY_PATH}:${XILINX_SDX}/lib/lnx64.o:${XILINX_SDX}/runtime/lib/x86_64:${XILINX_SDX}/lib/lnx64.o/Default
Preparing the Host Code
The host program needs to be compiled with debugging information generated in the executableby adding the -g option to the xcpp command line option, as follows:
xcpp -g ...
TIP: Because xcpp is simply a wrapper around the system compiler (gcc), the -g option enables thecompiler to generate debug information.
Chapter 2: SDAccel Debug Features
UG1281 (v2018.2) June 6, 2018 www.xilinx.com [placeholder text]SDAccel Debugging Guide 15Send Feedback
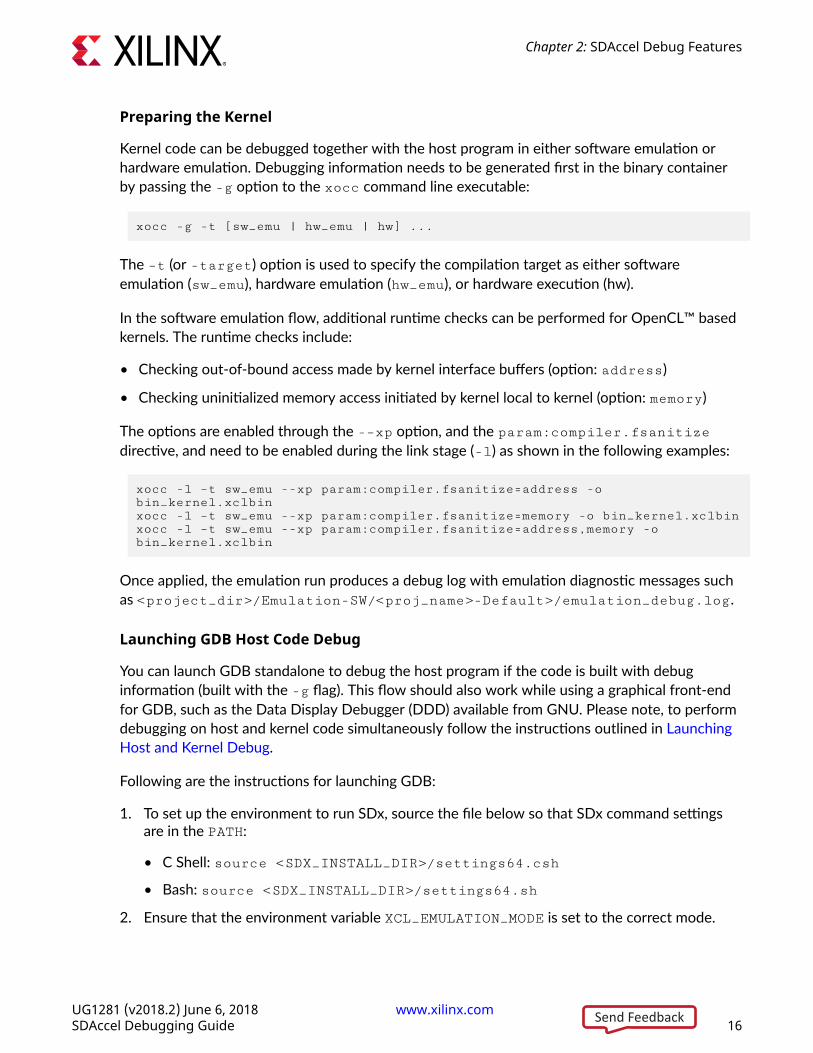
Preparing the Kernel
Kernel code can be debugged together with the host program in either software emulation orhardware emulation. Debugging information needs to be generated first in the binary containerby passing the -g option to the xocc command line executable:
xocc -g -t [sw_emu | hw_emu | hw] ...
The –t (or -target) option is used to specify the compilation target as either softwareemulation (sw_emu), hardware emulation (hw_emu), or hardware execution (hw).
In the software emulation flow, additional runtime checks can be performed for OpenCL™ basedkernels. The runtime checks include:
• Checking out-of-bound access made by kernel interface buffers (option: address)
• Checking uninitialized memory access initiated by kernel local to kernel (option: memory)
The options are enabled through the -–xp option, and the param:compiler.fsanitizedirective, and need to be enabled during the link stage (-l) as shown in the following examples:
xocc -l –t sw_emu --xp param:compiler.fsanitize=address -o bin_kernel.xclbinxocc -l –t sw_emu --xp param:compiler.fsanitize=memory -o bin_kernel.xclbinxocc -l –t sw_emu --xp param:compiler.fsanitize=address,memory -o bin_kernel.xclbin
Once applied, the emulation run produces a debug log with emulation diagnostic messages suchas <project_dir>/Emulation-SW/<proj_name>-Default>/emulation_debug.log.
Launching GDB Host Code Debug
You can launch GDB standalone to debug the host program if the code is built with debuginformation (built with the -g flag). This flow should also work while using a graphical front-endfor GDB, such as the Data Display Debugger (DDD) available from GNU. Please note, to performdebugging on host and kernel code simultaneously follow the instructions outlined in LaunchingHost and Kernel Debug.
Following are the instructions for launching GDB:
1. To set up the environment to run SDx, source the file below so that SDx command settingsare in the PATH:
• C Shell: source <SDX_INSTALL_DIR>/settings64.csh
• Bash: source <SDX_INSTALL_DIR>/settings64.sh
2. Ensure that the environment variable XCL_EMULATION_MODE is set to the correct mode.
Chapter 2: SDAccel Debug Features
UG1281 (v2018.2) June 6, 2018 www.xilinx.com [placeholder text]SDAccel Debugging Guide 16Send Feedback
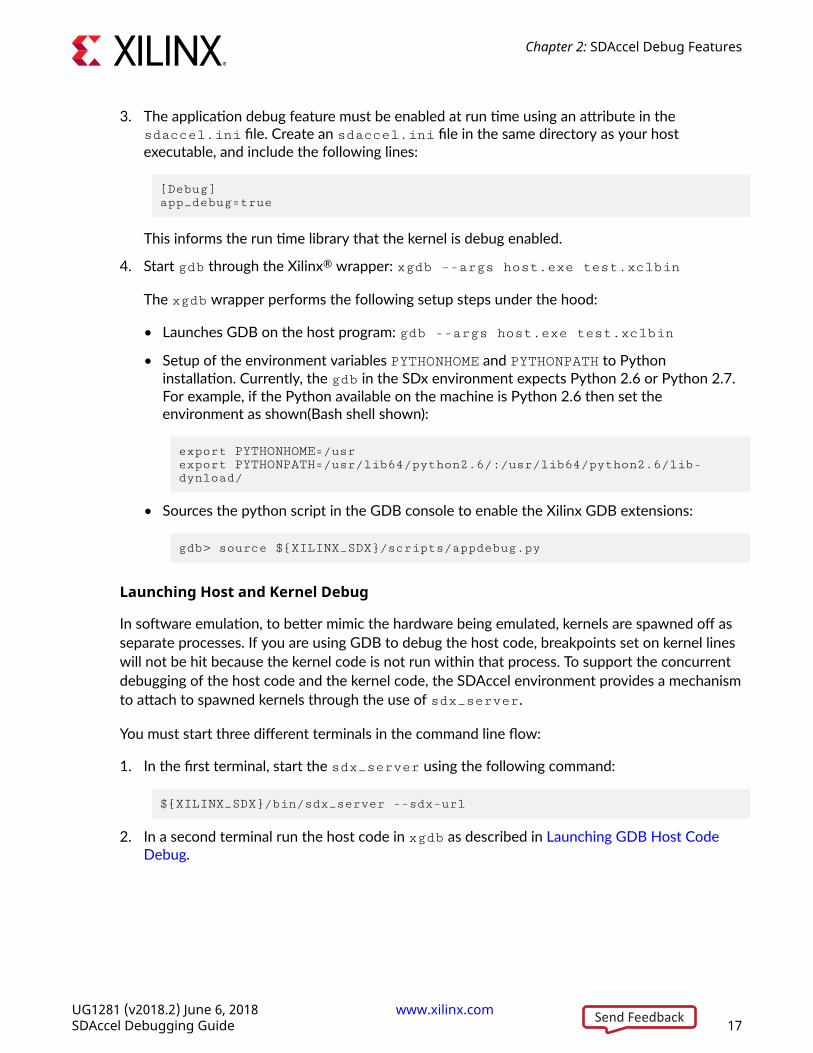
3. The application debug feature must be enabled at run time using an attribute in thesdaccel.ini file. Create an sdaccel.ini file in the same directory as your hostexecutable, and include the following lines:
[Debug]app_debug=true
This informs the run time library that the kernel is debug enabled.
4. Start gdb through the Xilinx® wrapper: xgdb –-args host.exe test.xclbin
The xgdb wrapper performs the following setup steps under the hood:
• Launches GDB on the host program: gdb --args host.exe test.xclbin
• Setup of the environment variables PYTHONHOME and PYTHONPATH to Pythoninstallation. Currently, the gdb in the SDx environment expects Python 2.6 or Python 2.7.For example, if the Python available on the machine is Python 2.6 then set theenvironment as shown(Bash shell shown):
export PYTHONHOME=/usr export PYTHONPATH=/usr/lib64/python2.6/:/usr/lib64/python2.6/lib-dynload/
• Sources the python script in the GDB console to enable the Xilinx GDB extensions:
gdb> source ${XILINX_SDX}/scripts/appdebug.py
Launching Host and Kernel Debug
In software emulation, to better mimic the hardware being emulated, kernels are spawned off asseparate processes. If you are using GDB to debug the host code, breakpoints set on kernel lineswill not be hit because the kernel code is not run within that process. To support the concurrentdebugging of the host code and the kernel code, the SDAccel environment provides a mechanismto attach to spawned kernels through the use of sdx_server.
You must start three different terminals in the command line flow:
1. In the first terminal, start the sdx_server using the following command:
${XILINX_SDX}/bin/sdx_server --sdx-url
2. In a second terminal run the host code in xgdb as described in Launching GDB Host CodeDebug.
Chapter 2: SDAccel Debug Features
UG1281 (v2018.2) June 6, 2018 www.xilinx.com [placeholder text]SDAccel Debugging Guide 17Send Feedback
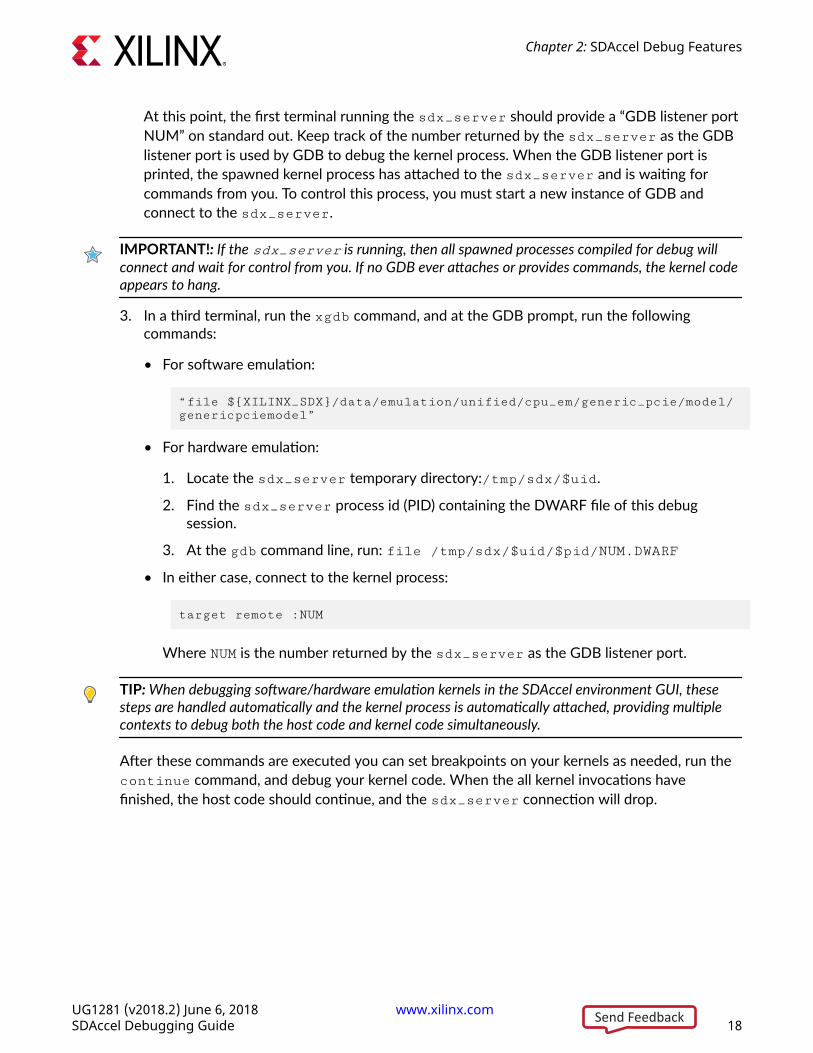
At this point, the first terminal running the sdx_server should provide a “GDB listener portNUM” on standard out. Keep track of the number returned by the sdx_server as the GDBlistener port is used by GDB to debug the kernel process. When the GDB listener port isprinted, the spawned kernel process has attached to the sdx_server and is waiting forcommands from you. To control this process, you must start a new instance of GDB andconnect to the sdx_server.
IMPORTANT!: If the sdx_server is running, then all spawned processes compiled for debug willconnect and wait for control from you. If no GDB ever attaches or provides commands, the kernel codeappears to hang.
3. In a third terminal, run the xgdb command, and at the GDB prompt, run the followingcommands:
• For software emulation:
“file ${XILINX_SDX}/data/emulation/unified/cpu_em/generic_pcie/model/genericpciemodel”
• For hardware emulation:
1. Locate the sdx_server temporary directory:/tmp/sdx/$uid.
2. Find the sdx_server process id (PID) containing the DWARF file of this debugsession.
3. At the gdb command line, run: file /tmp/sdx/$uid/$pid/NUM.DWARF
• In either case, connect to the kernel process:
target remote :NUM
Where NUM is the number returned by the sdx_server as the GDB listener port.
TIP: When debugging software/hardware emulation kernels in the SDAccel environment GUI, thesesteps are handled automatically and the kernel process is automatically attached, providing multiplecontexts to debug both the host code and kernel code simultaneously.
After these commands are executed you can set breakpoints on your kernels as needed, run thecontinue command, and debug your kernel code. When the all kernel invocations havefinished, the host code should continue, and the sdx_server connection will drop.
Chapter 2: SDAccel Debug Features
UG1281 (v2018.2) June 6, 2018 www.xilinx.com [placeholder text]SDAccel Debugging Guide 18Send Feedback
For both software and hardware emulation flows, there are restrictions with respect to theaccelerated kernel code debug interactions. As this code is preprocessed, in the softwareemulation flow and actually translated in the hardware emulation flow into a hardwaredescription language (HDL) and simulated during debugging, it is not always possible to setbreakpoints at all locations. Especially with hardware emulation, only a limited number ofbreakpoints such as on preserved loops and functions are supported. Nevertheless, this mode isuseful to debug the kernel/host interface.
Utilities for Hardware DebuggingIn some cases, the normal GUI and Command Line debug features are limited in their ability toisolate an issue. This is especially true when the software / hardware appears to locked up andnot making any progress (hang). These kinds of system issues are best analyzed with the help ofthe utilities mentioned in this section.
Using Linux "dmesg"Well designed Linux kernels and modules report issues through the kernel ring buffer. This is alsotrue for SDAccel™ modules that allow the user to debug on the lowest linux level the interactionwith the accelerator board.
Note: This utility intended for use in Hardware Debug only.
TIP: In most cases, it is sufficient to work with the less verbose xbsak feature to localize a problem.Refer to the SDx Command and Utility Reference Guide (UG1279) for more information on the xbsakcommand.
The dmesg utility is a linux tool that lets you read the kernel ring buffer. The kernel ring bufferholds kernel information messages in a circular buffer. A circular buffer of fixed size is used tolimit the resource requirements by overwriting the oldest entry with the next incoming message.
In the SDAccel tool, the xocl module and xclmgmt driver modules write informationalmessages to the ring buffer. Thus, for an application hang or crash, or for that matter anyunexpected behavior (like being unable to program the bitstream, etc.), the dmesg tool should beused to check the ring buffer.
The following image shows the layers of the software platform associated with the SDAccelboard platform.
Chapter 2: SDAccel Debug Features
UG1281 (v2018.2) June 6, 2018 www.xilinx.com [placeholder text]SDAccel Debugging Guide 19Send Feedback
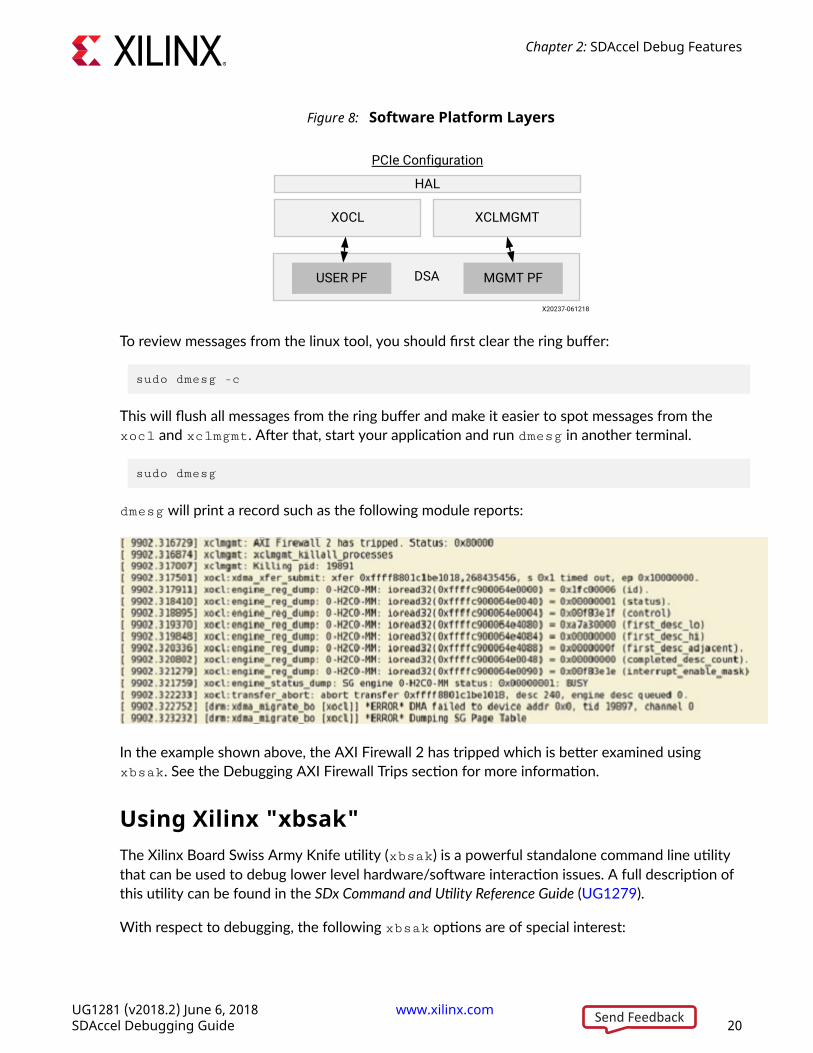
Figure 8: Software Platform Layers
PCIe Configuration
HAL
XOCL XCLMGMT
DSAUSER PF MGMT PF
X20237-061218
To review messages from the linux tool, you should first clear the ring buffer:
sudo dmesg -c
This will flush all messages from the ring buffer and make it easier to spot messages from thexocl and xclmgmt. After that, start your application and run dmesg in another terminal.
sudo dmesg
dmesg will print a record such as the following module reports:
In the example shown above, the AXI Firewall 2 has tripped which is better examined usingxbsak. See the Debugging AXI Firewall Trips section for more information.
Using Xilinx "xbsak"The Xilinx Board Swiss Army Knife utility (xbsak) is a powerful standalone command line utilitythat can be used to debug lower level hardware/software interaction issues. A full description ofthis utility can be found in the SDx Command and Utility Reference Guide (UG1279).
With respect to debugging, the following xbsak options are of special interest:
Chapter 2: SDAccel Debug Features
UG1281 (v2018.2) June 6, 2018 www.xilinx.com [placeholder text]SDAccel Debugging Guide 20Send Feedback
• query - Provides an overall status of an SDAccel™ platform.
• program - Downloads a binary (xclbin) to the programmable region of the Xilinx device.
• status - Extracts the status of the SDx™ Performance Monitors (spm) and the LightweightAXI Protocol Checkers (lapc).
Hardware Debugging Using ChipScopeAfter the final system image (xclbin) is generated and executed on the SDAccel™ platform, theentire system including the host application running on the CPU, and the accelerated kernels onthe Xilinx® FPGA, can be confirmed to be executing correctly on the actual hardware. At thisstage you can validate the functioning of the host code and kernel in the target hardware, anddebug any issues found.
Some of the conditions that can be looked for or analyzed include the following conditions:
• Debugging system hangs that could be due to protocol violations.
○ These violations can take down the entire system.
○ These violations can cause the kernel to get invalid data or to hang.
○ It is hard to determine where or when these violations originated.
○ To debug this condition you would want an ILA triggered off of the AXI protocol checker,which would need to be configured on the SDAccel platform in use.
• Debugging problems inside the RTL kernel.
○ These are sometimes caused by the implementation: timing issues, race condition, baddesign constraint.
○ Functional bug that hardware emulation did not show.
• Debugging Performance Problems.
○ For example, the frames/sec processing is not what you expect.
○ You can examine data beats and pipelining.
○ Using an ILA with trigger sequencer you could examine the burst size, pipelining, datawidth, and locate the bottleneck.
Chapter 2: SDAccel Debug Features
UG1281 (v2018.2) June 6, 2018 www.xilinx.com [placeholder text]SDAccel Debugging Guide 21Send Feedback
Checking FPGA Board for HW debug supportSupporting HW debugging requires the platform to support several IP components most notablethe Debug Bridge. Please talk to your platform designer to determine if these components areincluded in the platform DSA.
All Xilinx provided platforms fully support HW debugging:
• xilinx_kcu1500_dynamic_5_0
• xilinx_vcu1525_dynamic_5_1
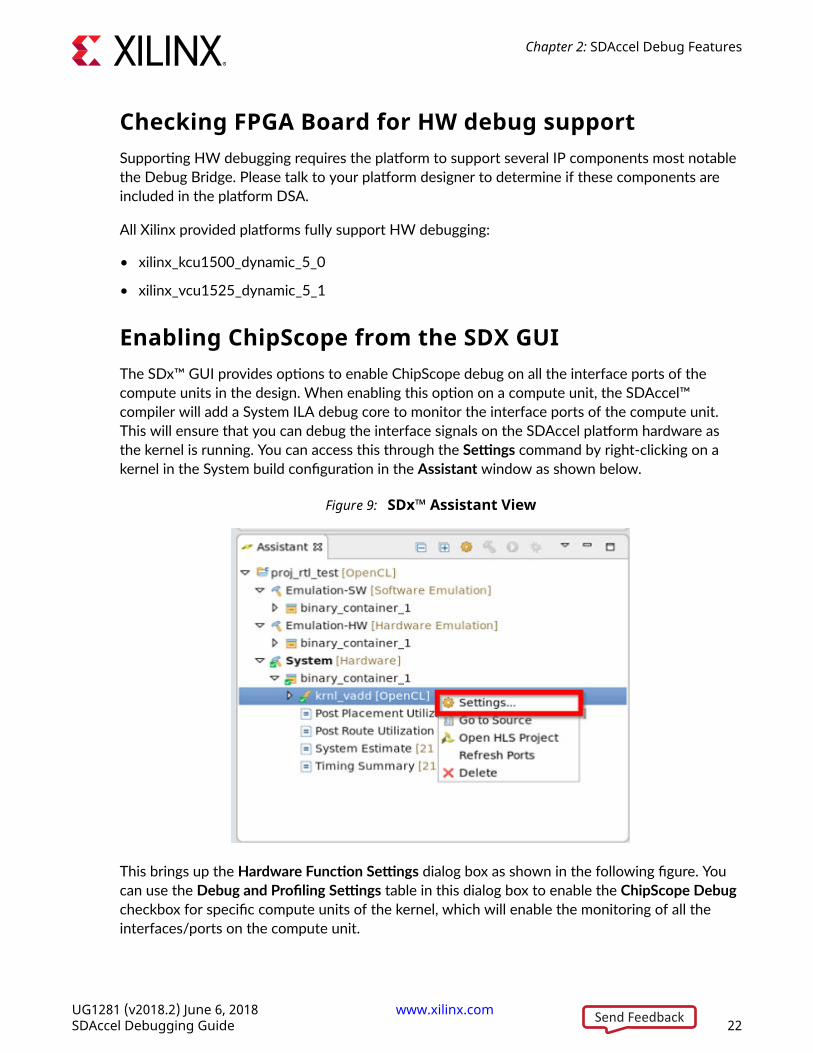
Enabling ChipScope from the SDX GUIThe SDx™ GUI provides options to enable ChipScope debug on all the interface ports of thecompute units in the design. When enabling this option on a compute unit, the SDAccel™compiler will add a System ILA debug core to monitor the interface ports of the compute unit.This will ensure that you can debug the interface signals on the SDAccel platform hardware asthe kernel is running. You can access this through the Settings command by right-clicking on akernel in the System build configuration in the Assistant window as shown below.
Figure 9: SDx™ Assistant View
This brings up the Hardware Function Settings dialog box as shown in the following figure. Youcan use the Debug and Profiling Settings table in this dialog box to enable the ChipScope Debugcheckbox for specific compute units of the kernel, which will enable the monitoring of all theinterfaces/ports on the compute unit.
Chapter 2: SDAccel Debug Features
UG1281 (v2018.2) June 6, 2018 www.xilinx.com [placeholder text]SDAccel Debugging Guide 22Send Feedback
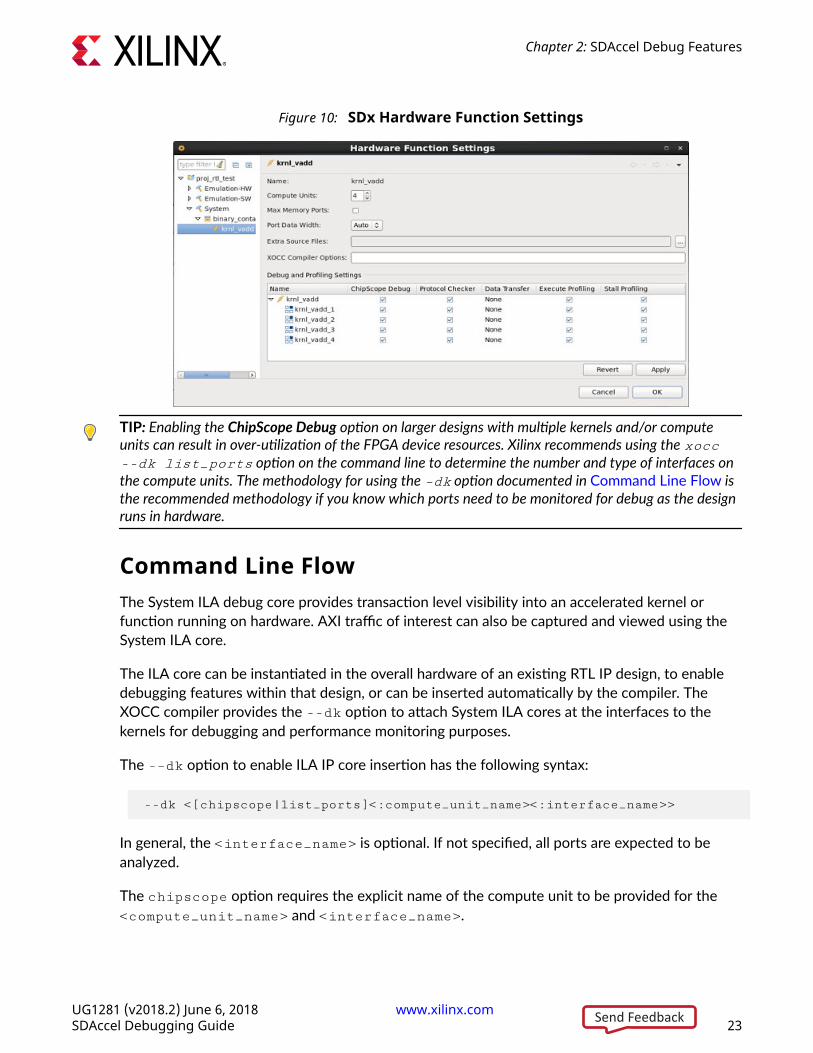
Figure 10: SDx Hardware Function Settings
TIP: Enabling the ChipScope Debug option on larger designs with multiple kernels and/or computeunits can result in over-utilization of the FPGA device resources. Xilinx recommends using the xocc--dk list_ports option on the command line to determine the number and type of interfaces onthe compute units. The methodology for using the –dk option documented in Command Line Flow isthe recommended methodology if you know which ports need to be monitored for debug as the designruns in hardware.
Command Line FlowThe System ILA debug core provides transaction level visibility into an accelerated kernel orfunction running on hardware. AXI traffic of interest can also be captured and viewed using theSystem ILA core.
The ILA core can be instantiated in the overall hardware of an existing RTL IP design, to enabledebugging features within that design, or can be inserted automatically by the compiler. TheXOCC compiler provides the --dk option to attach System ILA cores at the interfaces to thekernels for debugging and performance monitoring purposes.
The -–dk option to enable ILA IP core insertion has the following syntax:
--dk <[chipscope|list_ports]<:compute_unit_name><:interface_name>>
In general, the <interface_name> is optional. If not specified, all ports are expected to beanalyzed.
The chipscope option requires the explicit name of the compute unit to be provided for the<compute_unit_name> and <interface_name>.
Chapter 2: SDAccel Debug Features
UG1281 (v2018.2) June 6, 2018 www.xilinx.com [placeholder text]SDAccel Debugging Guide 23Send Feedback
The list_ports option generates a list of valid compute units and port combinations in thecurrent design.
Note:Multiple --dk option switches can be specified in a single command line to additively add interfacemonitoring capability.
Refer to the SDx Command and Utility Reference Guide (UG1279) for more information on anyXOCC option.
Once the design is built, you can debug the design using the Hardware Manager as described inVivado Design Suite User Guide: Programming and Debugging (UG908).
Chapter 2: SDAccel Debug Features
UG1281 (v2018.2) June 6, 2018 www.xilinx.com [placeholder text]SDAccel Debugging Guide 24Send Feedback
Chapter 3
Debug TechniquesThis section closely examines different styles of debugging techniques. The section classifies thedifferent approaches into software based debugging techniques and hardware orientedtechniques. In the software based approaches, you are not required to actually understand theultimate mapping of the kernel code onto the FPGA. However, this concept can only beextended to a certain amount of detail, at which point the more detailed hardware-based analysiswill be required.
The section is structured along the different debug stages of SDAccel™. It starts with FunctionalVerification during software emulation (a purely software based approach). Next is hardwareemulation, where the kernel code is converted into actual hardware representation providingmore details of the final implementation. Hardware debugging as well as software debuggingconcepts can be applied during debugging in the hardware emulation stage. The last stage isSystem Verification where the actual hardware is executed. In this stage, software debuggingconcepts can only be applied to the host while the kernel must deploy hardware debuggingconcepts.
Functional Verification (SoftwareEmulation)Functional Verification is the process during which the software representing the system isverified towards the ultimate implementation goal. The software developer is tasked at this pointwith ensuring that the software behaves as intended on the given data. This is a very commontask during software development and many different concepts are available.
If your software does not perform as intended, you can use the debugger to identify the rootcause of the issue, or if necessary, dump datapoints during software execution. This sectionintroduces these concepts applied to an SDx™ project.
UG1281 (v2018.2) June 6, 2018 www.xilinx.com [placeholder text]SDAccel Debugging Guide 25Send Feedback
Using printf() to Debug KernelsThe simplest and most rudimentary approach to debugging of algorithms is to verify key datavalues throughout the execution of the program. For application developers, printing checkpointvalues in the code is a tried and trusted way of identifying problems within the execution of aprogram. Because part of the algorithm is now running on an FPGA, even this debuggingtechnique requires additional support.
The SDAccel™ development environment supports OpenCL™ printf() built-in function withinthe kernels in all development flows: software emulation, hardware emulation, and runningkernel in actual hardware.
The following is an example of using printf() in the kernel, and the output when the kernel isexecuted with global size of 8:
__kernel __attribute__ ((reqd_work_group_size(1, 1, 1)))void hello_world(__global int *a){ int idx = get_global_id(0);
printf("Hello world from work item %d\n", idx); a[idx] = idx;}
Output is as follows:
Hello world from work item 0Hello world from work item 1Hello world from work item 2Hello world from work item 3Hello world from work item 4Hello world from work item 5Hello world from work item 6Hello world from work item 7
IMPORTANT!: printf() messages are buffered in the global memory and unloaded when kernelexecution is completed. If printf() is used in multiple kernels, there is no guarantee what order themessages from each kernel will display on the host terminal. Please note, especially when running inhardware emulation and hardware, the hardware buffer size might limit printf output capturing.
Please note this feature is only supported for OpenCL kernels in all development flows.
For C/C++ kernel models printf() is only supported during software emulation and should beexcluded from the Vivado® HLS synthesis step. In this case, any printf() statement should besurrounded by the following compiler macros:
#ifndef __SYNTHESIS__ printf("text");#endif
Chapter 3: Debug Techniques
UG1281 (v2018.2) June 6, 2018 www.xilinx.com [placeholder text]SDAccel Debugging Guide 26Send Feedback
GDB based DebuggingIn this section we briefly show how host and kernel debugging can be performed with the help ofGDB. This flow should be very familiar to software developers. Therefore, this section focuses onthe extensions with respect to host code debugging capabilities specifically for FPGAs and thecurrent status with respect to kernel based hardware emulation support.
Host Code Debugging
Except for the method of launching the debugging environment described in the previouschapter, there is no difference between the SDAccel™ host code debugging and the commonlyused GDB application debugging flow and features.
After gdb is launched, you can step through the host code in GDB and examine the C/C++/OpenCL™ objects to verify that their contents are as expected at any point in the code.
However, as stated in the introduction especially in the case of hardware emulation, it is commonto look for issues regarding protocol synchronization between the host and the kernel. TheSDAccel Environment provides special GDB extensions to examine the content of the OpenCLRuntime environment from the application host. These commands are described in more detail inthe next section.
Xilinx OpenCL Runtime GDB Extensions
The Xilinx® OpenCL™ Runtime Debug Environment introduces new GDB commands, that givevisibility from the host application into the OpenCL runtime library.Note: If you run GDB outside of the SDAccel™ Environment, these commands need to be enabled asdescribed in Launching GDB Host Code Debug.
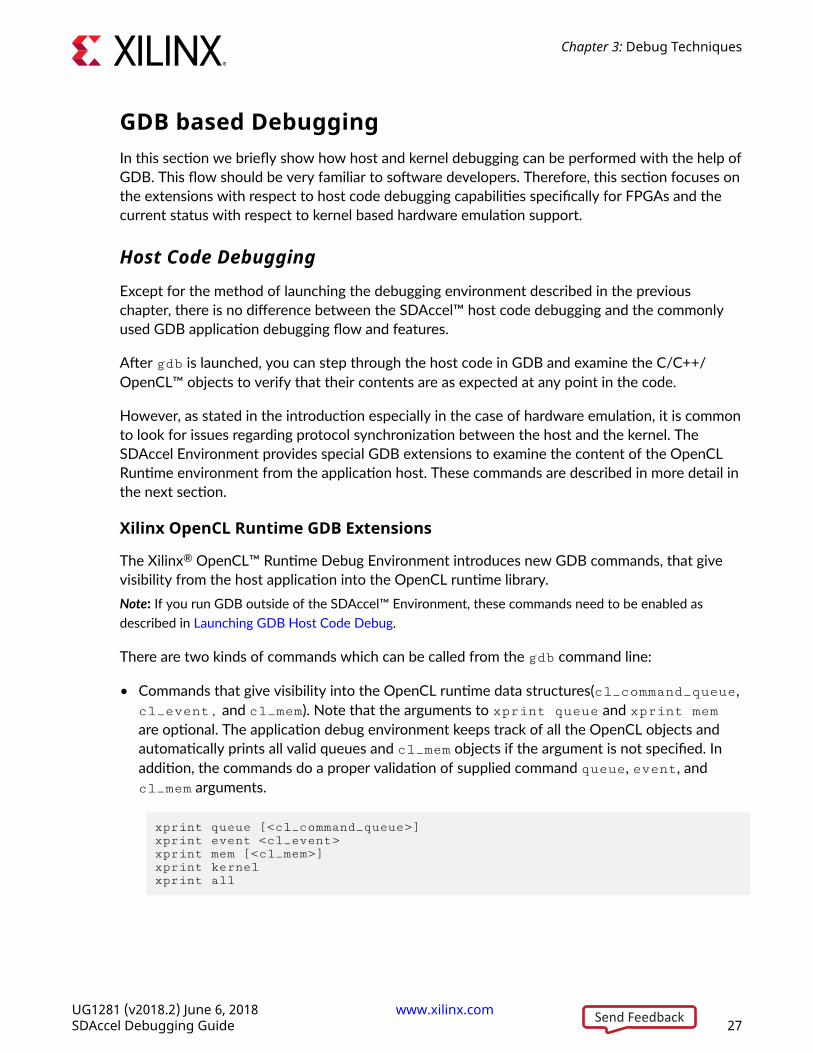
There are two kinds of commands which can be called from the gdb command line:
• Commands that give visibility into the OpenCL runtime data structures(cl_command_queue,cl_event, and cl_mem). Note that the arguments to xprint queue and xprint memare optional. The application debug environment keeps track of all the OpenCL objects andautomatically prints all valid queues and cl_mem objects if the argument is not specified. Inaddition, the commands do a proper validation of supplied command queue, event, andcl_mem arguments.
xprint queue [<cl_command_queue>]xprint event <cl_event>xprint mem [<cl_mem>]xprint kernelxprint all
Chapter 3: Debug Techniques
UG1281 (v2018.2) June 6, 2018 www.xilinx.com [placeholder text]SDAccel Debugging Guide 27Send Feedback
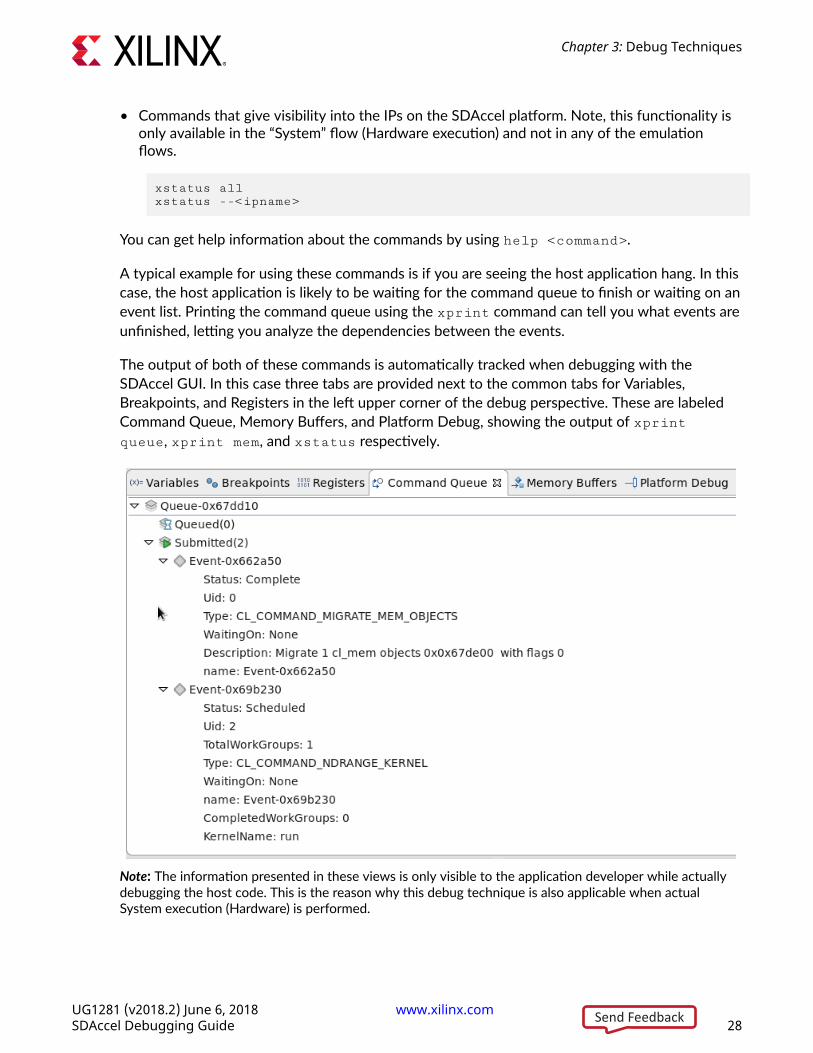
• Commands that give visibility into the IPs on the SDAccel platform. Note, this functionality isonly available in the “System” flow (Hardware execution) and not in any of the emulationflows.
xstatus allxstatus --<ipname>
You can get help information about the commands by using help <command>.
A typical example for using these commands is if you are seeing the host application hang. In thiscase, the host application is likely to be waiting for the command queue to finish or waiting on anevent list. Printing the command queue using the xprint command can tell you what events areunfinished, letting you analyze the dependencies between the events.
The output of both of these commands is automatically tracked when debugging with theSDAccel GUI. In this case three tabs are provided next to the common tabs for Variables,Breakpoints, and Registers in the left upper corner of the debug perspective. These are labeledCommand Queue, Memory Buffers, and Platform Debug, showing the output of xprintqueue, xprint mem, and xstatus respectively.
Note: The information presented in these views is only visible to the application developer while actuallydebugging the host code. This is the reason why this debug technique is also applicable when actualSystem execution (Hardware) is performed.
Chapter 3: Debug Techniques
UG1281 (v2018.2) June 6, 2018 www.xilinx.com [placeholder text]SDAccel Debugging Guide 28Send Feedback
GDB Kernel based Debugging
GDB Kernel debugging is supported for the software emulation and hardware emulation flows.Once the GDB executable is connected to the kernel in the GUI or command-line flows, asdescribed in Debug Command Line Flow, you can set breakpoints and query the content ofvariables in the kernel, similar to normal host code debugging.
This is fully supported in the software emulation flow since the kernel GDB processes simplyattach to the spawned software processes.
However, during hardware emulation, the kernel source code is transformed into RTL, created byVivado® HLS, and executed. As the RTL model is simulated, all transformations for performanceoptimization and concurrent hardware execution are applied. For that reason not all C/C++/OpenCL™ lines can be uniquely mapped to the RTL code, and only limited breakpoints aresupported and at only specific variables can be queried. Today, the GDB tool therefore breaks onthe next possible line based on requested breakpoint statements and clearly states if variablescan not be queried based on the RTL transformations.
Debugging in Hardware EmulationDuring hardware emulation, it is possible to deep dive into the implementation of the kernels.SDAccel™ allows you to perform typical hardware-like debugging in this mode as well as somesoftware-like GDB based analysis on the hardware implementation.
GDB based DebuggingDebugging using a software based GDB flow is fully supported during hardware emulation.Except for the execution of the actual RTL code representing the kernel code there is nodifferences to the user as the GDB flow maps the RTL back into the source code description. Thislimits the breakpoint and observability of the variables in some cases as during the RTLgeneration (HLS) variables and loops might have been dissolved.
For a detailed description of the debug feature itself please see the description in the SDAccel™Software Debug Features chapter, and the extensions to GDB as presented in the GDB basedDebugging section.
Chapter 3: Debug Techniques
UG1281 (v2018.2) June 6, 2018 www.xilinx.com [placeholder text]SDAccel Debugging Guide 29Send Feedback
Waveform-Based Kernel DebuggingThe C/C++ and OpenCL™ kernel code is synthesized using Vivado® High Level Synthesis (HLS) totransform it into a Hardware Description Language (HDL) and later implement it onto the FPGA(xclbin). The hardware-centric algorithm programmer will be very familiar with anotherdebugging approach based on simulation waveforms. This waveform-based HDL debugging isbest supported by SDAccel™ through the GUI flow during hardware emulation.
TIP: For most debugging, the HDL model will not need to be analyzed. Waveform debugging isconsidered an advanced debugging capability.
To run this flow:
1. Start SDx, and perform the regular setup.
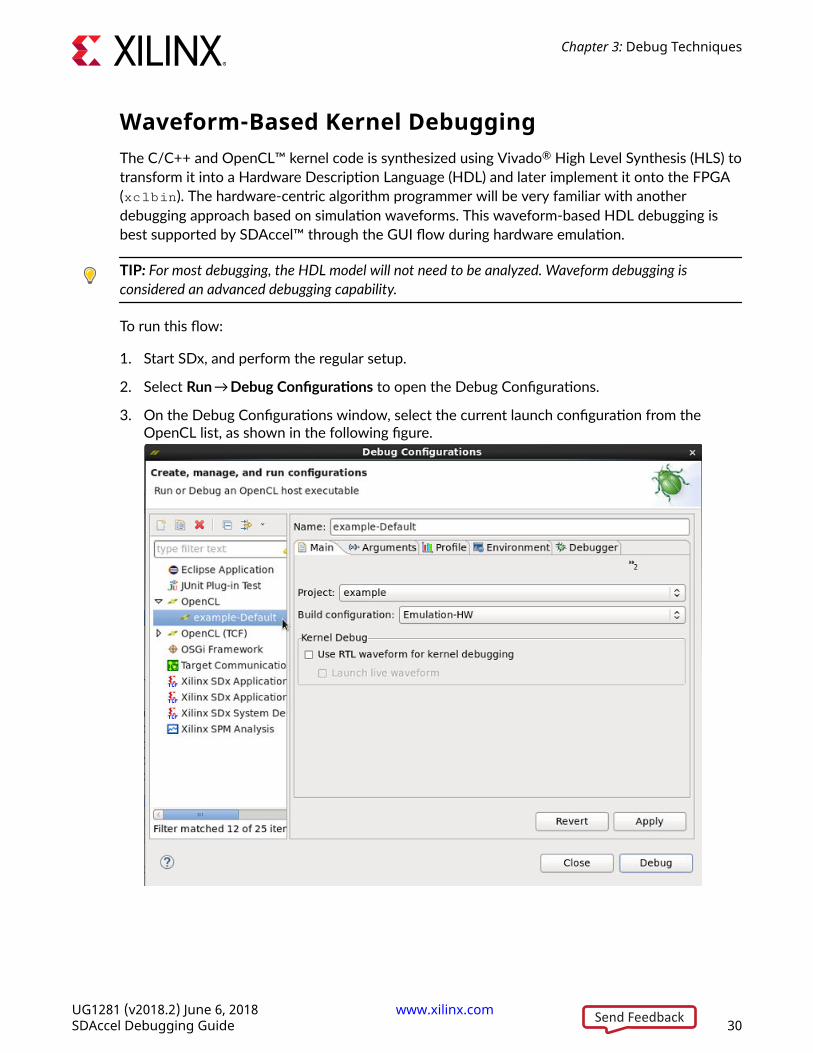
2. Select Run → Debug Configurations to open the Debug Configurations.
3. On the Debug Configurations window, select the current launch configuration from theOpenCL list, as shown in the following figure.
Chapter 3: Debug Techniques
UG1281 (v2018.2) June 6, 2018 www.xilinx.com [placeholder text]SDAccel Debugging Guide 30Send Feedback
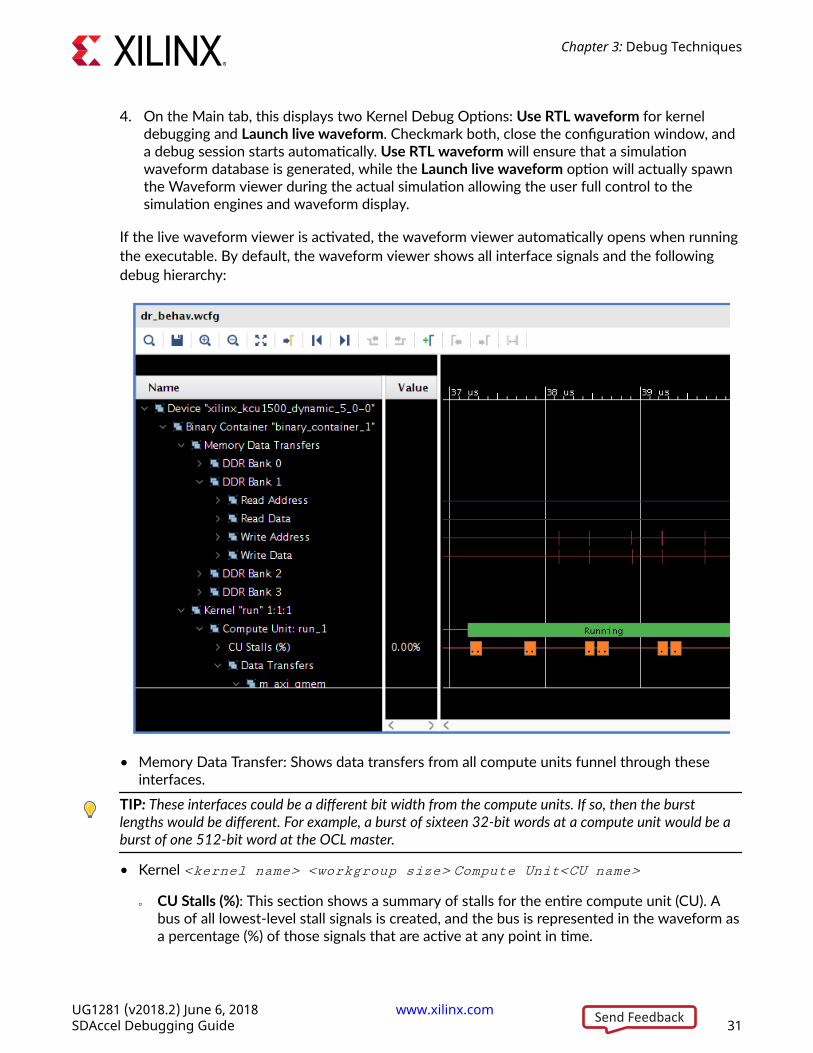
4. On the Main tab, this displays two Kernel Debug Options: Use RTL waveform for kerneldebugging and Launch live waveform. Checkmark both, close the configuration window, anda debug session starts automatically. Use RTL waveform will ensure that a simulationwaveform database is generated, while the Launch live waveform option will actually spawnthe Waveform viewer during the actual simulation allowing the user full control to thesimulation engines and waveform display.
If the live waveform viewer is activated, the waveform viewer automatically opens when runningthe executable. By default, the waveform viewer shows all interface signals and the followingdebug hierarchy:
• Memory Data Transfer: Shows data transfers from all compute units funnel through theseinterfaces.
TIP: These interfaces could be a different bit width from the compute units. If so, then the burstlengths would be different. For example, a burst of sixteen 32-bit words at a compute unit would be aburst of one 512-bit word at the OCL master.
• Kernel <kernel name> <workgroup size> Compute Unit<CU name>
○ CU Stalls (%): This section shows a summary of stalls for the entire compute unit (CU). Abus of all lowest-level stall signals is created, and the bus is represented in the waveform asa percentage (%) of those signals that are active at any point in time.
Chapter 3: Debug Techniques
UG1281 (v2018.2) June 6, 2018 www.xilinx.com [placeholder text]SDAccel Debugging Guide 31Send Feedback
○ Data Transfers: This section shows the data transfers for all AXI masters on the CU.
○ User Functions: This section lists all of the functions within the hierarchy of the CU.
- Function: <function name>
- Dataflow/Pipeline Activity: This section shows the function-level loop dataflow/pipeline signals for a CU.
- Function Stalls: This section lists the three stall signals within this function.
- Function I/O: This section lists the I/O for the function. These I/O are of protocol -m_axi, ap_fifo, ap_memory, or ap_none.
TIP: As with any waveform debugger, additional debug data of internal signals can be added byselecting the instance of interest from the scope menu and the signals of interest from the object menu.Similarly, debug controls such as HDL breakpoints, as well as HDL code lookup and waveform markersare supported. Refer to the Vivado Design Suite User Guide: Logic Simulation (UG900) for moreinformation on working with the waveform viewer.
The waveform debugging process can also be enabled through the XOCC command line. Use thefollowing instructions to enable it:
1. Turn on debug code generation during kernel compilation.
xocc -g ...
2. Create an sdaccel.ini file in the same directory as the host executable with the contentsbelow:
[Emulation]launch_waveform=batch
[Debug]profile=truetimeline_trace=truedevice_profile=true
3. Execute hardware emulation. The hardware transaction data will be collected in the filenamed <hardware_platform>-<device_id>-<xclbin_name>.wdb file. This file candirectly be opened through the SDAccel GUI.
TIP: If the launch_waveform option is set to gui in the emulation section: [Emulation]launch_waveform=gui, then a live waveform viewer will be spawned during the execution of thehardware emulation.
Chapter 3: Debug Techniques
UG1281 (v2018.2) June 6, 2018 www.xilinx.com [placeholder text]SDAccel Debugging Guide 32Send Feedback
System Verification, Hardware HangsApplication HangThis section discusses debugging issues related to the interaction of the host code and theaccelerated kernels. Problems with these interactions manifest themselves as issues such asmachine hangs or application hangs. Although, the GDB debug environment might help withisolating the errors in some cases (xprint), such as hangs associated with specific kernels, theseissues are best debugged using the dmesg and xbsak commands as shown here. The commandsand all their associated options are described in Utilities for Hardware Debugging.
In the following, we examine three of the more common issues encountered:
• AXI firewall trips
• Kernel hangs due to AXI violations
• Host application hangs accessing DDR memory
If this process of hardware debugging does not resolve the problem, it is necessary to performhardware debugging using ChipScope. See the Debugging with ChipScope section.
AXI Firewall Trips
The AXI firewall should prevent host hangs. This is why Xilinx recommends the AXI ProtocolFirewall IP to be included in SDAccel Platforms. When the firewall trips one of the first checksyou perform should be to see if the host code and kernels are setup to utilize the same memorybanks. The following is one of the simplest methods to perform this check:
1. Use xbsak to program the FPGA:
xbsak program -p <xclbin>
2. Run the xbsak query option to check memory topology:
xbsak query
In the following example, there is no memory bank associated with the kernels:
Chapter 3: Debug Techniques
UG1281 (v2018.2) June 6, 2018 www.xilinx.com [placeholder text]SDAccel Debugging Guide 33Send Feedback
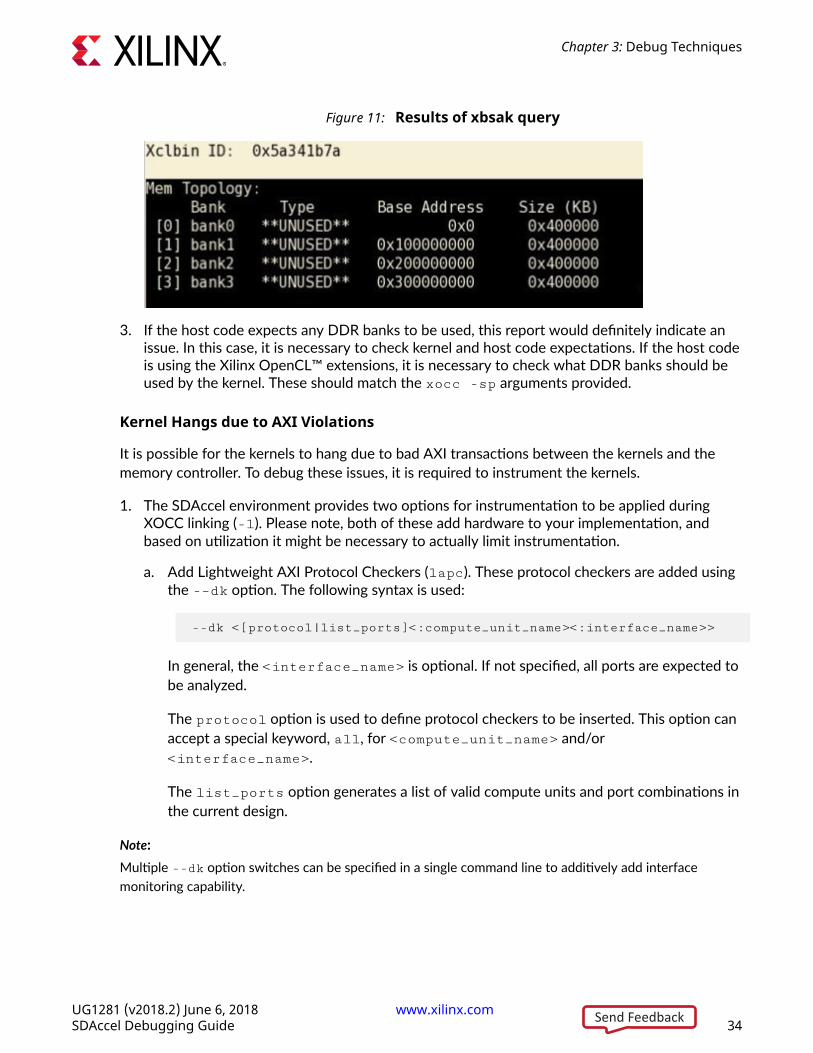
Figure 11: Results of xbsak query
3. If the host code expects any DDR banks to be used, this report would definitely indicate anissue. In this case, it is necessary to check kernel and host code expectations. If the host codeis using the Xilinx OpenCL™ extensions, it is necessary to check what DDR banks should beused by the kernel. These should match the xocc -sp arguments provided.
Kernel Hangs due to AXI Violations
It is possible for the kernels to hang due to bad AXI transactions between the kernels and thememory controller. To debug these issues, it is required to instrument the kernels.
1. The SDAccel environment provides two options for instrumentation to be applied duringXOCC linking (-l). Please note, both of these add hardware to your implementation, andbased on utilization it might be necessary to actually limit instrumentation.
a. Add Lightweight AXI Protocol Checkers (lapc). These protocol checkers are added usingthe -–dk option. The following syntax is used:
--dk <[protocol|list_ports]<:compute_unit_name><:interface_name>>
In general, the <interface_name> is optional. If not specified, all ports are expected tobe analyzed.
The protocol option is used to define protocol checkers to be inserted. This option canaccept a special keyword, all, for <compute_unit_name> and/or<interface_name>.
The list_ports option generates a list of valid compute units and port combinations inthe current design.
Note:Multiple --dk option switches can be specified in a single command line to additively add interfacemonitoring capability.
Chapter 3: Debug Techniques
UG1281 (v2018.2) June 6, 2018 www.xilinx.com [placeholder text]SDAccel Debugging Guide 34Send Feedback
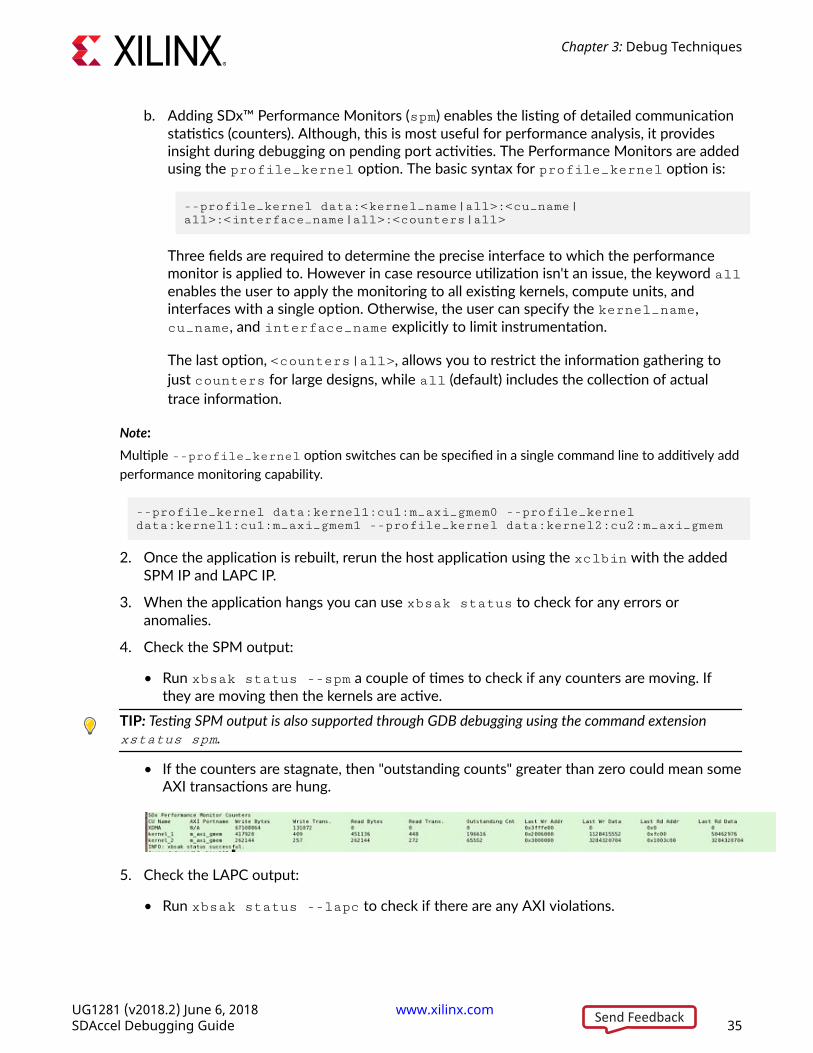
b. Adding SDx™ Performance Monitors (spm) enables the listing of detailed communicationstatistics (counters). Although, this is most useful for performance analysis, it providesinsight during debugging on pending port activities. The Performance Monitors are addedusing the profile_kernel option. The basic syntax for profile_kernel option is:
--profile_kernel data:<kernel_name|all>:<cu_name|all>:<interface_name|all>:<counters|all>
Three fields are required to determine the precise interface to which the performancemonitor is applied to. However in case resource utilization isn't an issue, the keyword allenables the user to apply the monitoring to all existing kernels, compute units, andinterfaces with a single option. Otherwise, the user can specify the kernel_name,cu_name, and interface_name explicitly to limit instrumentation.
The last option, <counters|all>, allows you to restrict the information gathering tojust counters for large designs, while all (default) includes the collection of actualtrace information.
Note:Multiple --profile_kernel option switches can be specified in a single command line to additively addperformance monitoring capability.
--profile_kernel data:kernel1:cu1:m_axi_gmem0 --profile_kernel data:kernel1:cu1:m_axi_gmem1 --profile_kernel data:kernel2:cu2:m_axi_gmem
2. Once the application is rebuilt, rerun the host application using the xclbin with the addedSPM IP and LAPC IP.
3. When the application hangs you can use xbsak status to check for any errors oranomalies.
4. Check the SPM output:
• Run xbsak status --spm a couple of times to check if any counters are moving. Ifthey are moving then the kernels are active.
TIP: Testing SPM output is also supported through GDB debugging using the command extensionxstatus spm.
• If the counters are stagnate, then "outstanding counts" greater than zero could mean someAXI transactions are hung.
5. Check the LAPC output:
• Run xbsak status --lapc to check if there are any AXI violations.
Chapter 3: Debug Techniques
UG1281 (v2018.2) June 6, 2018 www.xilinx.com [placeholder text]SDAccel Debugging Guide 35Send Feedback
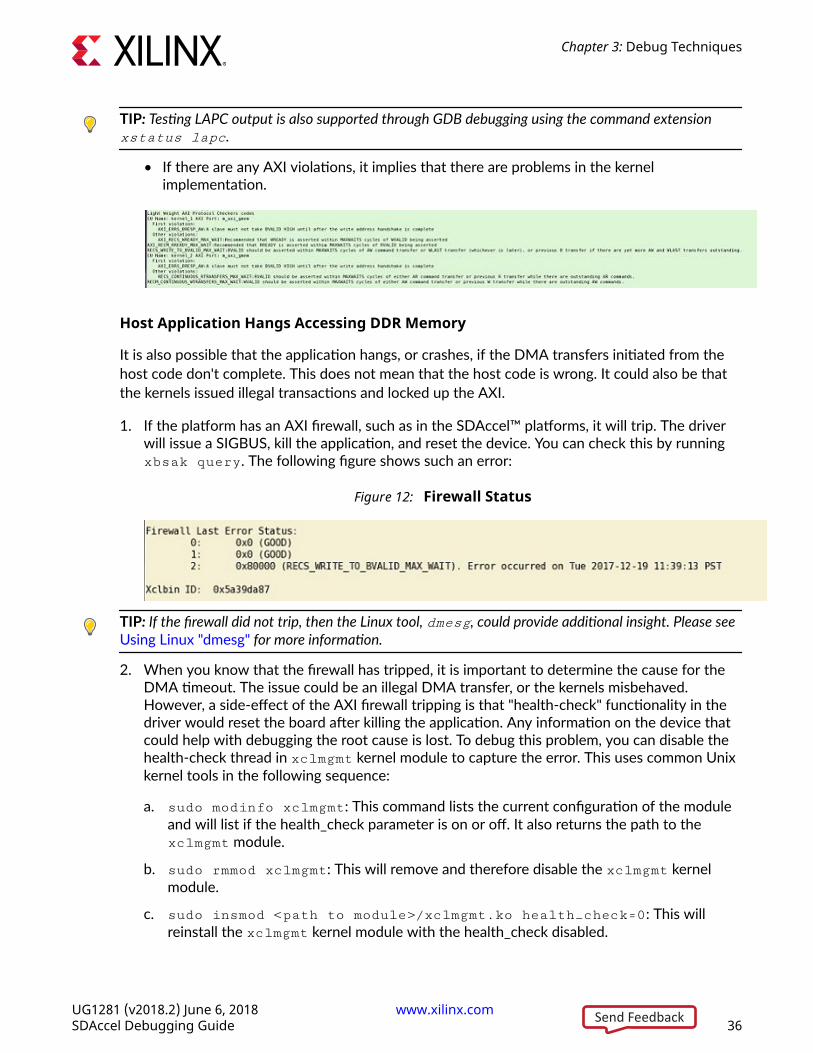
TIP: Testing LAPC output is also supported through GDB debugging using the command extensionxstatus lapc.
• If there are any AXI violations, it implies that there are problems in the kernelimplementation.
Host Application Hangs Accessing DDR Memory
It is also possible that the application hangs, or crashes, if the DMA transfers initiated from thehost code don't complete. This does not mean that the host code is wrong. It could also be thatthe kernels issued illegal transactions and locked up the AXI.
1. If the platform has an AXI firewall, such as in the SDAccel™ platforms, it will trip. The driverwill issue a SIGBUS, kill the application, and reset the device. You can check this by runningxbsak query. The following figure shows such an error:
Figure 12: Firewall Status
TIP: If the firewall did not trip, then the Linux tool, dmesg, could provide additional insight. Please see Using Linux "dmesg" for more information.
2. When you know that the firewall has tripped, it is important to determine the cause for theDMA timeout. The issue could be an illegal DMA transfer, or the kernels misbehaved.However, a side-effect of the AXI firewall tripping is that "health-check" functionality in thedriver would reset the board after killing the application. Any information on the device thatcould help with debugging the root cause is lost. To debug this problem, you can disable thehealth-check thread in xclmgmt kernel module to capture the error. This uses common Unixkernel tools in the following sequence:
a. sudo modinfo xclmgmt: This command lists the current configuration of the moduleand will list if the health_check parameter is on or off. It also returns the path to thexclmgmt module.
b. sudo rmmod xclmgmt: This will remove and therefore disable the xclmgmt kernelmodule.
c. sudo insmod <path to module>/xclmgmt.ko health_check=0: This willreinstall the xclmgmt kernel module with the health_check disabled.
Chapter 3: Debug Techniques
UG1281 (v2018.2) June 6, 2018 www.xilinx.com [placeholder text]SDAccel Debugging Guide 36Send Feedback
TIP: The path to this module is reported in the output of the call to modinfo.
3. With the health check disabled, re-run the application. You can utilize the kernelinstrumentation to isolate this issue as previously described in the section on Kernel Hangs.
Debugging with ChipScopeYou can use the ChipScope debugging environment and the Vivado® Hardware Manager to helpyou debug your host application and kernels quickly and more effectively. In order to do this, atleast one of the following must be true:
• Your SDAccel™ application project has been instrumented with debug cores, using the --dkcompiler switch (as described in Hardware Debugging Using ChipScope).
• The RTL kernels used in your project must have been instantiated with debug cores (asdescribed in Adding Debug IP to RTL Kernels).
These tools enable a wide range of capabilities from logic to system level debug while your kernelis running in hardware.
The following steps are required to run XVC and HW servers, host applications, and finallytrigger and arm the debug cores in Vivado Hardware Manager.
1. Add debug IP to your RTL kernels. This applies only to RTL kernels. See Adding Debug IP toRTL Kernels.
2. Instrument the host application to pause at appropriate point in the host execution whereyou want to debug. See Debugging through the Host Application.
3. Set up the environment for hardware debug. You can do this manually or using a script thatautomates this for you. The following steps are described in Manual Setup for HardwareDebug and Automated Setup for Hardware Debug:
a. Run the required XVC and HW servers.
b. Execute the host application and pause at the appropriate point in the host execution toenable setup of ILA triggers.
c. Open Vivado Hardware Manager and connect to XVC server.
d. Set up ILA trigger conditions for the design.
e. Continue with host application.
f. Inspect results in the Vivado Hardware Manager.
g. Rerun iteratively from Step b (above) as required.
Chapter 3: Debug Techniques
UG1281 (v2018.2) June 6, 2018 www.xilinx.com [placeholder text]SDAccel Debugging Guide 37Send Feedback
Adding Debug IP to RTL Kernels
IMPORTANT!: This debug technique requires familiarity with the Vivado® Design Suite, and RTLdesign.
You need to instantiate debug cores like the Integrated Logic Analyzer (ILA) and Virtual Input/Output (VIO) in your RTL kernel code to debug the kernel logic. From within the Vivado DesignSuite, edit the RTL kernel to instantiate an ILA IP customization, or a VIO IP, into the RTL code,similar to using any other IP in Vivado IDE. Refer to the Vivado Design Suite User Guide:Programming and Debugging (UG908) to learn more about using the ILA or other debug cores inthe RTL Insertion flow and to learn about using the HDL generate statement technique toenable/disable debug core generation.
TIP: The best time to add debug cores to your RTL kernel is when you create it. Refer to "Debugging" inthe UltraFast Design Methodology Guide for the Vivado Design Suite (UG949) for more information.
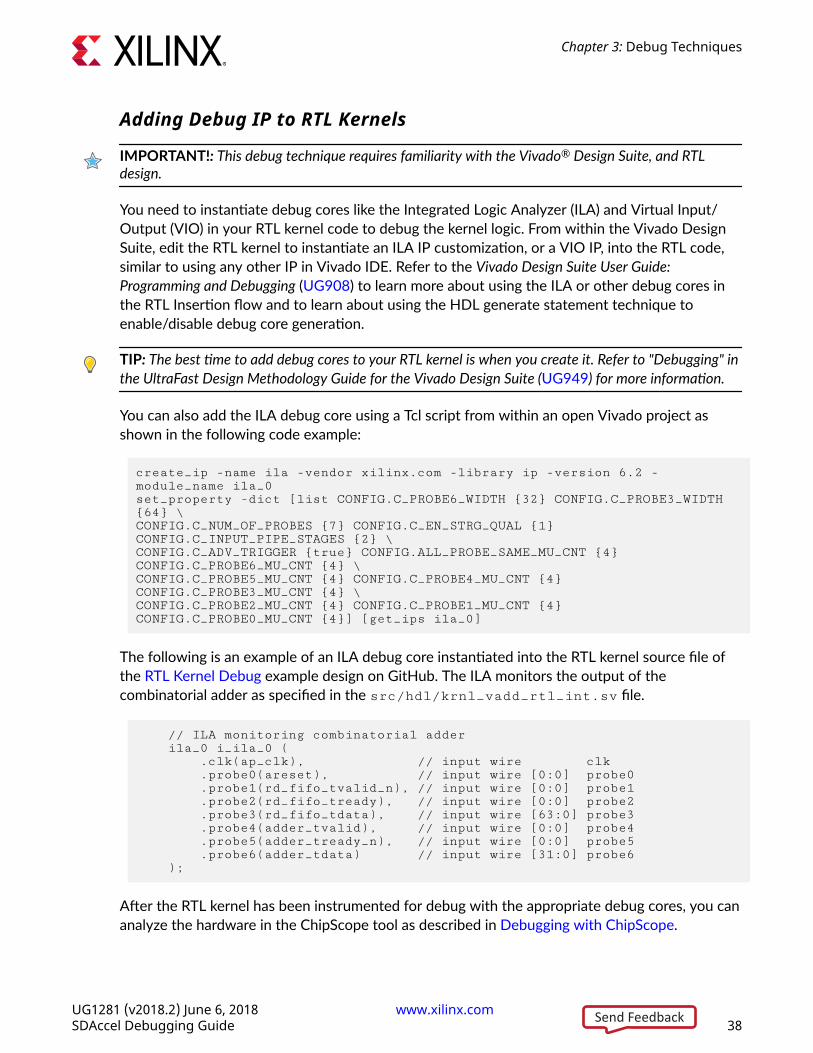
You can also add the ILA debug core using a Tcl script from within an open Vivado project asshown in the following code example:
create_ip -name ila -vendor xilinx.com -library ip -version 6.2 -module_name ila_0set_property -dict [list CONFIG.C_PROBE6_WIDTH {32} CONFIG.C_PROBE3_WIDTH {64} \CONFIG.C_NUM_OF_PROBES {7} CONFIG.C_EN_STRG_QUAL {1} CONFIG.C_INPUT_PIPE_STAGES {2} \CONFIG.C_ADV_TRIGGER {true} CONFIG.ALL_PROBE_SAME_MU_CNT {4} CONFIG.C_PROBE6_MU_CNT {4} \CONFIG.C_PROBE5_MU_CNT {4} CONFIG.C_PROBE4_MU_CNT {4} CONFIG.C_PROBE3_MU_CNT {4} \CONFIG.C_PROBE2_MU_CNT {4} CONFIG.C_PROBE1_MU_CNT {4} CONFIG.C_PROBE0_MU_CNT {4}] [get_ips ila_0]
The following is an example of an ILA debug core instantiated into the RTL kernel source file ofthe RTL Kernel Debug example design on GitHub. The ILA monitors the output of thecombinatorial adder as specified in the src/hdl/krnl_vadd_rtl_int.sv file.
// ILA monitoring combinatorial adder ila_0 i_ila_0 ( .clk(ap_clk), // input wire clk .probe0(areset), // input wire [0:0] probe0 .probe1(rd_fifo_tvalid_n), // input wire [0:0] probe1 .probe2(rd_fifo_tready), // input wire [0:0] probe2 .probe3(rd_fifo_tdata), // input wire [63:0] probe3 .probe4(adder_tvalid), // input wire [0:0] probe4 .probe5(adder_tready_n), // input wire [0:0] probe5 .probe6(adder_tdata) // input wire [31:0] probe6 );
After the RTL kernel has been instrumented for debug with the appropriate debug cores, you cananalyze the hardware in the ChipScope tool as described in Debugging with ChipScope.
Chapter 3: Debug Techniques
UG1281 (v2018.2) June 6, 2018 www.xilinx.com [placeholder text]SDAccel Debugging Guide 38Send Feedback
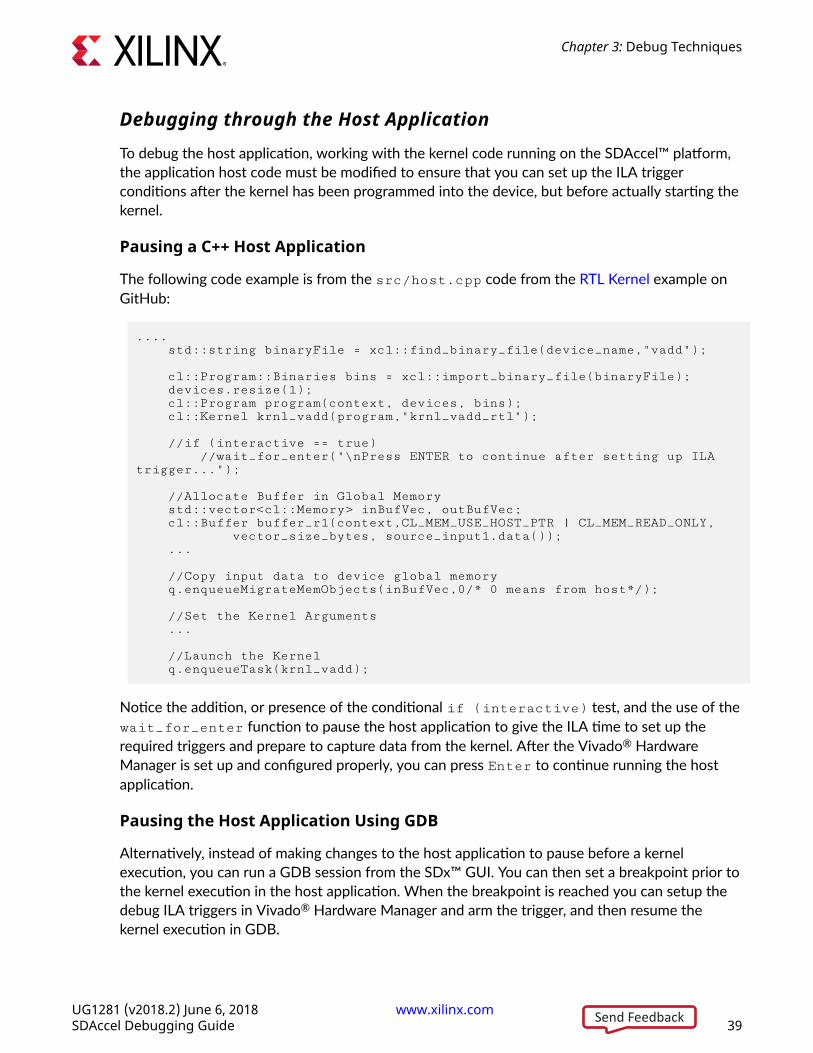
Debugging through the Host Application
To debug the host application, working with the kernel code running on the SDAccel™ platform,the application host code must be modified to ensure that you can set up the ILA triggerconditions after the kernel has been programmed into the device, but before actually starting thekernel.
Pausing a C++ Host Application
The following code example is from the src/host.cpp code from the RTL Kernel example onGitHub:
.... std::string binaryFile = xcl::find_binary_file(device_name,"vadd"); cl::Program::Binaries bins = xcl::import_binary_file(binaryFile); devices.resize(1); cl::Program program(context, devices, bins); cl::Kernel krnl_vadd(program,"krnl_vadd_rtl");
//if (interactive == true) //wait_for_enter("\nPress ENTER to continue after setting up ILA trigger...");
//Allocate Buffer in Global Memory std::vector<cl::Memory> inBufVec, outBufVec; cl::Buffer buffer_r1(context,CL_MEM_USE_HOST_PTR | CL_MEM_READ_ONLY, vector_size_bytes, source_input1.data()); ...
//Copy input data to device global memory q.enqueueMigrateMemObjects(inBufVec,0/* 0 means from host*/);
//Set the Kernel Arguments ...
//Launch the Kernel q.enqueueTask(krnl_vadd);
Notice the addition, or presence of the conditional if (interactive) test, and the use of thewait_for_enter function to pause the host application to give the ILA time to set up therequired triggers and prepare to capture data from the kernel. After the Vivado® HardwareManager is set up and configured properly, you can press Enter to continue running the hostapplication.
Pausing the Host Application Using GDB
Alternatively, instead of making changes to the host application to pause before a kernelexecution, you can run a GDB session from the SDx™ GUI. You can then set a breakpoint prior tothe kernel execution in the host application. When the breakpoint is reached you can setup thedebug ILA triggers in Vivado® Hardware Manager and arm the trigger, and then resume thekernel execution in GDB.
Chapter 3: Debug Techniques
UG1281 (v2018.2) June 6, 2018 www.xilinx.com [placeholder text]SDAccel Debugging Guide 39Send Feedback
Automated Setup for Hardware Debug
1. Set up your SDx™ environment by sourcing the appropriate settings64.sh/.csh filefound in your SDx install area.
2. Start xvc_pcie and hw_server apps using the sdx_debug_hw script (note thatthe /dev/xvc_* character device will differ depending on the platform and SDx release –for the vcu1525 5.1 DSA in 2018.2 SDx release, the file is /dev/xvc_pub.m1025).
sdx_debug_hw --xvc_pcie /dev/xvc_pub.m1025 --hw_serverlaunching xvc_pcie...xvc_pcie -d /dev/xvc_pub.m1025 -s TCP::10200launching hw_server...hw_server -sTCP::3121
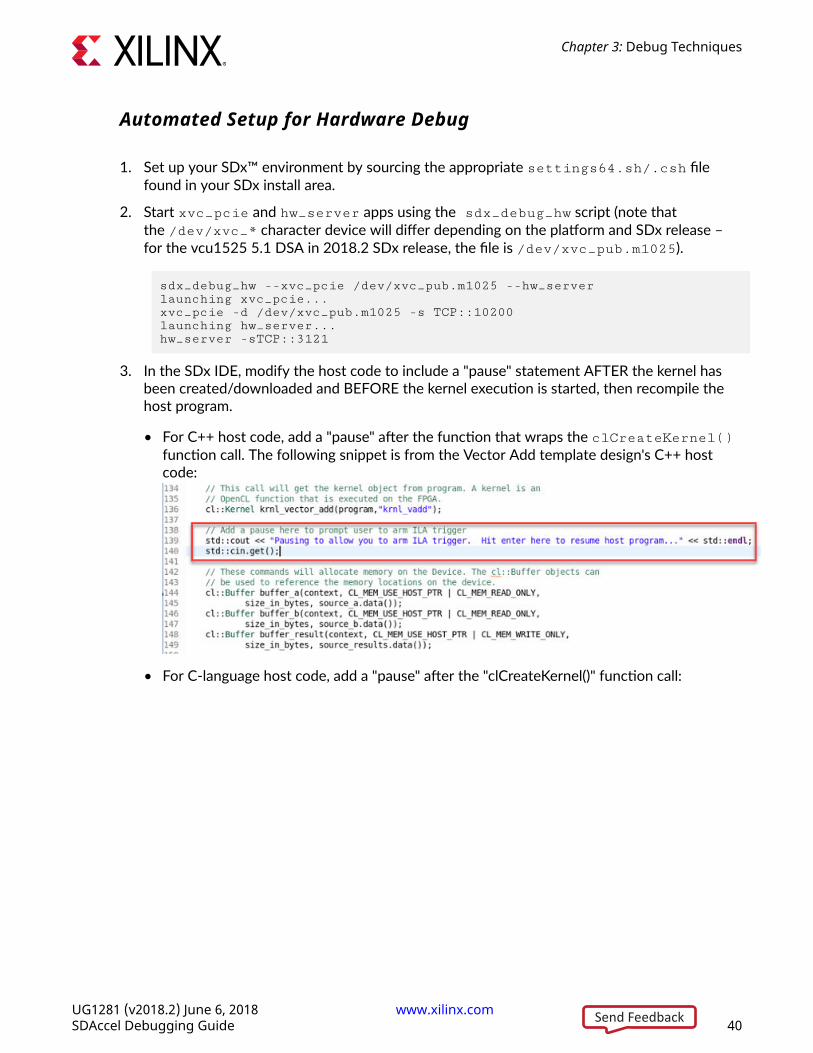
3. In the SDx IDE, modify the host code to include a "pause" statement AFTER the kernel hasbeen created/downloaded and BEFORE the kernel execution is started, then recompile thehost program.
• For C++ host code, add a "pause" after the function that wraps the clCreateKernel()function call. The following snippet is from the Vector Add template design's C++ hostcode:
• For C-language host code, add a "pause" after the "clCreateKernel()" function call:
Chapter 3: Debug Techniques
UG1281 (v2018.2) June 6, 2018 www.xilinx.com [placeholder text]SDAccel Debugging Guide 40Send Feedback
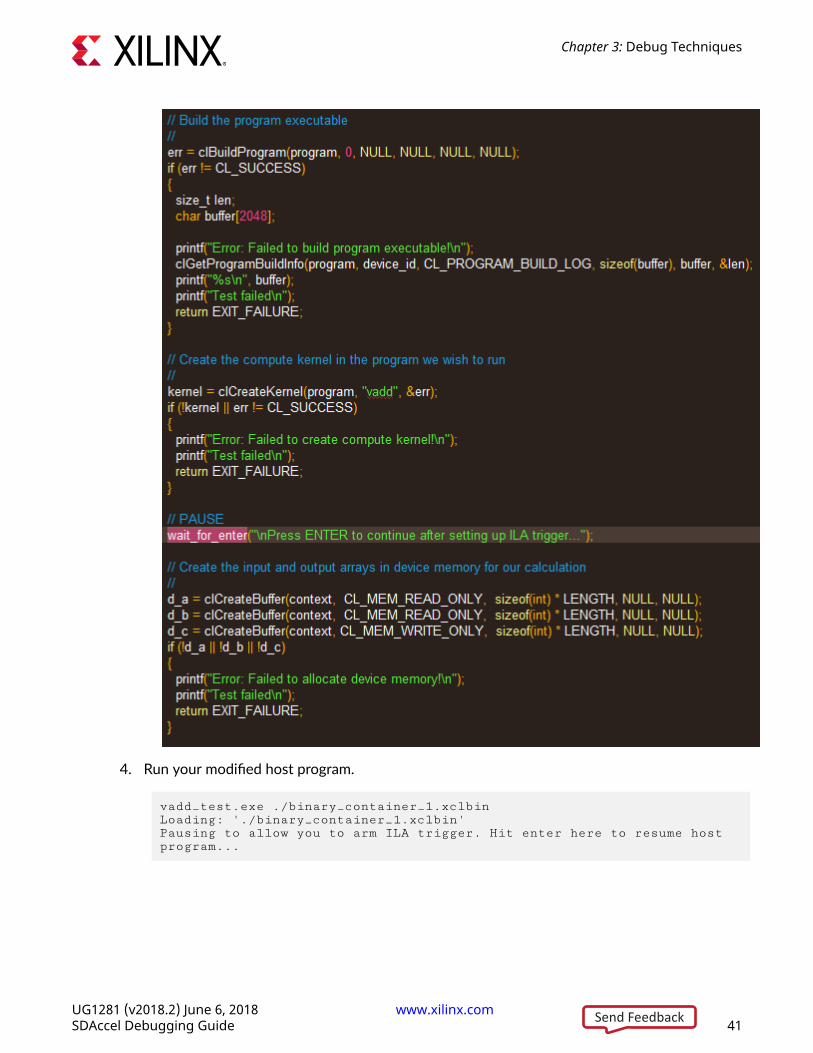
4. Run your modified host program.
vadd_test.exe ./binary_container_1.xclbinLoading: './binary_container_1.xclbin'Pausing to allow you to arm ILA trigger. Hit enter here to resume host program...
Chapter 3: Debug Techniques
UG1281 (v2018.2) June 6, 2018 www.xilinx.com [placeholder text]SDAccel Debugging Guide 41Send Feedback
5. Launch Vivado® Design Suite using the sdx_debug_hw script located in your SDAccelinstallation directory.
> sdx_debug_hw --vivado --host xcoltlab40 --ltx_file ../workspace/vadd_test/System/pfm_top_wrapper.ltx
The command window displays the following:
launching vivado... ['vivado', '-source', 'sdx_hw_debug.tcl', '-tclargs', '/tmp/sdx_tmp/project_1/project_1.xpr', 'workspace/vadd_test/System/pfm_top_wrapper.ltx', 'xcoltlab40', '10200', '3121'] ****** Vivado v2018.2 (64-bit) **** SW Build 2245749 on Wed May 30 12:36:19 MDT 2018 **** IP Build 2245576 on Wed May 30 15:12:50 MDT 2018 ** Copyright 1986-2018 Xilinx, Inc. All Rights Reserved. start_gui
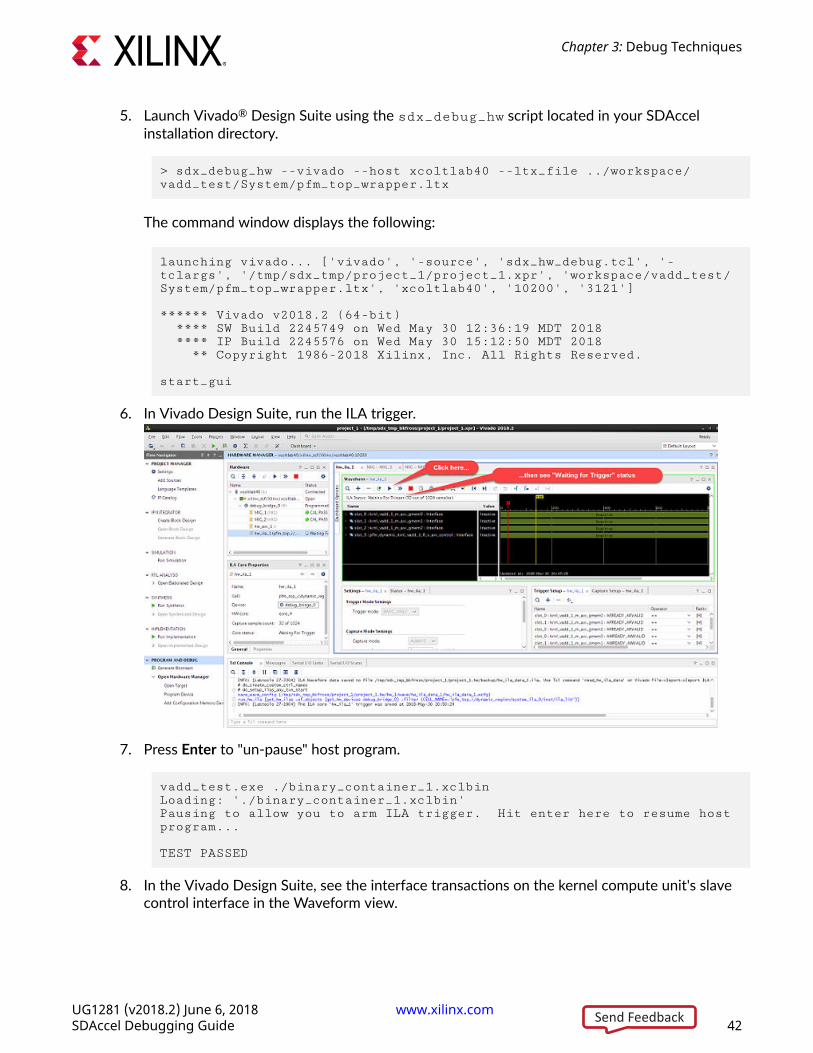
6. In Vivado Design Suite, run the ILA trigger.
7. Press Enter to "un-pause" host program.
vadd_test.exe ./binary_container_1.xclbinLoading: './binary_container_1.xclbin'Pausing to allow you to arm ILA trigger. Hit enter here to resume host program... TEST PASSED
8. In the Vivado Design Suite, see the interface transactions on the kernel compute unit's slavecontrol interface in the Waveform view.
Chapter 3: Debug Techniques
UG1281 (v2018.2) June 6, 2018 www.xilinx.com [placeholder text]SDAccel Debugging Guide 42Send Feedback
Manual Setup for Hardware Debug
Starting Debug Servers on Amazon F1 Instance
Instructions to start the debug servers on an Amazon F1 instance can be found here: https://github.com/aws/aws-fpga/blob/master/hdk/docs/Virtual_JTAG_XVC.md
Starting Debug Servers on Nimbix and Other CloudPlatforms
There are two steps required start the debug servers prior to debugging the design in Vivado®
Hardware Manager.
1. Source the SDx™ settings64.csh or settings.sh environment setup script and run thexvc_pcie driver. The filename passed to xvc_pcie must match the character driver fileinstalled with the kernel device driver.
>xvc_pcie -d /dev/xvc_pub.m1025
2. Start the XVC server on port 10201 and the hw_server on port 3121.
>hw_server "set auto-open-servers xilinx-xvc:localhost:10201" -e "set always-open-jtag 1"
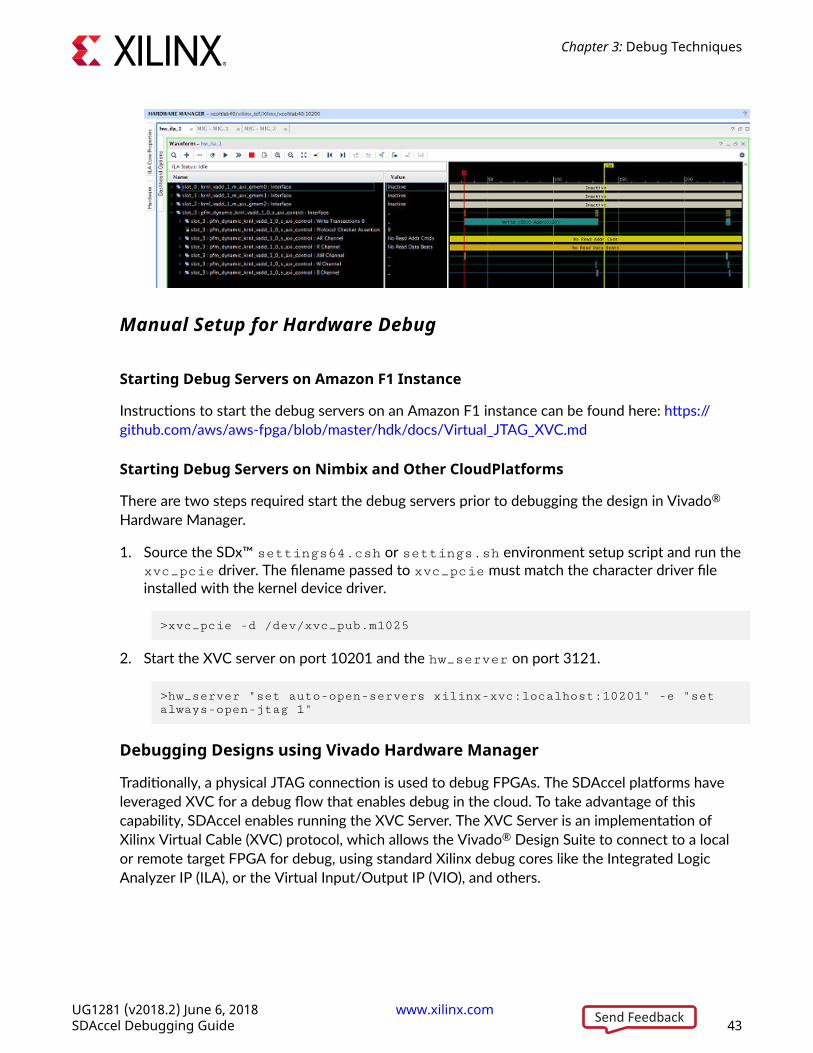
Debugging Designs using Vivado Hardware Manager
Traditionally, a physical JTAG connection is used to debug FPGAs. The SDAccel platforms haveleveraged XVC for a debug flow that enables debug in the cloud. To take advantage of thiscapability, SDAccel enables running the XVC Server. The XVC Server is an implementation ofXilinx Virtual Cable (XVC) protocol, which allows the Vivado® Design Suite to connect to a localor remote target FPGA for debug, using standard Xilinx debug cores like the Integrated LogicAnalyzer IP (ILA), or the Virtual Input/Output IP (VIO), and others.
Chapter 3: Debug Techniques
UG1281 (v2018.2) June 6, 2018 www.xilinx.com [placeholder text]SDAccel Debugging Guide 43Send Feedback
The Vivado Hardware Manager (Vivado Design Suite or Vivado Lab Edition) can be running onthe target instance or it can be running remotely on a different host. The TCP port on which theXVC Server is listening must be accessible to the host running Vivado Hardware Manager. Toconnect the Vivado Hardware Manager to XVC server on the target, the following steps shouldbe followed on the machine hosting the Vivado tools:
1. Launch the Vivado Lab Edition, or the full Vivado Design Suite.
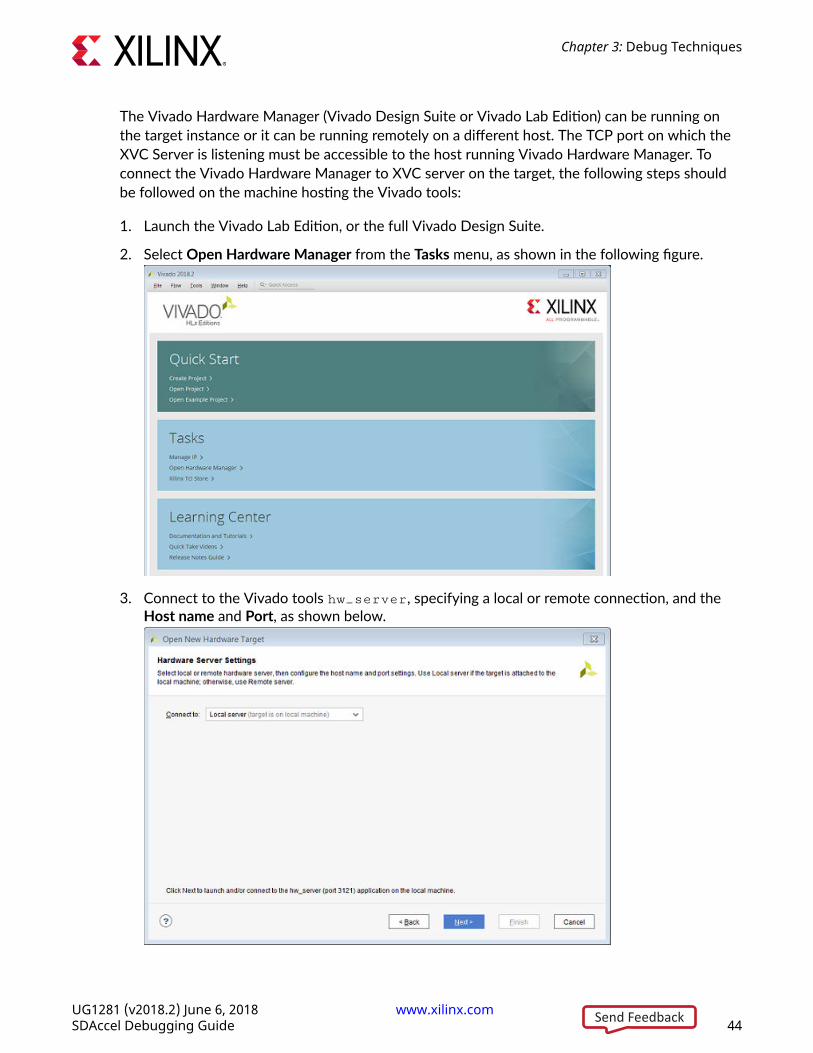
2. Select Open Hardware Manager from the Tasks menu, as shown in the following figure.
3. Connect to the Vivado tools hw_server, specifying a local or remote connection, and theHost name and Port, as shown below.
Chapter 3: Debug Techniques
UG1281 (v2018.2) June 6, 2018 www.xilinx.com [placeholder text]SDAccel Debugging Guide 44Send Feedback
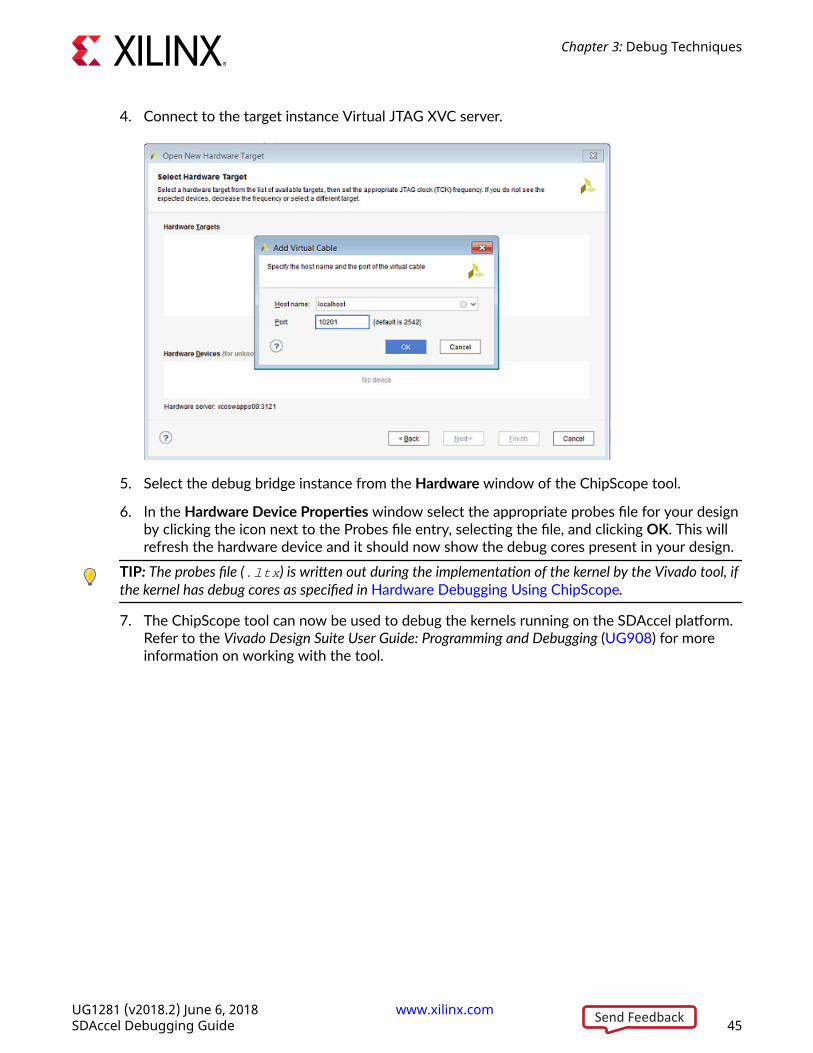
4. Connect to the target instance Virtual JTAG XVC server.
5. Select the debug bridge instance from the Hardware window of the ChipScope tool.
6. In the Hardware Device Properties window select the appropriate probes file for your designby clicking the icon next to the Probes file entry, selecting the file, and clicking OK. This willrefresh the hardware device and it should now show the debug cores present in your design.
TIP: The probes file (.ltx) is written out during the implementation of the kernel by the Vivado tool, ifthe kernel has debug cores as specified in Hardware Debugging Using ChipScope.
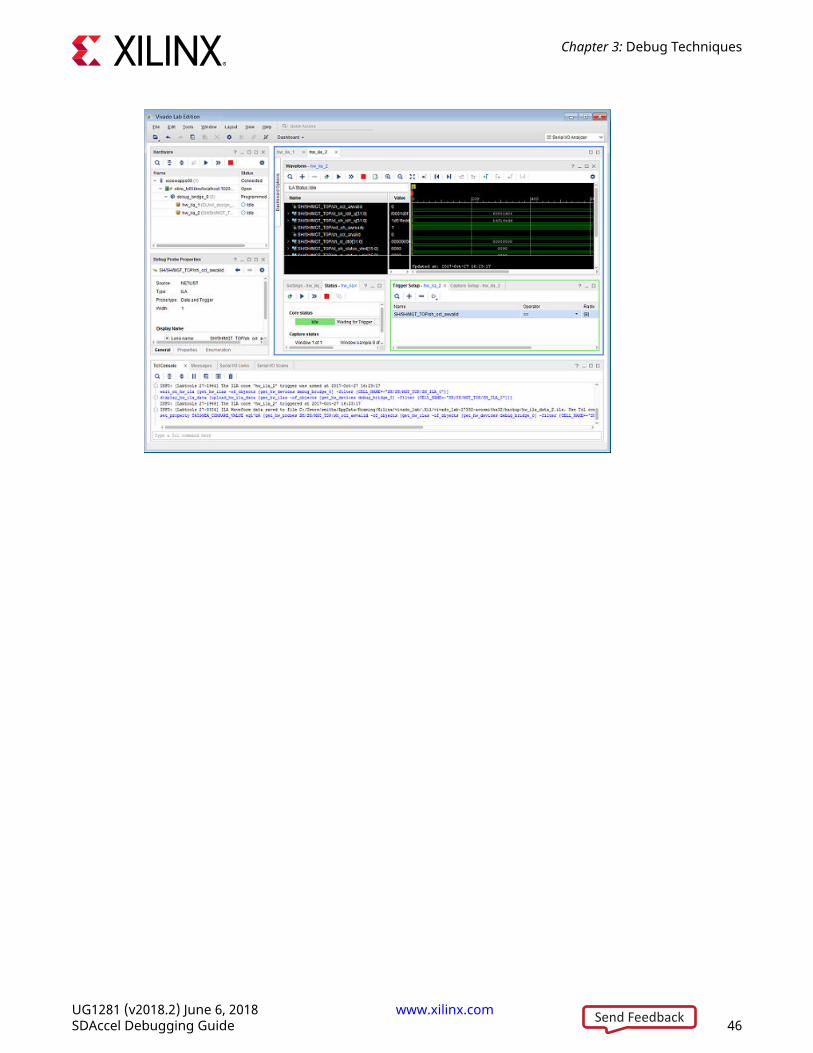
7. The ChipScope tool can now be used to debug the kernels running on the SDAccel platform.Refer to the Vivado Design Suite User Guide: Programming and Debugging (UG908) for moreinformation on working with the tool.
Chapter 3: Debug Techniques
UG1281 (v2018.2) June 6, 2018 www.xilinx.com [placeholder text]SDAccel Debugging Guide 45Send Feedback
Chapter 3: Debug Techniques
UG1281 (v2018.2) June 6, 2018 www.xilinx.com [placeholder text]SDAccel Debugging Guide 46Send Feedback
Appendix A
Additional Resources and LegalNotices
Xilinx Resources
For support resources such as Answers, Documentation, Downloads, and Forums, see XilinxSupport.
Solution Centers
See the Xilinx Solution Centers for support on devices, software tools, and intellectual propertyat all stages of the design cycle. Topics include design assistance, advisories, and troubleshootingtips
Xilinx ResourcesFor support resources such as Answers, Documentation, Downloads, and Forums, see XilinxSupport.
Documentation Navigator and DesignHubsXilinx® Documentation Navigator provides access to Xilinx documents, videos, and supportresources, which you can filter and search to find information. The Xilinx DocumentationNavigator (DocNav) is installed with SDSoC™ and SDAccel™. To open it:
• On Windows, select Start → All Programs → Xilinx Design Tools → DocNav.
• At the Linux command prompt, enter docnav.
UG1281 (v2018.2) June 6, 2018 www.xilinx.com [placeholder text]SDAccel Debugging Guide 47Send Feedback
Xilinx Design Hubs provide links to documentation organized by design tasks and other topics,which you can use to learn key concepts and address frequently asked questions. To access theDesign Hubs:
• In the Xilinx Documentation Navigator, click the Design Hubs View tab.
• On the Xilinx website, see the Design Hubs page.
Note: For more information on Documentation Navigator, see the Documentation Navigator page on theXilinx website.
References1. SDx Environments Release Notes, Installation, and Licensing Guide (UG1238)
2. SDAccel Environment User Guide (UG1023)
3. SDAccel Environment Profiling and Optimization Guide (UG1207)
4. SDAccel Environment Getting Started Tutorial (UG1021)
5. SDAccel Development Environment web page
6. Vivado® Design Suite Documentation
7. Vivado Design Suite User Guide: Designing IP Subsystems using IP Integrator (UG994)
8. Vivado Design Suite: Creating and Packaging Custom IP (UG1118)
9. Vivado Design Suite User Guide: Partial Reconfiguration (UG909)
10. Vivado Design Suite User Guide: High-Level Synthesis (UG902)
11. UltraFast Design Methodology Guide for the Vivado Design Suite (UG949)
12. Vivado Design Suite Properties Reference Guide (UG912)
13. Khronos Group web page: Documentation for the OpenCL standard
14. Xilinx Virtex UltraScale+ FPGA VCU1525 Acceleration Development Kit
15. Xilinx Kintex UltraScale FPGA KCU1500 Acceleration Development Kit
Appendix A: Additional Resources and Legal Notices
UG1281 (v2018.2) June 6, 2018 www.xilinx.com [placeholder text]SDAccel Debugging Guide 48Send Feedback
Please Read: Important Legal NoticesThe information disclosed to you hereunder (the "Materials") is provided solely for the selectionand use of Xilinx products. To the maximum extent permitted by applicable law: (1) Materials aremade available "AS IS" and with all faults, Xilinx hereby DISCLAIMS ALL WARRANTIES ANDCONDITIONS, EXPRESS, IMPLIED, OR STATUTORY, INCLUDING BUT NOT LIMITED TOWARRANTIES OF MERCHANTABILITY, NON-INFRINGEMENT, OR FITNESS FOR ANYPARTICULAR PURPOSE; and (2) Xilinx shall not be liable (whether in contract or tort, includingnegligence, or under any other theory of liability) for any loss or damage of any kind or naturerelated to, arising under, or in connection with, the Materials (including your use of theMaterials), including for any direct, indirect, special, incidental, or consequential loss or damage(including loss of data, profits, goodwill, or any type of loss or damage suffered as a result of anyaction brought by a third party) even if such damage or loss was reasonably foreseeable or Xilinxhad been advised of the possibility of the same. Xilinx assumes no obligation to correct anyerrors contained in the Materials or to notify you of updates to the Materials or to productspecifications. You may not reproduce, modify, distribute, or publicly display the Materialswithout prior written consent. Certain products are subject to the terms and conditions ofXilinx's limited warranty, please refer to Xilinx's Terms of Sale which can be viewed at https://www.xilinx.com/legal.htm#tos; IP cores may be subject to warranty and support terms containedin a license issued to you by Xilinx. Xilinx products are not designed or intended to be fail-safe orfor use in any application requiring fail-safe performance; you assume sole risk and liability foruse of Xilinx products in such critical applications, please refer to Xilinx's Terms of Sale which canbe viewed at https://www.xilinx.com/legal.htm#tos.
AUTOMOTIVE APPLICATIONS DISCLAIMER
AUTOMOTIVE PRODUCTS (IDENTIFIED AS "XA" IN THE PART NUMBER) ARE NOTWARRANTED FOR USE IN THE DEPLOYMENT OF AIRBAGS OR FOR USE IN APPLICATIONSTHAT AFFECT CONTROL OF A VEHICLE ("SAFETY APPLICATION") UNLESS THERE IS ASAFETY CONCEPT OR REDUNDANCY FEATURE CONSISTENT WITH THE ISO 26262AUTOMOTIVE SAFETY STANDARD ("SAFETY DESIGN"). CUSTOMER SHALL, PRIOR TO USINGOR DISTRIBUTING ANY SYSTEMS THAT INCORPORATE PRODUCTS, THOROUGHLY TESTSUCH SYSTEMS FOR SAFETY PURPOSES. USE OF PRODUCTS IN A SAFETY APPLICATIONWITHOUT A SAFETY DESIGN IS FULLY AT THE RISK OF CUSTOMER, SUBJECT ONLY TOAPPLICABLE LAWS AND REGULATIONS GOVERNING LIMITATIONS ON PRODUCTLIABILITY.
Copyright
© Copyright 2018 Xilinx, Inc. Xilinx, the Xilinx logo, Artix, ISE, Kintex, Spartan, Virtex, Vivado,Zynq, and other designated brands included herein are trademarks of Xilinx in the United Statesand other countries. OpenCL and the OpenCL logo are trademarks of Apple Inc. used bypermission by Khronos. All other trademarks are the property of their respective owners.
Appendix A: Additional Resources and Legal Notices
UG1281 (v2018.2) June 6, 2018 www.xilinx.com [placeholder text]SDAccel Debugging Guide 49Send Feedback