Embed Size (px)
Citation preview

Scotia Private Pools®and
Pinnacle PortfoliosInterim ReportJune 30, 2017
Money Market FundScotia Private Short Term Income Pool
Bond FundsScotia Private Income Pool
Scotia Private High Yield Income Pool
Scotia Private American Core-Plus Bond Pool
Balanced FundScotia Private Strategic Balanced Pool
Canadian Equity FundsScotia Private Canadian Value Pool
Scotia Private Canadian Mid Cap Pool
Scotia Private Canadian Growth Pool
Scotia Private Canadian Small Cap Pool
Foreign Equity FundsScotia Private U.S. Value Pool
Scotia Private U.S. Mid Cap Value Pool
Scotia Private U.S. Mid Cap Growth Pool
Scotia Private U.S. Large Cap Growth Pool
Scotia Private International Equity Pool
Scotia Private International Small to Mid Cap Value Pool
Scotia Private Emerging Markets Pool
Scotia Private Global Equity Pool
Scotia Private Global Real Estate Pool
Pinnacle PortfoliosPinnacle Income Portfolio
Pinnacle Balanced Portfolio
Pinnacle Growth Portfolio
SM54D 9098E-1 (08/17)
For more information about Scotia Private Pools® and Pinnacle Portfolios:
visit:www.scotiabank.com/scotiaprivatepoolswww.scotiabank.com/pinnacleportfolios
call:1-800-268-9269 (English)1-800-387-5004 (French)
write:1832 Asset Management L.P.
1 Adelaide Street East 28th Floor
Toronto, OntarioM5C 2V9
® Registered trademark of The Bank of Nova Scotia, used under licence.
403780_002-Pinnacle ARCvr Eng9_007409-Pinnacle ARCvr Eng.qx10 04/08/2017 21:53 Page 1

Tableof Contents
Financial Statements
Money Market Fund3 Scotia Private Short Term Income Pool
Bond Funds7 Scotia Private Income Pool11 Scotia Private High Yield Income Pool19 Scotia Private American Core-Plus Bond Pool
Balanced Fund29 Scotia Private Strategic Balanced Pool
Canadian Equity Funds35 Scotia Private Canadian Value Pool40 Scotia Private Canadian Mid Cap Pool45 Scotia Private Canadian Growth Pool50 Scotia Private Canadian Small Cap Pool
Foreign Equity Funds54 Scotia Private U.S. Value Pool58 Scotia Private U.S. Mid Cap Value Pool63 Scotia Private U.S. Mid Cap Growth Pool67 Scotia Private U.S. Large Cap Growth Pool72 Scotia Private International Equity Pool78 Scotia Private International Small to Mid Cap Value Pool85 Scotia Private Emerging Markets Pool91 Scotia Private Global Equity Pool96 Scotia Private Global Real Estate Pool
The Pinnacle Portfolios101 Pinnacle Income Portfolio105 Pinnacle Balanced Portfolio109 Pinnacle Growth Portfolio
113 Notes to the Financial Statements
125 Management’s Responsibility for Financial Reporting
1

2
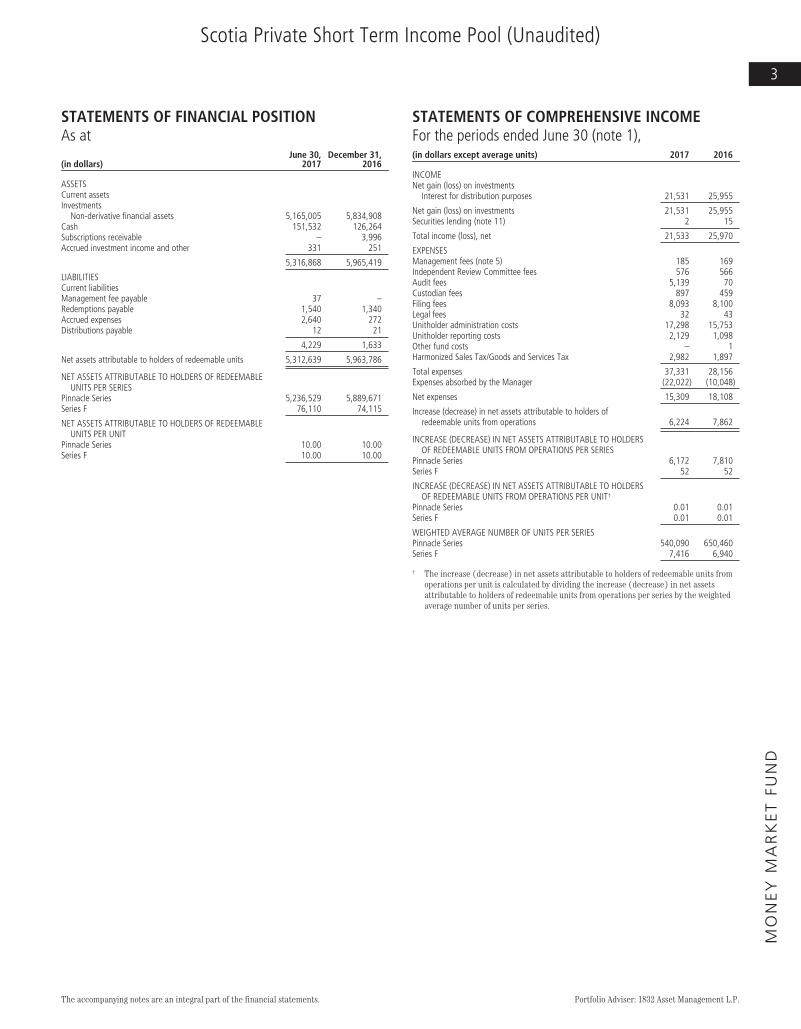
Scotia Private Short Term Income Pool (Unaudited)
STATEMENTS OF FINANCIAL POSITIONAs at
(in dollars)June 30,
2017December 31,
2016
ASSETSCurrent assetsInvestments
Non-derivative financial assets 5,165,005 5,834,908Cash 151,532 126,264Subscriptions receivable – 3,996Accrued investment income and other 331 251
5,316,868 5,965,419
LIABILITIESCurrent liabilitiesManagement fee payable 37 –Redemptions payable 1,540 1,340Accrued expenses 2,640 272Distributions payable 12 21
4,229 1,633
Net assets attributable to holders of redeemable units 5,312,639 5,963,786
NET ASSETS ATTRIBUTABLE TO HOLDERS OF REDEEMABLEUNITS PER SERIES
Pinnacle Series 5,236,529 5,889,671Series F 76,110 74,115
NET ASSETS ATTRIBUTABLE TO HOLDERS OF REDEEMABLEUNITS PER UNIT
Pinnacle Series 10.00 10.00Series F 10.00 10.00
STATEMENTS OF COMPREHENSIVE INCOMEFor the periods ended June 30 (note 1),(in dollars except average units) 2017 2016
INCOMENet gain (loss) on investments
Interest for distribution purposes 21,531 25,955
Net gain (loss) on investments 21,531 25,955Securities lending (note 11) 2 15
Total income (loss), net 21,533 25,970
EXPENSESManagement fees (note 5) 185 169Independent Review Committee fees 576 566Audit fees 5,139 70Custodian fees 897 459Filing fees 8,093 8,100Legal fees 32 43Unitholder administration costs 17,298 15,753Unitholder reporting costs 2,129 1,098Other fund costs – 1Harmonized Sales Tax/Goods and Services Tax 2,982 1,897
Total expenses 37,331 28,156Expenses absorbed by the Manager (22,022) (10,048)
Net expenses 15,309 18,108
Increase (decrease) in net assets attributable to holders ofredeemable units from operations 6,224 7,862
INCREASE (DECREASE) IN NET ASSETS ATTRIBUTABLE TO HOLDERSOF REDEEMABLE UNITS FROM OPERATIONS PER SERIES
Pinnacle Series 6,172 7,810Series F 52 52
INCREASE (DECREASE) IN NET ASSETS ATTRIBUTABLE TO HOLDERSOF REDEEMABLE UNITS FROM OPERATIONS PER UNIT†
Pinnacle Series 0.01 0.01Series F 0.01 0.01
WEIGHTED AVERAGE NUMBER OF UNITS PER SERIESPinnacle Series 540,090 650,460Series F 7,416 6,940
† The increase (decrease) in net assets attributable to holders of redeemable units fromoperations per unit is calculated by dividing the increase (decrease) in net assetsattributable to holders of redeemable units from operations per series by the weightedaverage number of units per series.
The accompanying notes are an integral part of the financial statements. Portfolio Adviser: 1832 Asset Management L.P.
MO
NE
YM
AR
KE
TFU
ND
3
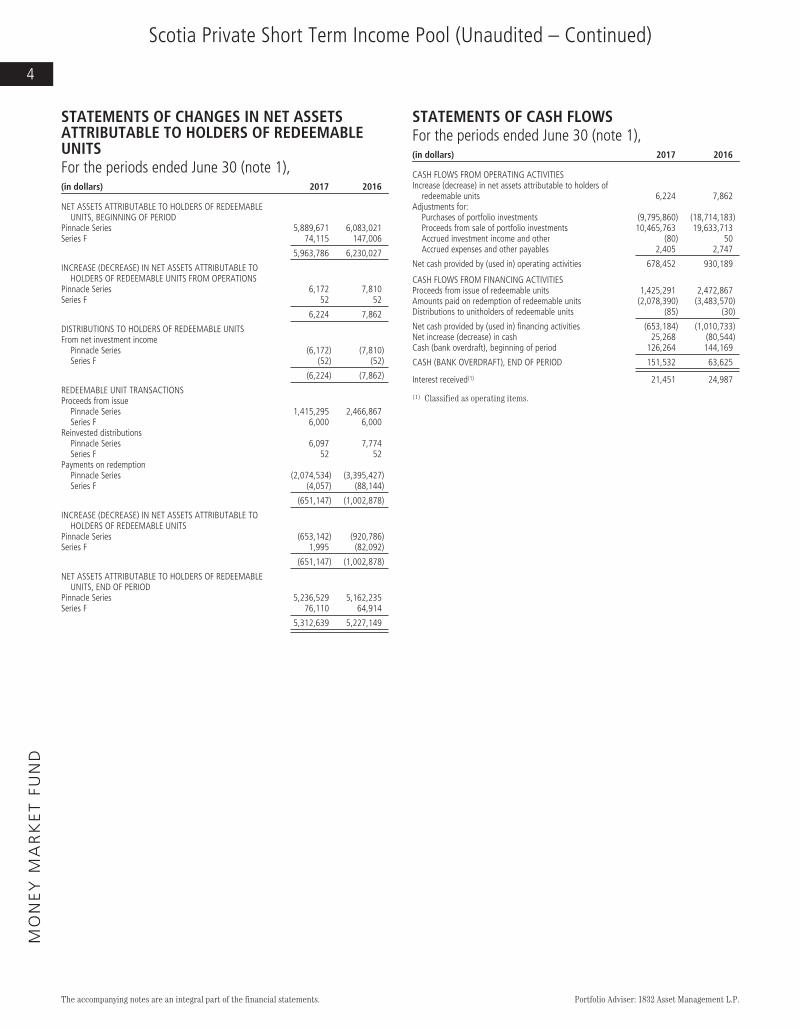
Scotia Private Short Term Income Pool (Unaudited – Continued)
STATEMENTS OF CHANGES IN NET ASSETSATTRIBUTABLE TO HOLDERS OF REDEEMABLEUNITSFor the periods ended June 30 (note 1),(in dollars) 2017 2016
NET ASSETS ATTRIBUTABLE TO HOLDERS OF REDEEMABLEUNITS, BEGINNING OF PERIOD
Pinnacle Series 5,889,671 6,083,021Series F 74,115 147,006
5,963,786 6,230,027
INCREASE (DECREASE) IN NET ASSETS ATTRIBUTABLE TOHOLDERS OF REDEEMABLE UNITS FROM OPERATIONS
Pinnacle Series 6,172 7,810Series F 52 52
6,224 7,862
DISTRIBUTIONS TO HOLDERS OF REDEEMABLE UNITSFrom net investment income
Pinnacle Series (6,172) (7,810)Series F (52) (52)
(6,224) (7,862)
REDEEMABLE UNIT TRANSACTIONSProceeds from issue
Pinnacle Series 1,415,295 2,466,867Series F 6,000 6,000
Reinvested distributionsPinnacle Series 6,097 7,774Series F 52 52
Payments on redemptionPinnacle Series (2,074,534) (3,395,427)Series F (4,057) (88,144)
(651,147) (1,002,878)
INCREASE (DECREASE) IN NET ASSETS ATTRIBUTABLE TOHOLDERS OF REDEEMABLE UNITS
Pinnacle Series (653,142) (920,786)Series F 1,995 (82,092)
(651,147) (1,002,878)
NET ASSETS ATTRIBUTABLE TO HOLDERS OF REDEEMABLEUNITS, END OF PERIOD
Pinnacle Series 5,236,529 5,162,235Series F 76,110 64,914
5,312,639 5,227,149
STATEMENTS OF CASH FLOWSFor the periods ended June 30 (note 1),(in dollars) 2017 2016
CASH FLOWS FROM OPERATING ACTIVITIESIncrease (decrease) in net assets attributable to holders of
redeemable units 6,224 7,862Adjustments for:
Purchases of portfolio investments (9,795,860) (18,714,183)Proceeds from sale of portfolio investments 10,465,763 19,633,713Accrued investment income and other (80) 50Accrued expenses and other payables 2,405 2,747
Net cash provided by (used in) operating activities 678,452 930,189
CASH FLOWS FROM FINANCING ACTIVITIESProceeds from issue of redeemable units 1,425,291 2,472,867Amounts paid on redemption of redeemable units (2,078,390) (3,483,570)Distributions to unitholders of redeemable units (85) (30)
Net cash provided by (used in) financing activities (653,184) (1,010,733)Net increase (decrease) in cash 25,268 (80,544)Cash (bank overdraft), beginning of period 126,264 144,169
CASH (BANK OVERDRAFT), END OF PERIOD 151,532 63,625
Interest received(1) 21,451 24,987
(1) Classified as operating items.
The accompanying notes are an integral part of the financial statements. Portfolio Adviser: 1832 Asset Management L.P.
MO
NE
YM
AR
KE
TFU
ND
4

Scotia Private Short Term Income Pool (Unaudited – Continued)
SCHEDULE OF INVESTMENT PORTFOLIOAs at June 30, 2017
IssuerFace
Value ($)AverageCost ($)
CarryingValue ($)
MONEY MARKET INSTRUMENTS – 97.2%Short Term Bonds – 28.9%Bank of Montreal (Floating Rate) 1.33% Dec 21, 2017 150,000 150,326 150,270Bank of Montreal 2.24% Dec 11, 2017 100,000 101,043 100,618BMW Canada Inc. 2.39% Nov 27, 2017 100,000 101,045 100,793Caisse Centrale Desjardins 3.50% Oct 05, 2017 100,000 102,357 101,464Canadian Imperial Bank of Commerce (Floating Rate)1.02% May 08, 2018 150,000 150,075 150,156Honda Canada Finance Inc. 2.28% Dec 11, 2017 100,000 101,205 100,662HSBC Bank of Canada 3.56% Oct 04, 2017 100,000 102,287 101,478Hydro Quebec Interest Strip 0.00% Aug 15, 2017 225,000 223,461 224,810Lower Mattagami Energy LP 2.23% Oct 23, 2017 100,000 100,587 100,812National Bank of Canada 2.69% Aug 21, 2017 150,000 152,233 151,761OMERS Realty Corporation 2.50% Jun 05, 2018 100,000 101,222 101,341Royal Bank of Canada (Floating Rate) 1.04%Aug 04, 2017 150,000 150,000 150,109
1,535,841 1,534,274
Bankers’ Acceptances – 6.6%Canadian Imperial Bank of Commerce 0.00%May 03, 2018 100,000 99,038 99,161Manulife Bank of Canada 0.00% Sep 26, 2017 100,000 98,971 99,755Toronto-Dominion Bank, The 0.00% Jul 05, 2017 150,000 149,684 149,987
347,693 348,903
Commercial Paper – 15.5%Daimler Canada Finance Inc. 0.00% Aug 11, 2017 125,000 124,664 124,878Enbridge Gas Distribution Inc. 0.00% Jul 06, 2017 100,000 99,782 99,987FortisBC Energy Inc. 0.00% Aug 02, 2017 100,000 99,804 99,932Greater Toronto Airports Authority 0.00% Jul 17, 2017 100,000 99,931 99,967Husky Energy Inc. 0.00% Jul 06, 2017 100,000 99,781 99,987Inter Pipeline Ltd. 0.00% Jul 11, 2017 100,000 99,852 99,976Ontario Teachers Financial Trust 0.00% Jul 20, 2017 200,000 199,716 199,924
823,530 824,651
Promissory Notes – 30.8%Province of Alberta 0.00% Sep 05, 2017 600,000 599,214 599,326Province of British Columbia 0.00% Aug 23, 2017 440,000 439,538 439,617Province of British Columbia 0.00% Jul 19, 2017 400,000 399,344 399,880Province of Prince Edward Island 0.00% Jul 17, 2017 200,000 199,680 199,947
1,637,776 1,638,770
Treasury Bills – 15.4%Province of Manitoba 0.00% Aug 16, 2017 500,000 499,310 499,647Province of Ontario 0.00% Mar 14, 2018 220,000 218,398 218,835Province of Quebec 0.00% Aug 18, 2017 100,000 99,858 99,925
817,566 818,407
TOTAL INVESTMENT PORTFOLIO 5,162,406 5,165,005
OTHER ASSETS, LESS LIABILITIES – 2.8% 147,634
NET ASSETS – 100.0% 5,312,639
Instruments with a 0.00% stated interest rate are purchased at a discount to face value. Thediscount represents the implied effective interest.
The accompanying notes are an integral part of the financial statements. Portfolio Adviser: 1832 Asset Management L.P.
MO
NE
YM
AR
KE
TFU
ND
5

Scotia Private Short Term Income Pool (Unaudited – Continued)
FUND SPECIFIC NOTESFor the periods indicated in Note 1
The Fund (note 1)
The Fund’s investment objective is to preserve investment capitalwhile providing interest income and maintaining liquidity by investingprimarily in highly liquid, senior investment grade money marketinstruments (i.e. federal and provincial treasury bills and bond) andbankers acceptances with a minimum credit rating of R-1(low) orA-1(low).
Risks associated with financial instruments (note 4)
Interest rate risk
The table below summarizes the Fund’s exposure to interest rate riskby the remaining term to maturity of the Fund’s portfolio, excludingcash and overdrafts, as applicable.
Interest rate exposureJune 30, 2017
($)December 31, 2016
($)
Less than 1 year 5,165,005 5,834,9081-3 years – –3-5 years – –5-10 years – –> 10 years – –
5,165,005 5,834,908
As at June 30, 2017, had the prevailing interest rates increased ordecreased by 0.25%, assuming a parallel shift in the yield curve and allother variables held constant, net assets attributable to holders ofredeemable units would have decreased or increased, respectively, by$1,573 or approximately 0.0% (December 31, 2016 – $1,751 orapproximately 0.0%).
Currency risk
The Fund did not have significant currency risk exposure as atJune 30, 2017 or December 31, 2016.
Price risk
The Fund did not have significant price risk exposure to equities,underlying funds, derivatives or commodities, if applicable, as atJune 30, 2017 and December 31, 2016.
Credit risk
The table below summarizes the credit ratings of bond and debenturesand money market instruments held by the Fund.
June 30, 2017 December 31, 2016
Credit ratings
Percentage oftotal money
marketinstruments
(%)
Percentage ofnet assets
(%)
Percentage oftotal money
marketinstruments
(%)
Percentage ofnet assets
(%)
Short Term RatingA-1+ 50.6 49.0 38.3 37.4A-1 19.8 19.3 24.2 23.7Bond Credit RatingAAA – – 6.9 6.8AA 15.5 15.2 13.8 13.5A 14.1 13.7 16.8 16.4
100.0 97.2 100.0 97.8
Concentration risk
Concentration risk arises as a result of the concentration of exposureswithin the same category, geographical location, asset type or industrysector, as applicable. The table below is a summary of the Fund’sconcentration risk:
Percentage of net assets (%)
June 30, 2017 December 31, 2016
Bankers’ Acceptances 6.6 7.1Bearers’ Deposit Notes – 1.7Commercial Paper 15.5 8.8Promissory Notes 30.8 21.3Provincial Bonds – 3.3Short Term Bonds 28.9 33.4Treasury Bills 15.4 22.2
Fair Value Classification (note 2)
The tables below illustrate the classification of the Fund’s financialinstruments within the fair value hierarchy.
June 30, 2017Level 1
($)Level 2
($)Level 3
($)Total($)
Bonds and debentures – 1,534,274 – 1,534,274Money market instruments – 3,630,731 – 3,630,731
– 5,165,005 – 5,165,005
December 31, 2016Level 1
($)Level 2
($)Level 3
($)Total($)
Bonds and debentures – 2,193,529 – 2,193,529Money market instruments – 3,641,379 – 3,641,379
– 5,834,908 – 5,834,908
Transfers between levels
During the periods ended June 30, 2017 and December 31, 2016, therewere no significant transfers between Level 1 and Level 2.
Offsetting of financial assets and liabilities (note 2)
As at June 30, 2017 and December 31, 2016, the Fund did not enter intoany agreement whereby the financial instruments were eligible foroffset.
Interest in Underlying Funds (note 2)
The Fund did not hold any interest in Underlying Funds as at June 30,2017 or December 31, 2016.
Comparison of net asset value per unit and net assets per unit(note 2)
As at June 30, 2017 or December 31, 2016, there were no differencesbetween the net asset value per unit and the net assets per unit for anyseries of the Fund.
The accompanying notes are an integral part of the financial statements.
MO
NE
YM
AR
KE
TFU
ND
6

Scotia Private Income Pool (Unaudited)
STATEMENTS OF FINANCIAL POSITIONAs at
(in dollars)June 30,
2017December 31,
2016
ASSETSCurrent assetsInvestments
Non-derivative financial assets 496,824,834 475,465,215Cash 8,348,015 11,909,637Receivable for securities sold 119,173,979 11,248,063Subscriptions receivable 1,510,084 735,817Accrued investment income and other 1,982,345 2,231,793
627,839,257 501,590,525
LIABILITIESCurrent liabilitiesManagement fee payable 1,105 39Payable for securities purchased 106,387,126 10,679,103Redemptions payable 838,186 529,990Accrued expenses 33,054 1,007Distributions payable 30,467 –
107,289,938 11,210,139
Net assets attributable to holders of redeemable units 520,549,319 490,380,386
NET ASSETS ATTRIBUTABLE TO HOLDERS OF REDEEMABLEUNITS PER SERIES
Pinnacle Series 495,407,629 464,089,721Series F 1,745,646 1,889,170Series I 23,396,044 24,401,495
NET ASSETS ATTRIBUTABLE TO HOLDERS OF REDEEMABLEUNITS PER UNIT
Pinnacle Series 10.69 10.67Series F 11.02 10.96Series I 10.79 10.70
STATEMENTS OF COMPREHENSIVE INCOMEFor the periods ended June 30 (note 1),(in dollars except average units) 2017 2016
INCOMENet gain (loss) on investments
Interest for distribution purposes 5,501,537 6,030,824Net realized gain (loss) on non-derivative financial assets (924,215) 1,243,025Change in unrealized gain (loss) on non-derivative financial
assets 2,394,942 11,574,213
Net gain (loss) on investments 6,972,264 18,848,062Securities lending (note 11) 24,806 21,148Other income 3,232 2,693
Total income (loss), net 7,000,302 18,871,903
EXPENSESManagement fees (note 5) 6,359 7,302Fixed administration fees (note 6) 172,622 150,120Independent Review Committee fees 576 563Other fund costs – 78Harmonized Sales Tax/Goods and Services Tax 17,980 16,136
Total expenses 197,537 174,199
Increase (decrease) in net assets attributable to holders ofredeemable units from operations 6,802,765 18,697,704
INCREASE (DECREASE) IN NET ASSETS ATTRIBUTABLE TOHOLDERS OF REDEEMABLE UNITS FROM OPERATIONSPER SERIES
Pinnacle Series 6,312,300 17,452,589Series F 22,066 76,822Series I 468,399 1,168,293
INCREASE (DECREASE) IN NET ASSETS ATTRIBUTABLE TOHOLDERS OF REDEEMABLE UNITS FROM OPERATIONSPER UNIT†
Pinnacle Series 0.14 0.46Series F 0.13 0.41Series I 0.21 0.45
WEIGHTED AVERAGE NUMBER OF UNITS PER SERIESPinnacle Series 45,052,964 38,299,617Series F 165,796 187,762Series I 2,260,147 2,615,235
† The increase (decrease) in net assets attributable to holders of redeemable units fromoperations per unit is calculated by dividing the increase (decrease) in net assetsattributable to holders of redeemable units from operations per series by the weightedaverage number of units per series.
The accompanying notes are an integral part of the financial statements. Portfolio Adviser: 1832 Asset Management L.P.
BO
ND
FUN
DS
7

Scotia Private Income Pool (Unaudited – Continued)
STATEMENTS OF CHANGES IN NET ASSETSATTRIBUTABLE TO HOLDERS OF REDEEMABLEUNITSFor the periods ended June 30 (note 1),(in dollars) 2017 2016
NET ASSETS ATTRIBUTABLE TO HOLDERS OF REDEEMABLEUNITS, BEGINNING OF PERIOD
Pinnacle Series 464,089,721 393,787,102Series F 1,889,170 2,200,367Series I 24,401,495 29,816,483
490,380,386 425,803,952
INCREASE (DECREASE) IN NET ASSETS ATTRIBUTABLE TOHOLDERS OF REDEEMABLE UNITS FROM OPERATIONS
Pinnacle Series 6,312,300 17,452,589Series F 22,066 76,822Series I 468,399 1,168,293
6,802,765 18,697,704
DISTRIBUTIONS TO HOLDERS OF REDEEMABLE UNITSFrom net investment income
Pinnacle Series (5,543,236) (5,973,092)Series F (12,614) (19,714)Series I (276,458) (396,771)
(5,832,308) (6,389,577)
REDEEMABLE UNIT TRANSACTIONSProceeds from issue
Pinnacle Series 82,676,050 81,180,191Series F 172,271 399,635Series I 502,200 70,601
Reinvested distributionsPinnacle Series 5,481,552 5,915,006Series F 7,283 13,687Series I 276,458 396,771
Payments on redemptionPinnacle Series (57,608,758) (42,557,197)Series F (332,530) (433,514)Series I (1,976,050) (3,159,850)
29,198,476 41,825,330
INCREASE (DECREASE) IN NET ASSETS ATTRIBUTABLE TOHOLDERS OF REDEEMABLE UNITS
Pinnacle Series 31,317,908 56,017,497Series F (143,524) 36,916Series I (1,005,451) (1,920,956)
30,168,933 54,133,457
NET ASSETS ATTRIBUTABLE TO HOLDERS OF REDEEMABLEUNITS, END OF PERIOD
Pinnacle Series 495,407,629 449,804,599Series F 1,745,646 2,237,283Series I 23,396,044 27,895,527
520,549,319 479,937,409
STATEMENTS OF CASH FLOWSFor the periods ended June 30 (note 1),(in dollars) 2017 2016
CASH FLOWS FROM OPERATING ACTIVITIESIncrease (decrease) in net assets attributable to holders of
redeemable units 6,802,765 18,697,704Adjustments for:
Net realized (gain) loss on non-derivative financialassets 924,215 (1,243,025)
Change in unrealized (gain) loss on non-derivativefinancial assets (2,394,942) (11,574,213)
Purchases of portfolio investments (468,920,437) (475,958,810)Proceeds from sale of portfolio investments 436,813,653 436,954,884Accrued investment income and other 249,448 (129,140)Accrued expenses and other payables 33,113 30,172
Net cash provided by (used in) operating activities (26,492,185) (33,222,428)
CASH FLOWS FROM FINANCING ACTIVITIESProceeds from issue of redeemable units 82,576,254 79,961,929Amounts paid on redemption of redeemable units (59,609,143) (45,706,974)Distributions to unitholders of redeemable units (36,548) (34,119)
Net cash provided by (used in) financing activities 22,930,563 34,220,836Net increase (decrease) in cash (3,561,622) 998,408Cash (bank overdraft), beginning of period 11,909,637 2,948,928
CASH (BANK OVERDRAFT), END OF PERIOD 8,348,015 3,947,336
Interest received(1) 5,750,987 5,901,685
(1) Classified as operating items.
The accompanying notes are an integral part of the financial statements. Portfolio Adviser: 1832 Asset Management L.P.
BO
ND
FUN
DS
8

Scotia Private Income Pool (Unaudited – Continued)
SCHEDULE OF INVESTMENT PORTFOLIOAs at June 30, 2017
IssuerFace
Value ($)AverageCost ($)
CarryingValue ($)
BONDS AND DEBENTURES – 95.5%Corporate Bonds – 29.1%Alimentation Couche-Tard Inc. (Callable) 3.60%Mar 02, 2025 2,000,000 2,056,000 2,068,943Allied Properties Real Estate Investment Trust3.75% May 13, 2020 1,500,000 1,550,700 1,547,461Allied Properties Real Estate Investment Trust3.93% Nov 14, 2022 970,000 996,093 997,884American Express Canada Credit Corporation2.31% Mar 29, 2018 2,000,000 2,025,720 2,014,628Bank of Montreal 1.61% Oct 28, 2021 2,033,000 2,032,898 1,996,206Bank of Montreal 1.88% Mar 31, 2021 4,733,000 4,756,492 4,719,928Bank of Montreal 2.10% Oct 06, 2020 8,528,000 8,638,341 8,600,629Bank of Montreal 2.84% Jun 04, 2020 159,000 167,212 163,799Bank of Nova Scotia, The 1.90% Dec 02, 2021 3,500,000 3,504,165 3,471,142Bank of Nova Scotia, The 2.13% Jun 15, 2020 2,370,000 2,386,711 2,391,664Bell Canada 3.25% Jun 17, 2020 2,000,000 2,096,020 2,072,808Canadian Imperial Bank of Commerce 1.64%Jul 12, 2021 3,456,000 3,454,593 3,408,777Canadian Imperial Bank of Commerce 1.85%Jul 14, 2020 4,871,000 4,888,901 4,879,733Canadian Imperial Bank of Commerce 1.90%Apr 26, 2021 4,599,000 4,596,609 4,590,617Caterpillar Financial Services Ltd. 1.75%Jun 03, 2019 4,000,000 4,041,520 4,009,375Daimler Canada Finance Inc. 1.91%Jul 08, 2021 2,500,000 2,511,975 2,474,379Dollarama Inc. 2.34% Jul 22, 2021 3,405,000 3,441,229 3,414,910Glacier Credit Card Trust 2.76% Nov 20, 2018 5,000,000 5,143,500 5,080,216Hollis Receivables Term Trust II 1.79%Feb 26, 2020 4,000,000 4,055,360 3,999,168Loblaw Companies Limited 3.75% Mar 12, 2019 3,000,000 3,145,020 3,098,957Manufacturers Life Insurance Company, The(Callable) 2.81% Feb 21, 2019 4,000,000 4,069,520 4,062,571Manulife Bank of Canada 1.41% Feb 27, 2018 5,000,000 5,007,200 5,001,888Metro Inc. (Callable) 3.20% Nov 01, 2021 1,500,000 1,570,170 1,553,241National Bank of Canada 1.74% Mar 03, 2020 9,300,000 9,340,176 9,287,014New Brunswick F-M Project Company Inc.6.47% Nov 30, 2027 1 1 1PSP Capital Inc. 3.29% Apr 04, 2024 15,000,000 16,422,600 16,002,959Rogers Communications Inc. 4.70%Sep 29, 2020 2,000,000 2,225,480 2,165,481Royal Bank of Canada 1.58% Sep 13, 2021 3,243,000 3,240,277 3,179,490Royal Bank of Canada 1.92% Jul 17, 2020 2,486,000 2,494,496 2,493,726Royal Bank of Canada 1.97% Mar 02, 2022 3,485,000 3,446,721 3,461,240Royal Bank of Canada 2.03% Mar 15, 2021 9,793,000 9,806,969 9,813,179TELUS Corporation (Callable) 3.75%Oct 17, 2024 3,000,000 3,184,560 3,168,486Toronto-Dominion Bank, The 1.69%Apr 02, 2020 6,131,000 6,166,462 6,120,324Toronto-Dominion Bank, The 1.91%Jul 18, 2023 4,539,000 4,552,677 4,444,793Toronto-Dominion Bank, The 2.05%Mar 08, 2021 7,244,000 7,294,802 7,271,057Toronto-Dominion Bank, The 2.56%Jun 24, 2020 3,072,000 3,172,956 3,141,038Toyota Credit Canada Inc. 2.75% Jul 18, 2018 5,000,000 5,123,350 5,066,314
152,607,476 151,234,026
Federal Bonds – 31.8%Canadian Government Bond 1.00%Jun 01, 2027 177,800,000 167,510,082 165,710,341
Mortgage-Backed Securities – 0.3%Canadian Credit Card Trust II 1.83%Mar 24, 2020 1,510,000 1,529,434 1,510,355
IssuerFace
Value ($)AverageCost ($)
CarryingValue ($)
BONDS AND DEBENTURES (cont'd)Provincial Bonds – 34.3%Province of Alberta 2.55% Jun 01, 2027 19,600,000 19,905,760 19,618,904Province of British Columbia 3.70%Dec 18, 2020 13,500,000 14,671,800 14,462,672Province of Manitoba 2.45% Jun 02, 2025 11,000,000 11,224,176 11,082,682Province of Ontario 2.60% Jun 02, 2027 26,400,000 27,192,000 26,727,583Province of Ontario 2.80% Jun 02, 2048 23,050,000 21,534,934 22,422,635Province of Ontario 3.50% Jun 02, 2024 9,500,000 10,428,910 10,296,275Province of Quebec 3.00% Sep 01, 2023 70,000,000 75,684,000 73,759,361
180,641,580 178,370,112
TOTAL INVESTMENT PORTFOLIO 502,288,572 496,824,834
OTHER ASSETS, LESS LIABILITIES – 4.5% 23,724,485
NET ASSETS – 100.0% 520,549,319
The accompanying notes are an integral part of the financial statements. Portfolio Adviser: 1832 Asset Management L.P.
BO
ND
FUN
DS
9

Scotia Private Income Pool (Unaudited – Continued)
FUND SPECIFIC NOTESFor the periods indicated in Note 1
The Fund (note 1)
The Fund’s investment objective is to preserve investment capitalwhile seeking to achieve increased income by investing primarily in aportfolio of Canadian government and corporate bonds, preferredshares of Canadian corporations and loans of supranationalorganizations.
Risks associated with financial instruments (note 4)
Interest rate risk
The table below summarizes the Fund’s exposure to interest rate riskby the remaining term to maturity of the Fund’s portfolio, excludingunderlying funds, preferred shares, cash and overdrafts, as applicable.
Interest rate exposureJune 30, 2017
($)December 31, 2016
($)
Less than 1 year 7,016,516 –1-3 years 51,551,063 46,885,2163-5 years 81,956,407 100,257,6385-10 years 333,878,211 260,597,773> 10 years 22,422,637 67,724,588
496,824,834 475,465,215
As at June 30, 2017, had the prevailing interest rates increased ordecreased by 0.25%, assuming a parallel shift in the yield curve and allother variables held constant, net assets attributable to holders ofredeemable units would have decreased or increased, respectively, by$8,829,248 or approximately 1.7% (December 31, 2016 – $9,191,491 orapproximately 1.9%).
Currency risk
The Fund did not have significant currency risk exposure as atJune 30, 2017 or December 31, 2016.
Price risk
The Fund did not have significant price risk exposure to equities,underlying funds, derivatives or commodities, if applicable, as atJune 30, 2017 and December 31, 2016.
Credit risk
The table below summarizes the credit ratings of bonds anddebentures, money market instruments and preferred shares held bythe Fund, as applicable.
June 30, 2017 December 31, 2016
Credit ratings
Percentage oftotal credit
ratedinstruments
(%)
Percentage ofnet assets
(%)
Percentage oftotal credit
ratedinstruments
(%)
Percentage ofnet assets
(%)
AAA 42.3 40.5 22.4 21.7AA 34.8 33.2 24.9 24.2A 18.9 18.0 48.4 47.0BBB 4.0 3.8 4.3 4.1
100.0 95.5 100.0 97.0
Concentration risk
Concentration risk arises as a result of the concentration of exposureswithin the same category, geographical location, asset type or industrysector, as applicable. The table below is a summary of the Fund’sconcentration risk:
Percentage of net assets (%)
June 30, 2017 December 31, 2016
Corporate Bonds 29.1 34.8Federal Bonds 31.8 15.5Mortgage-Backed Securities 0.3 1.1Provincial Bonds 34.3 45.6
Fair Value Classification (note 2)
The tables below illustrate the classification of the Fund’s financialinstruments within the fair value hierarchy.
June 30, 2017Level 1
($)Level 2
($)Level 3
($)Total($)
Bonds and debentures – 496,824,834 – 496,824,834
– 496,824,834 – 496,824,834
December 31, 2016Level 1
($)Level 2
($)Level 3
($)Total($)
Bonds and debentures – 475,465,215 – 475,465,215
– 475,465,215 – 475,465,215
Transfers between levels
During the periods ended June 30, 2017 and December 31, 2016, therewere no significant transfers between Level 1 and Level 2.
Offsetting of financial assets and liabilities (note 2)
As at June 30, 2017 and December 31, 2016, the Fund did not enter intoany agreement whereby the financial instruments were eligible foroffset.
Interest in Underlying Funds (note 2)
The Fund did not hold any interest in Underlying Funds as at June 30,2017 or December 31, 2016.
Comparison of net asset value per unit and net assets per unit(note 2)
As at June 30, 2017 or December 31, 2016, there were no differencesbetween the net asset value per unit and the net assets per unit for anyseries of the Fund.
The accompanying notes are an integral part of the financial statements.
BO
ND
FUN
DS
10

Scotia Private High Yield Income Pool (Unaudited)
STATEMENTS OF FINANCIAL POSITIONAs at
(in dollars)June 30,
2017December 31,
2016
ASSETSCurrent assetsInvestments
Non-derivative financial assets 1,276,419,214 1,227,956,543Unrealized gain on currency forward contracts 9,853,684 –
Cash 41,880 12,505Subscriptions receivable 5,351,752 1,010,350Accrued investment income and other 15,267,368 14,048,089
1,306,933,898 1,243,027,487
LIABILITIESCurrent liabilitiesManagement fee payable 143,658 –Payable for securities purchased 11,945,323 –Redemptions payable 2,174,528 1,083,084Accrued expenses 53,538 6,122Distributions payable 1,153,332 668Unrealized loss on currency spot contracts 25,802 –
15,496,181 1,089,874
Net assets attributable to holders of redeemable units 1,291,437,717 1,241,937,613
NET ASSETS ATTRIBUTABLE TO HOLDERS OFREDEEMABLE UNITS PER SERIES
Pinnacle Series 231,342,632 222,187,763Series F 16,747,937 16,993,904Series I 551,271,646 525,927,796Series K 8,034,497 1,327,050Series M 484,041,005 475,501,100
NET ASSETS ATTRIBUTABLE TO HOLDERS OFREDEEMABLE UNITS PER UNIT
Pinnacle Series 9.23 9.37Series F 9.64 9.73Series I 9.24 9.40Series K 10.15 10.32Series M 9.30 9.42
STATEMENTS OF COMPREHENSIVE INCOMEFor the periods ended June 30 (note 1),(in dollars except average units) 2017 2016
INCOMENet gain (loss) on investments
Dividends 1,398,157 2,507,138Interest for distribution purposes 31,213,056 29,091,097Net realized gain (loss) on non-derivative financial assets 34,034,263 1,283,507Net realized gain (loss) on currency forward contracts 8,776,289 (2,862,780)Change in unrealized gain (loss) on non-derivative
financial assets (70,110,540) 9,806,140Change in unrealized gain (loss) on currency forward
contracts 9,853,684 3,172,116Change in unrealized gain (loss) on currency spots
contracts (25,802) –
Net gain (loss) on investments 15,139,107 42,997,218Securities lending (note 11) 81 –Net realized and unrealized foreign currency translation gain
(loss) 968,403 (5,464,319)Other income 1,074 61
Total income (loss), net 16,108,665 37,532,960
EXPENSESManagement fees (note 5) 784,715 736,897Fixed administration fees (note 6) 283,875 243,972Independent Review Committee fees 576 563Interest expense and bank overdraft charges 924 452Foreign withholding taxes/tax reclaims 142,699 425,072Other fund costs – 196Harmonized Sales Tax/Goods and Services Tax 102,772 91,845Transaction costs 19,853 5,831
Total expenses 1,335,414 1,504,828
Increase (decrease) in net assets attributable to holders ofredeemable units from operations 14,773,251 36,028,132
INCREASE (DECREASE) IN NET ASSETS ATTRIBUTABLE TOHOLDERS OF REDEEMABLE UNITS FROM OPERATIONSPER SERIES
Pinnacle Series 2,880,295 6,263,599Series F 231,816 452,805Series I 5,493,525 15,837,178Series K 6,511 –Series M 6,161,104 13,474,550
INCREASE (DECREASE) IN NET ASSETS ATTRIBUTABLE TOHOLDERS OF REDEEMABLE UNITS FROM OPERATIONSPER UNIT†
Pinnacle Series 0.12 0.30Series F 0.13 0.25Series I 0.10 0.29Series K 0.01 –Series M 0.12 0.26
WEIGHTED AVERAGE NUMBER OF UNITS PER SERIESPinnacle Series 24,262,904 20,972,462Series F 1,754,585 1,784,618Series I 57,170,173 54,008,086Series K 457,883 –Series M 51,184,192 51,120,838
† The increase (decrease) in net assets attributable to holders of redeemable units fromoperations per unit is calculated by dividing the increase (decrease) in net assetsattributable to holders of redeemable units from operations per series by the weightedaverage number of units per series.
The accompanying notes are an integral part of the financial statements. Portfolio Adviser: Guardian Capital LP
BO
ND
FUN
DS
11
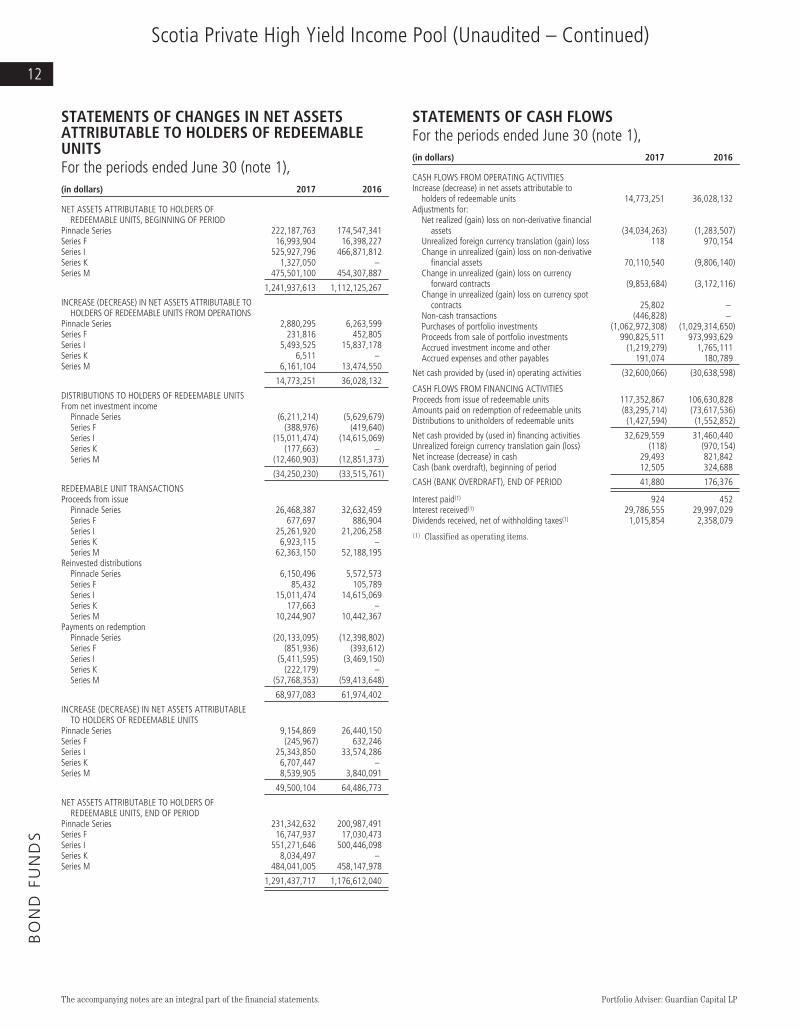
Scotia Private High Yield Income Pool (Unaudited – Continued)
STATEMENTS OF CHANGES IN NET ASSETSATTRIBUTABLE TO HOLDERS OF REDEEMABLEUNITSFor the periods ended June 30 (note 1),(in dollars) 2017 2016
NET ASSETS ATTRIBUTABLE TO HOLDERS OFREDEEMABLE UNITS, BEGINNING OF PERIOD
Pinnacle Series 222,187,763 174,547,341Series F 16,993,904 16,398,227Series I 525,927,796 466,871,812Series K 1,327,050 –Series M 475,501,100 454,307,887
1,241,937,613 1,112,125,267
INCREASE (DECREASE) IN NET ASSETS ATTRIBUTABLE TOHOLDERS OF REDEEMABLE UNITS FROM OPERATIONS
Pinnacle Series 2,880,295 6,263,599Series F 231,816 452,805Series I 5,493,525 15,837,178Series K 6,511 –Series M 6,161,104 13,474,550
14,773,251 36,028,132
DISTRIBUTIONS TO HOLDERS OF REDEEMABLE UNITSFrom net investment income
Pinnacle Series (6,211,214) (5,629,679)Series F (388,976) (419,640)Series I (15,011,474) (14,615,069)Series K (177,663) –Series M (12,460,903) (12,851,373)
(34,250,230) (33,515,761)
REDEEMABLE UNIT TRANSACTIONSProceeds from issue
Pinnacle Series 26,468,387 32,632,459Series F 677,697 886,904Series I 25,261,920 21,206,258Series K 6,923,115 –Series M 62,363,150 52,188,195
Reinvested distributionsPinnacle Series 6,150,496 5,572,573Series F 85,432 105,789Series I 15,011,474 14,615,069Series K 177,663 –Series M 10,244,907 10,442,367
Payments on redemptionPinnacle Series (20,133,095) (12,398,802)Series F (851,936) (393,612)Series I (5,411,595) (3,469,150)Series K (222,179) –Series M (57,768,353) (59,413,648)
68,977,083 61,974,402
INCREASE (DECREASE) IN NET ASSETS ATTRIBUTABLETO HOLDERS OF REDEEMABLE UNITS
Pinnacle Series 9,154,869 26,440,150Series F (245,967) 632,246Series I 25,343,850 33,574,286Series K 6,707,447 –Series M 8,539,905 3,840,091
49,500,104 64,486,773
NET ASSETS ATTRIBUTABLE TO HOLDERS OFREDEEMABLE UNITS, END OF PERIOD
Pinnacle Series 231,342,632 200,987,491Series F 16,747,937 17,030,473Series I 551,271,646 500,446,098Series K 8,034,497 –Series M 484,041,005 458,147,978
1,291,437,717 1,176,612,040
STATEMENTS OF CASH FLOWSFor the periods ended June 30 (note 1),(in dollars) 2017 2016
CASH FLOWS FROM OPERATING ACTIVITIESIncrease (decrease) in net assets attributable to
holders of redeemable units 14,773,251 36,028,132Adjustments for:
Net realized (gain) loss on non-derivative financialassets (34,034,263) (1,283,507)
Unrealized foreign currency translation (gain) loss 118 970,154Change in unrealized (gain) loss on non-derivative
financial assets 70,110,540 (9,806,140)Change in unrealized (gain) loss on currency
forward contracts (9,853,684) (3,172,116)Change in unrealized (gain) loss on currency spot
contracts 25,802 –Non-cash transactions (446,828) –Purchases of portfolio investments (1,062,972,308) (1,029,314,650)Proceeds from sale of portfolio investments 990,825,511 973,993,629Accrued investment income and other (1,219,279) 1,765,111Accrued expenses and other payables 191,074 180,789
Net cash provided by (used in) operating activities (32,600,066) (30,638,598)
CASH FLOWS FROM FINANCING ACTIVITIESProceeds from issue of redeemable units 117,352,867 106,630,828Amounts paid on redemption of redeemable units (83,295,714) (73,617,536)Distributions to unitholders of redeemable units (1,427,594) (1,552,852)
Net cash provided by (used in) financing activities 32,629,559 31,460,440Unrealized foreign currency translation gain (loss) (118) (970,154)Net increase (decrease) in cash 29,493 821,842Cash (bank overdraft), beginning of period 12,505 324,688
CASH (BANK OVERDRAFT), END OF PERIOD 41,880 176,376
Interest paid(1) 924 452Interest received(1) 29,786,555 29,997,029Dividends received, net of withholding taxes(1) 1,015,854 2,358,079
(1) Classified as operating items.
The accompanying notes are an integral part of the financial statements. Portfolio Adviser: Guardian Capital LP
BO
ND
FUN
DS
12

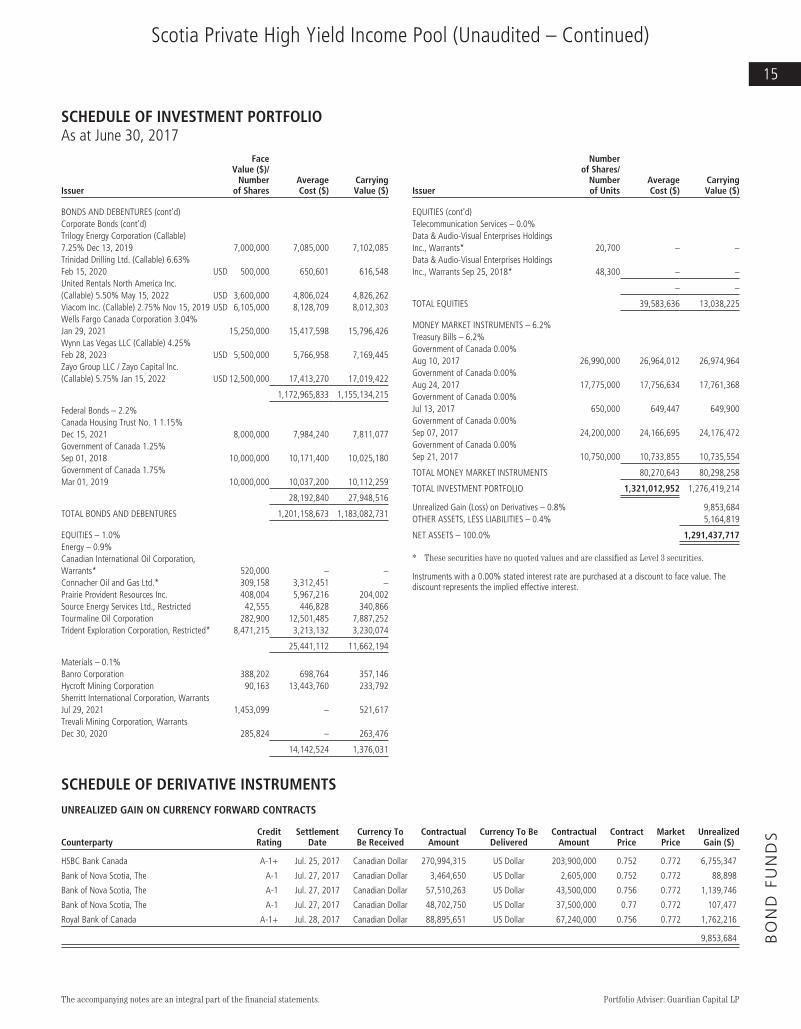
Scotia Private High Yield Income Pool (Unaudited – Continued)
SCHEDULE OF INVESTMENT PORTFOLIOAs at June 30, 2017
IssuerFace
Value ($)AverageCost ($)
CarryingValue ($)
BONDS AND DEBENTURES – 91.6%Corporate Bonds – 89.4%ADT Corporation, The 4.13% Jun 15, 2023 USD 15,250,000 18,574,969 19,613,780AGT Food & Ingredients Inc. (Callable)5.88% Dec 21, 2018 6,500,000 6,539,375 6,608,333AK Steel Corporation (Callable) 7.63%Oct 01, 2021 USD 4,500,000 4,885,541 6,050,097AK Steel Corporation (Callable) 8.38%Apr 01, 2022 USD 2,000,000 1,783,330 2,715,717Ally Financial Inc. 4.63% Mar 30, 2025 USD 5,000,000 6,696,185 6,643,892American International Group Inc.(Callable) 2.30% Jun 16, 2019 USD 12,000,000 16,434,104 15,639,548American International Group Inc. 3.38%Aug 15, 2020 USD 9,800,000 13,397,868 13,121,576American International Group Inc. 4.88%Jun 01, 2022 USD 1,300,000 1,936,251 1,850,475Amkor Technology Inc. (Callable) 6.38%Oct 01, 2022 USD 12,300,000 15,136,653 16,664,506Armstrong Energy Inc. (Callable) 11.75%Dec 15, 2019 USD 10,925,000 10,772,606 5,699,680Avis Budget Car Rental LLC / Avis BudgetFinance Inc. (Callable) 5.13% Jun 01, 2022 USD 8,250,000 10,820,196 10,629,238Avis Budget Car Rental LLC / Avis BudgetFinance Inc. (Callable) 6.38% Apr 01, 2019 USD 8,750,000 11,738,774 11,401,058Axalta Coating Systems LLC (Callable)4.88% Aug 15, 2019 USD 5,000,000 7,088,928 6,672,184Bank of Montreal 2.24% Dec 11, 2017 10,000,000 10,060,400 10,047,657Bank of Nova Scotia, The (Callable) 3.04%Oct 18, 2019 11,000,000 10,837,600 11,265,783Bank of Nova Scotia, The 2.40%Oct 28, 2019 1,300,000 1,299,701 1,320,353Banro Corporation (Callable) 10.00%Mar 01, 2021 USD 6,750,000 8,437,843 7,438,643Baytex Energy Corporation (Callable)5.13% Jun 01, 2021 USD 1,000,000 1,098,378 1,140,916Bellatrix Exploration Ltd. (Callable)8.50% May 15, 2020 USD 5,000,000 6,454,062 5,818,024Brookfield Residential Properties Inc.(Callable) 6.13% May 15, 2018 2,000,000 2,025,000 2,066,000Cablevision Systems Corporation 5.88%Sep 15, 2022 USD 2,500,000 3,070,856 3,391,341Cameco Corporation (Callable) 4.19%Mar 24, 2024 4,000,000 3,998,400 4,063,303CES Energy Solutions Corporation (Callable)7.38% Apr 17, 2020 4,500,000 4,500,000 4,676,250Canadian Imperial Bank of Commerce2.22% Mar 07, 2018 10,000,000 9,673,000 10,062,939Cascades Inc. 5.50% Jul 15, 2017 12,000,000 11,955,000 12,301,000CCO Holdings LLC / CCO Holdings CapitalCorporation (Callable) 5.25% Sep 30, 2017 USD 10,850,000 13,961,515 14,494,261CCO Holdings LLC / CCO Holdings CapitalCorporation (Callable) 5.50%May 01, 2021 USD 2,250,000 3,079,958 3,096,416CenturyLink Inc. 5.80% Mar 15, 2022 USD 11,850,000 13,754,105 16,018,110Cheniere Corpus Christi Holdings LLC5.13% Jun 30, 2027 USD 1,000,000 1,364,294 1,333,770CHS/ Community Health Systems Inc.(Callable) 6.25% Mar 31, 2020 USD 3,500,000 4,728,177 4,715,024CHS/Community Health Systems Inc.(Callable) 5.13% Aug 01, 2021 USD 10,000,000 13,266,313 13,119,044CIT Group Inc. 3.88% Feb 19, 2019 USD 4,100,000 5,587,419 5,449,453CIT Group Inc. 5.38% May 15, 2020 USD 4,800,000 6,730,795 6,723,398CIT Group Inc. 5.50% Feb 15, 2019 USD 4,252,000 5,888,538 5,802,116
IssuerFace
Value ($)AverageCost ($)
CarryingValue ($)
BONDS AND DEBENTURES (cont'd)Corporate Bonds (cont'd)Clearwater Seafoods Inc. (Callable)6.88% May 01, 2020 USD 1,500,000 2,025,139 2,043,342Concordia Healthcare Corporation(Callable) 7.00% Apr 15, 2018 USD 1,250,000 1,573,119 244,681Concordia Healthcare Corporation(Callable) 9.50% Dec 15, 2018 USD 12,250,000 15,289,752 2,898,478Consolidated Energy Finance SA (Callable)6.75% Oct 15, 2019 USD 4,500,000 5,857,454 5,986,212CPPIB Capital Inc. 1.40% Jun 04, 2020 9,330,000 9,440,094 9,290,141Credit Suisse AG 6.00% Feb 15, 2018 USD 8,000,000 11,073,524 10,624,729Crestwood Midstream Partners LP /Crestwood Midstream Finance Corporation(Callable) 6.25% Apr 01, 2018 USD 10,000,000 14,060,269 13,256,927CSC Holdings LLC (Callable) 10.13%Jan 15, 2019 USD 2,000,000 3,102,550 3,024,932CSC Holdings LLC 5.25% Jun 01, 2024 USD 2,500,000 2,914,412 3,321,622Data & Audio-Visual Enterprises HoldingsInc. (Callable) 15.00% Sep 25, 2018* 2,186,511 1,904,607 –DISH DBS Corporation 4.25% Apr 01, 2018 USD 5,000,000 5,013,554 6,571,612DISH DBS Corporation 5.88% Jul 15, 2022 USD 6,000,000 8,214,721 8,387,678DISH DBS Corporation 5.88%Nov 15, 2024 USD 15,300,000 19,668,500 21,237,624DPL Inc. (Callable) 6.75% Sep 01, 2019 USD 3,000,000 4,150,158 4,077,232DPL Inc. (Callable) 7.25% Jul 15, 2021 USD 10,400,000 11,734,581 14,412,301Dynegy Inc. (Callable) 5.88% Jun 01, 2018 USD 5,000,000 6,209,514 6,115,440Dynegy Inc. (Callable) 6.75% May 22, 2017 USD 13,500,000 18,488,712 18,153,440Dynegy Inc. (Callable) 7.38% Nov 01, 2018 USD 6,000,000 7,745,232 7,735,722Exela Intermediate LLC / Exela Finance Inc.(Callable) 10.00% Jul 15, 2020 USD 9,000,000 11,721,650 11,595,532Fairfax Financial Holdings Limited6.40% May 25, 2021 1,500,000 1,502,020 1,681,075Fairfax Financial Holdings Limited 7.38%Apr 15, 2018 USD 13,117,000 15,750,406 17,771,749Fairfax Financial Holdings Limited 7.75%Jul 15, 2037 USD 2,000,000 1,943,339 3,111,343First Data Corporation (Callable) 5.00%Jan 15, 2019 USD 2,450,000 3,330,180 3,287,239First Data Corporation (Callable) 7.00%Dec 01, 2018 USD 15,000,000 21,435,242 20,831,313First Quantum Minerals Ltd. (Callable)7.00% Feb 15, 2018 USD 4,015,000 3,695,481 5,349,932Fly Leasing Ltd. (Callable) 6.75%Dec 15, 2020 USD 7,300,000 8,251,049 9,913,978Ford Credit Canada Ltd. 2.92%Sep 16, 2020 3,000,000 3,085,800 3,045,926Ford Credit Canada Ltd. 2.94%Feb 19, 2019 3,000,000 3,052,500 3,046,034Freeport-McMoRan Inc. (Callable) 3.55%Dec 01, 2021 USD 2,400,000 2,986,674 2,923,354Frontier Communications Corporation(Callable) 11.00% Jun 15, 2025 USD 9,500,000 12,750,323 11,425,101Frontier Communications Corporation8.75% Apr 15, 2022 USD 2,100,000 2,285,506 2,474,663Gateway Casinos & Entertainment Ltd.(Callable) 8.25% Mar 01, 2020 USD 350,000 457,660 473,059Gibson Energy Inc. (Callable) 5.25%Jul 15, 2020 14,300,000 14,302,500 14,276,167Goldman Sachs Group Inc., The 3.38%Feb 01, 2018 6,000,000 5,992,080 6,068,944Golf Town Canada Inc. (Callable) 10.50%Jul 24, 2018 14,435,000 14,179,375 2,631,501
The accompanying notes are an integral part of the financial statements. Portfolio Adviser: Guardian Capital LP
BO
ND
FUN
DS
13

Scotia Private High Yield Income Pool (Unaudited – Continued)
SCHEDULE OF INVESTMENT PORTFOLIOAs at June 30, 2017
IssuerFace
Value ($)AverageCost ($)
CarryingValue ($)
BONDS AND DEBENTURES (cont'd)Corporate Bonds (cont'd)Harvest Operations Corporation 2.33%Apr 14, 2021 USD 4,950,000 6,201,627 6,258,977HCA Inc. (Callable) 4.50% Aug 15, 2026 USD 10,000,000 13,359,364 13,385,539HCA Inc. 6.50% Feb 15, 2020 USD 3,000,000 4,371,665 4,256,421HCA Inc. 8.00% Oct 01, 2018 USD 3,950,000 5,775,976 5,518,047Hertz Corp, The (Callable) 6.25%Oct 15, 2022 USD 13,706,000 17,341,472 15,694,259HSBC Bank of Canada 2.94% Jan 14, 2020 5,000,000 4,895,100 5,134,604HSBC Holdings PLC 2.65% Jan 05, 2022 USD 5,000,000 6,551,299 6,440,925Icahn Enterprises LP / Icahn EnterprisesFinance Corporation (Callable) 6.00%Feb 01, 2020 USD 6,750,000 8,915,790 9,017,474IGM Financial Inc. (Callable) 3.44%Oct 26, 2026 2,250,000 2,248,493 2,294,750Iron Mountain Canada Operations ULC(Callable) 5.38% Sep 15, 2019 1,000,000 1,000,000 1,049,800Iron Mountain Canada Operations ULC(Callable) 6.13% Aug 15, 2021 11,000,000 11,155,000 11,430,833JBS USA LLC / JBS USA Finance Inc.(Callable) 5.75% Jun 15, 2020 USD 17,500,000 21,332,220 21,447,602Kellogg Company 3.25% Apr 01, 2026 USD 1,000,000 1,352,889 1,300,722Kinder Morgan Inc. (Callable) 4.30%Mar 01, 2025 USD 3,300,000 4,070,287 4,444,824Kinder Morgan Inc. 7.25% Jun 01, 2018 USD 900,000 919,889 1,221,775Loblaw Companies Limited 3.75%Mar 12, 2019 5,000,000 5,243,650 5,164,928Lundin Mining Corporation (Callable)7.88% Nov 01, 2018 USD 4,500,000 5,678,151 6,403,243MEG Energy Corporation (Callable) 6.38%Jul 30, 2017 USD 6,425,000 6,537,382 6,493,056MEG Energy Corporation (Callable) 7.00%Sep 30, 2018 USD 3,000,000 3,757,645 3,020,031Methanex Corporation 5.25%Mar 01, 2022 USD 8,500,000 10,469,543 11,614,202MGM Resorts International 6.63%Dec 15, 2021 USD 1,500,000 1,727,041 2,192,037Midcontinent Express Pipeline LLC 6.70%Sep 15, 2019 USD 7,500,000 10,263,049 10,410,989Morgan Stanley 1.49% Jan 24, 2019 USD 9,000,000 11,926,303 11,705,858Morgan Stanley 2.50% Jan 24, 2019 USD 13,000,000 17,523,065 16,946,215Navistar International Corporation(Callable) 8.25% Nov 01, 2021 USD 2,000,000 2,162,940 2,627,037Netflix Inc. 3.63% May 15, 2027 EUR 3,750,000 5,559,015 5,639,371New Gold Inc. (Callable) 6.25%Nov 15, 2017 USD 3,900,000 4,397,376 5,233,304Newalta Corporation (Callable) 5.88%Apr 01, 2021 6,650,000 6,658,000 5,748,094Newalta Corporation (Callable) 7.75%Nov 14, 2019 2,500,000 2,500,000 2,435,416NGPL PipeCo LLC 7.12% Dec 15, 2017 USD 18,689,000 24,323,318 24,751,640NGPL PipeCo LLC 7.77% Dec 15, 2037 USD 5,000,000 7,558,023 7,673,568Norbord Inc. 6.25% Apr 15, 2023 USD 3,500,000 4,379,053 4,855,376Novelis Corporation (Callable) 5.88%Sep 30, 2021 USD 13,200,000 17,823,707 17,730,692NRG Energy Inc. (Callable) 6.63%Sep 15, 2017 USD 12,500,000 17,056,512 16,616,617Parkland Fuel Corporation (Callable)5.50% May 28, 2021 3,800,000 3,762,000 3,925,875Parkland Fuel Corporation (Callable)5.63% May 09, 2020 1,500,000 1,500,000 1,515,313Parkland Fuel Corporation (Callable) 5.75%Sep 16, 2019 5,000,000 5,050,000 5,145,833
IssuerFace
Value ($)AverageCost ($)
CarryingValue ($)
BONDS AND DEBENTURES (cont'd)Corporate Bonds (cont'd)Parkland Fuel Corporation (Callable) 6.00%Nov 21, 2022 500,000 500,625 520,833Postmedia Network Inc. (Callable) 8.25%Jul 15, 2021 4,935,206 4,957,190 4,662,783Precision Drilling Corporation (Callable)5.25% May 15, 2019 USD 4,500,000 5,832,356 5,206,409Precision Drilling Corporation (Callable)7.75% Dec 15, 2019 USD 1,000,000 1,420,124 1,283,531Quebecor Media Inc. 6.63% Jan 15, 2023 6,750,000 6,753,938 7,346,250Reynolds Group Issuer LLC (Callable)5.75% Oct 15, 2020 USD 18,400,000 22,703,598 24,507,967RioCan Real Estate Investment Trust 3.72%Dec 13, 2021 4,290,000 4,277,988 4,484,921Rite Aid Corporation (Callable) 6.13%Apr 01, 2018 USD 13,000,000 17,517,736 16,577,355River Cree Enterprises LP (Callable) 11.00%Jan 20, 2018 6,250,000 6,190,918 6,547,932Rockies Express Pipeline LLC 5.63%Apr 15, 2020 USD 10,000,000 13,056,521 13,787,841Rockies Express Pipeline LLC 6.00%Jan 15, 2019 USD 10,115,000 13,583,792 13,715,660Royal Bank of Canada (Callable) 2.99%Dec 06, 2019 5,000,000 4,821,650 5,121,021Royal Bank of Canada 2.82% Jul 12, 2018 11,750,000 12,076,298 11,915,242Sabine Pass Liquefaction LLC (Callable)4.20% Sep 15, 2027 USD 1,000,000 1,326,909 1,308,080Scientific Games International Inc.(Callable) 10.00% Dec 01, 2018 USD 3,975,000 5,217,048 5,670,834Shaw Communications Inc. (Callable)4.35% Oct 31, 2023 8,000,000 8,426,000 8,656,309Sherritt International Corporation (Callable)7.50% Sep 24, 2019 4,434,329 4,369,946 2,813,952Sherritt International Corporation (Callable)7.88% Oct 11, 2018 10,250,000 9,966,250 6,192,707Sherritt International Corporation (Callable)8.00% Nov 15, 2017 5,153,211 5,295,049 3,478,417Sobeys Inc. 3.52% Aug 08, 2018 4,300,000 4,443,577 4,372,983Source Energy Services Canada LP(Callable) 10.50% Dec 15, 2018 4,556,809 4,556,809 5,171,067Southern Pacific Resource Corporation(Callable) 8.75% Jan 25, 2018* 6,000,000 5,540,250 –Sprint Communications Inc. 9.00%Nov 15, 2018 USD 8,750,000 12,689,384 12,354,379Sprint Corporation 7.25% Sep 15, 2021 USD 11,500,000 14,129,393 16,602,546Superior Plus Corporation (Callable) 5.25%Feb 27, 2020 7,500,000 7,500,000 7,706,250Superior Plus LP (Callable) 6.50%Dec 09, 2017 7,500,000 7,500,000 7,964,063Taseko Mines Ltd. (Callable) 7.75%Apr 15, 2019 USD 10,500,000 9,583,374 13,671,060Taseko Mines Ltd. (Callable) 8.75%Jun 15, 2019 USD 10,930,000 14,625,335 14,082,130Tesoro Corporation (Callable) 4.75%Oct 15, 2023 USD 4,000,000 5,631,653 5,606,565Time Inc. (Callable) 5.75% Apr 15, 2022 USD 11,500,000 14,829,507 15,260,599T-Mobile US Inc. (Callable) 6.50%Jan 15, 2019 USD 4,000,000 5,367,130 5,585,121T-Mobile US Inc. (Callable) 6.63%Apr 01, 2018 USD 13,250,000 18,551,639 18,209,967Transcontinental Inc. 3.90% May 13, 2019 10,000,000 10,090,909 10,216,195Trevali Mining Corporation (Callable)12.50% May 30, 2018 2,320,000 2,254,122 2,302,600
The accompanying notes are an integral part of the financial statements. Portfolio Adviser: Guardian Capital LP
BO
ND
FUN
DS
14
Scotia Private High Yield Income Pool (Unaudited – Continued)
SCHEDULE OF INVESTMENT PORTFOLIOAs at June 30, 2017
Issuer
FaceValue ($)/
Numberof Shares
AverageCost ($)
CarryingValue ($)
BONDS AND DEBENTURES (cont'd)Corporate Bonds (cont'd)Trilogy Energy Corporation (Callable)7.25% Dec 13, 2019 7,000,000 7,085,000 7,102,085Trinidad Drilling Ltd. (Callable) 6.63%Feb 15, 2020 USD 500,000 650,601 616,548United Rentals North America Inc.(Callable) 5.50% May 15, 2022 USD 3,600,000 4,806,024 4,826,262Viacom Inc. (Callable) 2.75% Nov 15, 2019 USD 6,105,000 8,128,709 8,012,303Wells Fargo Canada Corporation 3.04%Jan 29, 2021 15,250,000 15,417,598 15,796,426Wynn Las Vegas LLC (Callable) 4.25%Feb 28, 2023 USD 5,500,000 5,766,958 7,169,445Zayo Group LLC / Zayo Capital Inc.(Callable) 5.75% Jan 15, 2022 USD 12,500,000 17,413,270 17,019,422
1,172,965,833 1,155,134,215
Federal Bonds – 2.2%Canada Housing Trust No. 1 1.15%Dec 15, 2021 8,000,000 7,984,240 7,811,077Government of Canada 1.25%Sep 01, 2018 10,000,000 10,171,400 10,025,180Government of Canada 1.75%Mar 01, 2019 10,000,000 10,037,200 10,112,259
28,192,840 27,948,516
TOTAL BONDS AND DEBENTURES 1,201,158,673 1,183,082,731
EQUITIES – 1.0%Energy – 0.9%Canadian International Oil Corporation,Warrants* 520,000 – –Connacher Oil and Gas Ltd.* 309,158 3,312,451 –Prairie Provident Resources Inc. 408,004 5,967,216 204,002Source Energy Services Ltd., Restricted 42,555 446,828 340,866Tourmaline Oil Corporation 282,900 12,501,485 7,887,252Trident Exploration Corporation, Restricted* 8,471,215 3,213,132 3,230,074
25,441,112 11,662,194
Materials – 0.1%Banro Corporation 388,202 698,764 357,146Hycroft Mining Corporation 90,163 13,443,760 233,792Sherritt International Corporation, WarrantsJul 29, 2021 1,453,099 – 521,617Trevali Mining Corporation, WarrantsDec 30, 2020 285,824 – 263,476
14,142,524 1,376,031
Issuer
Numberof Shares/
Numberof Units
AverageCost ($)
CarryingValue ($)
EQUITIES (cont'd)Telecommunication Services – 0.0%Data & Audio-Visual Enterprises HoldingsInc., Warrants* 20,700 – –Data & Audio-Visual Enterprises HoldingsInc., Warrants Sep 25, 2018* 48,300 – –
– –
TOTAL EQUITIES 39,583,636 13,038,225
MONEY MARKET INSTRUMENTS – 6.2%Treasury Bills – 6.2%Government of Canada 0.00%Aug 10, 2017 26,990,000 26,964,012 26,974,964Government of Canada 0.00%Aug 24, 2017 17,775,000 17,756,634 17,761,368Government of Canada 0.00%Jul 13, 2017 650,000 649,447 649,900Government of Canada 0.00%Sep 07, 2017 24,200,000 24,166,695 24,176,472Government of Canada 0.00%Sep 21, 2017 10,750,000 10,733,855 10,735,554
TOTAL MONEY MARKET INSTRUMENTS 80,270,643 80,298,258
TOTAL INVESTMENT PORTFOLIO 1,321,012,952 1,276,419,214
Unrealized Gain (Loss) on Derivatives – 0.8% 9,853,684OTHER ASSETS, LESS LIABILITIES – 0.4% 5,164,819
NET ASSETS – 100.0% 1,291,437,717
* These securities have no quoted values and are classified as Level 3 securities.
Instruments with a 0.00% stated interest rate are purchased at a discount to face value. Thediscount represents the implied effective interest.
SCHEDULE OF DERIVATIVE INSTRUMENTS
UNREALIZED GAIN ON CURRENCY FORWARD CONTRACTS
CounterpartyCreditRating
SettlementDate
Currency ToBe Received
ContractualAmount
Currency To BeDelivered
ContractualAmount
ContractPrice
MarketPrice
UnrealizedGain ($)
HSBC Bank Canada A-1+ Jul. 25, 2017 Canadian Dollar 270,994,315 US Dollar 203,900,000 0.752 0.772 6,755,347
Bank of Nova Scotia, The A-1 Jul. 27, 2017 Canadian Dollar 3,464,650 US Dollar 2,605,000 0.752 0.772 88,898
Bank of Nova Scotia, The A-1 Jul. 27, 2017 Canadian Dollar 57,510,263 US Dollar 43,500,000 0.756 0.772 1,139,746
Bank of Nova Scotia, The A-1 Jul. 27, 2017 Canadian Dollar 48,702,750 US Dollar 37,500,000 0.77 0.772 107,477
Royal Bank of Canada A-1+ Jul. 28, 2017 Canadian Dollar 88,895,651 US Dollar 67,240,000 0.756 0.772 1,762,216
9,853,684
The accompanying notes are an integral part of the financial statements. Portfolio Adviser: Guardian Capital LP
BO
ND
FUN
DS
15

Scotia Private High Yield Income Pool (Unaudited – Continued)
FUND SPECIFIC NOTESFor the periods indicated in Note 1
The Fund (note 1)
The Fund’s investment objective is to achieve superior long termreturns and to provide income as well as capital growth by investingprimarily in high yield, lower rated Canadian corporate bonds,preferred shares and short term money market securities.
Risks associated with financial instruments (note 4)
Interest rate risk
The table below summarizes the Fund’s exposure to interest rate riskby the remaining term to maturity of the Fund’s portfolio, excludingunderlying funds, preferred shares, cash and overdrafts, as applicable.
Interest rate exposureJune 30, 2017
($)December 31, 2016
($)
Less than 1 year 229,472,575 319,346,4491-3 years 317,500,759 369,994,5713-5 years 278,412,436 232,871,3975-10 years 424,568,458 182,702,433> 10 years 13,426,761 3,086,179
1,263,380,989 1,108,001,029
As at June 30, 2017, had the prevailing interest rates increased ordecreased by 0.25%, assuming a parallel shift in the yield curve and allother variables held constant, net assets attributable to holders ofredeemable units would have decreased or increased, respectively, by$8,726,047 or approximately 0.7% (December 31, 2016 – $7,829,240 orapproximately 0.6%).
Currency risk
The Fund’s exposure to currency risk is summarized in the tablesbelow. Amounts shown are based on the carrying value of monetary andnon-monetary assets and liabilities of the Fund net of currencycontracts, as applicable.
June 30, 2017
CurrencyGross currencyexposure ($)
Currencycontracts ($)
Netexposure ($)
Percentage ofnet assets (%)
US Dollar 892,105,233 (459,713,943) 432,391,290 33.5Euro 5,671,778 – 5,671,778 0.4
897,777,011 (459,713,943) 438,063,068 33.9
December 31, 2016
CurrencyGross currencyexposure ($)
Currencycontracts ($)
Netexposure ($)
Percentage ofnet assets (%)
US Dollar 781,119,967 – 781,119,967 62.9
781,119,967 – 781,119,967 62.9
If the Canadian dollar strengthened or weakened by 10% in relation toall other currencies, with all other variables held constant, net assetsof the Fund could possibly have decreased or increased, respectively,by $43,806,307 or 3.4% of net assets (December 31, 2016 – $78,111,997or 6.3%). In practice, actual results may differ from this sensitivityanalysis and the difference could be material.
Price risk
Price risk is the risk that the carrying value of financial instrumentswill fluctuate as a result of changes in market prices (other than thosearising from interest rate risk or currency risk) caused by factorsspecific to a security, its issuer or all factors affecting a market or amarket segment. Exposure to price risk is mainly in equities,underlying funds, derivatives and commodities, as applicable. As atJune 30, 2017, approximately 1.0% (December 31, 2016 – 9.6%) of theFund’s net assets were exposed to price risk. If prices of theseinstruments had decreased or increased by 10%, with all othervariables held constant, net assets of the Fund would have decreasedor increased, respectively, by approximately $1,303,823 (December 31,2016 – $11,995,551). In practice, actual results may differ from thissensitivity analysis and the difference could be material.
Credit risk
The table below summarizes the credit ratings of bonds anddebentures, money market instruments and preferred shares held bythe Fund, as applicable.
June 30, 2017 December 31, 2016
Credit ratings
Percentage oftotal credit
ratedinstruments
(%)
Percentage ofnet assets
(%)
Percentage oftotal credit
ratedinstruments
(%)
Percentage ofnet assets
(%)
Short Term RatingA-1+ 6.4 6.2 4.2 3.8A-1 – – 2.1 1.9Bond Credit RatingAAA 2.9 2.9 5.7 5.1AA 1.9 1.9 1.8 1.6A 4.9 4.7 5.9 5.2BBB 14.8 14.6 15.2 13.5BB 32.5 31.8 29.2 26.1B 33.0 32.3 29.9 26.5CCC 1.7 1.6 4.3 3.9CC 0.5 0.4 – –D – – 0.3 0.3NOT RATED 1.4 1.4 1.4 1.4
100.0 97.8 100.0 89.3
Concentration risk
Concentration risk arises as a result of the concentration of exposureswithin the same category, geographical location, asset type or industrysector, as applicable. The table below is a summary of the Fund’sconcentration risk:
Percentage of net assets (%)
June 30, 2017 December 31, 2016
Corporate Bonds 89.4 79.2Energy 0.9 1.1Federal Bonds 2.2 4.4Index Based ETFs – 8.4Materials 0.1 0.1Promissory Notes – 0.9Treasury Bills 6.2 4.8Telecommunication Services 0.0 0.0
The accompanying notes are an integral part of the financial statements.
BO
ND
FUN
DS
16
Scotia Private High Yield Income Pool (Unaudited – Continued)
FUND SPECIFIC NOTESFor the periods indicated in Note 1
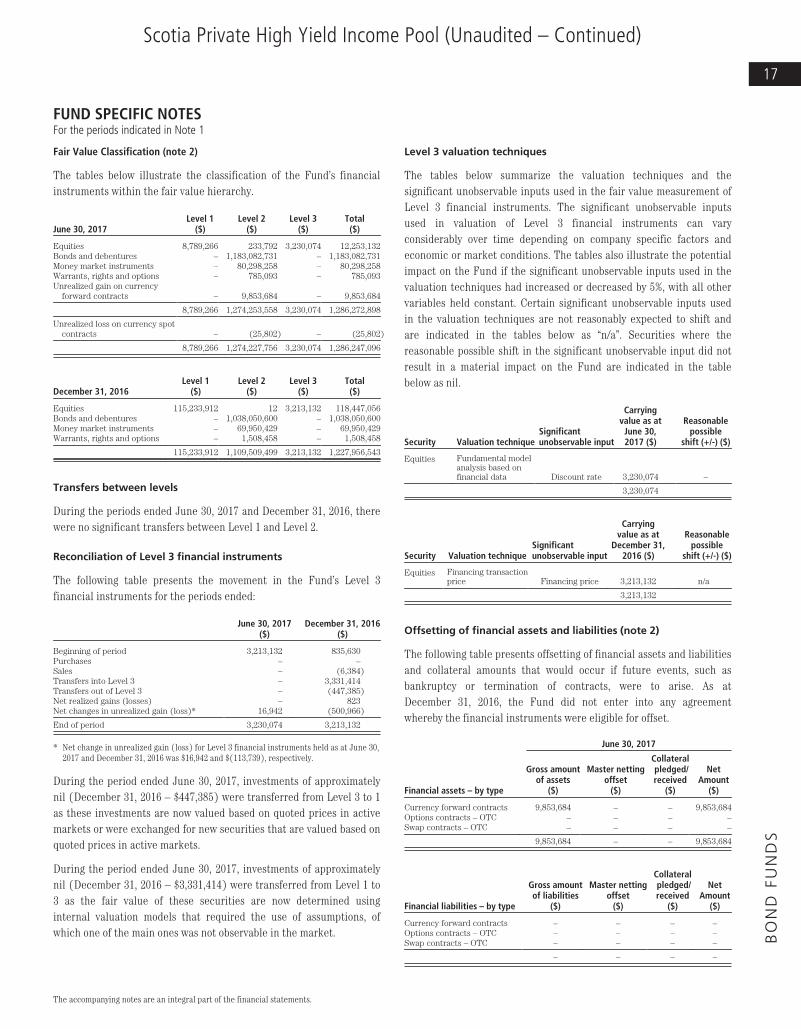
Fair Value Classification (note 2)
The tables below illustrate the classification of the Fund’s financialinstruments within the fair value hierarchy.
June 30, 2017Level 1
($)Level 2
($)Level 3
($)Total($)
Equities 8,789,266 233,792 3,230,074 12,253,132Bonds and debentures – 1,183,082,731 – 1,183,082,731Money market instruments – 80,298,258 – 80,298,258Warrants, rights and options – 785,093 – 785,093Unrealized gain on currency
forward contracts – 9,853,684 – 9,853,684
8,789,266 1,274,253,558 3,230,074 1,286,272,898
Unrealized loss on currency spotcontracts – (25,802) – (25,802)
8,789,266 1,274,227,756 3,230,074 1,286,247,096
December 31, 2016Level 1
($)Level 2
($)Level 3
($)Total($)
Equities 115,233,912 12 3,213,132 118,447,056Bonds and debentures – 1,038,050,600 – 1,038,050,600Money market instruments – 69,950,429 – 69,950,429Warrants, rights and options – 1,508,458 – 1,508,458
115,233,912 1,109,509,499 3,213,132 1,227,956,543
Transfers between levels
During the periods ended June 30, 2017 and December 31, 2016, therewere no significant transfers between Level 1 and Level 2.
Reconciliation of Level 3 financial instruments
The following table presents the movement in the Fund’s Level 3financial instruments for the periods ended:
June 30, 2017($)
December 31, 2016($)
Beginning of period 3,213,132 835,630Purchases – –Sales – (6,384)Transfers into Level 3 – 3,331,414Transfers out of Level 3 – (447,385)Net realized gains (losses) – 823Net changes in unrealized gain (loss)* 16,942 (500,966)
End of period 3,230,074 3,213,132
* Net change in unrealized gain (loss) for Level 3 financial instruments held as at June 30,2017 and December 31, 2016 was $16,942 and $(113,739), respectively.
During the period ended June 30, 2017, investments of approximatelynil (December 31, 2016 – $447,385) were transferred from Level 3 to 1as these investments are now valued based on quoted prices in activemarkets or were exchanged for new securities that are valued based onquoted prices in active markets.
During the period ended June 30, 2017, investments of approximatelynil (December 31, 2016 – $3,331,414) were transferred from Level 1 to3 as the fair value of these securities are now determined usinginternal valuation models that required the use of assumptions, ofwhich one of the main ones was not observable in the market.
Level 3 valuation techniques
The tables below summarize the valuation techniques and thesignificant unobservable inputs used in the fair value measurement ofLevel 3 financial instruments. The significant unobservable inputsused in valuation of Level 3 financial instruments can varyconsiderably over time depending on company specific factors andeconomic or market conditions. The tables also illustrate the potentialimpact on the Fund if the significant unobservable inputs used in thevaluation techniques had increased or decreased by 5%, with all othervariables held constant. Certain significant unobservable inputs usedin the valuation techniques are not reasonably expected to shift andare indicated in the tables below as “n/a”. Securities where thereasonable possible shift in the significant unobservable input did notresult in a material impact on the Fund are indicated in the tablebelow as nil.
Security Valuation techniqueSignificantunobservable input
Carryingvalue as at
June 30,2017 ($)
Reasonablepossible
shift (+/-) ($)
Equities Fundamental modelanalysis based onfinancial data Discount rate 3,230,074 –
3,230,074
Security Valuation techniqueSignificantunobservable input
Carryingvalue as at
December 31,2016 ($)
Reasonablepossible
shift (+/-) ($)
Equities Financing transactionprice Financing price 3,213,132 n/a
3,213,132
Offsetting of financial assets and liabilities (note 2)
The following table presents offsetting of financial assets and liabilitiesand collateral amounts that would occur if future events, such asbankruptcy or termination of contracts, were to arise. As atDecember 31, 2016, the Fund did not enter into any agreementwhereby the financial instruments were eligible for offset.
June 30, 2017
Financial assets – by type
Gross amountof assets
($)
Master nettingoffset
($)
Collateralpledged/received
($)
NetAmount
($)
Currency forward contracts 9,853,684 – – 9,853,684Options contracts – OTC – – – –Swap contracts – OTC – – – –
9,853,684 – – 9,853,684
Financial liabilities – by type
Gross amountof liabilities
($)
Master nettingoffset
($)
Collateralpledged/received
($)
NetAmount
($)
Currency forward contracts – – – –Options contracts – OTC – – – –Swap contracts – OTC – – – –
– – – –
The accompanying notes are an integral part of the financial statements.
BO
ND
FUN
DS
17

Scotia Private High Yield Income Pool (Unaudited – Continued)
FUND SPECIFIC NOTESFor the periods indicated in Note 1
Interest in Underlying Funds (note 2)
The following table presents the percentage of the Underlying Fundsowned by the Fund. The Fund did not hold any interest in UnderlyingFunds as at June 30, 2017.
December 31, 2016
Underlying Fund
Carrying value ofthe Underlying Fund
($)
Ownership percentagein Underlying Fund
(%)
SPDR Barclays High Yield Bond ETF 48,966,926 0.3iShares iBoxx $ High Yield Corporate
Bond Fund ETF 55,810,204 0.2
104,777,130
Comparison of net asset value per unit and net assets per unit(note 2)
The table below provides a comparison of the net asset value per unitand net assets per unit. A difference could arise when the last tradedmarket price for a financial instrument is not within the bid-ask spread(note 2).
June 30, 2017 December 31, 2016
Net asset valueper unit
($)
Net assetsper unit
($)
Net asset valueper unit
($)
Net assetsper unit
($)
Pinnacle Series 9.23 9.23 9.37 9.37Series F 9.64 9.64 9.73 9.73Series I 9.24 9.24 9.40 9.40Series K 10.14 10.15 10.32 10.32Series M 9.30 9.30 9.42 9.42
The accompanying notes are an integral part of the financial statements.
BO
ND
FUN
DS
18

Scotia Private American Core-Plus Bond Pool (Unaudited)
STATEMENTS OF FINANCIAL POSITIONAs at
(in dollars)June 30,
2017December 31,
2016
ASSETSCurrent assetsInvestments
Non-derivative financial assets 883,779,308 790,004,812Unrealized gain on currency forward contracts 9,427,173 8,940,628
Cash 59,216,870 100,182,876Receivable for securities sold 8,673,282 29,721,910Subscriptions receivable 422,833 150,122Accrued investment income and other 4,706,751 4,805,915
966,226,217 933,806,263
LIABILITIESCurrent liabilitiesManagement fee payable 139 –Payable for securities purchased 104,364,578 126,514,335Redemptions payable 317,049 97,214Accrued expenses 38,289 1,174Distributions payable 3,745 104Unrealized loss on currency forward contracts 81,915 125,636
104,805,715 126,738,463
Net assets attributable to holders of redeemable units 861,420,502 807,067,800
NET ASSETS ATTRIBUTABLE TO HOLDERS OF REDEEMABLEUNITS PER SERIES
Pinnacle Series 105,328,599 96,235,733Series F 217,251 217,232Series I 755,874,652 710,614,835
NET ASSETS ATTRIBUTABLE TO HOLDERS OF REDEEMABLEUNITS PER UNIT
Pinnacle Series 9.32 9.19Series F 9.56 9.39Series I 9.59 9.47
STATEMENTS OF COMPREHENSIVE INCOMEFor the periods ended June 30 (note 1),(in dollars except average units) 2017 2016
INCOMENet gain (loss) on investments
Dividends – 104,610Interest for distribution purposes 14,060,343 11,524,648Net realized gain (loss) on non-derivative financial assets 5,732,877 14,879,892Net realized gain (loss) on currency forward contracts 25,149,314 41,617,190Change in unrealized gain (loss) on non-derivative financial
assets (22,038,405) (33,562,905)Change in unrealized gain (loss) on currency forward
contracts 530,266 2,698,720
Net gain (loss) on investments 23,434,395 37,262,155Securities lending (note 11) 50,633 42,125Net realized and unrealized foreign currency translation gain
(loss) 2,234,886 1,511,085Other income 446 387
Total income (loss), net 25,720,360 38,815,752
EXPENSESManagement fees (note 5) 784 562Fixed administration fees (note 6) 199,705 174,416Independent Review Committee fees 576 563Interest expense and bank overdraft charges 317 1,790Foreign withholding taxes/tax reclaims (7,352) 22,718Other fund costs – 132Harmonized Sales Tax/Goods and Services Tax 20,374 18,349
Total expenses 214,404 218,530
Increase (decrease) in net assets attributable to holders ofredeemable units from operations 25,505,956 38,597,222
INCREASE (DECREASE) IN NET ASSETS ATTRIBUTABLE TOHOLDERS OF REDEEMABLE UNITS FROM OPERATIONS PERSERIES
Pinnacle Series 3,103,492 4,136,630Series F 6,668 7,133Series I 22,395,796 34,453,459
INCREASE (DECREASE) IN NET ASSETS ATTRIBUTABLE TOHOLDERS OF REDEEMABLE UNITS FROM OPERATIONS PERUNIT†
Pinnacle Series 0.29 0.47Series F 0.30 0.45Series I 0.29 0.49
WEIGHTED AVERAGE NUMBER OF UNITS PER SERIESPinnacle Series 10,863,097 8,817,429Series F 22,218 15,865Series I 76,851,587 70,561,189
† The increase (decrease) in net assets attributable to holders of redeemable units fromoperations per unit is calculated by dividing the increase (decrease) in net assetsattributable to holders of redeemable units from operations per series by the weightedaverage number of units per series.
The accompanying notes are an integral part of the financial statements. Portfolio Adviser: Logan Circle Partners, L.P.
BO
ND
FUN
DS
19

Scotia Private American Core-Plus Bond Pool (Unaudited – Continued)
STATEMENTS OF CHANGES IN NET ASSETSATTRIBUTABLE TO HOLDERS OF REDEEMABLEUNITSFor the periods ended June 30 (note 1),(in dollars) 2017 2016
NET ASSETS ATTRIBUTABLE TO HOLDERS OF REDEEMABLEUNITS, BEGINNING OF PERIOD
Pinnacle Series 96,235,733 65,167,343Series F 217,232 133,753Series I 710,614,835 666,123,804
807,067,800 731,424,900
INCREASE (DECREASE) IN NET ASSETS ATTRIBUTABLE TO HOLDERS OFREDEEMABLE UNITS FROM OPERATIONS
Pinnacle Series 3,103,492 4,136,630Series F 6,668 7,133Series I 22,395,796 34,453,459
25,505,956 38,597,222
DISTRIBUTIONS TO HOLDERS OF REDEEMABLE UNITSFrom net investment income
Pinnacle Series (1,736,026) (1,325,637)Series F (2,800) (1,940)Series I (13,208,351) (11,106,685)
(14,947,177) (12,434,262)
REDEEMABLE UNIT TRANSACTIONSProceeds from issue
Pinnacle Series 17,339,255 28,850,345Series F 27,903 29,728Series I 27,585,111 10,693,500
Reinvested distributionsPinnacle Series 1,729,513 1,321,560Series F 1,335 1,408Series I 13,208,351 11,106,664
Payments on redemptionPinnacle Series (11,343,368) (7,710,602)Series F (33,087) –Series I (4,721,090) (11,191,489)
43,793,923 33,101,114
INCREASE (DECREASE) IN NET ASSETS ATTRIBUTABLE TOHOLDERS OF REDEEMABLE UNITS
Pinnacle Series 9,092,866 25,272,296Series F 19 36,329Series I 45,259,817 33,955,449
54,352,702 59,264,074
NET ASSETS ATTRIBUTABLE TO HOLDERS OF REDEEMABLEUNITS, END OF PERIOD
Pinnacle Series 105,328,599 90,439,639Series F 217,251 170,082Series I 755,874,652 700,079,253
861,420,502 790,688,974
STATEMENTS OF CASH FLOWSFor the periods ended June 30 (note 1),(in dollars) 2017 2016
CASH FLOWS FROM OPERATING ACTIVITIESIncrease (decrease) in net assets attributable to
holders of redeemable units 25,505,956 38,597,222Adjustments for:
Net realized (gain) loss on non-derivative financialassets (5,732,877) (14,879,892)
Unrealized foreign currency translation (gain) loss 1,668,008 2,834,661Change in unrealized (gain) loss on non-derivative
financial assets 22,038,405 33,562,905Change in unrealized (gain) loss on currency
forward contracts (530,266) (2,698,720)Purchases of portfolio investments (1,649,809,010) (2,189,383,864)Proceeds from sale of portfolio investments 1,538,627,856 2,077,311,393Accrued investment income and other 99,164 215,649Accrued expenses and other payables 37,254 33,308
Net cash provided by (used in) operating activities (68,095,510) (54,407,338)
CASH FLOWS FROM FINANCING ACTIVITIESProceeds from issue of redeemable units 44,679,559 39,964,637Amounts paid on redemption of redeemable units (15,877,710) (18,359,509)Distributions to unitholders of redeemable units (4,337) (2,584)
Net cash provided by (used in) financing activities 28,797,512 21,602,544Unrealized foreign currency translation gain (loss) (1,668,008) (2,834,661)Net increase (decrease) in cash (39,297,998) (32,804,794)Cash (bank overdraft), beginning of period 100,182,876 130,720,013
CASH (BANK OVERDRAFT), END OF PERIOD 59,216,870 95,080,558
Interest paid(1) 317 1,790Interest received(1) 14,166,859 11,704,722Dividends received, net of withholding taxes(1) – 81,892
(1) Classified as operating items.
The accompanying notes are an integral part of the financial statements. Portfolio Adviser: Logan Circle Partners, L.P.
BO
ND
FUN
DS
20

Scotia Private American Core-Plus Bond Pool (Unaudited – Continued)
SCHEDULE OF INVESTMENT PORTFOLIOAs at June 30, 2017
IssuerFace
Value ($)AverageCost ($)
CarryingValue ($)
BONDS AND DEBENTURES – 97.5%Australian Dollar – 0.2%Morgan Stanley 4.75% Nov 16, 2018 AUD 1,590,000 1,621,407 1,629,246
Euro – 0.3%America Movil S.A.B. de C.V. 3.26%Jul 22, 2023 EUR 1,400,000 1,905,514 2,322,382
India Rupee – 0.6%International Finance Corporation 6.45%Oct 30, 2018 INR 129,000,000 2,494,613 2,617,659International Finance Corporation 7.80%Jun 03, 2019 INR 120,000,000 2,175,277 2,512,973
4,669,890 5,130,632
Mexican Peso – 0.6%Mexican Bonos 6.50% Jun 09, 2022 MXN 72,150,000 5,173,777 5,128,029
New Zealand dollar – 1.4%Federal Republic of Germany 3.75%Jun 14, 2018 NZD 2,500,000 2,311,335 2,399,048Goldman Sachs Group Inc., The 5.20%Dec 17, 2019 NZD 3,310,000 2,967,085 3,264,671International Bank for Reconstruction &Development 3.00% Oct 19, 2026 AUD 4,100,000 4,232,254 4,032,403JPMorgan Chase & Co. 4.25% Nov 02, 2018 NZD 2,300,000 1,991,202 2,204,318
11,501,876 11,900,440
United States Dollar – 94.4%21st Century Fox America Inc. 6.20%Dec 15, 2034 USD 130,000 213,248 209,769Abbott Laboratories (Callable) 2.90%Oct 30, 2021 USD 1,760,000 2,372,501 2,307,195Abbott Laboratories (Callable) 3.75%Aug 30, 2026 USD 1,700,000 2,278,604 2,252,487AbbVie Inc. (Callable) 2.50% Apr 14, 2020 USD 1,530,000 2,008,089 2,004,695Access Group Inc. (Floating Rate) 1.11%Aug 25, 2037 USD 1,028,064 1,060,508 1,234,470Access Group Inc. (Floating Rate) 1.42%Jul 01, 2038 USD 1,493,145 1,707,230 1,931,206Access Group Inc. 1.42% Jul 01, 2038 USD 2,290,468 2,725,595 2,954,717Adjustable Rate Mortgage TrustSeries 2005-10 2.71% Jan 25, 2036 USD 17,932 18,342 20,523Albemarle Corporation (Callable) 5.45%Jun 01, 2044 USD 1,345,000 1,573,233 2,040,326Ally Financial Inc. 1.36% Apr 22, 2019 USD 1,441,465 1,889,953 1,869,676Alternative Loan Trust Series 2006-2CB 5.50%Mar 25, 2036 USD 12,577 16,590 12,252Altria Group Inc. 10.20% Feb 06, 2039 USD 997,000 1,827,232 2,243,350Altria Group Inc. 9.95% Nov 10, 2038 USD 195,000 389,323 434,148American Airlines 2014-1 Class B PassThrough Trust 4.38% Oct 01, 2022 USD 689,515 783,200 911,552Ameriquest Mortgage Securities Inc. Asset-Backed Pass-Through CertificateSeries 2003-11 1.59% Dec 25, 2033 USD 1,095,111 1,404,303 1,398,283Anadarko Petroleum Corporation 6.45%Sep 15, 2036 USD 2,309,000 3,481,418 3,511,667Anthem Inc. 3.13% May 15, 2022 USD 860,000 1,132,603 1,135,586Anthem Inc. 3.30% Jan 15, 2023 USD 695,000 962,832 919,149Apache Corporation 6.90% Sep 15, 2018 USD 540,000 784,439 740,409Apple Inc. (Callable) 2.85% Mar 11, 2024 USD 1,775,000 2,440,094 2,312,326ArcelorMittal 7.75% Mar 01, 2041 USD 490,000 685,729 695,403Asset Backed Securities Corporation HomeEquity Loan Trust Series 2002-HE1 2.13%Mar 15, 2032 USD 2,126,119 2,785,605 2,764,439Assurant Inc. 2.50% Mar 15, 2018 USD 1,550,000 2,129,789 2,017,737
IssuerFace
Value ($)AverageCost ($)
CarryingValue ($)
BONDS AND DEBENTURES (cont'd)United States Dollar (cont'd)AstraZeneca PLC (Callable) 2.38%May 12, 2022 USD 2,105,000 2,827,868 2,707,836AstraZeneca PLC 2.38% Nov 16, 2020 USD 1,679,000 2,234,779 2,190,998AT&T Inc. (Callable) 5.25% Sep 01, 2036 USD 2,290,000 3,011,546 3,142,170AT&T Inc. 6.15% Sep 15, 2034 USD 1,000,000 1,622,374 1,479,982AT&T Inc. 6.45% Jun 15, 2034 USD 1,205,000 1,952,540 1,841,183Baidu Inc. 2.88% Jul 06, 2022 USD 1,645,000 2,131,102 2,122,458Banc of America Commercial Mortgage Trust2008-1 6.51% Feb 10, 2051 USD 1,118,000 1,475,997 1,488,546Bancolombia S.A. 6.13% Jul 26, 2020 USD 700,000 825,991 974,134Bank of America Alternative Loan TrustSeries 2005-5 6.00% Jun 25, 2035 USD 68,879 63,073 88,640Bank of America Commercial Mortgage Trust,Series 2008-1 6.23% Dec 10, 2051 USD 987,084 1,154,006 1,294,160Bank of America Corporation (Callable) 3.12%Jan 20, 2022 USD 1,545,000 2,016,840 2,035,956Bank of America Corporation (Callable) 3.82%Jan 20, 2027 USD 1,185,000 1,575,486 1,567,405Bank of America Mortgage Trust Series 2004-K2.78% Dec 25, 2034 USD 117,947 145,212 151,429Bank of America Mortgage Trust Series 2005-35.50% Apr 25, 2035 USD 789,916 909,387 1,043,631Bank of America Mortgage Trust Series 2005-G2.87% Aug 25, 2035 USD 116,351 98,900 144,508Bank of America Mortgage Trust, Series 2003-J3.62% Nov 25, 2051 USD 56,365 55,101 73,833Barclays PLC (Callable) 3.68% Jan 10, 2022 USD 1,155,000 1,552,086 1,534,964Barclays PLC (Callable) 4.84% May 07, 2027 USD 1,795,000 2,463,293 2,382,164Barrick North America Finance LLC 4.40%May 30, 2021 USD 1,690,000 2,385,916 2,368,916Bear Stearns ARM Trust Series 2004-5 3.27%Jul 25, 2034 USD 342,749 344,884 449,814Becton Dickinson and Company (Callable)2.89% May 06, 2022 USD 1,725,000 2,331,333 2,234,587Becton Dickinson and Company (Callable)3.36% Apr 06, 2024 USD 1,555,000 2,101,579 2,017,946Brazilian Government International Bond4.88% Jan 22, 2021 USD 760,000 1,081,625 1,034,998California Republic Auto Receivables Trust2017-1 1.90% Mar 15, 2021 USD 1,970,000 2,587,508 2,556,572Capital Auto Receivables Asset Trust 2016-11.50% Nov 20, 2018 USD 562,308 749,366 729,535CarMax Auto Owner Trust 2016-2 1.52%Feb 16, 2021 USD 2,350,000 2,998,663 3,044,090Cengage Learning Inc. (First Lien Term Loan B)Jun 07, 2023 USD 2,928,741 3,778,430 3,597,752CenturyLink Inc. (Callable) 3.93% Jun 31, 2025 USD 1,500,000 2,020,911 1,925,432CF Industries Inc. 5.38% Mar 15, 2044 USD 3,320,000 3,673,828 3,923,558CFCRE Commercial Mortgage Trust 2017-C83.57% Jun 15, 2050 USD 1,595,000 2,235,102 2,119,846CHL Mortgage Pass-Through Trust Series 2004-HYB4 2.72% Sep 20, 2034 USD 33,030 32,038 38,307Citigroup Capital III 7.63% Dec 01, 2036 USD 1,025,000 1,682,705 1,652,005Citigroup Inc. 4.45% Sep 29, 2027 USD 1,845,000 2,469,218 2,485,132Citigroup Mortgage Loan Trust Inc. (FloatingRate) 2.26% Aug 25, 2034 USD 1,135,235 1,402,526 1,478,672Clear Channel Worldwide Holdings Inc.(Callable) 6.50% Nov 15, 2017 USD 2,425,000 3,227,207 3,239,422CNOOC Finance 2013 Ltd. 3.00%May 09, 2023 USD 920,000 849,880 1,176,948COMM 2006-C8 Mortgage Trust 5.38%Dec 10, 2046 USD 1,609,938 2,156,848 2,096,190
The accompanying notes are an integral part of the financial statements. Portfolio Adviser: Logan Circle Partners, L.P.
BO
ND
FUN
DS
21

Scotia Private American Core-Plus Bond Pool (Unaudited – Continued)
SCHEDULE OF INVESTMENT PORTFOLIOAs at June 30, 2017
IssuerFace
Value ($)AverageCost ($)
CarryingValue ($)
BONDS AND DEBENTURES (cont'd)United States Dollar (cont'd)COMM 2012-CCRE2 Mortgage Trust (FloatingRate) 3.79% Aug 15, 2045 USD 300,000 427,158 406,939Comm 2014-UBS2 Mortgage Trust 3.96%Mar 10, 2047 USD 1,190,000 1,730,694 1,632,121COMM 2015-CCRE25 Mortgage Trust 3.76%Aug 10, 2048 USD 1,600,000 2,152,571 2,178,268COMM 2015-CCRE26 Mortgage Trust 4.64%Oct 10, 2048 USD 1,800,000 2,288,490 2,358,301Commercial Mortgage Loan Trust 2008-LS16.09% Dec 10, 2049 USD 542,793 727,607 709,527Commonwealth Edison Company 5.80%Mar 15, 2018 USD 700,000 810,486 933,430Commonwealth Edison Company 6.45%Jan 15, 2038 USD 100,000 122,518 176,270Compass Bank 6.40% Oct 01, 2017 USD 2,360,000 3,248,078 3,090,602Credit Suisse Commercial Mortgage TrustSeries 2007-C5 5.70% Sep 15, 2040 USD 318,286 434,990 414,225Credit Suisse First Boston Mortgage SecuritiesCorporation 4.88% Jul 15, 2037 USD 331,009 422,928 430,759CSAIL 2015-C3 Commercial Mortgage Trust3.45% Aug 15, 2048 USD 2,000,020 2,748,651 2,658,582CSMC Mortgage-Backed Trust Series 2007-56.00% Oct 25, 2024 USD 269,581 346,616 358,481CVS Health Corporation (Callable) 2.88%Mar 01, 2026 USD 5,000 6,398 6,301Darden Restaurants Inc. 6.80% Oct 15, 2037 USD 900,000 1,393,337 1,499,356DCP Midstream Operating LP (Callable) 2.50%Nov 01, 2017 USD 270,000 315,478 350,152Dell International LLC (First Lien Term Loan)Sep 07, 2023 USD 1,422,859 1,846,849 1,853,567Devon Financing Co LLC 7.88% Sep 30, 2031 USD 2,596,000 4,350,321 4,386,352Digicel International Finance Ltd. (First LienTerm Loan B) May 10, 2024 USD 915,000 1,251,382 1,195,748Discovery Communications LLC 5.63%Aug 15, 2019 USD 1,093,000 1,557,999 1,517,327Discovery Communications LLC 6.35%Jun 01, 2040 USD 1,380,000 1,925,424 1,987,251Drive Auto Receivables Trust 2017-1 (Callable)1.67% Mar 15, 2021 USD 1,525,000 2,030,026 1,978,548Ecopetrol S.A. 4.13% Jan 16, 2025 USD 1,800,000 2,287,451 2,282,538Ecopetrol S.A. 5.88% May 28, 2045 USD 830,000 980,366 978,834Energy Transfer Partners LP (Callable) 6.05%Dec 01, 2040 USD 1,785,000 2,190,373 2,470,676EnLink Midstream Partners LP (Callable) 4.15%Mar 01, 2025 USD 1,530,000 1,963,620 1,979,740Enterprise Products Operating LLC (Callable)7.03% Jan 15, 2018 USD 805,000 885,038 1,069,494Exelon Corporation (Callable) 2.85%May 15, 2020 USD 1,475,000 1,828,656 1,939,304Export-Import Bank of Korea 5.00%Apr 11, 2022 USD 400,000 403,409 570,092Fannie Mae 2.00% Dec 25, 2042 USD 1,405,000 1,357,140 1,664,088Fannie Mae 2.50% May 25, 2041 USD 152,874 156,122 198,737Fannie Mae 3.50% Dec 01, 2099 USD 14,625,000 20,194,159 19,475,276Fannie Mae 4.00% Dec 01, 2099 USD 21,695,000 30,729,052 29,571,194Fannie Mae 4.00% Nov 25, 2029 USD 589,336 609,667 805,793Fannie Mae 4.50% Aug 25, 2023 USD 18,554 17,288 25,251Fannie Mae 4.50% Dec 01, 2099 USD 5,044,000 7,323,557 7,016,705Fannie Mae 4.50% Jun 25, 2029 USD 195,369 225,459 272,960Fannie Mae 4.50% Sep 25, 2024 USD 339,420 398,758 464,602Fannie Mae 5.00% Oct 25, 2024 USD 48,555 51,100 66,302Fannie Mae 5.50% Sep 25, 2017 USD 660 692 859
IssuerFace
Value ($)AverageCost ($)
CarryingValue ($)
BONDS AND DEBENTURES (cont'd)United States Dollar (cont'd)Fannie Mae 5.50% Sep 25, 2035 USD 73,895 88,455 100,474Fannie Mae 7.50% Nov 25, 2026 USD 4,642 6,729 6,858Fannie Mae Grantor Trust 2003-T4 5.02%Sep 26, 2033 USD 16,002 18,319 22,694Fannie Mae Grantor Trust Series 2001-T47.50% Jul 25, 2041 USD 359,282 503,935 551,929Fannie Mae Pool 2.55% Jul 01, 2026 USD 1,230,524 1,605,964 1,580,444Fannie Mae Pool 2.68% Aug 01, 2022 USD 728,013 969,898 932,739Fannie Mae Pool 3.00% Dec 01, 2046 USD 14,352,953 19,343,888 18,594,345Fannie Mae Pool 3.00% Dec 01, 2099 USD 11,065,000 14,952,490 14,331,154Fannie Mae Pool 3.00% Mar 01, 2047 USD 4,722,218 6,223,828 6,118,615Fannie Mae Pool 3.10% Jan 01, 2026 USD 600,000 825,532 796,840Fannie Mae Pool 3.50% Dec 01, 2046 USD 1,044,001 1,406,008 1,394,413Fannie Mae Pool 3.50% Jul 01, 2046 USD 3,948,415 5,569,378 5,263,058Fannie Mae Pool 3.50% May 01, 2045 USD 4,762,959 6,584,956 6,373,509Fannie Mae Pool 3.50% May 01, 2045 USD 1,829,118 2,514,471 2,447,567Fannie Mae Pool 3.50% Oct 01, 2045 USD 919,822 1,257,748 1,226,596Fannie Mae Pool 3.50% Oct 01, 2046 USD 2,927,227 4,003,801 3,917,080Fannie Mae Pool 3.50% Oct 01, 2046 USD 3,939,140 5,482,303 5,249,527Fannie Mae Pool 3.50% Sep 01, 2045 USD 1,226,312 1,700,332 1,635,243Fannie Mae Pool 3.62% Dec 01, 2020 USD 783,994 1,103,350 1,065,622Fannie Mae Pool 3.66% Feb 01, 2027 USD 517,529 714,610 713,629Fannie Mae Pool 4.00% Apr 01, 2046 USD 4,824,253 6,761,623 6,628,752Fannie Mae Pool 4.00% May 01, 2047 USD 1,711,589 2,455,078 2,322,783Fannie Mae Pool 4.00% Sep 01, 2043 USD 1,362,771 1,890,823 1,878,193Fannie Mae Pool 4.50% Apr 01, 2035 USD 1,742,903 2,430,972 2,443,203Fannie Mae Pool 4.50% Mar 01, 2046 USD 1,651,616 2,378,620 2,343,367Fannie Mae Pool 5.00% Feb 01, 2031 USD 3,251,320 4,729,855 4,617,003Fannie Mae Pool 5.00% Jan 01, 2036 USD 2,880 3,196 4,079Fannie Mae Pool 5.00% Nov 01, 2033 USD 1,366 1,773 1,865Fannie Mae Pool 5.00% Nov 01, 2034 USD 1,615 1,915 2,193Fannie Mae Pool 5.00% Nov 01, 2034 USD 672 801 896Fannie Mae Pool 5.25% Aug 01, 2029 USD 804,216 1,213,717 1,187,894Fannie Mae Pool 5.26% Jun 01, 2023 USD 318,615 398,342 438,293Fannie Mae Pool 5.50% Apr 01, 2036 USD 1,372,460 1,959,621 1,979,201Fannie Mae Pool 5.50% Aug 01, 2037 USD 320,316 392,576 461,908Fannie Mae Pool 5.50% Feb 01, 2038 USD 1,677,632 2,457,111 2,419,580Fannie Mae Pool 5.50% Feb 01, 2038 USD 558,802 703,967 805,619Fannie Mae Pool 5.50% Jan 01, 2040 USD 171,137 245,574 246,245Fannie Mae Pool 5.50% Jul 01, 2040 USD 1,676,582 2,451,104 2,414,999Fannie Mae Pool 6.00% Sep 01, 2039 USD 134,144 201,777 196,419Fannie Mae Pool 7.50% Apr 01, 2032 USD 1,593 2,314 2,411Fannie Mae Pool 7.50% Jun 01, 2031 USD 1,098 1,761 1,645Fannie Mae Series A 3.00% Dec 01, 2099 USD 7,965,000 10,842,208 10,600,081Fannie Mae Whole Loan (Callable) 6.50%Jun 25, 2023 USD 84,054 105,995 125,771Fannie Mae Whole Loan 6.00% Feb 25, 2047 USD 522,888 671,209 782,372Fannie Mae Whole Loan 6.50% May 25, 2044 USD 30,119 36,364 44,694Fannie Mae Whole Loan 7.00% Jul 25, 2044 USD 614,979 738,594 914,070Fannie Mae-Aces (Floating Rate) 1.39%Aug 25, 2028 USD 719,709 940,282 934,849Federal Home Loan Mortgage Corporation2.00% Dec 15, 2041 USD 282,118 286,533 355,551Federal Home Loan Mortgage Corporation2.50% May 15, 2041 USD 747,137 775,911 955,631Federal Home Loan Mortgage Corporation3.00% Jan 15, 2042 USD 370,958 392,392 482,431Federal Home Loan Mortgage Corporation4.00% Nov 15, 2036 USD 238,958 260,545 324,279Federal Home Loan Mortgage Corporation4.50% Dec 15, 2033 USD 381,000 404,720 561,553
The accompanying notes are an integral part of the financial statements. Portfolio Adviser: Logan Circle Partners, L.P.
BO
ND
FUN
DS
22

Scotia Private American Core-Plus Bond Pool (Unaudited – Continued)
SCHEDULE OF INVESTMENT PORTFOLIOAs at June 30, 2017
IssuerFace
Value ($)AverageCost ($)
CarryingValue ($)
BONDS AND DEBENTURES (cont'd)United States Dollar (cont'd)Federal Home Loan Mortgage Corporation4.50% Nov 15, 2029 USD 220,000 229,963 319,673FHLMC Multifamily Structured Pass ThroughCertificates (Floating Rate) 1.15% Sep 25, 2022 USD 1,565,356 2,083,997 2,041,644FHLMC Multifamily Structured Pass ThroughCertificates 2.85% Mar 25, 2026 USD 2,685,000 3,468,626 3,488,871FHLMC Multifamily Structured Pass ThroughCertificates 3.00% Dec 25, 2025 USD 1,420,000 1,969,162 1,880,081FHLMC Structured Pass Through Securities5.23% May 25, 2043 USD 361,745 411,823 516,421FHLMC Structured Pass Through Securities6.50% Sep 25, 2043 USD 12,603 18,145 18,945Fifth Third Bankcorp (Callable) 2.88%Sep 01, 2021 USD 1,200,000 1,304,907 1,583,426FirstEnergy Corporation (Callable) 3.90%Apr 15, 2027 USD 660,000 869,614 855,820Ford Credit Floorplan Master Owner Trust A(Floating Rate) 1.30% Jul 15, 2020 USD 1,490,000 1,960,255 1,939,654Ford Motor Credit Company LLC 2.55%Oct 05, 2018 USD 990,000 1,319,398 1,292,374Freddie Mac 3.00% May 15, 2041 USD 226,009 238,409 295,545Freddie Mac 4.00% Aug 15, 2024 USD 290,000 343,589 396,729Freddie Mac 4.50% Apr 15, 2030 USD 1,222,897 1,446,142 1,682,248Freddie Mac 5.00% Feb 15, 2040 USD 634,701 923,685 906,628Freddie Mac 5.00% Jun 15, 2033 USD 55,327 60,149 79,603Freddie Mac 5.00% May 15, 2026 USD 55,910 57,186 77,268Freddie Mac 5.00% May 15, 2033 USD 160,029 168,632 225,135Freddie Mac 7.00% May 15, 2024 USD 4,151 5,428 5,847Freddie Mac Gold Pool 3.50% Jul 01, 2043 USD 1,029,806 1,537,442 1,378,159Freddie Mac Gold Pool 3.50% May 01, 2046 USD 4,097,791 5,602,736 5,463,040Freddie Mac Gold Pool 3.50% Nov 01, 2045 USD 1,186,045 1,797,774 1,590,337Freddie Mac Gold Pool 4.00% Aug 01, 2044 USD 1,584,848 1,873,272 2,183,990Freddie Mac Gold Pool 4.00% Feb 01, 2046 USD 2,951,604 4,177,142 4,056,262Freddie Mac Gold Pool 4.00% Jan 01, 2045 USD 3,185,737 4,499,899 4,376,559Freddie Mac Gold Pool 4.50% Mar 01, 2046 USD 480,986 701,258 673,335Freddie Mac Gold Pool 5.00% Jun 01, 2018 USD 1,214 1,219 1,587Freddie Mac Gold Pool 5.00% Sep 01, 2033 USD 4,474 6,095 6,309Freddie Mac Gold Pool 5.50% Jun 01, 2041 USD 677,017 1,011,745 969,216Freddie Mac Multifamily Structured PassThrough Certificates 2.20% Nov 25, 2023 USD 1,835,000 2,424,670 2,373,776Freddie Mac Multifamily Structured PassThrough Certificates 2.86% Aug 25, 2022 USD 1,995,000 2,731,013 2,661,427Freddie Mac Multifamily Structured PassThrough Certificates 3.41% Dec 25, 2026 USD 2,005,000 2,699,694 2,722,312Freddie Mac Strips 3.00% Aug 15, 2042 USD 2,612,976 3,459,441 3,378,509Freeport-McMoRan Inc. (Callable) 4.55%Aug 14, 2024 USD 1,190,000 1,492,599 1,458,653Freeport-McMoRan Inc. (Callable) 5.45%Sep 15, 2042 USD 2,610,000 2,903,023 2,931,365General Electric Company 5.25% Dec 06, 2017 USD 515,000 583,441 679,019General Motors Corporation 4.88%Oct 02, 2023 USD 2,125,000 2,918,675 2,972,385Georgia-Pacific LLC 8.88% May 15, 2031 USD 1,215,000 2,040,652 2,423,400Gilead Sciences Inc. 2.55% Sep 01, 2020 USD 2,805,000 3,745,023 3,690,129Ginnie Mae I Pool 7.00% Dec 15, 2034 USD 16,530 20,219 24,780Ginnie Mae I Pool 7.50% Feb 15, 2032 USD 1,203 1,754 1,858Ginnie Mae II Pool 2.00% Feb 20, 2040 USD 86,445 94,673 115,867Ginnie Mae II Pool 2.00% Jan 20, 2040 USD 363,230 436,146 480,805Ginnie Mae II Pool 3.00% Apr 20, 2040 USD 392,733 435,388 525,898Ginnie Mae II Pool 3.50% Jun 20, 2040 USD 88,966 93,037 120,835Ginnie Mae II Pool 4.51% Jan 20, 2067 USD 3,806,042 5,595,191 5,492,439Ginnie Mae II Pool 4.55% Dec 20, 2066 USD 1,756,193 2,579,001 2,526,725
IssuerFace
Value ($)AverageCost ($)
CarryingValue ($)
BONDS AND DEBENTURES (cont'd)United States Dollar (cont'd)Ginnie Mae II Pool 4.56% Nov 20, 2062 USD 1,744,410 1,918,031 2,366,649Ginnie Mae II Pool 4.63% Jun 20, 2062 USD 296,719 424,811 397,845Ginnie Mae II Pool 4.65% Jan 20, 2063 USD 142,005 156,918 200,263Ginnie Mae II Pool 4.66% Jan 20, 2063 USD 51,906 57,415 73,156Ginnie Mae II Pool 4.68% Aug 20, 2064 USD 404,547 495,169 535,380Ginnie Mae II Pool 4.73% Apr 20, 2063 USD 107,114 122,458 144,049Ginnie Mae II Pool 4.81% Feb 20, 2061 USD 1,668,449 1,950,720 2,216,184Ginnie Mae II Pool 4.85% May 20, 2062 USD 132,675 154,200 177,000Ginnie Mae II Pool 5.07% Apr 20, 2062 USD 202,964 236,817 272,309Ginnie Mae II Pool 5.39% Dec 20, 2059 USD 452,813 510,180 595,931Ginnie Mae II Pool 5.50% Sep 20, 2043 USD 510,855 754,474 726,371GM Financial Automobile Leasing Trust 2015-31.69% Mar 20, 2019 USD 1,245,000 1,626,764 1,616,660GMACM Mortgage Loan Trust 2005-AR23.39% May 25, 2035 USD 180,818 178,418 230,080Goldman Sachs Capital I 6.35% Feb 15, 2034 USD 2,300,000 3,428,417 3,705,180Goldman Sachs Group Inc., The (Callable)2.64% Oct 28, 2026 USD 2,410,000 3,219,573 3,223,056Goldman Sachs Group Inc./The (Callable)2.91% Jun 05, 2022 USD 1,535,000 2,073,176 1,987,920Government National Mortgage Association1.81% Nov 20, 2066 USD 2,773,777 3,703,920 3,539,994Government National Mortgage Association4.50% Jun 16, 2039 USD 44,848 48,356 60,745Government National Mortgage Association5.47% Nov 20, 2059 USD 310,484 347,844 408,067Great Plains Energy Inc. (Callable) 5.29%Mar 15, 2022 USD 2,000,000 2,362,965 2,836,356GS Mortgage Securities Trust 2013-GCJ123.78% Jun 10, 2046 USD 250,000 334,450 332,060Harris Corporation 2.00% Apr 27, 2018 USD 1,100,000 1,534,396 1,428,085HCA Inc. (Callable) 5.50% Dec 15, 2046 USD 2,500,000 3,413,181 3,369,073Hess Corporation (Callable) 4.30%Jan 01, 2027 USD 890,000 1,164,560 1,124,434Hewlett Packard Enterprise Company (Callable)6.20% Apr 15, 2035 USD 1,266,000 1,775,069 1,784,827Homestar Mortgage Acceptance Corporation0.90% Oct 25, 2034 USD 113,602 107,887 147,177HSBC Bank PLC (Callable) 1.63% Jun 30, 2049 USD 3,050,000 3,055,497 3,242,535HSBC Bank PLC 7.65% May 01, 2025 USD 964,000 1,590,523 1,548,573HSBC Bank USA N.A. 5.88% Nov 01, 2034 USD 960,000 1,389,920 1,538,942HSBC Holdings PLC (Callable) 6.00%May 22, 2027 USD 1,660,000 2,265,759 2,228,736Jo-Ann Stores LLC (First Lien Term Loan)Sep 29, 2023 USD 3,196,988 4,173,639 4,133,648JP Morgan Chase Commercial MortgageSecurities Trust Series 2004-LN2 5.27%Jul 15, 2041 USD 690,000 758,811 893,893JP Morgan Chase Commercial MortgageSecurities Trust Series 2005-CIBC12 4.99%Sep 12, 2037 USD 287,916 348,976 373,027JP Morgan Chase Commercial MortgageSecurities Trust Series 2007-CIBC20 5.88%Feb 12, 2051 USD 423,977 525,693 555,203JP Morgan Chase Commercial MortgageSecurities Trust Series 2007-LDP10 5.46%Jan 15, 2049 USD 902,407 1,164,928 1,167,978JP Morgan Mortgage Trust Series 2005-A42.61% Jul 25, 2035 USD 325,655 364,938 420,377JP Morgan Mortgage Trust Series 2005-A42.66% Jul 25, 2035 USD 7,847 7,882 10,220
The accompanying notes are an integral part of the financial statements. Portfolio Adviser: Logan Circle Partners, L.P.
BO
ND
FUN
DS
23

Scotia Private American Core-Plus Bond Pool (Unaudited – Continued)
SCHEDULE OF INVESTMENT PORTFOLIOAs at June 30, 2017
IssuerFace
Value ($)AverageCost ($)
CarryingValue ($)
BONDS AND DEBENTURES (cont'd)United States Dollar (cont'd)JP Morgan Mortgage Trust Series 2005-A62.74% Sep 25, 2035 USD 58,435 64,701 72,265JP Morgan Mortgage Trust Series 2006-A62.69% Oct 25, 2036 USD 92,094 80,212 113,080JPMBB Commercial Mortgage Securities TrustSeries 2014-C26 4.43% Jan 15, 2048 USD 1,554,000 2,027,320 1,976,645JPMDB Commercial Mortgage SecuritiesTrust 2017-C5 3.60% Mar 15, 2050 USD 2,451,000 3,367,188 3,314,495Kimberly-Clark Corporation 7.50%Nov 01, 2018 USD 75,000 90,835 105,018Kohl’s Corporation (Callable) 5.55%Jan 17, 2045 USD 1,105,000 1,407,707 1,324,292Kraft Heinz Foods Company (Callable) 3.95%Apr 15, 2025 USD 2,765,000 3,742,465 3,696,638LB-UBS Commercial Mortgage TrustSeries 2005-C7 5.35% Nov 15, 2040 USD 890,000 1,157,046 1,182,209LyondellBasell Industries NV (Callable) 5.00%Jan 15, 2019 USD 880,000 1,244,770 1,191,744MacDermid Inc. (First Lien Term Loan B6)Jun 07, 2023 USD 2,181,974 2,497,415 2,837,407MASTR Adjustable Rate Mortgages TrustSeries 2006-2 2.81% Feb 25, 2036 USD 367,527 402,339 466,464McGraw-Hill Global Education Holdings LLC(First Lien Term Loan) May 04, 2022 USD 2,888,175 3,791,930 3,690,960Mercury General Corporation (Callable) 4.40%Dec 15, 2026 USD 1,170,000 1,560,701 1,553,639Merrill Lynch Mortgage Investors Trust MLMISeries 2005-A10 0.66% Feb 25, 2036 USD 568,830 583,411 697,571Merrill Lynch Mortgage Investors Trust Series1998-C1-CTL 6.75% Nov 15, 2026 USD 274,966 368,448 358,538Merrill Lynch Mortgage Investors TrustSeries 2005-2 2.52% Oct 25, 2035 USD 268,937 343,137 338,532Merrill Lynch Mortgage Investors Trust SeriesMLMI 2005-A1 2.76% Dec 25, 2034 USD 50,585 44,367 65,272Merrill Lynch Mortgage Trust 2005-CKI1 5.35%Nov 12, 2037 USD 160,805 214,659 208,569MetLife Inc. (Callable) 10.75% Aug 01, 2034 USD 2,125,000 3,609,263 4,521,249Mexico Government International Bond 4.60%Jan 23, 2046 USD 1,150,000 1,375,526 1,467,629ML-CFC Commercial Mortgage Trust 2007-95.86% Sep 12, 2049 USD 525,000 720,508 690,645Morgan Stanley (Callable) 2.28% Oct 24, 2022 USD 1,730,000 2,271,325 2,275,886Morgan Stanley 2.75% May 19, 2022 USD 1,250,000 1,694,567 1,621,912Morgan Stanley 3.63% Jan 20, 2027 USD 1,350,000 1,746,732 1,756,771Morgan Stanley Bank of America Merrill LynchTrust 2014-C14 4.83% Feb 15, 2047 USD 135,000 188,514 183,006Morgan Stanley Bank of America Merrill LynchTrust Series 2015-C24 4.35% May 15, 2048 USD 150,000 185,972 184,808Morgan Stanley Capital I Trust (Floating Rate)2.55% Jan. 11, 2043 USD 455,036 583,454 591,100Morgan Stanley Capital I Trust 6.33%Dec 12, 2049 USD 715,000 939,014 943,133Mortgage IT Trust Series 2005-1 (Callable)1.09% Feb 25, 2035 USD 539,456 680,983 681,113Municipal Electric Authority of Georgia 6.64%Apr 01, 2057 USD 660,000 716,611 1,052,551Municipal Electric Authority of Georgia 7.06%Apr 01, 2057 USD 1,500,000 1,698,121 2,222,696Mylan Inc. 2.55% Mar 28, 2019 USD 1,395,000 1,819,464 1,820,512Mylan NV 3.95% Jun 15, 2026 USD 1,275,000 1,647,608 1,668,331Mylan NV 5.25% Jun 15, 2046 USD 1,275,000 1,684,764 1,817,178
IssuerFace
Value ($)AverageCost ($)
CarryingValue ($)
BONDS AND DEBENTURES (cont'd)United States Dollar (cont'd)Navistar Inc. (First Lien Term Loan B)Aug 07, 2020 USD 2,977,330 3,897,569 3,909,562NCUA Guaranteed Notes Trust Series 2010-R32.40% Dec 08, 2020 USD 97,223 96,608 126,128Newell Brands Inc. (Callable) 5.00%Nov 15, 2018 USD 1,640,000 2,362,244 2,281,820NextEra Energy Capital Holdings Inc. (Callable)3.55% Feb 01, 2027 USD 915,000 1,237,574 1,210,642Nokia Oyj 3.38% Jun 12, 2022 USD 1,355,000 1,816,972 1,770,331Nokia Oyj 6.63% May 15, 2039 USD 1,950,000 2,238,872 2,877,104NovaStar Mortgage Funding TrustSeries 2003-3 (Floating Rate) 0.84%Dec 25, 2033 USD 2,385,273 2,972,845 2,984,478NVR Inc. (Callable) 3.95% Jun 15, 2022 USD 1,115,000 1,159,282 1,512,993Oracle Corporation (Callable) 1.90%Aug 01, 2021 USD 1,380,000 1,789,395 1,774,385PacifiCorp (Callable) 2.95% Nov 01, 2021 USD 1,520,000 1,657,915 2,016,383Party City Holdings Inc. (First Lien Term Loan B)Aug 19, 2022 USD 2,693,123 3,502,259 3,500,351Petco Animal Supplies Inc. (First Lien TermLoan B1) Jan 26, 2023 USD 2,870,927 3,747,228 3,372,263Petrobras Global Finance BV 5.38%Jan 27, 2021 USD 3,000,000 3,973,249 3,957,047Petrobras Global Finance BV 8.75%May 23, 2026 USD 2,530,000 3,358,926 3,758,263Petroleos Mexicanos 5.63% Jan 23, 2046 USD 2,260,000 2,343,191 2,609,602Petroleos Mexicanos 8.63% Feb 01, 2022 USD 1,000,000 1,344,780 1,513,270PQ Corporation (First Lien Term Loan)Nov 04, 2022 USD 2,868,361 3,775,076 3,763,443Public Service Co of Colorado (Callable) 2.25%Mar 15, 2022 USD 1,810,000 2,346,922 2,319,882QUALCOMM Inc. (Callable) 2.60%Dec 30, 2022 USD 1,060,000 1,430,281 1,370,066QUALCOMM Inc. 2.10% May 20, 2020 USD 1,635,000 2,209,566 2,128,694Renaissance Home Equity Loan TrustSeries 2006-1 5.61% May 25, 2036 USD 140,453 129,094 111,347Residential Asset Mortgage Products, Inc.7.00% Nov 25, 2031 USD 216 305 280Reynolds American Inc. 6.88% May 01, 2020 USD 1,295,000 1,949,573 1,890,049Reynolds American Inc. 8.13% May 01, 2040 USD 1,045,000 1,941,283 1,930,549Royal Bank of Scotland Group PLC 3.88%Sep 12, 2023 USD 1,705,000 2,215,081 2,259,223Sabine Pass Liquefaction LLC (Callable) 6.25%Dec 15, 2021 USD 2,245,000 3,325,931 3,290,237Santander Drive Auto Receivables Trust 2015-41.58% Sep 16, 2019 USD 223,641 292,415 290,151Santander Drive Auto Receivables Trust 2016-3(Floating Rate) 1.34% Nov 15, 2019 USD 1,776,551 2,343,896 2,304,116Scientific Games International Inc. (First LienTerm Loan B3) Oct 01, 2021 USD 2,343,832 3,093,593 3,072,331Select Income Real Estate Investment Trust(Callable) 4.25% Feb 15, 2024 USD 925,000 1,246,846 1,194,042Sequoia Mortgage Trust Series 2004-11 1.04%Dec 20, 2034 USD 196,749 220,256 248,810Shire Acquisitions Investments Ireland DAC(Callable) 3.20% Jun 23, 2026 USD 1,210,000 1,592,481 1,531,298Shire Acquisitions Investments Ireland DAC1.90% Sep 23, 2019 USD 2,585,000 3,410,993 3,331,131SLM Private Credit Student Loan Trust 2002-A1.18% Dec 16, 2030 USD 1,584,435 2,010,235 2,016,166SLM Private Credit Student Loan Trust 2006-A1.14% Jun 15, 2039 USD 2,490,000 3,030,457 3,055,023
The accompanying notes are an integral part of the financial statements. Portfolio Adviser: Logan Circle Partners, L.P.
BO
ND
FUN
DS
24

Scotia Private American Core-Plus Bond Pool (Unaudited – Continued)
SCHEDULE OF INVESTMENT PORTFOLIOAs at June 30, 2017
IssuerFace
Value ($)AverageCost ($)
CarryingValue ($)
BONDS AND DEBENTURES (cont'd)United States Dollar (cont'd)SMART Trust Series 2015-3US 1.66%Aug 14, 2019 USD 1,250,002 1,637,640 1,619,298South Carolina Student Loan CorporationSeries 2015-A 1.95% Jan 25, 2036 USD 2,597,922 3,363,003 3,325,160Sprint Capital Corporation 8.75% Mar 15, 2032 USD 2,935,000 3,485,827 4,793,866Structured Adjustable Rate Mortgage LoanTrust 2.92% Dec 25, 2034 USD 4,147 5,002 5,338Structured Asset Securities Corporation 3.08%Nov 25, 2033 USD 138,353 134,324 174,429Sungard Availability Services Capital Inc. (FirstLien Term Loan) Mar 31, 2019 USD 1,161,112 1,243,621 1,499,106Tennessee Gas Pipeline Co., LLC 8.38%Jun 15, 2032 USD 1,637,000 2,743,114 2,698,107Teva Pharmaceutical Finance Netherlands III BV2.80% Jul 21, 2023 USD 1,180,000 1,534,362 1,487,036Teva Pharmaceutical Industries Ltd. 3.15%Oct 01, 2026 USD 1,680,000 2,050,245 2,066,637Time Warner Inc. (Callable) 3.80%Nov 15, 2026 USD 1,335,000 1,786,006 1,746,235Time Warner Inc. 4.75% Mar 29, 2021 USD 2,187,000 3,080,000 3,060,867Total Capital SA 2.13% Aug 10, 2018 USD 1,740,000 1,858,788 2,264,486Twenty-First Century Fox Inc. 6.40%Dec 15, 2035 USD 815,000 1,198,017 1,345,879Tyco Electronics Group S.A. 6.55%Oct 01, 2017 USD 1,355,000 1,787,509 1,777,305United States Small Business Administration2.84% Apr 01, 2037 USD 1,525,000 2,045,936 1,978,095United States Small Business Administration2.88% May 01, 2037 USD 1,985,000 2,717,057 2,588,097United States Treasury Notes 1.25%Jun 30, 2019 USD 400,000 518,802 514,657United States Treasury Notes 1.25%May 31, 2019 USD 23,740,000 31,389,325 30,718,325United States Treasury Notes 1.50%May 15, 2020 USD 13,420,000 18,176,590 17,388,357United States Treasury Notes 1.75%Jun 30, 2022 USD 15,820,000 20,449,183 20,338,271United States Treasury Notes 1.75%May 31, 2022 USD 8,635,000 11,433,441 11,137,472United States Treasury Notes 2.00%May 31, 2024 USD 2,425,000 3,247,957 3,121,223United States Treasury Notes 2.25%Aug 15, 2046 USD 15,785,000 17,796,101 18,108,924United States Treasury Notes 2.25%Feb 15, 2027 USD 2,095,000 2,778,685 2,707,521United States Treasury Notes 2.38%May 15, 2027 USD 34,905,000 47,508,472 45,599,694United States Treasury Notes 2.88%Nov 15, 2046 USD 4,010,000 5,129,414 5,228,672United States Treasury Notes 3.00%Feb 15, 2047 USD 20,085,000 27,515,200 26,988,495Vale Overseas Ltd. 6.88% Nov 10, 2039 USD 1,196,000 1,506,671 1,654,655Validus Holdings Ltd. 8.88% Jan 26, 2040 USD 1,005,000 1,489,146 1,891,748Verizon Communications Inc. 4.13%Mar 16, 2027 USD 2,100,000 2,801,807 2,814,162Verizon Communications Inc. 4.67%Mar 15, 2055 USD 4,665,000 5,693,974 5,707,399Verizon Communications Inc. 5.15%Sep 15, 2023 USD 1,665,000 2,549,864 2,396,680Vodafone Group PLC 6.25% Nov 30, 2032 USD 1,110,000 1,723,607 1,770,537Vodafone Group PLC 7.88% Feb 15, 2030 USD 740,000 1,269,991 1,320,551
Issuer
FaceValue ($)/
Number ofShares
AverageCost ($)
CarryingValue ($)
BONDS AND DEBENTURES (cont'd)United States Dollar (cont'd)Wachovia Bank Commercial Mortgage TrustSeries 2006-C26 6.01% Jun 15, 2045 USD 1,532,000 1,994,230 2,003,715Wachovia Bank Commercial Mortgage TrustSeries 2006-C28 5.67% Oct 15, 2048 USD 1,105,000 1,525,441 1,432,936WaMu Mortgage Pass-Through CertificatesSeries 2003-AR10 Trust 2.54% Oct 25, 2033 USD 120,715 113,983 158,177WaMu Mortgage Pass-Through CertificatesSeries 2003-AR7 Trust 2.43% Aug 25, 2033 USD 232,998 269,692 301,992WaMu Mortgage Pass-Through CertificatesSeries 2004-AR1 Trust 2.77% Mar 25, 2034 USD 233,510 301,434 298,236Wells Fargo & Company (Callable) 3.07%Jan 24, 2022 USD 2,265,000 2,970,045 2,969,746Wells Fargo Commercial Mortgage Trust2017-RB1 3.64% Mar 15, 2050 USD 1,360,000 1,866,221 1,836,153Wells Fargo Mortgage Backed SecuritiesSeries 2004-P Trust 2.74% Sep 25, 2034 USD 58,535 53,998 76,998Wells Fargo Mortgage Backed SecuritiesSeries 2005-AR16 Trust 2.90% Oct 25, 2035 USD 24,595 25,188 30,938Wells Fargo Mortgage Backed SecuritiesSeries 2005-AR2 Trust 2.87% Mar 25, 2035 USD 44,579 39,386 57,040Wells Fargo Mortgage Backed SecuritiesSeries 2006-AR10 Trust 2.92% Jul 25, 2036 USD 19,314 14,771 25,084Wells Fargo Mortgage Backed SecuritiesSeries 2006-AR6 Trust 2.76% Mar 25, 2036 USD 41,819 42,983 54,523Wells Fargo Mortgage Backed SecuritiesSeries 2007-8 Trust 6.00% Jul 25, 2037 USD 7,964 8,113 10,452WFRBS Commercial Mortgage TrustSeries 2013-C12 4.28% Mar 15, 2048 USD 100,000 125,376 132,381Williams Partners LP (Callable) 3.60%Jan 15, 2022 USD 2,115,000 2,791,979 2,804,553Williams Partners LP (Callable) 3.75%Mar 15, 2027 USD 2,040,000 2,725,134 2,623,756Williams Partners LP (Callable) 5.80%May 15, 2043 USD 630,000 908,775 913,092World Financial Network Credit Card MasterTrust 1.72% Aug 15, 2023 USD 1,010,000 1,351,728 1,303,853
811,128,279 813,470,900
TOTAL BONDS AND DEBENTURES 836,000,743 839,581,629
EQUITIES – 0.0%NRG Energy, Inc. 3 69 67
MONEY MARKET INSTRUMENTS – 5.1%United States Treasury Bills 0.00% Jul 13, 2017 USD 34,100,000 45,103,778 44,197,612
TOTAL INVESTMENT PORTFOLIO 881,104,590 883,779,308
Unrealized Gain (Loss) on Derivatives – 1.1% 9,345,258OTHER ASSETS, LESS LIABILITIES – (3.7%) (31,704,064)
NET ASSETS – 100.0% 861,420,502
Instruments with a 0.00% stated interest rate are purchased at a discount to face value. Thediscount represents the implied effective interest.
The accompanying notes are an integral part of the financial statements. Portfolio Adviser: Logan Circle Partners, L.P.
BO
ND
FUN
DS
25

Scotia Private American Core-Plus Bond Pool (Unaudited – Continued)
SCHEDULE OF DERIVATIVE INSTRUMENTSUNREALIZED GAIN ON CURRENCY FORWARD CONTRACTS
CounterpartyCreditRating
SettlementDate
Currency ToBe Received
ContractualAmount
Currency ToBe Delivered
ContractualAmount
ContractPrice
MarketPrice
UnrealizedGain ($)
Standard Chartered Bank A-1 Jul. 03, 2017 New Zealand Dollar 9,900,000 US Dollar 7,246,800 0.732 0.732 5,776
Standard Chartered Bank A-1 Jul. 31, 2017 Canadian Dollar 860,755,622 US Dollar 657,000,162 0.763 0.772 9,421,397
9,427,173
UNREALIZED LOSS ON CURRENCY FORWARD CONTRACTS
CounterpartyCreditRating
SettlementDate
Currency ToBe Received
ContractualAmount
Currency ToBe Delivered
ContractualAmount
ContractPrice
MarketPrice
UnrealizedLoss ($)
Toronto-Dominion Bank, The A-1+ Jul. 31, 2017 US Dollar 4,468,961 Australian Dollar 5,877,505 1.315 1.301 (61,907)
Toronto-Dominion Bank, The A-1+ Jul. 31, 2017 US Dollar 1,805,725 Euro 1,587,953 0.879 0.874 (14,597)
Standard Chartered Bank A-1 Jul. 31, 2017 US Dollar 7,242,840 New Zealand Dollar 9,900,000 1.367 1.366 (5,411)
(81,915)
The accompanying notes are an integral part of the financial statements. Portfolio Adviser: Logan Circle Partners, L.P.
BO
ND
FUN
DS
26

Scotia Private American Core-Plus Bond Pool (Unaudited – Continued)
FUND SPECIFIC NOTESFor the periods indicated in Note 1
The Fund (note 1)
The Fund’s investment objective is to achieve superior long termreturns and to provide income as well as capital growth by investingprimarily in a portfolio of U.S. government and corporate bonds andmortgage pass through securities. The Fund may also invest in the U.S.dollar denominated emerging markets, non-investment grade debt andnon-U.S. investment grade sovereign and corporate debt.
Risks associated with financial instruments (note 4)
Interest rate risk
The table below summarizes the Fund’s exposure to interest rate riskby the remaining term to maturity of the Fund’s portfolio, excludingunderlying funds, preferred shares, cash and overdrafts, as applicable.
Interest rate exposureJune 30, 2017
($)December 31, 2016
($)
Less than 1 year 57,980,306 26,555,9311-3 years 92,983,040 59,138,9333-5 years 81,113,658 68,160,9285-10 years 203,372,386 219,042,492> 10 years 448,329,851 417,106,479
883,779,241 790,004,763
As at June 30, 2017, had the prevailing interest rates increased ordecreased by 0.25%, assuming a parallel shift in the yield curve and allother variables held constant, net assets attributable to holders ofredeemable units would have decreased or increased, respectively, by$13,839,807 or approximately 1.6% (December 31, 2016 – $12,946,366or approximately 1.6%).
Currency risk
The Fund’s exposure to currency risk is summarized in the tablesbelow. Amounts shown are based on the carrying value of monetary andnon-monetary assets and liabilities of the Fund net of currencycontracts, as applicable.
June 30, 2017
CurrencyGross currencyexposure ($)
Currencycontracts ($)
Netexposure ($)
Percentage ofnet assets (%)
Mexican Peso 5,452,994 – 5,452,994 0.6Indian Rupee 5,172,543 – 5,172,543 0.6Euro 2,412,233 (2,355,711) 56,522 0.0Australian Dollar 5,892,794 (5,855,895) 36,899 0.0Norwegian Krone 9,333 – 9,333 0.0Swedish Krona 1 – 1 0.0British Pound 1 – 1 0.0New Zealand Dollar (16,351) 391 (15,960) 0.0
US Dollar 832,679,745 (843,123,010) (10,443,265) (1.2)
851,603,293 (851,334,225) 269,068 –
December 31, 2016
CurrencyGross currencyexposure ($)
Currencycontracts ($)
Netexposure ($)
Percentage ofnet assets (%)
US Dollar 762,794,175 (754,345,450) 8,448,725 1.0Indian Rupee 5,059,663 – 5,059,663 0.6Mexican Peso 4,899,815 – 4,899,815 0.6Norwegian Krone 3,471,333 – 3,471,333 0.4Swedish Krona 1 – 1 0.0British Pound 1 – 1 0.0Australian Dollar 5,533,577 (5,541,457) (7,880) 0.0Euro 2,450,965 (2,471,576) (20,611) 0.0
New Zealand Dollar 9,135,733 (9,240,684) (104,951) 0.0
793,345,263 (771,599,167) 21,746,096 2.6
If the Canadian dollar strengthened or weakened by 10% in relation toall other currencies, with all other variables held constant, net assetsof the Fund could possibly have decreased or increased, respectively,by $26,905 or 0.1% of net assets (December 31, 2016 – $2,174,610 or0.3%). In practice, actual results may differ from this sensitivityanalysis and the difference could be material.
Price risk
Price risk is the risk that the carrying value of financial instrumentswill fluctuate as a result of changes in market prices (other than thosearising from interest rate risk or currency risk) caused by factorsspecific to a security, its issuer or all factors affecting a market or amarket segment. Exposure to price risk is mainly in equities,underlying funds, derivatives and commodities, as applicable. As atJune 30, 2017, approximately 0.0% (December 31, 2016 – 0.0%) of theFund’s net assets were exposed to price risk. If prices of theseinstruments had decreased or increased by 10%, with all othervariables held constant, net assets of the Fund would have decreasedor increased, respectively, by approximately $7 (December 31,2016 – $5). In practice, actual results may differ from this sensitivityanalysis and the difference could be material.
Credit risk
The table below summarizes the credit ratings of bonds anddebentures, money market instruments and preferred shares held bythe Fund, as applicable.
June 30, 2017 December 31, 2016
Credit ratings
Percentage oftotal credit
ratedinstruments
(%)
Percentage ofnet assets
(%)
Percentage oftotal credit
ratedinstruments
(%)
Percentage ofnet assets
(%)
Short Term RatingA-1+ 5.0 5.1 29.8 29.1Bond Credit RatingAAA 53.6 55.3 23.1 22.6AA 1.9 2.0 2.4 2.3A 7.8 8.0 9.9 9.7BBB 20.9 21.3 23.6 23.0BB 4.8 4.8 4.4 4.1B 5.0 5.0 6.2 6.0CCC 0.2 0.2 0.6 0.6NOT RATED 0.8 0.9 0.0 0.0
100.0 102.6 100.0 97.4
The accompanying notes are an integral part of the financial statements.
BO
ND
FUN
DS
27

Scotia Private American Core-Plus Bond Pool (Unaudited – Continued)
FUND SPECIFIC NOTESFor the periods indicated in Note 1
Concentration risk
Concentration risk arises as a result of the concentration of exposureswithin the same category, geographical location, asset type or industrysector, as applicable. The table below is a summary of the Fund’sconcentration risk:
Percentage of net assets (%)
June 30, 2017 December 31, 2016
Australian Dollar 0.2 0.2Euro 0.3 0.3Indian Ruppee 0.6 0.6Mexican Peso 0.6 0.6New Zealand dollar 1.4 1.6Norwegian Krone – 0.4US Dollar 99.5 94.2
Fair Value Classification (note 2)
The tables below illustrate the classification of the Fund’s financialinstruments within the fair value hierarchy.
June 30, 2017Level 1
($)Level 2
($)Level 3
($)Total($)
Equities 67 – – 67Bonds and debentures – 839,581,629 – 839,581,629Money market instruments – 44,197,612 – 44,197,612Unrealized gain on currency forward
contracts – 9,427,173 – 9,427,173
67 893,206,414 – 893,206,481
Unrealized loss on currency forwardcontracts – (81,915) – (81,915)
67 893,124,499 – 893,124,566
December 31, 2016Level 1
($)Level 2
($)Level 3
($)Total($)
Equities 49 – – 49Bonds and debentures – 790,004,763 – 790,004,763Unrealized gain on currency forward
contracts – 8,940,628 – 8,940,628
49 798,945,391 – 798,945,440
Unrealized loss on currency forwardcontracts – (125,636) – (125,636)
49 798,819,755 – 798,819,804
Transfers between levels
During the periods ended June 30, 2017 and December 31, 2016, therewere no significant transfers between Level 1 and Level 2.
Offsetting of financial assets and liabilities (note 2)
The following table presents offsetting of financial assets and liabilitiesand collateral amounts that would occur if future events, such asbankruptcy or termination of contracts, were to arise.
June 30, 2017
Financial assets – by type
Gross amountof assets
($)
Master nettingoffset
($)
Collateralpledged/received
($)
NetAmount
($)
Currency forward contracts 9,427,173 (5,411) – 9,421,762Options contracts – OTC – – – –Swap contracts – OTC – – – –
9,427,173 (5,411) – 9,421,762
Financial liabilities – by type
Gross amountof liabilities
($)
Master nettingoffset
($)
Collateralpledged/received
($)
NetAmount
($)
Currency forward contracts 81,915 (5,411) – 76,504Options contracts – OTC – – – –Swap contracts – OTC – – – –
81,915 (5,411) – 76,504
December 31, 2016
Financial assets – by type
Gross amountof assets
($)
Master nettingoffset
($)
Collateralpledged/received
($)
NetAmount
($)
Currency forward contracts 8,940,628 – – 8,940,628Options contracts – OTC – – – –Swap contracts – OTC – – – –
8,940,628 – – 8,940,628
Financial liabilities – by type
Gross amountof liabilities
($)
Master nettingoffset
($)
Collateralpledged/received
($)
NetAmount
($)
Currency forward contracts 125,636 – – 125,636Options contracts – OTC – – – –Swap contracts – OTC – – – –
125,636 – – 125,636
Interest in Underlying Funds (note 2)
The Fund did not hold any interest in Underlying Funds as at June 30,2017 or December 31, 2016.
Comparison of net asset value per unit and net assets per unit(note 2)
As at June 30, 2017 or December 31, 2016, there were no differencesbetween the net asset value per unit and the net assets per unit for anyseries of the Fund.
The accompanying notes are an integral part of the financial statements.
BO
ND
FUN
DS
28
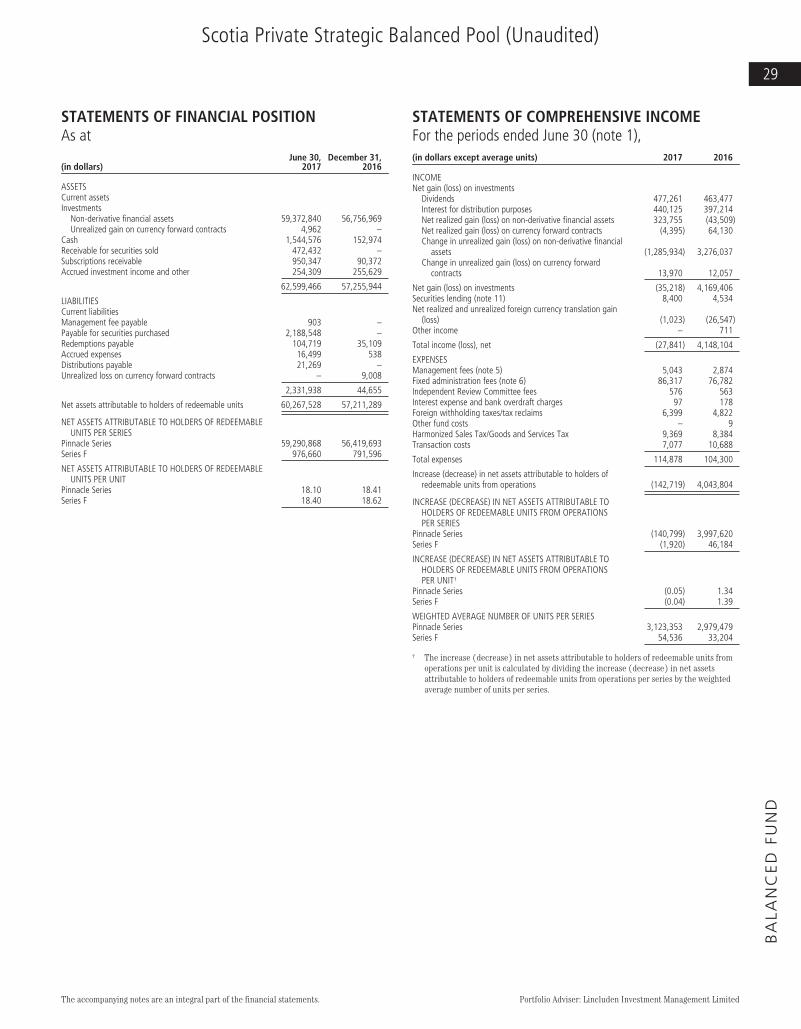
Scotia Private Strategic Balanced Pool (Unaudited)
STATEMENTS OF FINANCIAL POSITIONAs at
(in dollars)June 30,
2017December 31,
2016
ASSETSCurrent assetsInvestments
Non-derivative financial assets 59,372,840 56,756,969Unrealized gain on currency forward contracts 4,962 –
Cash 1,544,576 152,974Receivable for securities sold 472,432 –Subscriptions receivable 950,347 90,372Accrued investment income and other 254,309 255,629
62,599,466 57,255,944
LIABILITIESCurrent liabilitiesManagement fee payable 903 –Payable for securities purchased 2,188,548 –Redemptions payable 104,719 35,109Accrued expenses 16,499 538Distributions payable 21,269 –Unrealized loss on currency forward contracts – 9,008
2,331,938 44,655
Net assets attributable to holders of redeemable units 60,267,528 57,211,289
NET ASSETS ATTRIBUTABLE TO HOLDERS OF REDEEMABLEUNITS PER SERIES
Pinnacle Series 59,290,868 56,419,693Series F 976,660 791,596
NET ASSETS ATTRIBUTABLE TO HOLDERS OF REDEEMABLEUNITS PER UNIT
Pinnacle Series 18.10 18.41Series F 18.40 18.62
STATEMENTS OF COMPREHENSIVE INCOMEFor the periods ended June 30 (note 1),(in dollars except average units) 2017 2016
INCOMENet gain (loss) on investments
Dividends 477,261 463,477Interest for distribution purposes 440,125 397,214Net realized gain (loss) on non-derivative financial assets 323,755 (43,509)Net realized gain (loss) on currency forward contracts (4,395) 64,130Change in unrealized gain (loss) on non-derivative financial
assets (1,285,934) 3,276,037Change in unrealized gain (loss) on currency forward
contracts 13,970 12,057
Net gain (loss) on investments (35,218) 4,169,406Securities lending (note 11) 8,400 4,534Net realized and unrealized foreign currency translation gain
(loss) (1,023) (26,547)Other income – 711
Total income (loss), net (27,841) 4,148,104
EXPENSESManagement fees (note 5) 5,043 2,874Fixed administration fees (note 6) 86,317 76,782Independent Review Committee fees 576 563Interest expense and bank overdraft charges 97 178Foreign withholding taxes/tax reclaims 6,399 4,822Other fund costs – 9Harmonized Sales Tax/Goods and Services Tax 9,369 8,384Transaction costs 7,077 10,688
Total expenses 114,878 104,300
Increase (decrease) in net assets attributable to holders ofredeemable units from operations (142,719) 4,043,804
INCREASE (DECREASE) IN NET ASSETS ATTRIBUTABLE TOHOLDERS OF REDEEMABLE UNITS FROM OPERATIONSPER SERIES
Pinnacle Series (140,799) 3,997,620Series F (1,920) 46,184
INCREASE (DECREASE) IN NET ASSETS ATTRIBUTABLE TOHOLDERS OF REDEEMABLE UNITS FROM OPERATIONSPER UNIT†
Pinnacle Series (0.05) 1.34Series F (0.04) 1.39
WEIGHTED AVERAGE NUMBER OF UNITS PER SERIESPinnacle Series 3,123,353 2,979,479Series F 54,536 33,204
† The increase (decrease) in net assets attributable to holders of redeemable units fromoperations per unit is calculated by dividing the increase (decrease) in net assetsattributable to holders of redeemable units from operations per series by the weightedaverage number of units per series.
The accompanying notes are an integral part of the financial statements. Portfolio Adviser: Lincluden Investment Management Limited
BA
LAN
CE
DFU
ND
29

Scotia Private Strategic Balanced Pool (Unaudited – Continued)
STATEMENTS OF CHANGES IN NET ASSETSATTRIBUTABLE TO HOLDERS OF REDEEMABLEUNITSFor the periods ended June 30 (note 1),(in dollars) 2017 2016
NET ASSETS ATTRIBUTABLE TO HOLDERS OF REDEEMABLEUNITS, BEGINNING OF PERIOD
Pinnacle Series 56,419,693 48,117,892Series F 791,596 538,613
57,211,289 48,656,505
INCREASE (DECREASE) IN NET ASSETS ATTRIBUTABLE TOHOLDERS OF REDEEMABLE UNITS FROM OPERATIONS
Pinnacle Series (140,799) 3,997,620Series F (1,920) 46,184
(142,719) 4,043,804
DISTRIBUTIONS TO HOLDERS OF REDEEMABLE UNITSFrom net investment income
Pinnacle Series (844,901) (818,706)Series F (10,716) (7,066)
(855,617) (825,772)
REDEEMABLE UNIT TRANSACTIONSProceeds from issue
Pinnacle Series 10,292,486 8,059,621Series F 339,086 116,114
Reinvested distributionsPinnacle Series 821,300 811,170Series F 4,126 1,697
Payments on redemptionPinnacle Series (7,256,911) (6,441,771)Series F (145,512) (38,055)
4,054,575 2,508,776
INCREASE (DECREASE) IN NET ASSETS ATTRIBUTABLE TOHOLDERS OF REDEEMABLE UNITS
Pinnacle Series 2,871,175 5,607,934Series F 185,064 118,874
3,056,239 5,726,808
NET ASSETS ATTRIBUTABLE TO HOLDERS OF REDEEMABLEUNITS, END OF PERIOD
Pinnacle Series 59,290,868 53,725,826Series F 976,660 657,487
60,267,528 54,383,313
STATEMENTS OF CASH FLOWSFor the periods ended June 30 (note 1),(in dollars) 2017 2016
CASH FLOWS FROM OPERATING ACTIVITIESIncrease (decrease) in net assets attributable to holders of
redeemable units (142,719) 4,043,804Adjustments for:
Net realized (gain) loss on non-derivative financial assets (323,755) 43,509Unrealized foreign currency translation (gain) loss 1,194 26,925Change in unrealized (gain) loss on non-derivative
financial assets 1,285,934 (3,276,037)Change in unrealized (gain) loss on currency forward
contracts (13,970) (12,057)Purchases of portfolio investments (11,422,562) (22,326,233)Proceeds from sale of portfolio investments 9,560,628 20,150,857Accrued investment income and other 1,320 5,263Accrued expenses and other payables 16,864 15,069
Net cash provided by (used in) operating activities (1,037,066) (1,328,900)
CASH FLOWS FROM FINANCING ACTIVITIESProceeds from issue of redeemable units 9,771,597 8,109,135Amounts paid on redemption of redeemable units (7,332,813) (6,476,115)Distributions to unitholders of redeemable units (8,922) (7,131)
Net cash provided by (used in) financing activities 2,429,862 1,625,889Unrealized foreign currency translation gain (loss) (1,194) (26,925)Net increase (decrease) in cash 1,392,796 296,989Cash (bank overdraft), beginning of period 152,974 241,702
CASH (BANK OVERDRAFT), END OF PERIOD 1,544,576 511,766
Interest paid(1) 97 178Interest received(1) 448,258 388,934Dividends received, net of withholding taxes(1) 464,048 472,193
(1) Classified as operating items.
The accompanying notes are an integral part of the financial statements. Portfolio Adviser: Lincluden Investment Management Limited
BA
LAN
CE
DFU
ND
30
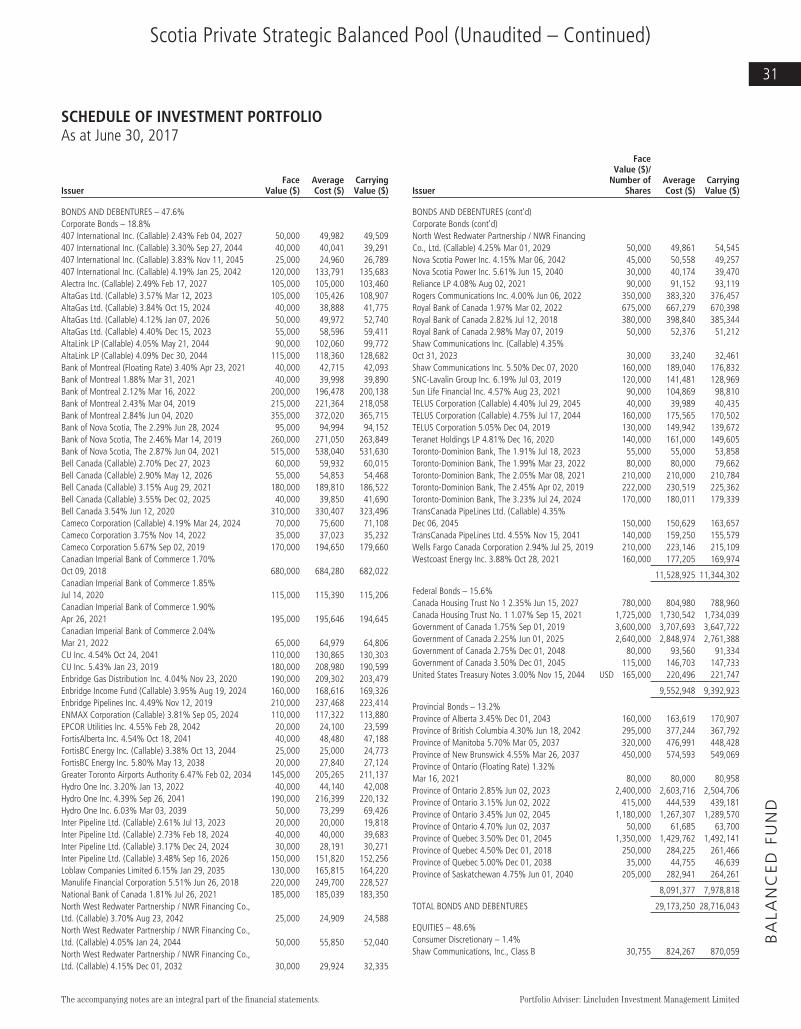
Scotia Private Strategic Balanced Pool (Unaudited – Continued)
SCHEDULE OF INVESTMENT PORTFOLIOAs at June 30, 2017
IssuerFace
Value ($)AverageCost ($)
CarryingValue ($)
BONDS AND DEBENTURES – 47.6%Corporate Bonds – 18.8%407 International Inc. (Callable) 2.43% Feb 04, 2027 50,000 49,982 49,509407 International Inc. (Callable) 3.30% Sep 27, 2044 40,000 40,041 39,291407 International Inc. (Callable) 3.83% Nov 11, 2045 25,000 24,960 26,789407 International Inc. (Callable) 4.19% Jan 25, 2042 120,000 133,791 135,683Alectra Inc. (Callable) 2.49% Feb 17, 2027 105,000 105,000 103,460AltaGas Ltd. (Callable) 3.57% Mar 12, 2023 105,000 105,426 108,907AltaGas Ltd. (Callable) 3.84% Oct 15, 2024 40,000 38,888 41,775AltaGas Ltd. (Callable) 4.12% Jan 07, 2026 50,000 49,972 52,740AltaGas Ltd. (Callable) 4.40% Dec 15, 2023 55,000 58,596 59,411AltaLink LP (Callable) 4.05% May 21, 2044 90,000 102,060 99,772AltaLink LP (Callable) 4.09% Dec 30, 2044 115,000 118,360 128,682Bank of Montreal (Floating Rate) 3.40% Apr 23, 2021 40,000 42,715 42,093Bank of Montreal 1.88% Mar 31, 2021 40,000 39,998 39,890Bank of Montreal 2.12% Mar 16, 2022 200,000 196,478 200,138Bank of Montreal 2.43% Mar 04, 2019 215,000 221,364 218,058Bank of Montreal 2.84% Jun 04, 2020 355,000 372,020 365,715Bank of Nova Scotia, The 2.29% Jun 28, 2024 95,000 94,994 94,152Bank of Nova Scotia, The 2.46% Mar 14, 2019 260,000 271,050 263,849Bank of Nova Scotia, The 2.87% Jun 04, 2021 515,000 538,040 531,630Bell Canada (Callable) 2.70% Dec 27, 2023 60,000 59,932 60,015Bell Canada (Callable) 2.90% May 12, 2026 55,000 54,853 54,468Bell Canada (Callable) 3.15% Aug 29, 2021 180,000 189,810 186,522Bell Canada (Callable) 3.55% Dec 02, 2025 40,000 39,850 41,690Bell Canada 3.54% Jun 12, 2020 310,000 330,407 323,496Cameco Corporation (Callable) 4.19% Mar 24, 2024 70,000 75,600 71,108Cameco Corporation 3.75% Nov 14, 2022 35,000 37,023 35,232Cameco Corporation 5.67% Sep 02, 2019 170,000 194,650 179,660Canadian Imperial Bank of Commerce 1.70%Oct 09, 2018 680,000 684,280 682,022Canadian Imperial Bank of Commerce 1.85%Jul 14, 2020 115,000 115,390 115,206Canadian Imperial Bank of Commerce 1.90%Apr 26, 2021 195,000 195,646 194,645Canadian Imperial Bank of Commerce 2.04%Mar 21, 2022 65,000 64,979 64,806CU Inc. 4.54% Oct 24, 2041 110,000 130,865 130,303CU Inc. 5.43% Jan 23, 2019 180,000 208,980 190,599Enbridge Gas Distribution Inc. 4.04% Nov 23, 2020 190,000 209,302 203,479Enbridge Income Fund (Callable) 3.95% Aug 19, 2024 160,000 168,616 169,326Enbridge Pipelines Inc. 4.49% Nov 12, 2019 210,000 237,468 223,414ENMAX Corporation (Callable) 3.81% Sep 05, 2024 110,000 117,322 113,880EPCOR Utilities Inc. 4.55% Feb 28, 2042 20,000 24,100 23,599FortisAlberta Inc. 4.54% Oct 18, 2041 40,000 48,480 47,188FortisBC Energy Inc. (Callable) 3.38% Oct 13, 2044 25,000 25,000 24,773FortisBC Energy Inc. 5.80% May 13, 2038 20,000 27,840 27,124Greater Toronto Airports Authority 6.47% Feb 02, 2034 145,000 205,265 211,137Hydro One Inc. 3.20% Jan 13, 2022 40,000 44,140 42,008Hydro One Inc. 4.39% Sep 26, 2041 190,000 216,399 220,132Hydro One Inc. 6.03% Mar 03, 2039 50,000 73,299 69,426Inter Pipeline Ltd. (Callable) 2.61% Jul 13, 2023 20,000 20,000 19,818Inter Pipeline Ltd. (Callable) 2.73% Feb 18, 2024 40,000 40,000 39,683Inter Pipeline Ltd. (Callable) 3.17% Dec 24, 2024 30,000 28,191 30,271Inter Pipeline Ltd. (Callable) 3.48% Sep 16, 2026 150,000 151,820 152,256Loblaw Companies Limited 6.15% Jan 29, 2035 130,000 165,815 164,220Manulife Financial Corporation 5.51% Jun 26, 2018 220,000 249,700 228,527National Bank of Canada 1.81% Jul 26, 2021 185,000 185,039 183,350North West Redwater Partnership / NWR Financing Co.,Ltd. (Callable) 3.70% Aug 23, 2042 25,000 24,909 24,588North West Redwater Partnership / NWR Financing Co.,Ltd. (Callable) 4.05% Jan 24, 2044 50,000 55,850 52,040North West Redwater Partnership / NWR Financing Co.,Ltd. (Callable) 4.15% Dec 01, 2032 30,000 29,924 32,335
Issuer
FaceValue ($)/
Number ofShares
AverageCost ($)
CarryingValue ($)
BONDS AND DEBENTURES (cont'd)Corporate Bonds (cont'd)North West Redwater Partnership / NWR FinancingCo., Ltd. (Callable) 4.25% Mar 01, 2029 50,000 49,861 54,545Nova Scotia Power Inc. 4.15% Mar 06, 2042 45,000 50,558 49,257Nova Scotia Power Inc. 5.61% Jun 15, 2040 30,000 40,174 39,470Reliance LP 4.08% Aug 02, 2021 90,000 91,152 93,119Rogers Communications Inc. 4.00% Jun 06, 2022 350,000 383,320 376,457Royal Bank of Canada 1.97% Mar 02, 2022 675,000 667,279 670,398Royal Bank of Canada 2.82% Jul 12, 2018 380,000 398,840 385,344Royal Bank of Canada 2.98% May 07, 2019 50,000 52,376 51,212Shaw Communications Inc. (Callable) 4.35%Oct 31, 2023 30,000 33,240 32,461Shaw Communications Inc. 5.50% Dec 07, 2020 160,000 189,040 176,832SNC-Lavalin Group Inc. 6.19% Jul 03, 2019 120,000 141,481 128,969Sun Life Financial Inc. 4.57% Aug 23, 2021 90,000 104,869 98,810TELUS Corporation (Callable) 4.40% Jul 29, 2045 40,000 39,989 40,435TELUS Corporation (Callable) 4.75% Jul 17, 2044 160,000 175,565 170,502TELUS Corporation 5.05% Dec 04, 2019 130,000 149,942 139,672Teranet Holdings LP 4.81% Dec 16, 2020 140,000 161,000 149,605Toronto-Dominion Bank, The 1.91% Jul 18, 2023 55,000 55,000 53,858Toronto-Dominion Bank, The 1.99% Mar 23, 2022 80,000 80,000 79,662Toronto-Dominion Bank, The 2.05% Mar 08, 2021 210,000 210,000 210,784Toronto-Dominion Bank, The 2.45% Apr 02, 2019 222,000 230,519 225,362Toronto-Dominion Bank, The 3.23% Jul 24, 2024 170,000 180,011 179,339TransCanada PipeLines Ltd. (Callable) 4.35%Dec 06, 2045 150,000 150,629 163,657TransCanada PipeLines Ltd. 4.55% Nov 15, 2041 140,000 159,250 155,579Wells Fargo Canada Corporation 2.94% Jul 25, 2019 210,000 223,146 215,109Westcoast Energy Inc. 3.88% Oct 28, 2021 160,000 177,205 169,974
11,528,925 11,344,302
Federal Bonds – 15.6%Canada Housing Trust No 1 2.35% Jun 15, 2027 780,000 804,980 788,960Canada Housing Trust No. 1 1.07% Sep 15, 2021 1,725,000 1,730,542 1,734,039Government of Canada 1.75% Sep 01, 2019 3,600,000 3,707,693 3,647,722Government of Canada 2.25% Jun 01, 2025 2,640,000 2,848,974 2,761,388Government of Canada 2.75% Dec 01, 2048 80,000 93,560 91,334Government of Canada 3.50% Dec 01, 2045 115,000 146,703 147,733United States Treasury Notes 3.00% Nov 15, 2044 USD 165,000 220,496 221,747
9,552,948 9,392,923
Provincial Bonds – 13.2%Province of Alberta 3.45% Dec 01, 2043 160,000 163,619 170,907Province of British Columbia 4.30% Jun 18, 2042 295,000 377,244 367,792Province of Manitoba 5.70% Mar 05, 2037 320,000 476,991 448,428Province of New Brunswick 4.55% Mar 26, 2037 450,000 574,593 549,069Province of Ontario (Floating Rate) 1.32%Mar 16, 2021 80,000 80,000 80,958Province of Ontario 2.85% Jun 02, 2023 2,400,000 2,603,716 2,504,706Province of Ontario 3.15% Jun 02, 2022 415,000 444,539 439,181Province of Ontario 3.45% Jun 02, 2045 1,180,000 1,267,307 1,289,570Province of Ontario 4.70% Jun 02, 2037 50,000 61,685 63,700Province of Quebec 3.50% Dec 01, 2045 1,350,000 1,429,762 1,492,141Province of Quebec 4.50% Dec 01, 2018 250,000 284,225 261,466Province of Quebec 5.00% Dec 01, 2038 35,000 44,755 46,639Province of Saskatchewan 4.75% Jun 01, 2040 205,000 282,941 264,261
8,091,377 7,978,818
TOTAL BONDS AND DEBENTURES 29,173,250 28,716,043
EQUITIES – 48.6%Consumer Discretionary – 1.4%Shaw Communications, Inc., Class B 30,755 824,267 870,059
The accompanying notes are an integral part of the financial statements. Portfolio Adviser: Lincluden Investment Management Limited
BA
LAN
CE
DFU
ND
31

Scotia Private Strategic Balanced Pool (Unaudited – Continued)
SCHEDULE OF INVESTMENT PORTFOLIOAs at June 30, 2017
IssuerNumber of
SharesAverageCost ($)
CarryingValue ($)
EQUITIES (cont'd)Consumer Staples – 3.3%George Weston Limited 3,625 369,767 425,539Jean Coutu Group (PJC) Inc., The, Class A 28,180 535,855 560,782Metro Inc., Class A 10,270 369,353 438,324North West Company Inc. 17,290 457,254 540,485
1,732,229 1,965,130
Energy – 5.8%ARC Resources Ltd. 25,735 512,696 436,466Cenovus Energy Inc. 60,460 1,170,772 577,998Crescent Point Energy Corporation 57,665 916,918 572,037Enbridge Income Fund Holdings Inc. 23,655 798,391 761,454Enerplus Corporation 27,650 240,303 290,878Husky Energy Inc. 57,011 1,078,645 839,202
4,717,725 3,478,035
Financials – 17.2%Bank of Montreal 9,150 542,142 871,263Bank of Nova Scotia, The 14,610 757,286 1,139,726Canadian Imperial Bank of Commerce 5,535 432,579 583,334Intact Financial Corporation 9,050 775,523 886,538Laurentian Bank of Canada 10,990 525,401 595,328Manulife Financial Corporation 37,140 808,051 902,873Power Financial Corporation 35,100 1,186,518 1,167,777Royal Bank of Canada 15,340 870,881 1,444,414Sun Life Financial Inc. 22,440 964,793 1,040,318Toronto-Dominion Bank, The 26,690 1,288,789 1,744,191
8,151,963 10,375,762
Health Care – 3.5%GlaxoSmithKline PLC – ADR 11,715 661,247 654,926Johnson & Johnson 2,845 300,183 487,956Merck & Co., Inc. 5,440 407,917 452,023Pfizer Inc. 12,385 518,514 539,358
1,887,861 2,134,263
Materials – 1.9%Agrium Inc. 4,920 581,740 578,248Potash Corporation of Saskatchewan Inc. 27,435 578,798 580,250
1,160,538 1,158,498
Issuer
Number ofShares/
FaceValue ($)
AverageCost ($)
CarryingValue ($)
EQUITIES (cont'd)Real Estate – 5.8%Brookfield Property Partners LP 29,050 850,106 891,254Cominar Real Estate Investment Trust 21,735 302,187 276,252Dream Industrial Real Estate Investment Trust 54,795 400,649 476,717First Capital Realty, Inc. 21,410 424,778 423,062H&R Real Estate Investment Trust 26,300 538,672 579,126RioCan Real Estate Investment Trust 35,880 987,483 863,632
3,503,875 3,510,043
Telecommunication Services – 6.3%BCE Inc. 19,750 1,134,377 1,153,400Rogers Communications, Inc., Class B 15,210 687,332 931,613TELUS Corporation 20,045 841,674 897,415Verizon Communications Inc. 13,895 857,971 804,541
3,521,354 3,786,969
Utilities – 3.4%Brookfield Renew Energy Partners LP 14,975 557,075 619,216Hydro One Limited 37,875 872,952 879,836Superior Plus Corporation 50,755 605,293 579,622
2,035,320 2,078,674
TOTAL EQUITIES 27,535,132 29,357,433
MONEY MARKET INSTRUMENTS – 2.2%Treasury Bills – 2.2%Government of Canada 0.00% Aug 10, 2017 400,000 399,460 399,780Government of Canada 0.00% Jul 13, 2017 500,000 499,370 499,912Government of Canada 0.00% Jul 27, 2017 100,000 99,858 99,962Government of Canada 0.00% Sep 07, 2017 300,000 299,586 299,710
TOTAL MONEY MARKET INSTRUMENTS 1,298,274 1,299,364
Transaction Costs (25,506)
TOTAL INVESTMENT PORTFOLIO 57,981,150 59,372,840
Unrealized Gain (Loss) on Derivatives — 0.0% 4,962OTHER ASSETS, LESS LIABILITIES — 1.6% 889,726
NET ASSETS — 100.0% 60,267,528
Instruments with a 0.00% stated interest rate are purchased at a discount to face value. Thediscount represents the implied effective interest.
SCHEDULE OF DERIVATIVE INSTRUMENTS
UNREALIZED GAIN ON CURRENCY FORWARD CONTRACTS
CounterpartyCreditRating
SettlementDate
Currency ToBe Received
ContractualAmount
Currency To BeDelivered
ContractualAmount
ContractPrice
MarketPrice
UnrealizedGain ($)
Bank of Nova Scotia, The A-1 Jul. 27, 2017 Canadian Dollar 13,503 US Dollar 10,000 0.741 0.772 545
Bank of Nova Scotia, The A-1 Aug. 24, 2017 Canadian Dollar 205,197 US Dollar 155,000 0.755 0.772 4,417
4,962
The accompanying notes are an integral part of the financial statements. Portfolio Adviser: Lincluden Investment Management Limited
BA
LAN
CE
DFU
ND
32

Scotia Private Strategic Balanced Pool (Unaudited – Continued)
FUND SPECIFIC NOTESFor the periods indicated in Note 1
The Fund (note 1)
The Fund’s investment objective is to achieve superior long termreturns through a combination of capital growth and income byinvesting primarily in large capitalization stocks of Canadiancorporations and Canadian government bonds. The weighting of theFund’s portfolio will be allocated between asset classes withinspecified ranges: 40%-80% equities, 20%-60% fixed income securities,and 0%-30% short-term money market securities and cash.
Risks associated with financial instruments (note 4)
Interest rate risk
The table below summarizes the Fund’s exposure to interest rate riskby the remaining term to maturity of the Fund’s portfolio, excludingunderlying funds, preferred shares, cash and overdrafts, as applicable.
Interest rate exposureJune 30, 2017
($)December 31, 2016
($)
Less than 1 year 1,527,888 290,0181-3 years 7,501,669 6,845,8443-5 years 6,083,587 5,272,6725-10 years 7,618,415 8,517,797> 10 years 7,283,848 7,141,958
30,015,407 28,068,289
As at June 30, 2017, had the prevailing interest rates increased ordecreased by 0.25%, assuming a parallel shift in the yield curve and allother variables held constant, net assets attributable to holders ofredeemable units would have decreased or increased, respectively, by$505,377 or approximately 0.8% (December 31, 2016 – $498,431 orapproximately 0.9%).
Currency risk
The Fund’s exposure to currency risk is summarized in the tablesbelow. Amounts shown are based on the carrying value of monetary andnon-monetary assets and liabilities of the Fund net of currencycontracts, as applicable.
June 30, 2017
CurrencyGross currencyexposure ($)
Currencycontracts ($)
Netexposure ($)
Percentage ofnet assets (%)
US Dollar 3,216,838 (213,739) 3,003,099 5.0
3,216,838 (213,739) 3,003,099 5.0
December 31, 2016
CurrencyGross currencyexposure ($)
Currencycontracts ($)
Netexposure ($)
Percentage ofnet assets (%)
US Dollar 3,232,466 (389,262) 2,843,204 5.0
3,232,466 (389,262) 2,843,204 5.0
If the Canadian dollar strengthened or weakened by 10% in relation toall other currencies, with all other variables held constant, net assetsof the Fund could possibly have decreased or increased, respectively,by $300,310 or 0.5% of net assets (December 31, 2016 – $284,320 or0.5%). In practice, actual results may differ from this sensitivityanalysis and the difference could be material.
Price risk
Price risk is the risk that the carrying value of financial instrumentswill fluctuate as a result of changes in market prices (other than thosearising from interest rate risk or currency risk) caused by factorsspecific to a security, its issuer or all factors affecting a market or amarket segment. Exposure to price risk is mainly in equities,underlying funds, derivatives and commodities, as applicable. As atJune 30, 2017, approximately 48.6% (December 31, 2016 – 50.2%) ofthe Fund’s net assets were exposed to price risk. If prices of theseinstruments had decreased or increased by 10%, with all othervariables held constant, net assets of the Fund would have decreasedor increased, respectively, by approximately $2,935,743(December 31, 2016 – $2,868,868). In practice, actual results maydiffer from this sensitivity analysis and the difference could bematerial.
Credit risk
The table below summarizes the credit ratings of bonds anddebentures, money market instruments and preferred shares held bythe Fund, as applicable.
June 30, 2017 December 31, 2016
Credit ratings
Percentage oftotal credit
ratedinstruments
(%)
Percentage ofnet assets
(%)
Percentage oftotal credit
ratedinstruments
(%)
Percentage ofnet assets
(%)
Short Term RatingA-1+ 4.3 2.2 0.9 0.4Bond Credit RatingAAA 33.2 16.6 32.4 16.1AA 19.1 9.5 13.9 6.7A 29.3 14.5 38.7 18.9BBB 14.1 7.0 14.1 6.9
100.0 49.8 100.0 49.0
Concentration risk
Concentration risk arises as a result of the concentration of exposureswithin the same category, geographical location, asset type or industrysector, as applicable. The table below is a summary of the Fund’sconcentration risk:
Percentage of net assets (%)
June 30, 2017 December 31, 2016
Consumer Discretionary 1.4 1.9Consumer Staples 3.3 3.1Corporate Bonds 18.8 18.5Energy 5.8 7.5Federal Bonds 15.6 15.3Financials 17.2 16.9Health Care 3.5 3.5Materials 1.9 1.9Provincial Bonds 13.2 14.8Real Estate 5.8 5.7Telecommunication Services 6.3 6.7Treasury Bills 2.2 0.4Utilities 3.4 3.0
The accompanying notes are an integral part of the financial statements.
BA
LAN
CE
DFU
ND
33
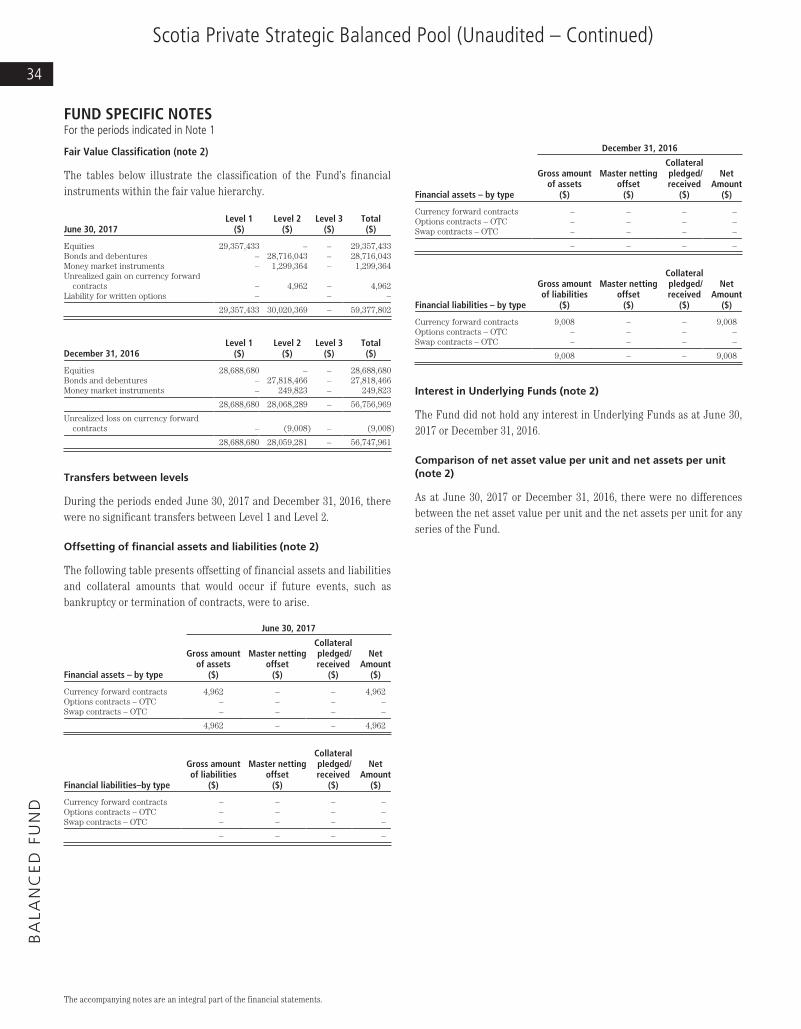
Scotia Private Strategic Balanced Pool (Unaudited – Continued)
FUND SPECIFIC NOTESFor the periods indicated in Note 1
Fair Value Classification (note 2)
The tables below illustrate the classification of the Fund’s financialinstruments within the fair value hierarchy.
June 30, 2017Level 1
($)Level 2
($)Level 3
($)Total($)
Equities 29,357,433 – – 29,357,433Bonds and debentures – 28,716,043 – 28,716,043Money market instruments – 1,299,364 – 1,299,364Unrealized gain on currency forward
contracts – 4,962 – 4,962Liability for written options – – –
29,357,433 30,020,369 – 59,377,802
December 31, 2016Level 1
($)Level 2
($)Level 3
($)Total($)
Equities 28,688,680 – – 28,688,680Bonds and debentures – 27,818,466 – 27,818,466Money market instruments – 249,823 – 249,823
28,688,680 28,068,289 – 56,756,969
Unrealized loss on currency forwardcontracts – (9,008) – (9,008)
28,688,680 28,059,281 – 56,747,961
Transfers between levels
During the periods ended June 30, 2017 and December 31, 2016, therewere no significant transfers between Level 1 and Level 2.
Offsetting of financial assets and liabilities (note 2)
The following table presents offsetting of financial assets and liabilitiesand collateral amounts that would occur if future events, such asbankruptcy or termination of contracts, were to arise.
June 30, 2017
Financial assets – by type
Gross amountof assets
($)
Master nettingoffset
($)
Collateralpledged/received
($)
NetAmount
($)
Currency forward contracts 4,962 – – 4,962Options contracts – OTC – – – –Swap contracts – OTC – – – –
4,962 – – 4,962
Financial liabilities–by type
Gross amountof liabilities
($)
Master nettingoffset
($)
Collateralpledged/received
($)
NetAmount
($)
Currency forward contracts – – – –Options contracts – OTC – – – –Swap contracts – OTC – – – –
– – – –
December 31, 2016
Financial assets – by type
Gross amountof assets
($)
Master nettingoffset
($)
Collateralpledged/received
($)
NetAmount
($)
Currency forward contracts – – – –Options contracts – OTC – – – –Swap contracts – OTC – – – –
– – – –
Financial liabilities – by type
Gross amountof liabilities
($)
Master nettingoffset
($)
Collateralpledged/received
($)
NetAmount
($)
Currency forward contracts 9,008 – – 9,008Options contracts – OTC – – – –Swap contracts – OTC – – – –
9,008 – – 9,008
Interest in Underlying Funds (note 2)
The Fund did not hold any interest in Underlying Funds as at June 30,2017 or December 31, 2016.
Comparison of net asset value per unit and net assets per unit(note 2)
As at June 30, 2017 or December 31, 2016, there were no differencesbetween the net asset value per unit and the net assets per unit for anyseries of the Fund.
The accompanying notes are an integral part of the financial statements.
BA
LAN
CE
DFU
ND
34

Scotia Private Canadian Value Pool (Unaudited)
STATEMENTS OF FINANCIAL POSITIONAs at
(in dollars)June 30,
2017December 31,
2016
ASSETSCurrent assetsInvestments
Non-derivative financial assets 193,567,422 195,571,311Cash 140,553 49,354Receivable for securities sold 4,526,829 276,806Subscriptions receivable 431,171 268,403Accrued investment income and other 657,549 624,291
199,323,524 196,790,165
LIABILITIESCurrent liabilitiesManagement fee payable 705 –Payable for securities purchased 5,470,669 88,148Redemptions payable 673,231 117,894Accrued expenses 26,202 886
6,170,807 206,928
Net assets attributable to holders of redeemable units 193,152,717 196,583,237
NET ASSETS ATTRIBUTABLE TO HOLDERS OF REDEEMABLEUNITS PER SERIES
Pinnacle Series 185,398,154 188,236,198Series F 782,799 854,641Series I 6,971,764 7,492,398
NET ASSETS ATTRIBUTABLE TO HOLDERS OF REDEEMABLEUNITS PER UNIT
Pinnacle Series 23.07 23.22Series F 22.75 23.02Series I 23.67 23.73
STATEMENTS OF COMPREHENSIVE INCOMEFor the periods ended June 30 (note 1),(in dollars except average units) 2017 2016
INCOMENet gain (loss) on investments
Dividends 2,805,999 2,702,628Interest for distribution purposes 12,498 11,793Net realized gain (loss) on non-derivative financial assets 7,434,451 (103,852)Change in unrealized gain (loss) on non-derivative financial
assets (11,243,380) 14,004,611
Net gain (loss) on investments (990,432) 16,615,180Securities lending (note 11) 10,825 34,404Other income 827 264
Total income (loss), net (978,780) 16,649,848
EXPENSESManagement fees (note 5) 4,041 3,287Fixed administration fees (note 6) 141,225 117,760Independent Review Committee fees 576 562Interest expense and bank overdraft charges 1,209 1,963Foreign withholding taxes/tax reclaims 2,533 2,087Other fund costs – 30Harmonized Sales Tax/Goods and Services Tax 13,916 11,789Transaction costs 93,438 82,414
Total expenses 256,938 219,892
Increase (decrease) in net assets attributable to holders ofredeemable units from operations (1,235,718) 16,429,956
INCREASE (DECREASE) IN NET ASSETS ATTRIBUTABLE TOHOLDERS OF REDEEMABLE UNITS FROM OPERATIONS PERSERIES
Pinnacle Series (1,222,793) 15,570,836Series F (8,491) 62,831Series I (4,434) 796,289
INCREASE (DECREASE) IN NET ASSETS ATTRIBUTABLE TOHOLDERS OF REDEEMABLE UNITS FROM OPERATIONS PERUNIT†
Pinnacle Series (0.15) 1.97Series F (0.24) 1.84Series I (0.01) 1.83
WEIGHTED AVERAGE NUMBER OF UNITS PER SERIESPinnacle Series 7,901,146 7,918,853Series F 34,814 34,212Series I 302,750 434,829
† The increase (decrease) in net assets attributable to holders of redeemable units fromoperations per unit is calculated by dividing the increase (decrease) in net assetsattributable to holders of redeemable units from operations per series by the weightedaverage number of units per series.
The accompanying notes are an integral part of the financial statements. Portfolio Adviser: Scheer, Rowlett & Associates Investment Management Ltd.
CA
NA
DIA
NE
QU
ITY
FUN
DS
35

Scotia Private Canadian Value Pool (Unaudited – Continued)
STATEMENTS OF CHANGES IN NET ASSETSATTRIBUTABLE TO HOLDERS OF REDEEMABLEUNITSFor the periods ended June 30 (note 1),(in dollars) 2017 2016
NET ASSETS ATTRIBUTABLE TO HOLDERS OF REDEEMABLEUNITS, BEGINNING OF PERIOD
Pinnacle Series 188,236,198 147,175,167Series F 854,641 650,154Series I 7,492,398 10,041,665
196,583,237 157,866,986
INCREASE (DECREASE) IN NET ASSETS ATTRIBUTABLE TOHOLDERS OF REDEEMABLE UNITS FROM OPERATIONS
Pinnacle Series (1,222,793) 15,570,836Series F (8,491) 62,831Series I (4,434) 796,289
(1,235,718) 16,429,956
REDEEMABLE UNIT TRANSACTIONSProceeds from issue
Pinnacle Series 21,834,126 27,579,165Series F 31,779 101,137Series I 17,500 87,900
Payments on redemptionPinnacle Series (23,449,377) (28,536,355)Series F (95,130) (120,483)Series I (533,700) (2,727,150)
(2,194,802) (3,615,786)
INCREASE (DECREASE) IN NET ASSETS ATTRIBUTABLE TOHOLDERS OF REDEEMABLE UNITS
Pinnacle Series (2,838,044) 14,613,646Series F (71,842) 43,485Series I (520,634) (1,842,961)
(3,430,520) 12,814,170
NET ASSETS ATTRIBUTABLE TO HOLDERS OF REDEEMABLEUNITS, END OF PERIOD
Pinnacle Series 185,398,154 161,788,813Series F 782,799 693,639Series I 6,971,764 8,198,704
193,152,717 170,681,156
STATEMENTS OF CASH FLOWSFor the periods ended June 30 (note 1),(in dollars) 2017 2016
CASH FLOWS FROM OPERATING ACTIVITIESIncrease (decrease) in net assets attributable to holders of
redeemable units (1,235,718) 16,429,956Adjustments for:
Net realized (gain) loss on non-derivative financial assets (7,434,451) 103,852Change in unrealized (gain) loss on non-derivative
financial assets 11,243,380 (14,004,611)Purchases of portfolio investments (61,458,755) (75,582,815)Proceeds from sale of portfolio investments 60,786,213 77,022,808Accrued investment income and other (33,258) (12,083)Accrued expenses and other payables 26,021 22,708
Net cash provided by (used in) operating activities 1,893,432 3,979,815
CASH FLOWS FROM FINANCING ACTIVITIESProceeds from issue of redeemable units 21,720,637 27,457,724Amounts paid on redemption of redeemable units (23,522,870) (31,256,415)
Net cash provided by (used in) financing activities (1,802,233) (3,798,691)Net increase (decrease) in cash 91,199 181,124Cash (bank overdraft), beginning of period 49,354 24,516
CASH (BANK OVERDRAFT), END OF PERIOD 140,553 205,640
Interest paid(1) 1,209 1,963Interest received(1) 12,496 11,793Dividends received, net of withholding taxes(1) 2,770,211 2,688,458
(1) Classified as operating items.
The accompanying notes are an integral part of the financial statements. Portfolio Adviser: Scheer, Rowlett & Associates Investment Management Ltd.
CA
NA
DIA
NE
QU
ITY
FUN
DS
36

Scotia Private Canadian Value Pool (Unaudited – Continued)
SCHEDULE OF INVESTMENT PORTFOLIOAs at June 30, 2017
Issuer
Number ofShares/
Number ofUnits
AverageCost ($)
CarryingValue ($)
EQUITIES – 98.8%Consumer Discretionary – 6.4%Gildan Activewear Inc. 111,900 3,134,223 4,459,215Magna International Inc. 132,800 6,101,640 7,977,296
9,235,863 12,436,511
Energy – 17.1%Cameco Corporation 141,000 1,817,461 1,665,210Canadian Natural Resources Ltd. 175,100 5,636,843 6,552,242Cenovus Energy Inc. 423,400 8,858,761 4,047,702Enbridge Inc. 36,800 1,946,867 1,901,088Suncor Energy, Inc. 224,214 7,046,881 8,495,468TransCanada Corporation 143,000 7,531,665 8,840,260Trican Well Service Ltd. 96,560 379,481 350,513Trinidad Drilling Ltd. 617,000 1,784,271 1,203,150
35,002,230 33,055,633
Financials – 42.8%Bank of Montreal 55,000 5,252,327 5,237,100Bank of Nova Scotia, The 112,100 5,887,736 8,744,921Canadian Imperial Bank of Commerce 100,600 8,102,031 10,602,234CI Financial Corporation 103,500 3,107,662 2,860,740ECN Capital Corporation 422,700 1,394,832 1,690,800Element Financial Corporation 280,500 3,507,978 2,496,450Manulife Financial Corporation 407,880 8,416,598 9,915,563National Bank of Canada 43,200 1,902,552 2,355,696Power Corporation of Canada 152,800 4,653,299 4,519,824Royal Bank of Canada 191,000 12,808,021 17,984,560Toronto-Dominion Bank, The 249,200 11,282,952 16,285,220
66,315,988 82,693,108
Index Based Exchange-Traded Funds – 0.5%iShares S&P/TSX 60 Index ETF 42,300 921,353 948,789
Industrials – 10.6%Canadian National Railway Company 89,700 5,069,204 9,438,234Canadian Pacific Railway Limited 27,800 5,056,544 5,800,470WestJet Airlines Ltd. 222,100 4,893,657 5,141,615
15,019,405 20,380,319
Materials – 14.9%Agrium Inc. 57,400 6,043,578 6,746,222Barrick Gold Corporation 161,000 4,454,598 3,321,430Dominion Diamond Corporation 97,700 1,306,863 1,594,464Domtar Corporation 16,000 738,952 797,440Goldcorp, Inc. 346,600 6,734,726 5,795,152Lundin Mining Corporation 279,000 1,379,878 2,056,230Major Drilling Group International Inc. 276,500 1,996,910 2,347,485Methanex Corporation 71,500 3,177,783 4,093,375Sherritt International Corporation 1,125,100 2,678,412 866,327Teck Resources Ltd., Class B 48,000 1,225,694 1,079,040
29,737,394 28,697,165
Telecommunication Services – 5.2%BCE Inc. 22,300 1,013,871 1,302,320Rogers Communications, Inc., Class B 76,200 3,276,900 4,667,250TELUS Corporation 92,900 2,901,837 4,159,133
7,192,608 10,128,703
Utilities – 1.3%TransAlta Corporation 311,100 2,121,153 2,579,019
TOTAL EQUITIES 165,545,994 190,919,247
IssuerFace
Value ($)AverageCost ($)
CarryingValue ($)
MONEY MARKET INSTRUMENTS – 1.4%Treasury Bills – 1.4%Government of Canada 0.00% Aug 24, 2017 2,200,000 2,197,544 2,198,242Government of Canada 0.00% Jul 13, 2017 450,000 449,786 449,933
2,647,330 2,648,175
Transaction Costs (196,130)
TOTAL INVESTMENT PORTFOLIO 167,997,194 193,567,422
OTHER ASSETS, LESS LIABILITIES – (0.2%) (414,705)
NET ASSETS – 100.0% 193,152,717
Instruments with a 0.00% stated interest rate are purchased at a discount to face value. Thediscount represents the implied effective interest.
The accompanying notes are an integral part of the financial statements. Portfolio Adviser: Scheer, Rowlett & Associates Investment Management Ltd.
CA
NA
DIA
NE
QU
ITY
FUN
DS
37

Scotia Private Canadian Value Pool (Unaudited – Continued)
FUND SPECIFIC NOTESFor the periods indicated in Note 1
The Fund (note 1)
The Fund’s investment objective is to achieve superior long termreturns through capital growth by investing primarily in securities ofCanadian corporations.
Risks associated with financial instruments (note 4)
Interest rate risk
The table below summarizes the Fund’s exposure to interest rate riskby the remaining term to maturity of the Fund’s portfolio, excludingunderlying funds, preferred shares, cash and overdrafts, as applicable.
Interest rate exposureJune 30, 2017
($)December 31, 2016
($)
Less than 1 year 2,648,175 2,548,9611-3 years – –3-5 years – –5-10 years – –> 10 years – –
2,648,175 2,548,961
As at June 30, 2017, had the prevailing interest rates increased ordecreased by 0.25%, assuming a parallel shift in the yield curve and allother variables held constant, net assets attributable to holders ofredeemable units would have decreased or increased, respectively, by$869 or approximately 0.0% (December 31, 2016 – $590 orapproximately 0.0%).
Currency risk
The Fund did not have significant currency risk exposure as atJune 30, 2017 or December 31, 2016.
Price risk
Price risk is the risk that the carrying value of financial instrumentswill fluctuate as a result of changes in market prices (other than thosearising from interest rate risk or currency risk) caused by factorsspecific to a security, its issuer or all factors affecting a market or amarket segment. Exposure to price risk is mainly in equities,underlying funds, derivatives and commodities, as applicable. As atJune 30, 2017, approximately 98.8% (December 31, 2016 – 98.2%) ofthe Fund’s net assets were exposed to price risk. If prices of theseinstruments had decreased or increased by 10%, with all othervariables held constant, net assets of the Fund would have decreasedor increased, respectively, by approximately $19,091,925(December 31, 2016 – $19,302,235). In practice, actual results maydiffer from this sensitivity analysis and the difference could bematerial.
Credit risk
The table below summarizes the credit ratings of bonds anddebentures, money market instruments and preferred shares held bythe Fund, as applicable.
June 30, 2017 December 31, 2016
Credit ratings
Percentage oftotal credit
ratedinstruments
(%)
Percentage ofnet assets
(%)
Percentage oftotal credit
ratedinstruments
(%)
Percentage ofnet assets
(%)
Short Term RatingA-1+ 100.0 1.4 100.0 1.3
100.0 1.4 100.0 1.3
Concentration risk
Concentration risk arises as a result of the concentration of exposureswithin the same category, geographical location, asset type or industrysector, as applicable. The table below is a summary of the Fund’sconcentration risk:
Percentage of net assets (%)
June 30, 2017 December 31, 2016
Consumer Discretionary 6.4 6.0Consumer Staples – 1.5Energy 17.1 17.1Financials 42.8 41.6Index Based ETFs 0.5 2.5Industrials 10.6 8.7Information Technology – 0.2Materials 14.9 14.6Real Estate – 0.3Telecommunication Services 5.2 5.0Treasury Bills 1.4 1.3Utilities 1.3 0.9
Fair Value Classification (note 2)
The tables below illustrate the classification of the Fund’s financialinstruments within the fair value hierarchy.
June 30, 2017Level 1
($)Level 2
($)Level 3
($)Total($)
Equities 190,919,247 – – 190,919,247Money market instruments – 2,648,175 – 2,648,175
190,919,247 2,648,175 – 193,567,422
December 31, 2016Level 1
($)Level 2
($)Level 3
($)Total($)
Equities 193,022,350 – – 193,022,350Money market instruments – 2,548,961 – 2,548,961
193,022,350 2,548,961 – 195,571,311
Transfers between levels
During the periods ended June 30, 2017 and December 31, 2016, therewere no significant transfers between Level 1 and Level 2.
The accompanying notes are an integral part of the financial statements.
CA
NA
DIA
NE
QU
ITY
FUN
DS
38

Scotia Private Canadian Value Pool (Unaudited – Continued)
FUND SPECIFIC NOTESFor the periods indicated in Note 1
Offsetting of financial assets and liabilities (note 2)
As at June 30, 2017 and December 31, 2016, the Fund did not enter intoany agreement whereby the financial instruments were eligible foroffset.
Interest in Underlying Funds (note 2)
The following tables present the percentage of the Underlying Fundsowned by the Fund.
June 30, 2017
Underlying Fund
Carrying value ofthe Underlying Fund
($)
Ownership percentagein Underlying Fund
(%)
iShares S&P/TSX 60 Index ETF 948,789 0.0
948,789
December 31, 2016
Underlying Fund
Carrying value ofthe Underlying Fund
($)
Ownership percentagein Underlying Fund
(%)
iShares S&P/TSX 60 Index ETF 4,881,184 0.0
4,881,184
Comparison of net asset value per unit and net assets per unit(note 2)
As at June 30, 2017 or December 31, 2016, there were no differencesbetween the net asset value per unit and the net assets per unit for anyseries of the Fund.
The accompanying notes are an integral part of the financial statements.
CA
NA
DIA
NE
QU
ITY
FUN
DS
39

Scotia Private Canadian Mid Cap Pool (Unaudited)
STATEMENTS OF FINANCIAL POSITIONAs at
(in dollars)June 30,
2017December 31,
2016
ASSETSCurrent assetsInvestments
Non-derivative financial assets 95,594,027 87,708,006Cash 489,212 176,879Subscriptions receivable 258,322 134,575Accrued investment income and other 293,639 119,844
96,635,200 88,139,304
LIABILITIESCurrent liabilitiesManagement fee payable 268 –Payable for securities purchased – 6,322Redemptions payable 203,860 46,513Accrued expenses 19,071 591
223,199 53,426
Net assets attributable to holders of redeemable units 96,412,001 88,085,878
NET ASSETS ATTRIBUTABLE TO HOLDERS OF REDEEMABLEUNITS PER SERIES
Pinnacle Series 80,263,071 76,587,808Series F 266,300 282,570Series I 15,882,630 11,215,500
NET ASSETS ATTRIBUTABLE TO HOLDERS OF REDEEMABLEUNITS PER UNIT
Pinnacle Series 20.79 21.61Series F 20.50 21.41Series I 21.17 22.03
STATEMENTS OF COMPREHENSIVE INCOMEFor the periods ended June 30 (note 1),(in dollars except average units) 2017 2016
INCOMENet gain (loss) on investments
Dividends 826,780 641,320Interest for distribution purposes 86,661 71,246Net realized gain (loss) on non-derivative financial assets 5,283,865 757,951Change in unrealized gain (loss) on non-derivative financial
assets (9,319,375) 7,227,997
Net gain (loss) on investments (3,122,069) 8,698,514Securities lending (note 11) 20,347 17,502Net realized and unrealized foreign currency translation gain (loss) (32,786) 7,070Other income 178 262
Total income (loss), net (3,134,330) 8,723,348
EXPENSESManagement fees (note 5) 1,550 935Fixed administration fees (note 6) 99,199 81,072Independent Review Committee fees 576 563Interest expense and bank overdraft charges – 408Foreign withholding taxes/tax reclaims 2,466 1,094Other fund costs – 13Harmonized Sales Tax/Goods and Services Tax 10,207 8,635Transaction costs 388,724 106,586
Total expenses 502,722 199,306
Increase (decrease) in net assets attributable to holders ofredeemable units from operations (3,637,052) 8,524,042
INCREASE (DECREASE) IN NET ASSETS ATTRIBUTABLE TOHOLDERS OF REDEEMABLE UNITS FROM OPERATIONS PERSERIES
Pinnacle Series (3,058,855) 7,516,479Series F (15,320) 19,558Series I (562,877) 988,005
INCREASE (DECREASE) IN NET ASSETS ATTRIBUTABLE TOHOLDERS OF REDEEMABLE UNITS FROM OPERATIONSPER UNIT†
Pinnacle Series (0.83) 2.21Series F (1.03) 1.96Series I (0.89) 2.06
WEIGHTED AVERAGE NUMBER OF UNITS PER SERIESPinnacle Series 3,697,745 3,395,948Series F 14,866 9,974Series I 634,601 479,158
† The increase (decrease) in net assets attributable to holders of redeemable units fromoperations per unit is calculated by dividing the increase (decrease) in net assetsattributable to holders of redeemable units from operations per series by the weightedaverage number of units per series.
The accompanying notes are an integral part of the financial statements. Portfolio Adviser: Barrantagh Investment Management
CA
NA
DIA
NE
QU
ITY
FUN
DS
40

Scotia Private Canadian Mid Cap Pool (Unaudited – Continued)
STATEMENTS OF CHANGES IN NET ASSETSATTRIBUTABLE TO HOLDERS OF REDEEMABLEUNITSFor the periods ended June 30 (note 1),(in dollars) 2017 2016
NET ASSETS ATTRIBUTABLE TO HOLDERS OF REDEEMABLEUNITS, BEGINNING OF PERIOD
Pinnacle Series 76,587,808 58,914,639Series F 282,570 186,165Series I 11,215,500 9,638,812
88,085,878 68,739,616
INCREASE (DECREASE) IN NET ASSETS ATTRIBUTABLE TOHOLDERS OF REDEEMABLE UNITS FROM OPERATIONS
Pinnacle Series (3,058,855) 7,516,479Series F (15,320) 19,558Series I (562,877) 988,005
(3,637,052) 8,524,042
REDEEMABLE UNIT TRANSACTIONSProceeds from issue
Pinnacle Series 12,314,553 15,807,764Series F 86,260 80,465Series I 5,452,957 1,005,875
Payments on redemptionPinnacle Series (5,580,435) (10,339,785)Series F (87,210) (51,218)Series I (222,950) (1,924,250)
11,963,175 4,578,851
INCREASE (DECREASE) IN NET ASSETS ATTRIBUTABLE TOHOLDERS OF REDEEMABLE UNITS
Pinnacle Series 3,675,263 12,984,458Series F (16,270) 48,805Series I 4,667,130 69,630
8,326,123 13,102,893
NET ASSETS ATTRIBUTABLE TO HOLDERS OF REDEEMABLEUNITS, END OF PERIOD
Pinnacle Series 80,263,071 71,899,097Series F 266,300 234,970Series I 15,882,630 9,708,442
96,412,001 81,842,509
STATEMENTS OF CASH FLOWSFor the periods ended June 30 (note 1),(in dollars) 2017 2016
CASH FLOWS FROM OPERATING ACTIVITIESIncrease (decrease) in net assets attributable to holders of
redeemable units (3,637,052) 8,524,042Adjustments for:
Net realized (gain) loss on non-derivative financial assets (5,283,865) (757,951)Unrealized foreign currency translation (gain) loss – (19,447)Change in unrealized (gain) loss on non-derivative
financial assets 9,319,375 (7,227,997)Purchases of portfolio investments (127,828,525) (57,712,813)Proceeds from sale of portfolio investments 115,900,671 52,681,245Accrued investment income and other (173,795) 34,047Accrued expenses and other payables 18,748 16,193
Net cash provided by (used in) operating activities (11,684,443) (4,462,681)
CASH FLOWS FROM FINANCING ACTIVITIESProceeds from issue of redeemable units 17,730,024 16,715,838Amounts paid on redemption of redeemable units (5,733,248) (12,257,510)
Net cash provided by (used in) financing activities 11,996,776 4,458,328Unrealized foreign currency translation gain (loss) – 19,447Net increase (decrease) in cash 312,333 (4,353)Cash (bank overdraft), beginning of period 176,879 64,234
CASH (BANK OVERDRAFT), END OF PERIOD 489,212 79,328
Interest paid(1) – 408Interest received(1) 84,883 71,140Dividends received, net of withholding taxes(1) 652,297 674,379
(1) Classified as operating items.
The accompanying notes are an integral part of the financial statements. Portfolio Adviser: Barrantagh Investment Management
CA
NA
DIA
NE
QU
ITY
FUN
DS
41

Scotia Private Canadian Mid Cap Pool (Unaudited – Continued)
SCHEDULE OF INVESTMENT PORTFOLIOAs at June 30, 2017
IssuerNumber of
SharesAverageCost ($)
CarryingValue ($)
EQUITIES – 96.8%Consumer Discretionary – 6.5%EnerCare Inc. 197,415 3,805,865 3,893,024Gildan Activewear Inc. 60,480 2,436,564 2,410,128
6,242,429 6,303,152
Consumer Staples – 5.5%Clearwater Seafoods Inc. 206,810 2,421,413 2,361,770Cott Corporation 155,575 2,383,461 2,913,920
4,804,874 5,275,690
Energy – 27.2%CES Energy Solutions Corporation 450,200 2,902,394 2,602,156Freehold Royalties Ltd. 257,000 3,351,049 3,353,850Gibson Energy Inc. 160,070 2,903,638 2,682,773Keyera Corporation 80,885 3,282,175 3,301,726Parkland Fuel Corporation 93,490 2,883,886 2,777,588Secure Energy Services Inc. 364,195 3,349,509 3,223,126STEP Energy Services Ltd. 41,900 413,606 370,815Tidewater Midstream and Infrastructure Ltd. 1,779,500 2,411,678 2,331,145Vermilion Energy, Inc. 78,855 3,376,342 3,244,095Whitecap Resources Inc. 251,160 2,421,024 2,325,742
27,295,301 26,213,016
Financials – 13.0%Brookfield Asset Management Inc., Class A 56,315 2,893,662 2,865,870Industrial Alliance Insurance and Financial ServicesInc. 66,525 3,295,037 3,742,697Intact Financial Corporation 35,495 3,169,784 3,477,090Toronto-Dominion Bank, The 37,110 2,409,077 2,425,138
11,767,560 12,510,795
Industrials – 18.3%Badger Daylighting Ltd. 101,430 2,431,287 2,700,067Boyd Group Income Fund 23,975 2,052,523 2,305,196Cargojet Inc. 52,690 2,384,624 2,503,302Morneau Shepell, Inc. 158,115 3,375,434 3,295,117New Flyer Industries Inc. 59,706 2,692,134 3,238,453Savaria Corporation, Restricted 6,400 88,578 102,432Stantec Inc. 106,510 3,382,552 3,477,552
16,407,132 17,622,119
Information Technology – 3.3%Open Text Corporation 76,600 2,701,012 3,135,238
Materials – 8.8%CCL Industries Inc., Class B 29,950 1,276,784 1,965,020Chemtrade Logistics Income Fund 163,060 2,858,442 2,966,061Intertape Polymer Group Inc. 143,775 3,415,319 3,549,803
7,550,545 8,480,884
Real Estate – 6.4%Canadian Apartment Properties Real EstateInvestment Trust 85,775 2,907,945 2,879,467Pure Industrial Real Estate Trust 485,100 3,338,908 3,337,488
6,246,853 6,216,955
Telecommunication Services – 2.4%BCE Inc. 39,300 2,389,220 2,295,120
Utilities – 5.4%Algonquin Power & Utilities Corporation 204,600 2,932,409 2,792,790Boralex Inc. 109,040 2,216,352 2,394,518
5,148,761 5,187,308
TOTAL EQUITIES 90,553,687 93,240,277
IssuerFace
Value ($)AverageCost ($)
CarryingValue ($)
MONEY MARKET INSTRUMENTS – 2.4%Treasury Bills – 2.4%Government of Canada 0.00% Aug 10, 2017 2,255,000 2,253,025 2,253,768Government of Canada 0.00% Jul 13, 2017 100,000 99,873 99,982
2,352,898 2,353,750
Transaction Costs (129,636)
TOTAL INVESTMENT PORTFOLIO 92,776,949 95,594,027
OTHER ASSETS, LESS LIABILITIES – 0.8% 817,974
NET ASSETS – 100.0% 96,412,001
The accompanying notes are an integral part of the financial statements. Portfolio Adviser: Barrantagh Investment Management
CA
NA
DIA
NE
QU
ITY
FUN
DS
42
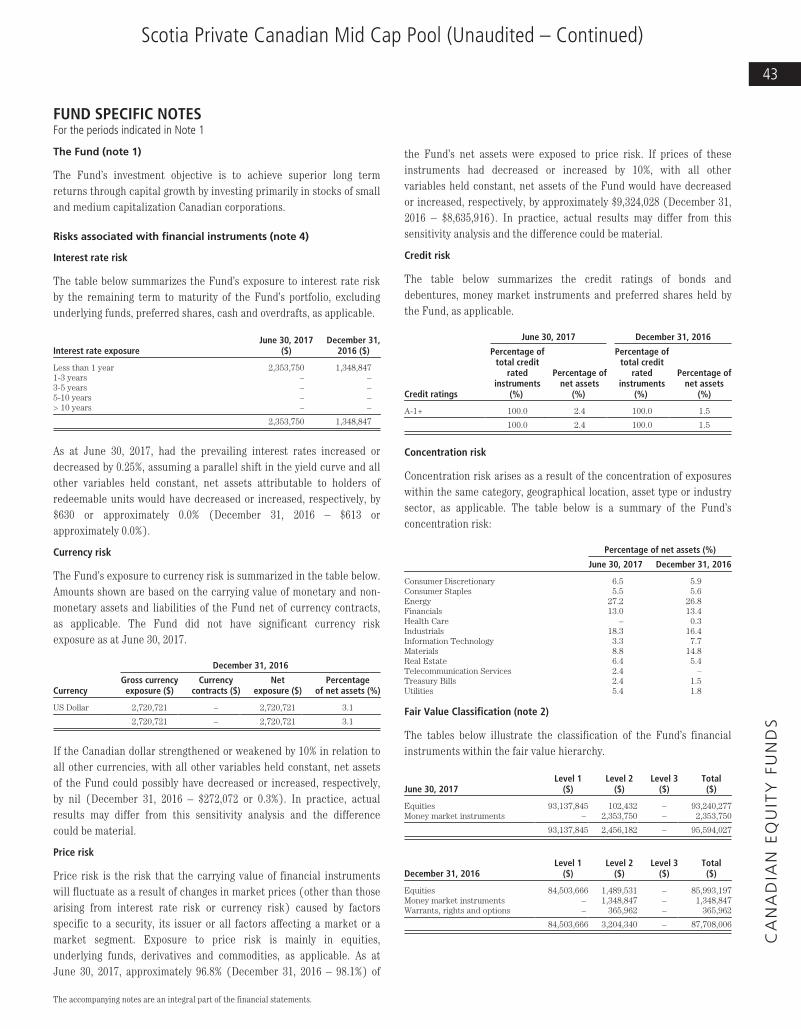
Scotia Private Canadian Mid Cap Pool (Unaudited – Continued)
FUND SPECIFIC NOTESFor the periods indicated in Note 1
The Fund (note 1)
The Fund’s investment objective is to achieve superior long termreturns through capital growth by investing primarily in stocks of smalland medium capitalization Canadian corporations.
Risks associated with financial instruments (note 4)
Interest rate risk
The table below summarizes the Fund’s exposure to interest rate riskby the remaining term to maturity of the Fund’s portfolio, excludingunderlying funds, preferred shares, cash and overdrafts, as applicable.
Interest rate exposureJune 30, 2017
($)December 31,
2016 ($)
Less than 1 year 2,353,750 1,348,8471-3 years – –3-5 years – –5-10 years – –> 10 years – –
2,353,750 1,348,847
As at June 30, 2017, had the prevailing interest rates increased ordecreased by 0.25%, assuming a parallel shift in the yield curve and allother variables held constant, net assets attributable to holders ofredeemable units would have decreased or increased, respectively, by$630 or approximately 0.0% (December 31, 2016 – $613 orapproximately 0.0%).
Currency risk
The Fund’s exposure to currency risk is summarized in the table below.Amounts shown are based on the carrying value of monetary and non-monetary assets and liabilities of the Fund net of currency contracts,as applicable. The Fund did not have significant currency riskexposure as at June 30, 2017.
December 31, 2016
CurrencyGross currencyexposure ($)
Currencycontracts ($)
Netexposure ($)
Percentageof net assets (%)
US Dollar 2,720,721 – 2,720,721 3.1
2,720,721 – 2,720,721 3.1
If the Canadian dollar strengthened or weakened by 10% in relation toall other currencies, with all other variables held constant, net assetsof the Fund could possibly have decreased or increased, respectively,by nil (December 31, 2016 – $272,072 or 0.3%). In practice, actualresults may differ from this sensitivity analysis and the differencecould be material.
Price risk
Price risk is the risk that the carrying value of financial instrumentswill fluctuate as a result of changes in market prices (other than thosearising from interest rate risk or currency risk) caused by factorsspecific to a security, its issuer or all factors affecting a market or amarket segment. Exposure to price risk is mainly in equities,underlying funds, derivatives and commodities, as applicable. As atJune 30, 2017, approximately 96.8% (December 31, 2016 – 98.1%) of
the Fund’s net assets were exposed to price risk. If prices of theseinstruments had decreased or increased by 10%, with all othervariables held constant, net assets of the Fund would have decreasedor increased, respectively, by approximately $9,324,028 (December 31,2016 – $8,635,916). In practice, actual results may differ from thissensitivity analysis and the difference could be material.
Credit risk
The table below summarizes the credit ratings of bonds anddebentures, money market instruments and preferred shares held bythe Fund, as applicable.
June 30, 2017 December 31, 2016
Credit ratings
Percentage oftotal credit
ratedinstruments
(%)
Percentage ofnet assets
(%)
Percentage oftotal credit
ratedinstruments
(%)
Percentage ofnet assets
(%)
A-1+ 100.0 2.4 100.0 1.5
100.0 2.4 100.0 1.5
Concentration risk
Concentration risk arises as a result of the concentration of exposureswithin the same category, geographical location, asset type or industrysector, as applicable. The table below is a summary of the Fund’sconcentration risk:
Percentage of net assets (%)
June 30, 2017 December 31, 2016
Consumer Discretionary 6.5 5.9Consumer Staples 5.5 5.6Energy 27.2 26.8Financials 13.0 13.4Health Care – 0.3Industrials 18.3 16.4Information Technology 3.3 7.7Materials 8.8 14.8Real Estate 6.4 5.4Telecommunication Services 2.4 –Treasury Bills 2.4 1.5Utilities 5.4 1.8
Fair Value Classification (note 2)
The tables below illustrate the classification of the Fund’s financialinstruments within the fair value hierarchy.
June 30, 2017Level 1
($)Level 2
($)Level 3
($)Total($)
Equities 93,137,845 102,432 – 93,240,277Money market instruments – 2,353,750 – 2,353,750
93,137,845 2,456,182 – 95,594,027
December 31, 2016Level 1
($)Level 2
($)Level 3
($)Total($)
Equities 84,503,666 1,489,531 – 85,993,197Money market instruments – 1,348,847 – 1,348,847Warrants, rights and options – 365,962 – 365,962
84,503,666 3,204,340 – 87,708,006
The accompanying notes are an integral part of the financial statements.
CA
NA
DIA
NE
QU
ITY
FUN
DS
43
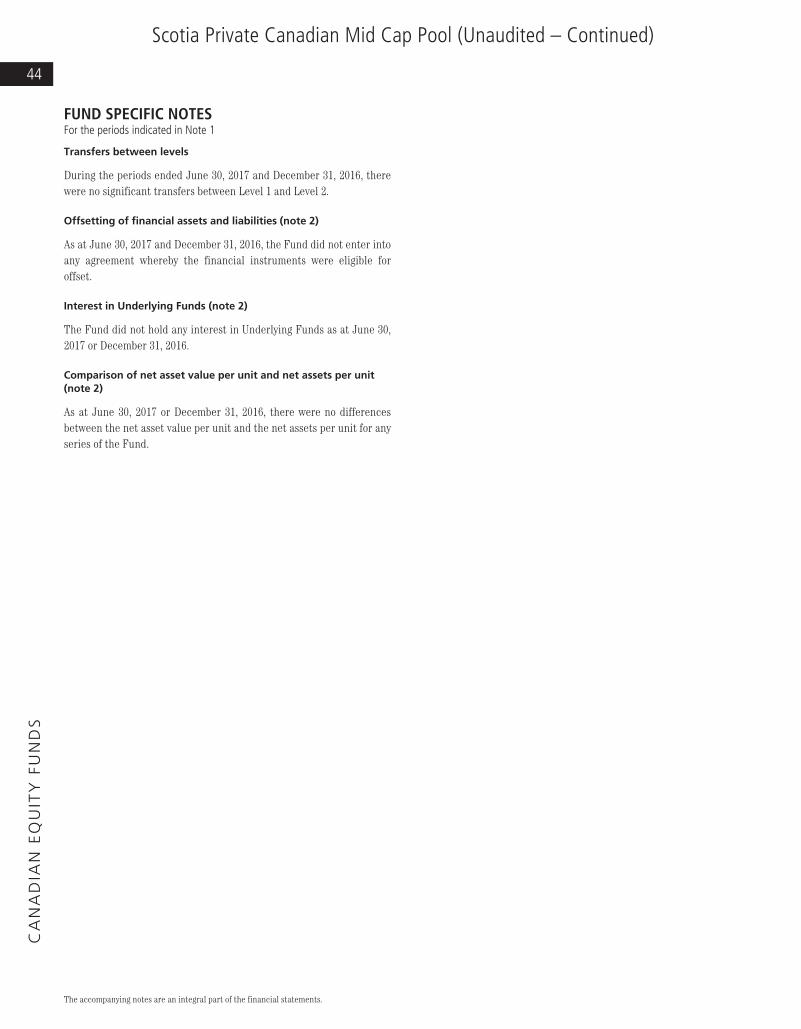
Scotia Private Canadian Mid Cap Pool (Unaudited – Continued)
FUND SPECIFIC NOTESFor the periods indicated in Note 1
Transfers between levels
During the periods ended June 30, 2017 and December 31, 2016, therewere no significant transfers between Level 1 and Level 2.
Offsetting of financial assets and liabilities (note 2)
As at June 30, 2017 and December 31, 2016, the Fund did not enter intoany agreement whereby the financial instruments were eligible foroffset.
Interest in Underlying Funds (note 2)
The Fund did not hold any interest in Underlying Funds as at June 30,2017 or December 31, 2016.
Comparison of net asset value per unit and net assets per unit(note 2)
As at June 30, 2017 or December 31, 2016, there were no differencesbetween the net asset value per unit and the net assets per unit for anyseries of the Fund.
The accompanying notes are an integral part of the financial statements.
CA
NA
DIA
NE
QU
ITY
FUN
DS
44

Scotia Private Canadian Growth Pool (Unaudited)
STATEMENTS OF FINANCIAL POSITIONAs at
(in dollars)June 30,
2017December 31,
2016
ASSETSCurrent assetsInvestments
Non-derivative financial assets 216,189,663 209,497,110Cash 11,315 36,865Subscriptions receivable 483,274 344,254Accrued investment income and other 385,507 261,206
217,069,759 210,139,435
LIABILITIESCurrent liabilitiesManagement fee payable 709 –Payable for securities purchased – 546,156Redemptions payable 649,632 64,977Accrued expenses 29,255 936
679,596 612,069
Net assets attributable to holders of redeemable units 216,390,163 209,527,366
NET ASSETS ATTRIBUTABLE TO HOLDERS OF REDEEMABLEUNITS PER SERIES
Pinnacle Series 206,347,050 198,725,944Series F 784,001 793,118Series I 9,259,112 10,008,304
NET ASSETS ATTRIBUTABLE TO HOLDERS OF REDEEMABLEUNITS PER UNIT
Pinnacle Series 16.47 16.62Series F 16.50 16.75Series I 16.72 16.86
STATEMENTS OF COMPREHENSIVE INCOMEFor the periods ended June 30 (note 1),(in dollars except average units) 2017 2016
INCOMENet gain (loss) on investmentsDividends 2,404,730 1,958,797
Interest for distribution purposes 2,029 3,294Net realized gain (loss) on non-derivative financial assets 8,832,921 1,227,782Change in unrealized gain (loss) on non-derivative
financial assets (13,077,196) 4,737,437
Net gain (loss) on investments (1,837,516) 7,927,310Securities lending (note 11) 2,300 9,658Net realized and unrealized foreign currency translation gain
(loss) (15) (390)Other income 1,070 688
Total income (loss), net (1,834,161) 7,937,266
EXPENSESManagement fees (note 5) 3,982 3,260Fixed administration fees (note 6) 154,353 124,774Independent Review Committee fees 576 563Interest expense and bank overdraft charges – 307Other fund costs – 32Harmonized Sales Tax/Goods and Services Tax 15,715 13,099Transaction costs 56,196 90,962
Total expenses 230,822 232,997
Increase (decrease) in net assets attributable to holders ofredeemable units from operations (2,064,983) 7,704,269
INCREASE (DECREASE) IN NET ASSETS ATTRIBUTABLE TOHOLDERS OF REDEEMABLE UNITS FROM OPERATIONSPER SERIES
Pinnacle Series (1,978,410) 7,183,515Series F (11,681) 12,223Series I (74,892) 508,531
INCREASE (DECREASE) IN NET ASSETS ATTRIBUTABLE TOHOLDERS OF REDEEMABLE UNITS FROM OPERATIONSPER UNIT†
Pinnacle Series (0.16) 0.64Series F (0.24) 0.27Series I (0.13) 0.67
WEIGHTED AVERAGE NUMBER OF UNITS PER SERIESPinnacle Series 12,208,518 11,219,882Series F 47,712 44,690Series I 576,783 759,983
† The increase (decrease) in net assets attributable to holders of redeemable units fromoperations per unit is calculated by dividing the increase (decrease) in net assetsattributable to holders of redeemable units from operations per series by the weightedaverage number of units per series.
The accompanying notes are an integral part of the financial statements. Portfolio Adviser: Manulife Asset Management
CA
NA
DIA
NE
QU
ITY
FUN
DS
45

Scotia Private Canadian Growth Pool (Unaudited – Continued)
STATEMENTS OF CHANGES IN NET ASSETSATTRIBUTABLE TO HOLDERS OF REDEEMABLEUNITSFor the periods ended June 30 (note 1),(in dollars) 2017 2016
NET ASSETS ATTRIBUTABLE TO HOLDERS OF REDEEMABLEUNITS, BEGINNING OF PERIOD
Pinnacle Series 198,725,944 147,021,366Series F 793,118 736,020Series I 10,008,304 10,736,190
209,527,366 158,493,576
INCREASE (DECREASE) IN NET ASSETS ATTRIBUTABLE TOHOLDERS OF REDEEMABLE UNITS FROM OPERATIONS
Pinnacle Series (1,978,410) 7,183,515Series F (11,681) 12,223Series I (74,892) 508,531
(2,064,983) 7,704,269
REDEEMABLE UNIT TRANSACTIONSProceeds from issue
Pinnacle Series 25,015,330 41,787,985Series F 48,841 103,964Series I 106,600 1,820,900
Payments on redemptionPinnacle Series (15,415,814) (20,828,678)Series F (46,277) (166,486)Series I (780,900) (2,157,900)
8,927,780 20,559,785
INCREASE (DECREASE) IN NET ASSETS ATTRIBUTABLE TOHOLDERS OF REDEEMABLE UNITS
Pinnacle Series 7,621,106 28,142,822Series F (9,117) (50,299)Series I (749,192) 171,531
6,862,797 28,264,054
NET ASSETS ATTRIBUTABLE TO HOLDERS OF REDEEMABLEUNITS, END OF PERIOD
Pinnacle Series 206,347,050 175,164,188Series F 784,001 685,721Series I 9,259,112 10,907,721
216,390,163 186,757,630
STATEMENTS OF CASH FLOWSFor the periods ended June 30 (note 1),(in dollars) 2017 2016
CASH FLOWS FROM OPERATING ACTIVITIESIncrease (decrease) in net assets attributable to holders of
redeemable units (2,064,983) 7,704,269Adjustments for:
Net realized (gain) loss on non-derivative financialassets (8,832,921) (1,227,782)
Unrealized foreign currency translation (gain) loss – 37Change in unrealized (gain) loss on non-derivative
financial assets 13,077,196 (4,737,437)Non-cash transactions (21,864) (93,186)Purchases of portfolio investments (407,066,286) (393,326,165)Proceeds from sale of portfolio investments 395,605,166 371,584,732Accrued investment income and other (124,301) (105,211)Accrued expenses and other payables 29,028 24,588
Net cash provided by (used in) operating activities (9,398,965) (20,176,155)CASH FLOWS FROM FINANCING ACTIVITIESProceeds from issue of redeemable units 25,031,751 43,262,139Amounts paid on redemption of redeemable units (15,658,336) (23,048,409)
Net cash provided by (used in) financing activities 9,373,415 20,213,730Unrealized foreign currency translation gain (loss) – (37)Net increase (decrease) in cash (25,550) 37,575Cash (bank overdraft), beginning of period 36,865 20,426
CASH (BANK OVERDRAFT), END OF PERIOD 11,315 57,964
Interest paid(1) – 307Interest received(1) 1,984 3,396Dividends received, net of withholding taxes(1) 2,258,610 1,853,485
(1) Classified as operating items.
The accompanying notes are an integral part of the financial statements. Portfolio Adviser: Manulife Asset Management
CA
NA
DIA
NE
QU
ITY
FUN
DS
46

Scotia Private Canadian Growth Pool (Unaudited – Continued)
SCHEDULE OF INVESTMENT PORTFOLIOAs at June 30, 2017
IssuerNumber of
SharesAverageCost ($)
CarryingValue ($)
EQUITIES – 96.9%Consumer Discretionary – 8.5%Aritzia Inc., Subordinated Voting 109,210 1,789,451 1,640,334Dollarama Inc. 33,250 1,568,231 4,120,008Gildan Activewear Inc. 90,510 2,744,702 3,606,824Magna International Inc. 37,920 1,599,597 2,277,854Restaurant Brands International Inc. 66,320 3,190,667 5,381,205Spin Master Corporation 37,240 1,450,587 1,441,188
12,343,235 18,467,413
Consumer Staples – 5.7%Alimentation Couche-Tard Inc., Class B 96,260 3,234,920 5,983,522Loblaw Companies Limited 30,770 1,787,016 2,219,748Saputo Inc. 102,660 3,401,632 4,234,725
8,423,568 12,437,995
Energy – 20.1%Canadian Natural Resources Ltd. 267,540 9,549,157 10,011,347Cenovus Energy Inc. 317,870 5,324,160 3,038,837Crescent Point Energy Corporation 148,680 2,788,520 1,474,906Enbridge Inc. 197,050 11,219,976 10,179,603Peyto Exploration & Development Corporation 79,350 2,620,196 1,866,312Seven Generations Energy Ltd. 144,950 2,727,650 3,219,340Suncor Energy, Inc. 282,170 10,689,326 10,691,421Whitecap Resources Inc. 336,410 3,585,591 3,115,157
48,504,576 43,596,923
Financials – 34.8%Bank of Nova Scotia, The 188,870 11,651,824 14,733,749Brookfield Asset Management Inc., Class A 155,860 5,604,724 7,931,715Canadian Imperial Bank of Commerce 60,840 6,465,427 6,411,928Chartwell Seniors Housing Real Estate InvestmentTrust 111,840 1,717,106 1,732,402Intact Financial Corporation 34,410 2,383,587 3,370,804Royal Bank of Canada 196,020 14,634,599 18,457,243Sun Life Financial Inc. 123,040 5,054,215 5,704,134Toronto-Dominion Bank, The 259,030 12,850,353 16,927,610
60,361,835 75,269,585
Industrials – 10.3%Canadian National Railway Company 111,100 6,678,407 11,689,942Canadian Pacific Railway Limited 37,960 7,518,288 7,920,354WestJet Airlines Ltd. 118,230 2,619,995 2,737,025
16,816,690 22,347,321
Information Technology – 7.6%CGI Group Inc., Class A 66,870 2,515,529 4,430,806Constellation Software Inc. 4,700 1,296,282 3,188,527Descartes Systems Group Inc., The 75,650 1,402,108 2,386,758Open Text Corporation 48,270 2,195,739 1,975,691Shopify Inc., Class A 39,070 1,430,510 4,399,282
8,840,168 16,381,064
Materials – 9.9%Agnico-Eagle Mines Limited 25,230 1,334,335 1,475,450Barrick Gold Corporation 129,460 2,663,716 2,670,760CCL Industries Inc., Class B 77,730 2,916,629 5,099,865First Quantum Minerals Ltd. 130,830 2,174,132 1,435,205Franco-Nevada Corporation 23,220 1,313,651 2,172,695Goldcorp, Inc. 92,020 1,950,209 1,538,574Lundin Mining Corporation 217,530 1,744,143 1,603,196Potash Corporation of Saskatchewan Inc. 86,710 2,138,847 1,833,917Tahoe Resources Inc. 149,180 2,406,074 1,667,832Teck Resources Ltd., Class B 85,130 2,685,958 1,913,722
21,327,694 21,411,216
TOTAL EQUITIES 176,617,766 209,911,517
IssuerFace
Value ($)AverageCost ($)
CarryingValue ($)
MONEY MARKET INSTRUMENTS – 2.9%Commercial Paper – 1.5%Merit Trust 0.65% Jul 04, 2017 3,280,000 3,279,766 3,279,824
Treasury Bills – 1.4%Government of Canada 0.00% Aug 10, 2017 3,000,000 2,995,890 2,998,322
TOTAL MONEY MARKET INSTRUMENTS 6,275,656 6,278,146
Transaction Costs (113,904)
TOTAL INVESTMENT PORTFOLIO 182,779,518 216,189,663
OTHER ASSETS, LESS LIABILITIES – 0.2% 200,500
NET ASSETS – 100.0% 216,390,163
Instruments with a 0.00% stated interest rate are purchased at a discount to face value. Thediscount represents the implied effective interest.
The accompanying notes are an integral part of the financial statements. Portfolio Adviser: Manulife Asset Management
CA
NA
DIA
NE
QU
ITY
FUN
DS
47

Scotia Private Canadian Growth Pool (Unaudited – Continued)
FUND SPECIFIC NOTESFor the periods indicated in Note 1
The Fund (note 1)
The Fund’s investment objective is to achieve superior long termreturns through capital growth by investing primarily in stocks of largeand medium capitalization Canadian corporations.
Risks associated with financial instruments (note 4)
Interest rate risk
The table below summarizes the Fund’s exposure to interest rate riskby the remaining term to maturity of the Fund’s portfolio, excludingunderlying funds, preferred shares, cash and overdrafts, as applicable.
Interest rate exposureJune 30, 2017
($)December 31, 2016
($)
Less than 1 year 6,278,146 4,169,8511-3 years – –3-5 years – –5-10 years – –> 10 years – –
6,278,146 4,169,851
As at June 30, 2017, had the prevailing interest rates increased ordecreased by 0.25%, assuming a parallel shift in the yield curve and allother variables held constant, net assets attributable to holders ofredeemable units would have decreased or increased, respectively, by$825 or approximately 0.0% (December 31, 2016 – nil).
Currency risk
The Fund did not have significant currency risk exposure as atJune 30, 2017 or December 31, 2016.
Price risk
Price risk is the risk that the carrying value of financial instrumentswill fluctuate as a result of changes in market prices (other than thosearising from interest rate risk or currency risk) caused by factorsspecific to a security, its issuer or all factors affecting a market or amarket segment. Exposure to price risk is mainly in equities,underlying funds, derivatives and commodities, as applicable. As atJune 30, 2017, approximately 96.9% (December 31, 2016 – 98.0%) ofthe Fund’s net assets were exposed to price risk. If prices of theseinstruments had decreased or increased by 10%, with all othervariables held constant, net assets of the Fund would have decreasedor increased, respectively, by approximately $20,991,152(December 31, 2016 – $20,532,726). In practice, actual results maydiffer from this sensitivity analysis and the difference could bematerial.
Credit risk
The table below summarizes the credit ratings of bonds anddebentures, money market instruments and preferred shares held bythe Fund, as applicable.
June 30, 2017 December 31, 2016
Credit ratings
Percentage oftotal credit
ratedinstruments
(%)
Percentage ofnet assets
(%)
Percentage oftotal credit
ratedinstruments
(%)
Percentage ofnet assets
(%)
Short Term RatingA-1+ 100.0 2.9 100.0 2.0
100.0 2.9 100.0 2.0
Concentration risk
Concentration risk arises as a result of the concentration ofexposures within the same category, geographical location,asset type or industry sector, as applicable. The table below is asummary of the Fund’s concentration risk:
Percentage of net assets (%)
June 30, 2017 December 31, 2016
Commercial Paper 1.5 2.0Consumer Discretionary 8.5 9.9Consumer Staples 5.7 7.1Energy 20.1 23.4Financials 34.8 33.0Industrials 10.3 9.3Information Technology 7.6 8.2Materials 9.9 7.1Treasury Bills 1.4 –
Fair Value Classification (note 2)
The tables below illustrate the classification of the Fund’s financialinstruments within the fair value hierarchy.
June 30, 2017Level 1
($)Level 2
($)Level 3
($)Total($)
Equities 209,911,517 – – 209,911,517Money market instruments – 6,278,146 – 6,278,146
209,911,517 6,278,146 – 216,189,663
December 31, 2016Level 1
($)Level 2
($)Level 3
($)Total($)
Equities 205,327,259 – – 205,327,259Money market instruments – 4,169,851 – 4,169,851
205,327,259 4,169,851 – 209,497,110
Transfers between levels
During the periods ended June 30, 2017 and December 31, 2016, therewere no significant transfers between Level 1 and Level 2.
Offsetting of financial assets and liabilities (note 2)
As at June 30, 2017 and December 31, 2016, the Fund did not enter intoany agreement whereby the financial instruments were eligible foroffset.
The accompanying notes are an integral part of the financial statements.
CA
NA
DIA
NE
QU
ITY
FUN
DS
48

Scotia Private Canadian Growth Pool (Unaudited – Continued)
FUND SPECIFIC NOTESFor the periods indicated in Note 1
Interest in Underlying Funds (note 2)
The Fund did not hold any interest in Underlying Funds as at June 30,2017 or December 31, 2016.
Comparison of net asset value per unit and net assets per unit(note 2)
As at June 30, 2017 or December 31, 2016, there were no differencesbetween the net asset value per unit and the net assets per unit for anyseries of the Fund.
The accompanying notes are an integral part of the financial statements.
CA
NA
DIA
NE
QU
ITY
FUN
DS
49

Scotia Private Canadian Small Cap Pool (Unaudited)
STATEMENTS OF FINANCIAL POSITIONAs at
(in dollars)June 30,
2017December 31,
2016
ASSETSCurrent assetsInvestments
Non-derivative financial assets 746,650,005 658,631,895Cash 20,356,305 15,391,727Receivable for securities sold 458,894 951,526Subscriptions receivable 268,623 155,018Accrued investment income and other 1,168,021 1,292,859
768,901,848 676,423,025
LIABILITIESCurrent liabilitiesManagement fee payable 31,142 –Payable for securities purchased 2,545,286 69,478Redemptions payable 809,010 66,997Accrued expenses 46,616 1,303Distributions payable – 440
3,432,054 138,218
Net assets attributable to holders of redeemable units 765,469,794 676,284,807
NET ASSETS ATTRIBUTABLE TO HOLDERS OF REDEEMABLEUNITS PER SERIES
Pinnacle Series 109,591,187 104,339,865Series F 3,473,012 2,950,683Series I 590,483,339 568,993,209Series M 61,922,256 1,050
NET ASSETS ATTRIBUTABLE TO HOLDERS OF REDEEMABLEUNITS PER UNIT
Pinnacle Series 38.24 36.70Series F 38.79 37.46Series I 39.54 37.97Series M 10.64 10.24
STATEMENTS OF COMPREHENSIVE INCOMEFor the periods ended June 30 (note 1),(in dollars except average units) 2017 2016
INCOMENet gain (loss) on investments
Dividends 5,993,458 7,676,008Interest for distribution purposes 33,935 66,586Net realized gain (loss) on non-derivative financial assets 11,051,585 8,305,871Change in unrealized gain (loss) on non-derivative
financial assets 12,969,923 (10,530,489)
Net gain (loss) on investments 30,048,901 5,517,976Securities lending (note 11) 101,080 37,651Net realized and unrealized foreign currency translation gain
(loss) (49) –Other income 489 128
Total income (loss), net 30,150,421 5,555,755
EXPENSESManagement fees (note 5) 117,786 5,813Fixed administration fees (note 6) 234,587 168,975Independent Review Committee fees 576 563Other fund costs – 105Harmonized Sales Tax/Goods and Services Tax 35,674 17,628Transaction costs 230,327 378,845
Total expenses 618,950 571,929
Increase (decrease) in net assets attributable to holders ofredeemable units from operations 29,531,471 4,983,826
INCREASE (DECREASE) IN NET ASSETS ATTRIBUTABLE TOHOLDERS OF REDEEMABLE UNITS FROM OPERATIONSPER SERIES
Pinnacle Series 4,389,573 688,111Series F 107,203 (27,489)Series I 23,456,026 4,323,204Series M 1,578,669 –
INCREASE (DECREASE) IN NET ASSETS ATTRIBUTABLE TOHOLDERS OF REDEEMABLE UNITS FROM OPERATIONSPER UNIT†
Pinnacle Series 1.54 0.26Series F 1.33 (0.77)Series I 1.58 0.29Series M 0.40 –
WEIGHTED AVERAGE NUMBER OF UNITS PER SERIESPinnacle Series 2,842,802 2,667,483Series F 80,716 35,637Series I 14,838,075 15,089,676Series M 3,956,533 –
† The increase (decrease) in net assets attributable to holders of redeemable units fromoperations per unit is calculated by dividing the increase (decrease) in net assetsattributable to holders of redeemable units from operations per series by the weightedaverage number of units per series.
The accompanying notes are an integral part of the financial statements. Portfolio Adviser: Van Berkom & Associates Inc.
CA
NA
DIA
NE
QU
ITY
FUN
DS
50
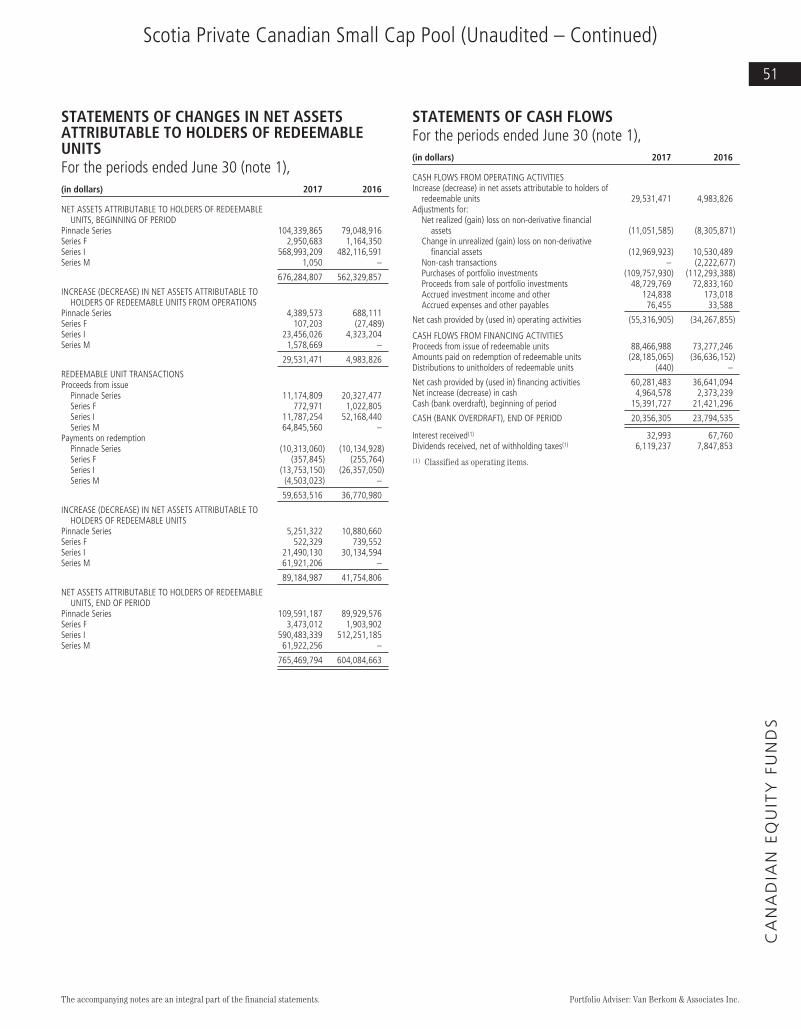
Scotia Private Canadian Small Cap Pool (Unaudited – Continued)
STATEMENTS OF CHANGES IN NET ASSETSATTRIBUTABLE TO HOLDERS OF REDEEMABLEUNITSFor the periods ended June 30 (note 1),(in dollars) 2017 2016
NET ASSETS ATTRIBUTABLE TO HOLDERS OF REDEEMABLEUNITS, BEGINNING OF PERIOD
Pinnacle Series 104,339,865 79,048,916Series F 2,950,683 1,164,350Series I 568,993,209 482,116,591Series M 1,050 –
676,284,807 562,329,857
INCREASE (DECREASE) IN NET ASSETS ATTRIBUTABLE TOHOLDERS OF REDEEMABLE UNITS FROM OPERATIONS
Pinnacle Series 4,389,573 688,111Series F 107,203 (27,489)Series I 23,456,026 4,323,204Series M 1,578,669 –
29,531,471 4,983,826
REDEEMABLE UNIT TRANSACTIONSProceeds from issue
Pinnacle Series 11,174,809 20,327,477Series F 772,971 1,022,805Series I 11,787,254 52,168,440Series M 64,845,560 –
Payments on redemptionPinnacle Series (10,313,060) (10,134,928)Series F (357,845) (255,764)Series I (13,753,150) (26,357,050)Series M (4,503,023) –
59,653,516 36,770,980
INCREASE (DECREASE) IN NET ASSETS ATTRIBUTABLE TOHOLDERS OF REDEEMABLE UNITS
Pinnacle Series 5,251,322 10,880,660Series F 522,329 739,552Series I 21,490,130 30,134,594Series M 61,921,206 –
89,184,987 41,754,806
NET ASSETS ATTRIBUTABLE TO HOLDERS OF REDEEMABLEUNITS, END OF PERIOD
Pinnacle Series 109,591,187 89,929,576Series F 3,473,012 1,903,902Series I 590,483,339 512,251,185Series M 61,922,256 –
765,469,794 604,084,663
STATEMENTS OF CASH FLOWSFor the periods ended June 30 (note 1),(in dollars) 2017 2016
CASH FLOWS FROM OPERATING ACTIVITIESIncrease (decrease) in net assets attributable to holders of
redeemable units 29,531,471 4,983,826Adjustments for:
Net realized (gain) loss on non-derivative financialassets (11,051,585) (8,305,871)
Change in unrealized (gain) loss on non-derivativefinancial assets (12,969,923) 10,530,489
Non-cash transactions – (2,222,677)Purchases of portfolio investments (109,757,930) (112,293,388)Proceeds from sale of portfolio investments 48,729,769 72,833,160Accrued investment income and other 124,838 173,018Accrued expenses and other payables 76,455 33,588
Net cash provided by (used in) operating activities (55,316,905) (34,267,855)
CASH FLOWS FROM FINANCING ACTIVITIESProceeds from issue of redeemable units 88,466,988 73,277,246Amounts paid on redemption of redeemable units (28,185,065) (36,636,152)Distributions to unitholders of redeemable units (440) –
Net cash provided by (used in) financing activities 60,281,483 36,641,094Net increase (decrease) in cash 4,964,578 2,373,239Cash (bank overdraft), beginning of period 15,391,727 21,421,296
CASH (BANK OVERDRAFT), END OF PERIOD 20,356,305 23,794,535
Interest received(1) 32,993 67,760Dividends received, net of withholding taxes(1) 6,119,237 7,847,853
(1) Classified as operating items.
The accompanying notes are an integral part of the financial statements. Portfolio Adviser: Van Berkom & Associates Inc.
CA
NA
DIA
NE
QU
ITY
FUN
DS
51

Scotia Private Canadian Small Cap Pool (Unaudited – Continued)
SCHEDULE OF INVESTMENT PORTFOLIOAs at June 30, 2017
IssuerNumber of
SharesAverageCost ($)
CarryingValue ($)
EQUITIES – 97.7%Consumer Discretionary – 6.1%AutoCanada Inc. 410,486 9,269,927 7,832,073Cara Operations Ltd. 612,689 17,611,608 14,434,953Leon’s Furniture Ltd. 949,693 14,549,242 16,667,112Martinrea International Inc. 710,970 7,805,115 7,529,172Pollard Banknote Ltd. 25,031 250,118 256,568
49,486,010 46,719,878
Consumer Staples – 4.9%Alimentation Couche-Tard Inc., Class B 288,220 9,391,408 17,915,755High Liner Foods Inc. 599,425 10,057,221 10,483,943Lassonde Industries Inc. 36,091 8,777,658 8,859,619
28,226,287 37,259,317
Energy – 20.0%CES Energy Solutions Corporation 2,513,212 10,948,244 14,526,365Enerflex Ltd. 1,556,802 21,397,966 29,299,014Kelt Exploration Ltd. 2,578,210 17,348,738 16,191,159Mullen Group Limited 1,391,934 28,255,149 22,270,944NuVista Energy Ltd. 2,718,041 16,375,492 17,803,169Peyto Exploration & Development Corporation 286,850 8,596,731 6,746,712Secure Energy Services Inc. 1,917,707 15,932,650 16,971,707Trican Well Service Ltd. 4,371,318 16,941,495 15,867,884ZCL Composites Inc. 1,039,499 6,996,127 13,534,277
142,792,592 153,211,231
Financials – 11.4%Canadian Western Bank 1,239,999 31,560,328 33,951,172Equitable Group Inc. 290,610 12,154,857 17,285,483Equity Financial Holdings, Inc. 326,478 3,168,462 2,445,320FirstService Corporation 400,730 8,399,868 33,344,743
55,283,515 87,026,718
Health Care – 2.5%Jamieson Wellness Inc. 49,840 784,980 784,980Knight Therapeutics Inc. 892,316 5,845,121 9,181,932New Look Eyewear Inc. 244,239 6,131,544 7,510,349New Look Vision Group Inc., Subscription Receipts 53,740 1,662,716 1,662,716
14,424,361 19,139,977
Industrials – 25.2%ATS Automation Tooling Systems Inc. 1,795,644 21,627,302 23,864,109Cervus Equipment Corporation 613,013 10,881,366 6,786,054Exactearth Ltd 111,485 438,337 139,356Exco Technologies Ltd. 1,346,050 13,857,493 14,375,814GDI Integrated Facility Services Inc. 695,434 10,524,538 10,786,181Horizon North Logistics Inc. 5,496,181 19,771,613 7,309,921IBI Group Inc. 717,079 4,307,717 4,725,551Logistec Corporation, Class B 61,551 2,247,482 2,141,975MacDonald, Dettwiler and Associates Ltd. 336,727 25,807,903 22,722,338Richelieu Hardware Ltd. 882,818 12,229,934 26,528,681Russel Metals Inc. 327,780 7,077,340 8,509,169Stantec Inc. 432,066 9,044,015 14,106,955Toromont Industries Ltd. 631,564 17,496,366 30,150,865WSP Global Inc. 378,952 11,957,835 20,391,407
167,269,241 192,538,376
Information Technology – 6.5%Absolute Software Corporation 1,688,446 12,311,234 12,967,265Enghouse Systems Limited 559,405 18,882,327 29,396,733Tucows Inc., Class A 106,555 7,159,071 7,403,441
38,352,632 49,767,439
Materials – 17.0%Canam Group Inc., Class A 905,639 10,176,588 11,139,360CCL Industries Inc., Class B 606,223 13,035,126 39,774,291
IssuerNumber of
SharesAverageCost ($)
CarryingValue ($)
EQUITIES (cont'd)Materials (cont'd)Major Drilling Group International Inc. 2,196,584 15,120,342 18,648,998Stella-Jones Inc. 681,332 15,696,356 30,155,754Winpak Ltd. 519,532 12,049,962 30,247,153
66,078,374 129,965,556
Real Estate – 4.1%Colliers International Group Inc. 423,213 12,912,990 31,021,513
Transaction Costs (1,167,364)
TOTAL INVESTMENT PORTFOLIO 573,658,638 746,650,005
OTHER ASSETS, LESS LIABILITIES – 2.3% 18,819,789
NET ASSETS – 100.0% 765,469,794
The accompanying notes are an integral part of the financial statements. Portfolio Adviser: Van Berkom & Associates Inc.
CA
NA
DIA
NE
QU
ITY
FUN
DS
52

Scotia Private Canadian Small Cap Pool (Unaudited – Continued)
FUND SPECIFIC NOTESFor the periods indicated in Note 1
The Fund (note 1)
The Fund’s investment objective is to achieve superior long termreturns through capital growth by investing primarily in stocks of smalland medium capitalization Canadian corporations.
Risks associated with financial instruments (note 4)
Interest rate risk
The majority of the Fund’s financial instruments were non-interestbearing as at June 30, 2017 and December 31, 2016. Accordingly, theFund is not directly subject to significant risk due to fluctuations inthe prevailing levels of market interest rates.
Currency risk
The Fund did not have significant currency risk exposure as atJune 30, 2017 or December 31, 2016.
Price risk
Price risk is the risk that the carrying value of financial instrumentswill fluctuate as a result of changes in market prices (other than thosearising from interest rate risk or currency risk) caused by factorsspecific to a security, its issuer or all factors affecting a market or amarket segment. Exposure to price risk is mainly in equities,underlying funds, derivatives and commodities, as applicable. As atJune 30, 2017, approximately 97.7% (December 31, 2016 – 97.4%) ofthe Fund’s net assets were exposed to price risk. If prices of theseinstruments had decreased or increased by 10%, with all othervariables held constant, net assets of the Fund would have decreasedor increased, respectively, by approximately $74,665,001(December 31, 2016 – $65,863,190). In practice, actual results maydiffer from this sensitivity analysis and the difference could bematerial.
Credit risk
The Fund had no significant exposure to bonds and debentures, moneymarket instruments or preferred shares as at June 30, 2017 orDecember 31, 2016.
Concentration risk
Concentration risk arises as a result of the concentration of exposureswithin the same category, geographical location, asset type or industrysector, as applicable. The table below is a summary of the Fund’sconcentration risk:
Percentage of net assets (%)
June 30, 2017 December 31, 2016
Consumer Discretionary 6.1 6.3Consumer Staples 4.9 4.3Energy 20.0 23.1Financials 11.4 10.9Health Care 2.5 2.3Industrials 25.2 24.6Information Technology 6.5 7.4Materials 17.0 15.5Real Estate 4.1 3.0
Fair Value Classification (note 2)
The tables below illustrate the classification of the Fund’s financialinstruments within the fair value hierarchy.
June 30, 2017Level 1
($)Level 2
($)Level 3
($)Total($)
Equities 744,987,289 1,662,716 – 746,650,005
744,987,289 1,662,716 – 746,650,005
December 31, 2016Level 1
($)Level 2
($)Level 3
($)Total($)
Equities 658,631,895 – – 658,631,895
658,631,895 – – 658,631,895
Transfers between levels
During the periods ended June 30, 2017 and December 31, 2016, therewere no significant transfers between Level 1 and Level 2.
Offsetting of financial assets and liabilities (note 2)
As at June 30, 2017 and December 31, 2016, the Fund did not enter intoany agreement whereby the financial instruments were eligible foroffset.
Interest in Underlying Funds (note 2)
The Fund did not hold any interest in Underlying Funds as at June 30,2017 or December 31, 2016.
Comparison of net asset value per unit and net assets per unit(note 2)
As at June 30, 2017 or December 31, 2016, there were no differencesbetween the net asset value per unit and the net assets per unit for anyseries of the Fund.
The accompanying notes are an integral part of the financial statements.
CA
NA
DIA
NE
QU
ITY
FUN
DS
53

Scotia Private U.S. Value Pool (Unaudited)
STATEMENTS OF FINANCIAL POSITIONAs at
(in dollars)June 30,
2017December 31,
2016
ASSETSCurrent assetsInvestments
Non-derivative financial assets 105,069,360 99,900,419Cash 5,030,009 3,618,833Subscriptions receivable 268,644 160,448Accrued investment income and other 202,716 205,697
110,570,729 103,885,397
LIABILITIESCurrent liabilitiesManagement fee payable 383 –Payable for securities purchased 691,920 –Redemptions payable 132,246 35,193Accrued expenses 21,166 641
845,715 35,834
Net assets attributable to holders of redeemable units 109,725,014 103,849,563
NET ASSETS ATTRIBUTABLE TO HOLDERS OF REDEEMABLEUNITS PER SERIES
Pinnacle Series 104,997,839 98,668,107Series F 421,321 406,066Series I 4,305,854 4,775,390
NET ASSETS ATTRIBUTABLE TO HOLDERS OF REDEEMABLEUNITS PER UNIT
Pinnacle Series 14.90 14.45Series F 14.86 14.49Series I 15.38 14.91
STATEMENTS OF COMPREHENSIVE INCOMEFor the periods ended June 30 (note 1),(in dollars except average units) 2017 2016
INCOMENet gain (loss) on investments
Dividends 1,274,728 1,099,918Interest for distribution purposes 21,985 8,911Net realized gain (loss) on non-derivative financial assets 740,549 (4,383,409)Change in unrealized gain (loss) on non-derivative financial
assets 1,551,187 (4,295,902)
Net gain (loss) on investments 3,588,449 (7,570,482)Securities lending (note 11) 2,421 10,470Net realized and unrealized foreign currency translation gain
(loss) (150,281) (96,099)Other income 479 128
Total income (loss), net 3,441,068 (7,655,983)
EXPENSESManagement fees (note 5) 2,090 2,061Fixed administration fees (note 6) 109,025 89,725Independent Review Committee fees 576 563Interest expense and bank overdraft charges – 1Foreign withholding taxes/tax reclaims 172,667 144,643Other fund costs – 16Harmonized Sales Tax/Goods and Services Tax 10,751 9,456Transaction costs 10,376 43,806
Total expenses 305,485 290,271
Increase (decrease) in net assets attributable to holders ofredeemable units from operations 3,135,583 (7,946,254)
INCREASE (DECREASE) IN NET ASSETS ATTRIBUTABLE TOHOLDERS OF REDEEMABLE UNITS FROM OPERATIONS PERSERIES
Pinnacle Series 2,972,538 (7,430,313)Series F 10,181 (41,516)Series I 152,864 (474,425)
INCREASE (DECREASE) IN NET ASSETS ATTRIBUTABLE TOHOLDERS OF REDEEMABLE UNITS FROM OPERATIONS PERUNIT†
Pinnacle Series 0.43 (1.22)Series F 0.36 (1.40)Series I 0.52 (1.36)
WEIGHTED AVERAGE NUMBER OF UNITS PER SERIESPinnacle Series 6,917,991 6,069,857Series F 28,064 29,553Series I 294,981 348,138
† The increase (decrease) in net assets attributable to holders of redeemable units fromoperations per unit is calculated by dividing the increase (decrease) in net assetsattributable to holders of redeemable units from operations per series by the weightedaverage number of units per series.
The accompanying notes are an integral part of the financial statements. Portfolio Adviser: Coho Partners, Ltd.
FOR
EIG
NE
QU
ITY
FUN
DS
54
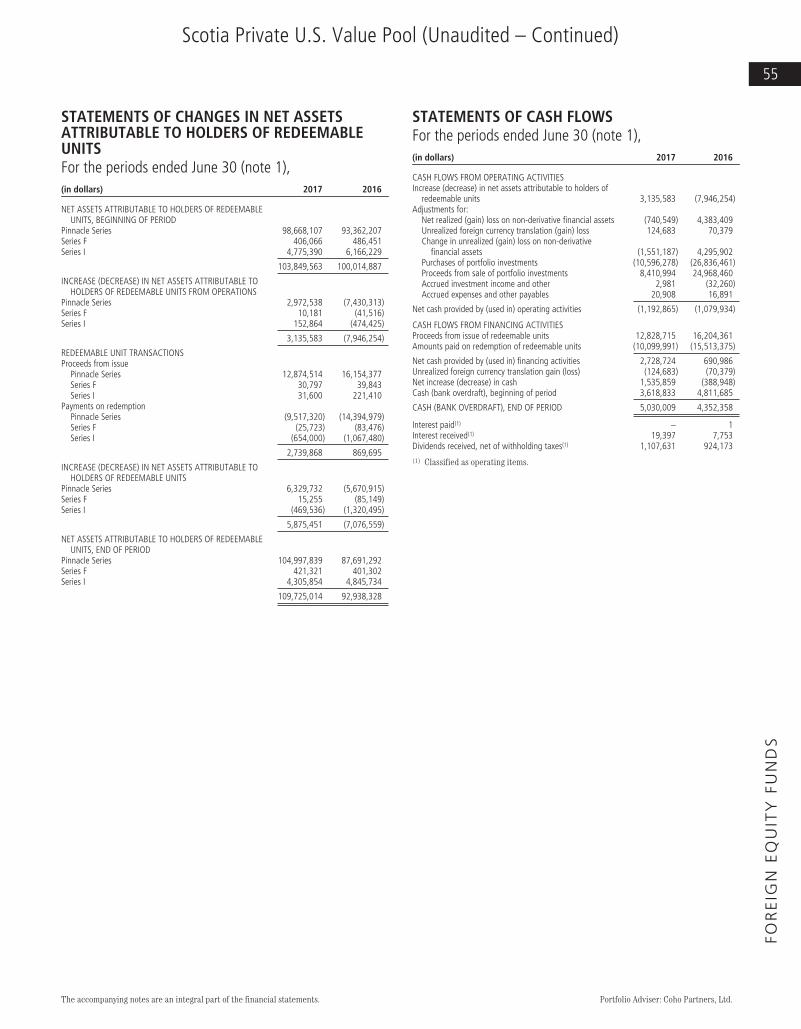
Scotia Private U.S. Value Pool (Unaudited – Continued)
STATEMENTS OF CHANGES IN NET ASSETSATTRIBUTABLE TO HOLDERS OF REDEEMABLEUNITSFor the periods ended June 30 (note 1),(in dollars) 2017 2016
NET ASSETS ATTRIBUTABLE TO HOLDERS OF REDEEMABLEUNITS, BEGINNING OF PERIOD
Pinnacle Series 98,668,107 93,362,207Series F 406,066 486,451Series I 4,775,390 6,166,229
103,849,563 100,014,887
INCREASE (DECREASE) IN NET ASSETS ATTRIBUTABLE TOHOLDERS OF REDEEMABLE UNITS FROM OPERATIONS
Pinnacle Series 2,972,538 (7,430,313)Series F 10,181 (41,516)Series I 152,864 (474,425)
3,135,583 (7,946,254)
REDEEMABLE UNIT TRANSACTIONSProceeds from issue
Pinnacle Series 12,874,514 16,154,377Series F 30,797 39,843Series I 31,600 221,410
Payments on redemptionPinnacle Series (9,517,320) (14,394,979)Series F (25,723) (83,476)Series I (654,000) (1,067,480)
2,739,868 869,695
INCREASE (DECREASE) IN NET ASSETS ATTRIBUTABLE TOHOLDERS OF REDEEMABLE UNITS
Pinnacle Series 6,329,732 (5,670,915)Series F 15,255 (85,149)Series I (469,536) (1,320,495)
5,875,451 (7,076,559)
NET ASSETS ATTRIBUTABLE TO HOLDERS OF REDEEMABLEUNITS, END OF PERIOD
Pinnacle Series 104,997,839 87,691,292Series F 421,321 401,302Series I 4,305,854 4,845,734
109,725,014 92,938,328
STATEMENTS OF CASH FLOWSFor the periods ended June 30 (note 1),(in dollars) 2017 2016
CASH FLOWS FROM OPERATING ACTIVITIESIncrease (decrease) in net assets attributable to holders of
redeemable units 3,135,583 (7,946,254)Adjustments for:
Net realized (gain) loss on non-derivative financial assets (740,549) 4,383,409Unrealized foreign currency translation (gain) loss 124,683 70,379Change in unrealized (gain) loss on non-derivative
financial assets (1,551,187) 4,295,902Purchases of portfolio investments (10,596,278) (26,836,461)Proceeds from sale of portfolio investments 8,410,994 24,968,460Accrued investment income and other 2,981 (32,260)Accrued expenses and other payables 20,908 16,891
Net cash provided by (used in) operating activities (1,192,865) (1,079,934)
CASH FLOWS FROM FINANCING ACTIVITIESProceeds from issue of redeemable units 12,828,715 16,204,361Amounts paid on redemption of redeemable units (10,099,991) (15,513,375)
Net cash provided by (used in) financing activities 2,728,724 690,986Unrealized foreign currency translation gain (loss) (124,683) (70,379)Net increase (decrease) in cash 1,535,859 (388,948)Cash (bank overdraft), beginning of period 3,618,833 4,811,685
CASH (BANK OVERDRAFT), END OF PERIOD 5,030,009 4,352,358
Interest paid(1) – 1Interest received(1) 19,397 7,753Dividends received, net of withholding taxes(1) 1,107,631 924,173
(1) Classified as operating items.
The accompanying notes are an integral part of the financial statements. Portfolio Adviser: Coho Partners, Ltd.
FOR
EIG
NE
QU
ITY
FUN
DS
55

Scotia Private U.S. Value Pool (Unaudited – Continued)
SCHEDULE OF INVESTMENT PORTFOLIOAs at June 30, 2017
IssuerNumber of
SharesAverageCost ($)
CarryingValue ($)
EQUITIES – 95.7%Consumer Discretionary – 12.1%Dollar General Corporation 49,265 5,702,181 4,604,522Lowe’s Companies, Inc. 40,533 4,021,818 4,074,268Omnicom Group Inc. 42,855 4,525,529 4,606,033
14,249,528 13,284,823
Consumer Staples – 19.6%CVS Health Corporation 47,015 5,598,350 4,904,418J.M. Smucker Company, The 21,556 4,042,509 3,306,999Kroger Company, The 72,853 3,280,000 2,202,658Philip Morris International Inc. 30,034 3,214,434 4,573,379Procter & Gamble Company, The 21,713 2,428,338 2,453,343Reynolds American Inc. 47,976 3,271,121 4,045,532
21,834,752 21,486,329
Energy – 8.2%Chevron Corporation 21,849 3,043,710 2,955,370Occidental Petroleum Corporation 42,987 4,066,406 3,336,702Royal Dutch Shell PLC, Class A – ADR 38,926 2,768,055 2,684,360
9,878,171 8,976,432
Financials – 13.2%Aflac, Inc. 44,615 4,267,262 4,493,256Marsh & McLennan Companies, Inc. 44,997 3,972,909 4,548,063State Street Corporation 47,204 3,567,475 5,491,456
11,807,646 14,532,775
Health Care – 24.3%Abbott Laboratories 76,070 4,083,050 4,794,133AmerisourceBergen Corporation 26,606 2,798,041 3,260,771Amgen Inc. 20,892 4,222,857 4,665,088Becton, Dickinson and Company 15,356 3,434,284 3,884,442Johnson & Johnson 13,392 2,138,042 2,296,907Merck & Co., Inc. 31,480 2,503,749 2,615,749UnitedHealth Group Incorporated 21,427 3,964,870 5,150,970
23,144,893 26,668,060
Industrials – 11.0%3M Company 14,071 3,219,209 3,798,008Illinois Tool Works Inc. 26,606 3,654,006 4,941,346W.W. Grainger, Inc. 14,285 4,174,212 3,343,495
11,047,427 12,082,849
Information Technology – 7.3%Automatic Data Processing, Inc. 34,462 4,194,917 4,577,895Microchip Technology Incorporated 34,580 2,302,737 3,460,197
6,497,654 8,038,092
Transaction Costs (31,544)
TOTAL INVESTMENT PORTFOLIO 98,428,527 105,069,360
OTHER ASSETS, LESS LIABILITIES – 4.3% 4,655,654
NET ASSETS – 100.0% 109,725,014
The accompanying notes are an integral part of the financial statements. Portfolio Adviser: Coho Partners, Ltd.
FOR
EIG
NE
QU
ITY
FUN
DS
56

Scotia Private U.S. Value Pool (Unaudited – Continued)
FUND SPECIFIC NOTESFor the periods indicated in Note 1
The Fund (note 1)
The Fund’s investment objective is to achieve superior long termreturns through capital growth by investing primarily in stocks of largecapitalization U.S. corporations.
Risks associated with financial instruments (note 4)
Interest rate risk
The majority of the Fund’s financial instruments were non-interestbearing as at June 30, 2017 and December 31, 2016. Accordingly, theFund is not directly subject to significant risk due to fluctuations inthe prevailing levels of market interest rates.
Currency risk
The Fund’s exposure to currency risk is summarized in the tablesbelow. Amounts shown are based on the carrying value of monetary andnon-monetary assets and liabilities of the Fund net of currencycontracts, as applicable.
June 30, 2017
CurrencyGross currencyexposure ($)
Currencycontracts ($)
Net exposure($)
Percentage ofnet assets (%)
US Dollar 109,301,243 – 109,301,243 99.6
109,301,243 – 109,301,243 99.6
December 31, 2016
CurrencyGross currencyexposure ($)
Currencycontracts ($)
Net exposure($)
Percentage ofnet assets (%)
US Dollar 103,286,414 – 103,286,414 99.5
103,286,414 – 103,286,414 99.5
If the Canadian dollar strengthened or weakened by 10% in relation toall other currencies, with all other variables held constant, net assetsof the Fund could possibly have decreased or increased, respectively,by $10,930,124 or 10.0% of net assets (December 31, 2016 – $10,328,641or 10.0%). In practice, actual results may differ from this sensitivityanalysis and the difference could be material.
Price risk
Price risk is the risk that the carrying value of financial instrumentswill fluctuate as a result of changes in market prices (other than thosearising from interest rate risk or currency risk) caused by factorsspecific to a security, its issuer or all factors affecting a market or amarket segment. Exposure to price risk is mainly in equities,underlying funds, derivatives and commodities, as applicable. As atJune 30, 2017, approximately 95.7% (December 31, 2016 – 96.2%) ofthe Fund’s net assets were exposed to price risk. If prices of theseinstruments had decreased or increased by 10%, with all othervariables held constant, net assets of the Fund would have decreasedor increased, respectively, by approximately $10,506,936(December 31, 2016 – $9,990,042). In practice, actual results maydiffer from this sensitivity analysis and the difference could bematerial.
Credit risk
The Fund had no significant exposure to bonds and debentures, moneymarket instruments or preferred shares as at June 30, 2017 orDecember 31, 2016.
Concentration risk
Concentration risk arises as a result of the concentration of exposureswithin the same category, geographical location, asset type or industrysector, as applicable. The table below is a summary of the Fund’sconcentration risk:
Percentage of net assets (%)
June 30, 2017 December 31, 2016
Consumer Discretionary 12.1 12.8Consumer Staples 19.6 19.2Energy 8.2 7.8Financials 13.2 12.9Health Care 24.3 23.6Industrials 11.0 11.5Information Technology 7.3 8.4
Fair Value Classification (note 2)
The tables below illustrate the classification of the Fund’s financialinstruments within the fair value hierarchy.
June 30, 2017Level 1
($)Level 2
($)Level 3
($)Total($)
Equities 105,069,360 – – 105,069,360
105,069,360 – – 105,069,360
December 31, 2016Level 1
($)Level 2
($)Level 3
($)Total($)
Equities 99,900,419 – – 99,900,419
99,900,419 – – 99,900,419
Transfers between levels
During the periods ended June 30, 2017 and December 31, 2016, therewere no significant transfers between Level 1 and Level 2.
Offsetting of financial assets and liabilities (note 2)
As at June 30, 2017 and December 31, 2016, the Fund did not enter intoany agreement whereby the financial instruments were eligible foroffset.
Interest in Underlying Funds (note 2)
The Fund did not hold any interest in Underlying Funds as at June 30,2017 or December 31, 2016.
Comparison of net asset value per unit and net assets per unit(note 2)
As at June 30, 2017 or December 31, 2016, there were no differencesbetween the net asset value per unit and the net assets per unit for anyseries of the Fund.
The accompanying notes are an integral part of the financial statements.
FOR
EIG
NE
QU
ITY
FUN
DS
57

Scotia Private U.S. Mid Cap Value Pool (Unaudited)
STATEMENTS OF FINANCIAL POSITIONAs at
(in dollars)June 30,
2017December 31,
2016
ASSETSCurrent assetsInvestments
Non-derivative financial assets 82,951,895 120,241,722Cash 3,433,886 7,251,740Subscriptions receivable 305,774 377,558Accrued investment income and other 52,148 105,733
86,743,703 127,976,753
LIABILITIESCurrent liabilitiesManagement fee payable 1,394 –Redemptions payable 211,513 82,462Accrued expenses 35,904 2,050Distributions payable – 3
248,811 84,515
Net assets attributable to holders of redeemable units 86,494,892 127,892,238
NET ASSETS ATTRIBUTABLE TO HOLDERS OF REDEEMABLEUNITS PER SERIES
Pinnacle Series 77,388,798 70,044,228Series F 407,647 382,305Series I 6,691,831 5,190,728Series M 2,006,616 52,274,977
NET ASSETS ATTRIBUTABLE TO HOLDERS OF REDEEMABLEUNITS PER UNIT
Pinnacle Series 17.10 16.66Series F 16.69 16.48Series I 17.77 17.29Series M 17.09 16.58
STATEMENTS OF COMPREHENSIVE INCOMEFor the periods ended June 30 (note 1),(in dollars except average units) 2017 2016
INCOMENet gain (loss) on investments
Dividends 629,825 649,707Interest for distribution purposes 19,005 15,071Net realized gain (loss) on non-derivative financial assets 5,933,816 (1,058,337)Change in unrealized gain (loss) on non-derivative financial
assets (3,188,329) (1,590,125)
Net gain (loss) on investments 3,394,317 (1,983,684)Securities lending (note 11) 1,577 1,085Net realized and unrealized foreign currency translation gain
(loss) (344,500) (993,903)Other income 1,168 162
Total income (loss), net 3,052,562 (2,976,340)
EXPENSESManagement fees (note 5) 84,831 148,248Fixed administration fees (note 6) 195,692 135,076Independent Review Committee fees 576 562Foreign withholding taxes/tax reclaims 93,046 84,699Other fund costs – 19Harmonized Sales Tax/Goods and Services Tax 27,748 29,449Transaction costs 52,897 62,136
Total expenses 454,790 460,189
Increase (decrease) in net assets attributable to holders ofredeemable units from operations 2,597,772 (3,436,529)
INCREASE (DECREASE) IN NET ASSETS ATTRIBUTABLE TOHOLDERS OF REDEEMABLE UNITS FROM OPERATIONSPER SERIES
Pinnacle Series 1,836,252 (680,163)Series F 4,543 (13,935)Series I 153,410 (64,434)Series M 603,567 (2,677,997)
INCREASE (DECREASE) IN NET ASSETS ATTRIBUTABLE TOHOLDERS OF REDEEMABLE UNITS FROM OPERATIONS PERUNIT†
Pinnacle Series 0.42 (0.22)Series F 0.19 (0.74)Series I 0.44 (0.22)Series M 0.32 (0.73)
WEIGHTED AVERAGE NUMBER OF UNITS PER SERIESPinnacle Series 4,339,647 3,097,463Series F 23,658 18,705Series I 344,748 295,667Series M 1,857,280 3,649,317
† The increase (decrease) in net assets attributable to holders of redeemable units fromoperations per unit is calculated by dividing the increase (decrease) in net assetsattributable to holders of redeemable units from operations per series by the weightedaverage number of units per series.
The accompanying notes are an integral part of the financial statements. Portfolio Adviser: Hahn Capital Management, LLC
FOR
EIG
NE
QU
ITY
FUN
DS
58

Scotia Private U.S. Mid Cap Value Pool (Unaudited – Continued)
STATEMENTS OF CHANGES IN NET ASSETSATTRIBUTABLE TO HOLDERS OF REDEEMABLEUNITSFor the periods ended June 30 (note 1),(in dollars) 2017 2016
NET ASSETS ATTRIBUTABLE TO HOLDERS OF REDEEMABLEUNITS, BEGINNING OF PERIOD
Pinnacle Series 70,044,228 13,663,796Series F 382,305 287,289Series I 5,190,728 1,516,440Series M 52,274,977 57,606,342
127,892,238 73,073,867
INCREASE (DECREASE) IN NET ASSETS ATTRIBUTABLE TOHOLDERS OF REDEEMABLE UNITS FROM OPERATIONS
Pinnacle Series 1,836,252 (680,163)Series F 4,543 (13,935)Series I 153,410 (64,434)Series M 603,567 (2,677,997)
2,597,772 (3,436,529)
REDEEMABLE UNIT TRANSACTIONSProceeds from issue
Pinnacle Series 13,370,968 44,266,237Series F 43,755 67,240Series I 1,651,603 3,715,950Series M 2,084,378 3,441,795
Payments on redemptionPinnacle Series (7,862,650) (2,359,924)Series F (22,956) (51,252)Series I (303,910) (253,750)Series M (52,956,306) (6,441,865)
(43,995,118) 42,384,431
INCREASE (DECREASE) IN NET ASSETS ATTRIBUTABLE TOHOLDERS OF REDEEMABLE UNITS
Pinnacle Series 7,344,570 41,226,150Series F 25,342 2,053Series I 1,501,103 3,397,766Series M (50,268,361) (5,678,067)
(41,397,346) 38,947,902
NET ASSETS ATTRIBUTABLE TO HOLDERS OF REDEEMABLEUNITS, END OF PERIOD
Pinnacle Series 77,388,798 54,889,946Series F 407,647 289,342Series I 6,691,831 4,914,206Series M 2,006,616 51,928,275
86,494,892 112,021,769
STATEMENTS OF CASH FLOWSFor the periods ended June 30 (note 1),(in dollars) 2017 2016
CASH FLOWS FROM OPERATING ACTIVITIESIncrease (decrease) in net assets attributable to holders of
redeemable units 2,597,772 (3,436,529)Adjustments for:
Net realized (gain) loss on non-derivative financial assets (5,933,816) 1,058,337Unrealized foreign currency translation (gain) loss 65,181 1,280,953Change in unrealized (gain) loss on non-derivative
financial assets 3,188,329 1,590,125Purchases of portfolio investments (6,686,677) (50,105,992)Proceeds from sale of portfolio investments 46,721,991 10,382,313Accrued investment income and other 53,585 (11,810)Accrued expenses and other payables 35,248 55,299
Net cash provided by (used in) operating activities 40,041,613 (39,187,304)
CASH FLOWS FROM FINANCING ACTIVITIESProceeds from issue of redeemable units 17,222,488 51,331,379Amounts paid on redemption of redeemable units (61,016,771) (8,443,154)Distributions to unitholders of redeemable units (3) –
Net cash provided by (used in) financing activities (43,794,286) 42,888,225Unrealized foreign currency translation gain (loss) (65,181) (1,280,953)Net increase (decrease) in cash (3,752,673) 3,700,921Cash (bank overdraft), beginning of period 7,251,740 3,995,702
CASH (BANK OVERDRAFT), END OF PERIOD 3,433,886 6,415,670
Interest received(1) 18,851 14,005Dividends received, net of withholding taxes(1) 590,518 554,265
(1) Classified as operating items.
The accompanying notes are an integral part of the financial statements. Portfolio Adviser: Hahn Capital Management, LLC
FOR
EIG
NE
QU
ITY
FUN
DS
59

Scotia Private U.S. Mid Cap Value Pool (Unaudited – Continued)
SCHEDULE OF INVESTMENT PORTFOLIOAs at June 30, 2017
IssuerNumber of
SharesAverageCost ($)
CarryingValue ($)
EQUITIES – 95.9%Consumer Discretionary – 15.2%Carter’s Inc. 19,918 2,289,784 2,297,009Hanesbrands Inc. 43,264 1,730,973 1,299,081Mohawk Industries, Inc. 12,477 2,772,784 3,909,668PVH Corporation 18,927 2,324,453 2,809,689Ross Stores, Inc. 37,777 2,296,092 2,827,483
11,414,086 13,142,930
Energy – 2.9%Pioneer Natural Resources Company 12,209 2,335,029 2,525,978
Financials – 17.4%BankUnited 62,467 2,856,430 2,730,112CIT Group, Inc. 26,804 1,298,726 1,692,387East West Bancorp, Inc. 24,228 1,760,012 1,840,085First Republic Bank 28,528 2,249,377 3,702,341FNF Group 39,829 1,917,589 2,314,937SEI Investments Company 40,042 2,215,121 2,791,950
12,297,255 15,071,812
Health Care – 13.6%Agilent Technologies, Inc. 39,008 2,040,409 2,999,526Becton, Dickinson and Company 14,162 2,782,168 3,582,409Envision Healthcare Corporation 32,543 3,029,983 2,644,164Laboratory Corporation of America Holdings 12,767 2,164,446 2,551,381
10,017,006 11,777,480
Industrials – 22.4%Carlisle Companies Inc. 12,535 1,511,251 1,550,400Convanta Holding Corporation 74,958 1,630,395 1,282,812EMCOR Group, Inc. 21,511 1,416,312 1,823,377Hexcel Corporation 52,809 2,901,381 3,614,354IDEX Corporation 19,921 1,866,424 2,918,764Jacobs Engineering Group, Inc. 43,959 2,494,106 3,099,830Roper Technologies Inc. 5,350 1,098,896 1,605,950Snap-on Incorporated 12,617 2,760,557 2,584,546Wabtec Corporation 7,183 721,108 852,115
16,400,430 19,332,148
Information Technology – 9.8%Euronet Worldwide, Inc. 27,599 2,370,533 3,126,272Genpact Limited 55,137 1,776,054 1,989,424Keysight Technologies Inc. 66,607 2,499,799 3,361,827
6,646,386 8,477,523
Materials – 5.5%Albemarle Corporation 19,915 1,686,867 2,725,012Reliance Steel & Aluminum Company 21,347 1,655,697 2,015,111
3,342,564 4,740,123
Real Estate – 9.1%CB Richard Ellis Group, Inc. 76,297 3,112,910 3,600,641Host Hotels & Resorts Inc. 75,886 1,639,899 1,797,510Mid-America Apartment Communities Inc. 18,194 2,260,569 2,485,750
7,013,378 7,883,901
Transaction Costs (62,086)
TOTAL INVESTMENT PORTFOLIO 69,404,048 82,951,895
OTHER ASSETS, LESS LIABILITIES – 4.1% 3,542,997
NET ASSETS – 100.0% 86,494,892
The accompanying notes are an integral part of the financial statements. Portfolio Adviser: Hahn Capital Management, LLC
FOR
EIG
NE
QU
ITY
FUN
DS
60

Scotia Private U.S. Mid Cap Value Pool (Unaudited – Continued)
FUND SPECIFIC NOTESFor the periods indicated in Note 1
The Fund (note 1)
The Fund’s investment objective is to achieve superior long termreturns through capital growth by investing primarily in stocks of smalland medium capitalization companies located in the U.S.
Risks associated with financial instruments (note 4)
Interest rate risk
The majority of the Fund’s financial instruments were non-interestbearing as at June 30, 2017 and December 31, 2016. Accordingly, theFund is not directly subject to significant risk due to fluctuations inthe prevailing levels of market interest rates.
Currency risk
The Fund’s exposure to currency risk is summarized in the tablesbelow. Amounts shown are based on the carrying value of monetary andnon-monetary assets and liabilities of the Fund net of currencycontracts, as applicable.
June 30, 2017
CurrencyGross currencyexposure ($)
Currencycontracts ($)
Netexposure ($)
Percentage ofnet assets (%)
US Dollar 85,472,074 – 85,472,074 98.8
85,472,074 – 85,472,074 98.8
December 31, 2016
CurrencyGross currencyexposure ($)
Currencycontracts ($)
Netexposure ($)
Percentage ofnet assets (%)
US Dollar 127,277,175 – 127,277,175 99.5
127,277,175 – 127,277,175 99.5
If the Canadian dollar strengthened or weakened by 10% in relation toall other currencies, with all other variables held constant, net assetsof the Fund could possibly have decreased or increased, respectively,by $8,547,207 or 9.9% of net assets (December 31, 2016 – $12,727,718 or10.0%). In practice, actual results may differ from this sensitivityanalysis and the difference could be material.
Price risk
Price risk is the risk that the carrying value of financial instrumentswill fluctuate as a result of changes in market prices (other than thosearising from interest rate risk or currency risk) caused by factorsspecific to a security, its issuer or all factors affecting a market or amarket segment. Exposure to price risk is mainly in equities,underlying funds, derivatives and commodities, as applicable. As atJune 30, 2017, approximately 95.9% (December 31, 2016 – 94.0%) ofthe Fund’s net assets were exposed to price risk. If prices of theseinstruments had decreased or increased by 10%, with all othervariables held constant, net assets of the Fund would have decreasedor increased, respectively, by approximately $8,295,190 (December 31,2016 – $12,024,172). In practice, actual results may differ from thissensitivity analysis and the difference could be material.
Credit risk
The Fund had no significant exposure to bonds and debentures, moneymarket instruments or preferred shares as at June 30, 2017 orDecember 31, 2016.
Concentration risk
Concentration risk arises as a result of the concentration of exposureswithin the same category, geographical location, asset type or industrysector, as applicable. The table below is a summary of the Fund’sconcentration risk:
Percentage of net assets (%)
June 30, 2017 December 31, 2016
Consumer Discretionary 15.2 15.2Consumer Staples – 3.7Energy 2.9 2.8Financials 17.4 15.3Health Care 13.6 13.1Industrials 22.4 23.4Information Technology 9.8 7.2Materials 5.5 5.0Real Estate 9.1 8.3
Fair Value Classification (note 2)
The tables below illustrate the classification of the Fund’s financialinstruments within the fair value hierarchy.
June 30, 2017Level 1
($)Level 2
($)Level 3
($)Total($)
Equities 82,951,895 – – 82,951,895
82,951,895 – – 82,951,895
December 31, 2016Level 1
($)Level 2
($)Level 3
($)Total($)
Equities 120,241,722 – – 120,241,722
120,241,722 – – 120,241,722
Transfers between levels
During the periods ended June 30, 2017 and December 31, 2016, therewere no significant transfers between Level 1 and Level 2.
Offsetting of financial assets and liabilities (note 2)
As at June 30, 2017 and December 31, 2016, the Fund did not enter intoany agreement whereby the financial instruments were eligible foroffset.
Interest in Underlying Funds (note 2)
The Fund did not hold any interest in Underlying Funds as at June 30,2017 or December 31, 2016.
The accompanying notes are an integral part of the financial statements.
FOR
EIG
NE
QU
ITY
FUN
DS
61

Scotia Private U.S. Mid Cap Value Pool (Unaudited – Continued)
FUND SPECIFIC NOTESFor the periods indicated in Note 1
Comparison of net asset value per unit and net assets per unit(note 2)
The table below provides a comparison of the net asset value per unitand net assets per unit. A difference could arise when the last tradedmarket price for a financial instrument is not within the bid-ask spread(note 2).
June 30, 2017 December 31, 2016
Net asset valueper unit
($)
Net assetsper unit
($)
Net asset valueper unit
($)
Net assetsper unit
($)
Pinnacle Series 17.10 17.10 16.65 16.66Series F 16.69 16.69 16.48 16.48Series I 17.77 17.77 17.29 17.29Series M 17.09 17.09 16.57 16.58
The accompanying notes are an integral part of the financial statements.
FOR
EIG
NE
QU
ITY
FUN
DS
62

Scotia Private U.S. Mid Cap Growth Pool (Unaudited)
STATEMENTS OF FINANCIAL POSITIONAs at
(in dollars)June 30,
2017December 31,
2016
ASSETSCurrent assetsInvestments
Non-derivative financial assets 58,197,351 57,752,991Cash 578,872 640,735Receivable for securities sold – 200,165Subscriptions receivable 52,016 117,974Accrued investment income and other 15,809 19,471
58,844,048 58,731,336
LIABILITIESCurrent liabilitiesManagement fee payable 25,836 –Payable for securities purchased – 363,231Redemptions payable 311,862 60,190Accrued expenses 6,926 1,032Distributions payable – 5
344,624 424,458
Net assets attributable to holders of redeemable units 58,499,424 58,306,878
NET ASSETS ATTRIBUTABLE TO HOLDERS OF REDEEMABLEUNITS PER SERIES
Pinnacle Series 8,485,443 8,581,524Series F 198,449 191,962Series M 49,815,532 49,533,392
NET ASSETS ATTRIBUTABLE TO HOLDERS OF REDEEMABLEUNITS PER UNIT
Pinnacle Series 33.06 31.00Series F 31.60 29.70Series M 32.86 30.81
STATEMENTS OF COMPREHENSIVE INCOMEFor the periods ended June 30 (note 1),(in dollars except average units) 2017 2016
INCOMENet gain (loss) on investments
Dividends 201,860 222,958Interest for distribution purposes 5,465 3,538Net realized gain (loss) on non-derivative financial assets 1,347,952 (543,982)Change in unrealized gain (loss) on non-derivative financial
assets 2,480,714 (4,667,000)
Net gain (loss) on investments 4,035,991 (4,984,486)Securities lending (note 11) 797 3,390Net realized and unrealized foreign currency translation gain
(loss) (11,612) 11,991
Total income (loss), net 4,025,176 (4,969,105)
EXPENSESManagement fees (note 5) 138,085 147,177Fixed administration fees (note 6) 34,241 39,119Independent Review Committee fees 576 563Interest expense and bank overdraft charges 4 759Foreign withholding taxes/tax reclaims 28,224 33,124Other fund costs – 11Harmonized Sales Tax/Goods and Services Tax 17,905 19,627Transaction costs 17,155 21,767
Total expenses 236,190 262,147
Increase (decrease) in net assets attributable to holders ofredeemable units from operations 3,788,986 (5,231,252)
INCREASE (DECREASE) IN NET ASSETS ATTRIBUTABLE TOHOLDERS OF REDEEMABLE UNITS FROM OPERATIONSPER SERIES
Pinnacle Series 564,377 (1,264,736)Series F 11,614 (17,691)Series M 3,212,995 (3,948,825)
INCREASE (DECREASE) IN NET ASSETS ATTRIBUTABLE TOHOLDERS OF REDEEMABLE UNITS FROM OPERATIONS PERUNIT†
Pinnacle Series 2.11 (3.62)Series F 1.88 (2.08)Series M 2.07 (2.15)
WEIGHTED AVERAGE NUMBER OF UNITS PER SERIESPinnacle Series 267,635 349,478Series F 6,194 8,519Series M 1,552,147 1,836,119
† The increase (decrease) in net assets attributable to holders of redeemable units fromoperations per unit is calculated by dividing the increase (decrease) in net assetsattributable to holders of redeemable units from operations per series by the weightedaverage number of units per series.
The accompanying notes are an integral part of the financial state Portfolio Adviser: William Blair Investment Management, LLC
FOR
EIG
NE
QU
ITY
FUN
DS
63

Scotia Private U.S. Mid Cap Growth Pool (Unaudited – Continued)
STATEMENTS OF CHANGES IN NET ASSETSATTRIBUTABLE TO HOLDERS OF REDEEMABLEUNITSFor the periods ended June 30 (note 1),(in dollars) 2017 2016
NET ASSETS ATTRIBUTABLE TO HOLDERS OF REDEEMABLEUNITS, BEGINNING OF PERIOD
Pinnacle Series 8,581,524 21,355,729Series F 191,962 262,085Series M 49,533,392 58,823,235
58,306,878 80,441,049
INCREASE (DECREASE) IN NET ASSETS ATTRIBUTABLE TOHOLDERS OF REDEEMABLE UNITS FROM OPERATIONS
Pinnacle Series 564,377 (1,264,736)Series F 11,614 (17,691)Series M 3,212,995 (3,948,825)
3,788,986 (5,231,252)
REDEEMABLE UNIT TRANSACTIONSProceeds from issue
Pinnacle Series 277,842 1,100,464Series F 19,765 24,648Series M 3,641,255 3,450,318
Payments on redemptionPinnacle Series (938,300) (12,329,534)Series F (24,892) (58,822)Series M (6,572,110) (6,473,938)
(3,596,440) (14,286,864)
INCREASE (DECREASE) IN NET ASSETS ATTRIBUTABLE TOHOLDERS OF REDEEMABLE UNITS
Pinnacle Series (96,081) (12,493,806)Series F 6,487 (51,865)Series M 282,140 (6,972,445)
192,546 (19,518,116)
NET ASSETS ATTRIBUTABLE TO HOLDERS OF REDEEMABLEUNITS, END OF PERIOD
Pinnacle Series 8,485,443 8,861,923Series F 198,449 210,220Series M 49,815,532 51,850,790
58,499,424 60,922,933
STATEMENTS OF CASH FLOWSFor the periods ended June 30 (note 1),(in dollars) 2017 2016
CASH FLOWS FROM OPERATING ACTIVITIESIncrease (decrease) in net assets attributable to holders of
redeemable units 3,788,986 (5,231,252)Adjustments for:
Net realized (gain) loss on non-derivative financial assets (1,347,952) 543,982Unrealized foreign currency translation (gain) loss 12,412 115,297Change in unrealized (gain) loss on non-derivative
financial assets (2,480,714) 4,667,000Purchases of portfolio investments (19,442,630) (19,778,964)Proceeds from sale of portfolio investments 22,663,870 33,806,857Accrued investment income and other 3,662 (6,437)Accrued expenses and other payables 31,730 32,582
Net cash provided by (used in) operating activities 3,229,364 14,149,065
CASH FLOWS FROM FINANCING ACTIVITIESProceeds from issue of redeemable units 4,004,820 4,615,872Amounts paid on redemption of redeemable units (7,283,630) (18,220,574)Distributions to unitholders of redeemable units (5) –
Net cash provided by (used in) financing activities (3,278,815) (13,604,702)Unrealized foreign currency translation gain (loss) (12,412) (115,297)Net increase (decrease) in cash (49,451) 544,363Cash (bank overdraft), beginning of period 640,735 1,711,374
CASH (BANK OVERDRAFT), END OF PERIOD 578,872 2,140,440
Interest paid(1) 4 759Interest received(1) 5,190 3,823Dividends received, net of withholding taxes(1) 177,574 183,111
(1) Classified as operating items.
The accompanying notes are an integral part of the financial statements. Portfolio Adviser: William Blair Investment Management, LLC
FOR
EIG
NE
QU
ITY
FUN
DS
64
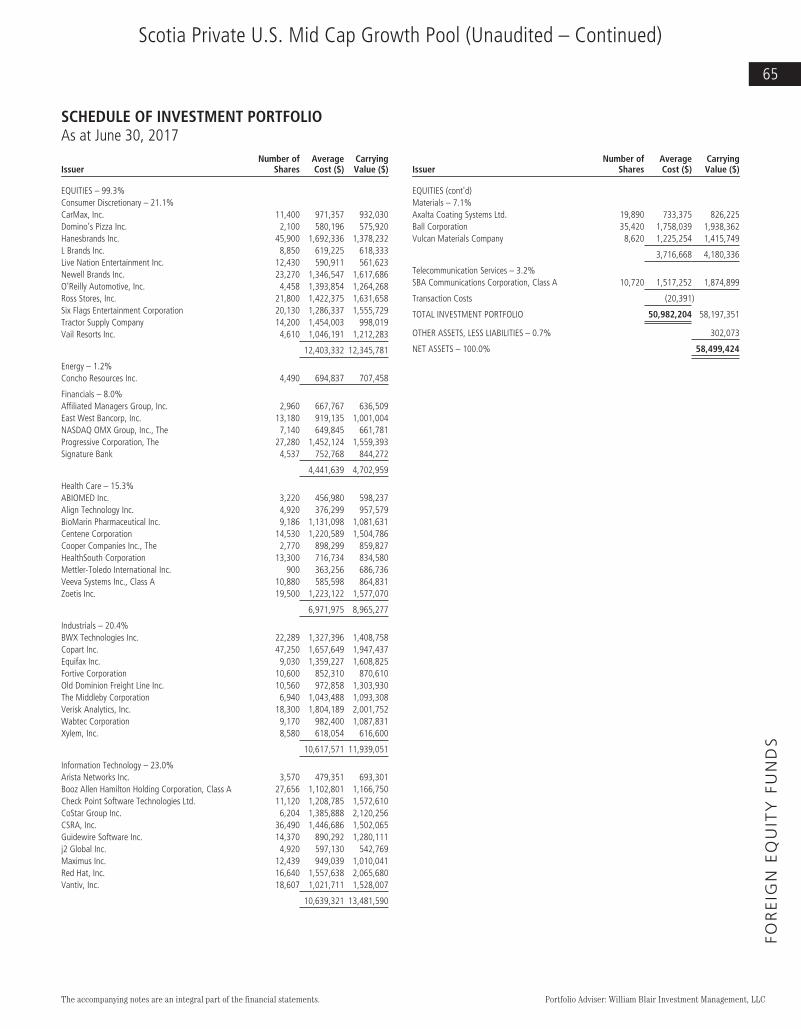
Scotia Private U.S. Mid Cap Growth Pool (Unaudited – Continued)
SCHEDULE OF INVESTMENT PORTFOLIOAs at June 30, 2017
IssuerNumber of
SharesAverageCost ($)
CarryingValue ($)
EQUITIES – 99.3%Consumer Discretionary – 21.1%CarMax, Inc. 11,400 971,357 932,030Domino’s Pizza Inc. 2,100 580,196 575,920Hanesbrands Inc. 45,900 1,692,336 1,378,232L Brands Inc. 8,850 619,225 618,333Live Nation Entertainment Inc. 12,430 590,911 561,623Newell Brands Inc. 23,270 1,346,547 1,617,686O’Reilly Automotive, Inc. 4,458 1,393,854 1,264,268Ross Stores, Inc. 21,800 1,422,375 1,631,658Six Flags Entertainment Corporation 20,130 1,286,337 1,555,729Tractor Supply Company 14,200 1,454,003 998,019Vail Resorts Inc. 4,610 1,046,191 1,212,283
12,403,332 12,345,781
Energy – 1.2%Concho Resources Inc. 4,490 694,837 707,458
Financials – 8.0%Affiliated Managers Group, Inc. 2,960 667,767 636,509East West Bancorp, Inc. 13,180 919,135 1,001,004NASDAQ OMX Group, Inc., The 7,140 649,845 661,781Progressive Corporation, The 27,280 1,452,124 1,559,393Signature Bank 4,537 752,768 844,272
4,441,639 4,702,959
Health Care – 15.3%ABIOMED Inc. 3,220 456,980 598,237Align Technology Inc. 4,920 376,299 957,579BioMarin Pharmaceutical Inc. 9,186 1,131,098 1,081,631Centene Corporation 14,530 1,220,589 1,504,786Cooper Companies Inc., The 2,770 898,299 859,827HealthSouth Corporation 13,300 716,734 834,580Mettler-Toledo International Inc. 900 363,256 686,736Veeva Systems Inc., Class A 10,880 585,598 864,831Zoetis Inc. 19,500 1,223,122 1,577,070
6,971,975 8,965,277
Industrials – 20.4%BWX Technologies Inc. 22,289 1,327,396 1,408,758Copart Inc. 47,250 1,657,649 1,947,437Equifax Inc. 9,030 1,359,227 1,608,825Fortive Corporation 10,600 852,310 870,610Old Dominion Freight Line Inc. 10,560 972,858 1,303,930The Middleby Corporation 6,940 1,043,488 1,093,308Verisk Analytics, Inc. 18,300 1,804,189 2,001,752Wabtec Corporation 9,170 982,400 1,087,831Xylem, Inc. 8,580 618,054 616,600
10,617,571 11,939,051
Information Technology – 23.0%Arista Networks Inc. 3,570 479,351 693,301Booz Allen Hamilton Holding Corporation, Class A 27,656 1,102,801 1,166,750Check Point Software Technologies Ltd. 11,120 1,208,785 1,572,610CoStar Group Inc. 6,204 1,385,888 2,120,256CSRA, Inc. 36,490 1,446,686 1,502,065Guidewire Software Inc. 14,370 890,292 1,280,111j2 Global Inc. 4,920 597,130 542,769Maximus Inc. 12,439 949,039 1,010,041Red Hat, Inc. 16,640 1,557,638 2,065,680Vantiv, Inc. 18,607 1,021,711 1,528,007
10,639,321 13,481,590
IssuerNumber of
SharesAverageCost ($)
CarryingValue ($)
EQUITIES (cont'd)Materials – 7.1%Axalta Coating Systems Ltd. 19,890 733,375 826,225Ball Corporation 35,420 1,758,039 1,938,362Vulcan Materials Company 8,620 1,225,254 1,415,749
3,716,668 4,180,336
Telecommunication Services – 3.2%SBA Communications Corporation, Class A 10,720 1,517,252 1,874,899
Transaction Costs (20,391)
TOTAL INVESTMENT PORTFOLIO 50,982,204 58,197,351
OTHER ASSETS, LESS LIABILITIES – 0.7% 302,073
NET ASSETS – 100.0% 58,499,424
The accompanying notes are an integral part of the financial statements. Portfolio Adviser: William Blair Investment Management, LLC
FOR
EIG
NE
QU
ITY
FUN
DS
65

Scotia Private U.S. Mid Cap Growth Pool (Unaudited – Continued)
FUND SPECIFIC NOTESFor the periods indicated in Note 1
The Fund (note 1)
The Fund’s investment objective is to achieve superior long termreturns through capital growth by investing primarily in stocks of smalland medium capitalization companies traded on U.S. stock exchanges.
Risks associated with financial instruments (note 4)
Interest rate risk
The majority of the Fund’s financial instruments were non-interestbearing as at June 30, 2017 and December 31, 2016. Accordingly, theFund is not directly subject to significant risk due to fluctuations inthe prevailing levels of market interest rates.
Currency risk
The Fund’s exposure to currency risk is summarized in the tablesbelow. Amounts shown are based on the carrying value of monetary andnon-monetary assets and liabilities of the Fund net of currencycontracts, as applicable.
June 30, 2017
CurrencyGross currencyexposure ($)
Currencycontracts ($)
Netexposure ($)
Percentage ofnet assets (%)
US Dollar 58,682,920 – 58,682,920 100.3
58,682,920 – 58,682,920 100.3
December 31, 2016
CurrencyGross currencyexposure ($)
Currencycontracts ($)
Netexposure ($)
Percentage ofnet assets (%)
US Dollar 58,325,879 – 58,325,879 100.0
58,325,879 – 58,325,879 100.0
If the Canadian dollar strengthened or weakened by 10% in relation toall other currencies, with all other variables held constant, net assetsof the Fund could possibly have decreased or increased, respectively,by $5,868,292 or 10.0% of net assets (December 31, 2016 – $5,832,588 or10.0%). In practice, actual results may differ from this sensitivityanalysis and the difference could be material.
Price risk
Price risk is the risk that the carrying value of financial instrumentswill fluctuate as a result of changes in market prices (other than thosearising from interest rate risk or currency risk) caused by factorsspecific to a security, its issuer or all factors affecting a market or amarket segment. Exposure to price risk is mainly in equities,underlying funds, derivatives and commodities, as applicable. As atJune 30, 2017, approximately 99.3% (December 31, 2016 – 99.1%) ofthe Fund’s net assets were exposed to price risk. If prices of theseinstruments had decreased or increased by 10%, with all othervariables held constant, net assets of the Fund would have decreasedor increased, respectively, by approximately $5,819,735(December 31, 2016 – $5,775,299). In practice, actual results maydiffer from this sensitivity analysis and the difference could bematerial.
Credit risk
The Fund had no significant exposure to bonds and debentures, moneymarket instruments or preferred shares as at June 30, 2017 orDecember 31, 2016.
Concentration risk
Concentration risk arises as a result of the concentration of exposureswithin the same category, geographical location, asset type or industrysector, as applicable. The table below is a summary of the Fund’sconcentration risk:
Percentage of net assets (%)
June 30, 2017 December 31, 2016
Consumer Discretionary 21.1 20.1Consumer Staples – 4.9Energy 1.2 0.9Financials 8.0 8.6Health Care 15.3 17.1Industrials 20.4 14.7Information Technology 23.0 25.2Materials 7.1 5.8Telecommunication Services 3.2 1.8
Fair Value Classification (note 2)
The tables below illustrate the classification of the Fund’s financialinstruments within the fair value hierarchy.
June 30, 2017Level 1
($)Level 2
($)Level 3
($)Total($)
Equities 58,197,351 – – 58,197,351
58,197,351 – – 58,197,351
December 31, 2016Level 1
($)Level 2
($)Level 3
($)Total($)
Equities 57,752,991 – – 57,752,991
57,752,991 – – 57,752,991
Transfers between levels
During the periods ended June 30, 2017 and December 31, 2016, therewere no significant transfers between Level 1 and Level 2.
Offsetting of financial assets and liabilities (note 2)
As at June 30, 2017 and December 31, 2016, the Fund did not enter intoany agreement whereby the financial instruments were eligible foroffset.
Interest in Underlying Funds (note 2)
The Fund did not hold any interest in Underlying Funds as at June 30,2017 or December 31, 2016.
Comparison of net asset value per unit and net assets per unit(note 2)
As at June 30, 2017 or December 31, 2016, there were no differencesbetween the net asset value per unit and the net assets per unit for anyseries of the Fund.
The accompanying notes are an integral part of the financial statements.
FOR
EIG
NE
QU
ITY
FUN
DS
66

Scotia Private U.S. Large Cap Growth Pool (Unaudited)
STATEMENTS OF FINANCIAL POSITIONAs at
(in dollars)June 30,
2017December 31,
2016
ASSETSCurrent assetsInvestments
Non-derivative financial assets 126,285,495 112,629,734Cash 6,662,081 4,344,816Subscriptions receivable 281,476 194,620Accrued investment income and other 59,825 62,571
133,288,877 117,231,741
LIABILITIESCurrent liabilitiesManagement fee payable 1,796 –Redemptions payable 176,530 54,281Accrued expenses 32,500 966
210,826 55,247
Net assets attributable to holders of redeemable units 133,078,051 117,176,494
NET ASSETS ATTRIBUTABLE TO HOLDERS OF REDEEMABLEUNITS PER SERIES
Pinnacle Series 125,996,190 109,331,325Series F 1,673,050 1,901,836Series I 5,408,811 5,943,333
NET ASSETS ATTRIBUTABLE TO HOLDERS OF REDEEMABLEUNITS PER UNIT
Pinnacle Series 21.58 19.21Series F 21.11 18.89Series I 21.72 19.32
STATEMENTS OF COMPREHENSIVE INCOMEFor the periods ended June 30 (note 1),(in dollars except average units) 2017 2016
INCOMENet gain (loss) on investments
Dividends 547,962 548,653Interest for distribution purposes 20,393 7,517Net realized gain (loss) on non-derivative financial assets 1,404,552 641,680Change in unrealized gain (loss) on non-derivative financial
assets 13,108,813 (9,537,309)
Net gain (loss) on investments 15,081,720 (8,339,459)Securities lending (note 11) 238 5,215Net realized and unrealized foreign currency translation gain
(loss) (249,219) (116,380)Other income 500 –
Total income (loss), net 14,833,239 (8,450,624)
EXPENSESManagement fees (note 5) 9,192 5,219Fixed administration fees (note 6) 164,147 124,459Independent Review Committee fees 576 563Foreign withholding taxes/tax reclaims 115,927 109,561Other fund costs – 17Harmonized Sales Tax/Goods and Services Tax 17,065 13,473Transaction costs 2,928 8,486
Total expenses 309,835 261,778
Increase (decrease) in net assets attributable to holders ofredeemable units from operations 14,523,404 (8,712,402)
INCREASE (DECREASE) IN NET ASSETS ATTRIBUTABLE TOHOLDERS OF REDEEMABLE UNITS FROM OPERATIONS PERSERIES
Pinnacle Series 13,630,519 (8,054,291)Series F 203,957 (101,159)Series I 688,928 (556,952)
INCREASE (DECREASE) IN NET ASSETS ATTRIBUTABLE TOHOLDERS OF REDEEMABLE UNITS FROM OPERATIONS PERUNIT†
Pinnacle Series 2.36 (1.62)Series F 2.24 (1.72)Series I 2.50 (1.66)
WEIGHTED AVERAGE NUMBER OF UNITS PER SERIESPinnacle Series 5,784,794 4,970,865Series F 90,892 58,889Series I 275,690 335,157
† The increase (decrease) in net assets attributable to holders of redeemable units fromoperations per unit is calculated by dividing the increase (decrease) in net assetsattributable to holders of redeemable units from operations per series by the weightedaverage number of units per series.
The accompanying notes are an integral part of the financial statements. Portfolio Adviser: Polen Capital Management
FOR
EIG
NE
QU
ITY
FUN
DS
67
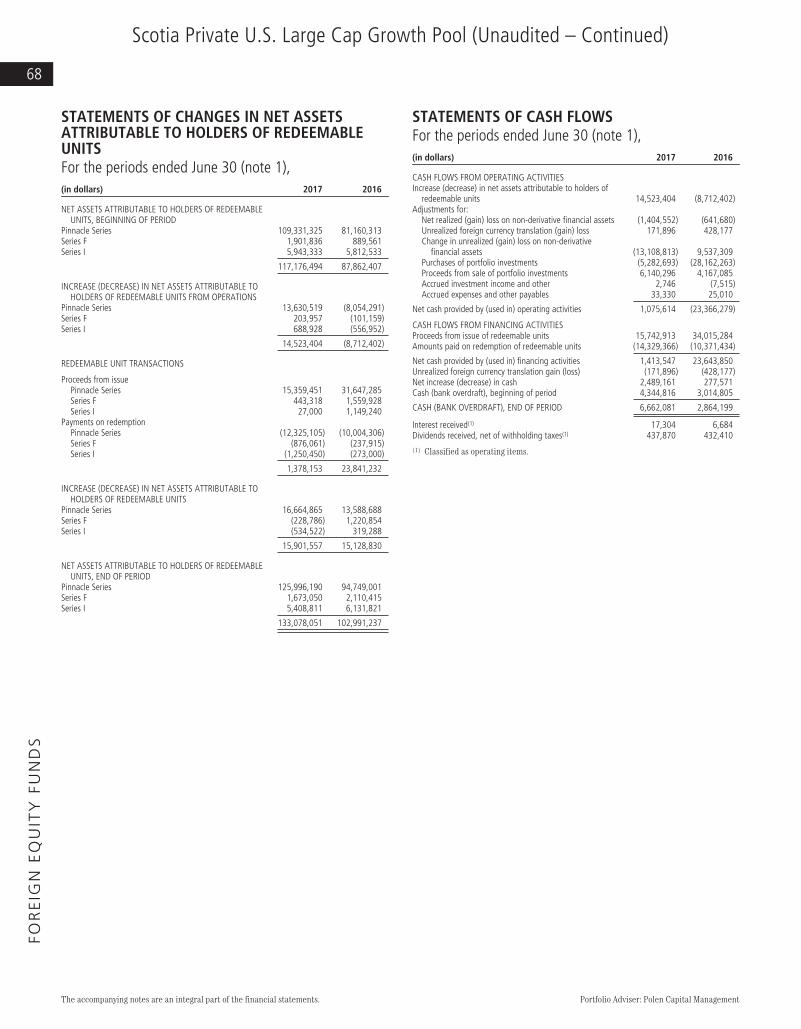
Scotia Private U.S. Large Cap Growth Pool (Unaudited – Continued)
STATEMENTS OF CHANGES IN NET ASSETSATTRIBUTABLE TO HOLDERS OF REDEEMABLEUNITSFor the periods ended June 30 (note 1),(in dollars) 2017 2016
NET ASSETS ATTRIBUTABLE TO HOLDERS OF REDEEMABLEUNITS, BEGINNING OF PERIOD
Pinnacle Series 109,331,325 81,160,313Series F 1,901,836 889,561Series I 5,943,333 5,812,533
117,176,494 87,862,407
INCREASE (DECREASE) IN NET ASSETS ATTRIBUTABLE TOHOLDERS OF REDEEMABLE UNITS FROM OPERATIONS
Pinnacle Series 13,630,519 (8,054,291)Series F 203,957 (101,159)Series I 688,928 (556,952)
14,523,404 (8,712,402)
REDEEMABLE UNIT TRANSACTIONS
Proceeds from issuePinnacle Series 15,359,451 31,647,285Series F 443,318 1,559,928Series I 27,000 1,149,240
Payments on redemptionPinnacle Series (12,325,105) (10,004,306)Series F (876,061) (237,915)Series I (1,250,450) (273,000)
1,378,153 23,841,232
INCREASE (DECREASE) IN NET ASSETS ATTRIBUTABLE TOHOLDERS OF REDEEMABLE UNITS
Pinnacle Series 16,664,865 13,588,688Series F (228,786) 1,220,854Series I (534,522) 319,288
15,901,557 15,128,830
NET ASSETS ATTRIBUTABLE TO HOLDERS OF REDEEMABLEUNITS, END OF PERIOD
Pinnacle Series 125,996,190 94,749,001Series F 1,673,050 2,110,415Series I 5,408,811 6,131,821
133,078,051 102,991,237
STATEMENTS OF CASH FLOWSFor the periods ended June 30 (note 1),(in dollars) 2017 2016
CASH FLOWS FROM OPERATING ACTIVITIESIncrease (decrease) in net assets attributable to holders of
redeemable units 14,523,404 (8,712,402)Adjustments for:
Net realized (gain) loss on non-derivative financial assets (1,404,552) (641,680)Unrealized foreign currency translation (gain) loss 171,896 428,177Change in unrealized (gain) loss on non-derivative
financial assets (13,108,813) 9,537,309Purchases of portfolio investments (5,282,693) (28,162,263)Proceeds from sale of portfolio investments 6,140,296 4,167,085Accrued investment income and other 2,746 (7,515)Accrued expenses and other payables 33,330 25,010
Net cash provided by (used in) operating activities 1,075,614 (23,366,279)
CASH FLOWS FROM FINANCING ACTIVITIESProceeds from issue of redeemable units 15,742,913 34,015,284Amounts paid on redemption of redeemable units (14,329,366) (10,371,434)
Net cash provided by (used in) financing activities 1,413,547 23,643,850Unrealized foreign currency translation gain (loss) (171,896) (428,177)Net increase (decrease) in cash 2,489,161 277,571Cash (bank overdraft), beginning of period 4,344,816 3,014,805
CASH (BANK OVERDRAFT), END OF PERIOD 6,662,081 2,864,199
Interest received(1) 17,304 6,684Dividends received, net of withholding taxes(1) 437,870 432,410
(1) Classified as operating items.
The accompanying notes are an integral part of the financial statements. Portfolio Adviser: Polen Capital Management
FOR
EIG
NE
QU
ITY
FUN
DS
68

Scotia Private U.S. Large Cap Growth Pool (Unaudited – Continued)
SCHEDULE OF INVESTMENT PORTFOLIOAs at June 30, 2017
IssuerNumber of
SharesAverageCost ($)
CarryingValue ($)
EQUITIES – 94.9%Consumer Discretionary – 22.1%Dollar General Corporation 38,692 4,100,822 3,616,323NIKE, Inc., Class B 100,372 5,320,943 7,677,779O’Reilly Automotive, Inc. 16,384 4,004,113 4,646,428Priceline Group Inc., The 2,720 3,889,650 6,596,329Starbucks Corporation 91,247 4,612,975 6,898,150
21,928,503 29,435,009
Consumer Staples – 4.2%Nestle S.A. – ADR 49,747 4,587,581 5,624,118
Health Care – 15.8%Align Technology Inc. 27,637 2,962,724 5,378,987Celgene Corporation 42,114 5,997,824 7,090,982Regeneron Pharmaceuticals, Inc. 13,336 6,052,535 8,491,843
15,013,083 20,961,812
Information Technology – 52.8%Accenture PLC, Class A 38,692 4,042,469 6,204,284Adobe Systems Incorporated 50,139 6,253,977 9,194,306Alphabet Inc., Class A 3,815 3,625,477 4,598,319Alphabet Inc., Class C 7,370 3,219,450 8,683,072Automatic Data Processing, Inc. 55,012 5,712,220 7,307,736Facebook Inc. 47,466 5,971,514 9,291,228Gartner Inc., Class A 32,551 2,897,900 5,212,397MasterCard, Inc., Class A 17,372 1,292,456 2,735,384Oracle Corporation 102,916 4,329,538 6,690,187Visa Inc. 85,106 6,050,049 10,347,643
43,395,050 70,264,556
Transaction Costs (16,680)
TOTAL INVESTMENT PORTFOLIO 84,907,537 126,285,495
OTHER ASSETS, LESS LIABILITIES – 5.1% 6,792,556
NET ASSETS – 100.0% 133,078,051
The accompanying notes are an integral part of the financial statements. Portfolio Adviser: Polen Capital Management
FOR
EIG
NE
QU
ITY
FUN
DS
69

Scotia Private U.S. Large Cap Growth Pool (Unaudited – Continued)
FUND SPECIFIC NOTESFor the periods indicated in Note 1
The Fund (note 1)
The Fund’s investment objective is to achieve superior long termreturns through capital growth by investing primarily in largecapitalization stocks of U.S. corporations.
Risks associated with financial instruments (note 4)
Interest rate risk
The majority of the Fund’s financial instruments were non-interestbearing as at June 30, 2017 and December 31, 2016. Accordingly, theFund is not directly subject to significant risk due to fluctuations inthe prevailing levels of market interest rates.
Currency risk
The Fund’s exposure to currency risk is summarized in the tablesbelow. Amounts shown are based on the carrying value of monetary andnon-monetary assets and liabilities of the Fund net of currencycontracts, as applicable.
June 30, 2017
CurrencyGross currencyexposure ($)
Currencycontracts ($) Net exposure ($)
Percentage ofnet assets (%)
US Dollar 132,854,137 – 132,854,137 99.8
132,854,137 – 132,854,137 99.8
December 31, 2016
CurrencyGross currencyexposure ($)
Currencycontracts ($) Net exposure ($)
Percentage ofnet assets (%)
US Dollar 116,823,420 – 116,823,420 99.7
116,823,420 – 116,823,420 99.7
If the Canadian dollar strengthened or weakened by 10% in relation toall other currencies, with all other variables held constant, net assetsof the Fund could possibly have decreased or increased, respectively,by $13,285,414 or 10.0% of net assets (December 31, 2016 – $11,682,342or 10.0%). In practice, actual results may differ from this sensitivityanalysis and the difference could be material.
Price risk
Price risk is the risk that the carrying value of financial instrumentswill fluctuate as a result of changes in market prices (other than thosearising from interest rate risk or currency risk) caused by factorsspecific to a security, its issuer or all factors affecting a market or amarket segment. Exposure to price risk is mainly in equities,underlying funds, derivatives and commodities, as applicable. As atJune 30, 2017, approximately 94.9% (December 31, 2016 – 96.1%) ofthe Fund’s net assets were exposed to price risk. If prices of theseinstruments had decreased or increased by 10%, with all othervariables held constant, net assets of the Fund would have decreasedor increased, respectively, by approximately $12,628,550(December 31, 2016 – $11,262,973). In practice, actual results maydiffer from this sensitivity analysis and the difference could bematerial.
Credit risk
The Fund had no significant exposure to bonds and debentures, moneymarket instruments or preferred shares as at June 30, 2017 orDecember 31, 2016.
Concentration risk
Concentration risk arises as a result of the concentration of exposureswithin the same category, geographical location, asset type or industrysector, as applicable. The table below is a summary of the Fund’sconcentration risk:
Percentage of net assets (%)
June 30, 2017 December 31, 2016
Consumer Discretionary 22.1 28.3Consumer Staples 4.2 4.0Health Care 15.8 13.9Information Technology 52.8 49.9
Fair Value Classification (note 2)
The tables below illustrate the classification of the Fund’s financialinstruments within the fair value hierarchy.
June 30, 2017Level 1
($)Level 2
($)Level 3
($)Total($)
Equities 126,285,495 – – 126,285,495
126,285,495 – – 126,285,495
December 31, 2016Level 1
($)Level 2
($)Level 3
($)Total($)
Equities 112,629,734 – – 112,629,734
112,629,734 – – 112,629,734
Transfers between levels
During the periods ended June 30, 2017 and December 31, 2016, therewere no significant transfers between Level 1 and Level 2.
Offsetting of financial assets and liabilities (note 2)
As at June 30, 2017 and December 31, 2016, the Fund did not enter intoany agreement whereby the financial instruments were eligible foroffset.
Interest in Underlying Funds (note 2)
The Fund did not hold any interest in Underlying Funds as at June 30,2017 or December 31, 2016.
The accompanying notes are an integral part of the financial statements.
FOR
EIG
NE
QU
ITY
FUN
DS
70

Scotia Private U.S. Large Cap Growth Pool (Unaudited – Continued)
FUND SPECIFIC NOTESFor the periods indicated in Note 1
Comparison of net asset value per unit and net assets per unit(note 2)
The table below provides a comparison of the net asset value per unitand net assets per unit. A difference could arise when the last tradedmarket price for a financial instrument is not within the bid-ask spread(note 2).
June 30, 2017 December 31, 2016
Net asset valueper unit
($)
Net assetsper unit
($)
Net asset valueper unit
($)
Net assetsper unit
($)
Pinnacle Series 21.58 21.58 19.20 19.21Series F 21.11 21.11 18.88 18.89Series I 21.72 21.72 19.31 19.32
The accompanying notes are an integral part of the financial statements.
FOR
EIG
NE
QU
ITY
FUN
DS
71

Scotia Private International Equity Pool (Unaudited)
STATEMENTS OF FINANCIAL POSITIONAs at
(in dollars)June 30,
2017December 31,
2016
ASSETSCurrent assetsInvestments
Non-derivative financial assets 1,187,669,072 1,112,343,479Cash 6,632,236 3,811,201Subscriptions receivable 816,339 313,347Accrued investment income and other 3,038,507 947,705
1,198,156,154 1,117,415,732
LIABILITIESCurrent liabilitiesManagement fee payable 1,086 –Payable for securities purchased 1,275,707 –Redemptions payable 267,259 110,072Accrued expenses 78,044 2,335
1,622,096 112,407
Net assets attributable to holders of redeemable units 1,196,534,058 1,117,303,325
NET ASSETS ATTRIBUTABLE TO HOLDERS OFREDEEMABLE UNITS PER SERIES
Pinnacle Series 178,002,538 157,844,724Series F 1,216,601 1,195,624Series I 1,017,314,919 958,262,977
NET ASSETS ATTRIBUTABLE TO HOLDERS OFREDEEMABLE UNITS PER UNIT
Pinnacle Series 13.12 11.86Series F 13.23 12.04Series I 13.51 12.21
STATEMENTS OF COMPREHENSIVE INCOMEFor the periods ended June 30 (note 1),(in dollars except average units) 2017 2016
INCOMENet gain (loss) on investments
Dividends 25,513,432 22,415,062Interest for distribution purposes 131,706 93,625Net realized gain (loss) on non-derivative financial
assets 32,126,330 (13,878,497)Change in unrealized gain (loss) on non-derivative
financial assets 67,344,619 (105,555,717)Change in unrealized gain (loss) on currency spots
contracts – (6,539)
Net gain (loss) on investments 125,116,087 (96,932,066)Securities lending (note 11) 110,343 114,169Net realized and unrealized foreign currency translation
gain (loss) (118,183) (318,483)Other income 1,020 –
Total income (loss), net 125,109,267 (97,136,380)
EXPENSESManagement fees (note 5) 6,052 6,416Fixed administration fees (note 6) 404,327 313,151Independent Review Committee fees 576 563Interest expense and bank overdraft charges 7,204 245Foreign withholding taxes/tax reclaims 3,921,376 3,838,757Other fund costs – 167Harmonized Sales Tax/Goods and Services Tax 41,204 32,334Transaction costs 304,387 300,282
Total expenses 4,685,126 4,491,915
Increase (decrease) in net assets attributable to holders ofredeemable units from operations 120,424,141 (101,628,295)
INCREASE (DECREASE) IN NET ASSETS ATTRIBUTABLE TOHOLDERS OF REDEEMABLE UNITS FROM OPERATIONSPER SERIES
Pinnacle Series 16,666,196 (12,226,929)Series F 119,222 (144,511)Series I 103,638,723 (89,256,855)
INCREASE (DECREASE) IN NET ASSETS ATTRIBUTABLE TOHOLDERS OF REDEEMABLE UNITS FROM OPERATIONSPER UNIT†
Pinnacle Series 1.24 (1.14)Series F 1.26 (1.29)Series I 1.34 (1.26)
WEIGHTED AVERAGE NUMBER OF UNITS PER SERIESPinnacle Series 13,396,393 10,771,807Series F 94,907 111,728Series I 77,422,291 70,967,319
† The increase (decrease) in net assets attributable to holders of redeemable units fromoperations per unit is calculated by dividing the increase (decrease) in net assetsattributable to holders of redeemable units from operations per series by the weightedaverage number of units per series.
The accompanying notes are an integral part of the financial statements. Portfolio Adviser: Strategic Global Advisors, LLC
FOR
EIG
NE
QU
ITY
FUN
DS
72

Scotia Private International Equity Pool (Unaudited – Continued)
STATEMENTS OF CHANGES IN NET ASSETSATTRIBUTABLE TO HOLDERS OF REDEEMABLEUNITSFor the periods ended June 30 (note 1),(in dollars) 2017 2016
NET ASSETS ATTRIBUTABLE TO HOLDERS OFREDEEMABLE UNITS, BEGINNING OF PERIOD
Pinnacle Series 157,844,724 95,632,049Series F 1,195,624 1,309,159Series I 958,262,977 864,620,305
1,117,303,325 961,561,513
INCREASE (DECREASE) IN NET ASSETS ATTRIBUTABLETO HOLDERS OF REDEEMABLE UNITS FROMOPERATIONS
Pinnacle Series 16,666,196 (12,226,929)Series F 119,222 (144,511)Series I 103,638,723 (89,256,855)
120,424,141 (101,628,295)
REDEEMABLE UNIT TRANSACTIONSProceeds from issue
Pinnacle Series 20,475,637 58,982,566Series F 112,465 265,765Series I 23,188,900 95,030,864
Payments on redemptionPinnacle Series (16,984,019) (7,438,902)Series F (210,710) (77,577)Series I (67,775,681) (21,123,450)
(41,193,408) 125,639,266
INCREASE (DECREASE) IN NET ASSETS ATTRIBUTABLETO HOLDERS OF REDEEMABLE UNITS
Pinnacle Series 20,157,814 39,316,735Series F 20,977 43,677Series I 59,051,942 (15,349,441)
79,230,733 24,010,971
NET ASSETS ATTRIBUTABLE TO HOLDERS OFREDEEMABLE UNITS, END OF PERIOD
Pinnacle Series 178,002,538 134,948,784Series F 1,216,601 1,352,836Series I 1,017,314,919 849,270,864
1,196,534,058 985,572,484
STATEMENTS OF CASH FLOWSFor the periods ended June 30 (note 1),(in dollars) 2017 2016
CASH FLOWS FROM OPERATING ACTIVITIESIncrease (decrease) in net assets attributable to holders of
redeemable units 120,424,141 (101,628,295)Adjustments for:
Net realized (gain) loss on non-derivative financialassets (32,126,330) 13,878,497
Unrealized foreign currency translation (gain) loss 81,351 134,314Change in unrealized (gain) loss on non-derivative
financial assets (67,344,619) 105,555,717Change in unrealized (gain) loss on currency spot
contracts – 6,539Non-cash transactions (717,076) –Purchases of portfolio investments (337,602,944) (417,179,932)Proceeds from sale of portfolio investments 363,741,083 274,798,170Accrued investment income and other (2,090,802) (1,660,500)Accrued expenses and other payables 76,795 61,383
Net cash provided by (used in) operating activities 44,441,599 (126,034,107)
CASH FLOWS FROM FINANCING ACTIVITIESProceeds from issue of redeemable units 43,274,010 152,388,058Amounts paid on redemption of redeemable units (84,813,223) (28,585,002)
Net cash provided by (used in) financing activities (41,539,213) 123,803,056Unrealized foreign currency translation gain (loss) (81,351) (134,314)Net increase (decrease) in cash 2,902,386 (2,231,051)Cash (bank overdraft), beginning of period 3,811,201 6,547,106
CASH (BANK OVERDRAFT), END OF PERIOD 6,632,236 4,181,741
Interest paid(1) 7,204 245Interest received(1) 131,035 94,879Dividends received, net of withholding taxes(1) 18,784,848 16,914,553
(1) Classified as operating items.
The accompanying notes are an integral part of the financial statements. Portfolio Adviser: Strategic Global Advisors, LLC
FOR
EIG
NE
QU
ITY
FUN
DS
73

Scotia Private International Equity Pool (Unaudited – Continued)
SCHEDULE OF INVESTMENT PORTFOLIOAs at June 30, 2017
IssuerNumber of
SharesAverageCost ($)
CarryingValue ($)
EQUITIES – 99.3%Australia – 5.9%Aristocrat Leisure Ltd. 567,734 10,080,856 12,753,338Commonwealth Bank of Australia 43,083 3,629,445 3,555,331Dexus Property Group 290,789 2,854,987 2,744,802Fortescue Metals Group Ltd. 943,287 6,210,346 4,898,340Harvey Norman Holdings Limited 1,002,850 4,165,968 3,815,101Lend Lease Group 550,269 8,215,988 9,130,197Macquarie Group Ltd. 180,565 12,885,984 15,924,858Ramsay Health Care Limited 60,078 4,125,052 4,410,227Rio Tinto Limited 167,095 10,550,233 10,521,374Westpac Banking Corporation 107,834 3,573,593 3,263,040
66,292,452 71,016,608
Austria – 0.8%ANDRITZ AG 66,230 4,608,289 5,174,911OMV AG 67,119 3,168,028 4,520,436
7,776,317 9,695,347
Belgium – 1.6%KBC Groep SA NV 135,495 11,556,906 13,325,231UCB SA 65,970 6,057,643 5,881,282
17,614,549 19,206,513
Brazil – 0.2%Cia de Saneamento Basico do Estado de Sao Paulo 195,000 2,179,612 2,416,510
Denmark – 3.3%Danske Bank A/S 376,526 14,989,614 18,835,215Pandora A/S 71,123 7,143,108 8,641,204Novo Nordisk A/S, Class B 87,541 4,913,673 4,866,177Vestas Wind Systems A/S 55,865 5,511,205 6,707,642
32,557,600 39,050,238
Finland – 1.7%Neste Oyj 199,792 7,143,973 10,210,519UPM-Kymmene Oyj 279,849 6,366,620 10,339,958
13,510,593 20,550,477
France – 9.8%Atos SE 55,178 5,229,850 10,030,099AXA SA 323,199 9,813,289 11,539,384BNP Paribas 59,990 4,688,488 5,652,618Klepierre 267,600 15,979,408 14,211,492L’Oreal SA 41,091 9,700,796 11,095,020LVMH Moet Hennessy Louis Vuitton SA 16,024 3,819,654 5,207,768Renault SA 35,406 4,071,344 4,160,988Safran SA 142,854 11,080,301 16,975,806Sanofi 157,929 19,278,085 19,664,629Thales SA 65,008 5,978,955 9,073,679TOTAL SA 39,696 2,680,237 2,548,037Valeo SA 74,069 4,566,174 6,509,166
96,886,581 116,668,686
Germany – 8.0%Allianz SE 54,457 11,649,983 13,903,292Bayer AG 39,389 5,366,305 6,602,397Bayerische Motoren Werke AG 82,384 12,013,957 9,934,127Continental AG 34,601 9,809,805 9,673,907Covestro AG 124,571 10,546,761 11,653,698Daimler AG 38,299 4,402,799 3,599,417Deutsche Telekom AG 158,921 3,695,546 3,700,126HeidelbergCement AG 48,997 5,089,332 6,142,323Hochtief AG 37,322 6,195,907 8,865,387RWE AG 166,620 4,079,051 4,304,396SAP SE 65,861 7,084,653 8,918,055Siemens AG 48,093 8,627,641 8,566,858
88,561,740 95,863,983
IssuerNumber of
SharesAverageCost ($)
CarryingValue ($)
EQUITIES (cont'd)Hong Kong – 2.3%Galaxy Entertainment Group Ltd. 624,000 4,515,290 4,912,460HKT Trust and HKT Ltd. 2,677,000 4,802,513 4,552,589Hongkong Electric Holdings Limited 405,500 5,210,523 4,640,080Nine Dragons Paper Holdings Ltd. 1,950,000 2,938,196 3,369,636WH Group Ltd. 7,359,000 7,826,891 9,630,907
25,293,413 27,105,672
Hungary – 0.2%MOL Hungarian Oil & Gas PLC 23,787 1,953,890 2,427,566
Ireland – 0.4%Kerry Group PLC 43,333 4,145,272 4,830,032
Italy – 1.9%Ferrari NV 107,325 6,283,151 11,981,338Prysmian SpA 157,325 4,435,389 6,016,147Telecom Italia SpA 4,421,000 6,057,200 5,308,262
16,775,740 23,305,747
Japan – 24.6%Amada Holdings Co Ltd. 196,900 2,728,200 2,955,563Asahi Breweries, Ltd. 152,800 6,038,187 7,458,264Asahi Glass Co., Ltd. 95,000 5,239,710 5,197,688Astellas Pharma Inc. 151,400 3,090,792 2,403,304Bandai Namco Holdings Inc. 157,800 6,061,050 6,980,873Central Japan Railway Company 63,000 13,614,410 13,326,033Daito Trust Construction Co., Ltd. 12,800 1,825,264 2,582,519Fuji Electric Holdings Co., Ltd. 1,800,000 9,747,089 12,334,268Fuji Heavy Industries Ltd. 75,500 3,341,551 3,308,428FUJIFILM Holdings Corporation 153,100 6,999,410 7,144,905Fujitsu Ltd. 500,000 4,825,646 4,785,639Hitachi Chemical Co., Ltd. 223,200 5,034,296 8,650,255Hitachi Metals Ltd. 170,600 3,315,270 3,086,694Hoya Corporation 187,300 11,381,279 12,646,670JTEKT Corporation 168,600 3,586,880 3,208,923JX Holdings Inc 1,790,000 11,480,786 10,153,570Kajima Corporation 463,000 4,205,447 5,068,655Kao Corporation 186,700 10,586,445 14,386,377KDDI Corporation 347,600 10,077,307 11,938,484Kirin Holdings Co., Ltd. 198,100 4,265,856 5,236,698MEIJI Holdings Co., Ltd. 38,300 5,120,245 4,027,217Mitsubishi Corporation 434,500 12,989,623 11,833,376Mitsubishi Electric Corporation 505,900 7,544,458 9,459,974Mitsubishi Tanabe Pharma Corporation 374,900 8,640,839 11,257,402Mixi Inc. 63,300 5,184,627 4,551,532MS & AD Insurance Group Holdings, Inc. 127,300 5,432,565 5,564,655Nippon Telegraph and Telephone Corporation 56,100 2,931,093 3,440,431NTT DoCoMo, Inc. 254,800 8,266,966 7,797,571Obayashi Corporation 456,300 6,642,274 6,963,150ORIX Corporation 403,300 6,155,471 8,127,272Shimizu Corporation 323,000 3,883,806 4,445,531Shionogi & Co., Ltd. 224,900 10,824,155 16,263,680Sumitomo Chemical Co., Ltd. 1,764,000 12,155,834 13,191,519Suruga Bank Ltd. 198,800 4,680,000 6,262,822Teijin Ltd. 164,700 3,791,715 4,112,281Toho Co Ltd. 91,600 3,537,539 3,660,182Tohoku Electric Power Company Inc. 187,700 3,191,920 3,371,155Tokyo Electron Ltd. 34,700 4,154,736 6,094,526Toyota Motor Corporation 152,670 10,519,201 10,382,287Yamaha Corporation 242,800 8,906,761 10,895,886
261,998,703 294,556,259
Mexico – 0.2%Gruma, S.A.B. de C.V. 172,373 2,692,659 2,915,213
The accompanying notes are an integral part of the financial statements. Portfolio Adviser: Strategic Global Advisors, LLC
FOR
EIG
NE
QU
ITY
FUN
DS
74

Scotia Private International Equity Pool (Unaudited – Continued)
SCHEDULE OF INVESTMENT PORTFOLIOAs at June 30, 2017
IssuerNumber of
SharesAverageCost ($)
CarryingValue ($)
EQUITIES (cont'd)Netherlands – 1.6%ABN AMRO Group NV 193,065 5,174,353 6,683,664Koninklijke Ahold Delhaize NV 272,096 6,831,350 6,756,616Randstand Holding NV 79,346 6,138,799 6,011,173
18,144,502 19,451,453
Norway – 0.8%Marine Harvest ASA 207,493 4,476,622 4,604,603Orkla ASA 341,557 4,067,878 4,503,888
8,544,500 9,108,491
Singapore – 1.2%DBS Group Holdings Limited 722,900 12,302,276 14,123,900
South Africa – 0.7%FirstRand Limited 982,502 5,428,542 4,588,648Nedbank Group Ltd. 203,816 5,419,587 4,215,341
10,848,129 8,803,989
South Korea – 2.0%KB Financial Group Inc. 158,015 7,903,606 10,316,388Samsung Electronics Co., Ltd. 3,157 6,369,123 8,492,857SK Telecom Co., Ltd. 15,170 4,403,794 4,566,193
18,676,523 23,375,438
Spain – 2.8%Aena S.A. 50,601 8,496,666 12,809,046Amadeus IT Holding S.A., Class A 53,522 2,899,113 4,148,002Red Electrica Corporation S.A. 276,104 7,416,820 7,490,648Repsol S.A. 429,548 8,707,502 8,537,273
27,520,101 32,984,969
Sweden – 2.3%Atlas Copco AB, Class A 173,856 5,900,471 8,677,752Hexagon AB 124,665 5,745,614 7,685,066Skandinaviska Enskilda Banken AB 700,954 10,503,317 11,026,618
22,149,402 27,389,436
Switzerland – 7.0%Idorsia Ltd. 52,784 717,076 1,291,347Lonza Group AG 42,959 11,391,896 12,041,382Nestle SA 131,512 12,758,562 14,848,032Novartis AG 24,669 2,514,347 2,670,055Partners Group Holding AG 13,059 7,271,379 10,493,587Roche Holdings AG 14,515 4,784,929 4,803,577Swiss Life Holding AG 33,810 9,738,556 14,804,560Swiss Re Ltd. 140,616 16,649,641 16,696,263Swisscom AG 10,321 6,362,492 6,459,864
72,188,878 84,108,667
United Kingdom – 15.4%3i Group PLC 1,379,479 13,168,770 21,045,105Auto Trader Group PLC 955,724 6,110,881 6,131,684Barclays PLC 2,741,304 10,341,218 9,399,827Carnival PLC 71,294 4,351,323 6,116,854Diageo PLC 144,721 5,452,335 5,543,417GlaxoSmithKline PLC 781,366 21,503,928 21,566,445Glencore PLC 881,065 3,946,507 4,285,035HSBC Holdings PLC 536,397 6,065,579 6,451,376Intertek Group PLC 114,166 7,171,304 8,136,338Johnson Matthey PLC 137,125 7,739,390 6,646,211Lloyds Banking Group PLC 10,204,918 12,277,345 11,413,133Mondi PLC 81,536 1,939,980 2,772,601Persimmon PLC 263,643 8,756,860 9,980,267Petrofac Limited 806,371 12,713,320 6,032,154Reckitt Benkiser Group PLC 91,925 9,137,362 12,085,396RELX PLC 348,182 7,675,133 9,763,005
IssuerNumber of
SharesAverageCost ($)
CarryingValue ($)
EQUITIES (cont'd)United Kingdom (cont'd)Unilever PLC 299,459 16,870,527 21,017,979WPP Group PLC 562,194 16,616,998 15,326,890
171,838,760 183,713,717
United States – 4.6%ICON PLC 30,900 3,707,584 3,917,635International Game Technology PLC 86,982 2,769,706 2,063,724iShares MSCI EAFE ETF 282,788 24,893,999 23,904,497Itau Unibanco Holding S.A. – ADR 348,749 4,248,518 4,996,274NetEase, Inc. 27,919 5,778,041 10,881,862Taro Pharmaceutical Industries Ltd. 27,474 5,584,606 3,991,568Ternium S.A. – ADR 144,009 4,164,590 5,244,601
51,147,044 55,000,161
Transaction Costs (483,323)
TOTAL INVESTMENT PORTFOLIO 1,051,115,913 1,187,669,072
OTHER ASSETS, LESS LIABILITIES – 0.7% 8,864,986
NET ASSETS – 100.0% 1,196,534,058
The accompanying notes are an integral part of the financial statements. Portfolio Adviser: Strategic Global Advisors, LLC
FOR
EIG
NE
QU
ITY
FUN
DS
75

Scotia Private International Equity Pool (Unaudited – Continued)
FUND SPECIFIC NOTESFor the periods indicated in Note 1
The Fund (note 1)
The Fund’s investment objective is to achieve long term returnsthrough capital growth by investing primarily in large capitalizationstocks of companies in Europe, Australia and the Far East.
Risks associated with financial instruments (note 4)
Interest rate risk
The majority of the Fund’s financial instruments were non-interestbearing as at June 30, 2017 and December 31, 2016. Accordingly, theFund is not directly subject to significant risk due to fluctuations inthe prevailing levels of market interest rates.
Currency risk
The Fund’s exposure to currency risk is summarized in the tablesbelow. Amounts shown are based on the carrying value of monetary andnon-monetary assets and liabilities of the Fund net of currencycontracts, as applicable.
June 30, 2017
CurrencyGross currencyexposure ($)
Currencycontracts ($)
Netexposure ($)
Percentage ofnet assets (%)
Euro 343,044,928 – 343,044,928 28.7Japanese Yen 295,536,635 – 295,536,635 24.7British Pound 185,431,588 – 185,431,588 15.5Swiss Franc 84,108,667 – 84,108,667 7.0Australian Dollar 71,652,364 – 71,652,364 6.0US Dollar 55,002,002 – 55,002,002 4.6Danish Krone 39,050,238 – 39,050,238 3.3Swedish Krona 27,389,436 – 27,389,436 2.3Hong Kong Dollar 27,105,671 – 27,105,671 2.3South Korean Won 23,375,438 – 23,375,438 2.0Singapore Dollar 14,123,900 – 14,123,900 1.2Norwegian Krone 9,108,490 – 9,108,490 0.8South African Rand 8,803,989 – 8,803,989 0.7Mexican Peso 2,915,213 – 2,915,213 0.2Hungary Forint 2,427,566 – 2,427,566 0.2Brazilian Real 2,416,510 – 2,416,510 0.2Taiwan Dollar 522,717 – 522,717 0.0
1,192,015,352 – 1,192,015,352 99.7
December 31, 2016
CurrencyGross currencyexposure ($)
Currencycontracts ($)
Netexposure ($)
Percentage ofnet assets (%)
Euro 313,023,383 – 313,023,383 28.0Japanese Yen 258,814,020 – 258,814,020 23.2British Pound 180,839,015 – 180,839,015 16.2Swiss Franc 89,538,047 – 89,538,047 8.0Australian Dollar 62,606,917 – 62,606,917 5.6US Dollar 48,440,951 – 48,440,951 4.3Danish Krone 38,252,733 – 38,252,733 3.4Swedish Krona 28,716,041 – 28,716,041 2.6Hong Kong Dollar 23,346,841 – 23,346,841 2.1South African Rand 13,367,351 – 13,367,351 1.2Singapore Dollar 12,045,240 – 12,045,240 1.1Israel Shekel 9,519,785 – 9,519,785 0.9Mexican Peso 8,558,624 – 8,558,624 0.8South Korean Won 6,386,802 – 6,386,802 0.6Thai Baht 5,128,249 – 5,128,249 0.5Taiwan Dollar 4,896,401 – 4,896,401 0.4Norwegian Krone 4,320,976 – 4,320,976 0.4Brazilian Real 2,367,048 – 2,367,048 0.2Hungary Forint 2,334,257 – 2,334,257 0.2
1,112,502,681 – 1,112,502,681 99.7
If the Canadian dollar strengthened or weakened by 10% in relation toall other currencies, with all other variables held constant, net assetsof the Fund could possibly have decreased or increased, respectively,by $119,201,535 or 10.0% of net assets (December 31, 2016 –$111,250,268 or 10.0%). In practice, actual results may differ from thissensitivity analysis and the difference could be material.
Price risk
Price risk is the risk that the carrying value of financial instrumentswill fluctuate as a result of changes in market prices (other than thosearising from interest rate risk or currency risk) caused by factorsspecific to a security, its issuer or all factors affecting a market or amarket segment. Exposure to price risk is mainly in equities,underlying funds, derivatives and commodities, as applicable. As atJune 30, 2017, approximately 99.3% (December 31, 2016 – 99.6%) ofthe Fund’s net assets were exposed to price risk. If prices of theseinstruments had decreased or increased by 10%, with all othervariables held constant, net assets of the Fund would have decreasedor increased, respectively, by approximately $118,766,907(December 31, 2016 – $111,234,348). In practice, actual results maydiffer from this sensitivity analysis and the difference could bematerial.
Credit risk
The Fund had no significant exposure to bonds and debentures, moneymarket instruments or preferred shares as at June 30, 2017 orDecember 31, 2016.
Concentration risk
Concentration risk arises as a result of the concentration of exposureswithin the same category, geographical location, asset type or industrysector, as applicable. The table below is a summary of the Fund’sconcentration risk:
Percentage of net assets (%)
June 30, 2017 December 31, 2016
Australia 5.9 5.6Austria 0.8 2.0Belgium 1.6 0.4Brazil 0.2 0.2Denmark 3.3 3.4Finland 1.7 2.3France 9.8 9.6Germany 8.0 7.6Hong Kong 2.3 2.1Hungary 0.2 –Ireland 0.4 0.4Israel – 0.9Italy 1.9 1.3Japan 24.6 22.8Mexico 0.2 0.8Netherlands 1.6 2.0Norway 0.8 0.4Portugal – 0.4Singapore 1.2 1.4South Africa 0.7 1.2South Korea 2.0 0.6Spain 2.8 1.9Sweden 2.3 2.6Switzerland 7.0 8.0Taiwan – 0.4Thailand – 0.5United Kingdom 15.4 16.3United States 4.6 4.3
The accompanying notes are an integral part of the financial statements.
FOR
EIG
NE
QU
ITY
FUN
DS
76

Scotia Private International Equity Pool (Unaudited – Continued)
FUND SPECIFIC NOTESFor the periods indicated in Note 1
Fair Value Classification (note 2)
The tables below illustrate the classification of the Fund’s financialinstruments within the fair value hierarchy.
June 30, 2017Level 1
($)Level 2
($)Level 3
($)Total($)
Equities 60,331,884 1,127,337,188 – 1,187,669,072
60,331,884 1,127,337,188 – 1,187,669,072
December 31, 2016Level 1
($)Level 2
($)Level 3
($)Total($)
Equities 56,999,575 1,055,343,904 – 1,112,343,479
56,999,575 1,055,343,904 – 1,112,343,479
Transfers between levels
During the periods ended June 30, 2017 and December 31, 2016, therewere no significant transfers between Level 1 and Level 2.
Offsetting of financial assets and liabilities (note 2)
As at June 30, 2017 and December 31, 2016, the Fund did not enter intoany agreement whereby the financial instruments were eligible foroffset.
Interest in Underlying Funds (note 2)
The following tables present the percentage of the Underlying Fundsowned by the Fund.
June 30, 2017
Underlying Fund
Carrying value ofthe Underlying Fund
($)
Ownership percentagein Underlying Fund
(%)
iShares MSCI EAFE ETF 23,904,497 0.0
23,904,497
December 31, 2016
Underlying Fund
Carrying value ofthe Underlying Fund
($)
Ownership percentagein Underlying Fund
(%)
iShares MSCI EAFE ETF 22,113,728 0.0
22,113,728
Comparison of net asset value per unit and net assets per unit(note 2)
As at June 30, 2017 or December 31, 2016, there were no differencesbetween the net asset value per unit and the net assets per unit for anyseries of the Fund.
The accompanying notes are an integral part of the financial statements.
FOR
EIG
NE
QU
ITY
FUN
DS
77

Scotia Private International Small to Mid Cap Value Pool (Unaudited)
STATEMENTS OF FINANCIAL POSITIONAs at
(in dollars)June 30,
2017December 31,
2016
ASSETSCurrent assetsInvestments
Non-derivative financial assets 67,314,548 58,561,359Unrealized gain on currency spot contracts 38 –
Cash 728,960 466,477Receivable for securities sold 44,179 7,272Subscriptions receivable 143,726 104,454Accrued investment income and other 88,739 52,270
68,320,190 59,191,832
LIABILITIESCurrent liabilitiesManagement fee payable 677 –Payable for securities purchased 149,318 –Redemptions payable 258,326 21,118Accrued expenses 31,096 878Distributions payable – 73
439,417 22,069
Net assets attributable to holders of redeemable units 67,880,773 59,169,763
NET ASSETS ATTRIBUTABLE TO HOLDERS OF REDEEMABLEUNITS PER SERIES
Pinnacle Series 65,556,716 56,746,676Series F 720,204 658,376Series I 1,603,853 1,764,711
NET ASSETS ATTRIBUTABLE TO HOLDERS OF REDEEMABLEUNITS PER UNIT
Pinnacle Series 31.43 27.42Series F 31.50 27.61Series I 31.91 27.81
STATEMENTS OF COMPREHENSIVE INCOMEFor the periods ended June 30 (note 1),(in dollars except average units) 2017 2016
INCOMENet gain (loss) on investments
Dividends 1,043,677 873,770Interest for distribution purposes 2,773 1,096Net realized gain (loss) on non-derivative financial assets 2,011,489 1,082,931Change in unrealized gain (loss) on non-derivative financial
assets 5,995,142 (6,500,734)Change in unrealized gain (loss) on currency spots contracts 38 111
Net gain (loss) on investments 9,053,119 (4,542,826)Securities lending (note 11) 684 2,403Net realized and unrealized foreign currency translation gain (loss) (1,160) (20,561)Other income 257 –
Total income (loss), net 9,052,900 (4,560,984)
EXPENSESManagement fees (note 5) 3,413 3,228Fixed administration fees (note 6) 156,337 119,045Independent Review Committee fees 576 563Interest expense and bank overdraft charges 123 2Foreign withholding taxes/tax reclaims 161,221 136,059Other fund costs – 9Harmonized Sales Tax/Goods and Services Tax 14,939 11,988Transaction costs 32,639 44,075
Total expenses 369,248 314,969
Increase (decrease) in net assets attributable to holders ofredeemable units from operations 8,683,652 (4,875,953)
INCREASE (DECREASE) IN NET ASSETS ATTRIBUTABLE TOHOLDERS OF REDEEMABLE UNITS FROM OPERATIONS PERSERIES
Pinnacle Series 8,353,685 (4,608,848)Series F 88,886 (68,658)Series I 241,081 (198,447)
INCREASE (DECREASE) IN NET ASSETS ATTRIBUTABLE TOHOLDERS OF REDEEMABLE UNITS FROM OPERATIONS PERUNIT†
Pinnacle Series 4.00 (2.57)Series F 3.89 (2.81)Series I 4.24 (2.75)
WEIGHTED AVERAGE NUMBER OF UNITS PER SERIESPinnacle Series 2,090,681 1,790,513Series F 22,877 24,434Series I 56,801 72,042
† The increase (decrease) in net assets attributable to holders of redeemable units fromoperations per unit is calculated by dividing the increase (decrease) in net assetsattributable to holders of redeemable units from operations per series by the weightedaverage number of units per series.
The accompanying notes are an integral part of the financial statements. Portfolio Adviser: Victory Capital Management
FOR
EIG
NE
QU
ITY
FUN
DS
78

Scotia Private International Small to Mid Cap Value Pool (Unaudited – Continued)
STATEMENTS OF CHANGES IN NET ASSETSATTRIBUTABLE TO HOLDERS OF REDEEMABLEUNITSFor the periods ended June 30 (note 1),(in dollars) 2017 2016
NET ASSETS ATTRIBUTABLE TO HOLDERS OF REDEEMABLEUNITS, BEGINNING OF PERIOD
Pinnacle Series 56,746,676 46,951,423Series F 658,376 667,641Series I 1,764,711 2,242,981
59,169,763 49,862,045
INCREASE (DECREASE) IN NET ASSETS ATTRIBUTABLE TOHOLDERS OF REDEEMABLE UNITS FROM OPERATIONS
Pinnacle Series 8,353,685 (4,608,848)Series F 88,886 (68,658)Series I 241,081 (198,447)
8,683,652 (4,875,953)
REDEEMABLE UNIT TRANSACTIONSProceeds from issue
Pinnacle Series 6,974,903 12,465,981Series F 35,914 117,893Series I 5,350 20,400
Payments on redemptionPinnacle Series (6,518,548) (5,357,850)Series F (62,972) (50,197)Series I (407,289) (232,400)
27,358 6,963,827
INCREASE (DECREASE) IN NET ASSETS ATTRIBUTABLE TOHOLDERS OF REDEEMABLE UNITS
Pinnacle Series 8,810,040 2,499,283Series F 61,828 (962)Series I (160,858) (410,447)
8,711,010 2,087,874
NET ASSETS ATTRIBUTABLE TO HOLDERS OF REDEEMABLEUNITS, END OF PERIOD
Pinnacle Series 65,556,716 49,450,706Series F 720,204 666,679Series I 1,603,853 1,832,534
67,880,773 51,949,919
STATEMENTS OF CASH FLOWSFor the periods ended June 30 (note 1),(in dollars) 2017 2016
CASH FLOWS FROM OPERATING ACTIVITIESIncrease (decrease) in net assets attributable to holders of
redeemable units 8,683,652 (4,875,953)Adjustments for:
Net realized (gain) loss on non-derivative financial assets (2,011,489) (1,082,931)Unrealized foreign currency translation (gain) loss 5,161 53,732Change in unrealized (gain) loss on non-derivative
financial assets (5,995,142) 6,500,734Change in unrealized (gain) loss on currency spot
contracts (38) (111)Purchases of portfolio investments (17,119,648) (28,289,084)Proceeds from sale of portfolio investments 16,485,500 21,459,535Accrued investment income and other (36,469) (44,855)Accrued expenses and other payables 30,895 23,349
Net cash provided by (used in) operating activities 42,422 (6,255,584)
CASH FLOWS FROM FINANCING ACTIVITIESProceeds from issue of redeemable units 6,976,895 12,475,890Amounts paid on redemption of redeemable units (6,751,600) (5,588,363)Distributions to unitholders of redeemable units (73) –
Net cash provided by (used in) financing activities 225,222 6,887,527Unrealized foreign currency translation gain (loss) (5,161) (53,732)Net increase (decrease) in cash 267,644 631,943Cash (bank overdraft), beginning of period 466,477 75,779
CASH (BANK OVERDRAFT), END OF PERIOD 728,960 653,990
Interest paid(1) 123 2Interest received(1) 2,779 1,139Dividends received, net of withholding taxes(1) 845,613 694,495
(1) Classified as operating items.
The accompanying notes are an integral part of the financial statements. Portfolio Adviser: Victory Capital Management
FOR
EIG
NE
QU
ITY
FUN
DS
79

Scotia Private International Small to Mid Cap Value Pool (Unaudited – Continued)
SCHEDULE OF INVESTMENT PORTFOLIOAs at June 30, 2017
IssuerNumber of
SharesAverageCost ($)
CarryingValue ($)
EQUITIES – 99.3%Australia – 5.3%ALS Ltd. 30,640 237,669 227,188Amaysim Australia Ltd. 113,419 235,860 176,316Aristocrat Leisure Ltd. 11,474 80,078 257,747Aveo Group 59,611 181,115 165,011Beach Energy Limited 561,939 312,091 321,440BlueScope Steel Limited 28,447 165,843 373,949BT Investment Management Ltd. 30,347 351,675 343,615Charter Hall Group 80,671 382,174 441,853CSR Ltd. 93,093 341,666 392,421JB Hi-Fi Ltd. 10,455 292,771 243,630Mineral Resources Ltd. 19,576 104,381 211,128OZ Minerals Ltd. 32,166 157,310 237,533Seven Group Holdings Ltd. 18,803 194,992 204,589
3,037,625 3,596,420
Belgium – 0.5%Warehouses De Pauw SCA 2,650 286,412 360,820
Canada – 6.9%Air Canada 15,734 163,378 273,457Algonquin Power & Utilities Corporation 21,696 233,003 296,150BRP Inc. 6,765 210,386 257,002Canadian Apartment Properties Real Estate InvestmentTrust 6,190 115,808 207,798Celestica Inc. 15,618 234,473 275,189Cogeco Communication Inc. 2,735 173,069 216,639Enerflex Ltd. 10,623 178,484 199,925Gran Tierra Energy, Inc. 52,833 217,258 152,159HudBay Minerals, Inc. 22,997 241,629 172,478IAMGOLD Corporation 37,725 224,065 252,380Interfor Corporation 13,665 209,497 253,896Laurentian Bank of Canada 4,443 221,116 240,677OceanGold Corporation 51,578 132,121 201,670Painted Pony Energy Ltd. 27,829 215,842 131,631Parex Resources Inc. 28,105 298,792 414,549Premium Brands Holdings Corporation 3,957 253,132 368,159Tamarack Valley Energy Ltd. 96,023 282,402 214,131Tricon Capital Group Inc. 24,955 238,636 289,977WSP Global Inc. 4,609 230,195 248,010
4,073,286 4,665,877
Denmark – 1.7%GN Store Nord A/S 8,646 252,137 327,401Jyske Bank A/S 2,806 174,780 210,767NKT Holding A/S 2,130 172,226 221,951Royal Unibrew A/S 5,896 364,588 366,532
963,731 1,126,651
Finland – 1.3%Cramo Oyj Class B 12,758 339,085 494,722Valmet Oyj 14,348 237,357 361,279
576,442 856,001
France – 9.8%Alten SA 3,584 252,757 385,538Amundi SA 5,351 332,711 501,757Arkema SA 3,224 328,584 446,011Atos SE 4,143 402,704 753,103Edenred 5,876 169,424 198,704Eiffage SA 3,541 332,977 417,226Elior Group 7,214 209,145 272,791Euronext NV 7,792 344,284 524,648Faurecia 4,048 278,884 266,371Ipsen SA 4,640 371,765 823,196Nexity SA 5,457 270,472 410,968
IssuerNumber of
SharesAverageCost ($)
CarryingValue ($)
EQUITIES (cont'd)France (cont'd)SCOR SE 4,666 227,081 239,794SEB SA 1,079 178,794 251,148Tarkett SA 3,402 193,405 204,944Teleperformance 4,350 263,974 724,978Television Francaise 1 12,802 196,679 232,565
4,353,640 6,653,742
Germany – 7.3%Aareal Bank AG 4,265 198,021 219,025Alstria Office Real Estate Investment Trust AG 18,485 342,380 323,914Bechtle AG 1,637 225,265 273,104Carl Zeiss Meditec AG 5,114 305,337 344,431Dialog Semiconductor PLC 3,796 204,499 210,829Duerr AG 4,440 284,108 683,774Freenet AG 5,719 116,295 236,683Gerresheimer AG 1,924 199,222 200,561LANXESS AG 2,742 205,482 269,028MTU Aero Engines AG 1,547 243,489 283,584SAF-Holland SA 17,291 244,386 383,814Stabilus SA 5,340 252,095 537,194TAG Immobilien AG 20,805 360,532 423,858VTG AG 4,590 118,719 232,001Wirecard AG 3,835 251,342 316,436
3,551,172 4,938,236
Hong Kong – 2.4%Fortune Real Estate Investment Trust 152,000 212,535 244,615Man Wah Holdings Limited 530,000 299,106 617,199Nexteer Automotive Group Ltd. 126,000 215,701 256,142Tongda Group Holdings Ltd. 1,260,000 274,650 487,735
1,001,992 1,605,691
Italy – 3.7%A2A SpA 175,176 246,795 377,930Amplifon SpA 31,706 255,785 542,584Azimut Holding SpA 8,604 191,427 224,200Brembo SpA 42,635 229,516 810,771Buzzi Unicem SpA 6,663 176,259 216,072Infrastrutture Wireless Italiane SpA 42,433 287,103 313,025
1,386,885 2,484,582
Japan – 21.1%Adastria Holdings Co., Ltd. 8,300 329,742 299,995Arcs Co., Ltd. 7,500 253,885 210,627Asahi Intecc Co., Ltd. 4,100 218,593 241,349CKD Corporation 17,100 204,529 338,414Daifuku Co., Ltd. 7,800 176,570 302,702DAIHEN Corporation 32,000 178,618 326,920Daikyonishikawa Corporation 14,000 249,920 242,936Dainippon Screen Manufacturing Co., Ltd. 2,000 128,943 172,404DCM Holdings Co., Ltd. 16,000 151,777 182,136Denka Co., Ltd. 29,000 169,452 194,409Doutor Nichires Holdings Co., Ltd. 14,900 294,998 410,419Dowa Holdings Co., Ltd. 19,000 202,207 186,387Fujikura Ltd. 18,000 212,464 195,929Horiba Ltd. 3,200 220,307 252,798IT Holdings Corporation 7,900 260,006 284,931Japan Hotel REIT Investment Corporation 298 309,098 273,075Kanamoto Co., Ltd. 7,300 266,664 315,187Macromill Inc. 8,800 215,313 240,301Maeda Corporation 26,000 262,070 371,801Mandom Corporation 4,400 258,245 309,757Matsumotokiyoshi Holdings Co., Ltd. 4,900 297,033 361,724Morinaga & Co., Ltd. 6,300 271,171 463,297
The accompanying notes are an integral part of the financial statements. Portfolio Adviser: Victory Capital Management
FOR
EIG
NE
QU
ITY
FUN
DS
80
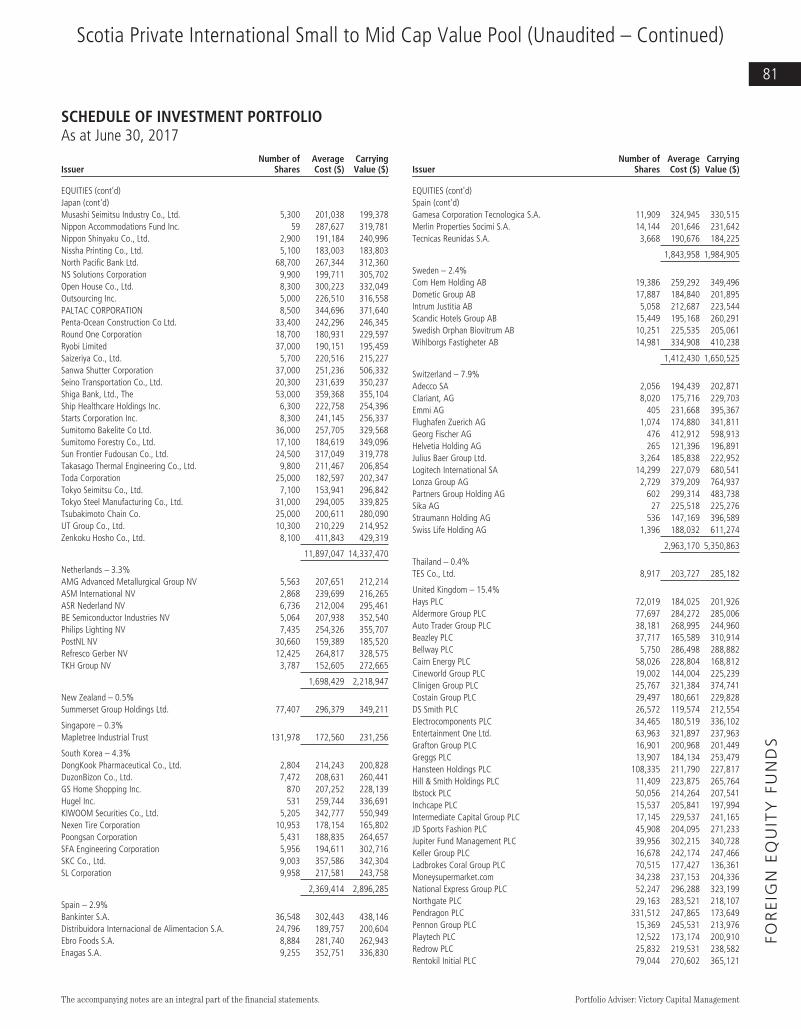
Scotia Private International Small to Mid Cap Value Pool (Unaudited – Continued)
SCHEDULE OF INVESTMENT PORTFOLIOAs at June 30, 2017
IssuerNumber of
SharesAverageCost ($)
CarryingValue ($)
EQUITIES (cont'd)Japan (cont'd)Musashi Seimitsu Industry Co., Ltd. 5,300 201,038 199,378Nippon Accommodations Fund Inc. 59 287,627 319,781Nippon Shinyaku Co., Ltd. 2,900 191,184 240,996Nissha Printing Co., Ltd. 5,100 183,003 183,803North Pacific Bank Ltd. 68,700 267,344 312,360NS Solutions Corporation 9,900 199,711 305,702Open House Co., Ltd. 8,300 300,223 332,049Outsourcing Inc. 5,000 226,510 316,558PALTAC CORPORATION 8,500 344,696 371,640Penta-Ocean Construction Co Ltd. 33,400 242,296 246,345Round One Corporation 18,700 180,931 229,597Ryobi Limited 37,000 190,151 195,459Saizeriya Co., Ltd. 5,700 220,516 215,227Sanwa Shutter Corporation 37,000 251,236 506,332Seino Transportation Co., Ltd. 20,300 231,639 350,237Shiga Bank, Ltd., The 53,000 359,368 355,104Ship Healthcare Holdings Inc. 6,300 222,758 254,396Starts Corporation Inc. 8,300 241,145 256,337Sumitomo Bakelite Co Ltd. 36,000 257,705 329,568Sumitomo Forestry Co., Ltd. 17,100 184,619 349,096Sun Frontier Fudousan Co., Ltd. 24,500 317,049 319,778Takasago Thermal Engineering Co., Ltd. 9,800 211,467 206,854Toda Corporation 25,000 182,597 202,347Tokyo Seimitsu Co., Ltd. 7,100 153,941 296,842Tokyo Steel Manufacturing Co., Ltd. 31,000 294,005 339,825Tsubakimoto Chain Co. 25,000 200,611 280,090UT Group Co., Ltd. 10,300 210,229 214,952Zenkoku Hosho Co., Ltd. 8,100 411,843 429,319
11,897,047 14,337,470
Netherlands – 3.3%AMG Advanced Metallurgical Group NV 5,563 207,651 212,214ASM International NV 2,868 239,699 216,265ASR Nederland NV 6,736 212,004 295,461BE Semiconductor Industries NV 5,064 207,938 352,540Philips Lighting NV 7,435 254,326 355,707PostNL NV 30,660 159,389 185,520Refresco Gerber NV 12,425 264,817 328,575TKH Group NV 3,787 152,605 272,665
1,698,429 2,218,947
New Zealand – 0.5%Summerset Group Holdings Ltd. 77,407 296,379 349,211
Singapore – 0.3%Mapletree Industrial Trust 131,978 172,560 231,256
South Korea – 4.3%DongKook Pharmaceutical Co., Ltd. 2,804 214,243 200,828DuzonBizon Co., Ltd. 7,472 208,631 260,441GS Home Shopping Inc. 870 207,252 228,139Hugel Inc. 531 259,744 336,691KIWOOM Securities Co., Ltd. 5,205 342,777 550,949Nexen Tire Corporation 10,953 178,154 165,802Poongsan Corporation 5,431 188,835 264,657SFA Engineering Corporation 5,956 194,611 302,716SKC Co., Ltd. 9,003 357,586 342,304SL Corporation 9,958 217,581 243,758
2,369,414 2,896,285
Spain – 2.9%Bankinter S.A. 36,548 302,443 438,146Distribuidora Internacional de Alimentacion S.A. 24,796 189,757 200,604Ebro Foods S.A. 8,884 281,740 262,943Enagas S.A. 9,255 352,751 336,830
IssuerNumber of
SharesAverageCost ($)
CarryingValue ($)
EQUITIES (cont'd)Spain (cont'd)Gamesa Corporation Tecnologica S.A. 11,909 324,945 330,515Merlin Properties Socimi S.A. 14,144 201,646 231,642Tecnicas Reunidas S.A. 3,668 190,676 184,225
1,843,958 1,984,905
Sweden – 2.4%Com Hem Holding AB 19,386 259,292 349,496Dometic Group AB 17,887 184,840 201,895Intrum Justitia AB 5,058 212,687 223,544Scandic Hotels Group AB 15,449 195,168 260,291Swedish Orphan Biovitrum AB 10,251 225,535 205,061Wihlborgs Fastigheter AB 14,981 334,908 410,238
1,412,430 1,650,525
Switzerland – 7.9%Adecco SA 2,056 194,439 202,871Clariant, AG 8,020 175,716 229,703Emmi AG 405 231,668 395,367Flughafen Zuerich AG 1,074 174,880 341,811Georg Fischer AG 476 412,912 598,913Helvetia Holding AG 265 121,396 196,891Julius Baer Group Ltd. 3,264 185,838 222,952Logitech International SA 14,299 227,079 680,541Lonza Group AG 2,729 379,209 764,937Partners Group Holding AG 602 299,314 483,738Sika AG 27 225,518 225,276Straumann Holding AG 536 147,169 396,589Swiss Life Holding AG 1,396 188,032 611,274
2,963,170 5,350,863
Thailand – 0.4%TES Co., Ltd. 8,917 203,727 285,182
United Kingdom – 15.4%Hays PLC 72,019 184,025 201,926Aldermore Group PLC 77,697 284,272 285,006Auto Trader Group PLC 38,181 268,995 244,960Beazley PLC 37,717 165,589 310,914Bellway PLC 5,750 286,498 288,882Cairn Energy PLC 58,026 228,804 168,812Cineworld Group PLC 19,002 144,004 225,239Clinigen Group PLC 25,767 321,384 374,741Costain Group PLC 29,497 180,661 229,828DS Smith PLC 26,572 119,574 212,554Electrocomponents PLC 34,465 180,519 336,102Entertainment One Ltd. 63,963 321,897 237,963Grafton Group PLC 16,901 200,968 201,449Greggs PLC 13,907 184,134 253,479Hansteen Holdings PLC 108,335 211,790 227,817Hill & Smith Holdings PLC 11,409 223,875 265,764Ibstock PLC 50,056 214,264 207,541Inchcape PLC 15,537 205,841 197,994Intermediate Capital Group PLC 17,145 229,537 241,165JD Sports Fashion PLC 45,908 204,095 271,233Jupiter Fund Management PLC 39,956 302,215 340,728Keller Group PLC 16,678 242,174 247,466Ladbrokes Coral Group PLC 70,515 177,427 136,361Moneysupermarket.com 34,238 237,153 204,336National Express Group PLC 52,247 296,288 323,199Northgate PLC 29,163 283,521 218,107Pendragon PLC 331,512 247,865 173,649Pennon Group PLC 15,369 245,531 213,976Playtech PLC 12,522 173,174 200,910Redrow PLC 25,832 219,531 238,582Rentokil Initial PLC 79,044 270,602 365,121
The accompanying notes are an integral part of the financial statements. Portfolio Adviser: Victory Capital Management
FOR
EIG
NE
QU
ITY
FUN
DS
81

Scotia Private International Small to Mid Cap Value Pool (Unaudited – Continued)
SCHEDULE OF INVESTMENT PORTFOLIOAs at June 30, 2017
IssuerNumber of
SharesAverageCost ($)
CarryingValue ($)
EQUITIES (cont'd)United Kingdom (cont'd)RPC Group PLC 15,056 224,176 191,351Safestore Holdings PLC 48,381 323,096 344,210Synthomer PLC 53,295 384,225 439,126Tate & Lyle PLC 26,528 336,154 296,608TP ICAP PLC 27,509 214,851 217,082Ultra Electronics Holdings PLC 5,913 205,732 204,582Unite Group PLC 19,148 132,344 209,838United Drug PLC 35,739 244,580 522,737Wizz Air Holdings PLC 9,563 355,747 391,238
9,477,112 10,462,576
United States – 1.9%Criteo SA – ADR 3,113 177,247 197,965Vanguard FTSE Developed Markets ETF 19,812 1,087,956 1,061,343
1,265,203 1,259,308
Transaction Costs (51,470)
TOTAL INVESTMENT PORTFOLIO 52,779,144 67,314,548
OTHER ASSETS, LESS LIABILITIES – 0.7% 566,225
NET ASSETS – 100.0% 67,880,773
The accompanying notes are an integral part of the financial statements. Portfolio Adviser: Victory Capital Management
FOR
EIG
NE
QU
ITY
FUN
DS
82

Scotia Private International Small to Mid Cap Value Pool (Unaudited – Continued)
FUND SPECIFIC NOTESFor the periods indicated in Note 1
The Fund (note 1)
The Fund’s investment objective is to achieve superior long termreturns through capital growth by investing in stocks of small andmedium capitalization corporations in Europe, Australia and the FarEast.
Risks associated with financial instruments (note 4)
Interest rate risk
The majority of the Fund’s financial instruments were non-interestbearing as at June 30, 2017 and December 31, 2016. Accordingly, theFund is not directly subject to significant risk due to fluctuations inthe prevailing levels of market interest rates.
Currency risk
The Fund’s exposure to currency risk is summarized in the tablesbelow. Amounts shown are based on the carrying value of monetary andnon-monetary assets and liabilities of the Fund net of currency hedgingcontracts, as applicable.
June 30, 2017
CurrencyGross currencyexposure ($)
Currencycontracts ($)
Netexposure ($)
Percentage ofnet assets (%)
Euro 19,524,256 – 19,524,256 28.8Japanese Yen 14,396,532 – 14,396,532 21.2British Pound 10,499,055 – 10,499,055 15.5Swiss Franc 5,350,863 – 5,350,863 7.9Australian Dollar 3,625,312 – 3,625,312 5.3South Korean Won 3,181,467 – 3,181,467 4.7Swedish Krona 1,656,477 – 1,656,477 2.4Hong Kong Dollar 1,609,587 – 1,609,587 2.4US Dollar 1,259,336 – 1,259,336 1.9Danish Krone 1,126,651 – 1,126,651 1.7New Zealand Dollar 349,211 – 349,211 0.5Singapore Dollar 234,501 – 234,501 0.3
62,813,248 – 62,813,248 92.6
December 31, 2016
CurrencyGross currencyexposure ($)
Currencycontracts ($)
Netexposure ($)
Percentage ofnet assets (%)
Euro 16,448,344 – 16,448,344 27.8Japanese Yen 12,856,252 – 12,856,252 21.7British Pound 8,847,655 – 8,847,655 15.0Swiss Franc 4,284,213 – 4,284,213 7.2Australian Dollar 3,840,740 – 3,840,740 6.5South Korean Won 2,800,705 – 2,800,705 4.7Hong Kong Dollar 1,714,114 – 1,714,114 2.9Swedish Krona 1,430,449 – 1,430,449 2.4US Dollar 845,620 – 845,620 1.4Danish Krone 735,947 – 735,947 1.2New Zealand Dollar 339,039 – 339,039 0.6Norwegian Krone 217,910 – 217,910 0.4
Singapore Dollar 201,375 – 201,375 0.3
54,562,363 – 54,562,363 92.1
If the Canadian dollar strengthened or weakened by 10% in relation toall other currencies, with all other variables held constant, net assetsof the Fund could possibly have decreased or increased, respectively,by $6,281,325 or 9.3% of net assets (December 31, 2016 – $5,456,237 or9.2%). In practice, actual results may differ from this sensitivityanalysis and the difference could be material.
Price risk
Price risk is the risk that the carrying value of financial instrumentswill fluctuate as a result of changes in market prices (other than thosearising from interest rate risk or currency risk) caused by factorsspecific to a security, its issuer or all factors affecting a market or amarket segment. Exposure to price risk is mainly in equities,underlying funds, derivatives and commodities, as applicable. As atJune 30, 2017, approximately 99.3% (December 31, 2016 – 99.0%) ofthe Fund’s net assets were exposed to price risk. If prices of theseinstruments had decreased or increased by 10%, with all othervariables held constant, net assets of the Fund would have decreasedor increased, respectively, by approximately $6,731,455 (December 31,2016 – $5,856,136). In practice, actual results may differ from thissensitivity analysis and the difference could be material.
Credit risk
The Fund had no significant exposure to bonds and debentures, moneymarket instruments or preferred shares as at June 30, 2017 orDecember 31, 2016.
Concentration risk
Concentration risk arises as a result of the concentration of exposureswithin the same category, geographical location, asset type or industrysector, as applicable. The table below is a summary of the Fund’sconcentration risk:
Percentage of net assets (%)
June 30, 2017 December 31, 2016
Australia 5.3 6.2Austria – 0.5Belgium 0.5 0.8Canada 6.9 6.9Denmark 1.7 1.2Finland 1.3 1.8France 9.8 9.5Germany 7.3 7.3Hong Kong 2.4 2.9Italy 3.7 3.3Japan 21.1 21.6Netherlands 3.3 2.8New Zealand 0.5 0.6Norway – 0.4Singapore 0.3 0.3South Korea 4.3 4.3Spain 2.9 1.9Sweden 2.4 2.4Switzerland 7.9 7.2Thailand 0.4 0.4United Kingdom 15.4 14.9United States 1.9 1.8
Fair Value Classification (note 2)
The tables below illustrate the classification of the Fund’s financialinstruments within the fair value hierarchy.
June 30, 2017Level 1
($)Level 2
($)Level 3
($)Total($)
Equities 5,925,185 61,389,363 – 67,314,548Unrealized gain on currency spot
contracts – 38 – 38
5,925,185 61,389,401 – 67,314,586
The accompanying notes are an integral part of the financial statements.
FOR
EIG
NE
QU
ITY
FUN
DS
83

Scotia Private International Small to Mid Cap Value Pool (Unaudited – Continued)
FUND SPECIFIC NOTESFor the periods indicated in Note 1
December 31, 2016Level 1
($)Level 2
($)Level 3
($)Total($)
Equities 4,946,721 53,614,638 – 58,561,359
4,946,721 53,614,638 – 58,561,359
Transfers between levels
During the periods ended June 30, 2017 and December 31, 2016, therewere no significant transfers between Level 1 and Level 2.
Offsetting of financial assets and liabilities (note 2)
As at June 30, 2017 and December 31, 2016, the Fund did not enter intoany agreement whereby the financial instruments were eligible foroffset.
Interest in Underlying Funds (note 2)
The following tables present the percentage of the Underlying Fundsowned by the Fund.
June 30, 2017
Underlying Fund
Carrying value ofthe Underlying Fund
($)
Ownership percentagein Underlying Fund
(%)
Vanguard FTSE Developed MarketsETF 1,061,343 0.0
1,061,343
December 31, 2016
Underlying Fund
Carrying value ofthe Underlying Fund
($)
Ownership percentagein Underlying Fund
(%)
Vanguard FTSE Developed MarketsETF 642,952 0.0
642,952
Comparison of net asset value per unit and net assets per unit(note 2)
As at June 30, 2017 or December 31, 2016, there were no differencesbetween the net asset value per unit and the net assets per unit for anyseries of the Fund.
The accompanying notes are an integral part of the financial statements.
FOR
EIG
NE
QU
ITY
FUN
DS
84

Scotia Private Emerging Markets Pool (Unaudited)
STATEMENTS OF FINANCIAL POSITIONAs at
(in dollars)June 30,
2017December 31,
2016
ASSETSCurrent assetsInvestments
Non-derivative financial assets 280,932,071 239,746,771Cash 4,166,397 10,862,919Subscriptions receivable 322,720 128,200Accrued investment income and other 1,447,383 321,543
286,868,571 251,059,433
LIABILITIESCurrent liabilitiesManagement fee payable 9,985 –Payable for securities purchased – 3,809,108Redemptions payable 270,961 64,278Accrued expenses 29,524 1,074Distributions payable – 132Unrealized loss on currency spot contracts – 6,805
310,470 3,881,397
Net assets attributable to holders of redeemable units 286,558,101 247,178,036
NET ASSETS ATTRIBUTABLE TO HOLDERS OF REDEEMABLEUNITS PER SERIES
Pinnacle Series 69,704,499 58,757,538Series I 201,587,485 175,801,605Series M 15,266,117 12,618,893
NET ASSETS ATTRIBUTABLE TO HOLDERS OF REDEEMABLEUNITS PER UNIT
Pinnacle Series 10.82 9.28Series I 10.95 9.40Series M 10.76 9.29
STATEMENTS OF COMPREHENSIVE INCOMEFor the periods ended June 30 (note 1),(in dollars except average units) 2017 2016
INCOMENet gain (loss) on investments
Dividends 6,340,261 4,780,416Interest for distribution purposes 58,550 29,489Net realized gain (loss) on non-derivative financial assets 5,987,637 (9,792,007)Change in unrealized gain (loss) on non-derivative financial
assets 29,839,035 2,717,291Change in unrealized gain (loss) on currency spots contracts 6,805 (2,390)
Net gain (loss) on investments 42,232,288 (2,267,201)Securities lending (note 11) 4,434 16,001Net realized and unrealized foreign currency translation gain
(loss) (101,226) (235,879)Other income 294 –
Total income (loss), net 42,135,790 (2,487,079)
EXPENSESManagement fees (note 5) 49,701 51,509Fixed administration fees (note 6) 150,728 113,069Independent Review Committee fees 576 563Interest expense and bank overdraft charges 1,409 749Foreign withholding taxes/tax reclaims 584,254 575,602Other fund costs – 37Harmonized Sales Tax/Goods and Services Tax 19,541 16,176Transaction costs 184,628 226,874
Total expenses 990,837 984,579
Increase (decrease) in net assets attributable to holders ofredeemable units from operations 41,144,953 (3,471,658)
INCREASE (DECREASE) IN NET ASSETS ATTRIBUTABLE TOHOLDERS OF REDEEMABLE UNITS FROM OPERATIONS PERSERIES
Pinnacle Series 9,919,925 (522,594)Series I 29,171,231 (2,549,210)Series M 2,053,797 (399,854)
INCREASE (DECREASE) IN NET ASSETS ATTRIBUTABLE TOHOLDERS OF REDEEMABLE UNITS FROM OPERATIONS PERUNIT†
Pinnacle Series 1.53 (0.09)Series I 1.57 (0.15)Series M 1.49 (0.24)
WEIGHTED AVERAGE NUMBER OF UNITS PER SERIESPinnacle Series 6,463,484 5,504,497Series I 18,634,947 16,800,918Series M 1,379,659 1,699,578
† The increase (decrease) in net assets attributable to holders of redeemable units fromoperations per unit is calculated by dividing the increase (decrease) in net assetsattributable to holders of redeemable units from operations per series by the weightedaverage number of units per series.
The accompanying notes are an integral part of the financial statements. Portfolio Adviser: LMCG Investments, LLC
FOR
EIG
NE
QU
ITY
FUN
DS
85

Scotia Private Emerging Markets Pool (Unaudited – Continued)
STATEMENTS OF CHANGES IN NET ASSETSATTRIBUTABLE TO HOLDERS OF REDEEMABLEUNITSFor the periods ended June 30 (note 1),(in dollars) 2017 2016
NET ASSETS ATTRIBUTABLE TO HOLDERS OF REDEEMABLEUNITS, BEGINNING OF PERIOD
Pinnacle Series 58,757,538 42,594,674Series I 175,801,605 151,801,985Series M 12,618,893 15,686,821
247,178,036 210,083,480
INCREASE (DECREASE) IN NET ASSETS ATTRIBUTABLE TOHOLDERS OF REDEEMABLE UNITS FROM OPERATIONS
Pinnacle Series 9,919,925 (522,594)Series I 29,171,231 (2,549,210)Series M 2,053,797 (399,854)
41,144,953 (3,471,658)
REDEEMABLE UNIT TRANSACTIONSProceeds from issue
Pinnacle Series 8,016,081 13,120,782Series I 3,801,449 28,968,967Series M 3,398,792 1,075,993
Payments on redemptionPinnacle Series (6,989,045) (2,938,369)Series I (7,186,800) (8,348,850)Series M (2,805,365) (2,386,465)
(1,764,888) 29,492,058
INCREASE (DECREASE) IN NET ASSETS ATTRIBUTABLE TOHOLDERS OF REDEEMABLE UNITS
Pinnacle Series 10,946,961 9,659,819Series I 25,785,880 18,070,907Series M 2,647,224 (1,710,326)
39,380,065 26,020,400
NET ASSETS ATTRIBUTABLE TO HOLDERS OF REDEEMABLEUNITS, END OF PERIOD
Pinnacle Series 69,704,499 52,254,493Series I 201,587,485 169,872,892Series M 15,266,117 13,976,495
286,558,101 236,103,880
STATEMENTS OF CASH FLOWSFor the periods ended June 30 (note 1),(in dollars) 2017 2016
CASH FLOWS FROM OPERATING ACTIVITIESIncrease (decrease) in net assets attributable to holders of
redeemable units 41,144,953 (3,471,658)Adjustments for:
Net realized (gain) loss on non-derivative financial assets (5,987,637) 9,792,007Unrealized foreign currency translation (gain) loss 62,598 93,791Change in unrealized (gain) loss on non-derivative
financial assets (29,839,035) (2,717,291)Change in unrealized (gain) loss on currency spot
contracts (6,805) 2,390Non-cash transactions (1,355,849) (1,089,961)Purchases of portfolio investments (89,998,036) (103,619,542)Proceeds from sale of portfolio investments 82,186,149 76,478,355Accrued investment income and other (1,125,840) (1,426,926)Accrued expenses and other payables 38,435 30,724
Net cash provided by (used in) operating activities (4,881,067) (25,928,111)
CASH FLOWS FROM FINANCING ACTIVITIESProceeds from issue of redeemable units 15,021,802 43,056,746Amounts paid on redemption of redeemable units (16,774,527) (13,156,588)Distributions to unitholders of redeemable units (132) –
Net cash provided by (used in) financing activities (1,752,857) 29,900,158Unrealized foreign currency translation gain (loss) (62,598) (93,791)Net increase (decrease) in cash (6,633,924) 3,972,047Cash (bank overdraft), beginning of period 10,862,919 4,976,834
CASH (BANK OVERDRAFT), END OF PERIOD 4,166,397 8,855,090
Interest paid(1) 1,409 749Interest received(1) 59,957 29,032Dividends received, net of withholding taxes(1) 3,272,911 2,781,955
(1) Classified as operating items.
The accompanying notes are an integral part of the financial statements. Portfolio Adviser: LMCG Investments, LLC
FOR
EIG
NE
QU
ITY
FUN
DS
86
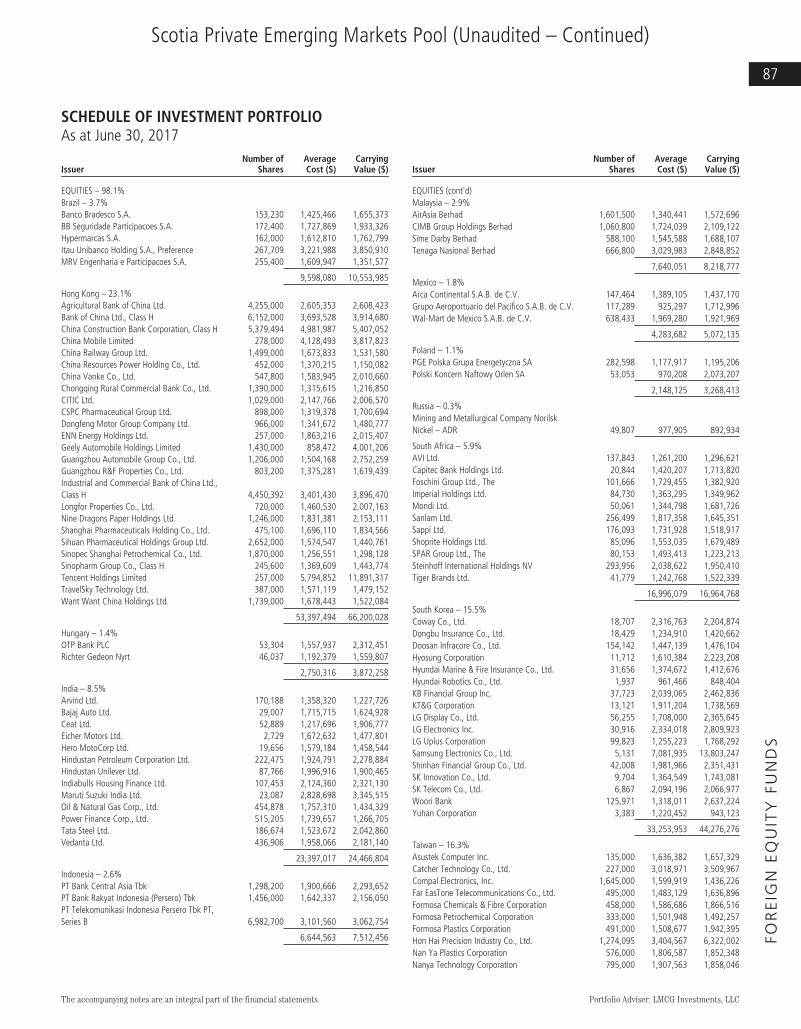
Scotia Private Emerging Markets Pool (Unaudited – Continued)
SCHEDULE OF INVESTMENT PORTFOLIOAs at June 30, 2017
IssuerNumber of
SharesAverageCost ($)
CarryingValue ($)
EQUITIES – 98.1%Brazil – 3.7%Banco Bradesco S.A. 153,230 1,425,466 1,655,373BB Seguridade Participacoes S.A. 172,400 1,727,869 1,933,326Hypermarcas S.A. 162,000 1,612,810 1,762,799Itau Unibanco Holding S.A., Preference 267,709 3,221,988 3,850,910MRV Engenharia e Participacoes S.A. 255,400 1,609,947 1,351,577
9,598,080 10,553,985
Hong Kong – 23.1%Agricultural Bank of China Ltd. 4,255,000 2,605,353 2,608,423Bank of China Ltd., Class H 6,152,000 3,693,528 3,914,680China Construction Bank Corporation, Class H 5,379,494 4,981,987 5,407,052China Mobile Limited 278,000 4,128,493 3,817,823China Railway Group Ltd. 1,499,000 1,673,833 1,531,580China Resources Power Holding Co., Ltd. 452,000 1,370,215 1,150,082China Vanke Co., Ltd. 547,800 1,583,945 2,010,660Chongqing Rural Commercial Bank Co., Ltd. 1,390,000 1,315,615 1,216,850CITIC Ltd. 1,029,000 2,147,766 2,006,570CSPC Pharmaceutical Group Ltd. 898,000 1,319,378 1,700,694Dongfeng Motor Group Company Ltd. 966,000 1,341,672 1,480,777ENN Energy Holdings Ltd. 257,000 1,863,216 2,015,407Geely Automobile Holdings Limited 1,430,000 858,472 4,001,206Guangzhou Automobile Group Co., Ltd. 1,206,000 1,504,168 2,752,259Guangzhou R&F Properties Co., Ltd. 803,200 1,375,281 1,619,439Industrial and Commercial Bank of China Ltd.,Class H 4,450,392 3,401,430 3,896,470Longfor Properties Co., Ltd. 720,000 1,460,530 2,007,163Nine Dragons Paper Holdings Ltd. 1,246,000 1,831,381 2,153,111Shanghai Pharmaceuticals Holding Co., Ltd. 475,100 1,696,110 1,834,566Sihuan Pharmaceutical Holdings Group Ltd. 2,652,000 1,574,547 1,440,761Sinopec Shanghai Petrochemical Co., Ltd. 1,870,000 1,256,551 1,298,128Sinopharm Group Co., Class H 245,600 1,369,609 1,443,774Tencent Holdings Limited 257,000 5,794,852 11,891,317TravelSky Technology Ltd. 387,000 1,571,119 1,479,152Want Want China Holdings Ltd. 1,739,000 1,678,443 1,522,084
53,397,494 66,200,028
Hungary – 1.4%OTP Bank PLC 53,304 1,557,937 2,312,451Richter Gedeon Nyrt 46,037 1,192,379 1,559,807
2,750,316 3,872,258
India – 8.5%Arvind Ltd. 170,188 1,358,320 1,227,726Bajaj Auto Ltd. 29,007 1,715,715 1,624,928Ceat Ltd. 52,889 1,217,696 1,906,777Eicher Motors Ltd. 2,729 1,672,632 1,477,801Hero MotoCorp Ltd. 19,656 1,579,184 1,458,544Hindustan Petroleum Corporation Ltd. 222,475 1,924,791 2,278,884Hindustan Unilever Ltd. 87,766 1,996,916 1,900,465Indiabulls Housing Finance Ltd. 107,453 2,124,360 2,321,130Maruti Suzuki India Ltd. 23,087 2,828,698 3,345,515Oil & Natural Gas Corp., Ltd. 454,878 1,757,310 1,434,329Power Finance Corp., Ltd. 515,205 1,739,657 1,266,705Tata Steel Ltd. 186,674 1,523,672 2,042,860Vedanta Ltd. 436,906 1,958,066 2,181,140
23,397,017 24,466,804
Indonesia – 2.6%PT Bank Central Asia Tbk 1,298,200 1,900,666 2,293,652PT Bank Rakyat Indonesia (Persero) Tbk 1,456,000 1,642,337 2,156,050PT Telekomunikasi Indonesia Persero Tbk PT,Series B 6,982,700 3,101,560 3,062,754
6,644,563 7,512,456
IssuerNumber of
SharesAverageCost ($)
CarryingValue ($)
EQUITIES (cont'd)Malaysia – 2.9%AirAsia Berhad 1,601,500 1,340,441 1,572,696CIMB Group Holdings Berhad 1,060,800 1,724,039 2,109,122Sime Darby Berhad 588,100 1,545,588 1,688,107Tenaga Nasional Berhad 666,800 3,029,983 2,848,852
7,640,051 8,218,777
Mexico – 1.8%Arca Continental S.A.B. de C.V. 147,464 1,389,105 1,437,170Grupo Aeroportuario del Pacifico S.A.B. de C.V. 117,289 925,297 1,712,996Wal-Mart de Mexico S.A.B. de C.V. 638,433 1,969,280 1,921,969
4,283,682 5,072,135
Poland – 1.1%PGE Polska Grupa Energetyczna SA 282,598 1,177,917 1,195,206Polski Koncern Naftowy Orlen SA 53,053 970,208 2,073,207
2,148,125 3,268,413
Russia – 0.3%Mining and Metallurgical Company NorilskNickel – ADR 49,807 977,905 892,934
South Africa – 5.9%AVI Ltd. 137,843 1,261,200 1,296,621Capitec Bank Holdings Ltd. 20,844 1,420,207 1,713,820Foschini Group Ltd., The 101,666 1,729,455 1,382,920Imperial Holdings Ltd. 84,730 1,363,295 1,349,962Mondi Ltd. 50,061 1,344,798 1,681,726Sanlam Ltd. 256,499 1,817,358 1,645,351Sappi Ltd. 176,093 1,731,928 1,518,917Shoprite Holdings Ltd. 85,096 1,553,035 1,679,489SPAR Group Ltd., The 80,153 1,493,413 1,223,213Steinhoff International Holdings NV 293,956 2,038,622 1,950,410Tiger Brands Ltd. 41,779 1,242,768 1,522,339
16,996,079 16,964,768
South Korea – 15.5%Coway Co., Ltd. 18,707 2,316,763 2,204,874Dongbu Insurance Co., Ltd. 18,429 1,234,910 1,420,662Doosan Infracore Co., Ltd. 154,142 1,447,139 1,476,104Hyosung Corporation 11,712 1,610,384 2,223,208Hyundai Marine & Fire Insurance Co., Ltd. 31,656 1,374,672 1,412,676Hyundai Robotics Co., Ltd. 1,937 961,466 848,404KB Financial Group Inc. 37,723 2,039,065 2,462,836KT&G Corporation 13,121 1,911,204 1,738,569LG Display Co., Ltd. 56,255 1,708,000 2,365,645LG Electronics Inc. 30,916 2,334,018 2,809,923LG Uplus Corporation 99,823 1,255,223 1,768,292Samsung Electronics Co., Ltd. 5,131 7,081,935 13,803,247Shinhan Financial Group Co., Ltd. 42,008 1,981,966 2,351,431SK Innovation Co., Ltd. 9,704 1,364,549 1,743,081SK Telecom Co., Ltd. 6,867 2,094,196 2,066,977Woori Bank 125,971 1,318,011 2,637,224Yuhan Corporation 3,383 1,220,452 943,123
33,253,953 44,276,276
Taiwan – 16.3%Asustek Computer Inc. 135,000 1,636,382 1,657,329Catcher Technology Co., Ltd. 227,000 3,018,971 3,509,967Compal Electronics, Inc. 1,645,000 1,599,919 1,436,226Far EasTone Telecommunications Co., Ltd. 495,000 1,483,129 1,636,896Formosa Chemicals & Fibre Corporation 458,000 1,586,686 1,866,516Formosa Petrochemical Corporation 333,000 1,501,948 1,492,257Formosa Plastics Corporation 491,000 1,508,677 1,942,395Hon Hai Precision Industry Co., Ltd. 1,274,095 3,404,567 6,322,002Nan Ya Plastics Corporation 576,000 1,806,587 1,852,348Nanya Technology Corporation 795,000 1,907,563 1,858,046
The accompanying notes are an integral part of the financial statements. Portfolio Adviser: LMCG Investments, LLC
FOR
EIG
NE
QU
ITY
FUN
DS
87

Scotia Private Emerging Markets Pool (Unaudited – Continued)
SCHEDULE OF INVESTMENT PORTFOLIOAs at June 30, 2017
IssuerNumber of
SharesAverageCost ($)
CarryingValue ($)
EQUITIES (cont'd)Taiwan (cont'd)Pegatron Corporation 391,000 1,385,726 1,590,432Phison Electronics Corporation 96,000 1,495,491 1,538,457Pou Chen Corporation 823,000 1,317,035 1,476,534Powertech Technology Inc. 394,000 1,127,019 1,579,824Quanta Computer Inc. 581,000 1,384,823 1,779,762St. Shine Optical Company Ltd. 33,000 1,076,544 895,791Taiwan Semiconductor ManufacturingCompany Ltd. 1,388,818 6,998,151 12,301,360Wistron Corporation 1,536,557 1,302,519 2,033,120
35,541,737 46,769,262
Thailand – 2.3%Beauty Community PCL 3,580,900 1,310,141 1,477,252Krung Thai Bank PCL 2,361,800 1,791,094 1,696,517PTT PCL 136,300 1,775,631 1,927,461Thai Oil PCL – NVDR 502,000 1,397,965 1,515,692
6,274,831 6,616,922
Turkey – 4.9%Akbank TAS 653,342 1,919,963 2,359,564Arcelik AS 150,608 1,159,330 1,446,484BIM Birlesik Magazalar AS 64,260 1,600,064 1,544,144Emlak Konut Gayrimenkul Yatirim Ortakligi AS 1,263,241 1,658,740 1,368,675Eregli Demir ve Celik Fabrikalari TAS (Erdemir) 851,672 1,746,760 2,212,716Koc Holding AS 267,543 1,466,660 1,596,235Tupras Turkiye Petrol Rafinerileri AS 47,036 1,356,666 1,754,354Turkiye Garanti Bankasi AS 461,165 1,552,317 1,663,841
12,460,500 13,946,013
United Kingdom – 1.1%Severstal PAO 73,431 1,367,672 1,251,876Tatneft OAO 36,643 1,469,133 1,796,610
2,836,805 3,048,486
United States – 6.7%Alibaba Group Holding Ltd. 31,549 3,395,301 5,763,252Gazprom – ADR 448,742 3,222,277 2,318,441Infosys Ltd. – Sponsored ADR 82,733 1,931,567 1,611,090iShares MSCI Emerging Markets ETF 132,628 6,333,318 7,117,077Lukoil Oil Company – ADR 38,616 2,598,256 2,442,694
17,480,719 19,252,554
Transaction Costs (265,488)
TOTAL INVESTMENT PORTFOLIO 235,416,369 280,932,071
OTHER ASSETS, LESS LIABILITIES – 1.9% 5,626,030
NET ASSETS – 100.0% 286,558,101
The accompanying notes are an integral part of the financial statements. Portfolio Adviser: LMCG Investments, LLC
FOR
EIG
NE
QU
ITY
FUN
DS
88

Scotia Private Emerging Markets Pool (Unaudited – Continued)
FUND SPECIFIC NOTESFor the periods indicated in Note 1
The Fund (note 1)
The Fund’s objective is to achieve long term returns through capitalgrowth by investing primarily in equity and equity-related securities ofcompanies located in emerging markets and emerging industries of anymarket.
Risks associated with financial instruments (note 4)
Interest rate risk
The majority of the Fund’s financial instruments were non-interestbearing as at June 30, 2017 and December 31, 2016. Accordingly, theFund is not directly subject to significant risk due to fluctuations inthe prevailing levels of market interest rates.
Currency risk
The Fund’s exposure to currency risk is summarized in the tablesbelow. Amounts shown are based on the carrying value of monetary andnon-monetary assets and liabilities of the Fund net of currencycontracts, as applicable.
June 30, 2017
CurrencyGross currencyexposure ($)
Currencycontracts ($)
Netexposure ($)
Percentage ofnet assets (%)
Hong Kong Dollar 67,225,803 – 67,225,803 23.5Taiwan Dollar 48,823,123 – 48,823,123 17.0South Korean Won 44,276,278 – 44,276,278 15.5Indian Rupee 24,488,893 – 24,488,893 8.5US Dollar 23,341,060 – 23,341,060 8.1South African Rand 16,995,604 – 16,995,604 5.9Turkish Lira 13,964,132 – 13,964,132 4.9Brazilian Real 10,626,532 – 10,626,532 3.7Malaysian Ringgit 8,276,842 – 8,276,842 2.9Indonesian Rupiah 7,512,456 – 7,512,456 2.6Thai Baht 6,616,921 – 6,616,921 2.3Mexican Peso 5,140,109 – 5,140,109 1.8Hungary Forint 3,895,690 – 3,895,690 1.4Polish Zloty 3,268,417 – 3,268,417 1.1
284,451,860 – 284,451,860 99.2
December 31, 2016
CurrencyGross currencyexposure ($)
Currencycontracts ($)
Netexposure ($)
Percentage ofnet assets (%)
Hong Kong Dollar 59,788,675 – 59,788,675 24.2South Korean Won 39,165,606 – 39,165,606 15.8Taiwan Dollar 37,642,462 – 37,642,462 15.2US Dollar 28,378,112 3,815,913 32,194,025 13.0Brazilian Real 17,560,835 – 17,560,835 7.1South African Rand 16,537,899 – 16,537,899 6.7Thai Baht 9,447,501 – 9,447,501 3.8Malaysian Ringgit 7,111,718 – 7,111,718 2.9Indian Rupee 6,261,273 – 6,261,273 2.5Turkish Lira 5,763,244 – 5,763,244 2.3Indonesian Rupiah 4,821,334 – 4,821,334 2.0Mexican Peso 3,692,394 – 3,692,394 1.5Hungary Forint 3,259,885 – 3,259,885 1.3Polish Zloty 2,192,340 – 2,192,340 0.9
241,623,278 3,815,913 245,439,191 99.2
If the Canadian dollar strengthened or weakened by 10% in relation toall other currencies, with all other variables held constant, net assetsof the Fund could possibly have decreased or increased, respectively,by $28,445,186 or 9.9% of net assets (December 31, 2016 – $24,543,919or 10.0%). In practice, actual results may differ from this sensitivityanalysis and the difference could be material.
Price risk
Price risk is the risk that the carrying value of financial instrumentswill fluctuate as a result of changes in market prices (other than thosearising from interest rate risk or currency risk) caused by factorsspecific to a security, its issuer or all factors affecting a market or amarket segment. Exposure to price risk is mainly in equities,underlying funds, derivatives and commodities, as applicable. As atJune 30, 2017, approximately 98.1% (December 31, 2016 – 97.0%) ofthe Fund’s net assets were exposed to price risk. If prices of theseinstruments had decreased or increased by 10%, with all othervariables held constant, net assets of the Fund would have decreasedor increased, respectively, by approximately $28,093,207 (December31, 2016 – $23,974,677). In practice, actual results may differ from thissensitivity analysis and the difference could be material.
Credit risk
The Fund had no significant exposure to bonds and debentures, moneymarket instruments or preferred shares as at June 30, 2017 orDecember 31, 2016.
Concentration risk
Concentration risk arises as a result of the concentration of exposureswithin the same category, geographical location, asset type or industrysector, as applicable. The table below is a summary of the Fund’sconcentration risk:
Percentage of net assets (%)
June 30, 2017 December 31, 2016
Brazil 3.7 7.1Hong Kong 23.1 24.3Hungary 1.4 1.3India 8.5 2.5Indonesia 2.6 2.0Malaysia 2.9 2.8Mexico 1.8 1.5Poland 1.1 0.9Russia 0.3 0.4South Africa 5.9 6.7South Korea 15.5 15.8Taiwan 16.3 14.6Thailand 2.3 3.8Turkey 4.9 2.3United Kingdom 1.1 1.1United States 6.7 9.9
Fair Value Classification (note 2)
The tables below illustrate the classification of the Fund’s financialinstruments within the fair value hierarchy.
June 30, 2017Level 1
($)Level 2
($)Level 3
($)Total($)
Equities 34,878,674 246,053,397 – 280,932,071
34,878,674 246,053,397 – 280,932,071
December 31, 2016Level 1
($)Level 2
($)Level 3
($)Total($)
Equities 28,262,473 211,484,298 – 239,746,771
28,262,473 211,484,298 – 239,746,771
Unrealized loss on currency spotcontracts – (6,805) – (6,805)
28,262,473 211,477,493 – 239,739,966
The accompanying notes are an integral part of the financial statements.
FOR
EIG
NE
QU
ITY
FUN
DS
89
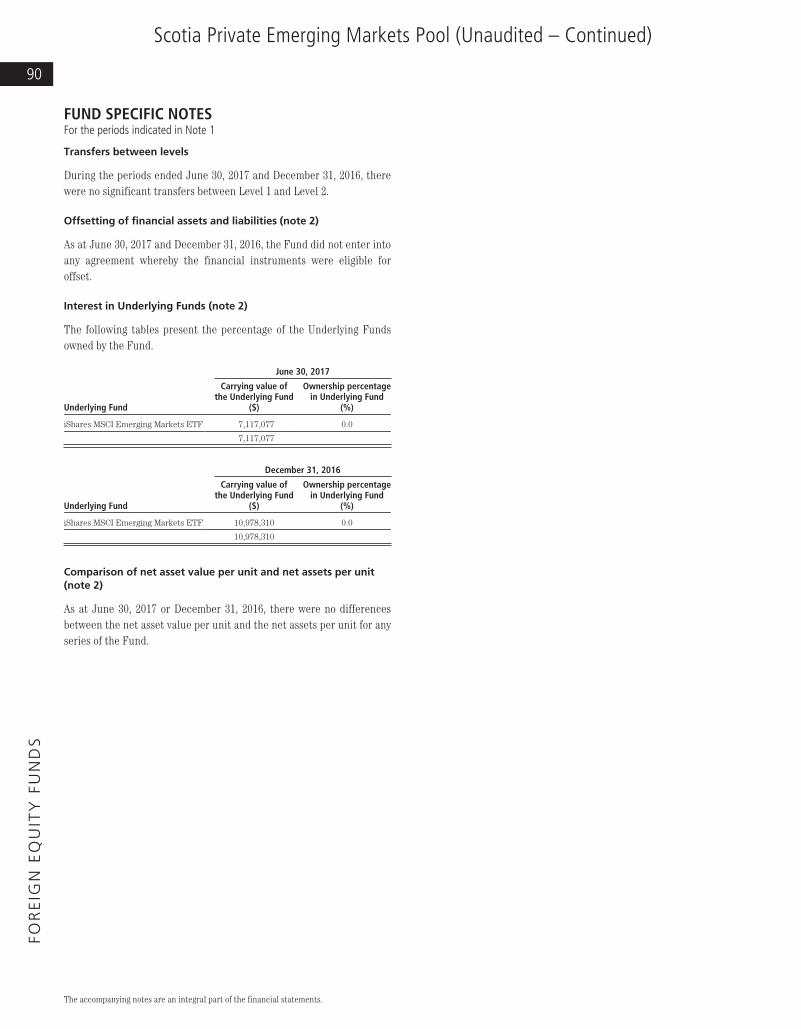
Scotia Private Emerging Markets Pool (Unaudited – Continued)
FUND SPECIFIC NOTESFor the periods indicated in Note 1
Transfers between levels
During the periods ended June 30, 2017 and December 31, 2016, therewere no significant transfers between Level 1 and Level 2.
Offsetting of financial assets and liabilities (note 2)
As at June 30, 2017 and December 31, 2016, the Fund did not enter intoany agreement whereby the financial instruments were eligible foroffset.
Interest in Underlying Funds (note 2)
The following tables present the percentage of the Underlying Fundsowned by the Fund.
June 30, 2017
Underlying Fund
Carrying value ofthe Underlying Fund
($)
Ownership percentagein Underlying Fund
(%)
iShares MSCI Emerging Markets ETF 7,117,077 0.0
7,117,077
December 31, 2016
Underlying Fund
Carrying value ofthe Underlying Fund
($)
Ownership percentagein Underlying Fund
(%)
iShares MSCI Emerging Markets ETF 10,978,310 0.0
10,978,310
Comparison of net asset value per unit and net assets per unit(note 2)
As at June 30, 2017 or December 31, 2016, there were no differencesbetween the net asset value per unit and the net assets per unit for anyseries of the Fund.
The accompanying notes are an integral part of the financial statements.
FOR
EIG
NE
QU
ITY
FUN
DS
90

Scotia Private Global Equity Pool (Unaudited)
STATEMENTS OF FINANCIAL POSITIONAs at
(in dollars)June 30,
2017December 31,
2016
ASSETSCurrent assetsInvestments
Non-derivative financial assets 393,590,555 375,941,621Unrealized gain on currency spot contracts 5 –
Cash 9,284,435 5,184,048Receivable for securities sold 32,407 –Subscriptions receivable 137,003 75,010Accrued investment income and other 274,073 195,573
403,318,478 381,396,252
LIABILITIESCurrent liabilitiesManagement fee payable 9,415 270Payable for securities purchased – 2,070,730Redemptions payable 400,647 623,037Accrued expenses 24,063 716Unrealized loss on currency spot contracts – 4,753
434,125 2,699,506
Net assets attributable to holders of redeemable units 402,884,353 378,696,746
NET ASSETS ATTRIBUTABLE TO HOLDERS OFREDEEMABLE UNITS PER SERIES
Pinnacle Series 30,880,000 29,903,016Series F 10,171,102 9,424,124Series I 361,833,251 339,369,606
NET ASSETS ATTRIBUTABLE TO HOLDERS OFREDEEMABLE UNITS PER UNIT
Pinnacle Series 27.74 24.38Series F 27.36 24.17Series I 28.18 24.75
STATEMENTS OF COMPREHENSIVE INCOMEFor the periods ended June 30 (note 1),(in dollars except average units) 2017 2016
INCOMENet gain (loss) on investments
Dividends 3,155,700 3,066,417Interest for distribution purposes 8,277 19,576Net realized gain (loss) on non-derivative financial assets 20,695,147 11,584,753Change in unrealized gain (loss) on non-derivative financial
assets 28,647,221 (31,171,215)Change in unrealized gain (loss) on currency spots contracts 4,758 (6,105)
Net gain (loss) on investments 52,511,103 (16,506,574)Securities lending (note 11) 13,999 10,244Net realized and unrealized foreign currency translation gain
(loss) (83,873) (96,883)Other income – 328
Total income (loss), net 52,441,229 (16,592,885)
EXPENSESManagement fees (note 5) 50,147 14,797Fixed administration fees (note 6) 124,265 117,240Independent Review Committee fees 576 563Interest expense and bank overdraft charges 742 5,201Foreign withholding taxes/tax reclaims 437,185 404,639Other fund costs – 60Harmonized Sales Tax/Goods and Services Tax 15,085 13,160Transaction costs 43,399 62,163
Total expenses 671,399 617,823
Increase (decrease) in net assets attributable to holders ofredeemable units from operations 51,769,830 (17,210,708)
INCREASE (DECREASE) IN NET ASSETS ATTRIBUTABLE TOHOLDERS OF REDEEMABLE UNITS FROM OPERATIONS PERSERIES
Pinnacle Series 3,958,563 (3,259,812)Series F 1,221,672 31,441Series I 46,589,595 (13,982,337)
INCREASE (DECREASE) IN NET ASSETS ATTRIBUTABLE TOHOLDERS OF REDEEMABLE UNITS FROM OPERATIONS PERUNIT†
Pinnacle Series 3.40 (2.11)Series F 3.19 0.24Series I 3.50 (1.03)
WEIGHTED AVERAGE NUMBER OF UNITS PER SERIESPinnacle Series 1,162,886 1,542,756Series F 382,877 133,407Series I 13,327,397 13,516,113
† The increase (decrease) in net assets attributable to holders of redeemable units fromoperations per unit is calculated by dividing the increase (decrease) in net assetsattributable to holders of redeemable units from operations per series by the weightedaverage number of units per series.
The accompanying notes are an integral part of the financial statements. Portfolio Adviser: Harding Loevner LP
FOR
EIG
NE
QU
ITY
FUN
DS
91

Scotia Private Global Equity Pool (Unaudited – Continued)
STATEMENTS OF CHANGES IN NET ASSETSATTRIBUTABLE TO HOLDERS OF REDEEMABLEUNITSFor the periods ended June 30 (note 1),(in dollars) 2017 2016
NET ASSETS ATTRIBUTABLE TO HOLDERS OF REDEEMABLEUNITS, BEGINNING OF PERIOD
Pinnacle Series 29,903,016 67,455,122Series F 9,424,124 1,248,646Series I 339,369,606 320,985,509
378,696,746 389,689,277
INCREASE (DECREASE) IN NET ASSETS ATTRIBUTABLE TOHOLDERS OF REDEEMABLE UNITS FROM OPERATIONS
Pinnacle Series 3,958,563 (3,259,812)Series F 1,221,672 31,441Series I 46,589,595 (13,982,337)
51,769,830 (17,210,708)
REDEEMABLE UNIT TRANSACTIONSProceeds from issue
Pinnacle Series 989,146 2,793,611Series F 1,487,947 4,866,590Series I 1,097,750 27,115,000
Payments on redemptionPinnacle Series (3,970,725) (36,654,747)Series F (1,962,641) (401,783)Series I (25,223,700) (15,883,567)
(27,582,223) (18,164,896)
INCREASE (DECREASE) IN NET ASSETS ATTRIBUTABLE TOHOLDERS OF REDEEMABLE UNITS
Pinnacle Series 976,984 (37,120,948)Series F 746,978 4,496,248Series I 22,463,645 (2,750,904)
24,187,607 (35,375,604)
NET ASSETS ATTRIBUTABLE TO HOLDERS OF REDEEMABLEUNITS, END OF PERIOD
Pinnacle Series 30,880,000 30,334,174Series F 10,171,102 5,744,894Series I 361,833,251 318,234,605
402,884,353 354,313,673
STATEMENTS OF CASH FLOWSFor the periods ended June 30 (note 1),(in dollars) 2017 2016
CASH FLOWS FROM OPERATING ACTIVITIESIncrease (decrease) in net assets attributable to holders of
redeemable units 51,769,830 (17,210,708)Adjustments for:
Net realized (gain) loss on non-derivative financial assets (20,695,147) (11,584,753)Unrealized foreign currency translation (gain) loss 2,733 18,682Change in unrealized (gain) loss on non-derivative
financial assets (28,647,221) 31,171,215Change in unrealized (gain) loss on currency spot
contracts (4,758) 6,105Purchases of portfolio investments (26,620,954) (54,744,699)Proceeds from sale of portfolio investments 56,211,251 69,288,813Accrued investment income and other (78,500) (120,062)Accrued expenses and other payables 32,492 25,231
Net cash provided by (used in) operating activities 31,969,726 16,849,824
CASH FLOWS FROM FINANCING ACTIVITIESProceeds from issue of redeemable units 3,512,850 34,780,952Amounts paid on redemption of redeemable units (31,379,456) (52,910,618)
Net cash provided by (used in) financing activities (27,866,606) (18,129,666)Unrealized foreign currency translation gain (loss) (2,733) (18,682)Net increase (decrease) in cash 4,103,120 (1,279,842)Cash (bank overdraft), beginning of period 5,184,048 14,801,642
CASH (BANK OVERDRAFT), END OF PERIOD 9,284,435 13,503,118
Interest paid(1) 742 5,201Interest received(1) 8,094 21,661Dividends received, net of withholding taxes(1) 2,640,196 2,539,630
(1) Classified as operating items.
The accompanying notes are an integral part of the financial statements. Portfolio Adviser: Harding Loevner LP
FOR
EIG
NE
QU
ITY
FUN
DS
92

Scotia Private Global Equity Pool (Unaudited – Continued)
SCHEDULE OF INVESTMENT PORTFOLIOAs at June 30, 2017
IssuerNumber of
SharesAverageCost ($)
CarryingValue ($)
EQUITIES – 97.8%Denmark – 2.4%Chr Hansen Holding A/S 54,200 3,981,078 5,107,469Novozymes A/S, Class B 78,700 3,813,469 4,466,309
7,794,547 9,573,778
Finland – 1.1%Kone Oyj 66,400 3,919,764 4,386,822
France – 3.6%Air Liquide SA 27,200 3,061,141 4,379,156Essilor International SA 36,850 4,629,867 6,104,054L’Oreal SA 15,600 2,275,261 4,212,171
9,966,269 14,695,381
Germany – 3.7%Bayerische Motoren Werke AG 37,100 4,839,786 4,473,637Linde AG 23,200 4,859,659 5,709,058Symrise AG 51,600 4,205,592 4,736,487
13,905,037 14,919,182
Hong Kong – 4.4%AIA Group Ltd. 1,154,700 6,424,789 10,943,199Tencent Holdings Limited 147,400 3,798,204 6,820,156
10,222,993 17,763,355
Italy – 1.4%Luxottica Group SpA 72,600 5,027,420 5,457,429
Japan – 10.7%FANUC Corporation 15,200 2,392,977 3,805,290Keyence Corporation 11,586 1,949,490 6,611,587Kubota Corporation 368,400 7,268,611 8,048,500M3, Inc. 302,349 5,792,030 10,823,047Makita Corporation 80,500 2,639,475 3,864,567Monotaro Co., Ltd. 110,000 1,890,276 4,603,918PIGEON CORPORATION 47,518 1,401,282 2,235,533Sysmex Corporation 40,476 3,542,103 3,138,202
26,876,244 43,130,644
Spain – 2.2%Banco Bilbao Vizcaya Argentaria S.A. 800,950 7,214,895 8,672,508
Sweden – 1.3%Atlas Copco AB, Class A 103,400 3,541,241 5,161,051
Switzerland – 2.7%Lonza Group AG 23,000 1,999,673 6,446,886Sonova Holdings AG 20,900 2,476,714 4,397,826
4,476,387 10,844,712
United Kingdom – 4.4%Abcam PLC 214,064 2,296,206 3,519,032Reckitt Benkiser Group PLC 36,070 4,077,610 4,742,129Shire PLC 65,300 5,731,539 4,661,687WPP Group PLC 177,900 2,853,592 4,850,023
14,958,947 17,772,871
United States – 59.9%Grifols S.A.– ADR 241,800 5,079,191 6,624,0993M Company 16,300 1,898,276 4,399,654Abbott Laboratories 62,900 2,280,184 3,964,125Alphabet Inc., Class A 13,820 10,721,330 16,657,605Amazon.com, Inc. 3,546 1,491,543 4,450,257AmerisourceBergen Corporation 44,200 4,992,667 5,417,052Check Point Software Technologies Ltd. 33,800 3,888,147 4,780,055Cognex Corporation 50,800 2,418,519 5,591,682Colgate-Palmolive Company 65,750 3,630,700 6,319,181Ctrip.com International Ltd.– ADR 60,300 3,272,609 4,210,704eBay Inc. 100,400 4,502,388 4,545,472
IssuerNumber of
SharesAverageCost ($)
CarryingValue ($)
EQUITIES (cont'd)United States (cont'd)Exxon Mobil Corporation 41,700 3,839,577 4,364,576F5 Networks, Inc. 45,600 5,773,888 7,511,812Facebook Inc. 34,000 3,486,589 6,655,327First Republic Bank 56,700 2,615,823 7,358,481ICICI Bank Limited – ADR 555,390 5,648,337 6,458,944IPG Photonics Corporation 39,900 3,005,130 7,506,048Lazard Ltd. 71,849 2,905,716 4,315,728MasterCard, Inc., Class A 33,600 2,703,358 5,290,635Microsoft Corporation 38,600 1,446,723 3,449,583Monsanto Company 26,000 2,635,473 3,989,784Nestle S.A. – ADR 68,900 4,614,011 7,789,449NIKE, Inc., Class B 162,300 5,819,069 12,414,853PayPal Holdings Inc. 161,600 5,457,759 11,244,599Priceline Group Inc., The 5,850 9,321,256 14,186,957Regeneron Pharmaceuticals, Inc. 14,400 6,925,483 9,169,356Roper Technologies Inc. 39,800 5,927,701 11,947,069Schlumberger Limited 119,300 10,609,823 10,183,599Signature Bank 19,900 3,652,518 3,703,112SVB Financial Group 40,300 4,133,917 9,184,812Tenaris S.A. – ADR 120,300 3,731,599 4,856,857Verisk Analytics, Inc. 79,000 6,308,364 8,641,441WABCO Holdings Inc. 25,640 3,788,298 4,238,706Walgreens Boots Alliance Inc. 40,800 4,647,140 4,142,366Waters Corporation 23,700 2,839,968 5,648,842
156,013,074 241,212,822
Transaction Costs (142,541) –
TOTAL INVESTMENT PORTFOLIO 263,774,277 393,590,555
OTHER ASSETS, LESS LIABILITIES – 2.2% 9,293,798
NET ASSETS – 100.0% 402,884,353
The accompanying notes are an integral part of the financial statements. Portfolio Adviser: Harding Loevner LP
FOR
EIG
NE
QU
ITY
FUN
DS
93

Scotia Private Global Equity Pool (Unaudited – Continued)
FUND SPECIFIC NOTESFor the periods indicated in Note 1
The Fund (note 1)
The Fund’s investment objective is to achieve long term returnsthrough capital growth by investing primarily in stocks of largecapitalization companies in North America, Europe, Australia and theFar East.
Risks associated with financial instruments (note 4)
Interest rate risk
The majority of the Fund’s financial instruments were non-interestbearing as at June 30, 2017 and December 31, 2016. Accordingly, theFund is not directly subject to significant risk due to fluctuations inthe prevailing levels of market interest rates.
Currency risk
The Fund’s exposure to currency risk is summarized in the tablesbelow. Amounts shown are based on the carrying value of monetary andnon-monetary assets and liabilities of the Fund net of currencycontracts, as applicable.
June 30, 2017
CurrencyGross currencyexposure ($)
Currencycontracts ($)
Netexposure ($)
Percentage ofnet assets (%)
US Dollar 241,361,422 – 241,361,422 59.9Euro 48,131,322 – 48,131,322 11.9Japanese Yen 43,208,630 – 43,208,630 10.7British Pound 17,884,108 – 17,884,108 4.4Hong Kong Dollar 17,763,356 – 17,763,356 4.4Swiss Franc 10,844,712 – 10,844,712 2.7Danish Krone 9,573,777 – 9,573,777 2.4
Swedish Krona 5,161,051 – 5,161,051 1.3
393,928,378 – 393,928,378 97.7
December 31, 2016
CurrencyGross currencyexposure ($)
Currencycontracts ($)
Netexposure ($)
Percentage ofnet assets (%)
US Dollar 241,415,097 2,026,890 243,441,987 64.3Japanese Yen 42,564,123 – 42,564,123 11.2Euro 39,133,041 – 39,133,041 10.3British Pound 16,642,507 – 16,642,507 4.4Hong Kong Dollar 14,436,251 – 14,436,251 3.8Swiss Franc 9,330,896 – 9,330,896 2.5Danish Krone 7,940,542 48,593 7,989,135 2.1
Swedish Krona 4,479,164 – 4,479,164 1.2
375,941,621 2,075,483 378,017,104 99.8
If the Canadian dollar strengthened or weakened by 10% in relation toall other currencies, with all other variables held constant, net assetsof the Fund could possibly have decreased or increased, respectively,by $39,392,838 or 9.8% of net assets (December 31, 2016 – $37,801,711or 9.9%). In practice, actual results may differ from this sensitivityanalysis and the difference could be material.
Price risk
Price risk is the risk that the carrying value of financial instrumentswill fluctuate as a result of changes in market prices (other than thosearising from interest rate risk or currency risk) caused by factorsspecific to a security, its issuer or all factors affecting a market or a
market segment. Exposure to price risk is mainly in equities,underlying funds, derivatives and commodities, as applicable. As atJune 30, 2017, approximately 97.8% (December 31, 2016 – 99.3%) ofthe Fund’s net assets were exposed to price risk. If prices of theseinstruments had decreased or increased by 10%, with all othervariables held constant, net assets of the Fund would have decreasedor increased, respectively, by approximately $39,359,056 (December31, 2016 – $37,594,162). In practice, actual results may differ from thissensitivity analysis and the difference could be material.
Credit risk
The Fund had no significant exposure to bonds and debentures, moneymarket instruments or preferred shares as at June 30, 2017 orDecember 31, 2016.
Concentration risk
Concentration risk arises as a result of the concentration of exposureswithin the same category, geographical location, asset type or industrysector, as applicable. The table below is a summary of the Fund’sconcentration risk:
Percentage of net assets (%)
June 30, 2017 December 31, 2016
Denmark 2.4 2.1Finland 1.1 1.1France 3.6 4.9Germany 3.7 0.8Hong Kong 4.4 3.8Italy 1.4 1.5Japan 10.7 11.2Spain 2.2 2.1Sweden 1.3 1.2Switzerland 2.7 2.5United Kingdom 4.4 4.4United States 59.9 63.7
Fair Value Classification (note 2)
The tables below illustrate the classification of the Fund’s financialinstruments within the fair value hierarchy.
June 30, 2017Level 1
($)Level 2
($)Level 3
($)Total($)
Equities 241,212,822 152,377,733 – 393,590,555Unrealized gain on currency spot
contracts – 5 – 5
241,212,822 152,377,738 – 393,590,560
December 31, 2016Level 1
($)Level 2
($)Level 3
($)Total($)
Equities 241,415,097 134,526,524 – 375,941,621
241,415,097 134,526,524 – 375,941,621
Unrealized loss on currency spotcontracts – (4,753) – (4,753)
241,415,097 134,521,771 – 375,936,868
Transfers between levels
During the periods ended June 30, 2017 and December 31, 2016, therewere no significant transfers between Level 1 and Level 2.
The accompanying notes are an integral part of the financial statements.
FOR
EIG
NE
QU
ITY
FUN
DS
94

Scotia Private Global Equity Pool (Unaudited – Continued)
FUND SPECIFIC NOTESFor the periods indicated in Note 1
Offsetting of financial assets and liabilities (note 2)
As at June 30, 2017 and December 31, 2016, the Fund did not enter intoany agreement whereby the financial instruments were eligible foroffset.
Interest in Underlying Funds (note 2)
The Fund did not hold any interest in Underlying Funds as at June 30,2017 or December 31, 2016.
Comparison of net asset value per unit and net assets per unit(note 2)
The table below provides a comparison of the net asset value per unitand net assets per unit. A difference could arise when the last tradedmarket price for a financial instrument is not within the bid-ask spread(note 2).
June 30, 2017 December 31, 2016
Net asset valueper unit
($)
Net assetsper unit
($)
Net asset valueper unit
($)
Net assetsper unit
($)
Pinnacle Series 27.74 27.74 24.37 24.38Series F 27.36 27.36 24.17 24.17Series I 28.18 28.18 24.75 24.75
The accompanying notes are an integral part of the financial statements.
FOR
EIG
NE
QU
ITY
FUN
DS
95

Scotia Private Global Real Estate Pool (Unaudited)
STATEMENTS OF FINANCIAL POSITIONAs at
(in dollars)June 30,
2017December 31,
2016
ASSETSCurrent assetsInvestments
Non-derivative financial assets 326,828,332 302,231,338Cash 16,589,270 14,850,739Receivable for securities sold 1,454,217 793,688Subscriptions receivable 661,374 340,421Accrued investment income and other 807,244 1,203,533
346,340,437 319,419,719
LIABILITIESCurrent liabilitiesManagement fee payable 739 –Payable for securities purchased 7,025,286 384,348Redemptions payable 523,860 73,390Accrued expenses 21,733 681Unrealized loss on currency spot contracts 3,362 –
7,574,980 458,419
Net assets attributable to holders of redeemable units 338,765,457 318,961,300
NET ASSETS ATTRIBUTABLE TO HOLDERS OF REDEEMABLEUNITS PER SERIES
Pinnacle Series 156,828,192 151,089,747Series F 791,048 940,882Series I 181,146,217 166,930,671
NET ASSETS ATTRIBUTABLE TO HOLDERS OF REDEEMABLEUNITS PER UNIT
Pinnacle Series 18.06 17.72Series F 17.60 17.39Series I 18.69 18.38
STATEMENTS OF COMPREHENSIVE INCOMEFor the periods ended June 30 (note 1),(in dollars except average units) 2017 2016
INCOMENet gain (loss) on investments
Dividends 4,493,240 5,400,001Interest for distribution purposes 144,996 103,010Net realized gain (loss) on non-derivative financial assets 5,848,594 24,745,899Change in unrealized gain (loss) on non-derivative financial
assets (2,194,421) (24,551,930)Change in unrealized gain (loss) on currency spots contracts (3,362) 795
Net gain (loss) on investments 8,289,047 5,697,775Securities lending (note 11) 1,457 717Net realized and unrealized foreign currency translation gain
(loss) (933,551) (445,493)Other income 1,007 60
Total income (loss), net 7,357,960 5,253,059
EXPENSESManagement fees (note 5) 4,226 9,217Fixed administration fees (note 6) 111,777 99,490Independent Review Committee fees 576 563Interest expense and bank overdraft charges – 1,407Foreign withholding taxes/tax reclaims 574,348 689,229Other fund costs – 49Harmonized Sales Tax/Goods and Services Tax 11,387 10,975Transaction costs 632,651 477,880
Total expenses 1,334,965 1,288,810
Increase (decrease) in net assets attributable to holders ofredeemable units from operations 6,022,995 3,964,249
INCREASE (DECREASE) IN NET ASSETS ATTRIBUTABLE TOHOLDERS OF REDEEMABLE UNITS FROM OPERATIONSPER SERIES
Pinnacle Series 2,900,985 1,583,280Series F 8,209 11,932Series I 3,113,801 2,369,037
INCREASE (DECREASE) IN NET ASSETS ATTRIBUTABLE TOHOLDERS OF REDEEMABLE UNITS FROM OPERATIONS PERUNIT†
Pinnacle Series 0.34 0.21Series F 0.17 0.12Series I 0.33 0.31
WEIGHTED AVERAGE NUMBER OF UNITS PER SERIESPinnacle Series 8,634,634 7,452,914Series F 48,296 102,233Series I 9,489,268 7,641,199
† The increase (decrease) in net assets attributable to holders of redeemable units fromoperations per unit is calculated by dividing the increase (decrease) in net assetsattributable to holders of redeemable units from operations per series by the weightedaverage number of units per series.
The accompanying notes are an integral part of the financial statements. Portfolio Adviser: Delaware Investment Advisers
FOR
EIG
NE
QU
ITY
FUN
DS
96

Scotia Private Global Real Estate Pool (Unaudited – Continued)
STATEMENTS OF CHANGES IN NET ASSETSATTRIBUTABLE TO HOLDERS OF REDEEMABLEUNITSFor the periods ended June 30 (note 1),(in dollars) 2017 2016
NET ASSETS ATTRIBUTABLE TO HOLDERS OF REDEEMABLEUNITS, BEGINNING OF PERIOD
Pinnacle Series 151,089,747 190,167,234Series F 940,882 1,828,143Series I 166,930,671 152,836,745
318,961,300 344,832,122
INCREASE (DECREASE) IN NET ASSETS ATTRIBUTABLE TO HOLDERS OFREDEEMABLE UNITS FROM OPERATIONS
Pinnacle Series 2,900,985 1,583,280Series F 8,209 11,932Series I 3,113,801 2,369,037
6,022,995 3,964,249
REDEEMABLE UNIT TRANSACTIONSProceeds from issue
Pinnacle Series 18,744,289 19,940,129Series F 25,603 328,238Series I 12,396,645 11,967,750
Payments on redemptionPinnacle Series (15,906,829) (66,355,821)Series F (183,646) (164,295)Series I (1,294,900) (9,739,700)
13,781,162 (44,023,699)
INCREASE (DECREASE) IN NET ASSETS ATTRIBUTABLE TOHOLDERS OF REDEEMABLE UNITS
Pinnacle Series 5,738,445 (44,832,412)Series F (149,834) 175,875Series I 14,215,546 4,597,087
19,804,157 (40,059,450)
NET ASSETS ATTRIBUTABLE TO HOLDERS OF REDEEMABLEUNITS, END OF PERIOD
Pinnacle Series 156,828,192 145,334,822Series F 791,048 2,004,018Series I 181,146,217 157,433,832
338,765,457 304,772,672
STATEMENTS OF CASH FLOWSFor the periods ended June 30 (note 1),(in dollars) 2017 2016
CASH FLOWS FROM OPERATING ACTIVITIESIncrease (decrease) in net assets attributable to holders of
redeemable units 6,022,995 3,964,249Adjustments for:
Net realized (gain) loss on non-derivative financialassets (5,848,594) (24,745,899)
Unrealized foreign currency translation (gain) loss 405,250 227,617Change in unrealized (gain) loss on non-derivative
financial assets 2,194,421 24,551,930Change in unrealized (gain) loss on currency spot
contracts 3,362 (795)Purchases of portfolio investments (357,560,253) (245,740,587)Proceeds from sale of portfolio investments 342,597,840 281,160,805Accrued investment income and other 396,289 43,874Accrued expenses and other payables 21,791 19,772
Net cash provided by (used in) operating activities (11,766,899) 39,480,966
CASH FLOWS FROM FINANCING ACTIVITIESProceeds from issue of redeemable units 30,845,585 31,945,345Amounts paid on redemption of redeemable units (16,934,905) (76,114,155)
Net cash provided by (used in) financing activities 13,910,680 (44,168,810)Unrealized foreign currency translation gain (loss) (405,250) (227,617)Net increase (decrease) in cash 2,143,781 (4,687,844)Cash (bank overdraft), beginning of period 14,850,739 18,142,720
CASH (BANK OVERDRAFT), END OF PERIOD 16,589,270 13,227,259
Interest paid(1) – 1,407Interest received(1) 137,624 96,043Dividends received, net of withholding taxes(1) 4,322,552 4,787,364
(1) Classified as operating items.
The accompanying notes are an integral part of the financial statements. Portfolio Adviser: Delaware Investment Advisers
FOR
EIG
NE
QU
ITY
FUN
DS
97

Scotia Private Global Real Estate Pool (Unaudited – Continued)
SCHEDULE OF INVESTMENT PORTFOLIOAs at June 30, 2017
IssuerNumber of
SharesAverageCost ($)
CarryingValue ($)
EQUITIES – 96.3%Australia – 4.6%Charter Hall Group 211,835 1,040,598 1,160,269Dexus Property Group 392,071 3,723,546 3,700,818Goodman Group 905,394 6,412,884 7,093,918Scentre Group 931,308 4,063,349 3,754,902
15,240,377 15,709,907
Canada – 0.8%Canadian Real Estate Investment Trust 60,300 2,958,866 2,765,961
France – 0.6%Gecina SA 10,541 1,954,853 2,142,609
Germany – 2.9%Alstria Office Real Estate Investment Trust AG 96,974 1,710,670 1,699,281Deutsche Wohnen AG-Br 166,741 7,345,218 8,268,826
9,055,888 9,968,107
Hong Kong – 7.7%Cheung Kong Property Holdings Ltd 1,087,500 9,719,284 11,045,143Hongkong Land Holdings Limited 408,329 3,616,363 3,896,527Link Real Estate Investment Trust, The 584,700 5,023,648 5,768,202Sun Hung Kai Properties Limited 286,341 5,273,574 5,454,717
23,632,869 26,164,589
Japan – 6.6%Japan Rental Housing Investments Inc. 2,700 2,621,204 2,582,628Mitsui Fudosan Co., Ltd. 296,500 9,463,183 9,189,904Orix JREIT Inc. 875 1,811,742 1,673,225Sumitomo Realty & Development Co., Ltd. 202,000 7,659,378 8,094,564United Urban Investment Corporation 461 965,729 852,853
22,521,236 22,393,174
Netherlands – 1.6%Unibail-Rodamco SE 16,564 5,315,264 5,410,981
Singapore – 4.0%CapitaLand Ltd. 1,019,600 3,420,413 3,361,700City Developments Ltd. 525,700 4,678,127 5,313,695Mapletree Commercial Trust 3,263,413 4,594,926 4,902,967
12,693,466 13,578,362
Spain – 1.2%Merlin Properties Socimi S.A. 252,911 3,818,945 4,142,020
United Kingdom – 8.7%Capital & Counties Properties PLC 968,833 4,991,507 4,787,291Grainger PLC 1,814,618 7,584,073 8,056,528Green REIT PLC 2,385,461 4,996,261 5,049,029Shaftesbury PLC 307,852 5,006,506 5,053,771Unite Group PLC 604,820 6,301,493 6,628,065
28,879,840 29,574,684
United States – 57.6%Apartment Investment & Management Company 21,392 1,181,926 1,191,757AvalonBay Communities Inc. 31,705 7,201,528 7,899,223Boston Properties Inc. 14,993 2,563,813 2,391,307Brixmor Property Group Inc. 188,267 5,209,679 4,364,282Brookdale Senior Living Inc. 688,871 12,565,391 13,137,764Camden Property Trust 22,953 2,683,343 2,544,646Columbia Property Trust Inc. 114,292 3,382,551 3,316,248CoreSite Realty Corporation 22,358 2,698,954 3,001,029Crown Castle International Corporation 56,624 7,066,331 7,354,491CubeSmart 43,072 1,469,682 1,342,457DCT Industrial Trust Inc. 90,886 5,435,809 6,297,011Developers Diversified Realty Corporation 111,670 1,333,202 1,313,152Empire State Realty Trust, Inc. 64,555 1,654,409 1,738,351
IssuerNumber of
SharesAverageCost ($)
CarryingValue ($)
EQUITIES (cont'd)United States (cont'd)Equinix Inc. 8,095 4,024,920 4,504,091Equity Commonwealth 112,837 4,356,927 4,622,848Equity LifeStyle Properties Inc. 27,845 2,779,540 3,116,953Equity Residential Real Estate Investment Trust 84,588 7,283,566 7,219,442Essex Property Trust, Inc. 10,022 3,095,601 3,342,832Forest City Realty Trust Inc. 156,735 4,673,649 4,911,495GGP Inc. 404,179 12,952,398 12,345,819HCP, Inc. Real Estate Investment Trust 244,827 9,838,253 10,144,651Host Hotels & Resorts Inc. 91,177 2,111,876 2,159,707Invitation Homes Inc. 110,564 2,962,651 3,100,568Kilroy Realty Corporation 13,329 1,305,822 1,298,666Kimco Realty Corporation 238,698 5,787,705 5,678,791MGM Growth Properties LLC 175,212 5,569,349 6,630,847National Health Investors Inc. 26,727 2,676,401 2,744,394ProLogis 69,361 4,719,354 5,273,274Public Storage Real Estate Investment Trust 10,233 3,029,481 2,766,576Realty Income Corporation 67,316 5,026,927 4,815,829Regency Centers Corporation 89,017 7,595,809 7,229,292Simon Property Group Inc. 48,780 11,281,856 10,230,196SL Green Realty Corporation 9,104 1,311,458 1,248,789Sunstone Hotel Investors, Inc. 136,099 2,515,608 2,844,402UDR Inc. 116,582 5,595,430 5,890,239Urban Edge Properties 77,542 2,626,936 2,385,645VEREIT Inc. 425,201 4,942,374 4,487,348Vornado Realty Trust Real EstateInvestment Trust 52,572 6,811,230 6,400,164Weingarten Realty Investors 130,504 5,818,162 5,092,856Welltower Inc. 88,626 8,077,184 8,600,506
193,217,085 194,977,938
Transaction Costs (292,807)
TOTAL INVESTMENT PORTFOLIO 318,995,882 326,828,332
OTHER ASSETS, LESS LIABILITIES – 3.7% 11,937,125
NET ASSETS – 100.0% 338,765,457
The accompanying notes are an integral part of the financial statements. Portfolio Adviser: Delaware Investment Advisers
FOR
EIG
NE
QU
ITY
FUN
DS
98

Scotia Private Global Real Estate Pool (Unaudited – Continued)
FUND SPECIFIC NOTESFor the periods indicated in Note 1
The Fund (note 1)
The Fund’s objective is to achieve superior long term returns throughincome and capital growth, by investing primarily in U.S., Canadianand non-North American real estate stocks and real estate investmenttrusts (REITs).
Risks associated with financial instruments (note 4)
Interest rate risk
The table below summarizes the Fund’s exposure to interest rate riskby the remaining term to maturity of the Fund’s portfolio, excludingunderlying funds, preferred shares, cash and overdrafts, as applicable.
Interest rate exposureJune 30, 2017
($)December 31, 2016
($)
Less than 1 year – –1-3 years – –3-5 years – 860,1495-10 years – –> 10 years – –
– 860,149
As at June 30, 2017, had the prevailing interest rates increased ordecreased by 0.25%, assuming a parallel shift in the yield curve and allother variables held constant, net assets attributable to holders ofredeemable units would have decreased or increased, respectively, bynil (December 31, 2016 – $7,834 or approximately 0.0%).
Currency risk
The Fund’s exposure to currency risk is summarized in the tablesbelow. Amounts shown are based on the carrying value of monetary andnon-monetary assets and liabilities of the Fund net of currencycontracts, as applicable.
June 30, 2017
CurrencyGross currencyexposure ($)
Currencycontracts ($)
Netexposure ($)
Percentage ofnet assets (%)
US Dollar 209,033,484 – 209,033,484 61.7Euro 26,741,643 – 26,741,643 7.9British Pound 24,607,024 – 24,607,024 7.3Japanese Yen 22,459,428 – 22,459,428 6.6Hong Kong Dollar 22,359,987 – 22,359,987 6.6Australian Dollar 15,882,680 – 15,882,680 4.7Singapore Dollar 13,578,372 – 13,578,372 4.0
334,662,619 – 334,662,619 98.8
December 31, 2016
CurrencyGross currencyexposure ($)
Currencycontracts ($)
Netexposure ($)
Percentage ofnet assets (%)
US Dollar 202,430,836 – 202,430,836 63.5Euro 37,108,360 – 37,108,360 11.6Australian Dollar 22,836,910 – 22,836,910 7.2Japanese Yen 18,877,491 – 18,877,491 5.9British Pound 16,242,257 – 16,242,257 5.1Hong Kong Dollar 9,730,184 – 9,730,184 3.1Singapore Dollar 5,287,851 – 5,287,851 1.7
312,513,889 – 312,513,889 98.1
If the Canadian dollar strengthened or weakened by 10% in relation toall other currencies, with all other variables held constant, net assetsof the Fund could possibly have decreased or increased, respectively,by $33,466,262 or 9.9% of net assets (December 31, 2016 – $31,251,389or 9.8%). In practice, actual results may differ from this sensitivityanalysis and the difference could be material.
Price risk
Price risk is the risk that the carrying value of financial instrumentswill fluctuate as a result of changes in market prices (other than thosearising from interest rate risk or currency risk) caused by factorsspecific to a security, its issuer or all factors affecting a market or amarket segment. Exposure to price risk is mainly in equities,underlying funds, derivatives and commodities, as applicable. As atJune 30, 2017, approximately 96.3% (December 31, 2016 – 94.5%) ofthe Fund’s net assets were exposed to price risk. If prices of theseinstruments had decreased or increased by 10%, with all othervariables held constant, net assets of the Fund would have decreasedor increased, respectively, by approximately $32,682,833(December 31, 2016 – $30,137,119). In practice, actual results maydiffer from this sensitivity analysis and the difference could bematerial.
Credit risk
The table below summarizes the credit ratings of bonds anddebentures, money market instruments and preferred shares held bythe Fund, as applicable.
June 30, 2017 December 31, 2016
Credit ratings
Percentage oftotal credit
ratedinstruments
(%)
Percentage ofnet assets
(%)
Percentage oftotal credit
ratedinstruments
(%)
Percentage ofnet assets
(%)
BBB – – 100.0 0.3
– – 100.0 0.3
Concentration risk
Concentration risk arises as a result of the concentration of exposureswithin the same category, geographical location, asset type or industrysector, as applicable. The table below is a summary of the Fund’sconcentration risk:
Percentage of net assets (%)
June 30, 2017 December 31, 2016
Australia 4.6 7.1Canada 0.8 1.2France 0.6 2.0Germany 2.9 4.9Hong Kong 7.7 4.6Japan 6.6 5.9Netherlands 1.6 2.8Singapore 4.0 1.7Spain 1.2 1.2United Kingdom 8.7 5.9United States 57.6 57.5
The accompanying notes are an integral part of the financial statements.
FOR
EIG
NE
QU
ITY
FUN
DS
99

Scotia Private Global Real Estate Pool (Unaudited – Continued)
FUND SPECIFIC NOTESFor the periods indicated in Note 1
Fair Value Classification (note 2)
The tables below illustrate the classification of the Fund’s financialinstruments within the fair value hierarchy.
June 30, 2017Level 1
($)Level 2
($)Level 3
($)Total($)
Equities 197,743,899 129,084,433 – 326,828,332
197,743,899 129,084,433 – 326,828,332
Unrealized loss on currency spotcontracts – (3,362) – (3,362)
197,743,899 129,081,071 – 326,824,970
December 31, 2016Level 1
($)Level 2
($)Level 3
($)Total($)
Equities 186,522,232 114,848,957 – 301,371,189Bonds and debentures – 860,149 – 860,149
186,522,232 115,709,106 – 302,231,338
Transfers between levels
During the periods ended June 30, 2017 and December 31, 2016, therewere no significant transfers between Level 1 and Level 2.
Offsetting of financial assets and liabilities (note 2)
As at June 30, 2017 and December 31, 2016, the Fund did not enter intoany agreement whereby the financial instruments were eligible foroffset.
Interest in Underlying Funds (note 2)
The Fund did not hold any interest in Underlying Funds as at June 30,2017 or December 31, 2016.
Comparison of net asset value per unit and net assets per unit(note 2)
As at June 30, 2017 or December 31, 2016, there were no differencesbetween the net asset value per unit and the net assets per unit for anyseries of the Fund.
The accompanying notes are an integral part of the financial statements.
FOR
EIG
NE
QU
ITY
FUN
DS
100

Pinnacle Income Portfolio (Unaudited)
STATEMENTS OF FINANCIAL POSITIONAs at
(in dollars)June 30,
2017December 31,
2016
ASSETSCurrent assetsInvestments
Non-derivative financial assets 8,414,846 9,396,902Cash 31,347 1,339Receivable for securities sold 176,700 33,000Accrued investment income and other 8 12
8,622,901 9,431,253
LIABILITIESCurrent liabilitiesManagement fee payable 14,721 –Redemptions payable 175,740 1,000Accrued expenses 1,769 567
192,230 1,567
Net assets attributable to holders of redeemable units 8,430,671 9,429,686
NET ASSETS ATTRIBUTABLE TO HOLDERS OF REDEEMABLEUNITS PER SERIES
Series A 8,430,671 9,429,686
NET ASSETS ATTRIBUTABLE TO HOLDERS OF REDEEMABLEUNITS PER UNIT
Series A 12.25 12.05
STATEMENTS OF COMPREHENSIVE INCOMEFor the periods ended June 30 (note 1),(in dollars except average units) 2017 2016
INCOMENet gain (loss) on investments
Dividends 1,343 2,664Interest for distribution purposes 91,468 136,467Net realized gain (loss) on non-derivative financial assets 109,914 530,689Change in unrealized gain (loss) on non-derivative financial
assets 51,097 (366,954)
Net gain (loss) on investments 253,822 302,866Other income 179 –
Total income (loss), net 254,001 302,866
EXPENSESManagement fees (note 5) 82,462 108,477Fixed administration fees (note 6) 6,686 8,795Independent Review Committee fees 576 563Interest expense and bank overdraft charges 84 –Other fund costs – 2Harmonized Sales Tax/Goods and Services Tax 8,817 11,738
Total expenses 98,625 129,575
Increase (decrease) in net assets attributable to holders ofredeemable units from operations 155,376 173,291
INCREASE (DECREASE) IN NET ASSETS ATTRIBUTABLE TO HOLDERSOF REDEEMABLE UNITS FROM OPERATIONS PER SERIES
Series A 155,376 173,291
INCREASE (DECREASE) IN NET ASSETS ATTRIBUTABLE TO HOLDERSOF REDEEMABLE UNITS FROM OPERATIONS PER UNIT†
Series A 0.21 0.18
WEIGHTED AVERAGE NUMBER OF UNITS PER SERIESSeries A 733,633 970,834
† The increase (decrease) in net assets attributable to holders of redeemable units fromoperations per unit is calculated by dividing the increase (decrease) in net assetsattributable to holders of redeemable units from operations per series by the weightedaverage number of units per series.
STATEMENTS OF CHANGES IN NET ASSETSATTRIBUTABLE TO HOLDERS OF REDEEMABLEUNITSFor the periods ended June 30 (note 1),(in dollars) 2017 2016
NET ASSETS ATTRIBUTABLE TO HOLDERS OF REDEEMABLEUNITS, BEGINNING OF PERIOD
Series A 9,429,686 11,804,572
INCREASE (DECREASE) IN NET ASSETS ATTRIBUTABLE TOHOLDERS OF REDEEMABLE UNITS FROM OPERATIONS
Series A 155,376 308,001
DISTRIBUTIONS TO HOLDERS OF REDEEMABLE UNITSFrom net investment income
Series A – (43,134)From net realized gains on investments
Series A – (310,209)
– (353,343)
REDEEMABLE UNIT TRANSACTIONSProceeds from issue
Series A 118,133 1,029,725Reinvested distributions
Series A – 332,404Payments on redemption
Series A (1,272,524) (3,691,673)
INCREASE (DECREASE) IN NET ASSETS ATTRIBUTABLE TOHOLDERS OF REDEEMABLE UNITS
Series A (999,015) (2,374,886)
NET ASSETS ATTRIBUTABLE TO HOLDERS OF REDEEMABLEUNITS, END OF PERIOD
Series A 8,430,671 9,429,686
STATEMENTS OF CASH FLOWSFor the periods ended June 30 (note 1),(in dollars) 2017 2016
CASH FLOWS FROM OPERATING ACTIVITIESIncrease (decrease) in net assets attributable to holders of
redeemable units 155,376 173,291Adjustments for:
Net realized (gain) loss on non-derivative financial assets (109,914) (530,689)Change in unrealized (gain) loss on non-derivative financial
assets (51,097) 366,954Non-cash transactions (92,733) (138,871)Purchases of portfolio investments (9,999) (1,798,900)Proceeds from sale of portfolio investments 1,102,099 1,747,169Accrued investment income and other 4 1Accrued expenses and other payables 15,923 21,676
Net cash provided by (used in) operating activities 1,009,659 (159,369)
CASH FLOWS FROM FINANCING ACTIVITIESProceeds from issue of redeemable units 118,133 831,367Amounts paid on redemption of redeemable units (1,097,784) (777,736)
Net cash provided by (used in) financing activities (979,651) 53,631Net increase (decrease) in cash 30,008 (105,738)Cash (bank overdraft), beginning of period 1,339 126,526
CASH (BANK OVERDRAFT), END OF PERIOD 31,347 20,788
Interest paid(1) 84 –Interest received(1) 80 262
(1) Classified as operating items.
The accompanying notes are an integral part of the financial statements. Portfolio Adviser: 1832 Asset Management L.P.
TH
EP
INN
AC
LEP
OR
TFO
LIO
S
101

Pinnacle Income Portfolio (Unaudited – Continued)
SCHEDULE OF INVESTMENT PORTFOLIOAs at June 30, 2017
IssuerNumber of
UnitsAverageCost ($)
CarryingValue ($)
CANADIAN EQUITY FUNDS – 11.0%Scotia Private Canadian Growth Pool Series I 22,625 281,366 378,249Scotia Private Canadian Small Cap Pool Series I 6,415 203,911 253,729Scotia Private Canadian Value Pool Series I 12,555 228,630 296,216
713,907 928,194
FIXED INCOME FUNDS – 69.8%Scotia Private American Core-Plus Bond Pool Series I 131,548 1,119,825 1,261,760Scotia Private High Yield Income Pool Series I 90,867 811,095 840,971Scotia Private Income Pool Series I 352,369 3,877,700 3,780,568
5,808,620 5,883,299
FOREIGN EQUITY FUNDS – 19.0%Scotia Private Emerging Markets Pool Series I 15,583 144,120 170,719Scotia Private Global Real Estate Pool Series I 17,947 220,843 335,816Scotia Private International Equity Pool Series I 21,802 266,239 294,631Scotia Private International Small to Mid Cap ValuePool Series I 5,328 85,606 170,176Scotia Private U.S. Large Cap Growth Pool Series I 11,625 220,891 252,486Scotia Private U.S. Mid Cap Value Pool Series I 10,755 167,749 191,282Scotia Private U.S. Value Pool Series I 12,234 130,202 188,243
1,235,650 1,603,353
TOTAL INVESTMENT PORTFOLIO 7,758,177 8,414,846
OTHER ASSETS, LESS LIABILITIES – 0.2% 15,825
NET ASSETS – 100.0% 8,430,671
The accompanying notes are an integral part of the financial statements. Portfolio Adviser: 1832 Asset Management L.P.
TH
EP
INN
AC
LEP
OR
TFO
LIO
S
102

Pinnacle Income Portfolio (Unaudited – Continued)
FUND SPECIFIC NOTESFor the periods indicated in Note 1
The Fund (note 1)
The Fund’s objective is to generate current income and long-termcapital growth, with a bias towards income. It invests primarily in amix of equity and income mutual funds managed by us.
The Fund invests primarily in funds managed by the Manager and/or bythe third party investment managers (the ‘‘Underlying Funds’’). Toensure the Fund’s composition meets the investment objectives of theFund, the portfolio advisor monitors the Underlying Funds on anongoing basis and rebalances the Fund’s assets among the UnderlyingFunds.
Risk associated with financial instruments (note 4)
Interest rate risk
The Fund could be exposed to indirect interest rate risk to the extentthat the Underlying Funds held financial instruments that weresubject to interest rate risk.
Currency risk
The Fund could be exposed to indirect currency risk to the extent thatthe Underlying Funds held financial instruments that weredenominated in a currency other than its functional currency.
Price risk
Price risk is the risk that the carrying value of financial instrumentswill fluctuate as a result of changes in market prices (other than thosearising from interest rate risk or currency risk) caused by factorsspecific to a security, its issuer or all factors affecting a market or amarket segment. Exposure to price risk is mainly in equities,underlying funds, derivatives and commodities, as applicable. As atJune 30, 2017, approximately 99.8% (December 31, 2016 – 99.7%) ofthe Fund’s net assets were exposed to price risk. If prices of theseinstruments had decreased or increased by 10%, with all othervariables held constant, net assets of the Fund would have decreasedor increased, respectively, by approximately $841,485 (December 31,2016 – $939,690). In practice, actual results may differ from thissensitivity analysis and the difference could be material.
Credit risk
The Fund could be exposed to indirect credit risk to the extent thatthe Underlying Funds invested in bonds and debentures, money marketinstruments or preferred shares.
Concentration risk
Concentration risk arises as a result of the concentration of exposureswithin the same category, geographical location, asset type or industry
sector, as applicable. The table below is a summary of the Fund’sconcentration risk:
Percentage of net assets (%)
June 30, 2017 December 31, 2016
Canadian Equity Funds 11.0 11.1Fixed Income Funds 69.8 69.7Foreign Equity Funds 19.0 18.9
Fair Value Classification (note 2)
The tables below illustrate the classification of the Fund’s financialinstruments within the fair value hierarchy.
June 30, 2017Level 1
($)Level 2
($)Level 3
($)Total($)
Underlying funds 8,414,846 – – 8,414,846
8,414,846 – – 8,414,846
December 31, 2016Level 1
($)Level 2
($)Level 3
($)Total($)
Underlying funds 9,396,902 – – 9,396,902
9,396,902 – – 9,396,902
Transfers between levels
During the periods ended June 30, 2017 and December 31, 2016, therewere no significant transfers between Level 1 and Level 2.
Offsetting of financial assets and liabilities (note 2)
As at June 30, 2017 and December 31, 2016, the Fund did not enter intoany agreement whereby the financial instruments were eligible foroffset.
Interest in Underlying Funds (note 2)
The following tables present the percentage of the Underlying Fundsowned by the Fund.
June 30, 2017
Underlying Fund
Carrying value ofthe Underlying Fund
($)
Ownership percentagein Underlying Fund
(%)
Scotia Private Income Pool Series I 3,780,568 0.7Scotia Private International Small to
Mid-Cap Value Pool Series I 170,176 0.3Scotia Private Canadian Growth Pool
Series I 378,249 0.2Scotia Private Canadian Value Pool
Series I 296,216 0.2Scotia Private U.S. Large Cap Growth
Pool Series I 252,486 0.2Scotia Private U.S. Mid Cap Value Pool
Series I 191,282 0.2Scotia Private U.S. Value Pool Series I 188,243 0.2Scotia Private American Core-Plus Bond
Pool Series I 1,261,760 0.1Scotia Private High Yield Income Pool
Series I 840,971 0.1Scotia Private Emerging Markets Pool
Series I 170,719 0.1Scotia Private Global Real Estate Pool
Series I 335,816 0.1Scotia Private Canadian Small Cap Pool
Series I 253,729 0.0Scotia Private International Equity Pool
Series I 294,631 0.0
8,414,846
The accompanying notes are an integral part of the financial statements.
TH
EP
INN
AC
LEP
OR
TFO
LIO
S
103

Pinnacle Income Portfolio (Unaudited – Continued)
FUND SPECIFIC NOTESFor the periods indicated in Note 1
December 31, 2016
Underlying Fund
Carrying value ofthe Underlying Fund
($)
Ownership percentagein Underlying Fund
(%)
Scotia Private Income Pool Series I 4,211,897 0.9Scotia Private International Small to Mid
Cap Value Pool Series I 191,187 0.3Scotia Private Canadian Growth Pool
Series I 431,735 0.2Scotia Private U.S. Mid Cap Value Pool
Series I 207,599 0.2Scotia Private American Core-Plus Bond
Pool Series I 1,412,065 0.2Scotia Private U.S. Large Cap Growth
Pool Series I 275,674 0.2Scotia Private Canadian Value Pool
Series I 331,040 0.2Scotia Private U.S. Value Pool Series I 209,475 0.2Scotia Private High Yield Income Pool
Series I 945,490 0.1Scotia Private Emerging Markets Pool
Series I 190,438 0.1Scotia Private Global Real Estate Pool
Series I 378,205 0.1Scotia Private Canadian Small Cap Pool
Series I 285,006 0.0Scotia Private International Equity Pool
Series I 327,091 0.0
9,396,902
Comparison of net asset value and net assets per unit (note 2)
As at June 30, 2017 or December 31, 2016, there were no differencesbetween the net asset value per unit and the net assets per unit for anyseries of the Fund.
The accompanying notes are an integral part of the financial statements.
TH
EP
INN
AC
LEP
OR
TFO
LIO
S
104

Pinnacle Balanced Portfolio (Unaudited)
STATEMENTS OF FINANCIAL POSITIONAs at
(in dollars)June 30,
2017December 31,
2016
ASSETSCurrent assetsInvestments
Non-derivative financial assets 61,064,677 64,712,077Cash 310,199 186,565Receivable for securities sold 412,000 –Subscriptions receivable 8,632 641,351Accrued investment income and other 73 66
61,795,581 65,540,059
LIABILITIESCurrent liabilitiesManagement fee payable 118,705 –Redemptions payable 517,645 91,256Accrued expenses 5,098 4,211
641,448 95,467
Net assets attributable to holders of redeemable units 61,154,133 65,444,592
NET ASSETS ATTRIBUTABLE TO HOLDERS OF REDEEMABLEUNITS PER SERIES
Series A 61,154,133 65,444,592
NET ASSETS ATTRIBUTABLE TO HOLDERS OF REDEEMABLEUNITS PER UNIT
Series A 14.49 14.26
STATEMENTS OF COMPREHENSIVE INCOMEFor the periods ended June 30 (note 1),(in dollars except average units) 2017 2016
INCOMENet gain (loss) on investments
Dividends 9,807 14,686Interest for distribution purposes 383,544 500,542Net realized gain (loss) on non-derivative financial assets 1,189,805 2,866,578Change in unrealized gain (loss) on non-derivative financial
assets 261,564 (2,210,533)
Net gain (loss) on investments 1,844,720 1,171,273Other income 241 617
Total income (loss), net 1,844,961 1,171,890
EXPENSESManagement fees (note 5) 671,737 754,103Fixed administration fees (note 6) 25,590 28,728Independent Review Committee fees 576 563Interest expense and bank overdraft charges 117 43Other fund costs – 12Harmonized Sales Tax/Goods and Services Tax 64,433 70,599
Total expenses 762,453 854,048
Increase (decrease) in net assets attributable to holders ofredeemable units from operations 1,082,508 317,842
INCREASE (DECREASE) IN NET ASSETS ATTRIBUTABLE TO HOLDERSOF REDEEMABLE UNITS FROM OPERATIONS PER SERIES
Series A 1,082,508 317,842
INCREASE (DECREASE) IN NET ASSETS ATTRIBUTABLE TO HOLDERSOF REDEEMABLE UNITS FROM OPERATIONS PER UNIT†
Series A 0.24 0.06
WEIGHTED AVERAGE NUMBER OF UNITS PER SERIESSeries A 4,437,455 5,366,024
† The increase (decrease) in net assets attributable to holders of redeemable units fromoperations per unit is calculated by dividing the increase (decrease) in net assetsattributable to holders of redeemable units from operations per series by the weightedaverage number of units per series.
STATEMENTS OF CHANGES IN NET ASSETSATTRIBUTABLE TO HOLDERS OF REDEEMABLEUNITSFor the periods ended June 30 (note 1),(in dollars) 2017 2016
NET ASSETS ATTRIBUTABLE TO HOLDERS OF REDEEMABLEUNITS, BEGINNING OF PERIOD
Series A 65,444,592 76,291,021
INCREASE (DECREASE) IN NET ASSETS ATTRIBUTABLE TOHOLDERS OF REDEEMABLE UNITS FROM OPERATIONS
Series A 1,082,508 317,842
REDEEMABLE UNIT TRANSACTIONSProceeds from issue
Series A 3,034,850 4,064,565Payments on redemption
Series A (8,407,817) (11,107,281)
(5,372,967) (7,042,716)
INCREASE (DECREASE) IN NET ASSETS ATTRIBUTABLE TOHOLDERS OF REDEEMABLE UNITS
Series A (4,290,459) (6,724,874)
NET ASSETS ATTRIBUTABLE TO HOLDERS OF REDEEMABLEUNITS, END OF PERIOD
Series A 61,154,133 69,566,147
STATEMENTS OF CASH FLOWSFor the periods ended June 30 (note 1),(in dollars) 2017 2016
CASH FLOWS FROM OPERATING ACTIVITIESIncrease (decrease) in net assets attributable to holders of
redeemable units 1,082,508 317,842Adjustments for:
Net realized (gain) loss on non-derivative financial assets (1,189,805) (2,866,578)Change in unrealized (gain) loss on non-derivative financial
assets (261,564) 2,210,533Non-cash transactions (392,837) (514,726)Purchases of portfolio investments (796,000) (8,537,200)Proceeds from sale of portfolio investments 5,875,606 15,966,562Accrued investment income and other (7) 15Accrued expenses and other payables 119,592 136,907
Net cash provided by (used in) operating activities 4,437,493 6,713,355
CASH FLOWS FROM FINANCING ACTIVITIESProceeds from issue of redeemable units 3,667,569 4,068,212Amounts paid on redemption of redeemable units (7,981,428) (10,744,552)
Net cash provided by (used in) financing activities (4,313,859) (6,676,340)Net increase (decrease) in cash 123,634 37,015Cash (bank overdraft), beginning of period 186,565 216,173
CASH (BANK OVERDRAFT), END OF PERIOD 310,199 253,188
Interest paid(1) 117 43Interest received(1) 509 518
(1) Classified as operating items.
The accompanying notes are an integral part of the financial statements. Portfolio Adviser: 1832 Asset Management L.P.
TH
EP
INN
AC
LEP
OR
TFO
LIO
S
105

Pinnacle Balanced Portfolio (Unaudited – Continued)
SCHEDULE OF INVESTMENT PORTFOLIOAs at June 30, 2017
IssuerNumber of
UnitsAverageCost ($)
CarryingValue ($)
CANADIAN EQUITY FUNDS – 30.0%Scotia Private Canadian Growth Pool Series I 438,240 5,702,057 7,326,495Scotia Private Canadian Mid Cap Pool Series I 130,462 1,952,568 2,766,625Scotia Private Canadian Small Cap Pool Series I 69,944 1,841,291 2,766,482Scotia Private Canadian Value Pool Series I 232,423 4,355,612 5,483,684
13,851,528 18,343,286
FIXED INCOME FUNDS – 40.2%Scotia Private High Yield Income Pool Series I 666,339 6,211,597 6,166,965Scotia Private Income Pool Series I 1,715,864 18,860,760 18,409,509
25,072,357 24,576,474
FOREIGN EQUITY FUNDS – 29.7%Scotia Private Emerging Markets Pool Series I 111,423 1,084,379 1,220,706Scotia Private Global Real Estate Pool Series I 192,237 2,756,280 3,597,096Scotia Private International Equity Pool Series I 359,033 4,174,652 4,851,930Scotia Private International Small to Mid Cap ValuePool Series I 37,806 624,547 1,207,626Scotia Private U.S. Large Cap Growth Pool Series I 138,493 1,268,244 3,008,064Scotia Private U.S. Mid Cap Value Pool Series I 120,834 1,885,867 2,149,158Scotia Private U.S. Value Pool Series I 137,153 1,618,174 2,110,337
13,412,143 18,144,917
TOTAL INVESTMENT PORTFOLIO 52,336,028 61,064,677
OTHER ASSETS, LESS LIABILITIES – 0.1% 89,456
NET ASSETS – 100.0% 61,154,133
The accompanying notes are an integral part of the financial statements. Portfolio Adviser: 1832 Asset Management L.P.
TH
EP
INN
AC
LEP
OR
TFO
LIO
S
106

Pinnacle Balanced Portfolio (Unaudited – Continued)
FUND SPECIFIC NOTESFor the periods indicated in Note 1
The Fund (note 1)
The Fund’s objective is to achieve a balance of long-term capitalgrowth and current income. It invests primarily in a mix of equity andincome mutual funds managed by us.
The Fund invests primarily in funds managed by the Manager and/or bythe third party investment managers (the ‘‘Underlying Funds’’). Toensure the Fund’s composition meets the investment objectives of theFund, the portfolio advisor monitors the Underlying Funds on anongoing basis and rebalances the Fund’s assets among the UnderlyingFunds.
Risk associated with financial instruments (note 4)
Interest rate risk
The Fund could be exposed to indirect interest rate risk to the extentthat the Underlying Funds held financial instruments that weresubject to interest rate risk.
Currency risk
The Fund could be exposed to indirect currency risk to the extent thatthe Underlying Funds held financial instruments that weredenominated in a currency other than its functional currency.
Price risk
Price risk is the risk that the carrying value of financial instrumentswill fluctuate as a result of changes in market prices (other than thosearising from interest rate risk or currency risk) caused by factorsspecific to a security, its issuer or all factors affecting a market or amarket segment. Exposure to price risk is mainly in equities,underlying funds, derivatives and commodities, as applicable. As atJune 30, 2017, approximately 99.9% (December 31, 2016 – 98.9%) ofthe Fund’s net assets were exposed to price risk. If prices of theseinstruments had decreased or increased by 10%, with all othervariables held constant, net assets of the Fund would have decreasedor increased, respectively, by approximately $6,106,468 (December 31,2016 – $6,471,208). In practice, actual results may differ from thissensitivity analysis and the difference could be material.
Credit risk
The Fund could be exposed to indirect credit risk to the extent thatthe Underlying Funds invested in bonds and debentures, money marketinstruments or preferred shares.
Concentration risk
Concentration risk arises as a result of the concentration of exposureswithin the same category, geographical location, asset type or industry
sector, as applicable. The table below is a summary of the Fund’sconcentration risk:
Percentage of net assets (%)
June 30, 2017 December 31, 2016
Canadian Equity Funds 30.0 29.7Fixed Income Funds 40.2 39.0Foreign Equity Funds 29.7 30.2
Fair Value Classification (note 2)
The tables below illustrate the classification of the Fund’s financialinstruments within the fair value hierarchy.
June 30, 2017Level 1
($)Level 2
($)Level 3
($)Total($)
Underlying funds 61,064,677 – – 61,064,677
61,064,677 – – 61,064,677
December 31, 2016Level 1
($)Level 2
($)Level 3
($)Total($)
Underlying funds 64,712,077 – – 64,712,077
64,712,077 – – 64,712,077
Transfers between levels
During the periods ended June 30, 2017 and December 31, 2016, therewere no significant transfers between Level 1 and Level 2.
Offsetting of financial assets and liabilities (note 2)
As at June 30, 2017 and December 31, 2016, the Fund did not enter intoany agreement whereby the financial instruments were eligible for offset.
Interest in Underlying Funds (note 2)
The following tables present the percentage of the Underlying Fundsowned by the Fund.
June 30, 2017
Underlying Fund
Carrying value ofthe Underlying Fund
($)
Ownership percentagein Underlying Fund
(%)
Scotia Private Income Pool Series I 18,409,509 3.5Scotia Private Canadian Growth Pool
Series I 7,326,495 3.4Scotia Private Canadian Mid Cap Pool
Series I 2,766,625 2.9Scotia Private Canadian Value Pool
Series I 5,483,684 2.8Scotia Private U.S. Mid Cap Value Pool
Series I 2,149,158 2.5Scotia Private U.S. Large Cap Growth
Pool Series I 3,008,064 2.3Scotia Private U.S. Value Pool Series I 2,110,337 1.9Scotia Private International Small to
Mid Cap Value Pool Series I 1,207,626 1.8Scotia Private Global Real Estate Pool
Series I 3,597,096 1.1Scotia Private High Yield Income Pool
Series I 6,166,965 0.5Scotia Private Canadian Small Cap Pool
Series I 2,766,482 0.4Scotia Private Emerging Markets Pool
Series I 1,220,706 0.4Scotia Private International Equity Pool
Series I 4,851,930 0.4
61,064,677
The accompanying notes are an integral part of the financial statements.
TH
EP
INN
AC
LEP
OR
TFO
LIO
S
107

Pinnacle Balanced Portfolio (Unaudited – Continued)
FUND SPECIFIC NOTESFor the periods indicated in Note 1
December 31, 2016
Underlying Fund
Carrying value ofthe Underlying Fund
($)
Ownership percentagein Underlying Fund
(%)
Scotia Private Income Pool Series I 18,932,811 3.9Scotia Private Canadian Growth
Pool Series I 7,762,726 3.7Scotia Private Canadian Mid Cap
Pool Series I 2,940,229 3.3Scotia Private Canadian Value Pool
Series I 5,808,705 3.0Scotia Private U.S. Large Cap
Growth Pool Series I 3,274,204 2.8Scotia Private International Small
to Mid Cap Value Pool Series I 1,326,117 2.2Scotia Private U.S. Value Pool
Series I 2,296,273 2.2Scotia Private U.S. Mid Cap Value
Pool Series I 2,278,554 1.8Scotia Private Global Real Estate
Pool Series I 3,949,785 1.2Scotia Private Emerging Markets
Pool Series I 1,258,441 0.5Scotia Private International Equity
Pool Series I 5,360,398 0.5Scotia Private High Yield Income
Pool Series I 6,591,422 0.5Scotia Private Canadian Small Cap
Pool Series I 2,932,412 0.4
64,712,077
Comparison of net asset value and net assets per unit (note 2)
As at June 30, 2017 or December 31, 2016, there were no differencesbetween the net asset value per unit and the net assets per unit for anyseries of the Fund.
The accompanying notes are an integral part of the financial statements.
TH
EP
INN
AC
LEP
OR
TFO
LIO
S
108

Pinnacle Growth Portfolio (Unaudited)
STATEMENTS OF FINANCIAL POSITIONAs at
(in dollars)June 30,
2017December 31,
2016
ASSETSCurrent assetsInvestments
Non-derivative financial assets 7,769,820 9,109,431Cash – 36,088Receivable for securities sold 135,700 –Subscriptions receivable 400 6,373Accrued investment income and other 14 14
7,905,934 9,151,906
LIABILITIESCurrent liabilitiesBank overdraft 99,860 –Management fee payable 17,480 –Redemptions payable 1,750 1,000Accrued expenses 1,668 699
120,758 1,699
Net assets attributable to holders of redeemable units 7,785,176 9,150,207
NET ASSETS ATTRIBUTABLE TO HOLDERS OF REDEEMABLEUNITS PER SERIES
Series A 7,785,176 9,150,207
NET ASSETS ATTRIBUTABLE TO HOLDERS OF REDEEMABLEUNITS PER UNIT
Series A 15.33 15.17
STATEMENTS OF COMPREHENSIVE INCOMEFor the periods ended June 30 (note 1),(in dollars except average units) 2017 2016
INCOMENet gain (loss) on investments
Dividends 747 1,303Interest for distribution purposes 25,399 38,242Net realized gain (loss) on non-derivative financial assets 313,480 413,382Change in unrealized gain (loss) on non-derivative financial assets (124,343) (242,487)
Net gain (loss) on investments 215,283 210,440Other income – 205
Total income (loss), net 215,283 210,645
EXPENSESManagement fees (note 5) 100,473 126,226Fixed administration fees (note 6) 6,279 7,889Independent Review Committee fees 576 563Interest expense and bank overdraft charges 87 68Other fund costs – 2Harmonized Sales Tax/Goods and Services Tax 10,889 12,837
Total expenses 118,304 147,585
Increase (decrease) in net assets attributable to holders of redeemableunits from operations 96,979 63,060
INCREASE (DECREASE) IN NET ASSETS ATTRIBUTABLE TO HOLDERSOF REDEEMABLE UNITS FROM OPERATIONS PER SERIES
Series A 96,979 63,060
INCREASE (DECREASE) IN NET ASSETS ATTRIBUTABLE TO HOLDERSOF REDEEMABLE UNITS FROM OPERATIONS PER UNIT†
Series A 0.18 0.08
WEIGHTED AVERAGE NUMBER OF UNITS PER SERIESSeries A 546,305 763,051
† The increase (decrease) in net assets attributable to holders of redeemable units fromoperations per unit is calculated by dividing the increase (decrease) in net assetsattributable to holders of redeemable units from operations per series by the weightedaverage number of units per series.
STATEMENTS OF CHANGES IN NET ASSETSATTRIBUTABLE TO HOLDERS OF REDEEMABLEUNITSFor the periods ended June 30 (note 1),(in dollars) 2017 2016
NET ASSETS ATTRIBUTABLE TO HOLDERS OF REDEEMABLEUNITS, BEGINNING OF PERIOD
Series A 9,150,207 11,393,181
INCREASE (DECREASE) IN NET ASSETS ATTRIBUTABLE TOHOLDERS OF REDEEMABLE UNITS FROM OPERATIONS
Series A 96,979 63,060
REDEEMABLE UNIT TRANSACTIONSProceeds from issue
Series A 387,580 326,974Payments on redemption
Series A (1,849,590) (1,599,525)
(1,462,010) (1,272,551)
INCREASE (DECREASE) IN NET ASSETS ATTRIBUTABLE TOHOLDERS OF REDEEMABLE UNITS
Series A (1,365,031) (1,209,491)
NET ASSETS ATTRIBUTABLE TO HOLDERS OF REDEEMABLEUNITS, END OF PERIOD
Series A 7,785,176 10,183,690
STATEMENTS OF CASH FLOWSFor the periods ended June 30 (note 1),(in dollars) 2017 2016
CASH FLOWS FROM OPERATING ACTIVITIESIncrease (decrease) in net assets attributable to holders of
redeemable units 96,979 63,060Adjustments for:
Net realized (gain) loss on non-derivative financial assets (313,480) (413,382)Change in unrealized (gain) loss on non-derivative financial
assets 124,343 242,487Non-cash transactions (26,052) (39,417)Purchases of portfolio investments (67,500) (1,326,899)Proceeds from sale of portfolio investments 1,486,600 2,663,537Accrued investment income and other – 66Accrued expenses and other payables 18,449 23,401
Net cash provided by (used in) operating activities 1,319,339 1,212,853
CASH FLOWS FROM FINANCING ACTIVITIESProceeds from issue of redeemable units 393,553 326,856Amounts paid on redemption of redeemable units (1,848,840) (1,597,605)
Net cash provided by (used in) financing activities (1,455,287) (1,270,749)Net increase (decrease) in cash (135,948) (57,896)Cash (bank overdraft), beginning of period 36,088 87,649
CASH (BANK OVERDRAFT), END OF PERIOD (99,860) 29,753
Interest paid(1) 87 68Interest received(1) 94 194
(1) Classified as operating items.
The accompanying notes are an integral part of the financial statements. Portfolio Adviser: 1832 Asset Management L.P.
TH
EP
INN
AC
LEP
OR
TFO
LIO
S
109

Pinnacle Growth Portfolio (Unaudited – Continued)
SCHEDULE OF INVESTMENT PORTFOLIOAs at June 30, 2017
IssuerNumber of
UnitsAverageCost ($)
CarryingValue ($)
CANADIAN EQUITY FUNDS – 50.2%Scotia Private Canadian Growth Pool Series I 92,972 1,243,192 1,554,307Scotia Private Canadian Mid Cap Pool Series I 27,825 455,476 590,062Scotia Private Canadian Small Cap Pool Series I 14,986 415,396 592,753Scotia Private Canadian Value Pool Series I 49,572 955,205 1,169,579
3,069,269 3,906,701
FIXED INCOME FUNDS – 19.9%Scotia Private High Yield Income Pool Series I 50,384 463,554 466,305Scotia Private Income Pool Series I 101,017 1,114,486 1,083,814
1,578,040 1,550,119
FOREIGN EQUITY FUNDS – 29.7%Scotia Private Emerging Markets Pool Series I 14,093 133,943 154,392Scotia Private Global Real Estate Pool Series I 24,544 363,840 459,257Scotia Private International Equity Pool Series I 45,473 502,360 614,517Scotia Private International Small to Mid Cap ValuePool Series I 4,857 86,728 155,154Scotia Private U.S. Large Cap Growth Pool Series I 17,746 168,338 385,447Scotia Private U.S. Mid Cap Value Pool Series I 15,304 239,084 272,205Scotia Private U.S. Value Pool Series I 17,679 219,379 272,028
1,713,672 2,313,000
TOTAL INVESTMENT PORTFOLIO 6,360,981 7,769,820
OTHER ASSETS, LESS LIABILITIES – 0.2% 15,356
NET ASSETS – 100.0% 7,785,176
The accompanying notes are an integral part of the financial statements. Portfolio Adviser: 1832 Asset Management L.P.
TH
EP
INN
AC
LEP
OR
TFO
LIO
S
110

Pinnacle Growth Portfolio (Unaudited – Continued)
FUND SPECIFIC NOTESFor the periods indicated in Note 1
The Fund (note 1)
The Fund’s objective is to achieve long-term capital growth andprovide some current income. It invests primarily in a mix of equityand income mutual funds managed by us.
The Fund invests primarily in funds managed by the Manager and/or bythe third party investment managers (the ‘‘Underlying Funds’’). Toensure the Fund’s composition meets the investment objectives of theFund, the portfolio advisor monitors the Underlying Funds on anongoing basis and rebalances the Fund’s assets among the UnderlyingFunds.
Risk associated with financial instruments (note 4)
Interest rate risk
The Fund could be exposed to indirect interest rate risk to the extentthat the Underlying Funds held financial instruments that weresubject to interest rate risk.
Currency risk
The Fund could be exposed to indirect currency risk to the extent thatthe Underlying Funds held financial instruments that weredenominated in a currency other than its functional currency.
Price risk
Price risk is the risk that the carrying value of financial instrumentswill fluctuate as a result of changes in market prices (other than thosearising from interest rate risk or currency risk) caused by factorsspecific to a security, its issuer or all factors affecting a market or amarket segment. Exposure to price risk is mainly in equities,underlying funds, derivatives and commodities, as applicable. As atJune 30, 2017, approximately 99.8% (December 31, 2016 – 99.6%) ofthe Fund’s net assets were exposed to price risk. If prices of theseinstruments had decreased or increased by 10%, with all othervariables held constant, net assets of the Fund would have decreasedor increased, respectively, by approximately $776,982 (December 31,2016 – $910,943). In practice, actual results may differ from thissensitivity analysis and the difference could be material.
Credit risk
The Fund could be exposed to indirect credit risk to the extent thatthe Underlying Funds invested in bonds and debentures, money marketinstruments or preferred shares.
Concentration risk
Concentration risk arises as a result of the concentration of exposureswithin the same category, geographical location, asset type or industrysector, as applicable. The table below is a summary of the Fund’sconcentration risk:
Percentage of net assets (%)
June 30, 2017 December 31, 2016
Canadian Equity Funds 50.2 49.6Fixed Income Funds 19.9 19.8Foreign Equity Funds 29.7 30.2
Fair Value Classification (note 2)
The tables below illustrate the classification of the Fund’s financialinstruments within the fair value hierarchy.
June 30, 2017Level 1
($)Level 2
($)Level 3
($)Total($)
Underlying funds 7,769,820 – – 7,769,820
7,769,820 – – 7,769,820
December 31, 2016Level 1
($)Level 2
($)Level 3
($)Total($)
Underlying funds 9,109,431 – – 9,109,431
9,109,431 – – 9,109,431
Transfers between levels
During the periods ended June 30, 2017 and December 31, 2016, therewere no significant transfers between Level 1 and Level 2.
Offsetting of financial assets and liabilities (note 2)
As at June 30, 2017 and December 31, 2016, the Fund did not enter intoany agreement whereby the financial instruments were eligible foroffset.
Interest in Underlying Funds (note 2)
The following tables present the percentage of the Underlying Fundsowned by the Fund.
June 30, 2017
Underlying Fund
Carrying value ofthe Underlying Fund
($)
Ownership percentagein Underlying Fund
(%)
Scotia Private Canadian GrowthPool Series I 1,554,307 0.7
Scotia Private Canadian Mid CapPool Series I 590,062 0.6
Scotia Private Canadian Value PoolSeries I 1,169,579 0.6
Scotia Private U.S. Large CapGrowth Pool Series I 385,447 0.3
Scotia Private U.S. Mid Cap ValuePool Series I 272,205 0.3
Scotia Private Income Pool Series I 1,083,814 0.2Scotia Private International Small
to Mid Cap Value Pool Series I 155,154 0.2Scotia Private U.S. Value Pool
Series I 272,028 0.2Scotia Private Canadian Small Cap
Pool Series I 592,753 0.1Scotia Private Emerging Markets
Pool Series I 154,392 0.1Scotia Private Global Real Estate
Pool Series I 459,257 0.1Scotia Private International Equity
Pool Series I 614,517 0.1Scotia Private High Yield Income
Pool Series I 466,305 0.0
7,769,820
The accompanying notes are an integral part of the financial statements.
TH
EP
INN
AC
LEP
OR
TFO
LIO
S
111

Pinnacle Growth Portfolio (Unaudited – Continued)
FUND SPECIFIC NOTESFor the periods indicated in Note 1
December 31, 2016
Underlying Fund
Carrying value ofthe Underlying Fund
($)
Ownership percentagein Underlying Fund
(%)
Scotia Private Canadian GrowthPool Series I 1,814,023 0.9
Scotia Private Canadian Mid CapPool Series I 679,146 0.8
Scotia Private Canadian Value PoolSeries I 1,352,625 0.7
Scotia Private U.S. Large CapGrowth Pool Series I 453,254 0.4
Scotia Private Income Pool Series I 1,255,241 0.3Scotia Private U.S. Mid Cap Value
Pool Series I 321,770 0.3Scotia Private International Small
to Mid Cap Value Pool Series I 184,851 0.3Scotia Private U.S. Value Pool
Series I 322,885 0.3Scotia Private Global Real Estate
Pool Series I 559,339 0.2Scotia Private Emerging Markets
Pool Series I 180,180 0.1Scotia Private Canadian Small Cap
Pool Series I 685,897 0.1Scotia Private International Equity
Pool Series I 744,543 0.1Scotia Private High Yield Income
Pool Series I 555,677 0.0
9,109,431
Comparison of net asset value and net assets per unit (note 2)
As at June 30, 2017 or December 31, 2016, there were no differencesbetween the net asset value per unit and the net assets per unit for anyseries of the Fund.
The accompanying notes are an integral part of the financial statements.
TH
EP
INN
AC
LEP
OR
TFO
LIO
S
112

NOTES TO THE FINANCIAL STATEMENTS (UNAUDITED)For the periods indicated in Note 1.
1. The Funds1832 Asset Management L.P., a wholly owned subsidiary of the Bank ofNova Scotia (“Scotiabank”), is the manager and trustee (whereapplicable) of the funds. In this document, “we”, “us”, “our”, the“Manager”, the “Trustee”, and “1832 Asset Management” refer to 1832Asset Management L.P. The registered office of the Funds is 1Adelaide Street East, 28th Floor, Toronto, ON, M5C 2V9.
The Funds presented in these financial statements are open-endedmutual fund trusts. Throughout this document, we refer to thesemutual fund trusts individually as a “Fund” and collectively, as the“Funds”.
The Funds are established under the laws of the Province of Ontariopursuant to an Amended and Restated Master Declaration of Trustdated November 24, 2011, as amended from time to time.
The Statements of Financial Position are as at June 30, 2017 andDecember 31, 2016, and the Statements of Comprehensive Income,Changes in Net Assets Attributable to Holders of Redeemable Unitsand Cash Flows are for the six-month periods ended June 30, 2017 and2016. The Schedule of Investment Portfolio for each of the Funds is asat June 30, 2017. Throughout this document, reference to the periodsrefers to the reporting periods described above.
These financial statements were approved and authorized for issue onAugust 22, 2017 by the Board of Directors of 1832 Asset ManagementG.P. Inc., as general partner for and on behalf of 1832 AssetManagement L.P., in its capacity as Trustee of the Funds.
The investment objectives for each of the Funds are provided in therespective Fund’s “Fund Specific Notes”. The commencement date foreach Fund is as follows:
Scotia Private Pools Commencement Date
Scotia Private American Core-Plus Bond Pool January 28, 2002
Scotia Private Canadian Growth Pool September 3, 1997
Scotia Private Canadian Mid Cap Pool January 28, 2002
Scotia Private Canadian Small Cap Pool September 3, 1997
Scotia Private Canadian Value Pool September 3, 1997
Scotia Private Emerging Markets Pool September 8, 2010
Scotia Private Global Equity Pool September 3, 1997
Scotia Private Global Real Estate Pool January 28, 2002
Scotia Private High Yield Income Pool September 3, 1997
Scotia Private Income Pool September 3, 1997
Scotia Private International Equity Pool September 3, 1997
Scotia Private International Small to Mid Cap Value Pool January 28, 2002
Scotia Private Short Term Income Pool September 3, 1997
Scotia Private Strategic Balanced Pool September 3, 1997
Scotia Private U.S. Large Cap Growth Pool January 18, 2001
Scotia Private U.S. Mid Cap Growth Pool September 3, 1997
Scotia Private U.S. Mid Cap Value Pool January 28, 2002
Scotia Private U.S. Value Pool September 3, 1997
Pinnacle Portfolios
Pinnacle Balanced Portfolio April 22, 2005
Pinnacle Growth Portfolio April 22, 2005
Pinnacle Income Portfolio April 22, 2005
Each Fund may offer an unlimited number of units of some or all of itsrespective series. Each series of a Fund is intended for differentinvestors.
A description of each series is provided below:
Series A: Series A units are only available through Scotia McLeod or otherwise as
permitted by the Manager.
Pinnacle Series: Pinnacle Series units are only available to investors who participate in
the Pinnacle Program.
Series F: Series F units are available for purchase into a fee-based account with
authorized brokers or dealers.
Series I: Series I units may only be purchased by eligible institutional investors
and other qualified investors as determined by the Manager.
Series K: Series K units are only available to investors who participate in the
ScotiaMcLeod Investment Portfolio (‘SIP”). Series K units are only
available in the SIP multi-manager mandates or SIP optimized portfolios
and are not available as single funds.
Series M: Series M units are available to investors who have signed a
discretionary investment management agreement with the Manager or
Scotiatrust.
2. Summary of Significant AccountingPolicies
The significant accounting policies applied in the preparation of thesefinancial statements are set out below. These policies have beenconsistently applied to all the periods presented, unless otherwisestated.
(a) Basis of preparation
These interim financial statements of the Funds have beenprepared in compliance with International Financial ReportingStandards (“IFRS”) applicable to the preparation of interimfinancial statements including, International AccountingStandard (“IAS”) 34, Interim Financial Statements.
The preparation of these financial statements in accordancewith IFRS requires the use of judgment in applying theiraccounting policies and to make estimates and assumptionsconcerning the future. Significant accounting judgments andestimates made by the management are disclosed in Note 3.
(b) Financial instruments
Classification
The Funds classify investments, including derivatives, asfinancial assets or financial liabilities at fair value through profitand loss (FVTPL). This category has two sub categories:financial assets and financial liabilities are either held fortrading or designated at fair value through profit or loss atinception.
Financial assets or financial liabilities held for trading are thoseacquired principally for the purpose of selling or repurchasing inthe near future or on initial recognition as part of an identicalportfolio of financial instruments that are managed together forwhich there is evidence of actual short-term profit taking.Derivatives and short positions are included in this category.
Financial assets and financial liabilities designated at fair valuethrough profit or loss at inception are financial instruments thatare not classified as held for trading but are managed and theirperformance evaluated on a fair value basis in accordance withthe respective Fund’s investment strategy.
113

The Funds’ obligations for net assets attributable to holders ofredeemable units are presented at the redemption amount.
Loans and receivables are non-derivative financial assets withfixed or determinable payments that are not quoted in an activemarket. The Funds include in this category receivable forsecurities sold, subscription receivable, and other accruedinvestment income and other receivables.
All other financial liabilities, other than those classified as atFVTPL are measured at amortized cost.
Recognition and measurement
Regular purchases and sales of investments are recognized onthe date on which the Funds commit to purchase or sell theirinvestments at fair value. Transaction costs are expensed asincurred in the Statements of Comprehensive Income.Subsequent to initial recognition, financial assets and liabilitiesat FVTPL are measured at fair value as presented below. Gainsand losses arising from changes in their fair value are includedin the Statements of Comprehensive Income for the periods inwhich they arise.
(c) Fair value measurement and hierarchy of financialinstruments
Fair value of a financial instrument is the price that would bereceived to sell an asset or paid to transfer a liability in anorderly transaction between market participants at themeasurement date (i.e. an exit price). The fair value of financialassets and liabilities traded in active markets (such as publiclytraded derivatives and marketable securities) are based onquoted market prices at the close of trading on the reportingdate. The Funds use the last traded market price for bothfinancial assets and financial liabilities where the last tradedprice falls within that day’s bid-ask spread. In circumstanceswhere the last traded price is not within the bid-ask spread, theManager determines the point within the bid-ask spread that ismost representative of fair value based on the specific facts andcircumstances.
The fair value of financial assets and liabilities that are nottraded in an active market, including over the-counterderivatives, is determined using valuation techniques. The Fundsuse a variety of methods and make assumptions that are basedon market conditions existing at each reporting date. Valuationtechniques include the use of comparable recent arm’s lengthtransactions, reference to other instruments that aresubstantially the same, discounted cash flow analysis, optionpricing models and other techniques commonly used by marketparticipants which make the maximum use of observable inputs.
IFRS 13, Fair value measurement, requires the use anddisclosure of a fair value hierarchy that categorises into threelevels the inputs to valuation techniques used to measure fairvalue of financial instruments. The fair value hierarchy gives thehighest priority to quoted prices (unadjusted) in active markets
and the lowest priority to unobservable inputs. The three levelhierarchy based on inputs levels are defined as follows:
• Level 1: Fair value is based on unadjusted quoted prices inactive markets for identical assets or liabilities:
• Level 2: Fair value is based on inputs other than unadjustedquoted prices included in Level 1 that are observable for theassets or liabilities, either directly or indirectly; and
• Level 3: Fair value is based on at least one significant non-observable input that is not supported by market data for thefinancial assets or liabilities.
Changes in valuation methodology may result in transfer in andout of a level. The Funds’ policy is to recognize these transfers asof the date of the event or circumstance giving rise to thetransfer. The three level fair value hierarchy, transfers betweenlevels and a reconciliation of level 3 financial instruments, asapplicable, are disclosed in the respective Fund’s “Fund SpecificNotes”.
The Manager is responsible for performing the fair valuemeasurements included in the financial statements of the Funds,including level 3 measurements. The Manager obtains pricingfrom a third party pricing vendor, which is monitored andreviewed by the valuation team daily. At each financial reportingdate, the Manager reviews and approves all level 3 fair valuemeasurements. The Funds also have a Valuation Working Groupwhich includes the Chief Financial Officer, members of thefinance team, as well as members of the investment council andcompliance teams. The working group meets quarterly toperform detailed reviews of the valuations of investments held bythe Funds.
Financial instruments are valued at their fair value assummarized below:
(i) North American equities are valued at the closing marketprice recorded by the security exchange on which thesecurity is principally traded. Non-North Americanequities are valued at fair value based on informationprovided by an independent pricing source.
(ii) Fixed income securities, including bonds and mortgage-backed securities, are valued using quotations receivedfrom independent pricing sources.
(iii) Short-term debt instruments are carried at amortizedcost, which approximates fair value.
(iv) Investments in Underlying Funds are valued based on theNet Asset Value per unit provided by the UnderlyingFund’s manager at the end of each valuation date.
(v) Unlisted warrants are valued using the Black-Scholesoption valuation model. The model factors in the timevalue of money and the volatility inputs significant to suchvaluation. For purposes of determining Net Asset Value asdefined below, warrants are valued at their intrinsic value.
114

(vi) Options contracts are valued at their mid-price asreported by the principal exchange or the over-the-counter market on which the contract is traded. Alltransactions in over-the-counter options are executedusing approved brokers with an approved credit rating.
(vii) Futures contracts are valued at their close prices on eachvaluation date.
(viii) Open forward currency contracts are valued at the gain orloss that would arise as a result of closing the position onthe valuation date.
(ix) Centrally cleared swaps and over the counter swaps derivetheir value from underlying asset prices, indices,reference rates and other inputs or a combination of thesefactors. They are valued using a broker-dealer bidquotation or on market-based prices provided by anindependent pricing source, which may use inputs thatare observed from actively quoted markets such as theovernight index swap rate, London Interbank Offered Rateforward rate, interest rates, yield curves and creditspreads.
(d) Net Assets versus Net Asset Value
The Funds’ accounting policies for measuring the fair value oftheir investments and derivatives are identical to those used inmeasuring their net asset value for transactions with unitholdersin accordance with Part 14 of National Instrument 81-106Investment Funds for Continuous Disclosure (“NI 81-106”),except where the last traded market price for financial assetsand liabilities are not within the bid-ask spread or the Fundholds non-traded warrants as described above. A comparison ofthe net assets per unit in accordance to IFRS (“Net Assets perunit”) and the net assets per unit calculated in accordance toNI 81-106 (“Net Asset Value per unit”) are presented in the“Fund Specific Notes” for each Fund, as applicable.
(e) Income recognition
Gains and losses arising from changes in fair value of financialinstruments, other than derivatives, are shown in the Statementsof Comprehensive Income as “Change in unrealized gain (loss)on non-derivative financial assets” and as “Net realized gain(loss) on non-derivative financial assets” when the positions aresold.
The premium received or paid on options purchased or writtenare included in the cost of the options. Any difference resultingfrom revaluation at the reporting date is treated as “Change inunrealized gain (loss) on options contracts”, while the gains andlosses realized when the position is closed is included in theStatements of Comprehensive Income as “Net realized gain(loss) on options contracts”.
Gains and losses arising from changes in fair value of spots,forwards, futures, and swaps are shown in the Statements ofComprehensive Income as “Change in unrealized gain (loss)” ofthe respective derivative contract and in the Statements ofFinancial Position as “Unrealized Gain” or “Unrealized Loss” of
the respective derivative contract until the contracts are closedout or expire. Once the contracts are closed out or have expired,the resulting realized gains and losses of forwards, futures, andswaps are shown in the Statements of Comprehensive Income as“Net Realized gain (loss)” of the respective derivative contract.
Dividend income and distributions from Underlying Funds arerecognized on the ex-dividend date. Distributions received fromincome trusts are recognized based on the nature of theunderlying components such as dividend income, interestincome, capital gains, and return of capital by applying previousyear characterizations reported by the trust as current yearcharacterizations are not available until the following year. Theinterest income component of the distributions received fromUnderlying Funds are included as part of “Interest fordistribution purposes” in the Statements of ComprehensiveIncome.
Interest for distribution purposes includes the coupon interestreceived by the Fund, recognized on an accrual basis. The Funddoes not amortize premiums paid or discounts received on thepurchase of fixed income securities except for zero couponbonds which are amortized on a straight line basis. Realized gainor loss on the sale of short-term debt instruments are recordedas an adjustment to interest for distribution purposes.
(f) Functional and presentation currency and foreignexchange translation
The functional and reporting currency for all Funds is theCanadian dollar. The functional currency is the currency of theprimary economic environment in which the Funds operate, orwhere mixed indicators exist in the primary environment, thecurrency in which they primarily raise capital. Any currencyother than functional currency represents foreign currency tothe Funds. Amounts denominated in foreign currencies areconverted into the functional currency as follows:
(i) The fair values of investments, derivative contracts andmonetary and non-monetary assets and liabilities at therates of exchange prevailing as at the valuation date;
(ii) Foreign income and expenses at the rates of exchangeapplicable on the respective dates of such transactions;and
(iii) Purchase or sale of investments and investment income atthe rate of exchange prevailing on the respective dates ofsuch transactions.
Gains and losses on foreign exchange incurred in the Funds frommonetary or non-monetary assets and liabilities other thaninvestments and derivatives are shown in the Statements ofComprehensive Income as “Net realized and unrealized foreigncurrency translation gain (loss)”.
(g) Investments in unconsolidated structured entities
Certain Funds invest in mutual funds, exchange-traded funds orclosed-ended funds managed by the Manager or by third partyinvestment managers. The relevant Funds consider all
115

investments in such instruments (“Underlying Funds”) to beinvestments in unconsolidated structured entities based on thefact that the decisions made by these Underlying Funds are notgoverned by voting rights or any other similar rights held by theFunds. The Funds account for these unconsolidated structuredentities at fair value.
The Underlying Funds each have their own objectives andinvestment strategies which assist the Funds in achieving theirinvestment objectives. The Underlying Funds primarily financetheir operations by issuing redeemable units or shares which areputtable at the holder’s option in the case of mutual funds andexchange-traded funds or through issuing non-redeemable unitsor partnership interests in the case of closed end funds. TheUnderlying Funds entitle the holder to a proportional stake inthe respective fund’s net assets. The Funds hold units, shares orpartnership interests in each of their Underlying Funds. Theseinvestments are included in “Non-derivative financial assets” inthe Statements of Financial Position. The change in fair value ofeach Underlying Fund is included in the Statements ofComprehensive Income in ‘Change in unrealized gain (loss) ofnon-derivative financial assets. The exposure to investments inUnderlying Funds at fair value is disclosed in the Fund’s “FundSpecific Notes”. The Funds’ maximum exposure to loss from theirinterests in Underlying Funds is equal to the total carrying valueof their investments in Underlying Funds.
Mortgage-backed securities or asset-backed securities are alsoconsidered to be unconsolidated structured entities. Mortgage-backed securities are formed by pooling various types ofmortgages while asset-backed securities are formed by poolingassets such as auto loans, credit card receivables or studentloans. An interest or claim to this future cash flow (interest andprincipal) is then sold in the form of debt or equity securities,which could be held by the Funds. The Funds account for theseunconsolidated structured entities investments at fair value. Thefair value of such securities, as disclosed in the Schedule ofInvestment Portfolio, as applicable, represents the maximumexposure to losses at that date.
(h) Redeemable Units Issued by the Funds
The Funds’ outstanding redeemable units qualify as “puttableinstruments” as per by International Accounting Standard 32,Financial Instruments: Presentation (“IAS 32”) which statesthat units or shares of an entity that include a contractualobligation for the issuer to repurchase or redeem them for cashor another financial asset should be classified as financialliabilities
In accordance with IAS 32, the Funds’ redeemable units’entitlements include a contractual obligation to distribute anynet income and net realized capital gains at least annually incash (at the request of the unitholder) and therefore meet thecontractual obligation requirement.
This violates one of the criteria that are required in order for theredeemable units to be presented as equity under IAS 32.Consequently, the Funds’ outstanding redeemable units areclassified as financial liabilities in these financial statements.
(i) Offsetting of financial instruments
Financial assets and liabilities are offset and the net amount ispresented in the Statements of Financial Position only if there isa legal right to offset the amounts and there is an intentioneither to settle on a net basis or to realize the asset and settlethe liability simultaneously. Income and expenses are presentedon a net basis only when permitted under IFRS, for gains andlosses arising from a group of similar transactions, such as gainsand losses from financial instruments at fair value through profitor loss. Financial assets and liabilities that are subject to masternetting or comparable agreements and the related potentialeffect of offsetting are disclosed in the respective Fund’s “FundSpecific Notes”.
(j) Other financial assets and liabilities
Other financial assets and liabilities other than investmentsecurities are valued at amortized cost. These balances areshort-term in nature; therefore, their carrying valuesapproximate fair values.
(k) Increase (decrease) in net assets attributable toholders of redeemable units per unit
“Increase (decrease) in net assets attributable to holders ofredeemable units per unit” is disclosed in the Statements ofComprehensive Income and represents, for each Series of units,the increase or decrease in net assets attributable to holders ofredeemable units from operations for the period attributable toeach Series divided by the weighted average number of unitsoutstanding for the corresponding Series during the period.
(l) Accounting standards issued but not yet effective
The final version of IFRS 9, Financial Instruments was issued bythe International Accounting Standards Board (‘‘IASB’’) in July2014 and will replace IAS 39, Financial Instruments:Recognition and Measurement, related to the classification andmeasurement of financial assets and financial liabilities.
IFRS 9 relates to the classification and measurement of financialassets and financial liabilities in the Funds. The new standard iseffective for the Funds for their fiscal year beginning January 1,2018. The Manager has been evaluating the standard and hascurrently determined that the impact to the Funds will includeadditional disclosures related to changes to the classification ofcertain financial instruments to align with the classificationsunder IFRS 9. Adoption of the standard will not impact netassets attributable to holders of redeemable units. The Managerwill continue to monitor for changes to this accounting standard.
3. Significant Accounting Judgmentsand Estimates
The preparation of financial statements requires management to usejudgment in applying its accounting policies and to make estimatesand assumptions about the future. These estimates are made based oninformation available as at the date of issuance of the financialstatements. Actual results could materially differ from those
116

estimates. The following discusses the most significant accountingjudgments and estimates that the Funds have made in preparing thefinancial statements:
Investment Entities
In accordance with IFRS 10: Consolidated Financial Statements, theManager has determined that the Funds meet the definition of anInvestment Entity which requires that the Funds obtain funds fromone or more investors for the purpose of providing investmentmanagement services, commit to their investors that their businesspurpose is to invest funds solely for returns from capital appreciation,investment income, or both; and measure and evaluate theperformance of their investments on a fair value basis. Consequently,the Funds do not consolidate their investments in subsidiaries, if any,but instead measure these at FVTPL, as required by the accountingstandard.
Classification and measurement of investments and
application of the fair value option
In classifying and measuring financial instruments held by the Funds,the Manager is required to make significant judgments about whetheror not the business of the Funds is to invest on a total return basis forthe purpose of applying the fair value option for financial assets underIAS 39, “Financial Instruments – Recognition and Measurement”.The most significant judgments made include the determination thatcertain financial instruments are held-for-trading and that the fairvalue option can be applied to those which are not.
Fair value measurement of financial instruments not
quoted in an active market
Key areas of estimation, where the Manager has made complex orsubjective judgments, include the determination of fair values offinancial instruments that are not quoted in an active market. The useof valuation techniques for financial instruments that are not quotedin an active market requires the Manager to make assumptions thatare based on market conditions existing as at the date of the financialstatements. Changes in these assumptions as a result of changes inmarket conditions could affect the reported fair value of financialinstruments.
4. Discussion of Financial InstrumentRisk
Each Fund’s investment activities expose it to a variety of financialrisks: market risk (including interest rate risk, currency risk, andother price risk), credit risk and liquidity risk. Each Fund’sinvestment practices include portfolio monitoring to ensurecompliance with stated investment guidelines. The Manager seeks tominimize potential adverse effects of risks on each Fund’sperformance by employing and overseeing professional andexperienced portfolio advisors that regularly monitor each Fund’ssecurities and financial market developments. The risks are measuredusing a method that reflects the expected impact on the results andnet assets attributable to unitholders of the Funds from reasonablypossible changes in the relevant risk variables.
The Manager maintains a risk management practice that includesmonitoring compliance with investment restrictions to ensure thatthe Funds are being managed in accordance with the Funds’ statedinvestment objectives, strategies and securities regulations.
Some Funds invest in underlying funds. These Funds are indirectlyexposed to market risk, credit risk, and liquidity risk in the event thatthe underlying funds invest in financial instruments that are subjectto those risks.
A Fund’s exposure to market risk, credit risk and liquidity risk, whereapplicable, is disclosed in the respective Fund’s “Fund Specific Notes”.
(a) Market risk
(i) Interest rate risk
Interest rate risk arises from the possibility that changes in interestrates will affect the future cash flows or the fair values of interest-bearing financial instruments. Each Fund’s exposure to interest raterisk is concentrated in its investments in debt instruments (such asbonds and debentures) and interest rate sensitive derivativeinstruments, if any.
(ii) Currency risk
The Funds may invest in monetary and non-monetary assetsdenominated in currencies other than their functional currency.Currency risk is the risk that the value of foreign investments willfluctuate due to changes in the foreign exchange rates of thosecurrencies in relation to the Fund’s functional currency. Funds mayenter into foreign exchange forward contracts, currency futurescontracts and/or foreign currency option contracts for hedgingpurposes to reduce their foreign currency risk exposure.
(i) Price risk
Price risk is the risk that the fair value of a Fund’s financialinstruments will fluctuate as a result of changes in market prices(other than those arising from interest rate risk or currency risk)caused by factors specific to a security, its issuer or all factorsaffecting a market or a market segment. Exposure to price risk ismainly in equities, underlying funds, derivatives and commodities.The maximum risk resulting from these financial instruments isequivalent to their fair value, except for written options, short salesand short futures contracts, where possible losses can be unlimited.
(b) Credit risk
Credit risk is the risk that the issuer of a financial instrument will failto discharge an obligation or commitment that it has entered intowith the Funds. A Fund’s investment in financial instruments such asbonds, debentures, money market instruments, preferred shares andderivatives represents the main concentration of credit risk. The fairvalue of financial instruments includes consideration of thecreditworthiness of the issuer, and accordingly, represents themaximum credit risk exposure to the Funds. All the transactions inlisted securities are settled or paid upon delivery using approvedbrokers with an approved credit rating. The risk of default with thecounterparty is considered minimal, as delivery of securities sold isonly made once the broker has received payment. Payment is only
117

made on a purchase once the securities have been received by thebroker.
The Trade Management Oversight Working Group responsible forregulatory evaluation and improvement of trade management policiesand procedures, when applicable, is also responsible for counterpartyselection and oversight. The working group review counterpartiesregularly to ensure they still meet preapproved credit standardsestablished by the working group. The counterparty policies andprocedures established by the working group have been reviewed andapproved by the Board of Directors of the Manager.
The Funds enter into transactions with approved counterparties witha designated rating in accordance with securities regulations. Thecredit ratings reported in the financial statements for issuers of debtinstruments, counterparties of derivative transactions, prime brokersand custodians, where applicable, are S&P Global Ratings’ creditratings or S&P Global Ratings equivalent for credit ratings from otherapproved rating agencies. In instances where the credit rating was tofall below the designated rating, the Manager would take appropriateaction.
The Funds can also be exposed to credit risk to the extent that theFunds’ custodian may not be able to settle trades for cash. Canadiansecurities regulations require that the Funds employ a custodian thatmeets certain capital requirements. These regulations state that,among other things, a fund’s custodian be either a bank listed inSchedule I, II, or III of the Bank Act (Canada), or a companyincorporated in Canada affiliated with a bank with shareholders’equity of not less than $10,000,000. The Bank of Nova Scotia, which isthe custodian for all the Funds, meets all Canadian SecuritiesAdministrators’ requirements to act as custodian.
A Fund may enter into securities lending transactions withcounterparties whereby the Fund temporarily exchanges securities forcollateral with a commitment by the counterparty to deliver the samesecurities on a future date. Credit risk associated with thesetransactions is considered minimal as all counterparties haveapproved credit rating and the market value of cash or securities heldas collateral must be at least 102% of the fair value of the securitiesloaned as at the end of each trading day.
(c) Liquidity risk
The Funds’ exposure to liquidity risk arises primarily from the dailycash redemption of units. The Funds primarily invest in securitiesthat are traded in active markets and can be readily disposed of. Inaddition, each Fund aims to retain sufficient cash and cash equivalentpositions to maintain liquidity. The Funds may, from time to time,enter into over-the-counter derivative contracts or invest in securitiesthat are not traded in an active market and may be illiquid. Illiquidsecurities are identified in the respective Fund’s Schedule ofInvestment Portfolio, as applicable.
(d) Concentration risk
Concentrations of risk arise from financial instruments that havesimilar characteristics and are affected similarly by changes ineconomic or other conditions. The identification and disclosure ofconcentration risk is provided in the respective Fund’s “Fund SpecificNotes”.
5. Management FeesThe Funds pay the Manager a management fees for each series ofsecurities, other than Series I, Series K and Pinnacle Series.Management fees for Series I, Series K and Pinnacle Series securitiesare paid directly by investors. The management fees cover the costs ofmanaging the Funds, arranging for investment analysis,recommendations and investment decision making for the Funds,arranging for, distribution of the Funds, marketing and promotion ofthe Funds and providing or arranging for other services for the Funds.
The management fee for all Series except Series I, Series K &Pinnacle Series is an annualized rate based on the net asset value ofeach series of the Funds. The management fee for Series I & PinnacleSeries are negotiated and paid directly by these unitholders and notby the Funds. The Funds’ management fees are accrued daily andpayable monthly on the first business day of the following calendarmonth.
The Manager may reduce the effective management fee payable byclients who invest large amounts in a particular Fund by waiving aportion of the management fee that it would otherwise be entitled toreceive from the Fund or a securityholder and directing the Fund tomake a management fee distribution, in the case of clients of theFunds. All management fee distributions and management fee rebatesare automatically reinvested in additional units of the relevant seriesof the Funds.
There is no duplication of management fees, sales charges orredemption fees between the Funds and the Underlying Funds helddirectly by them, if any. The Manager is entitled to a maximum annualmanagement fee, exclusive of sales taxes, as follows:
% of Net Asset Value
Series A Series F Series M
Scotia Private PoolsScotia Private Short Term Income Pool – 0.50 –Scotia Private Income Pool – 0.70 –Scotia Private High Yield Income Pool – 0.75 0.30Scotia Private American Core-Plus Bond Pool – 0.75 –Scotia Private Strategic Balanced Pool – 1.00 –Scotia Private Canadian Value Pool – 1.00 –Scotia Private Canadian Growth Pool – 1.00 –Scotia Private Canadian Small Cap Pool – 1.00 0.70Scotia Private Canadian Mid Cap Pool – 1.00 –Scotia Private U.S. Value Pool – 1.00 –Scotia Private U.S. Large Cap Growth Pool – 1.00 –Scotia Private U.S. Mid Cap Growth Pool – 0.80 0.55Scotia Private U.S. Mid Cap Value Pool – 0.80 0.55Scotia Private International Equity Pool – 1.00 –Scotia Private International Small to Mid Cap Value
Pool – 1.00 –Scotia Private Global Equity Pool – 1.00 –Scotia Private Global Real Estate Pool – 1.00 –Scotia Private Emerging Markets Pool – – 0.70
Pinnacle PortfoliosPinnacle Income Portfolio 1.85 – –Pinnacle Balanced Portfolio 2.10 – –Pinnacle Growth Portfolio 2.40 – –
118

6. Fixed Administration Fees andOperating Expenses
The Manager pays certain operating expenses of the Funds(“FAF Funds”), other than Scotia Private Short Term Income Pool.These expenses include regulatory filing fees and other day-to-dayoperating expenses including, but not limited to, transfer agency andrecordkeeping, accounting and fund valuation costs, custody fees,audit and legal fees, administration costs, bank charges, costs ofpreparing and distributing annual and semi-annual reports,prospectuses, annual information forms, Fund Facts and statements,investor communications and continuous disclosure materials. TheManager is not obligated to pay any other expense, cost or fee,including those arising from new government or regulatoryrequirements relating to the foregoing expenses, costs and fees. Inreturn, each Series of the FAF Funds pays a Fixed Administration feeto the Manager (the “Fixed Administration fee”). Up to December 31,2017, the Fixed Administration Fee payable by each Series of theFunds is subject to a transitional adjustment payment, details ofwhich are presented in the Funds’ simplified prospectus.
In addition to the Fixed Administration Fee, each Series of the FAFFunds pays certain operating expenses directly, referred to as “OtherFund Costs”. These include the costs and expenses related to theIndependent Review Committee (“IRC”) of the Funds, the ongoingaudit costs associated with compliance with IFRS, the cost of any newgovernment or regulatory requirements, including compliance withthe Volcker Rule under Dodd Frank Wall Street Reform andConsumer Protection Act and other applicable U.S. regulations, anynew fees introduced by a securities regulators or other governmentauthority that is based on the assets or other criteria of the Funds, anytransaction costs, including all fees and costs related to derivatives,
and any borrowing costs, and taxes (including, but not limited to, GSTor HST, as applicable). Refer to the simplified prospectus of the Fundsfor more details on Other Fund Costs. Other Fund Costs will beallocated among the FAF Funds and each Series of the FAF Funds isallocated its own expenses and its proportionate share of theseexpenses that are common to all Series.
The Fixed Administration Fee does not apply to Scotia Private ShortTerm Income Pool. Each series of this Fund pays its own share of allexpense (“Operating Expenses”) common to the Funds along withseries specific expenses relevant to each Series. Operating expensesmay include legal fees and other costs incurred in order to complywith legal and regulatory requirements and policies, audit fees, taxes,brokerage commissions, unitholder communication costs and otheradministrative costs. Examples of other administrative costs includedepartmental expenses incurred and paid by the Manager whichsupport the daily operation of the Funds. These expenses also includethe costs in connection with the operation of the IRC (such as thecosts of holding meetings, insurance premiums for the IRC, and feesand expenses of any advisor engaged by the IRC), the fees paid to eachIRC member, and the reasonable expenses associated with theperformance of his or her duties as an IRC member.
The Manager may, in some years and in certain cases, pay a portion ofa Series’ Fixed Administration Fee, Other Fund Costs or OperatingExpenses. The Fixed Administration Fee, Other Fund Costs andOperating Expenses, as applicable, are included in the managementexpense ratio of each Series of a Fund.
The Fixed Administration Fee, Other Fund Costs and OperatingExpense are accrued daily and paid monthly. The maximum annualrates of the Fixed Administration Fee, which are a percentage of thenet asset value for each series of units of each Fund, are as follows:
% of Net Asset Value
Series A Series F Series I Series K Series M Pinnacle Series
Scotia Private PoolsScotia Private Income Pool – 0.08 0.03 – – 0.07Scotia Private High Yield Income Pool – 0.05 0.03 0.11 0.03 0.11Scotia Private American Core-Plus Bond Pool – 0.10 0.03 – – 0.18Scotia Private Strategic Balanced Pool – 0.10 – – – 0.30Scotia Private Canadian Value Pool – 0.10 0.05 – – 0.15Scotia Private Canadian Growth Pool – 0.10 0.04 – – 0.15Scotia Private Canadian Small Cap Pool – 0.10 0.03 – 0.15 0.22Scotia Private Canadian Mid Cap Pool – 0.10 0.08 – – 0.24Scotia Private U.S. Value Pool – 0.10 0.03 – – 0.21Scotia Private U.S. Large Cap Growth Pool – 0.10 0.07 – – 0.27Scotia Private U.S. Mid Cap Growth Pool – 0.10 0.04 – 0.05 0.50Scotia Private U.S. Mid Cap Value Pool – 0.10 0.10 – 0.08 0.49Scotia Private International Equity Pool – 0.10 0.04 – – 0.24Scotia Private International Small to Mid Cap Value Pool – 0.10 0.10 – – 0.50Scotia Private Global Equity Pool – 0.10 0.04 – – 0.31Scotia Private Global Real Estate Pool – 0.10 0.03 – – 0.11Scotia Private Emerging Markets Pool – – 0.07 – 0.09 0.23
Pinnacle PortfoliosPinnacle Income Portfolio 0.15 – – – – –Pinnacle Balanced Portfolio 0.08 – – – – –Pinnacle Growth Portfolio 0.15 – – – – –
7. Redeemable UnitsUnits issued and outstanding represent the capital of each Fund. Eachof the Funds may issue an unlimited number of units. Each unit isredeemable at the option of the unitholder in accordance with the
Declaration of Trust, ranks pari passu with all other units of the Fundsand entitles the unitholder to a proportionate undivided interest in theNet Asset Value of the Funds. Unitholders are entitled to distributionswhen declared. Distributions on units of a Fund are reinvested inadditional units of the Fund or at the option of the unitholder, paid in
119

cash. The Funds’ capital is managed in accordance with each of theFunds’ investment objectives, policies and restrictions, as outlined inthe Funds’ prospectus. The Funds have no specific restrictions orspecific capital requirements on the subscriptions or redemptions ofunits, other than minimum subscription requirements.
The units of each Series of the Funds are issued and redeemed at theirNet Asset Value per unit of each Series which is determined as of theclose of business on each day that the Toronto Stock Exchange is openfor trading. The Net Asset Value per unit is calculated by dividing theNet Asset Value per Series by the total number of outstanding units ofeach Series.
For the periods ended June 30, 2017 and 2016, the following number of units were issued, reinvested and redeemed:
June 2017 June 2016
Scotia Private PoolsOpening
UnitsUnits
IssuedUnits
ReinvestedUnits
RedeemedEnding
UnitsOpening
UnitsUnits
IssuedUnits
ReinvestedUnits
RedeemedEnding
Units
Scotia Private American Core-Plus Bond PoolPinnacle Series Units 10,470,587 1,867,872 186,596 1,223,227 11,301,828 7,116,663 3,113,659 140,943 829,012 9,542,253Series F Units 23,143 2,949 141 3,509 22,724 14,295 3,121 147 – 17,563Series I Units 75,037,925 2,885,936 1,383,190 490,198 78,816,853 70,608,961 1,114,461 1,150,020 1,176,198 71,697,244
Scotia Private Canadian GrowthPoolPinnacle Series Units 11,957,258 1,494,681 – 921,414 12,530,525 10,026,269 2,950,603 – 1,431,292 11,545,580Series F Units 47,354 2,908 – 2,761 47,501 49,767 7,026 – 11,749 45,044Series I Units 593,528 6,239 – 45,930 553,837 721,391 132,835 – 146,268 707,958
Scotia Private Canadian MidCap PoolPinnacle Series Units 3,544,202 577,520 – 261,664 3,860,058 3,143,132 863,110 – 554,476 3,451,766Series F Units 13,199 4,002 – 4,212 12,989 10,009 4,104 – 2,692 11,421Series I Units 509,169 251,244 – 10,130 750,283 504,757 54,458 – 102,120 457,095
Scotia Private Canadian SmallCap PoolPinnacle Series Units 2,843,017 298,046 – 275,088 2,865,975 2,362,718 649,724 – 316,646 2,695,796Series F Units 78,759 20,196 – 9,419 89,536 33,973 29,961 – 7,951 55,983Series I Units 14,987,158 303,782 – 357,843 14,933,097 13,932,082 1,651,967 – 753,274 14,830,775Series M Units 103 6,247,007 – 428,039 5,819,071 – – – – –
Scotia Private Canadian ValuePoolPinnacle Series Units 8,106,216 921,907 – 991,801 8,036,322 7,868,606 1,456,581 – 1,487,391 7,837,796Series F Units 37,121 1,341 – 4,051 34,411 34,980 5,170 – 6,161 33,989Series I Units 315,711 729 – 21,891 294,549 525,069 4,985 – 141,803 388,251
Scotia Private EmergingMarkets PoolPinnacle Series Units 6,334,650 787,969 – 677,514 6,445,105 4,652,145 1,507,374 – 336,042 5,823,477Series I Units 18,698,215 366,951 – 660,141 18,405,025 16,362,952 3,257,616 – 953,012 18,667,556Series M Units 1,358,596 328,495 – 267,651 1,419,440 1,713,823 123,637 – 274,638 1,562,822
Scotia Private Global EquityPoolPinnacle Series Units 1,226,709 37,727 – 151,201 1,113,235 2,804,660 123,458 – 1,605,355 1,322,763Series F Units 389,943 55,368 – 73,584 371,727 52,066 218,058 – 17,812 252,312Series I Units 13,710,612 40,730 – 909,774 12,841,568 13,137,194 1,190,699 – 687,707 13,640,186
Scotia Private Global RealEstate PoolPinnacle Series Units 8,526,226 1,045,500 – 885,837 8,685,889 9,841,242 1,066,720 – 3,473,677 7,434,285Series F Units 54,096 1,492 – 10,643 44,945 97,260 17,817 – 9,109 105,968Series I Units 9,083,228 675,298 – 68,165 9,690,361 7,627,152 626,529 – 491,132 7,762,549
Scotia Private High YieldIncome PoolPinnacle Series Units 23,716,044 2,815,021 662,967 2,140,753 25,053,279 19,592,175 3,707,034 635,878 1,400,817 22,534,270Series F Units 1,745,903 69,225 8,860 87,120 1,736,868 1,771,696 96,710 11,621 42,732 1,837,295Series I Units 55,944,736 2,675,529 1,612,661 571,266 59,661,660 52,227,011 2,420,729 1,662,736 390,140 55,920,336Series K Units 128,577 667,130 17,407 21,416 791,698 – – – – –Series M Units 50,459,644 6,593,350 1,097,725 6,098,768 52,051,951 50,693,862 5,885,319 1,185,140 6,707,207 51,057,114
Scotia Private Income PoolPinnacle Series Units 43,507,985 7,693,209 512,542 5,362,950 46,350,786 36,546,672 7,465,128 540,288 3,911,816 40,640,272Series F Units 172,404 15,663 663 30,269 158,461 198,810 35,538 1,216 38,872 196,692Series I Units 2,279,453 46,888 25,758 182,848 2,169,251 2,757,463 6,436 36,133 288,521 2,511,511
Scotia Private InternationalEquity PoolPinnacle Series Units 13,306,846 1,618,427 – 1,354,678 13,570,595 7,693,860 5,069,243 1 648,333 12,114,771Series F Units 99,283 8,706 – 15,997 91,992 103,945 23,188 – 6,720 120,413Series I Units 78,500,698 1,823,509 – 5,039,758 75,284,449 67,612,353 8,142,306 – 1,729,333 74,025,326
120

June 2017 June 2016
Scotia Private PoolsOpening
UnitsUnits
IssuedUnits
ReinvestedUnits
RedeemedEnding
UnitsOpening
UnitsUnits
IssuedUnits
ReinvestedUnits
RedeemedEnding
Units
Scotia Private InternationalSmall to Mid Cap Value PoolPinnacle Series Units 2,069,418 236,121 – 219,712 2,085,827 1,642,128 467,908 – 199,128 1,910,908Series F Units 23,849 1,252 – 2,234 22,867 23,211 4,379 – 1,896 25,694Series I Units 63,453 174 – 13,358 50,269 77,390 781 – 8,464 69,707
Scotia Private Short TermIncome PoolPinnacle Series Units 588,967 141,529 610 207,453 523,653 608,302 246,687 777 339,543 516,223Series F Units 7,411 601 5 406 7,611 14,701 600 5 8,814 6,492
Scotia Private StrategicBalanced PoolPinnacle Series Units 3,065,214 557,563 44,996 392,587 3,275,186 2,874,516 474,115 46,279 375,056 3,019,854Series F Units 42,512 18,165 223 7,812 53,088 31,789 6,637 96 2,226 36,296
Scotia Private U.S. Large CapGrowth PoolPinnacle Series Units 5,691,434 747,492 – 599,128 5,839,798 4,144,093 1,701,411 – 543,270 5,302,234Series F Units 100,701 20,650 – 42,096 79,255 45,964 87,498 – 13,409 120,053Series I Units 307,650 1,404 – 59,974 249,080 295,235 60,632 – 14,898 340,969
Scotia Private U.S. Mid CapGrowth PoolPinnacle Series Units 276,840 8,650 – 28,815 256,675 674,432 37,130 – 411,960 299,602Series F Units 6,463 649 – 831 6,281 8,621 885 – 2,087 7,419Series I Units – – – – – – – – – –Series M Units 1,607,625 112,000 – 203,740 1,515,885 1,867,691 118,523 – 222,851 1,763,363
Scotia Private U.S. Mid CapValue PoolPinnacle Series Units 4,204,946 786,317 – 465,610 4,525,653 873,002 2,958,467 – 158,779 3,672,690Series F Units 23,196 2,636 – 1,402 24,430 18,535 4,487 – 3,423 19,599Series I Units 300,217 93,449 – 16,989 376,677 93,457 239,333 – 16,233 316,557Series M Units 3,153,521 123,271 – 3,159,391 117,401 3,703,142 233,940 – 437,807 3,499,275
Scotia Private U.S. Value PoolPinnacle Series Units 6,827,413 862,291 – 640,656 7,049,048 6,139,031 1,151,210 – 1,007,072 6,283,169Series F Units 28,024 2,100 – 1,774 28,350 31,902 2,888 – 5,976 28,814Series I Units 320,186 2,128 – 42,424 279,890 392,926 15,323 – 72,109 336,140
Pinnacle Portfolios
Pinnacle Balanced PortfolioSeries A Units 4,589,552 209,928 – 578,873 4,220,607 5,579,731 303,677 – 825,732 5,057,676
Pinnacle Growth PortfolioSeries A Units 603,132 25,287 – 120,612 507,807 808,054 23,808 – 115,954 715,908
Pinnacle Income PortfolioSeries A Units 782,788 9,704 – 104,409 688,083 966,356 68,344 – 66,043 968,657
(i) Included in units redeemed are redemptions related to payments of the Pinnacle Program Fee, where applicable.
8. Income TaxesEach of the Funds qualifies or expects to qualify as a mutual fundtrust under the Income Tax Act (Canada). The Funds are subject totax on their net investment income, including the taxable portion ofnet realized capital gains that are not paid or payable to theirunitholders. Each Fund distributes sufficient amounts of its netinvestment income, including net realized capital gains, less theamount retained to enable each Fund to utilize any available taxlosses or, if applicable, tax credits attributable to redemptions duringthe period by its unitholders such that no income tax will be paid orpayable by the Funds. Such net investment income, including netrealized capital gains are taxable in the hands of the unitholders.
Accordingly, the Funds do not record Canadian income taxes in theirfinancial statements.
In certain circumstances, the Funds may distribute a return of capital.A return of capital is generally not taxable to unitholders but willreduce the adjusted cost base of the units held.
Losses Carried Forward
Capital losses can be carried forward indefinitely to reduce future netrealized capital gains. Non-capital losses for income tax purposes maybe carried forward up to twenty years and applied against all sourcesof income. Since the Funds do not record income taxes, the tax benefitof capital and non-capital losses have not been reflected in theStatements of Financial Position as a deferred income tax asset.
121

As of 2016 tax year end, Trust Funds have capital and/or non-capitallosses available to carry forward as indicated in the table below:
Yearof
expiry
Non-Capital
Loss$
CapitalLoss
$
Scotia Private PoolsScotia Private American Core-Plus Bond Pool – – 17,519,496Scotia Private Canadian Growth Pool – – 36,700,014Scotia Private Canadian Mid Cap Pool – – –Scotia Private Canadian Small Cap Pool – – –Scotia Private Canadian Value Pool – – 9,866,418Scotia Private Emerging Markets Pool – – 23,460,816Scotia Private Global Equity Pool – – –Scotia Private Global Real Estate Pool – – –Scotia Private High Yield Income Pool – – 33,560,668Scotia Private Income Pool – – –Scotia Private International Equity Pool – – 33,330,905Scotia Private International Small to Mid Cap Value
Pool – – 20,492,112Scotia Private Short Term Income Pool – – –Scotia Private Strategic Balanced Pool – – 5,159,828Scotia Private U.S. Large Cap Growth Pool – – 4,892,476Scotia Private U.S. Mid Cap Growth Pool – – 31,552,440Scotia Private U.S. Mid Cap Value Pool – – 266,710Scotia Private U.S. Value Pool – – –
Pinnacle PortfoliosPinnacle Balanced Portfolio – – –Pinnacle Growth Portfolio 2030 204,326 1,304,819
2032 2,849 –2036 – –
Pinnacle Income Portfolio – – –
Withholding Taxes
The Funds currently incur withholding taxes imposed by certaincountries on investment income and in some cases, capital gains.Such income and gains are recorded on a gross basis and the relatedwithholding taxes are shown as a separate expense in the Statementsof Comprehensive Income.
Uncertain Income Taxes
The Funds invest in securities issued by entities which are domiciledin countries other than Canada. These foreign countries may imposetaxes on capital gains realized by non-residents. In addition, theFunds may be required to determine these capital gains taxes on aself-assessment basis; therefore, such taxes may not be deducted bythe Funds broker on a “withholding” basis.
As at June 30, 2017 and December 31, 2016, the Funds have measureduncertain tax liabilities and related interest and penalties withrespect to foreign capital gains taxes as nil. While this represents theManager’s best estimate, the estimated value could differ significantlyfrom the amount ultimately payable.
9. Client Brokerage CommissionsClient brokerage commissions are arrangements pursuant to whichproducts or services, other than the execution of portfolio securitiestransactions, are obtained by a portfolio advisor from or through abroker-dealer in exchange for directing client securities transactionsto the broker-dealer. The ascertainable client brokerage commissionspaid in connection with investment portfolio transactions for theperiods ended June 30, 2017 and 2016 are set out below.
Fund 2017 2016
Scotia Private Canadian Growth Pool $ 1,783 $ 1,343Scotia Private Canadian Mid Cap Pool 5,842 6,285Scotia Private Canadian Small Cap Pool 25,614 32,138Scotia Private Emerging Markets Pool 47,621 29,995Scotia Private Global Equity Pool 2,971 5,979Scotia Private Global Real Estate Pool – 228,381Scotia Private International Small to Mid Cap Value Pool – 8,975Scotia Private Strategic Balanced Pool 680 790Scotia Private U.S. Mid Cap Growth Pool 999 –Scotia Private U.S. Value Pool – 6,248
10.Related Party TransactionsThe Manager is a wholly owned subsidiary of The Bank of Nova Scotia(“Scotiabank”). Scotiabank also owns, directly or indirectly, 100% ofScotia Securities Inc., HollisWealth Advisory Services Inc. andTangerine Investment Funds Limited, each a mutual fund dealer, andScotia Capital Inc., (which includes HollisWealth, ScotiaMcLeod andScotia iTRADE), an investment dealer.
The Manager, on behalf of the Funds, may enter into transactions orarrangements with other members of Scotiabank or certain othercompanies that are related or connected to the Manager (each a“related party”). All transactions between the Funds and the relatedparties are in the normal course of business and are carried out atarm’s length terms.
(a) The Manager earns fees for acting as trustee and manager of theFunds, and Fixed Administration Fee in return for paying certainoperating expenses of the Funds as detailed in note 5 and note 6respectively. In addition, Scotiabank as the custodian of theFunds earns a fee for providing custody and related services. Themanagement fees, fixed administration fees, and custodian fees(for Funds that are not subject to Fixed Administration Fee) aredisclosed separately in the Statements of Comprehensive Incomeand Statements of Financial Position. The custodian fee chargedto Funds that are subject to Fixed Administration Fee is paid bythe Manager, in exchange for the Fixed Administration Feereceived from these Funds.
(b) Decisions about the purchase and sale of each Fund’s portfoliosecurities are made by appointed Portfolio Managers of eachFund. Provided that the pricing, service and other terms arecomparable to those offered by other dealers, a portion of theportfolio transactions may be executed for the Funds, by arelated party to the Funds. In such cases, the related party willreceive commissions from the Fund. Brokerage fees paid torelated parties for the periods ended June 30, 2017 and 2016 areas follows:
Fund June 30, 2017 June 30, 2016
Scotia Private Canadian Growth Pool $ 7,034 $ 7,061Scotia Private Canadian Mid Cap Pool 28,718 6,679Scotia Private Canadian Small Cap Pool 21,478 29,648Scotia Private Canadian Value Pool 15,540 22,919Scotia Private International Small to Mid Cap Value Pool – 637Scotia Private Strategic Balanced Pool 594 2,457
(c) Certain registered dealers through which units of the Fund aredistributed are related parties to the Fund and the Manager. TheManager pays to these related parties a trailer commission out ofits management fees, representing distribution and servicing
122

fees, based on the amount of assets held in the investors’accounts. These fees are paid on the basis and at the same ratesthat the Manager pays to non-affiliated dealers.
(d) The Manager received approval from the Independent ReviewCommittee to invest the Funds’ overnight cash with Scotiabankwith interest paid by Scotiabank to the Funds based on prevailingmarket rates. The interest earned by the Funds is included in“Interest for distribution purposes” in the Statements ofComprehensive Income.
(e) The Manager has received approval from the IndependentReview Committee for the Funds to purchase securities of relatedparties. Any related party securities held by the Funds aredisclosed in the Schedule of Investment Portfolio for therespective Funds.
(f) The Funds may invest in investment funds managed by theManager or a related party, which are disclosed in the Scheduleof Investment Portfolio for the respective Funds. These includeScotia Funds, Scotia Private Pools, Pinnacle Portfolios, DynamicFunds, Marquis Funds and Dynamic Private Investment Pools.
(g) Units held by the Manager in the Funds as at June 30, 2017 andDecember 31, 2016, are disclosed below:
Fund June 30, 2017 December 31, 2016
Scotia Private Canadian Small Cap Pool – 103 Series M UnitsScotia Private High Yield Income Pool – 103 Series K Units
(h) Distributions received from related party funds are included in“Interest for distribution purposes”, “Dividends”, or “Net realized
gain (loss) on non-derivative financial assets”, as applicable inthe Statements of Comprehensive Income.
11.Securities LendingSome of the Funds may enter into securities lending transactionsunder a securities lending program with their custodian, The Bank ofNova Scotia. These transactions involve the temporary exchange ofsecurities for collateral with a commitment to return the samesecurities to the Fund on a future date. In accordance with securityregulations, the Funds receive minimum collateral of 102%. Collateralis received in the form of debt obligations of the Government ofCanada, a Canadian provincial government, the government of theUnited States of America, certain financial institutions or otherqualified securities, and is not included in the Schedule of InvestmentPortfolio. The Funds do not receive cash collateral from any securitieslending transactions. The aggregate market value of all securitiesloaned by a Fund cannot exceed 50% of the Net Assets of the Fund.The fair value of the securities lent and collateral held is determinedon a daily basis. The securities lending arrangement can beterminated by the borrower, the securities lending agent or the Fundat any time.
The income earned from these securities lending transactions isrecorded in the Statements of Comprehensive Income. The securitieslending agent earns 30% of the gross income generated through anysecurities lending transactions in the Funds.
The aggregate market value of the securities on loan and the collateralreceived by the Funds as at June 30, 2017 and December 31, 2016 arepresented below along with the income earned for the six-monthperiods ended June 30, 2017 and 2016:
As at June 30, 2017 For the period ended June 30, 2017
Trust Funds
Market value ofsecurities on loan
($)
Market value ofcollateral received
($)
Net amount receivedby the Fund
($)
Amount earned bylending agent
($)
Gross securities lendingrevenue earned
($)
Scotia Private American Core-Plus Bond Pool 102,111,240 107,343,525 50,633 21,700 72,333Scotia Private Canadian Growth Pool 6,306,806 6,621,165 2,300 986 3,286Scotia Private Canadian Mid Cap Pool – – 20,347 8,728 29,075Scotia Private Canadian Small Cap Pool 138,782,214 146,032,247 101,080 43,341 144,421Scotia Private Canadian Value Pool 14,407,004 15,148,951 10,825 4,644 15,469Scotia Private Emerging Markets Pool 12,875,241 13,528,134 4,434 1,901 6,335Scotia Private Global Equity Pool 36,911 38,782 13,999 6,001 20,000Scotia Private Global Real Estate Pool 10,330,152 10,853,591 1,457 625 2,082Scotia Private High Yield Income Pool 100 105 81 34 115Scotia Private Income Pool 119,276,253 126,699,755 24,806 10,632 35,438Scotia Private International Equity Pool 4,438,592 4,678,915 110,343 47,291 157,634Scotia Private International Small to Mid Cap
Value Pool 648,990 682,620 684 295 979Scotia Private Short Term Income Pool 99,885 104,775 2 1 3Scotia Private Strategic Balanced Pool 9,482,013 9,968,273 8,400 3,604 12,004Scotia Private U.S. Large Cap Growth Pool – – 238 102 340Scotia Private U.S. Mid Cap Growth Pool 967,144 1,016,501 797 343 1,140Scotia Private U.S. Mid Cap Value Pool 5,263,500 5,531,824 1,577 678 2,255Scotia Private U.S. Value Pool 2,535,861 2,664,398 2,421 1,038 3,459
123

As at December 31, 2016 For the period ended June 30, 2016
Trust Funds
Market value ofsecurities on loan
($)
Market value ofcollateral received
($)
Net amount receivedby the Fund
($)
Amount earned bylending agent
($)
Gross securities lendingrevenue earned
($)
Scotia Private American Core-Plus Bond Pool 29,746,204 31,371,739 42,125 18,054 60,179Scotia Private Canadian Growth Pool 4,148,123 4,376,465 9,658 4,141 13,799Scotia Private Canadian Mid Cap Pool 6,785,311 7,175,259 17,502 7,511 25,013Scotia Private Canadian Small Cap Pool 104,306,568 110,051,927 37,651 16,164 53,815Scotia Private Canadian Value Pool 17,942,887 18,974,697 34,404 14,749 49,153Scotia Private Emerging Markets Pool 11,909,303 12,577,744 16,001 6,859 22,860Scotia Private Global Equity Pool 4,743,642 5,038,108 10,244 4,392 14,636Scotia Private Global Real Estate Pool 141,891 150,983 717 307 1,024Scotia Private High Yield Income Pool 146 154 – – –Scotia Private Income Pool 80,683,297 84,829,058 21,148 9,070 30,218Scotia Private International Equity Pool 11,746,829 12,401,262 114,169 48,929 163,098Scotia Private International Small to Mid Cap
Value Pool 782,829 827,161 2,403 1,032 3,435Scotia Private Short Term Income Pool – – 15 7 22Scotia Private Strategic Balanced Pool 7,682,106 8,088,926 4,534 1,946 6,480Scotia Private U.S. Large Cap Growth Pool – – 5,215 2,236 7,451Scotia Private U.S. Mid Cap Growth Pool 1,060,388 1,127,417 3,390 1,453 4,843Scotia Private U.S. Mid Cap Value Pool 2,435,141 2,588,527 1,085 466 1,551Scotia Private U.S. Value Pool 4,112,876 4,342,562 10,470 4,488 14,958
12.Subsequent EventsSale of HollisWealth
On August 4, 2017, Industrial Alliance Insurance and FinancialServices Inc. completed its acquisition of HollisWealth includingHollisWealth Advisory Services Inc. (collectively, “HollisWealth”), arelated party of the Manager. As such, HollisWealth ceased to be arelated party.
Change in Custodian
On or about September 29, 2017, State Street Trust Company Canadawill replace The Bank of Nova Scotia in its capacity as the Custodianof Funds.
13.Currency LegendThe following is a list of abbreviations that may be used in theFinancial Statements:
AUD Australian Dollar KRW South Korean Won
BMD Bermuda Dollar MXN Mexican Peso
BRL Brazilian Real MYR Malaysian Ringgit
CAD Canadian Dollar NOK Norwegian Krone
CHF Swiss Franc NZD New Zealand Dollar
DKK Danish Krone PHP Philippine Peso
EUR Euro PKR Pakistani Rupee
GBP Pound Sterling SEK Swedish Krona
HKD Hong Kong Dollar SGD Singapore Dollar
IDR Indonesian Rupiah THB Thailand Baht
ILS Israeli Shekel TWD New Taiwan Dollar
INR Indian Rupee USD US Dollar
JPY Japanese Yen ZAR South African Rand
124

ManagementResponsibilityforFinancialReporting
The accompanying financial statements of the Funds (as defined in Note 1) have beenprepared by 1832 Asset Management L.P., in its capacity as manager (the “Manager”) ofthe Funds, and have been approved by the Board of Directors of 1832 Asset ManagementG.P. Inc., as general partner for and on behalf of 1832 Asset Management L.P., in itscapacity as trustee (the “Trustee”) of the Funds. The Board of Directors of 1832 AssetManagement G.P. Inc., as general partner for and on behalf of 1832 Asset ManagementL.P., is responsible for the information and representations contained in these financialstatements and the management report of fund performance.
The Manager maintains appropriate processes to ensure that relevant and reliablefinancial information is produced. The financial statements have been prepared inaccordance with International Financial Reporting Standards (“IFRS”) and includecertain amounts that are based on estimates and judgments made by the Manager. Thesignificant accounting policies which the Manager believes are appropriate for the Fundsare described in Note 2 to the financial statements.
The Board of Directors of 1832 Asset Management G.P. Inc. has delegated responsibility foroversight of the financial reporting process to the Finance Committee of the Board ofDirectors of 1832 Asset Management G.P. Inc. (the “Finance Committee”). The FinanceCommittee is responsible for reviewing the financial statements and the managementreport of fund performance and recommending them to the Board of Directors of1832 Asset Management G.P. Inc. for approval, in addition to meeting with management,internal auditors and external auditors to discuss internal controls over the financialreporting process, auditing matters and financial reporting issues.
PricewaterhouseCoopers LLP is the external auditor of the Funds, appointed by theTrustee of the Funds. The auditor of the Funds has not reviewed these financialstatements. Applicable securities laws require that if an external auditor has not reviewedthe Funds’ financial statements, this must be disclosed in an accompanying notice.
Glen Gowland
President
1832 Asset Management L.P.
Abdurrehman Muhammadi
Chief Financial Officer
1832 Asset Management L.P.
August 22, 2017
125

Scotia Private Pools®and
Pinnacle PortfoliosInterim ReportJune 30, 2017
Money Market FundScotia Private Short Term Income Pool
Bond FundsScotia Private Income Pool
Scotia Private High Yield Income Pool
Scotia Private American Core-Plus Bond Pool
Balanced FundScotia Private Strategic Balanced Pool
Canadian Equity FundsScotia Private Canadian Value Pool
Scotia Private Canadian Mid Cap Pool
Scotia Private Canadian Growth Pool
Scotia Private Canadian Small Cap Pool
Foreign Equity FundsScotia Private U.S. Value Pool
Scotia Private U.S. Mid Cap Value Pool
Scotia Private U.S. Mid Cap Growth Pool
Scotia Private U.S. Large Cap Growth Pool
Scotia Private International Equity Pool
Scotia Private International Small to Mid Cap Value Pool
Scotia Private Emerging Markets Pool
Scotia Private Global Equity Pool
Scotia Private Global Real Estate Pool
Pinnacle PortfoliosPinnacle Income Portfolio
Pinnacle Balanced Portfolio
Pinnacle Growth Portfolio
SM54D 9098E-1 (08/17)
For more information about Scotia Private Pools® and Pinnacle Portfolios:
visit:www.scotiabank.com/scotiaprivatepoolswww.scotiabank.com/pinnacleportfolios
call:1-800-268-9269 (English)1-800-387-5004 (French)
write:1832 Asset Management L.P.
1 Adelaide Street East 28th Floor
Toronto, OntarioM5C 2V9
® Registered trademark of The Bank of Nova Scotia, used under licence.
403780_002-Pinnacle ARCvr Eng9_007409-Pinnacle ARCvr Eng.qx10 04/08/2017 21:53 Page 1