Embed Size (px)
Citation preview
CBRE RESEARCH
2 01 7 S C O R I N G T E C H T A L E N T
Influencing Innovation, Economic and Real Estate Growth in 50 U.S. and Canadian Markets

2017 SCORING TECH TALENT | CBRE Research2

3 © 2017 CBRE, Inc.
C O N T E N T S
W H A T I S T E C H T A L E N T ?
Tech talent is a group of highly skilled workers in more than 20 technology-oriented occupations driving innovation across all industry sectors.
W H I C H A R E T H E T O P - R A N K E D T E C H T A L E N T M A R K E T S ?
A scorecard measuring 13 metrics to gauge the competitive advantages of markets and their ability to attract and grow tech talent pools determined the top-ranked tech talent markets.
W H A T A R E T E C H T A L E N T M O M E N T U M M A R K E T S ?
Tech talent growth rates are the best and most easily quantified indicator of labor pool momentum and patterns across both large and small markets.
W H A T D E F I N E S A T E C H T A L E N T M A R K E T ?
Tech talent markets are characterized by high concentrations of college-educated workers, major universities producing tech graduates and large millennial populations.
W H I C H A R E T H E H I G H E S T- A N D L O W E S T- C O S T M A R K E T S T O
O P E R A T E I N ?
Employee wages and office rent for a typical 500 person U.S.-based tech firm using 75,000 sq. ft. of office space provide insight into annual operating costs, market-by-market.
H O W I S T E C H T A L E N T Q U A L I T Y V S . C O S T M E A S U R E D ?
Plotting a quality assessment against average software developer salary by market visualizes the distribution of quality and cost across the top-50 tech talent markets.
H O W D O E S T E C H T A L E N T I M PA C T C O M M E R C I A L R E A L E S T A T E ?
Markets with high concentrations or clusters of rapidly growing tech talent employers have driven office leasing demand, causing rising rents and declining vacancies.
A P P E N D I X
Local market profiles and full report data summary
Scoring Tech Talent is a comprehensive analysis of labor market conditions, cost and quality for highly skilled tech workers in the U.S. and Canada. The 50 largest markets were ranked according to their competitive advantages and appeal to tech employers and tech talent. The analysis also provides insight into the quality of tech talent, their demographics and how tech talent growth patterns are impacting cities and real estate markets.
0 6
1 3
2 5
0 8
1 6
2 8
3 1
3 4

2017 SCORING TECH TALENT | CBRE Research4
K E Y T A K E A W A Y S
Nearly 6 million highly skilled workers comprise the tech talent that is leading global innovation by developing the software and devices we depend on and managing the data and systems that ensure functionality of our tech ecosystems.
MOMENTUM QUALITY #SCORE
The quality of tech talent comes at a cost. The San Francisco Bay Area and Seattle were standouts for both quality and cost. The best value markets were in Canada and the Midwest.
13 metrics measured each market’s depth, vitality and attractiveness. The top-ranked markets were the San Francisco Bay Area, Seattle and New York. Atlanta and Toronto jumped up in the rankings.
Tech job growth has accelerated in 28 of 50 markets, including surges in Orange County, Kansas City, Madison, Salt Lake City and Pittsburgh.
5 © 2017 CBRE, Inc.
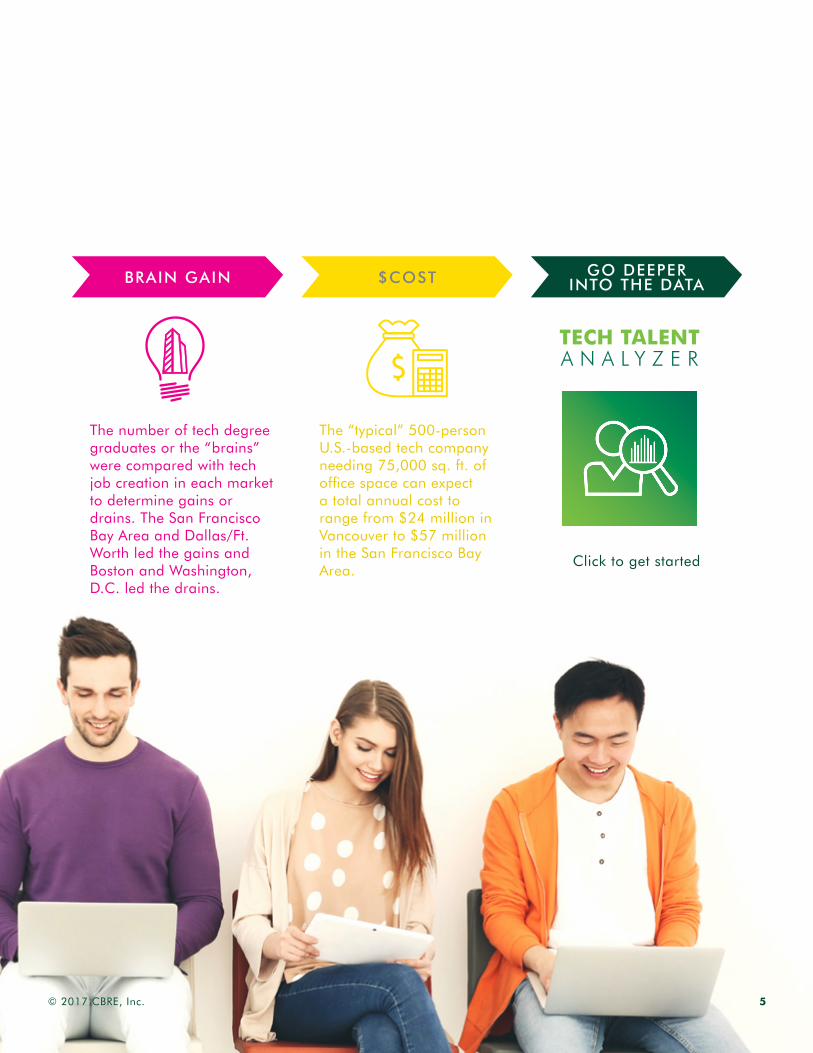
BRAIN GAIN $COST GO DEEPERINTO THE DATA
The number of tech degree graduates or the “brains” were compared with tech job creation in each market to determine gains or drains. The San Francisco Bay Area and Dallas/Ft. Worth led the gains and Boston and Washington, D.C. led the drains.
The “typical” 500-person U.S.-based tech company needing 75,000 sq. ft. of office space can expect a total annual cost to range from $24 million in Vancouver to $57 million in the San Francisco Bay Area.
TECH TALENT A N A L Y Z E R
Click to get started

2017 SCORING TECH TALENT | CBRE Research6
W H A T I S T E C H T A L E N T ?
1Tech Talent includes the following occupation categories: software developers and programmers; computer support, database and systems; technology and engineering related; and computer and information system managers.
Technology has become integrated into nearly everything we do, highlighting the growing scope of devices and software that form the internet of things. Highly skilled tech talent individuals are creating and enabling this evolving culture between work and home. Computers in the home and workplace are commonplace, but new tools (i.e., wearable technology, Wi-Fi-enabled lightbulbs and voice-activated home assistants) are becoming more universally adopted, and expectations for fast deliveries and real-time information updates are increasing. Technology is the future and companies from all industries are expanding their innovation capabilities to satisfy changing customer and consumer demands.
Nearly 6 million highly skilled tech talent workers are leading global innovation that will shape our daily lives and economy for decades to come. These tech talent workers comprise 20 different occupations, from software developers who enable the devices we
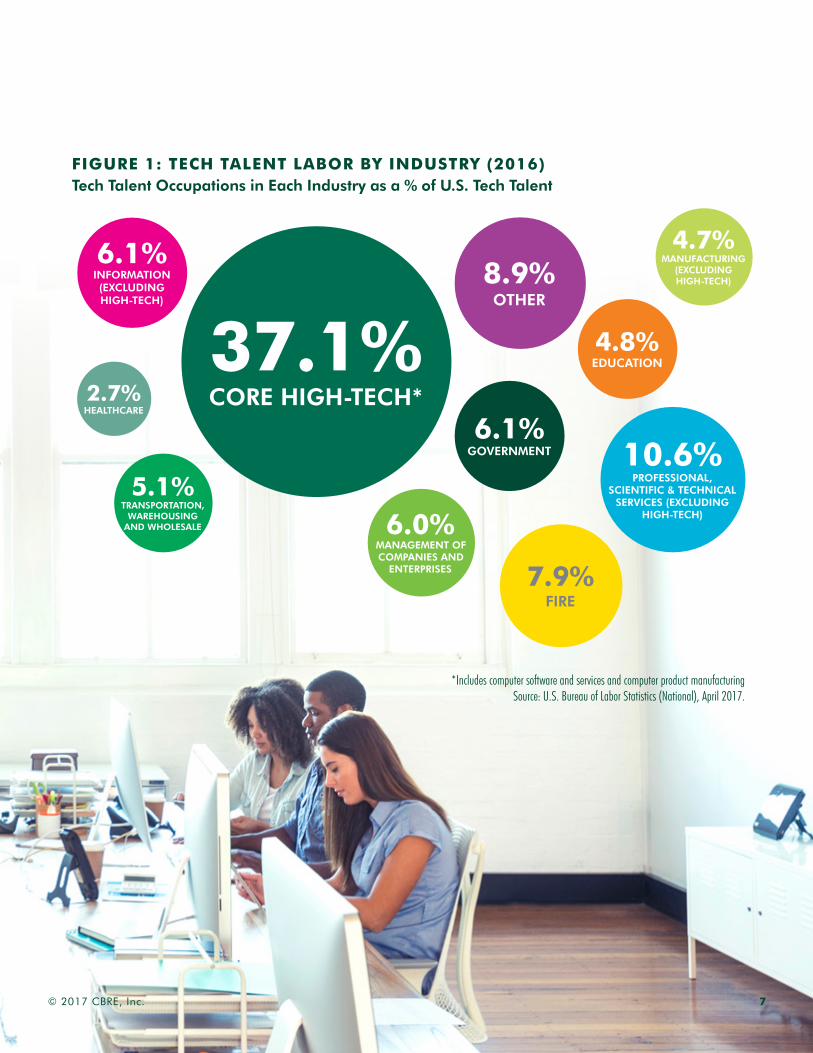
depend on to systems and data managers who ensure that our tech ecosystems function.1 These positions are highly concentrated within the high-tech services industry but are not limited to any one type of company and are spread across all industry sectors (Figure 1). Using this definition, a software developer who works for a logistics company is included in our data.
The 4.9 million tech talent workers in the U.S. and 776,000 in Canada account for 3.5% and 5.1% of total workers in each country, respectively. This relatively small labor force has an outsized impact on real estate markets and the economy. The number of tech talent workers has increased by 27% in the past five years, adding more than 1 million jobs to the U.S. economy at a pace more than three times the national average. They are fueling new innovation and adapting technology within non-traditional tech sectors to increase productivity and strengthen the national economy.
7 © 2017 CBRE, Inc.
FIGURE 1: TECH TALENT LABOR BY INDUSTRY (2016)Tech Talent Occupations in Each Industry as a % of U.S. Tech Talent
*Includes computer software and services and computer product manufacturingSource: U.S. Bureau of Labor Statistics (National), April 2017.
37.1%CORE HIGH-TECH*
6.0%MANAGEMENT OF COMPANIES AND
ENTERPRISES
5.1%TRANSPORTATION,
WAREHOUSING AND WHOLESALE
4.7%MANUFACTURING
(EXCLUDING HIGH-TECH)
6.1%INFORMATION (EXCLUDING HIGH-TECH)
10.6%PROFESSIONAL,
SCIENTIFIC & TECHNICAL SERVICES (EXCLUDING
HIGH-TECH)
7.9%FIRE
2.7%HEALTHCARE
6.1%GOVERNMENT
4.8%EDUCATION
8.9%OTHER

2017 SCORING TECH TALENT | CBRE Research8
W H I C H A R E T H E T O P - R A N K E D T E C H T A L E N T M A R K E T S ?
The highly competitive and supply constrained market for tech talent, along with advanced communications infrastructure, has accelerated the expansion of tech talent labor pools beyond major hubs and into smaller markets. These previously untapped and undersupplied regions are gaining appeal from start-ups and established companies. Accordingly, demand for commercial real estate to accommodate this growing workforce is on the rise.
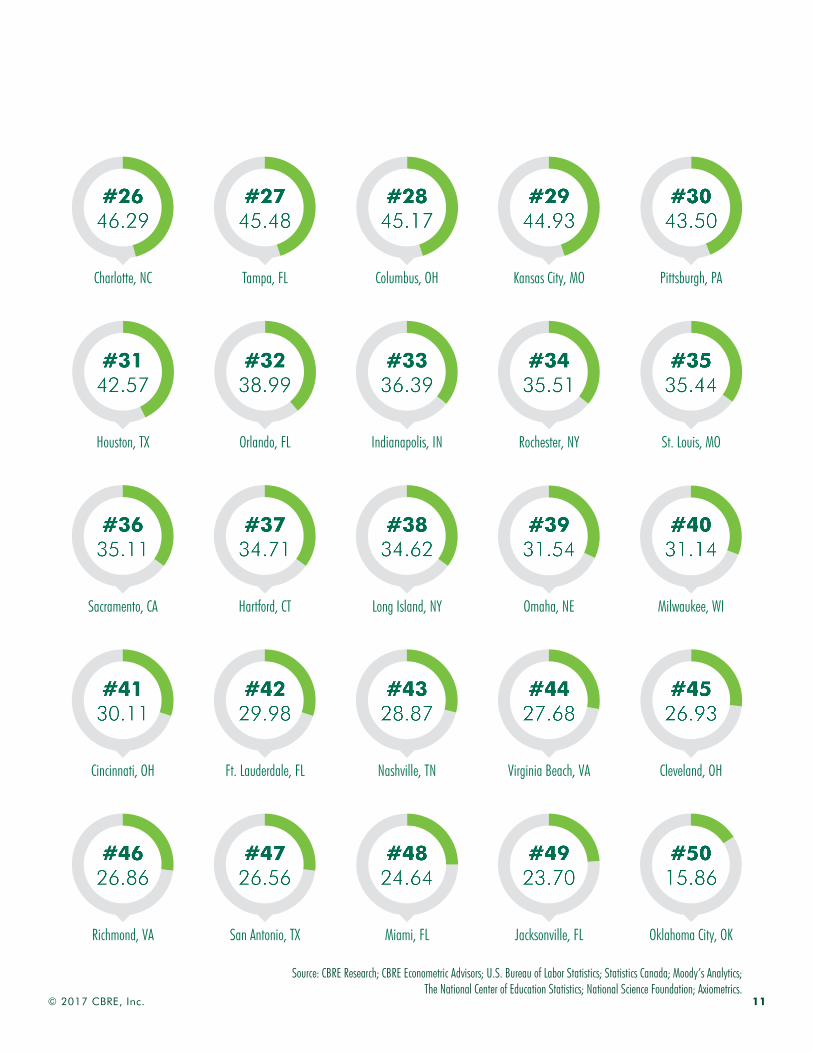
Fifty of the largest markets by number of tech talent professionals in the U.S. and Canada were analyzed to create a scorecard that ranks them (Figure 2). The scorecard uses 13 metrics to measure each market’s depth, vitality and attractiveness to companies seeking tech talent and to tech workers seeking employment. Each metric was weighted by its relative importance to job creation and innovation. Tech
talent concentration metrics have the highest weights because they signify clustering of tech workers. Labor costs for tech talent are weighted more heavily than office rents because companies allocate more capital to labor than to real estate.
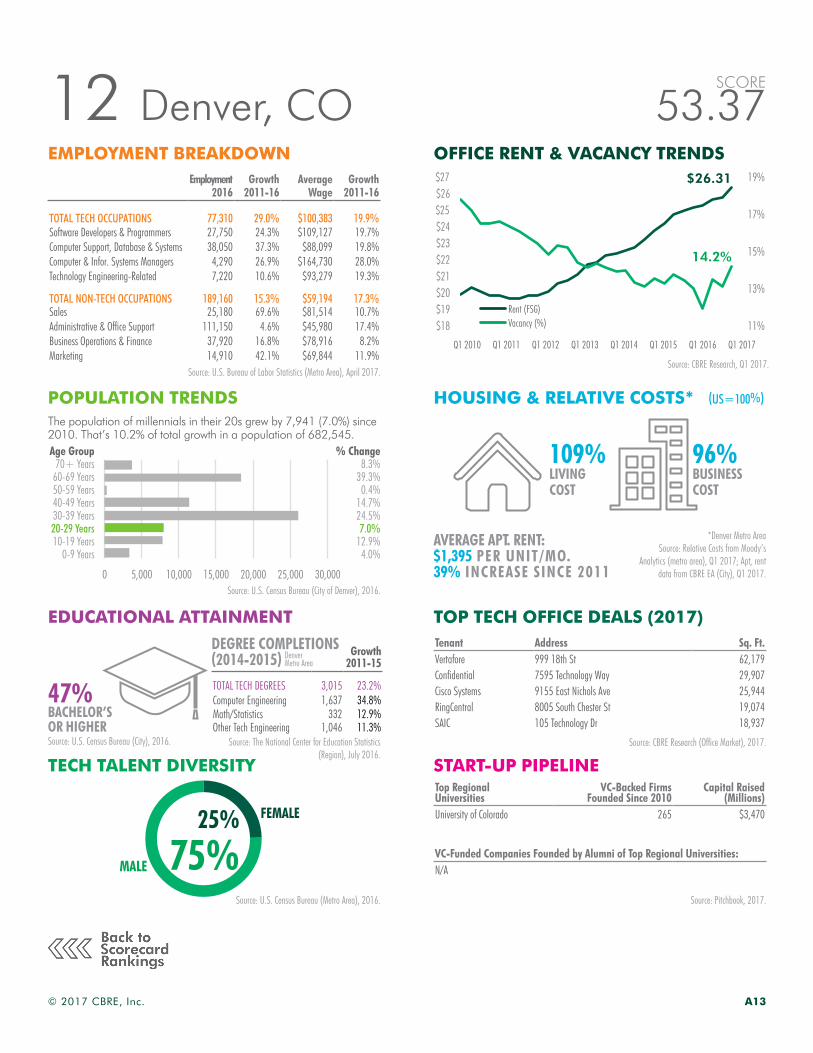
The top-three markets were the San Francisco Bay Area, Seattle and New York. Comparing the 2017 market rankings with the previous year, a few markets shifted positions. While the San Francisco Bay Area maintained the top score, Seattle and New York each moved up one spot to second and third, and Washington, D.C. slipped to fourth. Supported by strong tech-centric universities, Atlanta rose four spots to fifth and Toronto rose six spots to sixth. Other large changes came from Denver and Newark—both rose six spots to 12th and 13th, respectively.

9 © 2017 CBRE, Inc.

2017 SCORING TECH TALENT | CBRE Research10
New York, NYSeattle, WA Washington, D.C. Atlanta, GA
Detroit, MI Salt Lake City, UTPhiladelphia, PA Los Angeles, CA Madison, WI
Vancouver, BC Minneapolis/St. Paul, MNPhoenix, AZ San Diego, CA Portland, OR
Baltimore, MD Newark, NJDenver, CO Orange County, CA Chicago, IL
Toronto, ON Austin, TXRaleigh-Durham, NC Boston, MA Dallas/Ft. Worth, TX
FIGURE 2: TECH TALENT SCORECARD RANKINGSClick on a Market to See the Full Scorecard
SF Bay Area, CA
11 © 2017 CBRE, Inc.
Charlotte, NC Columbus, OHTampa, FL Kansas City, MO Pittsburgh, PA
Richmond, VA Miami, FLSan Antonio, TX Jacksonville, FL Oklahoma City, OK
Cincinnati, OH Nashville, TNFt. Lauderdale, FL Virginia Beach, VA Cleveland, OH
Sacramento, CA Long Island, NYHartford, CT Omaha, NE Milwaukee, WI
Houston, TX Indianapolis, INOrlando, FL Rochester, NY St. Louis, MO
Source: CBRE Research; CBRE Econometric Advisors; U.S. Bureau of Labor Statistics; Statistics Canada; Moody’s Analytics; The National Center of Education Statistics; National Science Foundation; Axiometrics.

2017 SCORING TECH TALENT | CBRE Research12

13 © 2017 CBRE, Inc.
W H A T A R E T E C H T A L E N T M O M E N T U M M A R K E T S ?
As many companies expand their technology capabilities, demand for tech talent is growing in both large and small markets across all industries. Major gateway markets such as New York, Toronto and the San Francisco Bay Area dominate overall tech talent growth because of their size. These markets, along with others with a tech talent labor pool of more than 50,000 workers, are categorized as “large,” while those below this threshold are categorized as “small.” Both Kansas City and Portland moved up into the large market bracket in 2016. Both large and small markets have their advantages; while large markets tend to have a deeper pool of talent, small markets typically offer savings in business and living costs.
Tech labor concentration—or its percentage of total employment—is an influential factor in how “tech” the market is and its growth potential. Tech talent comprises 10.3% of the San Francisco Bay Area labor force—the highest concentration of the top-50 markets and about three times the national average of tech talent density. Other large tech markets round out the top-five most concentrated tech markets: Seattle, Toronto, Washington, D.C. and Austin have concentrations of highly skilled tech workers ranging from 7.1% to 8.6% of their overall labor force. This
sizeable concentration of highly skilled workers offers an environment conducive to innovation.
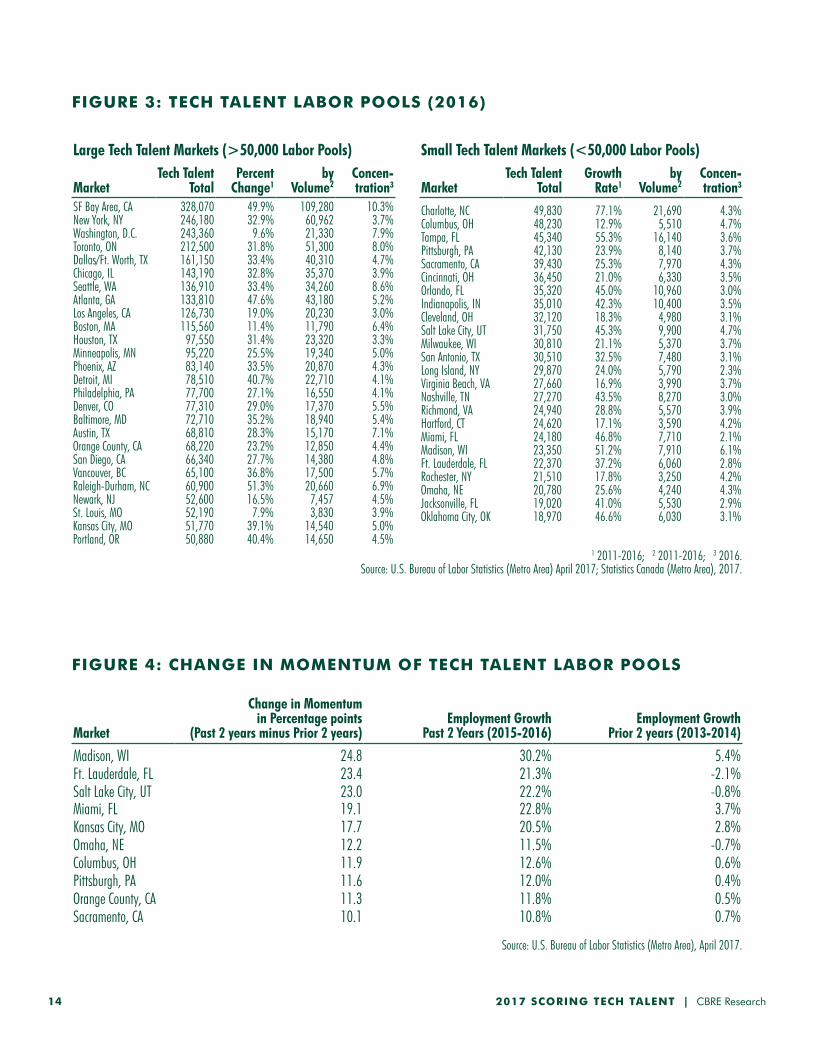
In order to evaluate up-and-coming markets, compare them and determine their growth momentum, we considered ”large” and “small” categories separately. During the past five years, the five fastest-growing large markets increased their tech talent labor pools by more than 40% (Figure 3), with Raleigh-Durham and the San Francisco Bay Area both growing their tech talent base by 50%. Smaller tech talent markets also grew quickly. The top-10 small tech markets increased by more than 40%. Charlotte and Tampa grew at the fastest pace of all 50 markets, increasing by 77% and 55%, respectively.
Job growth momentum has picked up in more than half of the 50 markets. Tech talent grew faster over the past two years (2015-2016) in 28 markets when compared with the prior two-year period (2013-2014). The top-10 markets for momentum grew at least 10% faster during the recent two-year period (Figure 4). Tech employment growth has a multiplier effect that positively impacts economic growth, which in turn can have an immense impact on commercial real estate.
2017 SCORING TECH TALENT | CBRE Research14
FIGURE 3: TECH TALENT LABOR POOLS (2016)
1 2011-2016; 2 2011-2016; 3 2016.Source: U.S. Bureau of Labor Statistics (Metro Area) April 2017; Statistics Canada (Metro Area), 2017.
Large Tech Talent Markets (>50,000 Labor Pools)
MarketTech Talent
TotalPercent
Change1 by
Volume2Concen-tration3
SF Bay Area, CA 328,070 49.9% 109,280 10.3%New York, NY 246,180 32.9% 60,962 3.7%Washington, D.C. 243,360 9.6% 21,330 7.9%Toronto, ON 212,500 31.8% 51,300 8.0%Dallas/Ft. Worth, TX 161,150 33.4% 40,310 4.7%Chicago, IL 143,190 32.8% 35,370 3.9%Seattle, WA 136,910 33.4% 34,260 8.6%Atlanta, GA 133,810 47.6% 43,180 5.2%Los Angeles, CA 126,730 19.0% 20,230 3.0%Boston, MA 115,560 11.4% 11,790 6.4%Houston, TX 97,550 31.4% 23,320 3.3%Minneapolis, MN 95,220 25.5% 19,340 5.0%Phoenix, AZ 83,140 33.5% 20,870 4.3%Detroit, MI 78,510 40.7% 22,710 4.1%Philadelphia, PA 77,700 27.1% 16,550 4.1%Denver, CO 77,310 29.0% 17,370 5.5%Baltimore, MD 72,710 35.2% 18,940 5.4%Austin, TX 68,810 28.3% 15,170 7.1%Orange County, CA 68,220 23.2% 12,850 4.4%San Diego, CA 66,340 27.7% 14,380 4.8%Vancouver, BC 65,100 36.8% 17,500 5.7%Raleigh-Durham, NC 60,900 51.3% 20,660 6.9%Newark, NJ 52,600 16.5% 7,457 4.5%St. Louis, MO 52,190 7.9% 3,830 3.9%Kansas City, MO 51,770 39.1% 14,540 5.0%Portland, OR 50,880 40.4% 14,650 4.5%
Small Tech Talent Markets (<50,000 Labor Pools)
MarketTech Talent
TotalGrowth
Rate1 by
Volume2Concen-tration3
Charlotte, NC 49,830 77.1% 21,690 4.3%Columbus, OH 48,230 12.9% 5,510 4.7%Tampa, FL 45,340 55.3% 16,140 3.6%Pittsburgh, PA 42,130 23.9% 8,140 3.7%Sacramento, CA 39,430 25.3% 7,970 4.3%Cincinnati, OH 36,450 21.0% 6,330 3.5%Orlando, FL 35,320 45.0% 10,960 3.0%Indianapolis, IN 35,010 42.3% 10,400 3.5%Cleveland, OH 32,120 18.3% 4,980 3.1%Salt Lake City, UT 31,750 45.3% 9,900 4.7%Milwaukee, WI 30,810 21.1% 5,370 3.7%San Antonio, TX 30,510 32.5% 7,480 3.1%Long Island, NY 29,870 24.0% 5,790 2.3%Virginia Beach, VA 27,660 16.9% 3,990 3.7%Nashville, TN 27,270 43.5% 8,270 3.0%Richmond, VA 24,940 28.8% 5,570 3.9%Hartford, CT 24,620 17.1% 3,590 4.2%Miami, FL 24,180 46.8% 7,710 2.1%Madison, WI 23,350 51.2% 7,910 6.1%Ft. Lauderdale, FL 22,370 37.2% 6,060 2.8%Rochester, NY 21,510 17.8% 3,250 4.2%Omaha, NE 20,780 25.6% 4,240 4.3%Jacksonville, FL 19,020 41.0% 5,530 2.9%Oklahoma City, OK 18,970 46.6% 6,030 3.1%
FIGURE 4: CHANGE IN MOMENTUM OF TECH TALENT LABOR POOLS
Source: U.S. Bureau of Labor Statistics (Metro Area), April 2017.
Market
Change in Momentum in Percentage points
(Past 2 years minus Prior 2 years)Employment Growth
Past 2 Years (2015-2016)Employment Growth
Prior 2 years (2013-2014)
Madison, WI 24.8 30.2% 5.4%Ft. Lauderdale, FL 23.4 21.3% -2.1%Salt Lake City, UT 23.0 22.2% -0.8%Miami, FL 19.1 22.8% 3.7%Kansas City, MO 17.7 20.5% 2.8%Omaha, NE 12.2 11.5% -0.7%Columbus, OH 11.9 12.6% 0.6%Pittsburgh, PA 11.6 12.0% 0.4%Orange County, CA 11.3 11.8% 0.5%Sacramento, CA 10.1 10.8% 0.7%

15 © 2017 CBRE, Inc.

16 2017 SCORING TECH TALENT | CBRE Research
W H A T D E F I N E S A T E C H T A L E N T M A R K E T ?
A key aspect that top tech talent markets share is high educational attainment. Two-thirds of the top-50 tech talent markets have an educational attainment rate above the U.S. average. In Seattle and Washington, D.C., 55% or more of residents over 25 years old hold a bachelor’s degree or higher (Figure 5). In Atlanta, the San Francisco Bay Area, Minneapolis and Raleigh-Durham, the educational attainment rate is above 48%.
Education, particularly with a focus on technology,2 is best analyzed through degrees completed and issued from higher educational institutions. Metro areas that produced the largest number of tech graduates using the latest data available were New York, Washington, D.C., Los Angeles and Chicago (Figure 6). Large tech talent markets dominate the top-10 degree-granting regions, with the smaller markets of Pittsburgh, Salt Lake City and Minneapolis/St. Paul just missing the list. Demand is high for tech-related classes and degrees, and tech-related degree completions grew by an average of 33% in the top-10 markets since 2011. These numbers provide insight into which markets will produce the highest amount of tech talent entering the labor pool each year.
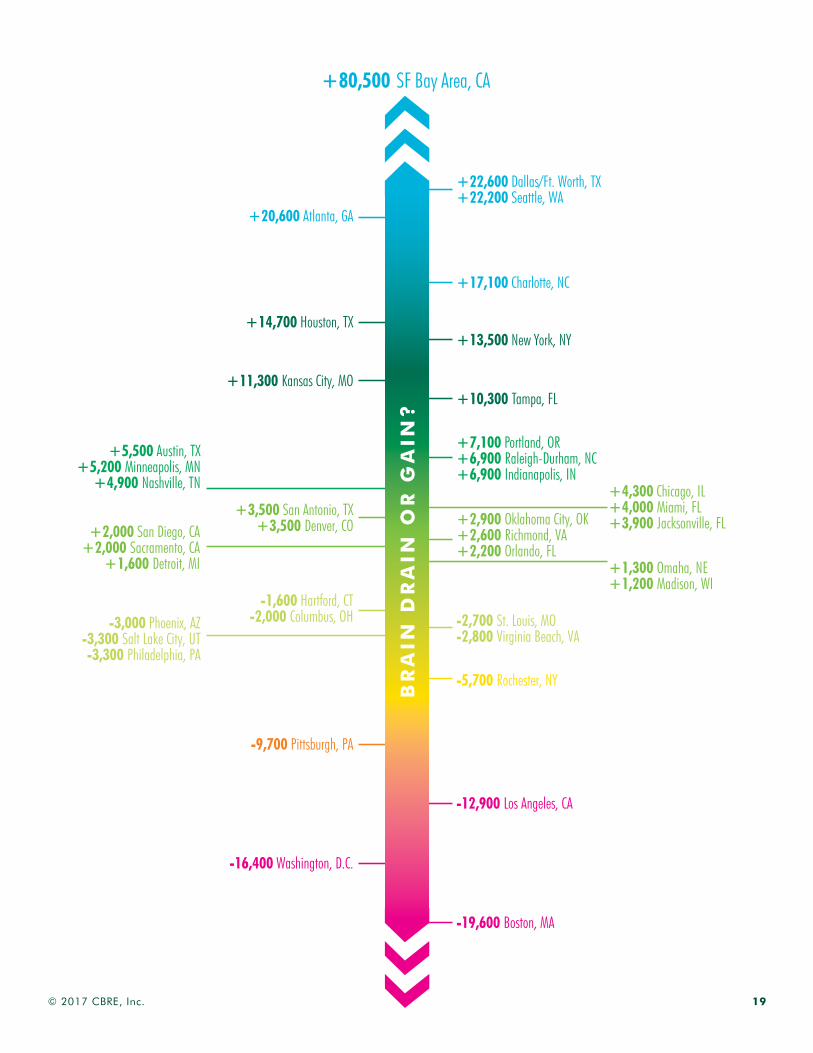
Graduates do not always remain in the labor market where they earn their degrees; they often migrate to locations that offer the best pay or have the most job opportunities. Analyzing tech-related graduation data and tech-related employment growth, Figure 7 presents the difference between where tech talent workers are employed and where they were educated. Tech degrees cover the most recent five-year period available (2011-2015) and tech jobs added cover the time period when most graduates would be counted in employment figures (2012-2016). The San Francisco Bay Area stands out as a strong tech-job creator, adding nearly 80,500 more tech jobs than graduates. On the other end of the spectrum, Los Angeles, Washington, D.C. and Boston produce the most tech graduates but post a deep deficit when it comes to employing them locally.
2Tech degree fields include computer engineering and information sciences; mathematics and statistics; electrical and electronics engineering; mechanical and industrial engineering; other engineering.

17 © 2017 CBRE, Inc.

2017 SCORING TECH TALENT | CBRE Research18
FIGURE 7: WHERE ARE TALENT WORKERS COMING FROM AND WHERE ARE THEY HEADED?
MarketTech Degrees (2011-2015)*
Tech Jobs Added
(2012-2016)*Brain Gain
or Drain?SF Bay Area, CA 28,804 109,280 80,476Dallas/Ft. Worth, TX 17,750 40,310 22,560Seattle, WA 12,043 34,260 22,217Atlanta, GA 22,634 43,180 20,546Charlotte, NC 4,639 21,690 17,051Houston, TX 8,578 23,320 14,742New York, NY 60,678 74,209 13,531Kansas City, MO 3,192 14,540 11,348Tampa, FL 5,808 16,140 10,332Portland, OR 7,563 14,650 7,087Raleigh-Durham, NC 13,738 20,660 6,922Indianapolis, IN 3,514 10,400 6,886Austin, TX 9,660 15,170 5,510Minneapolis, MN 14,138 19,340 5,202Nashville, TN 3,337 8,270 4,933Chicago, IL 36,459 40,740 4,281Miami, FL 9,817 13,770 3,953Jacksonville, FL 1,612 5,530 3,918San Antonio, TX 4,005 7,480 3,475Denver, CO 13,918 17,370 3,452Oklahoma City, OK 3,170 6,030 2,860Richmond, VA 2,964 5,570 2,606Orlando, FL 8,806 10,960 2,154San Diego, CA 12,382 14,380 1,998Sacramento, CA 5,977 7,970 1,993Detroit, MI 21,155 22,710 1,555Omaha, NE 2,916 4,240 1,324Madison, WI 6,695 7,910 1,215
MarketTech Degrees (2011-2015)*
Tech Jobs Added
(2012-2016)*Brain Gain
or Drain?Hartford, CT 5,150 3,590 -1,560Columbus, OH 18,898 16,820 -2,078St. Louis, MO 6,485 3,830 -2,655Virginia Beach, VA 6,828 3,990 -2,838Phoenix, AZ 23,969 20,870 -3,099Salt Lake City, UT 13,155 9,900 -3,255Philadelphia, PA 19,891 16,550 -3,341Rochester, NY 8,953 3,250 -5,703Pittsburgh, PA 17,795 8,140 -9,655Los Angeles, CA 45,968 33,080 -12,888Washington, D.C. 56,623 40,270 -16,353Boston, MA 31,400 11,790 -19,610
Source: CBRE Research, U.S. Bureau of Labor Statistics, The National Center for Education Statistics (Region).
Los Angeles Metro Area includes Orange CountyNew York Metro Area includes Newark and Long Island
Miami Metro Area includes Ft. LauderdaleColumbus Metro Area include Columbus, Cleveland and Cincinnati
Bay Area Metro Area includes San Francisco, Oakland and Silicon ValleyChicago Metro Area includes Chicago and Milwaukee
Washington D.C. Metro Area includes Baltimore *Tech degrees cover the most recent five-year period available (2011-2015) and tech jobs added cover the time period reflecting when most graduates would be counted in
employment figures (2012-2016).
FIGURE 5: TOP 10 MARKETS FOR EDUCATIONAL ATTAINMENT25+ Years Old, Bachelor’s Degree or Higher
Source: U.S. Census Bureau (City/County), 2016.
Market Educational Attainment Rate
Seattle, WAWashington, D.C.Madison, WIPortland, ORRaleigh-Durham, NCAtlanta, GAAustin, TXMinneapolis, MNDenver, COSF Bay Area, CA
62.1%56.7%
55.0%48.6%48.4%48.3%48.3%48.3%47.1%46.7%
Market
Tech DegreeCompletions
(2015)Growth
(2011-2015)
New York Metro Area1 14,419 37.8%Washington, D.C. Metro Area2 13,058 40.9%Los Angeles Metro Area3 10,632 26.7%Chicago Metro Area4 7,866 15.6%Boston Metro Area 7,507 40.5%SF Bay Area Metro Area5 6,503 27.0%Atlanta Metro Area 5,120 30.2%Phoenix Metro Area 4,744 18.9%Philadelphia Metro Area 4,655 33.8%Dallas/Ft. Worth Metro Area 4,614 60.7%
FIGURE 6: TOP 10 REGIONS FOR TECH DEGREE COMPLETIONS
1 Includes Long Island and Newark;2 Includes Baltimore;
3 Includes Orange County;4 Includes Milwaukee;
5 Includes Silicon Valley, San Francisco, SF Peninsula and Oakland;Source: The National Center for Education Statistics (Region), July 2016.
19 © 2017 CBRE, Inc.
+80,500 SF Bay Area, CA
+22,600 Dallas/Ft. Worth, TX+22,200 Seattle, WA
+7,100 Portland, OR+6,900 Raleigh-Durham, NC+6,900 Indianapolis, IN
+4,300 Chicago, IL+4,000 Miami, FL+3,900 Jacksonville, FL+2,900 Oklahoma City, OK
+2,600 Richmond, VA+2,200 Orlando, FL
+1,300 Omaha, NE+1,200 Madison, WI
-2,700 St. Louis, MO-2,800 Virginia Beach, VA
-5,700 Rochester, NY
-12,900 Los Angeles, CA
-19,600 Boston, MA
+5,500 Austin, TX+5,200 Minneapolis, MN
+4,900 Nashville, TN
+2,000 San Diego, CA+2,000 Sacramento, CA
+1,600 Detroit, MI
-1,600 Hartford, CT-2,000 Columbus, OH-3,000 Phoenix, AZ
-3,300 Salt Lake City, UT-3,300 Philadelphia, PA
-9,700 Pittsburgh, PA
-16,400 Washington, D.C.
+3,500 San Antonio, TX+3,500 Denver, CO
+20,600 Atlanta, GA
+14,700 Houston, TX
+11,300 Kansas City, MO
+17,100 Charlotte, NC
+13,500 New York, NY
+10,300 Tampa, FLB
RA
IN D
RA
IN O
R G
AIN
?

20 2017 SCORING TECH TALENT | CBRE Research
Another notable characteristic of tech talent markets is the presence of millennials3 in the workforce. Having grown up with technology, the younger half of this generation only knows of a world connected by the internet. Millennials generally prefer living in cities rather than suburbs, which has helped revitalize some downtown neighborhoods. This trend is best analyzed using data at the city level. As the largest demographic cohort, their robust entry into and maturity within the labor pool contributes greatly to the growth of tech talent across all 50 markets (Figure 8).
Six large tech markets increased their millennial populations by more than 9% since 2010. Seattle grew the fastest at 16.6%. During the same time period, six of the smaller tech markets increased their
millennial populations by more than 9%, with Pittsburgh and Hartford growing significantly faster than the rest. Aided by the presence of higher educational institutions, Madison, Pittsburgh and Boston rank highest for concentration of millennials as a portion of the urban population, accounting for nearly 25% or more (Figure 9).
Similar traits between markets cause many of them to appear equivalent, but top tech markets distinguish themselves from the rest with tech clusters and higher concentrations of talent. These clusters typically form around preeminent universities where companies have access to a constant flow of new talent. Stanford University is an essential catalyst for tech clustering in the San Francisco Bay Area, as is Georgia Tech for Atlanta.
3Analysis conducted in this report, includes millennials aged 20-29 years.

21 © 2017 CBRE, Inc.
Tech clusters can also form around leading companies that draw other, smaller organizations to its region, in turn supporting entrepreneurs as they develop their innovations. Examples of this can be found in Seattle with large tech firms and in Charlotte with large financial services firms. Tech companies use these clusters to collaborate and compete with each other, thereby accelerating the innovation process. These companies in the core high-tech industry are heavily concentrated with about half of their workers doing tech-related jobs (Figure 10). Consequently, tech clusters are likely to form in markets with a strong concentration of high-tech companies.

2017 SCORING TECH TALENT | CBRE Research22
FIGURE 8: MILLENNIAL POPULATION CHANGE BY MARKET* (2010-2015)
*Millennial aged 20-29 years living in downtown areas.Source: U.S. Census Bureau (City/County), Statistics Canada, 2016.
Small Tech Talent Markets (<50,000 Labor Pools)
Market % ChangePittsburgh, PAHartford, CTSan Antonio, TXCleveland, OHCharlotte, NCOrlando, FLLong Island, NYSalt Lake City, UTSacramento, CAMadison, WIMiami, FLNashville, TNColumbus, OHTampa, FLVirginia Beach, VAJacksonville, FLIndianapolis, INRichmond, VARochester, NYOmaha, NEFt. Lauderdale, FLOklahoma City, OKMilwaukee, WICincinnati, OH
17.7% 17.7%
15.6% 13.7% 13.3%
12.3% 8.7% 8.4%
7.5% 7.3% 7.0% 6.8% 6.4% 6.3% 5.5%
4.1% 3.6%
1.3%0.7%
-12.7% -1.9% -1.3% -0.5% -0.2%
Below U.S. Average (4.6%)
Large Tech Talent Markets (>50,000 Labor Pools)
Market % ChangeSeattle, WARaleigh-Durham, NCToronto, ONSF Bay Area, CAAtlanta, GADetroit, MIHouston, TXPhoenix, AZDenver, COLos Angeles, CAWashington, D.C.Orange County, CAAustin, TXVancouver, BCDallas/Ft. Worth, TXNew York, NYSan Diego, CAPhiladelphia, PABoston, MANewark, NJBaltimore, MDChicago, ILMinneapolis, MNSt. Louis, MOPortland, ORKansas City, MO
16.6% 11.2%
9.5% 9.5%
9.3% 9.2%
8.5% 7.1% 7.0%
6.4% 5.9% 5.7% 5.5% 5.3%
3.8% 2.6%
1.1% 0.9% 0.8% 0.5%
1.2% 0.5%
-1.4% -2.2%
-5.3%
-0.9%
Below U.S. Average (4.6%)
FIGURE 9: TOP 10 MOST CONCENTRATED MILLENNIAL MARKETS* (2015)
* Millennial aged 20-29 Years living in downtown areas.Source: U.S. Census Bureau (City/County), 2016.
Market Population Concentration of Millennial
Madison, WIPittsburgh, PABoston, MARichmond, VASalt Lake City, UTHartford, CTMinneapolis, MNOrlando, FLSeattle, WAColumbus, OH
26.5% 25.3%
24.6%21.8%21.8%21.8%21.7%
21.6%20.4%20.3%
U.S. Average (14.2%)

23 © 2017 CBRE, Inc.
FIGURE 10: TECH TALENT LABOR CONCENTRATION BY INDUSTRY (2016)Tech Talent Occupations as a % of All Occupations in Each Industry
Core High-Tech*
49.8%
Management of Companies and Enterprises
12.8% 7.7%
Professional, Scientific and Technical Services (Excluding High-Tech)
14.0%
Information (Excluding High-Tech)
5.0%
FIRE
3.5%
Total U.S. Employment
3.1%
Government
2.2%
Transportation, Warehousing, and
Wholesale
2.0%
Manufacturing (Excluding High-Tech)
1.8%
Education
0.8%
Other
0.7%
Healthcare
*Includes computer software and services and computer product manufacturing.Source: U.S. Bureau of Labor Statistics (National), April 2017.

2017 SCORING TECH TALENT | CBRE Research24

25 © 2017 CBRE, Inc.
W H I C H A R E T H E H I G H E S T- A N D L O W E S T- C O S T M A R K E T S T O O P E R A T E I N ?
The greatest cost for companies within tech talent markets is employee wages. These highly skilled and educated workers require a premium that can reach more than double the average non-tech salary. The San Francisco Bay Area ranked the highest for average tech talent worker salary at almost $123,000 per year, more than $9,000 above the next highest market—Seattle. The average tech worker wage in 19 of the 50 top tech talent markets was above the U.S. tech worker average.
The second highest cost for companies is office rent. Companies continue to pursue the benefits of tech clustering and often place a higher value on specific submarkets and even specific streets where tech talent is ample. This has led to some competition for office space and caused rental rates in these areas to increase. Average office rents are the highest in Manhattan, followed by the San Francisco Bay Area and Washington, D.C. Among the top-10 most expensive office markets, Miami and Ft. Lauderdale are the only small tech markets with an average asking rate above $30 per sq. ft.
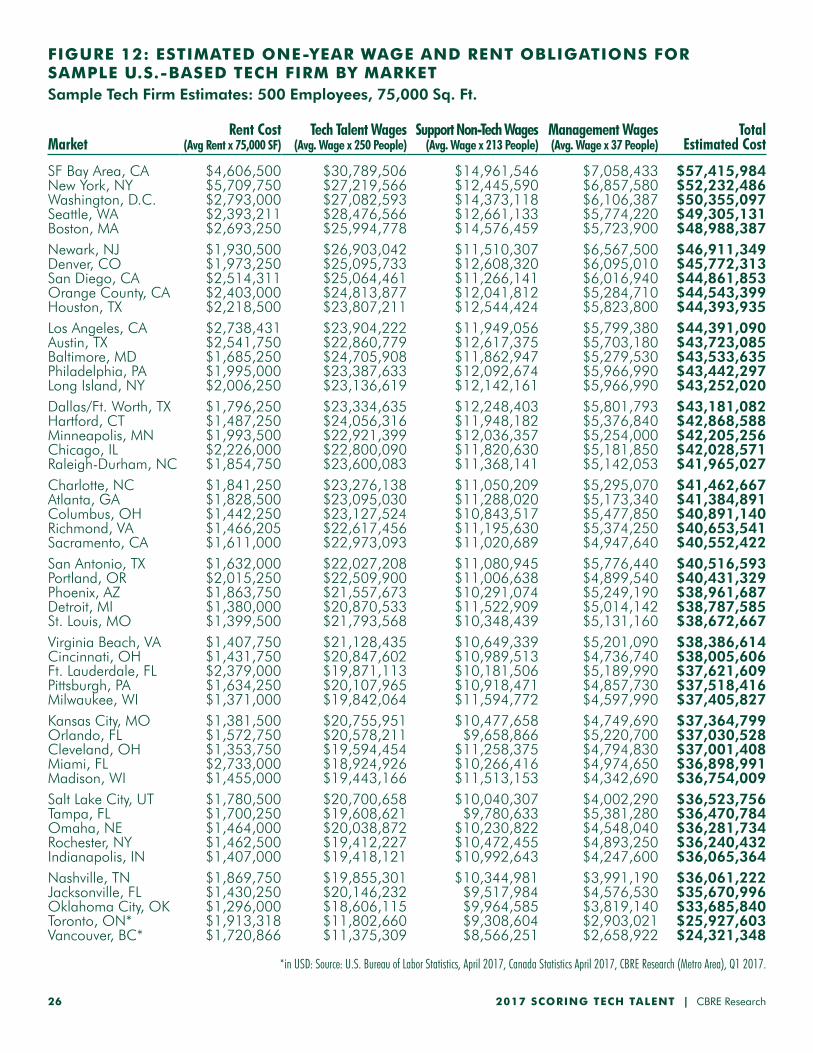
Combining wage and real estate costs provides insight into what a tech company might pay to operate in one or more of the top-50 tech talent markets. For this comparison, U.S. averages were analyzed to determine the occupational makeup of a typical 500-person U.S.-based tech company needing 75,000 sq. ft. of office space. This breakdown provides interesting insight into relative costs, market-by-market (Figure 12).
Local market wages were applied to the various occupations to determine total annual wage costs by market, and local market rents were used to estimate the annual cost of renting a 75,000 sq. ft. office to house the 500 employees. The San Francisco Bay Area topped the list with the highest estimated costs at more than $57.4 million, followed distantly by the other major tech markets of New York, Washington, D.C., Seattle and Boston. These high-cost markets continue to attract employers seeking to push the boundaries of innovation, as well as the tech talent that makes it possible.
FIGURE 11: AVERAGE U.S. TECH COMPANY OCCUPATION POOLS
Typical 500 Person
Tech CompanyTech Talent Employees*
250 (50%)
Support Non-Tech Employees (excluding Management) 213 (42%)
Management 37 (8%)
Source: U.S. Bureau of Labor Statistics (National), April 2017. *Tech Talent includes the following occupation categories: software developers and programmers; computer support, database and systems; technology and engineering related;
and computer information system managers.
2017 SCORING TECH TALENT | CBRE Research26
FIGURE 12: ESTIMATED ONE-YEAR WAGE AND RENT OBLIGATIONS FOR SAMPLE U.S.-BASED TECH FIRM BY MARKETSample Tech Firm Estimates: 500 Employees, 75,000 Sq. Ft.
MarketRent Cost
(Avg Rent x 75,000 SF)Tech Talent Wages
(Avg. Wage x 250 People)Support Non-Tech Wages
(Avg. Wage x 213 People)Management Wages(Avg. Wage x 37 People)
Total Estimated Cost
SF Bay Area, CA $4,606,500 $30,789,506 $14,961,546 $7,058,433 $57,415,984New York, NY $5,709,750 $27,219,566 $12,445,590 $6,857,580 $52,232,486Washington, D.C. $2,793,000 $27,082,593 $14,373,118 $6,106,387 $50,355,097Seattle, WA $2,393,211 $28,476,566 $12,661,133 $5,774,220 $49,305,131Boston, MA $2,693,250 $25,994,778 $14,576,459 $5,723,900 $48,988,387Newark, NJ $1,930,500 $26,903,042 $11,510,307 $6,567,500 $46,911,349Denver, CO $1,973,250 $25,095,733 $12,608,320 $6,095,010 $45,772,313San Diego, CA $2,514,311 $25,064,461 $11,266,141 $6,016,940 $44,861,853Orange County, CA $2,403,000 $24,813,877 $12,041,812 $5,284,710 $44,543,399Houston, TX $2,218,500 $23,807,211 $12,544,424 $5,823,800 $44,393,935Los Angeles, CA $2,738,431 $23,904,222 $11,949,056 $5,799,380 $44,391,090Austin, TX $2,541,750 $22,860,779 $12,617,375 $5,703,180 $43,723,085Baltimore, MD $1,685,250 $24,705,908 $11,862,947 $5,279,530 $43,533,635Philadelphia, PA $1,995,000 $23,387,633 $12,092,674 $5,966,990 $43,442,297Long Island, NY $2,006,250 $23,136,619 $12,142,161 $5,966,990 $43,252,020Dallas/Ft. Worth, TX $1,796,250 $23,334,635 $12,248,403 $5,801,793 $43,181,082Hartford, CT $1,487,250 $24,056,316 $11,948,182 $5,376,840 $42,868,588Minneapolis, MN $1,993,500 $22,921,399 $12,036,357 $5,254,000 $42,205,256Chicago, IL $2,226,000 $22,800,090 $11,820,630 $5,181,850 $42,028,571Raleigh-Durham, NC $1,854,750 $23,600,083 $11,368,141 $5,142,053 $41,965,027Charlotte, NC $1,841,250 $23,276,138 $11,050,209 $5,295,070 $41,462,667Atlanta, GA $1,828,500 $23,095,030 $11,288,020 $5,173,340 $41,384,891Columbus, OH $1,442,250 $23,127,524 $10,843,517 $5,477,850 $40,891,140Richmond, VA $1,466,205 $22,617,456 $11,195,630 $5,374,250 $40,653,541Sacramento, CA $1,611,000 $22,973,093 $11,020,689 $4,947,640 $40,552,422San Antonio, TX $1,632,000 $22,027,208 $11,080,945 $5,776,440 $40,516,593Portland, OR $2,015,250 $22,509,900 $11,006,638 $4,899,540 $40,431,329Phoenix, AZ $1,863,750 $21,557,673 $10,291,074 $5,249,190 $38,961,687Detroit, MI $1,380,000 $20,870,533 $11,522,909 $5,014,142 $38,787,585St. Louis, MO $1,399,500 $21,793,568 $10,348,439 $5,131,160 $38,672,667Virginia Beach, VA $1,407,750 $21,128,435 $10,649,339 $5,201,090 $38,386,614Cincinnati, OH $1,431,750 $20,847,602 $10,989,513 $4,736,740 $38,005,606Ft. Lauderdale, FL $2,379,000 $19,871,113 $10,181,506 $5,189,990 $37,621,609Pittsburgh, PA $1,634,250 $20,107,965 $10,918,471 $4,857,730 $37,518,416Milwaukee, WI $1,371,000 $19,842,064 $11,594,772 $4,597,990 $37,405,827Kansas City, MO $1,381,500 $20,755,951 $10,477,658 $4,749,690 $37,364,799Orlando, FL $1,572,750 $20,578,211 $9,658,866 $5,220,700 $37,030,528Cleveland, OH $1,353,750 $19,594,454 $11,258,375 $4,794,830 $37,001,408Miami, FL $2,733,000 $18,924,926 $10,266,416 $4,974,650 $36,898,991Madison, WI $1,455,000 $19,443,166 $11,513,153 $4,342,690 $36,754,009Salt Lake City, UT $1,780,500 $20,700,658 $10,040,307 $4,002,290 $36,523,756Tampa, FL $1,700,250 $19,608,621 $9,780,633 $5,381,280 $36,470,784Omaha, NE $1,464,000 $20,038,872 $10,230,822 $4,548,040 $36,281,734Rochester, NY $1,462,500 $19,412,227 $10,472,455 $4,893,250 $36,240,432Indianapolis, IN $1,407,000 $19,418,121 $10,992,643 $4,247,600 $36,065,364Nashville, TN $1,869,750 $19,855,301 $10,344,981 $3,991,190 $36,061,222Jacksonville, FL $1,430,250 $20,146,232 $9,517,984 $4,576,530 $35,670,996Oklahoma City, OK $1,296,000 $18,606,115 $9,964,585 $3,819,140 $33,685,840Toronto, ON* $1,913,318 $11,802,660 $9,308,604 $2,903,021 $25,927,603Vancouver, BC* $1,720,866 $11,375,309 $8,566,251 $2,658,922 $24,321,348
*in USD: Source: U.S. Bureau of Labor Statistics, April 2017, Canada Statistics April 2017, CBRE Research (Metro Area), Q1 2017.

27 © 2017 CBRE, Inc.
28 2017 SCORING TECH TALENT | CBRE Research
H O W I S T E C H T A L E N T Q U A L I T Y V S . C O S T M E A S U R E D ?
Assessing the quality of a labor market is challenging because there are no standard metrics to measure. Since the cost of talent is the largest expense category for most firms seeking tech talent, the quality of that tech talent is becoming one of their most important considerations. The skills of the available labor pool do not appear to align with available jobs, causing a structural barrier to growth for companies across North America. Jobs that require specific skills, such as software development, are in high demand and the pool of available talent to fill them is limited. Only 37% of all tech talent workers are employed in the high-tech software/services industry (Figure 1), meaning tech companies must compete with other industries that employ the remaining 63% of tech workers. In addition, the unemployment rate for college-educated workers is around 2.3%, further stiffening competition.
Figure 13 plots a quality assessment for software developers against their average salary by market to visualize this trade-off across the top-50 tech talent markets. Labor quality was measured by the number and concentration of software engineers with three or more years of experience and who have graduated from one of the top 25 computer science programs in the U.S. and Canada, as determined by U.S. News & World Report. The highest cost markets (San Francisco Bay Area and Seattle) also have the highest concentration of quality tech talent. However, good, high and very high concentrations of quality tech talent are available in moderate and low-cost markets, providing a range of options. Due in part to the strong U.S. dollar, Toronto and Vancouver provide the best value when it comes to cost and quality, followed by Indianapolis, Pittsburgh and Detroit.

29 © 2017 CBRE, Inc.
FIGURE 13: TECH TALENT QUALITY VS. COST ANALYSISAverage Annual Salary for Software Engineer (USD)
$135,000
Labor Cost
Labor Quality*
$95,000
$115,000
$75,000
$125,000
$85,000
$105,000
$65,000
$55,000
LOW
MO
DE
RA
TE
HIG
H
GOOD HIGH VERY HIGH EXCEPTIONAL
*Concentration of software engineers/developers with 3+ years of experience that have earned degrees from the Top 25 Computer Information Science programs in the U.S. and Canada as rated by U.S. News, 2017.
Source: U.S. Bureau of Labor Statistics, April 2017; Statistics Canada, April 2017; U.S. News & World Report, CBRE Labor Analytics, CBRE Research, 2017.
Oklahoma City
Milwaukee
VirginiaBeachRichmond
HartfordJacksonville
Nashville
Cincinnati
Cleveland
Tampa
RochesterOmaha
ColumbusSan Antonio
Charlotte
Madison Miami
St. LouisMinneapolis
Salt Lake City
Orlando
Ft. Lauderdale
Phoenix
Sacramento
VancouverToronto
Indianapolis
PittsburghDetroit
Philadelphia
PortlandChicago
Raleigh-Durham
Houston
DallasBaltimore
Atlanta
San Diego
Washington, D.C.
Denver NY/NJBoston
LA/OC
Austin
San Francisco Bay Area
Seattle
Kansas City

2017 SCORING TECH TALENT | CBRE Research30

31 © 2017 CBRE, Inc.
H O W D O E S T E C H T A L E N T I M PA C T C O M M E R C I A L R E A L E S T A T E ?
Tech talent growth, primarily within the high-tech industry, has reached more than 1 million employees in the past five years and has been the top driver of office leasing activity in the U.S. during that time. The high-tech industry’s share of major leasing activity4 nationwide increased to 19% in 2017 from 11% in 2011—the largest single share of any industry. Many tech talent markets, especially those with high concentrations or clusters of tech companies, have seen rising rents and declining vacancies as a result.
Significant demand for office space in top markets that have added tens of thousands of workers during the past five years raised rents to their highest levels and pushed down vacancy rates to their lowest levels. Rent growth is most prominent in the large tech markets, with office rents in the San Francisco Bay Area more than double what they were five years ago. But the decrease in vacancy rates is present across both large and small tech markets. Vacancy rates in
the San Francisco Bay Area and New York are the lowest of the top-50 tech talent markets, and some small markets like Madison and Nashville are not far behind (Figure 14).
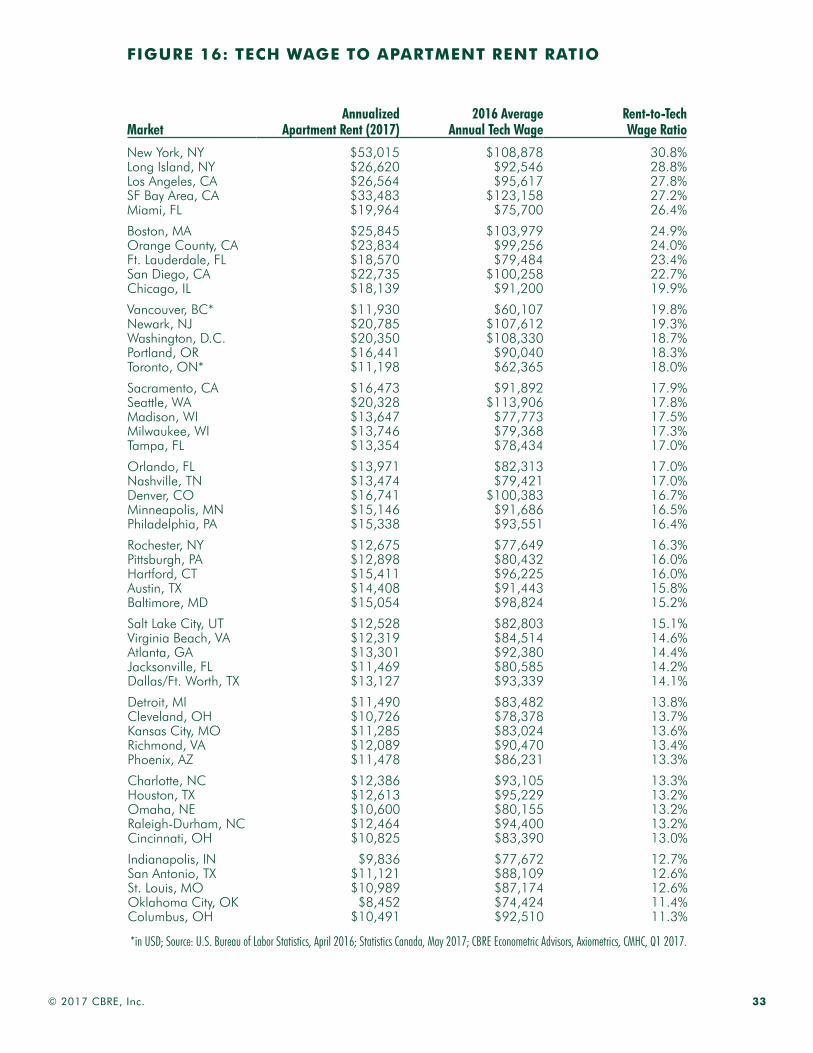
The in-migration of talent to these tech markets has a sizeable impact on residential real estate as well. Although Manhattan remains the most expensive market in which to rent an apartment, 30 of the top-50 tech talent markets have a cost of living above the U.S. national average (Figure 15), according to Moody’s Analytics. Comparing the annual average apartment rent with the annual average tech-worker salary, we found that even among the most expensive markets tech salaries can cover the high cost of living (Figure 16) based on the affordability standard of 30% of income to housing. Considering the underlying fundamentals of tech talent markets, we conclude that both occupiers and investors can pursue profitable real estate strategies.
4Includes top-25 largest transactions by sq. ft. each quarter for the 54 markets tracked by CBRE Research.

2017 SCORING TECH TALENT | CBRE Research32
FIGURE 14: OFFICE ASKING RENT BY MARKET (Q1 2017)
FIGURE 15: APARTMENT ASKING RENT BY MARKET (Q1 2017)
MarketAnnual Gross Direct
Asking Rent Per SFVacancy
Rate
New York, NY $76.13 7.7%SF Bay Area, CA $61.42 7.7%Washington, D.C. $37.24 16.5%Los Angeles, CA $36.51 14.3%Miami, FL $36.44 10.9%Boston, MA $35.91 13.7%Austin, TX $33.89 9.5%San Diego, CA $33.52 11.5%Orange County, CA $32.04 9.3%Seattle, WA $31.91 11.7%Ft. Lauderdale, FL $31.72 12.9%Vancouver, BC* $30.31 10.1%Chicago, IL $29.68 15.0%Houston, TX $29.58 16.8%Portland, OR $26.87 11.2%Long Island, NY $26.75 10.4%Philadelphia, PA $26.60 14.1%Minneapolis, MN $26.58 16.7%Denver, CO $26.31 14.2%Newark, NJ $25.74 16.6%Toronto, ON* $25.51 9.0%Nashville, TN $24.93 8.1%Phoenix, AZ $24.85 17.3%Raleigh-Durham, NC $24.73 14.0%Charlotte, NC $24.55 8.1%Atlanta, GA $24.38 16.9%Dallas/Ft. Worth, TX $23.95 19.1%Salt Lake City, UT $23.74 11.6%Tampa, FL $22.67 11.2%Baltimore, MD $22.47 14.0%Pittsburgh, PA $21.79 11.9%San Antonio, TX $21.76 14.6%Sacramento, CA $21.48 14.5%Orlando, FL $20.97 10.4%Hartford, CT $19.83 16.0%Richmond, VA $19.55 11.8%Omaha, NE $19.52 11.2%Rochester, NY $19.50 14.8%Madison, WI $19.40 8.0%Columbus, OH $19.23 12.3%Cincinnati, OH $19.09 18.8%Jacksonville, FL $19.07 15.9%Virginia Beach, VA $18.77 15.6%Indianapolis, IN $18.76 16.4%St. Louis, MO $18.66 14.2%Kansas City, MO $18.42 12.8%Detroit, MI $18.40 16.7%Milwaukee, WI $18.28 13.0%Cleveland, OH $18.05 18.4%Oklahoma City, OK $17.28 15.1%
MarketAverage Monthly
Apartment RentCost of Living
(U.S. = 100%)
New York, NY $4,418 125%SF Bay Area, CA $2,790 151%Long Island, NY $2,218 125%Los Angeles, CA $2,214 123%Boston, MA $2,154 119%
Orange County, CA $1,986 145%San Diego, CA $1,895 126%Newark, NJ $1,732 122%Washington, D.C. $1,696 122%Seattle, WA $1,694 123%
Miami, FL $1,664 113%Ft. Lauderdale, FL $1,548 111%Chicago, IL $1,512 98%Denver, CO $1,395 109%Sacramento, CA $1,373 106%
Portland, OR $1,370 108%Hartford, CT $1,284 106%Philadelphia, PA $1,278 99%Minneapolis, MN $1,262 101%Baltimore, MD $1,255 107%
Austin, TX $1,201 112%Orlando, FL $1,164 103%Milwaukee, WI $1,145 98%Madison, WI $1,137 101%Nashville, TN $1,123 102%
Tampa, FL $1,113 100%Atlanta, GA $1,108 101%Dallas/Ft. Worth, TX $1,094 105%Pittsburgh, PA $1,075 93%Rochester, NY $1,056 89%
Houston, TX $1,051 108%Salt Lake City, UT $1,044 106%Raleigh-Durham, NC $1,039 99%Charlotte, NC $1,032 99%Virginia Beach, VA $1,027 98%
Richmond, VA $1,007 99%Vancouver, BC* $994 97%Detroit, MI $958 92%Phoenix, AZ $956 105%Jacksonville, FL $956 101%
Kansas City, MO $940 96%Toronto, ON* $933 91%San Antonio, TX $927 102%St. Louis, MO $916 94%Cincinnati, OH $902 91%
Cleveland, OH $894 90%Omaha, NE $883 93%Columbus, OH $874 95%Indianapolis, IN $820 92%Oklahoma City, OK $704 97%
*in USD; Source: CBRE Research (Office Market), Q1 2017. *in USD; Source: CBRE Econometric Advisors (City), Axiometrics, CMHC, Q1 2017.Note: New York represents Manhattan only.
33 © 2017 CBRE, Inc.
FIGURE 16: TECH WAGE TO APARTMENT RENT RATIO
*in USD; Source: U.S. Bureau of Labor Statistics, April 2016; Statistics Canada, May 2017; CBRE Econometric Advisors, Axiometrics, CMHC, Q1 2017.
MarketAnnualized
Apartment Rent (2017)2016 Average
Annual Tech WageRent-to-Tech Wage Ratio
New York, NY $53,015 $108,878 30.8%Long Island, NY $26,620 $92,546 28.8%Los Angeles, CA $26,564 $95,617 27.8%SF Bay Area, CA $33,483 $123,158 27.2%Miami, FL $19,964 $75,700 26.4%
Boston, MA $25,845 $103,979 24.9%Orange County, CA $23,834 $99,256 24.0%Ft. Lauderdale, FL $18,570 $79,484 23.4%San Diego, CA $22,735 $100,258 22.7%Chicago, IL $18,139 $91,200 19.9%
Vancouver, BC* $11,930 $60,107 19.8%Newark, NJ $20,785 $107,612 19.3%Washington, D.C. $20,350 $108,330 18.7%Portland, OR $16,441 $90,040 18.3%Toronto, ON* $11,198 $62,365 18.0%
Sacramento, CA $16,473 $91,892 17.9%Seattle, WA $20,328 $113,906 17.8%Madison, WI $13,647 $77,773 17.5%Milwaukee, WI $13,746 $79,368 17.3%Tampa, FL $13,354 $78,434 17.0%
Orlando, FL $13,971 $82,313 17.0%Nashville, TN $13,474 $79,421 17.0%Denver, CO $16,741 $100,383 16.7%Minneapolis, MN $15,146 $91,686 16.5%Philadelphia, PA $15,338 $93,551 16.4%
Rochester, NY $12,675 $77,649 16.3%Pittsburgh, PA $12,898 $80,432 16.0%Hartford, CT $15,411 $96,225 16.0%Austin, TX $14,408 $91,443 15.8%Baltimore, MD $15,054 $98,824 15.2%
Salt Lake City, UT $12,528 $82,803 15.1%Virginia Beach, VA $12,319 $84,514 14.6%Atlanta, GA $13,301 $92,380 14.4%Jacksonville, FL $11,469 $80,585 14.2%Dallas/Ft. Worth, TX $13,127 $93,339 14.1%
Detroit, MI $11,490 $83,482 13.8%Cleveland, OH $10,726 $78,378 13.7%Kansas City, MO $11,285 $83,024 13.6%Richmond, VA $12,089 $90,470 13.4%Phoenix, AZ $11,478 $86,231 13.3%
Charlotte, NC $12,386 $93,105 13.3%Houston, TX $12,613 $95,229 13.2%Omaha, NE $10,600 $80,155 13.2%Raleigh-Durham, NC $12,464 $94,400 13.2%Cincinnati, OH $10,825 $83,390 13.0%
Indianapolis, IN $9,836 $77,672 12.7%San Antonio, TX $11,121 $88,109 12.6%St. Louis, MO $10,989 $87,174 12.6%Oklahoma City, OK $8,452 $74,424 11.4%Columbus, OH $10,491 $92,510 11.3%
34 2017 SCORING TECH TALENT | CBRE Research
A P P E N D I X
A P P E N D I X A : L O C A L M A R K E T P R O F I L E S A2
A P P E N D I X B : F U L L R E P O R T D A T A S U M M A R Y B1
What is tech talent and why is it important? B2
Which are the top-ranked tech-talent markets? B3
What are tech-talent momentum markets? B4
Whatdefinesatechtalentmarket? B6
Tech talent has unique concentrations across markets. B10
Which are the highest- and lowest-cost markets to operate in? B14
How does tech talent impact commercial real estate? B17

A1 © 2017 CBRE, Inc.

2017 SCORING TECH TALENT | CBRE ResearchA2
0%
5%
10%
15%
20%
$20
$30
$40
$50
$60
$70
SCORE
HOUSING & RELATIVE COSTS* (US=100%)
EMPLOYMENT BREAKDOWN
TOP TECH OFFICE DEALS (2017)
START-UP PIPELINE
EDUCATIONAL ATTAINMENT
TECH TALENT DIVERSITY
OFFICE RENT & VACANCY TRENDS
POPULATION TRENDS
Top Regional Universities
Company Count
Capital Raised (Millions)
Stanford 850 $18,146UC Berkeley 881 $14,239
VC-Funded Companies Founded by Alumni of Top Regional Universities:Snapchat, Solyndra, SunRun, Flipboard, Okta, Cloudera, Zynga, Machine Zone, Sapphire Energy, Harvest Powers
Employment 2016
Growth 2011-16
Average Wage
Growth 2011-16
TOTAL TECH OCCUPATIONS 328,070 49.9% $123,158 13.8%Software Developers & Programmers 147,580 56.2% $128,821 12.6%Computer Support, Database & Systems 107,560 53.9% $102,307 14.9%Computer & Infor. Systems Managers 25,440 48.1% $190,768 15.9%Technology Engineering-Related 47,490 27.6% $116,567 13.7%
TOTAL NON-TECH OCCUPATIONS 374,590 12.3% $70,242 7.0%Sales 61,660 38.2% $89,789 -5.1%Administrative & Office Support 218,680 11.9% $54,249 10.1%Business Operations & Finance 73,500 17.3% $98,153 13.0%Marketing 20,750 -32.9% $81,828 -3.3%
Source: U.S. Bureau of Labor Statistics (Metro Area), April 2017.*Aggregate of San Francisco, Oakland and Silicon Valley Metro Areas
FEMALE
MALE 74%26%
Source: U.S. Census Bureau (Metro Area), 2016. *Weighted Average of San Francisco, Oakland and
Silicon Valley Metro Areas
Tenant Address Sq. Ft.Confidential 905 11th Ave (Sunnyvale) 350,700Confidential 2100 University Ave (Palo Alto) 214,000Confidential 121 Spear St (San Francisco) 166,500Confidential 415 Mission St (San Francisco) 149,000Confidential 113 20th St (San Francisco) 126,600
Source: CBRE Research (Office Market), 2017.
151% LIVING COST
118% BUSINESS COST
AVERAGE APT. RENT: $2,790 PER UNIT/MO.38% INCREASE SINCE 2011
Source: Relative Costs from Moody’s Analytics (Metro Area), Q1 2017.
*Average of San Jose, San Francisco and Oakland MSAs
Source: U.S. Census Bureau (Cities of San Francisco and Oakland, counties of Santa Clara and San Mateo), 2016.*Aggregate of San Francisco, Oakland and Silicon Valley Metro Areas
The population of millennials in their 20s grew by 51,047 (9.5%) since 2010. That’s 20.2% of total growth in a population of 3,967,273.Age Group
70+ Years60-69 Years50-59 Years40-49 Years30-39 Years20-29 Years10-19 Years
0-9 Years
% Change11.3%19.7%
9.5%1.4%5.3%9.5%1.7%0.2%
47% BACHELOR’S OR HIGHER
DEGREE COMPLETIONS (2014-2015)
TOTAL TECH DEGREES 6,503 27.0%Computer Engineering 3,950 28.9%Math/Statistics 1,016 33.5%Other Tech Engineering 1,537 18.8%
Source: U.S. Census Bureau (City), 2016.*Aggregate of San Francisco, Oakland and Silicon Valley Metro Areas
San Francisco Bay Area
Source: CBRE Research, Q1 2017.
1 SF Bay Area, CA 81.28
Source: Pitchbook, 2017.
$61.42
7.7%
Source: The National Center for Education Statistics (Region), July 2016.
*Aggregate of San Francisco, Oakland and Silicon Valley Metro Areas
Rent (FSG)Vacancy (%)
0 10,000 20,000 30,000 40,000 50,000 60,000 70,000
Growth 2011-15
Source: Apt, rent data from CBRE EA (City), Q1 2017. *Weighted Average of San Francisco, Oakland and Silicon
Valley Metro Areas
Q1 2010 Q1 2012 Q1 2014 Q1 2016Q1 2011 Q1 2013 Q1 2015 Q1 2017

A3 © 2017 CBRE, Inc.
10%
12%
14%
16%
18%
20%
22%
$24 $25 $26 $27 $28 $29 $30 $31 $32 $33
SCORE
HOUSING & RELATIVE COSTS* (US=100%)
EMPLOYMENT BREAKDOWN
TOP TECH OFFICE DEALS (2017)
START-UP PIPELINE
EDUCATIONAL ATTAINMENT
TECH TALENT DIVERSITY
OFFICE RENT & VACANCY TRENDS
POPULATION TRENDS
Top Regional Universities
Company Count
Capital Raised (Millions)
University of Washington 282 $3,865
VC-Funded Companies Founded by Alumni of Top Regional Universities:N/A
Employment 2016
Growth 2011-16
Average Wage
Growth 2011-16
TOTAL TECH OCCUPATIONS 136,910 33.4% $113,906 20.7%Software Developers & Programmers 70,740 34.2% $125,908 26.4%Computer Support, Database & Systems 46,240 40.2% $88,162 13.7%Computer & Infor. Systems Managers 9,860 34.3% $156,060 13.8%Technology Engineering-Related 10,070 4.9% $106,530 17.5%
TOTAL NON-TECH OCCUPATIONS 189,830 24.6% $59,442 7.9%Sales 17,390 -1.5% $72,447 -4.9%Administrative & Office Support 116,870 23.4% $49,288 12.6%Business Operations & Finance 35,860 38.1% $75,901 4.5%Marketing 19,710 40.0% $78,230 7.6%
Source: U.S. Bureau of Labor Statistics (Metro Area), April 2017.
FEMALE
MALE 77%23%
Source: U.S. Census Bureau (Metro Area), 2016.
Tenant Address Sq. Ft.F5 Networks 801 5th Ave 515,500Confidential 1812 Boren Ave 290,700Confidential 101 Westlake Ave N 151,700Offer Up 1745 114th Ave SE 71,300Confidential 437 N 34th St 50,900
Source: CBRE Research (Office Market), 2017.
123% LIVING COST
103% BUSINESS COST
AVERAGE APT. RENT: $1,694 PER UNIT/MO.37% INCREASE SINCE 2011
*Seattle Metro Div Source: Relative Costs from Moody’s Analytics
(metro area), Q1 2017; Apt. rent data from CBRE EA (City), Q1 2017.
Source: U.S. Census Bureau (City of Seattle), 2016.
The population of millennials in their 20s grew by 19,927 (16.6%) since 2010. That’s 27% of total growth in a population of 684,443.Age Group
70+ Years60-69 Years50-59 Years40-49 Years30-39 Years20-29 Years10-19 Years
0-9 Years
% Change16.7%28.1%-0.3%7.5%
21.1%16.6%-0.4%4.1%
62% BACHELOR’S OR HIGHERSource: U.S. Census Bureau (City), 2016.
Source: CBRE Research (Office Market), Q1 2017.
2 Seattle, WA 67.83
Source: Pitchbook, 2017.
$31.91
11.7%
Source: The National Center for Education Statistics (Region), July 2016.
-5,000 0 5,000 10,000 15,000 20,000 25,000
DEGREE COMPLETIONS (2014-2015)
TOTAL TECH DEGREES 2,984 62.7%Computer Engineering 1,871 64.6%Math/Statistics 535 61.6%Other Tech Engineering 578 57.9%
Growth 2011-15
Q1 2010 Q1 2012 Q1 2014 Q1 2016Q1 2011 Q1 2013 Q1 2015 Q1 2017
Rent (FSG)Vacancy (%)
Seattle Metro Area

2017 SCORING TECH TALENT | CBRE ResearchA4
0%
2%
4%
6%
8%
10%
12%
$40
$50
$60
$70
$80
HOUSING & RELATIVE COSTS* (US=100%)
EMPLOYMENT BREAKDOWN
TOP TECH OFFICE DEALS (2017)
START-UP PIPELINE
EDUCATIONAL ATTAINMENT
TECH TALENT DIVERSITY
OFFICE RENT & VACANCY TRENDS
POPULATION TRENDS
Top Regional Universities
Company Count
Capital Raised (Millions)
Columbia 347 $4,995NYU 307 $2,682
VC-Funded Companies Founded by Alumni of Top Regional Universities:DraftKings, Human Longevity, MediaMath, Serious Energy, Compas (US)
Employment 2016
Growth 2011-16
Average Wage
Growth 2011-16
TOTAL TECH OCCUPATIONS 246,180 32.9% $108,878 16.1%Software Developers & Programmers 100,310 40.5% $108,212 17.1%Computer Support, Database & Systems 109,870 41.3% $92,804 19.2%Computer & Infor. Systems Managers 24,120 4.9% $185,340 20.9%Technology Engineering-Related 11,880 3.0% $107,916 17.7%
TOTAL NON-TECH OCCUPATIONS 940,790 11.3% $58,430 16.9%Sales 86,810 31.1% $75,577 9.4%Administrative & Office Support 575,800 1.3% $39,269 10.4%Business Operations & Finance 188,030 26.6% $101,168 16.1%Marketing 90,150 52.1% $75,153 4.8%
Source: U.S. Bureau of Labor Statistics (Metro Area), April 2017.
Tenant Address Sq. Ft.Spotify 4 World Trade Ctr 481,263IPSoft 17 State St 139,642SS&C Technologies 4 Times Sq 135,572Snap 229 West 43rd St 121,326ContextMedia 330 West 34th St 55,758
Source: CBRE Research (Office Market), 2016.
125% LIVING COST
161% BUSINESS COST
AVERAGE APT. RENT: $4,418 PER UNIT/MO.17.8% INCREASE SINCE 2011
*New York Metro Div Source: Relative Costs from Moody’s Analytics
(metro area), Q1 2017; Apt, rent data from CBRE EA (City), Q1 2017.
Source: U.S. Census Bureau (City of New York), 2016.
The population of millennials in their 20s grew by 36,485 (2.6%) since 2010. That’s 10% of total growth in a population of 8,550,405.Age Group
70+ Years60-69 Years50-59 Years40-49 Years30-39 Years20-29 Years10-19 Years
0-9 Years
% Change8.2%
16.3%7.0%
-3.0%9.3%2.6%-6.6%7.1%
37% BACHELOR’S OR HIGHERSource: U.S. Census Bureau (City), 2016. Source: The National Center for Education Statistics
(Region), July 2016.
New YorkMetro Area
3 New York, NY 64.21
Source: Pitchbook, 2017.
SCORE
$76.13
7.7%
-100,000 -50,000 0 50,000 100,000 150,000
Rent (FSG)Vacancy (%)
DEGREE COMPLETIONS (2014-2015)
TOTAL TECH DEGREES 14,419 37.8%Computer Engineering 8,490 44.4%Math/Statistics 3,051 29.3%Other Tech Engineering 2,878 29.2%
Growth 2011-15
Source: CBRE Research, Q1 2017.
Q1 2010 Q1 2012 Q1 2014 Q1 2016Q1 2011 Q1 2013 Q1 2015 Q1 2017
Source: U.S. Census Bureau (Metro Area), 2016.
FEMALE
MALE 72%28%
A5 © 2017 CBRE, Inc.
11%
12%
13%
14%
15%
16%
17%
$33
$34
$35
$36
$37
$38
$39
HOUSING & RELATIVE COSTS* (US=100%)
EMPLOYMENT BREAKDOWN
TOP TECH OFFICE DEALS (2017)
START-UP PIPELINE
EDUCATIONAL ATTAINMENT
TECH TALENT DIVERSITY
OFFICE RENT & VACANCY TRENDS
POPULATION TRENDS
Top Regional Universities
Company Count
Capital Raised (Millions)
University of Maryland 267 $3,169Georgetown 222 $3,186
VC-Funded Companies Founded by Alumni of Top Regional Universities:N/A
Employment 2016
Growth 2011-16
Average Wage
Growth 2011-16
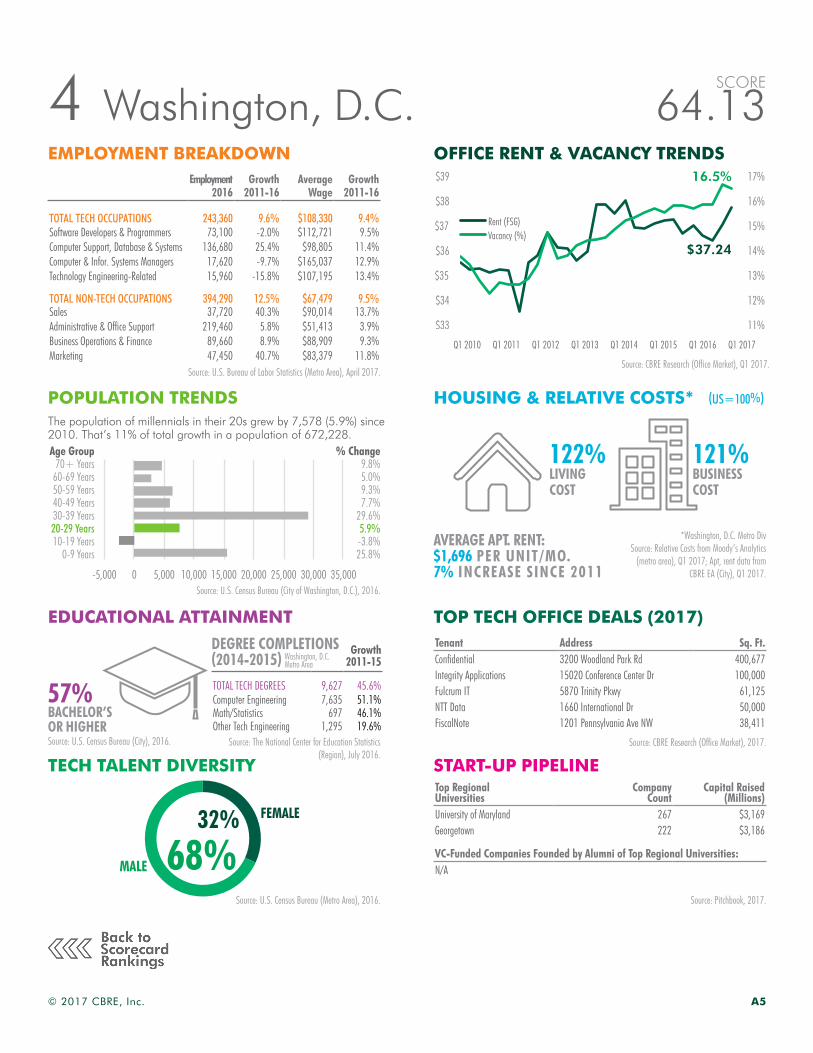
TOTAL TECH OCCUPATIONS 243,360 9.6% $108,330 9.4%Software Developers & Programmers 73,100 -2.0% $112,721 9.5%Computer Support, Database & Systems 136,680 25.4% $98,805 11.4%Computer & Infor. Systems Managers 17,620 -9.7% $165,037 12.9%Technology Engineering-Related 15,960 -15.8% $107,195 13.4%
TOTAL NON-TECH OCCUPATIONS 394,290 12.5% $67,479 9.5%Sales 37,720 40.3% $90,014 13.7%Administrative & Office Support 219,460 5.8% $51,413 3.9%Business Operations & Finance 89,660 8.9% $88,909 9.3%Marketing 47,450 40.7% $83,379 11.8%
Source: U.S. Bureau of Labor Statistics (Metro Area), April 2017.
FEMALE
MALE 68%32%
Source: U.S. Census Bureau (Metro Area), 2016.
Tenant Address Sq. Ft.Confidential 3200 Woodland Park Rd 400,677Integrity Applications 15020 Conference Center Dr 100,000Fulcrum IT 5870 Trinity Pkwy 61,125NTT Data 1660 International Dr 50,000FiscalNote 1201 Pennsylvania Ave NW 38,411
Source: CBRE Research (Office Market), 2017.
122% LIVING COST
121% BUSINESS COST
AVERAGE APT. RENT: $1,696 PER UNIT/MO.7% INCREASE SINCE 2011
*Washington, D.C. Metro DivSource: Relative Costs from Moody’s Analytics
(metro area), Q1 2017; Apt, rent data from CBRE EA (City), Q1 2017.
Source: U.S. Census Bureau (City of Washington, D.C.), 2016.
The population of millennials in their 20s grew by 7,578 (5.9%) since 2010. That’s 11% of total growth in a population of 672,228.Age Group
70+ Years60-69 Years50-59 Years40-49 Years30-39 Years20-29 Years10-19 Years
0-9 Years
% Change9.8%5.0%9.3%7.7%
29.6%5.9%-3.8%25.8%
57% BACHELOR’S OR HIGHERSource: U.S. Census Bureau (City), 2016.
Washington, D.C.Metro Area
4 Washington, D.C. 64.13
Source: Pitchbook, 2017.
SCORE
$37.24
16.5%
-5,000 0 5,000 10,000 15,000 20,000 25,000 30,000 35,000
Rent (FSG)Vacancy (%)
Q1 2010 Q1 2012 Q1 2014 Q1 2016Q1 2011 Q1 2013 Q1 2015 Q1 2017
Source: CBRE Research (Office Market), Q1 2017.
DEGREE COMPLETIONS (2014-2015)
TOTAL TECH DEGREES 9,627 45.6%Computer Engineering 7,635 51.1%Math/Statistics 697 46.1%Other Tech Engineering 1,295 19.6%
Growth 2011-15
Source: The National Center for Education Statistics (Region), July 2016.

2017 SCORING TECH TALENT | CBRE ResearchA6
SCORE
DEGREE COMPLETIONS (2014-2015)
TOTAL TECH DEGREES 5,120 30.2%Computer Engineering 2,883 33.2%Math/Statistics 485 55.9%Other Tech Engineering 1,752 20.2%
Growth 2011-15
12%
17%
22%
27%
$19
$20
$21
$22
$23
$24
$25
HOUSING & RELATIVE COSTS* (US=100%)
EMPLOYMENT BREAKDOWN
TOP TECH OFFICE DEALS (2017)
START-UP PIPELINE
EDUCATIONAL ATTAINMENT
TECH TALENT DIVERSITY
OFFICE RENT & VACANCY TRENDS
POPULATION TRENDS
Top Regional Universities
Company Count
Capital Raised (Millions)
Georgia Institute of Technology 217 $2,718
VC-Funded Companies Founded by Alumni of Top Regional Universities:N/A
Employment 2016
Growth 2011-16
Average Wage
Growth 2011-16
TOTAL TECH OCCUPATIONS 133,810 47.6% $92,380 15.7%Software Developers/Programmers 44,290 69.0% $98,585 12.2%Computer Support, Database & Systems 67,510 45.3% $82,545 20.0%Computer & Infor. Systems Managers 10,620 33.4% $139,820 14.0%Technology Engineering-Related 11,390 13.7% $82,316 7.9%
TOTAL NON-TECH OCCUPATIONS 334,490 16.4% $52,995 8.3%Sales 37,410 58.9% $72,049 5.4%Administrative & Office Support 216,700 5.5% $43,509 4.4%Business Operations & Finance 55,780 25.0% $73,311 6.6%Marketing 24,600 79.4% $61,519 2.1%
Source: U.S. Bureau of Labor Statistics (Metro Area), April 2017.
FEMALE
MALE 73%27%
Source: U.S. Census Bureau (Metro Area), 2016.
Tenant Address Sq. Ft.AthenaHealth 675 Ponce De Leon Ave 40,000CallRail 100 Peachtree St NW 31,943SalesLoft 1180 W Peachtree St NW 30,524Blue Sombrero 746 Willoughby Way 30,392Membersuite 47 Perimeter Ctr E 17,100
Source: CBRE Research (Office Market), 2017.
101% LIVING COST
88% BUSINESS COST
AVERAGE APT. RENT: $1,108 PER UNIT/MO.29% INCREASE SINCE 2011
*Atlanta Metro AreaSource: Relative Costs from Moody’s Analytics
(metro area), Q1 2017; Apt, rent data from CBRE EA (City), Q1 2017.
Source: U.S. Census Bureau (City of Atlanta), 2016.
The population of millennials in their 20s grew by 7,968 (9.3%) since 2010. That’s 19.2% of total growth in a population of 463,875.Age Group
70+ Years60-69 Years50-59 Years40-49 Years30-39 Years20-29 Years10-19 Years
0-9 Years
% Change36.5%17.1%
9.8%0.5%
20.6%9.3%-4.2%1.1%
48% BACHELOR’S OR HIGHERSource: U.S. Census Bureau (City), 2016.
AtlantaMetro Area
5 Atlanta, GA 59.55
Source: Pitchbook, 2017.
$24.38
16.9%
-5,000 0 5,000 10,000 15,000 20,000
Rent (FSG)Vacancy (%)
Source: CBRE Research, Q1 2017.
Q1 2010 Q1 2012 Q1 2014 Q1 2016Q1 2011 Q1 2013 Q1 2015 Q1 2017
Source: The National Center for Education Statistics (Region), July 2016.
A7 © 2017 CBRE, Inc.
SCORE
6%
7%
8%
9%
10%
11%
$32
$33
$34
$35
$36
HOUSING & RELATIVE COSTS* (US=100%)
EMPLOYMENT BREAKDOWN
TOP TECH OFFICE DEALS (2017)
START-UP PIPELINE
EDUCATIONAL ATTAINMENT
TECH TALENT DIVERSITY
OFFICE RENT* & VACANCY TRENDS
POPULATION TRENDS
Top Regional Universities
Company Count
Capital Raised (Millions)
University of Waterloo 275 $5,067University of Toronto 230 $2,845
VC-Funded Companies Founded by Alumni of Top Regional Universities:Pivotal Software, Wish, Hangzhou Kuaidi Technology, Instacart, Real Matters
Employment 2016
Growth 2011-16
Average Wage*
Growth 2011-16
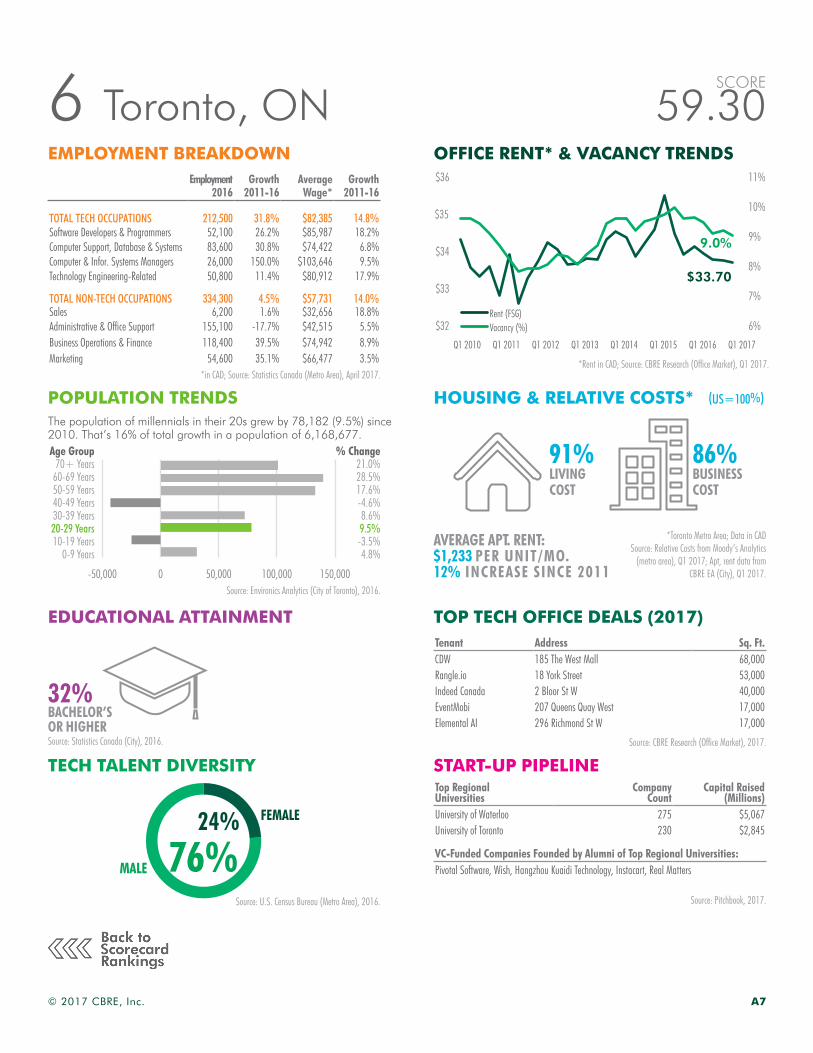
TOTAL TECH OCCUPATIONS 212,500 31.8% $82,385 14.8%Software Developers & Programmers 52,100 26.2% $85,987 18.2%Computer Support, Database & Systems 83,600 30.8% $74,422 6.8%Computer & Infor. Systems Managers 26,000 150.0% $103,646 9.5%Technology Engineering-Related 50,800 11.4% $80,912 17.9%
TOTAL NON-TECH OCCUPATIONS 334,300 4.5% $57,731 14.0%Sales 6,200 1.6% $32,656 18.8%Administrative & Office Support 155,100 -17.7% $42,515 5.5%Business Operations & Finance 118,400 39.5% $74,942 8.9%Marketing 54,600 35.1% $66,477 3.5%
*in CAD; Source: Statistics Canada (Metro Area), April 2017.
Tenant Address Sq. Ft.CDW 185 The West Mall 68,000Rangle.io 18 York Street 53,000Indeed Canada 2 Bloor St W 40,000EventMobi 207 Queens Quay West 17,000Elemental AI 296 Richmond St W 17,000
Source: CBRE Research (Office Market), 2017.
91% LIVING COST
86% BUSINESS COST
AVERAGE APT. RENT: $1,233 PER UNIT/MO.12% INCREASE SINCE 2011
*Toronto Metro Area; Data in CADSource: Relative Costs from Moody’s Analytics
(metro area), Q1 2017; Apt, rent data from CBRE EA (City), Q1 2017.
Source: Environics Analytics (City of Toronto), 2016.
The population of millennials in their 20s grew by 78,182 (9.5%) since 2010. That’s 16% of total growth in a population of 6,168,677.Age Group
70+ Years60-69 Years50-59 Years40-49 Years30-39 Years20-29 Years10-19 Years
0-9 Years
% Change21.0%28.5%17.6%-4.6%8.6%9.5%-3.5%4.8%
32% BACHELOR’S OR HIGHERSource: Statistics Canada (City), 2016.
6 Toronto, ON 59.30
Source: Pitchbook, 2017.
9.0%
$33.70
-100,000 -50,000 0 50,000 100,000 150,000
Rent (FSG)Vacancy (%)
Q1 2010 Q1 2012 Q1 2014 Q1 2016Q1 2011 Q1 2013 Q1 2015 Q1 2017
*Rent in CAD; Source: CBRE Research (Office Market), Q1 2017.
Source: U.S. Census Bureau (Metro Area), 2016.
FEMALE
MALE 76%24%
2017 SCORING TECH TALENT | CBRE ResearchA8
SCORE
10%
12%
14%
16%
18%
20%
22%
$18
$19
$20
$21
$22
$23
$24
$25
$26
HOUSING & RELATIVE COSTS* (US=100%)
EMPLOYMENT BREAKDOWN
TOP TECH OFFICE DEALS (2017)
START-UP PIPELINE
EDUCATIONAL ATTAINMENT
TECH TALENT DIVERSITY
OFFICE RENT & VACANCY TRENDS
POPULATION TRENDS
Top Regional Universities
Company Count
Capital Raised (Millions)
Duke 331 $5,168University of North Carolina 212 $2,475
VC-Funded Companies Founded by Alumni of Top Regional Universities:N/A
Employment 2016
Growth 2011-16
Average Wage
Growth 2011-16
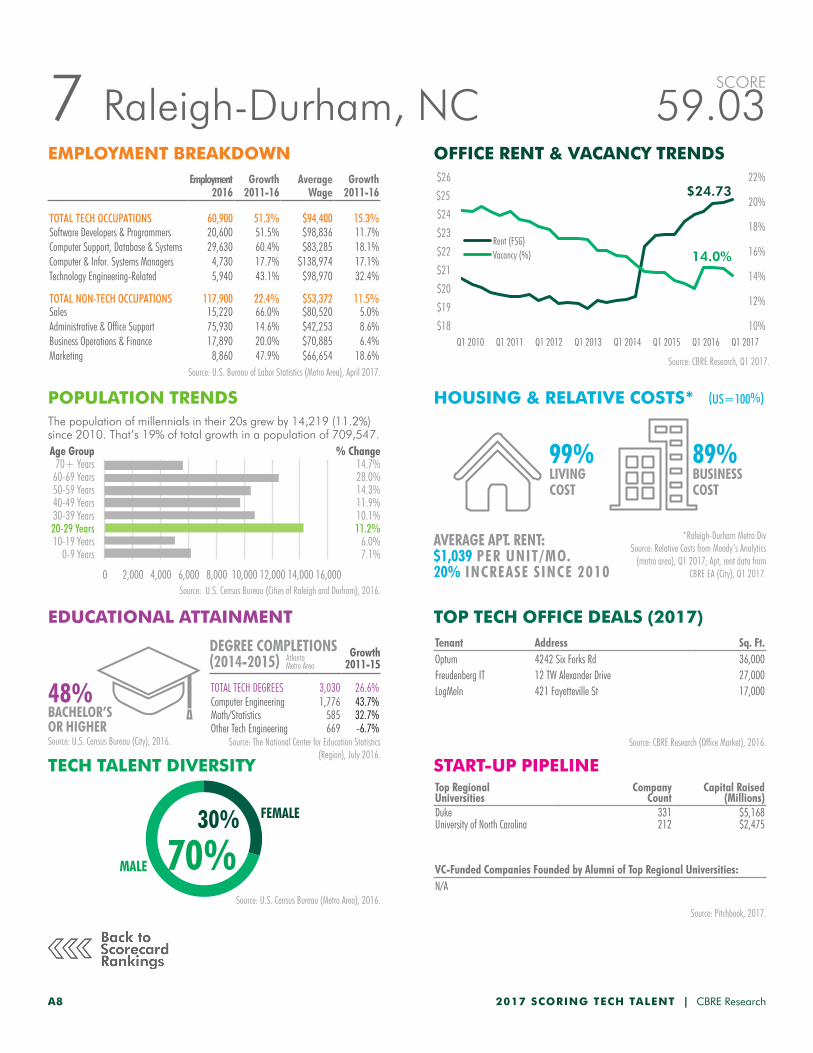
TOTAL TECH OCCUPATIONS 60,900 51.3% $94,400 15.3%Software Developers & Programmers 20,600 51.5% $98,836 11.7%Computer Support, Database & Systems 29,630 60.4% $83,285 18.1%Computer & Infor. Systems Managers 4,730 17.7% $138,974 17.1%Technology Engineering-Related 5,940 43.1% $98,970 32.4%
TOTAL NON-TECH OCCUPATIONS 117,900 22.4% $53,372 11.5%Sales 15,220 66.0% $80,520 5.0%Administrative & Office Support 75,930 14.6% $42,253 8.6%Business Operations & Finance 17,890 20.0% $70,885 6.4%Marketing 8,860 47.9% $66,654 18.6%
Source: U.S. Bureau of Labor Statistics (Metro Area), April 2017.
FEMALE
MALE 70%30%
Source: U.S. Census Bureau (Metro Area), 2016.
Tenant Address Sq. Ft.Optum 4242 Six Forks Rd 36,000Freudenberg IT 12 TW Alexander Drive 27,000LogMeln 421 Fayetteville St 17,000
Source: CBRE Research (Office Market), 2016.
99% LIVING COST
89% BUSINESS COST
AVERAGE APT. RENT: $1,039 PER UNIT/MO.20% INCREASE SINCE 2010
*Raleigh-Durham Metro DivSource: Relative Costs from Moody’s Analytics
(metro area), Q1 2017; Apt, rent data from CBRE EA (City), Q1 2017.
Source: U.S. Census Bureau (Cities of Raleigh and Durham), 2016.
The population of millennials in their 20s grew by 14,219 (11.2%) since 2010. That’s 19% of total growth in a population of 709,547. Age Group
70+ Years60-69 Years50-59 Years40-49 Years30-39 Years20-29 Years10-19 Years
0-9 Years
% Change14.7%28.0%14.3%11.9%10.1%11.2%
6.0%7.1%
48% BACHELOR’S OR HIGHERSource: U.S. Census Bureau (City), 2016.
7 Raleigh-Durham, NC 59.03
Source: Pitchbook, 2017.
$24.73
14.0%
0 2,000 4,000 6,000 8,000 10,000 12,000 14,000 16,000
Rent (FSG)Vacancy (%)
Source: CBRE Research, Q1 2017.
Q1 2010 Q1 2012 Q1 2014 Q1 2016Q1 2011 Q1 2013 Q1 2015 Q1 2017
DEGREE COMPLETIONS (2014-2015)
TOTAL TECH DEGREES 3,030 26.6%Computer Engineering 1,776 43.7%Math/Statistics 585 32.7%Other Tech Engineering 669 -6.7%
Growth 2011-15
AtlantaMetro Area
Source: The National Center for Education Statistics (Region), July 2016.
A9 © 2017 CBRE, Inc.
SCORE
0%
5%
10%
15%
20%
25%
30%
$20
$25
$30
$35
$40
HOUSING & RELATIVE COSTS* (US=100%)
EMPLOYMENT BREAKDOWN
TOP TECH OFFICE DEALS (2017)
START-UP PIPELINE
EDUCATIONAL ATTAINMENT
TECH TALENT DIVERSITY
OFFICE RENT & VACANCY TRENDS
POPULATION TRENDS
Top Regional Universities
Company Count
Capital Raised (Millions)
University of Texas 511 $4,763
VC-Funded Companies Founded by Alumni of Top Regional Universities:Zalora, Apollo Endosurgery, Dermira, AirStrip Technologies, Skyonic
Employment 2016
Growth 2011-16
Average Wage
Growth 2011-16
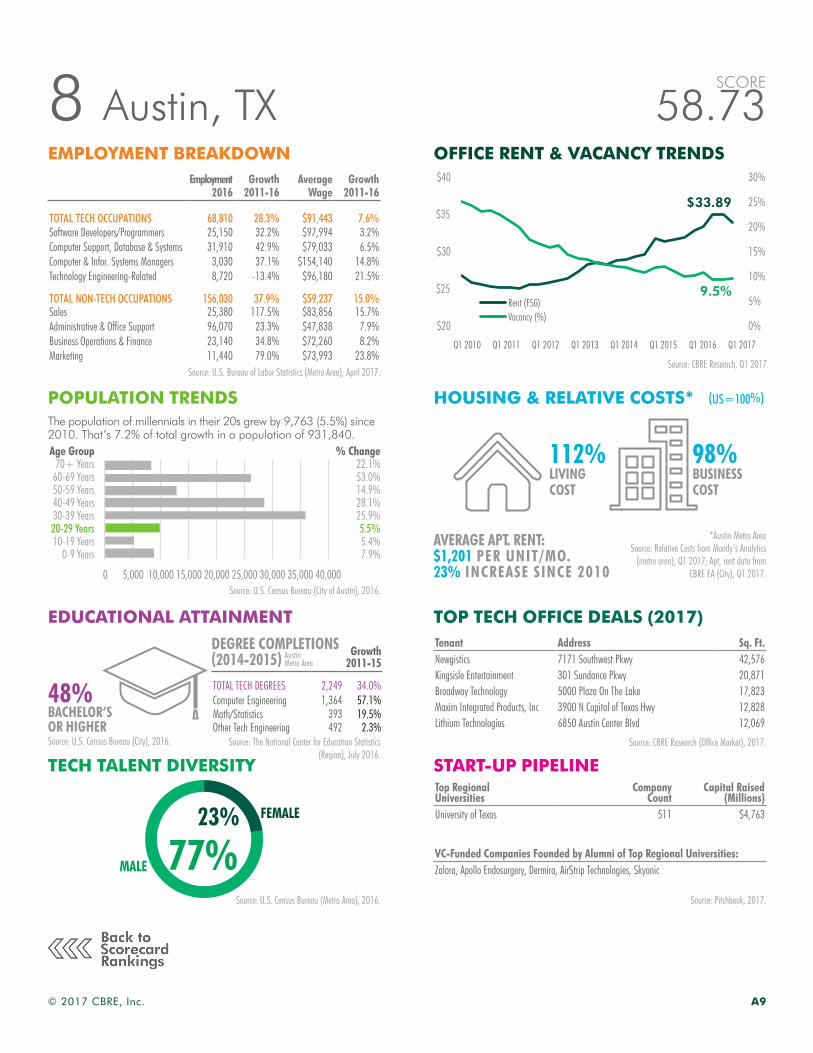
TOTAL TECH OCCUPATIONS 68,810 28.3% $91,443 7.6%Software Developers/Programmers 25,150 32.2% $97,994 3.2%Computer Support, Database & Systems 31,910 42.9% $79,033 6.5%Computer & Infor. Systems Managers 3,030 37.1% $154,140 14.8%Technology Engineering-Related 8,720 -13.4% $96,180 21.5%
TOTAL NON-TECH OCCUPATIONS 156,030 37.9% $59,237 15.0%Sales 25,380 117.5% $83,856 15.7%Administrative & Office Support 96,070 23.3% $47,838 7.9%Business Operations & Finance 23,140 34.8% $72,260 8.2%Marketing 11,440 79.0% $73,993 23.8%
Source: U.S. Bureau of Labor Statistics (Metro Area), April 2017.
Tenant Address Sq. Ft.Newgistics 7171 Southwest Pkwy 42,576Kingsisle Entertainment 301 Sundance Pkwy 20,871Broadway Technology 5000 Plaza On The Lake 17,823Maxim Integrated Products, Inc 3900 N Capital of Texas Hwy 12,828Lithium Technologies 6850 Austin Center Blvd 12,069
Source: CBRE Research (Office Market), 2017.
112% LIVING COST
98% BUSINESS COST
AVERAGE APT. RENT: $1,201 PER UNIT/MO.23% INCREASE SINCE 2010
*Austin Metro AreaSource: Relative Costs from Moody’s Analytics
(metro area), Q1 2017; Apt, rent data from CBRE EA (City), Q1 2017.
Source: U.S. Census Bureau (City of Austin), 2016.
The population of millennials in their 20s grew by 9,763 (5.5%) since 2010. That’s 7.2% of total growth in a population of 931,840.Age Group
70+ Years60-69 Years50-59 Years40-49 Years30-39 Years20-29 Years10-19 Years
0-9 Years
% Change22.1%53.0%14.9%28.1%25.9%5.5%5.4%7.9%
48% BACHELOR’S OR HIGHERSource: U.S. Census Bureau (City), 2016.
8 Austin, TX 58.73
Source: Pitchbook, 2017.
9.5%
$33.89
0 5,000 10,000 15,000 20,000 25,000 30,000 35,000 40,000
Rent (FSG)Vacancy (%)
Q1 2010 Q1 2012 Q1 2014 Q1 2016Q1 2011 Q1 2013 Q1 2015 Q1 2017
Source: CBRE Research, Q1 2017.
DEGREE COMPLETIONS (2014-2015)
TOTAL TECH DEGREES 2,249 34.0%Computer Engineering 1,364 57.1%Math/Statistics 393 19.5%Other Tech Engineering 492 2.3%
AustinMetro Area
Growth 2011-15
Source: The National Center for Education Statistics (Region), July 2016.
FEMALE
MALE 77%23%
Source: U.S. Census Bureau (Metro Area), 2016.

2017 SCORING TECH TALENT | CBRE ResearchA10
SCORE
0%
5%
10%
15%
20%
$20
$25
$30
$35
$40
HOUSING & RELATIVE COSTS* (US=100%)
EMPLOYMENT BREAKDOWN
TOP TECH OFFICE DEALS (2017)
START-UP PIPELINE
EDUCATIONAL ATTAINMENT
TECH TALENT DIVERSITY
OFFICE RENT & VACANCY TRENDS
POPULATION TRENDS
Top Regional Universities
Company Count
Capital Raised (Millions)
MIT 695 $12,874Harvard 673 $17,204Boston University 257 $3,955Tufts University 200 $2,713University of Massachusetts 210 $2,683
VC-Funded Companies Founded by Alumni of Top Regional Universities:Oscar, Dropbox, Human Longevity, Gilt, Humacyte, Coupang, Cloudera, BabyTree, Zenefits, Affirm
Employment 2016
Growth 2011-16
Average Wage
Growth 2011-16
TOTAL TECH OCCUPATIONS 115,560 11.4% $103,979 9.0%Software Developers & Programmers 47,840 16.2% $108,200 7.2%Computer Support, Database & Systems 43,900 12.3% $88,219 11.1%Computer & Infor. Systems Managers 11,200 12.4% $154,700 10.1%Technology Engineering-Related 12,620 -6.7% $97,790 6.9%
TOTAL NON-TECH OCCUPATIONS 233,080 9.2% $68,434 13.0%Sales 28,040 22.4% $92,103 5.8%Administrative & Office Support 133,470 6.9% $55,668 16.9%Business Operations & Finance 50,080 4.0% $86,023 7.6%Marketing 21,490 23.2% $75,852 16.3%
Source: U.S. Bureau of Labor Statistics (Metro Area), April 2017.
FEMALE
MALE 71%29%
Source: U.S. Census Bureau (Metro Area), 2016.
Tenant Address Sq. Ft.Confidential 235 Summer St 144,500Confidential 120 Turnpike Rd 82,000Kayak Software 10 Canal Pk 54,000Zensar Technologies (Akibia) 4 Technology Dr 40,700Desktop Metal 63 Third Ave 40,000
Source: CBRE Research (Office Market), 2017.
119% LIVING COST
122% BUSINESS COST
AVERAGE APT. RENT: $2,154 PER UNIT/MO.20% INCREASE SINCE 2011
*Boston Metro AreaSource: Relative Costs from Moody’s Analytics
(metro area), Q1 2017; Apt, rent data from CBRE EA (City), Q1 2017.
Source: U.S. Census Bureau (City of Boston), 2016.
The population of millennials in their 20s grew by 1,266 (0.8%) since 2010. That’s 2.6% of total growth in a population of 669,469.Age Group
70+ Years60-69 Years50-59 Years40-49 Years30-39 Years20-29 Years10-19 Years
0-9 Years
% Change4.7%
17.7%13.0%-0.3%25.2%0.8%-2.6%12.3%
47% BACHELOR’S OR HIGHERSource: U.S. Census Bureau (City), 2016.
9 Boston, MA 57.57
Source: Pitchbook, 2017.
$35.91
13.7%
-5,000 0 5,000 10,000 15,000 20,000 25,000
Rent (FSG)Vacancy (%)
Source: CBRE Research, Q1 2017.
Q1 2010 Q1 2012 Q1 2014 Q1 2016Q1 2011 Q1 2013 Q1 2015 Q1 2017
DEGREE COMPLETIONS (2014-2015)
TOTAL TECH DEGREES 7,507 40.5%Computer Engineering 4,203 50.8%Math/Statistics 1,083 25.8%Other Tech Engineering 2,221 31.1%
Growth 2011-15
BostonMetro Area
Source: The National Center for Education Statistics (Region), July 2016.

A11 © 2017 CBRE, Inc.
SCORE
15%
17%
19%
21%
23%
25%
$15 $16 $17 $18 $19 $20 $21 $22 $23 $24 $25
HOUSING & RELATIVE COSTS* (US=100%)
EMPLOYMENT BREAKDOWN
TOP TECH OFFICE DEALS (2016/2017)
START-UP PIPELINE
EDUCATIONAL ATTAINMENT
TECH TALENT DIVERSITY
OFFICE RENT & VACANCY TRENDS
POPULATION TRENDS
Top Regional Universities
Company Count
Capital Raised (Millions)
University of Texas 511 $4,763
VC-Funded Companies Founded by Alumni of Top Regional Universities:Zalora, Apollo Endosurgery, Dermira, AirStrip Technologies, Skyonic
Employment 2016
Growth 2011-16
Average Wage
Growth 2011-16
TOTAL TECH OCCUPATIONS 161,150 33.4% $93,339 8.9%Software Developers & Programmers 49,410 18.4% $102,199 9.8%Computer Support, Database & Systems 84,750 58.3% $83,579 15.8%Computer & Infor. Systems Managers 8,220 4.3% $156,805 1.5%Technology Engineering-Related 18,770 6.2% $86,285 9.8%
TOTAL NON-TECH OCCUPATIONS 468,280 23.7% $57,504 16.2%Sales 50,010 46.5% $68,773 -6.5%Administrative & Office Support 321,730 17.0% $49,983 20.3%Business Operations & Finance 72,600 37.7% $78,353 10.1%Marketing 23,940 43.1% $71,814 14.9%
Source: U.S. Bureau of Labor Statistics (Metro Area), April 2017.
FEMALE
MALE 75%25%
Source: U.S. Census Bureau (Metro Area), 2016.
Tenant Address Sq. Ft.NTT Data 7950 Legacy Dr 126,715CyrusOne LLC 2101 Cedar Springs Rd 30,137IBM 3010 Gayord Pkwy 26,656Check Point Software Technologies 6330 Commerce Dr 24,807Markit On Demand 5575 Flatiron Pkwy 96,267
Source: CBRE Research (Office Market), 2017.
105% LIVING COST
91% BUSINESS COST
AVERAGE APT. RENT: $1,094 PER UNIT/MO.26% INCREASE SINCE 2011
*Dallas/Ft. Worth Metro AreaSource: Relative Costs from Moody’s Analytics
(metro area), Q1 2017; Apt, rent data from CBRE EA (City), Q1 2017.
Source: U.S. Census Bureau (Cities of Dallas and Ft. Worth), 2016.
The population of millennials in their 20s grew by 12,757 (3.8%) since 2010. That’s 6.7% of total growth in a population of 2,137,051.Age Group
70+ Years60-69 Years50-59 Years40-49 Years30-39 Years20-29 Years10-19 Years
0-9 Years
% Change11.9%34.9%18.0%
4.2%7.8%3.8%9.3%4.1%
30% BACHELOR’S OR HIGHERSource: U.S. Census Bureau (City), 2016.
10 Dallas/Ft. Worth, TX 55.40
Source: Pitchbook, 2017.
19.1%
$23.95
0 10,000 20,000 30,000 40,000 50,000
Rent (FSG)Vacancy (%)
Q1 2010 Q1 2012 Q1 2014 Q1 2016Q1 2011 Q1 2013 Q1 2015 Q1 2017
Source: CBRE Research, Q1 2017.
DEGREE COMPLETIONS (2014-2015)
TOTAL TECH DEGREES 4,614 60.7%Computer Engineering 3,280 60.9%Math/Statistics 425 58.6%Other Tech Engineering 909 60.9%
Dallas/Ft. WorthMetro Area
Growth 2011-15
Source: The National Center for Education Statistics (Region), July 2016.

2017 SCORING TECH TALENT | CBRE ResearchA12
SCORE
9%
11%
13%
15%
17%
19%
$19
$20
$21
$22
$23
$24
HOUSING & RELATIVE COSTS* (US=100%)
EMPLOYMENT BREAKDOWN
TOP TECH OFFICE DEALS (2016/2017)
START-UP PIPELINE
EDUCATIONAL ATTAINMENT
TECH TALENT DIVERSITY
OFFICE RENT & VACANCY TRENDS
POPULATION TRENDS
Top Regional Universities
Company Count
Capital Raised (Millions)
University of Maryland 267 $3,169Georgetown 222 $3,186
VC-Funded Companies Founded by Alumni of Top Regional Universities:N/A
Employment 2016
Growth 2011-16
Average Wage
Growth 2011-16
TOTAL TECH OCCUPATIONS 72,710 35.2% $98,824 12.0%Software Developers & Programmers 20,010 30.3% $100,572 1.7%Computer Support, Database & Systems 39,560 48.8% $93,051 18.2%Computer & Infor. Systems Managers 4,380 -1.6% $142,690 20.1%Technology Engineering-Related 8,760 18.7% $98,966 21.3%
TOTAL NON-TECH OCCUPATIONS 172,380 13.8% $55,695 11.1%Sales 19,330 95.8% $75,707 7.2%Administrative & Office Support 114,720 3.8% $46,502 7.6%Business Operations & Finance 29,610 18.4% $76,804 9.5%Marketing 8,720 44.6% $60,595 0.1%
Source: U.S. Bureau of Labor Statistics (Metro Area), April 2017.
FEMALE
MALE 69%31%
Source: U.S. Census Bureau (Metro Area), 2016.
Tenant Address Sq. Ft.PayPal 9690 Deereco Rd 59,824Skyline Network Engineering 6956 Aviation Blvd 28,753PayPal 101 Schilling Rd 28,021Enlighten IT 991 Corporate Blvd 21,090Ventech 21 Governors Ct 16,000
Source: CBRE Research (Office Market), 2017.
107% LIVING COST
105% BUSINESS COST
AVERAGE APT. RENT: $1,255 PER UNIT/MO.10% INCREASE SINCE 2011
*Baltimore Metro AreaSource: Relative Costs from Moody’s Analytics
(metro area), Q1 2017; Apt, rent data from CBRE EA (City), Q1 2017.
Source: U.S. Census Bureau (City of Baltimore), 2016.
The population of millennials in their 20s declined by 1,012 (-0.9%) since 2010. That’s -79.9% in a population of 621,849.Age Group
70+ Years60-69 Years50-59 Years40-49 Years30-39 Years20-29 Years10-19 Years
0-9 Years
% Change1.5%
13.4%3.3%
-12.1%11.2%-0.9%
-11.8%4.3%
30% BACHELOR’S OR HIGHERSource: U.S. Census Bureau (City), 2016.
11 Baltimore, MD 55.28
Source: Pitchbook, 2017.
14.0%
$22.47
-15,000 -10,000 -5,000 0 5,000 10,000 15,000
Rent (FSG)Vacancy (%)
Source: CBRE Research, Q1 2017.
Q1 2010 Q1 2012 Q1 2014 Q1 2016Q1 2011 Q1 2013 Q1 2015 Q1 2017
DEGREE COMPLETIONS (2014-2015)
TOTAL TECH DEGREES 3,431 29.1%Computer Engineering 2,113 30.1%Math/Statistics 446 28.5%Other Tech Engineering 872 27.1%
Growth 2011-15
BaltimoreMetro Area
Source: The National Center for Education Statistics (Region), July 2016.
A13 © 2017 CBRE, Inc.
SCORE
11%
13%
15%
17%
19%
$18 $19 $20 $21 $22 $23 $24 $25 $26 $27
HOUSING & RELATIVE COSTS* (US=100%)
EMPLOYMENT BREAKDOWN
TOP TECH OFFICE DEALS (2017)
START-UP PIPELINE
EDUCATIONAL ATTAINMENT
TECH TALENT DIVERSITY
OFFICE RENT & VACANCY TRENDS
POPULATION TRENDS
Top Regional Universities
VC-Backed Firms Founded Since 2010
Capital Raised (Millions)
University of Colorado 265 $3,470
VC-Funded Companies Founded by Alumni of Top Regional Universities:N/A
Employment 2016
Growth 2011-16
Average Wage
Growth 2011-16
TOTAL TECH OCCUPATIONS 77,310 29.0% $100,383 19.9%Software Developers & Programmers 27,750 24.3% $109,127 19.7%Computer Support, Database & Systems 38,050 37.3% $88,099 19.8%Computer & Infor. Systems Managers 4,290 26.9% $164,730 28.0%Technology Engineering-Related 7,220 10.6% $93,279 19.3%
TOTAL NON-TECH OCCUPATIONS 189,160 15.3% $59,194 17.3%Sales 25,180 69.6% $81,514 10.7%Administrative & Office Support 111,150 4.6% $45,980 17.4%Business Operations & Finance 37,920 16.8% $78,916 8.2%Marketing 14,910 42.1% $69,844 11.9%
Source: U.S. Bureau of Labor Statistics (Metro Area), April 2017.
Tenant Address Sq. Ft.Vertafore 999 18th St 62,179Confidential 7595 Technology Way 29,907Cisco Systems 9155 East Nichols Ave 25,944RingCentral 8005 South Chester St 19,074SAIC 105 Technology Dr 18,937
Source: CBRE Research (Office Market), 2017.
109% LIVING COST
96% BUSINESS COST
AVERAGE APT. RENT: $1,395 PER UNIT/MO.39% INCREASE SINCE 2011
*Denver Metro AreaSource: Relative Costs from Moody’s
Analytics (metro area), Q1 2017; Apt, rent data from CBRE EA (City), Q1 2017.
Source: U.S. Census Bureau (City of Denver), 2016.
The population of millennials in their 20s grew by 7,941 (7.0%) since 2010. That’s 10.2% of total growth in a population of 682,545.Age Group
70+ Years60-69 Years50-59 Years40-49 Years30-39 Years20-29 Years10-19 Years
0-9 Years
% Change8.3%
39.3%0.4%
14.7%24.5%7.0%
12.9%4.0%
47% BACHELOR’S OR HIGHERSource: U.S. Census Bureau (City), 2016.
12 Denver, CO 53.37
Source: Pitchbook, 2017.
14.2%
$26.31
0 5,000 10,000 15,000 20,000 25,000 30,000
Rent (FSG)Vacancy (%)
Q1 2010 Q1 2012 Q1 2014 Q1 2016Q1 2011 Q1 2013 Q1 2015 Q1 2017
Source: CBRE Research, Q1 2017.
DEGREE COMPLETIONS (2014-2015)
TOTAL TECH DEGREES 3,015 23.2%Computer Engineering 1,637 34.8%Math/Statistics 332 12.9%Other Tech Engineering 1,046 11.3%
DenverMetro Area
Growth 2011-15
Source: The National Center for Education Statistics (Region), July 2016.
FEMALE
MALE 75%25%
Source: U.S. Census Bureau (Metro Area), 2016.

2017 SCORING TECH TALENT | CBRE ResearchA14
SCORE
DEGREE COMPLETIONS (2014-2015)
TOTAL TECH DEGREES 14,419 37.8%Computer Engineering 8,490 44.4%Math/Statistics 3,051 29.3%Other Tech Engineering 2,878 29.2%
13%
15%
17%
19%
21%
23%
$22
$23
$24
$25
$26
$27
HOUSING & RELATIVE COSTS* (US=100%)
EMPLOYMENT BREAKDOWN
TOP TECH OFFICE DEALS (2017)
START-UP PIPELINE
EDUCATIONAL ATTAINMENT
TECH TALENT DIVERSITY
OFFICE RENT & VACANCY TRENDS
POPULATION TRENDS
Top Regional Universities
CompanyCount
Capital Raised (Millions)
Princeton 382 $6,976Columbia 347 $4,995NYU 307 $2,682
VC-Funded Companies Founded by Alumni of Top Regional Universities:Jet, Demand Media, AppNexus, Harvest Power, Mosaic (Residential Solar Lending Platform)
Employment 2016
Growth 2011-16
Average Wage
Growth 2011-16
TOTAL TECH OCCUPATIONS 52,600 16.5% $107,612 11.1%Software Developers & Programmers 18,910 13.2% $104,276 6.7%Computer Support, Database & Systems 24,070 25.6% $95,513 19.4%Computer & Infor. Systems Managers 5,340 -2.4% $177,500 15.9%Technology Engineering-Related 4,280 -3.7% $103,198 8.9%
TOTAL NON-TECH OCCUPATIONS 142,050 3.5% $54,039 4.4%Sales 15,420 12.9% $85,947 -16.7%Administrative & Office Support 96,920 0.9% $39,544 8.9%Business Operations & Finance 21,250 -0.8% $87,841 6.5%Marketing 8,460 20.9% $77,031 15.8%
Source: U.S. Bureau of Labor Statistics (Metro Area), April 2017.
Tenant Address Sq. Ft.Confidential 33 Washington St 24,692Appeagle 10 Exchange Pl 12,960Combustion Innovation Group 695 Route 46 W 12,882Mediaocean 777 Terrace Ave 12,428The FORT Group 100 Challenger Rd 11,500
Source: CBRE Research (Office Market), 2017.
122% LIVING COST
107% BUSINESS COST
AVERAGE APT. RENT: $1,732 PER UNIT/MO.12.1% INCREASE SINCE 2011
*Newark Metro AreaSource: Relative Costs from Moody’s Analytics
(metro area), Q1 2017; Apt, rent data from CBRE EA (City), Q1 2017.
Source: U.S. Census Bureau (City of Newark), 2016.
The population of millennials in their 20s grew by 223 (0.5%) since 2010. That’s 4.8% of total growth in a population of 281,913.Age Group
70+ Years60-69 Years50-59 Years40-49 Years30-39 Years20-29 Years10-19 Years
0-9 Years
% Change32.0%27.5%11.5%
6.9%-9.8%0.5%-0.4%-9.6%
16% BACHELOR’S OR HIGHERSource: U.S. Census Bureau (City), 2016.
13 Newark, NJ 52.55
Source: Pitchbook, 2017.
16.6%
$25.74
-6,000 -4,000 -2,000 0 2,000 4,000 6,000
Rent (FSG)Vacancy (%)
Source: CBRE Research, Q1 2017.
Q1 2010 Q1 2012 Q1 2014 Q1 2016Q1 2011 Q1 2013 Q1 2015 Q1 2017
Growth 2011-15
New YorkMetro Area
Source: The National Center for Education Statistics (Region), July 2016.
Source: U.S. Census Bureau (Metro Area), 2016.
FEMALE
MALE 72%28%

A15 © 2017 CBRE, Inc.
SCORE
7%
9%
11%
13%
15%
17%
19%
$20 $21 $22 $23 $24 $25 $26 $27 $28 $29 $30 $31 $32 $33
HOUSING & RELATIVE COSTS* (US=100%)
EMPLOYMENT BREAKDOWN
TOP TECH OFFICE DEALS (2017)
START-UP PIPELINE
EDUCATIONAL ATTAINMENT
TECH TALENT DIVERSITY
OFFICE RENT & VACANCY TRENDS
POPULATION TRENDS
Top Regional Universities
Company Count
Capital Raised (Millions)
University of California Los Angeles 406 $6,988University of Southern California 341 $3,476
VC-Funded Companies Founded by Alumni of Top Regional Universities:BabyTree, BrightSource Energy, Demand Media, The Honest Company, Hortonworks, Lookout, Instacart, CrowdStrike, Moda Operandi, Crescendo Bioscience
Employment 2016
Growth 2011-16
Average Wage
Growth 2011-16
TOTAL TECH OCCUPATIONS 68,220 23.2% $99,256 10.7%Software Developers/Programmers 25,360 24.9% $109,418 13.6%Computer Support, Database & Systems 27,230 40.4% $81,692 12.5%Computer & Infor. Systems Managers 4,920 19.4% $142,830 6.9%Technology Engineering-Related 10,710 -7.3% $99,831 9.9%
TOTAL NON-TECH OCCUPATIONS 199,600 11.1% $56,534 5.9%Sales 25,180 7.7% $75,918 -1.0%Administrative & Office Support 127,920 7.0% $45,817 4.5%Business Operations & Finance 30,830 20.9% $78,929 9.4%Marketing 15,670 40.8% $68,816 7.8%
Source: U.S. Bureau of Labor Statistics (Metro Area), April 2017.
FEMALE
MALE 75%25%
Source: U.S. Census Bureau (Metro Area), 2016.
Tenant Address Sq. Ft.Kelley Blue Book 189, 195 & 217 Technology Dr 146,970Toshiba America 5231-5241 California 96,352Toshiba America 25530 Commercentre Dr 70,558Blizzard Entertainment 15253 Bake Pky 65,006Qualcomm 3347 Michelson Dr 25,968
Source: CBRE Research (Office Market), 2017.
145% LIVING COST
93% BUSINESS COST
AVERAGE APT. RENT: $1,986 PER UNIT/MO.19% INCREASE SINCE 2011
*Santa Ana Metro DivSource: Relative Costs from Moody’s Analytics
(metro area), Q1 2017; Apt, rent data from CBRE EA (City), Q1 2017.
Source: U.S. Census Bureau (Orange County), 2016.
The population of millennials in their 20s grew by 25,188 (5.7%) since 2010. That’s 16.7% of total growth in a population of 3,169,776.Age Group
70+ Years60-69 Years50-59 Years40-49 Years30-39 Years20-29 Years10-19 Years
0-9 Years
% Change18.0%22.3%13.1%
0.8%-1.0%5.7%-7.2%-0.7%
38% BACHELOR’S OR HIGHERSource: U.S. Census Bureau (City), 2016.
14 Orange County, CA 51.87
Source: Pitchbook, 2017.
9.3%
$32.04
-40,000 -20,000 0 20,000 40,000 60,000 80,000
Rent (FSG)Vacancy (%)
Q1 2010 Q1 2012 Q1 2014 Q1 2016Q1 2011 Q1 2013 Q1 2015 Q1 2017
Source: CBRE Research, Q1 2017.
DEGREE COMPLETIONS (2014-2015)
TOTAL TECH DEGREES 10,632 26.7%Computer Engineering 6,231 24.5%Math/Statistics 1,628 37.7%Other Tech Engineering 2,773 26.0%
Los AngelesMetro Area
Growth 2011-15
Source: The National Center for Education Statistics (Region), July 2016.

2017 SCORING TECH TALENT | CBRE ResearchA16
SCORE
10%
12%
14%
16%
18%
20%
$25
$26
$27
$28
$29
$30
HOUSING & RELATIVE COSTS* (US=100%)
EMPLOYMENT BREAKDOWN
TOP TECH OFFICE DEALS (2016/2017)
START-UP PIPELINE
EDUCATIONAL ATTAINMENT
TECH TALENT DIVERSITY
OFFICE RENT & VACANCY TRENDS
POPULATION TRENDS
Top Regional Universities
CompanyCount
Capital Raised (Millions)
University of Illinois 415 $5,462Northwestern 259 $3,385
VC-Funded Companies Founded by Alumni of Top Regional Universities:Avant, Affirm, ZocDoc, CRISPR Therapeutics, Otonomy
Employment 2016
Growth 2011-16
Average Wage
Growth 2011-16
TOTAL TECH OCCUPATIONS 143,190 32.8% $91,200 11.8%Software Developers & Programmers 44,390 7.9% $95,180 7.7%Computer Support, Database & Systems 77,120 74.7% $82,131 19.1%Computer & Infor. Systems Managers 11,410 11.0% $140,050 21.5%Technology Engineering-Related 10,270 -16.2% $87,830 15.1%
TOTAL NON-TECH OCCUPATIONS 442,650 7.5% $55,496 8.9%Sales 46,910 10.1% $70,887 -2.6%Administrative & Office Support 298,130 2.7% $47,574 10.2%Business Operations & Finance 70,330 25.5% $76,475 6.8%Marketing 27,280 18.5% $61,519 5.3%
Source: U.S. Bureau of Labor Statistics (Metro Area), April 2017.
Tenant Address Sq. Ft.Outcome Health 515 N State St 393,763Paylocity Corporation 1400 American Ln 309,559Echo Global Logistics 600 W Chicago Ave 224,678Cars.com 300 S Riverside Plz 158,000Expedia 500 W Madison St 96,980
Source: CBRE Research (Office Market), 2017.
98% LIVING COST
99% BUSINESS COST
AVERAGE APT. RENT: $1,512 PER UNIT/MO.21% INCREASE SINCE 2011
*Chicago Metro AreaSource: Relative Costs from Moody’s Analytics
(metro area), Q1 2017; Apt, rent data from CBRE EA (City), Q1 2017.
Source: U.S. Census Bureau (City of Chicago), 2016.
The population of millennials in their 20s declined by 6,820 (-1.4%) since 2010. That’s -31.4% in a population of 2,720,556.Age Group
70+ Years60-69 Years50-59 Years40-49 Years30-39 Years20-29 Years10-19 Years
0-9 Years
% Change12.3%19.6%
2.5%-1.5%4.5%
-1.4%-11.3%
-4.6%
37% BACHELOR’S OR HIGHERSource: U.S. Census Bureau (City), 2016.
15 Chicago, IL 51.78
Source: Pitchbook, 2017.
15.0%
$29.68
-50,000 -40,000 -30,000 -20,000 -10,000 0 10,000 20,000 30,000 40,000 50,000
Rent (FSG)Vacancy (%)
Source: CBRE Research, Q1 2017.
Q1 2010 Q1 2012 Q1 2014 Q1 2016Q1 2011 Q1 2013 Q1 2015 Q1 2017
DEGREE COMPLETIONS (2014-2015)
TOTAL TECH DEGREES 6,728 13.6%Computer Engineering 4,514 13.8%Math/Statistics 1,063 3.3%Other Tech Engineering 1,151 23.9%
Growth 2011-15
ChicagoMetro Area
Source: The National Center for Education Statistics (Region), July 2016.
FEMALE
MALE 75%25%
Source: U.S. Census Bureau (Metro Area), 2016.

A17 © 2017 CBRE, Inc.
SCORE
7%
8%
9%
10%
11%
12%
13%
$28
$30
$32
$34
$36
$38
$40
$42
HOUSING & RELATIVE COSTS* (US=100%)
EMPLOYMENT BREAKDOWN
TOP TECH OFFICE DEALS (2017)
START-UP PIPELINE
EDUCATIONAL ATTAINMENT
TECH TALENT DIVERSITY
OFFICE RENT* & VACANCY TRENDS
POPULATION TRENDS
Top Regional Universities
Company Count
Capital Raised (Millions)
University of British Columbia 159 $1,010
VC-Funded Companies Founded by Alumni of Top Regional Universities:N/A
Employment 2016
Growth 2011-16
Average Wage*
Growth 2011-16
TOTAL TECH OCCUPATIONS 65,100 36.8% $79,402 12.8%Software Developers & Programmers 22,000 44.7% $79,518 9.4%Computer Support, Database & Systems 19,900 53.1% $75,046 18.0%Computer & Infor. Systems Managers 6,500 71.1% $94,931 9.7%Technology Engineering-Related 16,700 7.1% $78,395 12.2%
TOTAL NON-TECH OCCUPATIONS 124,700 18.8% $53,127 8.5%Sales 3,300 37.5% $31,574 7.3%Administrative & Office Support 68,900 8.5% $44,949 12.4%Business Operations & Finance 33,800 17.8% $67,371 2.0%Marketing 18,700 79.8% $61,318 0.4%
*in CAD; Source: Statistics Canada (Metro Area), April 2017.
Tenant Address Sq. Ft.Hootsuite 2015 Main St 42,000Visier 858 Beaty St 40,000Image Engine 929 Granville St 38,000Scanline VFX 580 Granville St 36,000Thunderburd Games 123 W 7th St 35,000
Source: CBRE Research (Office Market), 2017.
97% LIVING COST
86% BUSINESS COST
AVERAGE APT. RENT: $1,313 PER UNIT/MO.17% INCREASE SINCE 2010
*Vancouver Metro Area; Data in CADSource: Relative Costs from Moody’s Analytics
(metro area), Q1 2017; Apt, rent data from CBRE EA (City), Q1 2017.
Source: Environics Analytics (Vancouver Metro), 2016.
The population of millennials in their 20s grew by 19,138 (5.3%) since 2010. That’s 10.5% of total growth in a population of 2,526,685.Age Group
70+ Years60-69 Years50-59 Years40-49 Years30-39 Years20-29 Years10-19 Years
0-9 Years
% Change23.3%28.2%11.0%-5.6%11.4%5.3%-5.1%5.3%
32% BACHELOR’S OR HIGHERSource: Statistics Canada (City), 2016.
16 Vancouver, BC 51.40
Source: Pitchbook, 2017.
10.1%
$40.04
-40,000 -20,000 0 20,000 40,000 60,000 80,000
Rent (FSG)Vacancy (%)
Q1 2010 Q1 2012 Q1 2014 Q1 2016Q1 2011 Q1 2013 Q1 2015 Q1 2017
*Rent in CAD; Source: CBRE Research, Q1 2017.
Source: U.S. Census Bureau (Metro Area), 2016.
FEMALE
MALE 76%24%
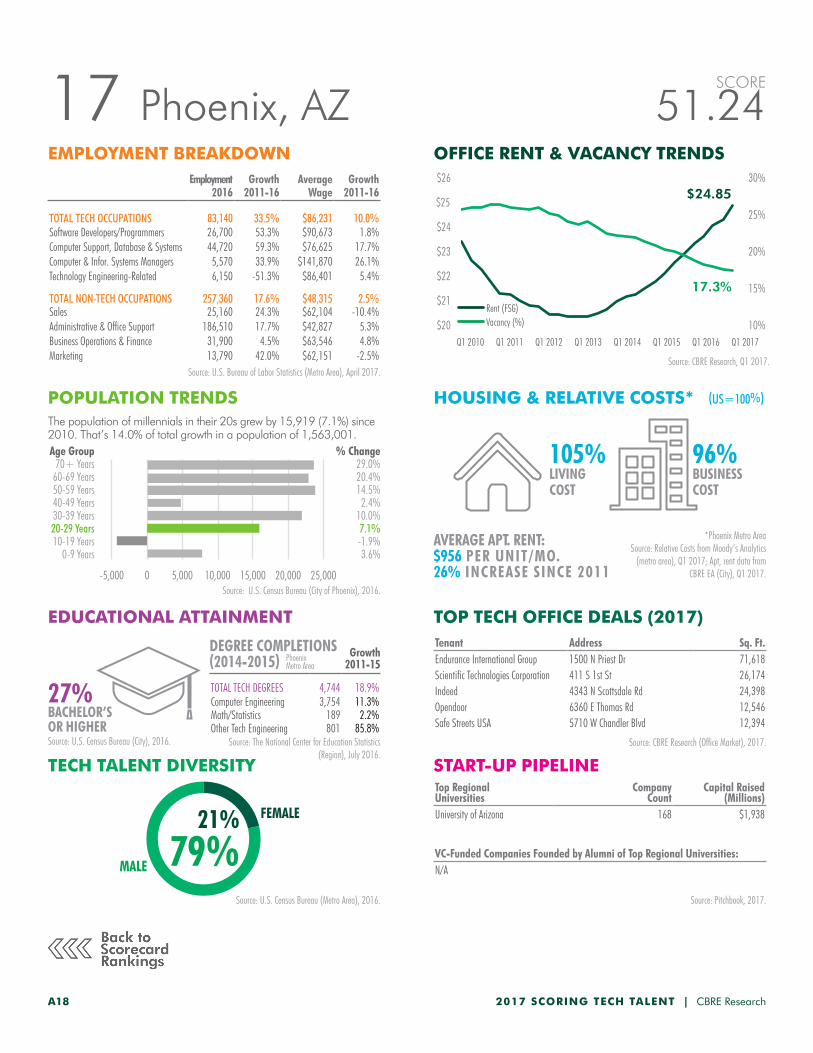
2017 SCORING TECH TALENT | CBRE ResearchA18
SCORE
10%
15%
20%
25%
30%
$20
$21
$22
$23
$24
$25
$26
HOUSING & RELATIVE COSTS* (US=100%)
EMPLOYMENT BREAKDOWN
TOP TECH OFFICE DEALS (2017)
START-UP PIPELINE
EDUCATIONAL ATTAINMENT
TECH TALENT DIVERSITY
OFFICE RENT & VACANCY TRENDS
POPULATION TRENDS
Top Regional Universities
Company Count
Capital Raised (Millions)
University of Arizona 168 $1,938
VC-Funded Companies Founded by Alumni of Top Regional Universities:N/A
Employment 2016
Growth 2011-16
Average Wage
Growth 2011-16
TOTAL TECH OCCUPATIONS 83,140 33.5% $86,231 10.0%Software Developers/Programmers 26,700 53.3% $90,673 1.8%Computer Support, Database & Systems 44,720 59.3% $76,625 17.7%Computer & Infor. Systems Managers 5,570 33.9% $141,870 26.1%Technology Engineering-Related 6,150 -51.3% $86,401 5.4%
TOTAL NON-TECH OCCUPATIONS 257,360 17.6% $48,315 2.5%Sales 25,160 24.3% $62,104 -10.4%Administrative & Office Support 186,510 17.7% $42,827 5.3%Business Operations & Finance 31,900 4.5% $63,546 4.8%Marketing 13,790 42.0% $62,151 -2.5%
Source: U.S. Bureau of Labor Statistics (Metro Area), April 2017.
FEMALE
MALE 79%21%
Source: U.S. Census Bureau (Metro Area), 2016.
Tenant Address Sq. Ft.Endurance International Group 1500 N Priest Dr 71,618Scientific Technologies Corporation 411 S 1st St 26,174Indeed 4343 N Scottsdale Rd 24,398Opendoor 6360 E Thomas Rd 12,546Safe Streets USA 5710 W Chandler Blvd 12,394
Source: CBRE Research (Office Market), 2017.
105% LIVING COST
96% BUSINESS COST
AVERAGE APT. RENT: $956 PER UNIT/MO.26% INCREASE SINCE 2011
*Phoenix Metro AreaSource: Relative Costs from Moody’s Analytics
(metro area), Q1 2017; Apt, rent data from CBRE EA (City), Q1 2017.
Source: U.S. Census Bureau (City of Phoenix), 2016.
The population of millennials in their 20s grew by 15,919 (7.1%) since 2010. That’s 14.0% of total growth in a population of 1,563,001.Age Group
70+ Years60-69 Years50-59 Years40-49 Years30-39 Years20-29 Years10-19 Years
0-9 Years
% Change29.0%20.4%14.5%
2.4%10.0%7.1%-1.9%3.6%
27% BACHELOR’S OR HIGHERSource: U.S. Census Bureau (City), 2016.
17 Phoenix, AZ 51.24
Source: Pitchbook, 2017.
17.3%
$24.85
-10,000 -5,000 0 5,000 10,000 15,000 20,000 25,000 30,000
Rent (FSG)Vacancy (%)
Source: CBRE Research, Q1 2017.
Q1 2010 Q1 2012 Q1 2014 Q1 2016Q1 2011 Q1 2013 Q1 2015 Q1 2017
DEGREE COMPLETIONS (2014-2015)
TOTAL TECH DEGREES 4,744 18.9%Computer Engineering 3,754 11.3%Math/Statistics 189 2.2%Other Tech Engineering 801 85.8%
Growth 2011-15
PhoenixMetro Area
Source: The National Center for Education Statistics (Region), July 2016.
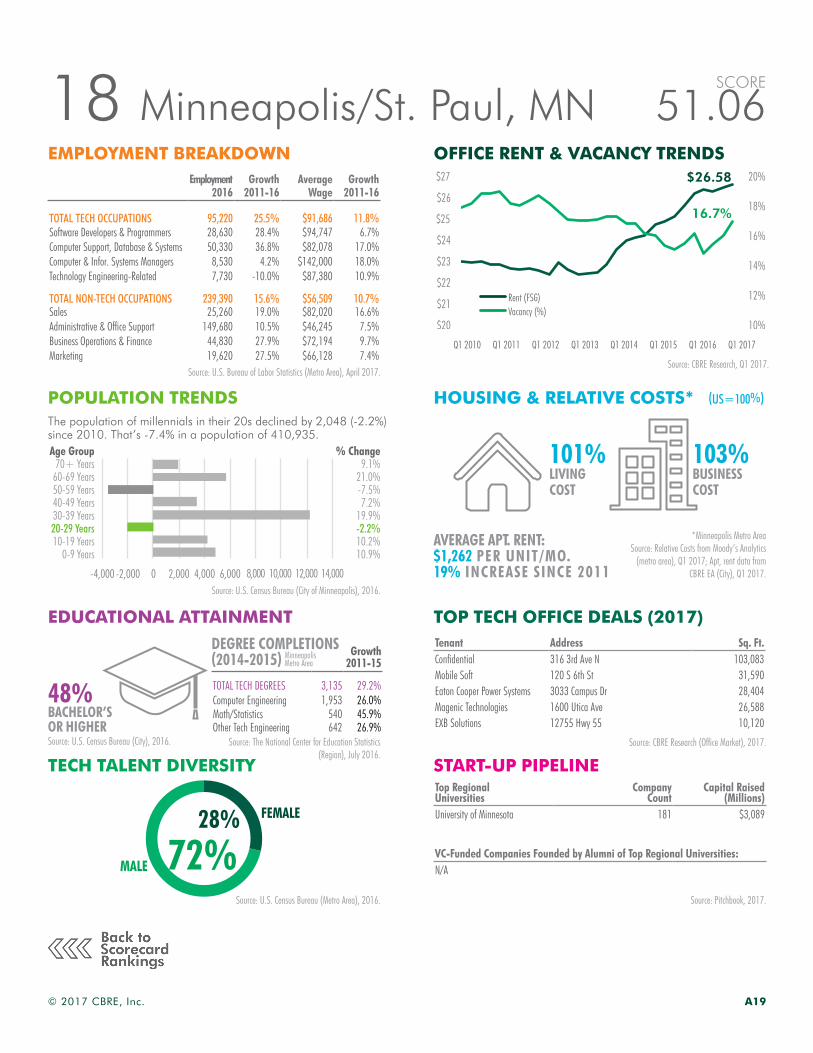
A19 © 2017 CBRE, Inc.
SCORE
10%
12%
14%
16%
18%
20%
$20
$21
$22
$23
$24
$25
$26
$27
HOUSING & RELATIVE COSTS* (US=100%)
EMPLOYMENT BREAKDOWN
TOP TECH OFFICE DEALS (2017)
START-UP PIPELINE
EDUCATIONAL ATTAINMENT
TECH TALENT DIVERSITY
OFFICE RENT & VACANCY TRENDS
POPULATION TRENDS
Top Regional Universities
Company Count
Capital Raised (Millions)
University of Minnesota 181 $3,089
VC-Funded Companies Founded by Alumni of Top Regional Universities:N/A
Employment 2016
Growth 2011-16
Average Wage
Growth 2011-16
TOTAL TECH OCCUPATIONS 95,220 25.5% $91,686 11.8%Software Developers & Programmers 28,630 28.4% $94,747 6.7%Computer Support, Database & Systems 50,330 36.8% $82,078 17.0%Computer & Infor. Systems Managers 8,530 4.2% $142,000 18.0%Technology Engineering-Related 7,730 -10.0% $87,380 10.9%
TOTAL NON-TECH OCCUPATIONS 239,390 15.6% $56,509 10.7%Sales 25,260 19.0% $82,020 16.6%Administrative & Office Support 149,680 10.5% $46,245 7.5%Business Operations & Finance 44,830 27.9% $72,194 9.7%Marketing 19,620 27.5% $66,128 7.4%
Source: U.S. Bureau of Labor Statistics (Metro Area), April 2017.
Tenant Address Sq. Ft.Confidential 316 3rd Ave N 103,083Mobile Soft 120 S 6th St 31,590Eaton Cooper Power Systems 3033 Campus Dr 28,404Magenic Technologies 1600 Utica Ave 26,588EXB Solutions 12755 Hwy 55 10,120
Source: CBRE Research (Office Market), 2017.
101% LIVING COST
103% BUSINESS COST
AVERAGE APT. RENT: $1,262 PER UNIT/MO.19% INCREASE SINCE 2011
*Minneapolis Metro AreaSource: Relative Costs from Moody’s Analytics
(metro area), Q1 2017; Apt, rent data from CBRE EA (City), Q1 2017.
Source: U.S. Census Bureau (City of Minneapolis), 2016.
The population of millennials in their 20s declined by 2,048 (-2.2%) since 2010. That’s -7.4% in a population of 410,935.Age Group
70+ Years60-69 Years50-59 Years40-49 Years30-39 Years20-29 Years10-19 Years
0-9 Years
% Change9.1%
21.0%-7.5%7.2%
19.9%-2.2%10.2%10.9%
48% BACHELOR’S OR HIGHERSource: U.S. Census Bureau (City), 2016.
18 Minneapolis/St. Paul, MN 51.06
Source: Pitchbook, 2017.
16.7%
$26.58
-6,000 -4,000 -2,000 0 2,000 4,000 6,000 8,000 10,000 12,000 14,000
Rent (FSG)Vacancy (%)
Q1 2010 Q1 2012 Q1 2014 Q1 2016Q1 2011 Q1 2013 Q1 2015 Q1 2017
Source: CBRE Research, Q1 2017.
DEGREE COMPLETIONS (2014-2015)
TOTAL TECH DEGREES 3,135 29.2%Computer Engineering 1,953 26.0%Math/Statistics 540 45.9%Other Tech Engineering 642 26.9%
MinneapolisMetro Area
Growth 2011-15
Source: The National Center for Education Statistics (Region), July 2016.
Source: U.S. Census Bureau (Metro Area), 2016.
14,00012,00010,0008,000
FEMALE
MALE 72%28%

2017 SCORING TECH TALENT | CBRE ResearchA20
SCORE
8%
10%
12%
14%
16%
18%
20%
$20
$25
$30
$35
HOUSING & RELATIVE COSTS* (US=100%)
EMPLOYMENT BREAKDOWN
TOP TECH OFFICE DEALS (2017)
START-UP PIPELINE
EDUCATIONAL ATTAINMENT
TECH TALENT DIVERSITY
OFFICE RENT & VACANCY TRENDS
POPULATION TRENDS
Top Regional Universities
Company Count
Capital Raised (Millions)
University of California San Diego 288 $3,424University of California Los Angeles 406 $6,988
VC-Funded Companies Founded by Alumni of Top Regional Universities:N/A
Employment 2016
Growth 2011-16
Average Wage
Growth 2011-16
TOTAL TECH OCCUPATIONS 66,340 27.7% $100,258 13.3%Software Developers/Programmers 23,870 29.9% $102,872 7.5%Computer Support, Database & Systems 23,620 30.5% $84,166 16.0%Computer & Infor. Systems Managers 4,160 16.9% $162,620 21.0%Technology Engineering-Related 14,690 23.1% $104,224 18.5%
TOTAL NON-TECH OCCUPATIONS 158,040 9.6% $52,893 -0.4%Sales 17,180 20.0% $66,958 -9.4%Administrative & Office Support 106,510 6.2% $43,758 -3.5%Business Operations & Finance 22,300 8.8% $78,157 6.8%Marketing 12,050 32.1% $66,827 10.5%
Source: U.S. Bureau of Labor Statistics (Metro Area), April 2017.
Tenant Address Sq. Ft.Broadcom 16340-16470 Brenardo Dr 90,610ServiceNow 4820 Eastgate Mall 63,532XIFIN Inc 12225 El Camino Real 44,121Psyonix 401 W A St 39,127SmartDrive 4790 Eastgate Mall 38,807
Source: CBRE Research (Office Market), 2017.
120% LIVING COST
126% BUSINESS COST
AVERAGE APT. RENT: $1,895 PER UNIT/MO.25% INCREASE SINCE 2011
*San Diego Metro AreaSource: Relative Costs from Moody’s Analytics
(metro area), Q1 2017; Apt, rent data from CBRE EA (City), Q1 2017.
Source: U.S. Census Bureau (City of San Diego), 2016.
The population of millennials in their 20s grew by 3,070 (1.1%) since 2010. That’s 3.7% of total growth in a population of 1,394,907.Age Group
70+ Years60-69 Years50-59 Years40-49 Years30-39 Years20-29 Years10-19 Years
0-9 Years
% Change10.6%28.4%14.8%-4.4%16.5%1.1%
-11.3%6.3%
44% BACHELOR’S OR HIGHER
19 San Diego, CA 50.83
Source: Pitchbook, 2017.
11.5%
$33.52
-30,000 -20,000 -10,000 0 10,000 20,000 30,000 40,000
Rent (FSG)Vacancy (%)
Source: CBRE Research, Q1 2017.
Q1 2010 Q1 2012 Q1 2014 Q1 2016Q1 2011 Q1 2013 Q1 2015 Q1 2017
Source: U.S. Census Bureau (City), 2016.
DEGREE COMPLETIONS (2014-2015)
TOTAL TECH DEGREES 2,734 22.9%Computer Engineering 1,634 27.4%Math/Statistics 378 8.0%Other Tech Engineering 722 22.0%
Growth 2011-15
San DiegoMetro Area
Source: The National Center for Education Statistics (Region), July 2016.
FEMALE
MALE 75%25%
Source: U.S. Census Bureau (Metro Area), 2016.

A21 © 2017 CBRE, Inc.
SCORE
8%
10%
12%
14%
16%
18%
$15 $16 $17 $18 $19 $20 $21 $22 $23 $24 $25 $26 $27 $28
HOUSING & RELATIVE COSTS* (US=100%)
EMPLOYMENT BREAKDOWN
TOP TECH OFFICE DEALS (2016/2017)
START-UP PIPELINE
EDUCATIONAL ATTAINMENT
TECH TALENT DIVERSITY
OFFICE RENT & VACANCY TRENDS
POPULATION TRENDS
Top Regional Universities
Company Count
Capital Raised (Millions)
N/A N/A N/A
VC-Funded Companies Founded by Alumni of Top Regional Universities:N/A
Employment 2016
Growth 2011-16
Average Wage
Growth 2011-16
TOTAL TECH OCCUPATIONS 50,880 40.4% $90,040 12.9%Software Developers/Programmers 20,410 92.4% $94,990 7.6%Computer Support, Database & Systems 21,320 38.0% $77,554 11.8%Computer & Infor. Systems Managers 4,160 46.5% $132,420 16.3%Technology Engineering-Related 4,990 -31.9% $87,805 15.3%
TOTAL NON-TECH OCCUPATIONS 129,530 15.5% $51,674 6.3%Sales 11,680 12.2% $68,977 -13.2%Administrative & Office Support 88,590 11.5% $44,216 11.5%Business Operations & Finance 19,620 18.6% $68,998 2.8%Marketing 9,640 66.8% $63,992 1.4%
Source: U.S. Bureau of Labor Statistics (Metro Area), April 2017.
Tenant Address Sq. Ft.Autodesk 17 SE 3rd Street 108,750Simple 120 SE Clay St 53,000D+H 1320 SW Broadway 45,600Expensify 401 SW 5th Ave 24,400Cloudability 334 NW 11th Avenue 22,600
Source: CBRE Research (Office Market), 2017.
108% LIVING COST
96% BUSINESS COST
AVERAGE APT. RENT: $1,370 PER UNIT/MO.39% INCREASE SINCE 2011
*Portland Metro AreaSource: Relative Costs from Moody’s Analytics
(metro area), Q1 2017; Apt, rent data from CBRE EA (City), Q1 2017.
Source: Environics Analytics (City of Portland), 2016.
The population of millennials in their 20s grew by 1,182 (1.2%) since 2010. That’s 2.5% of total growth in a population of 632,187.Age Group
70+ Years60-69 Years50-59 Years40-49 Years30-39 Years20-29 Years10-19 Years
0-9 Years
% Change5.1%
40.1%-4.5%8.8%
23.5%1.2%-3.8%5.2%
49% BACHELOR’S OR HIGHER
20 Portland, OR 49.88
Source: Pitchbook, 2017.
$26.87
11.2%
-5,000 0 5,000 10,000 15,000 20,000 25,000 30,000
Rent (FSG)Vacancy (%)
Q1 2010 Q1 2012 Q1 2014 Q1 2016Q1 2011 Q1 2013 Q1 2015 Q1 2017
Source: CBRE Research, Q1 2017.
Source: U.S. Census Bureau (City), 2016.
DEGREE COMPLETIONS (2014-2015)
TOTAL TECH DEGREES 1,813 39.2%Computer Engineering 988 43.2%Math/Statistics 350 15.5%Other Tech Engineering 475 53.7%
PortlandMetro Area
Growth 2011-15
Source: The National Center for Education Statistics (Region), July 2016.
FEMALE
MALE 75%25%
Source: U.S. Census Bureau (Metro Area), 2016.

2017 SCORING TECH TALENT | CBRE ResearchA22
SCORE
15%
20%
25%
30%
$16
$17
$18
$19
HOUSING & RELATIVE COSTS* (US=100%)
EMPLOYMENT BREAKDOWN
TOP TECH OFFICE DEALS (2016/2017)
START-UP PIPELINE
EDUCATIONAL ATTAINMENT
TECH TALENT DIVERSITY
OFFICE RENT & VACANCY TRENDS
POPULATION TRENDS
Top Regional Universities
Company Count
Capital Raised (Millions)
University of Michigan 546 $7,767
VC-Funded Companies Founded by Alumni of Top Regional Universities:Groupon, Medalia, Twilio, 23andMe, Calera
Employment 2016
Growth 2011-16
Average Wage
Growth 2011-16
TOTAL TECH OCCUPATIONS 78,510 40.7% $83,482 9.4%Software Developers & Programmers 24,500 38.3% $85,165 7.7%Computer Support, Database & Systems 36,960 36.0% $76,437 18.2%Computer & Infor. Systems Managers 5,080 54.9% $135,517 -13.2%Technology Engineering-Related 11,970 56.9% $79,709 3.6%
TOTAL NON-TECH OCCUPATIONS 229,180 18.9% $54,098 8.2%Sales 21,940 71.8% $75,798 -3.0%Administrative & Office Support 163,050 13.8% $46,090 5.7%Business Operations & Finance 31,110 11.1% $75,322 13.7%Marketing 13,080 50.5% $67,047 8.7%
Source: U.S. Bureau of Labor Statistics (Metro Area), April 2017.
FEMALE
MALE 76%24%
Source: U.S. Census Bureau (Metro Area), 2016.
Tenant Address Sq. Ft.Confidential 1 Campus Martius Ave 40,000Tyco Electronics 900 Wilshire Dr 15,954HERE 400 Galleria 52,000Netlink 6322 Progress Dr 32,120EWI Worldwide 27777 Inkster Rd 31,428
Source: CBRE Research (Office Market), 2017.
92% LIVING COST
94% BUSINESS COST
AVERAGE APT. RENT: $958 PER UNIT/MO.18% INCREASE SINCE 2011
*Detroit Metro AreaSource: Relative Costs from Moody’s Analytics
(metro area), Q1 2017; Apt, rent data from CBRE EA (City), Q1 2017.
Source: U.S. Census Bureau (City of Detroit and Macomb/Oakland Counties), 2016.
The population of millennials in their 20s grew by 32,028 (9.2%) since 2010. That’s 113.5% of total growth in a population of 2,784,268.Age Group
70+ Years60-69 Years50-59 Years40-49 Years30-39 Years20-29 Years10-19 Years
0-9 Years
% Change9.0%
27.2%3.2%
-6.9%-0.6%9.2%
-11.8%-6.4%
22% BACHELOR’S OR HIGHER
21 Detroit, MI 49.34
Source: Pitchbook, 2017.
16.7%
$18.40
-60,000 -40,000 -20,000 0 20,000 40,000 60,000 80,000
Rent (FSG)Vacancy (%)
Source: CBRE Research, Q1 2017.
Q1 2010 Q1 2012 Q1 2014 Q1 2016Q1 2011 Q1 2013 Q1 2015 Q1 2017
Source: U.S. Census Bureau (City), 2016.
DEGREE COMPLETIONS (2014-2015)
TOTAL TECH DEGREES 4,608 21.0%Computer Engineering 2,233 35.1%Math/Statistics 591 31.3%Other Tech Engineering 1,784 4.6%
Growth 2011-15
DetroitMetro Area
Source: The National Center for Education Statistics (Region), July 2016.
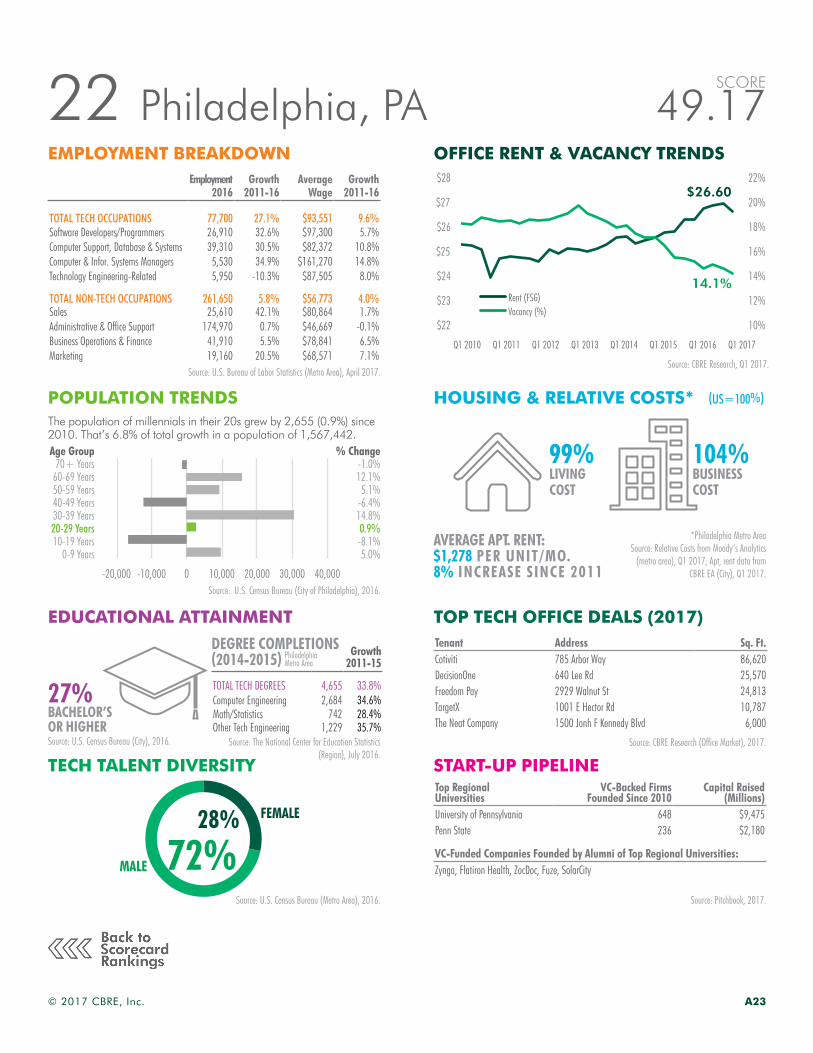
A23 © 2017 CBRE, Inc.
SCORE
10%
12%
14%
16%
18%
20%
22%
$22
$23
$24
$25
$26
$27
$28
HOUSING & RELATIVE COSTS* (US=100%)
EMPLOYMENT BREAKDOWN
TOP TECH OFFICE DEALS (2017)
START-UP PIPELINE
EDUCATIONAL ATTAINMENT
TECH TALENT DIVERSITY
OFFICE RENT & VACANCY TRENDS
POPULATION TRENDS
Top Regional Universities
VC-Backed Firms Founded Since 2010
Capital Raised (Millions)
University of Pennsylvania 648 $9,475Penn State 236 $2,180
VC-Funded Companies Founded by Alumni of Top Regional Universities:Zynga, Flatiron Health, ZocDoc, Fuze, SolarCity
Employment 2016
Growth 2011-16
Average Wage
Growth 2011-16
TOTAL TECH OCCUPATIONS 77,700 27.1% $93,551 9.6%Software Developers/Programmers 26,910 32.6% $97,300 5.7%Computer Support, Database & Systems 39,310 30.5% $82,372 10.8%Computer & Infor. Systems Managers 5,530 34.9% $161,270 14.8%Technology Engineering-Related 5,950 -10.3% $87,505 8.0%
TOTAL NON-TECH OCCUPATIONS 261,650 5.8% $56,773 4.0%Sales 25,610 42.1% $80,864 1.7%Administrative & Office Support 174,970 0.7% $46,669 -0.1%Business Operations & Finance 41,910 5.5% $78,841 6.5%Marketing 19,160 20.5% $68,571 7.1%
Source: U.S. Bureau of Labor Statistics (Metro Area), April 2017.
FEMALE
MALE 72%28%
Source: U.S. Census Bureau (Metro Area), 2016.
Tenant Address Sq. Ft.Cotiviti 785 Arbor Way 86,620DecisionOne 640 Lee Rd 25,570Freedom Pay 2929 Walnut St 24,813TargetX 1001 E Hector Rd 10,787The Neat Company 1500 Jonh F Kennedy Blvd 6,000
Source: CBRE Research (Office Market), 2017.
99% LIVING COST
104% BUSINESS COST
AVERAGE APT. RENT: $1,278 PER UNIT/MO.8% INCREASE SINCE 2011
*Philadelphia Metro AreaSource: Relative Costs from Moody’s Analytics
(metro area), Q1 2017; Apt, rent data from CBRE EA (City), Q1 2017.
Source: U.S. Census Bureau (City of Philadelphia), 2016.
The population of millennials in their 20s grew by 2,655 (0.9%) since 2010. That’s 6.8% of total growth in a population of 1,567,442.Age Group
70+ Years60-69 Years50-59 Years40-49 Years30-39 Years20-29 Years10-19 Years
0-9 Years
% Change-1.0%12.1%
5.1%-6.4%14.8%0.9%-8.1%5.0%
27% BACHELOR’S OR HIGHER
22 Philadelphia, PA 49.17
Source: Pitchbook, 2017.
14.1%
$26.60
-20,000 -10,000 0 10,000 20,000 30,000 40,000
Rent (FSG)Vacancy (%)
Q1 2010 Q1 2012 Q1 2014 Q1 2016Q1 2011 Q1 2013 Q1 2015 Q1 2017
Source: CBRE Research, Q1 2017.
Source: U.S. Census Bureau (City), 2016.
DEGREE COMPLETIONS (2014-2015)
TOTAL TECH DEGREES 4,655 33.8%Computer Engineering 2,684 34.6%Math/Statistics 742 28.4%Other Tech Engineering 1,229 35.7%
PhiladelphiaMetro Area
Growth 2011-15
Source: The National Center for Education Statistics (Region), July 2016.

2017 SCORING TECH TALENT | CBRE ResearchA24
SCORE
9%
11%
13%
15%
17%
19%
$18
$19
$20
$21
$22
$23
$24
$25
HOUSING & RELATIVE COSTS* (US=100%)
EMPLOYMENT BREAKDOWN
TOP TECH OFFICE DEALS (2016/2017)
START-UP PIPELINE
EDUCATIONAL ATTAINMENT
TECH TALENT DIVERSITY
OFFICE RENT & VACANCY TRENDS
POPULATION TRENDS
Top Regional Universities
CompanyCount
Capital Raised (Millions)
Brigham Young 255 $3,692
VC-Funded Companies Founded by Alumni of Top Regional Universities:N/A
Employment 2016
Growth 2011-16
Average Wage
Growth 2011-16
TOTAL TECH OCCUPATIONS 31,750 45.3% $82,803 13.2%Software Developers/Programmers 12,130 59.0% $91,508 8.0%Computer Support, Database & Systems 13,440 29.6% $68,594 13.5%Computer & Infor. Systems Managers 2,810 111.3% $108,170 -5.2%Technology Engineering-Related 3,370 33.7% $86,983 26.5%
TOTAL NON-TECH OCCUPATIONS 105,970 18.8% $47,138 8.0%Sales 12,440 20.0% $63,018 1.7%Administrative & Office Support 73,770 17.2% $39,671 9.3%Business Operations & Finance 13,790 20.3% $67,906 5.8%Marketing 5,970 33.9% $58,340 11.6%
Source: U.S. Bureau of Labor Statistics (Metro Area), April 2017.
Tenant Address Sq. Ft.U of Utah Information Tech Services 102 S 200 E 140,000Lucid Software 10355 S South Jordan Parkway 90,000Connexion Point 9500 S 300 W 75,000Imagine Learning 400 Qualtrics Dr 75,000Instructure Pleasant Grove Blvd 65,000
Source: CBRE Research (Office Market), 2017.
106% LIVING COST
88% BUSINESS COST
AVERAGE APT. RENT: $1,044 PER UNIT/MO.28% INCREASE SINCE 2011
*Salt Lake City Metro AreaSource: Relative Costs from Moody’s Analytics
(metro area), Q1 2017; Apt, rent data from CBRE EA (City), Q1 2017.
Source: U.S. Census Bureau (City of Salt Lake City), 2016.
The population of millennials in their 20s grew by 3,246 (8.4%) since 2010. That’s 59.6% of total growth in a population of 192,660.Age Group
70+ Years60-69 Years50-59 Years40-49 Years30-39 Years20-29 Years10-19 Years
0-9 Years
% Change1.5%
21.7%20.7%
0.0%9.8%8.4%
-17.7%-14.7%
44% BACHELOR’S OR HIGHER
23 Salt Lake City, UT 49.12
Source: Pitchbook, Q3 2015.
11.6%
$23.74
-5,000 -4,000 -3,000 -2,000 -1,000 0 1,000 2,000 3,000 4,000
Rent (FSG)Vacancy (%)
Source: CBRE Research, Q1 2017.
Q1 2010 Q1 2012 Q1 2014 Q1 2016Q1 2011 Q1 2013 Q1 2015 Q1 2017
Source: U.S. Census Bureau (City), 2016.
DEGREE COMPLETIONS (2014-2015)
TOTAL TECH DEGREES 3,586 91.0%Computer Engineering 2,856 127.6%Math/Statistics 316 45.0%Other Tech Engineering 414 2.5%
Growth 2011-15
Salt Lake CityMetro Area
Source: The National Center for Education Statistics (Region), July 2016.
FEMALE
MALE 79%21%
Source: U.S. Census Bureau (Metro Area), 2016.
-5,000 -3,000-4,000 -1,000-2,000
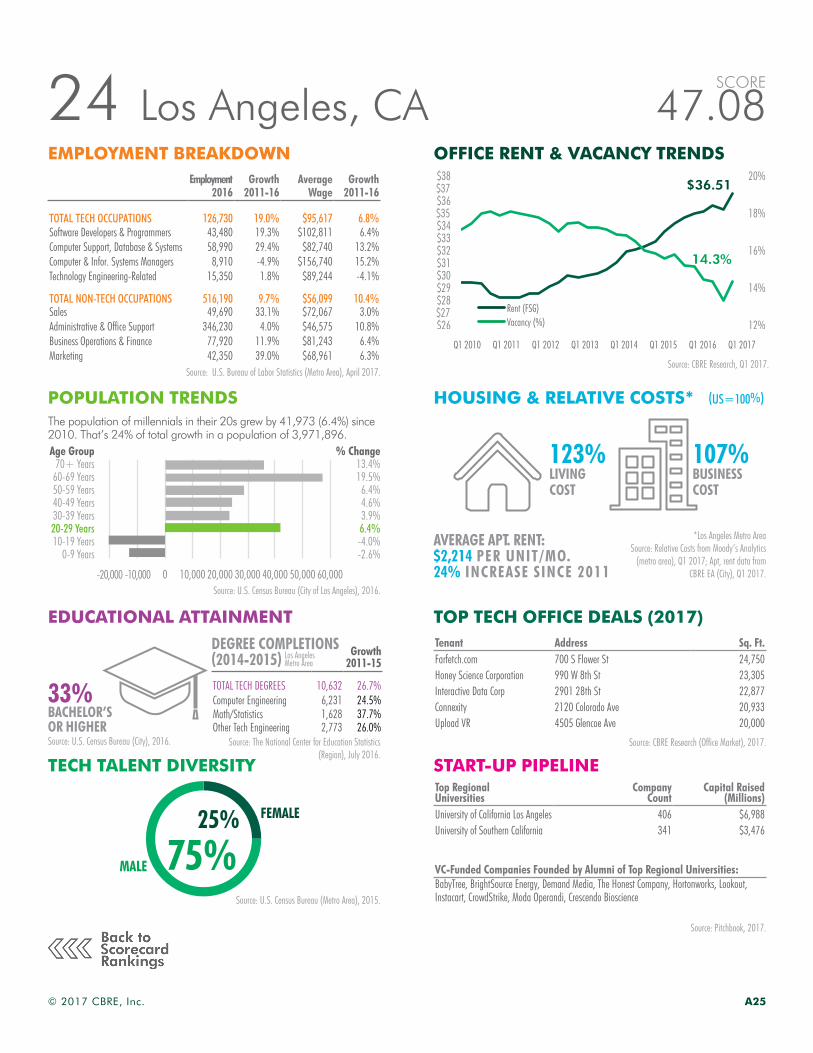
A25 © 2017 CBRE, Inc.
SCORE
12%
14%
16%
18%
20%
$26 $27 $28 $29 $30 $31 $32 $33 $34 $35 $36 $37 $38
HOUSING & RELATIVE COSTS* (US=100%)
EMPLOYMENT BREAKDOWN
TOP TECH OFFICE DEALS (2017)
START-UP PIPELINE
EDUCATIONAL ATTAINMENT
TECH TALENT DIVERSITY
OFFICE RENT & VACANCY TRENDS
POPULATION TRENDS
Top Regional Universities
Company Count
Capital Raised (Millions)
University of California Los Angeles 406 $6,988University of Southern California 341 $3,476
VC-Funded Companies Founded by Alumni of Top Regional Universities:BabyTree, BrightSource Energy, Demand Media, The Honest Company, Hortonworks, Lookout, Instacart, CrowdStrike, Moda Operandi, Crescendo Bioscience
Employment 2016
Growth 2011-16
Average Wage
Growth 2011-16
TOTAL TECH OCCUPATIONS 126,730 19.0% $95,617 6.8%Software Developers & Programmers 43,480 19.3% $102,811 6.4%Computer Support, Database & Systems 58,990 29.4% $82,740 13.2%Computer & Infor. Systems Managers 8,910 -4.9% $156,740 15.2%Technology Engineering-Related 15,350 1.8% $89,244 -4.1%
TOTAL NON-TECH OCCUPATIONS 516,190 9.7% $56,099 10.4%Sales 49,690 33.1% $72,067 3.0%Administrative & Office Support 346,230 4.0% $46,575 10.8%Business Operations & Finance 77,920 11.9% $81,243 6.4%Marketing 42,350 39.0% $68,961 6.3%
Source: U.S. Bureau of Labor Statistics (Metro Area), April 2017.
FEMALE
MALE 75%25%
Source: U.S. Census Bureau (Metro Area), 2015.
Tenant Address Sq. Ft.Farfetch.com 700 S Flower St 24,750Honey Science Corporation 990 W 8th St 23,305Interactive Data Corp 2901 28th St 22,877Connexity 2120 Colorado Ave 20,933Upload VR 4505 Glencoe Ave 20,000
Source: CBRE Research (Office Market), 2017.
123% LIVING COST
107% BUSINESS COST
AVERAGE APT. RENT: $2,214 PER UNIT/MO.24% INCREASE SINCE 2011
*Los Angeles Metro AreaSource: Relative Costs from Moody’s Analytics
(metro area), Q1 2017; Apt, rent data from CBRE EA (City), Q1 2017.
Source: U.S. Census Bureau (City of Los Angeles), 2016.
The population of millennials in their 20s grew by 41,973 (6.4%) since 2010. That’s 24% of total growth in a population of 3,971,896.Age Group
70+ Years60-69 Years50-59 Years40-49 Years30-39 Years20-29 Years10-19 Years
0-9 Years
% Change13.4%19.5%
6.4%4.6%3.9%6.4%-4.0%-2.6%
33% BACHELOR’S OR HIGHER
24 Los Angeles, CA 47.08
Source: Pitchbook, 2017.
14.3%
$36.51
-30,000 -20,000 -10,000 0 10,000 20,000 30,000 40,000 50,000 60,000 70,000
Rent (FSG)Vacancy (%)
Q1 2010 Q1 2012 Q1 2014 Q1 2016Q1 2011 Q1 2013 Q1 2015 Q1 2017
Source: CBRE Research, Q1 2017.
Source: U.S. Census Bureau (City), 2016.
DEGREE COMPLETIONS (2014-2015)
TOTAL TECH DEGREES 10,632 26.7%Computer Engineering 6,231 24.5%Math/Statistics 1,628 37.7%Other Tech Engineering 2,773 26.0%
Los AngelesMetro Area
Growth 2011-15
Source: The National Center for Education Statistics (Region), July 2016.
-10,000-20,000

2017 SCORING TECH TALENT | CBRE ResearchA26
SCORE
4%
6%
8%
10%
12%
14%
$15
$16
$17
$18
$19
$20
HOUSING & RELATIVE COSTS* (US=100%)
EMPLOYMENT BREAKDOWN
TOP TECH OFFICE DEALS (2017)
START-UP PIPELINE
EDUCATIONAL ATTAINMENT
TECH TALENT DIVERSITY
OFFICE RENT & VACANCY TRENDS
POPULATION TRENDS
Top Regional Universities
Company Count
Capital Raised (Millions)
N/A
VC-Funded Companies Founded by Alumni of Top Regional Universities:N/A
Employment 2016
Growth 2011-16
Average Wage
Growth 2011-16
TOTAL TECH OCCUPATIONS 23,350 51.2% $77,773 8.8%Software Developers/Programmers 9,490 115.2% $79,344 -2.1%Computer Support, Database & Systems 10,860 31.0% $70,379 13.8%Computer & Infor. Systems Managers 1,600 8.1% $117,370 19.5%Technology Engineering-Related 1,400 11.1% $79,218 13.6%
TOTAL NON-TECH OCCUPATIONS 48,420 15.9% $54,052 13.5%Sales 3,470 1.5% $72,705 2.7%Administrative & Office Support 31,840 8.3% $48,480 15.8%Business Operations & Finance 8,570 36.2% $64,394 9.2%Marketing 4,540 70.7% $59,354 8.7%
Source: U.S. Bureau of Labor Statistics (Metro Area), April 2017.
Tenant Address Sq. Ft.Performance Gateway 2418 Crossroads Dr 5,533ScheduleSoft 301 S Blount St 3,861Stealthbits 555 D'Onofrio Dr 3,094
Source: CBRE Research (Office Market), 2017.
101% LIVING COST
95% BUSINESS COST
AVERAGE APT. RENT: $1,137 PER UNIT/MO.17% INCREASE SINCE 2011
*Madison Metro AreaSource: Relative Costs from Moody’s Analytics
(metro area), Q1 2017; Apt, rent data from CBRE EA (City), Q1 2017.
Source: U.S. Census Bureau (City of Madison), 2016.
The population of millennials in their 20s grew by 4,490 (7.3%) since 2010. That’s 29.6% of total growth in a population of 248,956.Age Group
70+ Years60-69 Years50-59 Years40-49 Years30-39 Years20-29 Years10-19 Years
0-9 Years
% Change14.8%23.3%
-10.9%0.7%
12.3%7.3%3.9%
-0.3%
55% BACHELOR’S OR HIGHER
25 Madison, WI 46.91
Source: Pitchbook, 2017.
8.0%
$19.40
-4,000 -3,000 -2,000 -1,000 0 1,000 2,000 3,000 4,000 5,000
Rent (FSG)Vacancy (%)
Source: CBRE Research, Q1 2017.
Q1 2010 Q1 2012 Q1 2014 Q1 2016Q1 2011 Q1 2013 Q1 2015 Q1 2017
Source: U.S. Census Bureau (City), 2016.
DEGREE COMPLETIONS (2014-2015)
TOTAL TECH DEGREES 1,592 31.6%Computer Engineering 692 51.1%Math/Statistics 293 55.9%Other Tech Engineering 607 7.6%
Growth 2011-15
MadisonMetro Area
Source: The National Center for Education Statistics (Region), July 2016.
FEMALE
MALE 73%27%
Source: U.S. Census Bureau (Metro Area), 2016.
-1,000-2,000-3,000-4,000

A27 © 2017 CBRE, Inc.
SCORE
0%
5%
10%
15%
20%
25%
$0
$5
$10
$15
$20
$25
$30
HOUSING & RELATIVE COSTS* (US=100%)
EMPLOYMENT BREAKDOWN
TOP TECH OFFICE DEALS (2017)
START-UP PIPELINE
EDUCATIONAL ATTAINMENT
TECH TALENT DIVERSITY
OFFICE RENT & VACANCY TRENDS
POPULATION TRENDS
Top Regional Universities
Company Count
Capital Raised (Millions)
N/A
VC-Funded Companies Founded by Alumni of Top Regional Universities:N/A
Employment 2016
Growth 2011-16
Average Wage
Growth 2011-16
TOTAL TECH OCCUPATIONS 49,830 77.1% $93,105 8.0%Software Developers & Programmers 15,250 73.1% $98,688 9.1%Computer Support, Database & Systems 26,650 103.1% $80,861 10.4%Computer & Infor. Systems Managers 4,800 31.1% $143,110 10.6%Technology Engineering-Related 3,130 22.7% $93,464 22.8%
TOTAL NON-TECH OCCUPATIONS 137,390 29.7% $51,879 10.9%Sales 14,980 54.3% $70,676 9.4%Administrative & Office Support 97,150 32.1% $42,711 12.5%Business Operations & Finance 22,020 28.8% $78,916 12.4%Marketing 3,240 -41.8% $56,111 -7.2%
Source: U.S. Bureau of Labor Statistics (Metro Area), April 2017.
Tenant Address Sq. Ft.AvidXchange 935 Hamilton St 200,000Fidelity Information Services 2359 Perimeter Pointe Pkwy 23,196IBM 10925 David Taylor Dr 21,461FANUC America 13425 W Reese Blvd 21,217Comp Tech Systems 3426 Toringdon Way 7,364
Source: CBRE Research (Office Market), 2017.
99% LIVING COST
89% BUSINESS COST
AVERAGE APT. RENT: $1,032 PER UNIT/MO.24% INCREASE SINCE 2011
*Charlotte Metro AreaSource: Relative Costs from Moody’s Analytics
(metro area), Q1 2017; Apt, rent data from CBRE EA (City), Q1 2017.
Source: U.S. Census Bureau (City of Charlotte), 2016.
The population of millennials in their 20s grew by 16,123 (13.3%) since 2010. That’s 17.4% of total growth in a population of 827,121.Age Group
70+ Years60-69 Years50-59 Years40-49 Years30-39 Years20-29 Years10-19 Years
0-9 Years
% Change22.2%38.0%16.5%11.8%
9.3%13.3%
8.4%1.3%
42% BACHELOR’S OR HIGHER
26 Charlotte, NC 46.29
Source: Pitchbook, 2017.
8.1%
$24.55
0 5,000 10,000 15,000 20,000 25,000
Rent (FSG)Vacancy (%)
Q1 2010 Q1 2012 Q1 2014 Q1 2016Q1 2011 Q1 2013 Q1 2015 Q1 2017
Source: CBRE Research, Q1 2017.
Source: U.S. Census Bureau (City), 2016.
DEGREE COMPLETIONS (2014-2015)
TOTAL TECH DEGREES 1,107 50.4%Computer Engineering 660 48.6%Math/Statistics 224 60.0%Other Tech Engineering 223 46.7%
CharlotteMetro Area
Growth 2011-15
Source: The National Center for Education Statistics (Region), July 2016.
FEMALE
MALE 75%25%
Source: U.S. Census Bureau (Metro Area), 2015.

2017 SCORING TECH TALENT | CBRE ResearchA28
SCORE
HOUSING & RELATIVE COSTS* (US=100%)
TOP TECH OFFICE DEALS (2017)EMPLOYMENT BREAKDOWN
POPULATION TRENDS
OFFICE RENT & VACANCY TRENDS
LABOR POOLTECH DIVERSITY
45.17
95% LIVING COST
95% BUSINESS COST
Tenant Address Sq. Ft.Pillar Technology Group, LLC 711 N High St 25,000BarkBox 445 N High St 12,976Illumination Works, LLC 5550 Blazer Memorial Pkwy 4,545
AVERAGE APT. RENT: $874 PER UNIT/MO.19% INCREASE SINCE 2011
Employment 2016
Growth 2011-16
Average Wage
Growth 2011-16
TOTAL TECH TALENT 48,230 12.9% $92,510 20.1%Software Developers & Programmers 16,080 17.0% $100,410 22.2%Computer Support, Database & Systems 25,700 14.2% $81,378 18.5%Computer & Infor. Systems Managers 3,720 11.0% $148,050 22.4%Technology Engineering-Related 2,730 -12.5% $75,092 11.5%
TOTAL NON-TECH TALENT 127,930 9.7% $50,909 5.0%Sales 11,740 21.4% $75,432 12.8%Administrative & Office Support 86,300 6.0% $42,129 0.6%Business Operations & Finance 21,770 15.9% $67,890 6.4%Marketing 8,120 20.3% $63,237 6.8%
The population of millennials in their 20s grew by 10,423 (6.4%) since 2010. That’s 17.6% of total growth in a population of 849,067.
Asking Rent: $19.23 PSF (up 10.5%); Vacancy: 12.3% (down -590 bps) (Q1 2017 data with change since Q1 2012)
Source: U.S. Bureau of Labor Statistics (Metro Area), April 2017.
Source: U.S. Census Bureau (City of Columbus), 2016.
Source: CBRE Research (Office Market), Q1 2017.
Source: CBRE Research (Office Market), 2017.
*Columbus Metro AreaSource: Relative Costs from Moody’s Analytics (metro area), Q1 2017; Apt, rent data from CBRE EA (City), Q1 2017.
FEMALE
MALE75%
25%
Source: U.S. Census Bureau (Metro Area), 2016..
28 Columbus, OH
SCORE
HOUSING & RELATIVE COSTS* (US=100%)
TOP TECH OFFICE DEALS (2017)EMPLOYMENT BREAKDOWN
POPULATION TRENDS
OFFICE RENT & VACANCY TRENDS
LABOR POOLTECH DIVERSITYEDUCATION
ATTAINMENT
100% LIVING COST
99% BUSINESS COST
Tenant Address Sq. Ft.Intelligent Software Solutions 5100 W Lemon St 4,196Lockheed Martin 101 E Kennedy Blvd 2,721Xcirca 410 S Ware Blvd 1,459
AVERAGE APT. RENT: $1,113 PER UNIT/MO.23% INCREASE SINCE 2011
Employment 2016
Growth 2011-16
Average Wage
Growth 2011-16
TOTAL TECH TALENT 45,340 55.3% $78,434 6.2%Software Developers & Programmers 14,220 39.0% $85,872 7.1%Computer Support, Database & Systems 25,340 81.3% $68,996 5.2%Computer & Infor. Systems Managers 2,210 33.1% $145,440 15.4%Technology Engineering-Related 3,570 7.2% $74,321 17.8%
TOTAL NON-TECH TALENT 191,860 20.9% $45,918 10.9%Sales 19,530 16.5% $63,874 1.4%Administrative & Office Support 140,720 23.1% $38,953 13.3%Business Operations & Finance 23,250 5.4% $67,512 14.0%Marketing 8,360 48.2% $61,162 22.2%
The population of millennials in their 20s grew by 3,673 (6.3%) since 2010. That’s 11.4% of total growth in a population of 369,028.
Asking Rent: $22.67 PSF (up 14.8%); Vacancy: 11.2% (down -920 bps) (Q1 2017 data with change since Q1 2012)
Source: U.S. Bureau of Labor Statistics (Metro Area), April 2017.
Source: U.S. Census Bureau (City of Tampa), 2016.
Source: CBRE Research (Office Market), Q1 2017.
Source: CBRE Research (Office Market), 2017.
*Tampa MSASource: Relative Costs from Moody’s Analytics (metro area), Q1 2017; Apt, rent data from CBRE EA (City), Q1 2017.
DEGREE COMPLETIONS (2014-2015)
TOTAL TECH DEGREES 1,324 35.2%Computer Engineering 976 47.2%Math/Statistics 119 43.4%Other Tech Engineering 229 -1.7%
36% BACHELOR’S OR HIGHER
FEMALE
MALE73%
27%
Source: U.S. Census Bureau (Metro Area), 2016.
Source: The National Center for Education Statistics (Region), July 2016.
Tampa Metro area
27 Tampa, FL 45.48
Source: U.S. Census Bureau (City), 2016.
Growth 2011-15
EDUCATION ATTAINMENT
DEGREE COMPLETIONS (2014-2015)
TOTAL TECH DEGREES 2,068 25.7%Computer Engineering 1,042 30.3%Math/Statistics 246 35.9%Other Tech Engineering 780 17.5%
35% BACHELOR’S OR HIGHER
Source: The National Center for Education Statistics (Region), July 2016.
Columbus Metro area
Source: U.S. Census Bureau (City), 2016.
Growth 2011-15
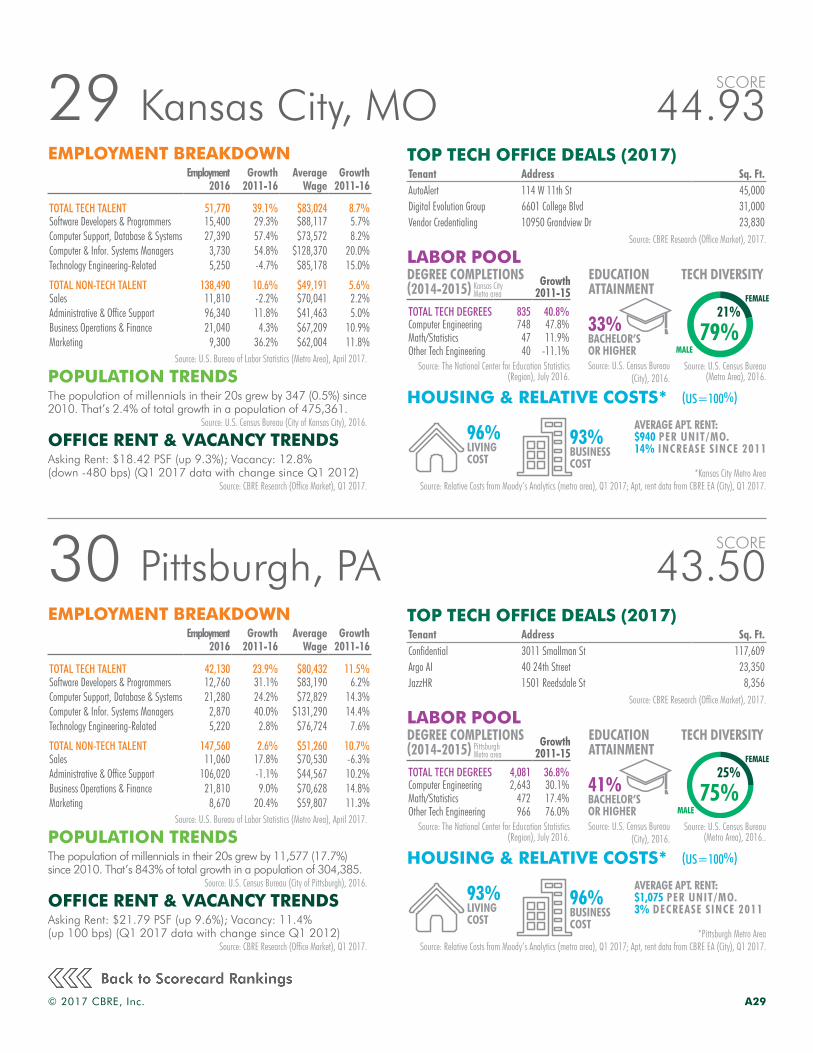
A29 © 2017 CBRE, Inc.
SCORE
HOUSING & RELATIVE COSTS* (US=100%)
TOP TECH OFFICE DEALS (2017)EMPLOYMENT BREAKDOWN
POPULATION TRENDS
OFFICE RENT & VACANCY TRENDS
LABOR POOLTECH DIVERSITY
43.50
93% LIVING COST
96% BUSINESS COST
Tenant Address Sq. Ft.Confidential 3011 Smallman St 117,609Argo AI 40 24th Street 23,350JazzHR 1501 Reedsdale St 8,356
AVERAGE APT. RENT: $1,075 PER UNIT/MO.3% DECREASE SINCE 2011
Employment 2016
Growth 2011-16
Average Wage
Growth 2011-16
TOTAL TECH TALENT 42,130 23.9% $80,432 11.5%Software Developers & Programmers 12,760 31.1% $83,190 6.2%Computer Support, Database & Systems 21,280 24.2% $72,829 14.3%Computer & Infor. Systems Managers 2,870 40.0% $131,290 14.4%Technology Engineering-Related 5,220 2.8% $76,724 7.6%
TOTAL NON-TECH TALENT 147,560 2.6% $51,260 10.7%Sales 11,060 17.8% $70,530 -6.3%Administrative & Office Support 106,020 -1.1% $44,567 10.2%Business Operations & Finance 21,810 9.0% $70,628 14.8%Marketing 8,670 20.4% $59,807 11.3%
The population of millennials in their 20s grew by 11,577 (17.7%) since 2010. That’s 843% of total growth in a population of 304,385.
Asking Rent: $21.79 PSF (up 9.6%); Vacancy: 11.4% (up 100 bps) (Q1 2017 data with change since Q1 2012)
Source: U.S. Bureau of Labor Statistics (Metro Area), April 2017.
Source: U.S. Census Bureau (City of Pittsburgh), 2016.
Source: CBRE Research (Office Market), Q1 2017.
Source: CBRE Research (Office Market), 2017.
*Pittsburgh Metro AreaSource: Relative Costs from Moody’s Analytics (metro area), Q1 2017; Apt, rent data from CBRE EA (City), Q1 2017.
FEMALE
MALE75%
25%
Source: U.S. Census Bureau (Metro Area), 2016..
30 Pittsburgh, PA
SCORE
HOUSING & RELATIVE COSTS* (US=100%)
TOP TECH OFFICE DEALS (2017)EMPLOYMENT BREAKDOWN
POPULATION TRENDS
OFFICE RENT & VACANCY TRENDS
LABOR POOLTECH DIVERSITYEDUCATION
ATTAINMENT
96% LIVING COST
93% BUSINESS COST
Tenant Address Sq. Ft.AutoAlert 114 W 11th St 45,000Digital Evolution Group 6601 College Blvd 31,000Vendor Credentialing 10950 Grandview Dr 23,830
AVERAGE APT. RENT: $940 PER UNIT/MO.14% INCREASE SINCE 2011
Employment 2016
Growth 2011-16
Average Wage
Growth 2011-16
TOTAL TECH TALENT 51,770 39.1% $83,024 8.7%Software Developers & Programmers 15,400 29.3% $88,117 5.7%Computer Support, Database & Systems 27,390 57.4% $73,572 8.2%Computer & Infor. Systems Managers 3,730 54.8% $128,370 20.0%Technology Engineering-Related 5,250 -4.7% $85,178 15.0%
TOTAL NON-TECH TALENT 138,490 10.6% $49,191 5.6%Sales 11,810 -2.2% $70,041 2.2%Administrative & Office Support 96,340 11.8% $41,463 5.0%Business Operations & Finance 21,040 4.3% $67,209 10.9%Marketing 9,300 36.2% $62,004 11.8%
The population of millennials in their 20s grew by 347 (0.5%) since 2010. That’s 2.4% of total growth in a population of 475,361.
Asking Rent: $18.42 PSF (up 9.3%); Vacancy: 12.8% (down -480 bps) (Q1 2017 data with change since Q1 2012)
Source: U.S. Bureau of Labor Statistics (Metro Area), April 2017.
Source: U.S. Census Bureau (City of Kansas City), 2016.
Source: CBRE Research (Office Market), Q1 2017.
Source: CBRE Research (Office Market), 2017.
*Kansas City Metro AreaSource: Relative Costs from Moody’s Analytics (metro area), Q1 2017; Apt, rent data from CBRE EA (City), Q1 2017.
DEGREE COMPLETIONS (2014-2015)
TOTAL TECH DEGREES 835 40.8%Computer Engineering 748 47.8%Math/Statistics 47 11.9%Other Tech Engineering 40 -11.1%
33% BACHELOR’S OR HIGHER
FEMALE
MALE79%
21%
Source: U.S. Census Bureau (Metro Area), 2016.
Source: The National Center for Education Statistics (Region), July 2016.
Kansas City Metro area
29 Kansas City, MO 44.93
Source: U.S. Census Bureau (City), 2016.
Growth 2011-15
EDUCATION ATTAINMENT
DEGREE COMPLETIONS (2014-2015)
TOTAL TECH DEGREES 4,081 36.8%Computer Engineering 2,643 30.1%Math/Statistics 472 17.4%Other Tech Engineering 966 76.0%
41% BACHELOR’S OR HIGHER
Source: The National Center for Education Statistics (Region), July 2016.
Pittsburgh Metro area
Source: U.S. Census Bureau (City), 2016.
Growth 2011-15

2017 SCORING TECH TALENT | CBRE ResearchA30
SCORE
HOUSING & RELATIVE COSTS* (US=100%)
TOP TECH OFFICE DEALS (2017)EMPLOYMENT BREAKDOWN
POPULATION TRENDS
OFFICE RENT & VACANCY TRENDS
LABOR POOLTECH DIVERSITY
38.99
103% LIVING COST
100% BUSINESS COST
Tenant Address Sq. Ft.IANPAGE Services, LLC 725 Primera Blvd 37,874Kittelson & Associations Inc 225 E Robinson St 7,608iVenture 1901 Summit Tower Blvd 5,840
AVERAGE APT. RENT: $1,164 PER UNIT/MO.28% INCREASE SINCE 2011
Employment 2016
Growth 2011-16
Average Wage
Growth 2011-16
TOTAL TECH TALENT 35,320 45.0% $82,313 12.6%Software Developers & Programmers 11,450 42.8% $91,159 15.3%Computer Support, Database & Systems 18,330 56.8% $70,503 8.5%Computer & Infor. Systems Managers 2,060 89.0% $141,100 10.9%Technology Engineering-Related 3,480 -2.2% $80,614 15.1%
TOTAL NON-TECH TALENT 143,170 15.7% $45,347 8.6%Sales 14,940 -12.4% $61,554 3.6%Administrative & Office Support 104,210 21.6% $38,883 13.0%Business Operations & Finance 20,090 25.1% $65,464 10.7%Marketing 3,930 -21.1% $52,292 0.4%
The population of millennials in their 20s grew by 6,408 (12.3%) since 2010. That’s 20.1% of total growth in a population of 270,917.
Asking Rent: $20.97 PSF (up 3.7%); Vacancy: 10.4% (down -880 bps) (Q1 2017 data with change since Q1 2012)
Source: U.S. Bureau of Labor Statistics (Metro Area), April 2017.
Source: U.S. Census Bureau (City of Orlando), 2016.
Source: CBRE Research (Office Market), Q1 2017.
Source: CBRE Research (Office Market), 2017.
*Orlando Metro AreaSource: Relative Costs from Moody’s Analytics (metro area), Q1 2017; Apt, rent data from CBRE EA (City), Q1 2017.
FEMALE
MALE75%
25%
Source: U.S. Census Bureau (Metro Area), 2016..
32 Orlando, FL
SCORE
HOUSING & RELATIVE COSTS* (US=100%)
TOP TECH OFFICE DEALS (2017)EMPLOYMENT BREAKDOWN
POPULATION TRENDS
OFFICE RENT & VACANCY TRENDS
LABOR POOLTECH DIVERSITYEDUCATION
ATTAINMENT
108% LIVING COST
101% BUSINESS COST
Tenant Address Sq. Ft.Forum Energy Technologies 920 Memorial City 23,652Houston Technology Center 13501 Katy Freeway 20,000Omni AI 1400 Broadfield 8,473
AVERAGE APT. RENT: $1,051 PER UNIT/MO.14% INCREASE SINCE 2011
Employment 2016
Growth 2011-16
Average Wage
Growth 2011-16
TOTAL TECH TALENT 97,550 31.4% $95,229 14.6%Software Developers & Programmers 27,020 21.7% $100,653 11.9%Computer Support, Database & Systems 50,530 41.8% $85,743 17.0%Computer & Infor. Systems Managers 5,790 20.9% $157,400 19.0%Technology Engineering-Related 14,210 22.4% $93,314 17.2%
TOTAL NON-TECH TALENT 373,940 24.8% $58,894 14.2%Sales 37,650 56.9% $74,312 1.3%Administrative & Office Support 251,230 14.0% $49,137 10.1%Business Operations & Finance 68,820 56.5% $84,742 17.0%Marketing 16,240 42.5% $64,546 9.1%
The population of millennials in their 20s grew by 31,200 (8.5%) since 2010. That’s 16.3% of total growth in a population of 2,298,628.
Asking Rent: $29.58 PSF (up 27.3%); Vacancy: 16.8% (up 230 bps) (Q1 2017 data with change since Q1 2012)
Source: U.S. Bureau of Labor Statistics (Metro Area), April 2017.
Source: U.S. Census Bureau (City of Houston), 2016.
Source: CBRE Research (Office Market), Q1 2017.
Source: CBRE Research (Office Market), 2017.
*Houston Metro AreaSource: Relative Costs from Moody’s Analytics (metro area), Q1 2017; Apt, rent data from CBRE EA (City), Q1 2017.
DEGREE COMPLETIONS (2014-2015)
TOTAL TECH DEGREES 2,217 45.2%Computer Engineering 1,437 57.6%Math/Statistics 369 29.5%Other Tech Engineering 411 24.5%
31% BACHELOR’S OR HIGHER
FEMALE
MALE76%
24%
Source: U.S. Census Bureau (Metro Area), 2016.
Source: The National Center for Education Statistics (Region), July 2016.
Houston Metro area
31 Houston, TX 42.57
Source: U.S. Census Bureau (City), 2016.
Growth 2011-15
EDUCATION ATTAINMENT
DEGREE COMPLETIONS (2014-2015)
TOTAL TECH DEGREES 2,129 43.2%Computer Engineering 1,367 36.4%Math/Statistics 105 78.0%Other Tech Engineering 657 54.2%
36% BACHELOR’S OR HIGHER
Source: The National Center for Education Statistics (Region), July 2016.
Orlando Metro area
Source: U.S. Census Bureau (City), 2016.
Growth 2011-15

A31 © 2017 CBRE, Inc.
SCORE
HOUSING & RELATIVE COSTS* (US=100%)
TOP TECH OFFICE DEALS (2017)EMPLOYMENT BREAKDOWN
POPULATION TRENDS
OFFICE RENT & VACANCY TRENDS
LABOR POOLTECH DIVERSITY
35.51
89% LIVING COST
90% BUSINESS COST
Tenant Address Sq. Ft.Conduent Medley Centre 125,000Datto The Metropolitan 42,000CoreLogic Solutions Calkins Road Business Park 41,000
AVERAGE APT. RENT: $1,056 PER UNIT/MO.22% INCREASE SINCE 2011
Employment 2016
Growth 2011-16
Average Wage
Growth 2011-16
TOTAL TECH TALENT 21,510 17.8% $77,649 8.6%Software Developers & Programmers 6,290 5.7% $85,737 11.8%Computer Support, Database & Systems 10,870 48.7% $65,924 8.1%Computer & Infor. Systems Managers 1,270 8.5% $132,250 10.8%Technology Engineering-Related 3,080 -19.6% $79,996 16.2%
TOTAL NON-TECH TALENT 68,570 14.7% $49,166 8.8%Sales 5,580 45.3% $73,383 4.1%Administrative & Office Support 49,620 14.4% $41,624 12.0%Business Operations & Finance 9,200 0.4% $69,087 2.6%Marketing 4,170 22.3% $62,557 5.4%
The population of millennials in their 20s grew by 269 (0.7%) since 2010. That’s 34.1% of total growth in a population of 209,808.
Asking Rent: $19.50 PSF (up 1.8%); Vacancy: 14.8% (down -470 bps) (Q1 2017 data with change since Q1 2012)
Source: U.S. Bureau of Labor Statistics (Metro Area), April 2017.
Source: U.S. Census Bureau (City of Rochester), 2016.
Source: CBRE Research (Office Market), Q1 2017.
Source: CBRE Research (Office Market), 2017.
*Rochester Metro AreaSource: Relative Costs from Moody’s Analytics (metro area), Q1 2017; Apt, rent data from CBRE EA (City), Q1 2017.
FEMALE
MALE75%
25%
Source: U.S. Census Bureau (Metro Area), 2016.
34 Rochester, NY
SCORE
HOUSING & RELATIVE COSTS* (US=100%)
TOP TECH OFFICE DEALS (2017)EMPLOYMENT BREAKDOWN
POPULATION TRENDS
OFFICE RENT & VACANCY TRENDS
LABOR POOLTECH DIVERSITYEDUCATION
ATTAINMENT
92% LIVING COST
88% BUSINESS COST
Tenant Address Sq. Ft.RCR Technology Corp 251 Illinois St 19,139Core BTS 10201 Illinois Sr 7,800SMARI Research 135 Pennsylvania St 4,309
AVERAGE APT. RENT: $820 PER UNIT/MO.15% INCREASE SINCE 2011
Employment 2016
Growth 2011-16
Average Wage
Growth 2011-16
TOTAL TECH TALENT 35,010 42.3% $77,672 7.7%Software Developers & Programmers 10,880 52.2% $77,970 1.4%Computer Support, Database & Systems 18,990 43.0% $73,289 14.1%Computer & Infor. Systems Managers 2,530 29.7% $114,800 4.0%Technology Engineering-Related 2,610 17.0% $72,331 2.2%
TOTAL NON-TECH TALENT 117,510 19.2% $51,609 6.4%Sales 12,900 22.4% $72,770 10.7%Administrative & Office Support 78,010 16.6% $44,568 7.0%Business Operations & Finance 19,070 19.9% $64,586 1.2%Marketing 7,530 43.7% $55,428 0.7%
The population of millennials in their 20s grew by 4,797 (3.6%) since 2010. That’s 19.8% of total growth in a population of 848,423.
Asking Rent: $18.76 PSF (up 8.6%); Vacancy: 16.4% (down -280 bps) (Q1 2017 data with change since Q1 2012)
Source: U.S. Bureau of Labor Statistics (Metro Area), April 2017.
Source: U.S. Census Bureau (City of Indianapolis), 2016.
Source: CBRE Research (Office Market), Q1 2017.
Source: CBRE Research (Office Market), 2017.
*Indianapolis Metro AreaSource: Relative Costs from Moody’s Analytics (metro area), Q1 2017; Apt, rent data from CBRE EA (City), Q1 2017.
DEGREE COMPLETIONS (2014-2015)
TOTAL TECH DEGREES 855 38.1%Computer Engineering 567 28.3%Math/Statistics 100 2.0%Other Tech Engineering 188 138.0%
29% BACHELOR’S OR HIGHER
FEMALE
MALE76%
24%
Source: U.S. Census Bureau (Metro Area), 2016.
Source: The National Center for Education Statistics (Region), July 2016.
Indianapolis Metro area
33 Indianapolis, IN 36.39
Source: U.S. Census Bureau (City), 2016.
Growth 2011-15
EDUCATION ATTAINMENT
DEGREE COMPLETIONS (2014-2015)
TOTAL TECH DEGREES 1,951 20.7%Computer Engineering 1,233 30.6%Math/Statistics 326 -4.1%Other Tech Engineering 392 17.7%
22% BACHELOR’S OR HIGHER
Source: The National Center for Education Statistics (Region), July 2016.
Rochester Metro area
Source: U.S. Census Bureau (City), 2016.
Growth 2011-15

2017 SCORING TECH TALENT | CBRE ResearchA32
Tenant Address Sq. Ft.Amdocs Inc 1390 Timberlake Manor Pkwy 70,881Riot Games 7777 Bonhomme Ave 23,591Teksystems 1 Cityplace Dr 15,941
SCORE
HOUSING & RELATIVE COSTS* (US=100%)
TOP TECH OFFICE DEALS (2017)EMPLOYMENT BREAKDOWN
POPULATION TRENDS
OFFICE RENT & VACANCY TRENDS
LABOR POOLTECH DIVERSITY
35.11
106% LIVING COST
103% BUSINESS COST
Tenant Address Sq. Ft.VOXPRO Group 225 Parkshore Dr 54,784JLM Energy 3735 Placer Corporate 39,869New Star Laser 9085 Foothills Blvd 19,000
AVERAGE APT. RENT: $1,373 PER UNIT/MO.39% INCREASE SINCE 2011
Employment 2016
Growth 2011-16
Average Wage
Growth 2011-16
TOTAL TECH TALENT 39,430 25.3% $91,892 7.5%Software Developers & Programmers 14,680 31.4% $95,217 4.3%Computer Support, Database & Systems 17,150 18.4% $80,353 7.9%Computer & Infor. Systems Managers 2,290 -13.6% $133,720 12.5%Technology Engineering-Related 5,310 68.0% $101,930 16.7%
TOTAL NON-TECH TALENT 111,460 8.6% $51,740 4.0%Sales 7,330 17.1% $66,762 -8.2%Administrative & Office Support 79,300 3.0% $44,178 1.8%Business Operations & Finance 19,230 28.4% $73,078 11.0%Marketing 5,600 26.4% $65,896 -10.0%
The population of millennials in their 20s grew by 5,816 (7.5%) since 2010. That’s 25.1% of total growth in a population of 490,715.
Asking Rent: $21.48 PSF (up 4.7%); Vacancy: 14.5% (down -920 bps) (Q1 2017 data with change since Q1 2012)
Source: U.S. Bureau of Labor Statistics (Metro Area), April 2017.
Source: U.S. Census Bureau (City of Sacramento), 2016.
Source: CBRE Research (Office Market), Q1 2017.
Source: CBRE Research (Office Market), 2017.
*Sacramento Metro AreaSource: Relative Costs from Moody’s Analytics (metro area), Q1 2017; Apt, rent data from CBRE EA (City), Q1 2017.
FEMALE
MALE70%
30%
Source: U.S. Census Bureau (Metro Area), 2016.
36 Sacramento, CA
SCORE
HOUSING & RELATIVE COSTS* (US=100%)
TOP TECH OFFICE DEALS (2016/2017)EMPLOYMENT BREAKDOWN
POPULATION TRENDS
OFFICE RENT & VACANCY TRENDS
LABOR POOLTECH DIVERSITYEDUCATION
ATTAINMENT
94% LIVING COST
93% BUSINESS COST
AVERAGE APT. RENT: $916 PER UNIT/MO.20% INCREASE SINCE 2011
Employment 2016
Growth 2011-16
Average Wage
Growth 2011-16
TOTAL TECH TALENT 52,190 7.9% $87,174 13.1%Software Developers & Programmers 14,170 -4.2% $94,268 10.9%Computer Support, Database & Systems 30,500 20.7% $77,712 15.6%Computer & Infor. Systems Managers 3,240 10.6% $138,680 19.9%Technology Engineering-Related 4,280 -20.3% $92,127 14.7%
TOTAL NON-TECH TALENT 172,920 14.1% $48,584 1.1%Sales 16,370 39.6% $60,583 -5.5%Administrative & Office Support 122,790 14.7% $41,052 -1.4%Business Operations & Finance 23,630 -7.2% $73,096 12.7%Marketing 10,130 38.4% $63,313 9.8%
The population of millennials in their 20s declined by 3,178 (-5.3%) since 2010. That’s 91.6% in a population of 315,685.
Asking Rent: $18.66 PSF (up 1.6%); Vacancy: 14.2% (down -350 bps) (Q1 2017 data with change since Q1 2012)
Source: U.S. Bureau of Labor Statistics (Metro Area), April 2017.
Source: U.S. Census Bureau (City of St. Louis), 2016.
Source: CBRE Research (Office Market), Q1 2017.
Source: CBRE Research (Office Market), 2017.
*St. Louis Metro AreaSource: Relative Costs from Moody’s Analytics (metro area), Q1 2017; Apt, rent data from CBRE EA (City), Q1 2017.
DEGREE COMPLETIONS (2014-2015)
TOTAL TECH DEGREES 1,555 37.0%Computer Engineering 823 21.9%Math/Statistics 303 71.2%Other Tech Engineering 429 51.6%
35% BACHELOR’S OR HIGHER
FEMALE
MALE73%
27%
Source: U.S. Census Bureau (Metro Area), 2016.
Source: The National Center for Education Statistics (Region), July 2016.
St. Louis Metro Area
35 St. Louis, MO 35.44
Source: U.S. Census Bureau (City), 2016.
Growth 2011-15
EDUCATION ATTAINMENT
DEGREE COMPLETIONS (2014-2015)
TOTAL TECH DEGREES 1,412 41.3%Computer Engineering 634 34.6%Math/Statistics 251 49.4%Other Tech Engineering 527 46.4%
30% BACHELOR’S OR HIGHER
Source: The National Center for Education Statistics (Region), July 2016.
Sacramento Metro Area
Source: U.S. Census Bureau (City), 2016.
Growth 2011-15

A33 © 2017 CBRE, Inc.
SCORE
HOUSING & RELATIVE COSTS* (US=100%)
TOP TECH OFFICE DEALS (2016/2017)EMPLOYMENT BREAKDOWN
POPULATION TRENDS
OFFICE RENT & VACANCY TRENDS
LABOR POOLTECH DIVERSITY
34.62
125% LIVING COST
94% BUSINESS COST
Tenant Address Sq. Ft.LBi Software 999 Walt Whitman Rd 16,000Frontline Technologies 100 Merrick Rd 14,000Driven Local CA Plz 12,000
AVERAGE APT. RENT: $2,218 PER UNIT/MO.17% INCREASE SINCE 2011
Employment 2016
Growth 2011-16
Average Wage
Growth 2011-16
TOTAL TECH TALENT 29,870 24.0% $92,546 9.0%Software Developers & Programmers 8,810 21.2% $95,200 4.6%Computer Support, Database & Systems 14,590 39.0% $79,608 10.7%Computer & Infor. Systems Managers 2,560 14.3% $161,270 23.4%Technology Engineering-Related 3,910 -3.9% $89,851 9.4%
TOTAL NON-TECH TALENT 175,940 5.7% $57,005 9.3%Sales 12,920 44.8% $81,171 0.7%Administrative & Office Support 134,320 1.6% $49,869 9.6%Business Operations & Finance 21,140 9.3% $84,878 5.0%Marketing 7,560 26.6% $64,568 -0.2%
The population of millennials in their 20s grew by 28,950 (8.7%) since 2010. That’s 106.2% of total growth in a population of 2,862,937.
Asking Rent: $26.75 PSF (up 0.6%); Vacancy: 10.4% (down -440 bps) (Q1 2017 data with change since Q1 2012)
Source: U.S. Bureau of Labor Statistics (Metro Area), April 2017.
Source: U.S. Census Bureau (Nassau and Suffolk Counties), 2016.
Source: CBRE Research (Office Market), Q1 2017.
Source: CBRE Research (Office Market), 2017.
*Long Island Metro AreaSource: Relative Costs from Moody’s Analytics (metro area), Q1 2017; Apt, rent data from CBRE EA (City), Q1 2017.
FEMALE
MALE72%
28%
Source: U.S. Census Bureau (Metro Area), 2016.
38 Long Island, NY
SCORE
HOUSING & RELATIVE COSTS* (US=100%)
TOP TECH OFFICE DEALS (2016)EMPLOYMENT BREAKDOWN
POPULATION TRENDS
OFFICE RENT & VACANCY TRENDS
LABOR POOLTECH DIVERSITYEDUCATION
ATTAINMENT
106% LIVING COST
101% BUSINESS COST
Tenant Address Sq. Ft.United Technologies 755 Main St 74,200Tallan 45 Glastonbury Blvd 20,000Vertafore 5 Waterside Crossing 15,400
AVERAGE APT. RENT: $1,284 PER UNIT/MO.11% INCREASE SINCE 2011
Employment 2016
Growth 2011-16
Average Wage
Growth 2011-16
TOTAL TECH TALENT 24,620 17.1% $96,225 15.2%Software Developers & Programmers 8,050 45.6% $95,103 12.4%Computer Support, Database & Systems 11,660 7.7% $85,951 13.1%Computer & Infor. Systems Managers 2,990 -2.0% $145,320 27.3%Technology Engineering-Related 1,920 18.5% $86,869 19.1%
TOTAL NON-TECH TALENT 74,120 16.3% $56,095 8.9%Sales 5,760 101.4% $76,360 -19.8%Administrative & Office Support 52,400 12.7% $47,595 10.5%Business Operations & Finance 12,390 10.8% $78,693 8.0%Marketing 3,570 10.9% $69,732 14.9%
The population of millennials in their 20s grew by 4,063 (17.7%) since 2010. That’s 487.8% of total growth in a population of 124,014.
Asking Rent: $19.83 PSF (up 1.0%); Vacancy: 16.0% (down -260 bps) (Q1 2017 data with change since Q1 2012)
Source: U.S. Bureau of Labor Statistics (Metro Area), April 2017.
Source: U.S. Census Bureau (City of Hartford), 2016.
Source: CBRE Research (Office Market), Q1 2017.
Source: CBRE Research (Office Market), 2017.
*Indianapolis Metro AreaSource: Relative Costs from Moody’s Analytics (metro area), Q1 2017; Apt, rent data from CBRE EA (City), Q1 2017.
DEGREE COMPLETIONS (2014-2015)
TOTAL TECH DEGREES 1,242 44.1%Computer Engineering 404 46.9%Math/Statistics 399 55.9%Other Tech Engineering 439 32.6%
17% BACHELOR’S OR HIGHER
FEMALE
MALE70%
30%
Source: U.S. Census Bureau (Metro Area), 2016.
Source: The National Center for Education Statistics (Region), July 2016.
Hartford Metro area
37 Hartford, CT 34.71
Source: U.S. Census Bureau (City), 2016.
Growth 2011-15
EDUCATION ATTAINMENT
DEGREE COMPLETIONS (2014-2015)
TOTAL TECH DEGREES 14,419 37.8%Computer Engineering 8,490 44.4%Math/Statistics 3,051 29.3%Other Tech Engineering 2,878 29.2%
38% BACHELOR’S OR HIGHER
Source: The National Center for Education Statistics (Region), July 2016.
New York Metro Area
Source: U.S. Census Bureau (City), 2016.
Growth 2011-15
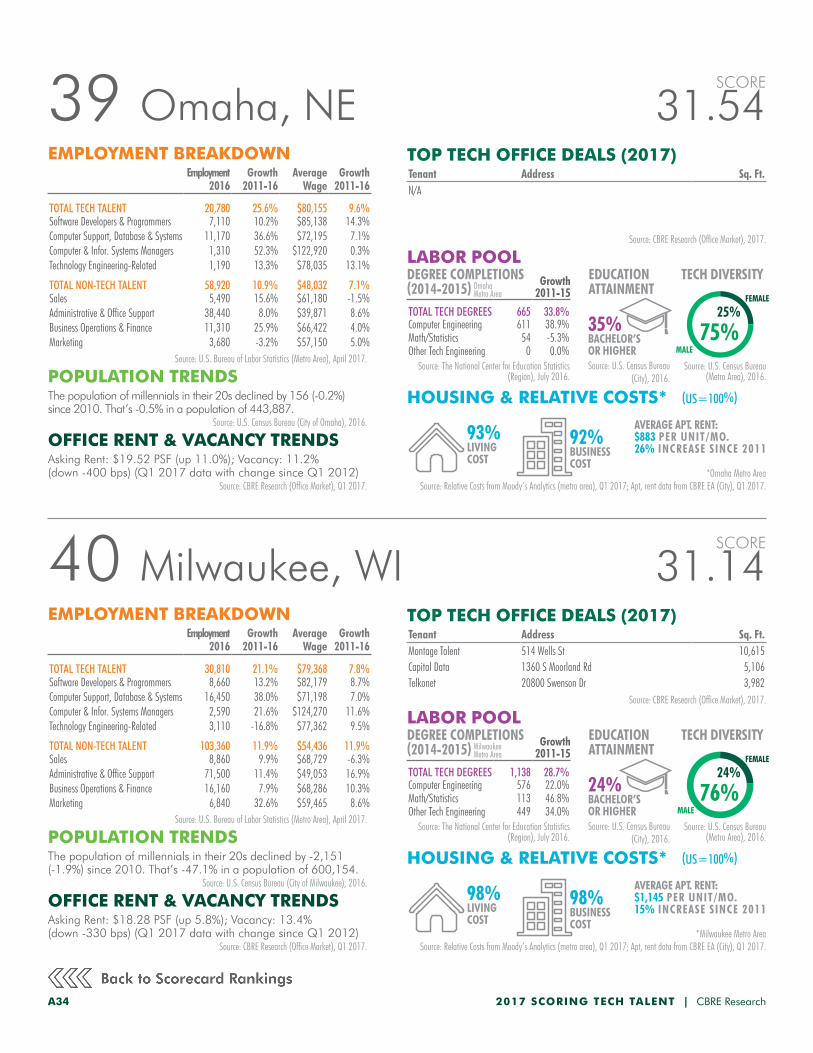
2017 SCORING TECH TALENT | CBRE ResearchA34
SCORE
HOUSING & RELATIVE COSTS* (US=100%)
TOP TECH OFFICE DEALS (2017)EMPLOYMENT BREAKDOWN
POPULATION TRENDS
OFFICE RENT & VACANCY TRENDS
LABOR POOLTECH DIVERSITY
31.14
98% LIVING COST
98% BUSINESS COST
Tenant Address Sq. Ft.Montage Talent 514 Wells St 10,615Capital Data 1360 S Moorland Rd 5,106Telkonet 20800 Swenson Dr 3,982
AVERAGE APT. RENT: $1,145 PER UNIT/MO.15% INCREASE SINCE 2011
Employment 2016
Growth 2011-16
Average Wage
Growth 2011-16
TOTAL TECH TALENT 30,810 21.1% $79,368 7.8%Software Developers & Programmers 8,660 13.2% $82,179 8.7%Computer Support, Database & Systems 16,450 38.0% $71,198 7.0%Computer & Infor. Systems Managers 2,590 21.6% $124,270 11.6%Technology Engineering-Related 3,110 -16.8% $77,362 9.5%
TOTAL NON-TECH TALENT 103,360 11.9% $54,436 11.9%Sales 8,860 9.9% $68,729 -6.3%Administrative & Office Support 71,500 11.4% $49,053 16.9%Business Operations & Finance 16,160 7.9% $68,286 10.3%Marketing 6,840 32.6% $59,465 8.6%
The population of millennials in their 20s declined by -2,151 (-1.9%) since 2010. That’s -47.1% in a population of 600,154.
Asking Rent: $18.28 PSF (up 5.8%); Vacancy: 13.4% (down -330 bps) (Q1 2017 data with change since Q1 2012)
Source: U.S. Bureau of Labor Statistics (Metro Area), April 2017.
Source: U.S. Census Bureau (City of Milwaukee), 2016.
Source: CBRE Research (Office Market), Q1 2017.
Source: CBRE Research (Office Market), 2017.
*Milwaukee Metro AreaSource: Relative Costs from Moody’s Analytics (metro area), Q1 2017; Apt, rent data from CBRE EA (City), Q1 2017.
FEMALE
MALE76%
24%
Source: U.S. Census Bureau (Metro Area), 2016.
40 Milwaukee, WI
SCORE
HOUSING & RELATIVE COSTS* (US=100%)
TOP TECH OFFICE DEALS (2017)EMPLOYMENT BREAKDOWN
POPULATION TRENDS
OFFICE RENT & VACANCY TRENDS
LABOR POOLTECH DIVERSITYEDUCATION
ATTAINMENT
93% LIVING COST
92% BUSINESS COST
Tenant Address Sq. Ft.N/A
AVERAGE APT. RENT: $883 PER UNIT/MO.26% INCREASE SINCE 2011
Employment 2016
Growth 2011-16
Average Wage
Growth 2011-16
TOTAL TECH TALENT 20,780 25.6% $80,155 9.6%Software Developers & Programmers 7,110 10.2% $85,138 14.3%Computer Support, Database & Systems 11,170 36.6% $72,195 7.1%Computer & Infor. Systems Managers 1,310 52.3% $122,920 0.3%Technology Engineering-Related 1,190 13.3% $78,035 13.1%
TOTAL NON-TECH TALENT 58,920 10.9% $48,032 7.1%Sales 5,490 15.6% $61,180 -1.5%Administrative & Office Support 38,440 8.0% $39,871 8.6%Business Operations & Finance 11,310 25.9% $66,422 4.0%Marketing 3,680 -3.2% $57,150 5.0%
The population of millennials in their 20s declined by 156 (-0.2%) since 2010. That’s -0.5% in a population of 443,887.
Asking Rent: $19.52 PSF (up 11.0%); Vacancy: 11.2% (down -400 bps) (Q1 2017 data with change since Q1 2012)
Source: U.S. Bureau of Labor Statistics (Metro Area), April 2017.
Source: U.S. Census Bureau (City of Omaha), 2016.
Source: CBRE Research (Office Market), Q1 2017.
Source: CBRE Research (Office Market), 2017.
*Omaha Metro AreaSource: Relative Costs from Moody’s Analytics (metro area), Q1 2017; Apt, rent data from CBRE EA (City), Q1 2017.
DEGREE COMPLETIONS (2014-2015)
TOTAL TECH DEGREES 665 33.8%Computer Engineering 611 38.9%Math/Statistics 54 -5.3%Other Tech Engineering 0 0.0%
35% BACHELOR’S OR HIGHER
FEMALE
MALE75%
25%
Source: U.S. Census Bureau (Metro Area), 2016.
Source: The National Center for Education Statistics (Region), July 2016.
Omaha Metro Area
39 Omaha, NE 31.54
Source: U.S. Census Bureau (City), 2016.
Growth 2011-15
EDUCATION ATTAINMENT
DEGREE COMPLETIONS (2014-2015)
TOTAL TECH DEGREES 1,138 28.7%Computer Engineering 576 22.0%Math/Statistics 113 46.8%Other Tech Engineering 449 34.0%
24% BACHELOR’S OR HIGHER
Source: The National Center for Education Statistics (Region), July 2016.
Milwaukee Metro Area
Source: U.S. Census Bureau (City), 2016.
Growth 2011-15

A35 © 2017 CBRE, Inc.
SCORE
HOUSING & RELATIVE COSTS* (US=100%)
TOP TECH OFFICE DEALS (2017)EMPLOYMENT BREAKDOWN
POPULATION TRENDS
OFFICE RENT & VACANCY TRENDS
LABOR POOLTECH DIVERSITY
29.98
111% LIVING COST
102% BUSINESS COST
Tenant Address Sq. Ft.Ford Motor Co 1200 Sawgrass Corporate Pkwy 60,648Housing & Development Software 3034 Universal Blvd 7,948
AVERAGE APT. RENT: $1,548 PER UNIT/MO.26% INCREASE SINCE 2011
Employment 2016
Growth 2011-16
Average Wage
Growth 2011-16
TOTAL TECH TALENT 22,370 37.2% $79,484 15.3%Software Developers & Programmers 7,770 73.4% $82,695 12.0%Computer Support, Database & Systems 11,910 29.2% $71,008 16.6%Computer & Infor. Systems Managers 1,390 51.1% $140,270 10.5%Technology Engineering-Related 1,300 -23.1% $72,955 6.8%
TOTAL NON-TECH TALENT 122,550 22.4% $47,800 6.0%Sales 14,040 1.7% $68,343 1.9%Administrative & Office Support 87,900 26.6% $40,291 9.9%Business Operations & Finance 14,700 9.3% $68,355 8.1%Marketing 5,910 71.8% $59,558 6.6%
The population of millennials in their 20s declined by -104 (-0.5%) since 2010. That’s -0.8% in a population of 178,587.
Asking Rent: $31.72 PSF (up 20.5%); Vacancy: 12.9% (down -620 bps) (Q1 2017 data with change since Q1 2012)
Source: U.S. Bureau of Labor Statistics (Metro Area), April 2017.
Source: U.S. Census Bureau (City of Ft. Lauderdale), 2016.
Source: CBRE Research (Office Market), Q1 2017.
Source: CBRE Research (Office Market), 2017.
*Ft. Lauderdale Metro AreaSource: Relative Costs from Moody’s Analytics (metro area), Q1 2017; Apt, rent data from CBRE EA (City), Q1 2017.
FEMALE
MALE72%
28%
Source: U.S. Census Bureau (Metro Area), 2016.
42 Ft. Lauderdale, FL
SCORE
HOUSING & RELATIVE COSTS* (US=100%)
TOP TECH OFFICE DEALS (2017)EMPLOYMENT BREAKDOWN
POPULATION TRENDS
OFFICE RENT & VACANCY TRENDS
LABOR POOLTECH DIVERSITYEDUCATION
ATTAINMENT
91% LIVING COST
97% BUSINESS COST
Tenant Address Sq. Ft.COMDOC 9999 Carver Rd 7,168EMI Research Solutions 8280 Montgomery Rd 4,995Forcam 4030 Smith Rd 3,706
AVERAGE APT. RENT: $902 PER UNIT/MO.16% INCREASE SINCE 2011
Employment 2016
Growth 2011-16
Average Wage
Growth 2011-16
TOTAL TECH TALENT 36,450 21.0% $83,390 11.9%Software Developers & Programmers 10,170 15.7% $85,158 12.3%Computer Support, Database & Systems 20,650 29.1% $76,321 13.5%Computer & Infor. Systems Managers 3,190 22.2% $128,020 15.3%Technology Engineering-Related 2,440 -10.6% $77,504 -0.4%
TOTAL NON-TECH TALENT 119,340 5.4% $51,594 7.1%Sales 13,690 10.0% $73,914 3.8%Administrative & Office Support 77,790 -0.9% $42,433 4.3%Business Operations & Finance 19,580 24.4% $68,521 6.0%Marketing 8,280 27.6% $60,727 11.7%
The population of millennials in their 20s declined by -8,012 (-12.7%) since 2010. That’s -491.5% in a population of 298,537.
Asking Rent: $19.09 PSF (down -0.9%); Vacancy: 18.8% (down -430 bps) (Q1 2017 data with change since Q1 2012)
Source: U.S. Bureau of Labor Statistics (Metro Area), April 2017.
Source: U.S. Census Bureau (City of Cincinnati), 2016.
Source: CBRE Research (Office Market), Q1 2017.
Source: CBRE Research (Office Market), 2017.
*Cincinnati Metro AreaSource: Relative Costs from Moody’s Analytics (metro area), Q1 2017; Apt, rent data from CBRE EA (City), Q1 2017.
DEGREE COMPLETIONS (2014-2015)
TOTAL TECH DEGREES 1,372 42.6%Computer Engineering 713 77.8%Math/Statistics 201 28.0%Other Tech Engineering 458 13.4%
34% BACHELOR’S OR HIGHER
FEMALE
MALE77%
23%
Source: U.S. Census Bureau (Metro Area), 2016.
Source: The National Center for Education Statistics (Region), July 2016.
Cincinnati Metro Area
41 Cincinnati, OH 30.11
Source: U.S. Census Bureau (City), 2016.
Growth 2011-15
EDUCATION ATTAINMENT
DEGREE COMPLETIONS (2014-2015)
TOTAL TECH DEGREES 2,275 41.7%Computer Engineering 1,656 42.3%Math/Statistics 156 28.9%Other Tech Engineering 463 44.2%
36% BACHELOR’S OR HIGHER
Source: The National Center for Education Statistics (Region), July 2016.
Ft. Lauderdale Metro Area
Source: U.S. Census Bureau (City), 2016.
Growth 2011-15

2017 SCORING TECH TALENT | CBRE ResearchA36
SCORE
HOUSING & RELATIVE COSTS* (US=100%)
TOP TECH OFFICE DEALS (2017)EMPLOYMENT BREAKDOWN
POPULATION TRENDS
OFFICE RENT & VACANCY TRENDS
LABOR POOLTECH DIVERSITY
27.68
98% LIVING COST
94% BUSINESS COST
Tenant Address Sq. Ft.Mythics 4525 Main Street Tower 38,951Harris Corporation 7007 Harbour View Blvd 15,131Decisions LLC 238 S Battlefield Blvd 10,450
AVERAGE APT. RENT: $1,027 PER UNIT/MO.5% INCREASE SINCE 2011
Employment 2016
Growth 2011-16
Average Wage
Growth 2011-16
TOTAL TECH TALENT 27,660 16.9% $84,514 10.8%Software Developers & Programmers 6,750 23.9% $96,754 18.1%Computer Support, Database & Systems 14,260 18.6% $75,614 7.3%Computer & Infor. Systems Managers 1,280 -5.2% $140,570 20.9%Technology Engineering-Related 5,370 10.7% $79,398 8.6%
TOTAL NON-TECH TALENT 79,460 -0.2% $49,997 11.2%Sales 5,680 19.1% $62,325 13.9%Administrative & Office Support 57,950 -4.2% $43,670 7.1%Business Operations & Finance 12,460 10.1% $71,631 18.6%Marketing 3,370 12.7% $58,029 4.4%
The population of millennials in their 20s grew by 4,118 (5.5%) since 2010. That’s 30.3% of total growth in a population of 452,745.
Asking Rent: $18.77 PSF (down -11.5%); Vacancy: 15.6% (down -200 bps) (Q1 2017 data with change since Q1 2012)
Source: U.S. Bureau of Labor Statistics (Metro Area), April 2017.
Source: U.S. Census Bureau (City of Norfolk), 2016.
Source: CBRE Research (Office Market), Q1 2017.
Source: CBRE Research (Office Market), 2017.
*Virginia Beach Metro AreaSource: Relative Costs from Moody’s Analytics (metro area), Q1 2017; Apt, rent data from CBRE EA (City), Q1 2017.
FEMALE
MALE76%
24%
Source: U.S. Census Bureau (Metro Area), 2016.
44 Virginia Beach, VA
SCORE
HOUSING & RELATIVE COSTS* (US=100%)
TOP TECH OFFICE DEALS (2016/2017)EMPLOYMENT BREAKDOWN
POPULATION TRENDS
OFFICE RENT & VACANCY TRENDS
LABOR POOLTECH DIVERSITYEDUCATION
ATTAINMENT
102% LIVING COST
94% BUSINESS COST
Tenant Address Sq. Ft.Digital Reasoning 701 Cool Springs Blvd 50,000Houzz 315 Deadrick St 37,421SouthComm 427 Chestnut St 14,160
AVERAGE APT. RENT: $1,123 PER UNIT/MO.33% INCREASE SINCE 2011
Employment 2016
Growth 2011-16
Average Wage
Growth 2011-16
TOTAL TECH TALENT 27,270 43.5% $79,421 12.7%Software Developers & Programmers 7,400 42.9% $83,458 11.8%Computer Support, Database & Systems 14,570 44.5% $71,721 14.8%Computer & Infor. Systems Managers 3,040 68.0% $107,870 7.1%Technology Engineering-Related 2,260 17.1% $77,580 6.8%
TOTAL NON-TECH TALENT 114,830 20.6% $48,568 7.0%Sales 11,810 20.0% $64,872 4.0%Administrative & Office Support 81,660 18.7% $42,146 6.8%Business Operations & Finance 15,890 21.3% $65,958 6.0%Marketing 5,470 58.6% $58,723 13.7%
The population of millennials in their 20s grew by 7,444 (6.8%) since 2010. That’s 14.3% of total growth in a population of 654,596.
Asking Rent: $24.93 PSF (up 38.3%); Vacancy: 8.1% (down -450 bps) (Q1 2017 data with change since Q1 2012)
Source: U.S. Bureau of Labor Statistics (Metro Area), April 2017.
Source: U.S. Census Bureau (City of Nashville), 2016.
Source: CBRE Research (Office Market), Q1 2017.
Source: CBRE Research (Office Market), 2017.
*Nashville Metro AreaSource: Relative Costs from Moody’s Analytics (metro area), Q1 2017; Apt, rent data from CBRE EA (City), Q1 2017.
DEGREE COMPLETIONS (2014-2015)
TOTAL TECH DEGREES 720 27.7%Computer Engineering 405 55.2%Math/Statistics 165 12.2%Other Tech Engineering 150 -3.8%
38% BACHELOR’S OR HIGHER
FEMALE
MALE75%
25%
Source: U.S. Census Bureau (Metro Area), 2016.
Source: The National Center for Education Statistics (Region), July 2016.
Nashville Metro Area
43 Nashville, TN 28.87
Source: U.S. Census Bureau (City), 2016.
Growth 2011-15
EDUCATION ATTAINMENT
DEGREE COMPLETIONS (2014-2015)
TOTAL TECH DEGREES 1,495 39.7%Computer Engineering 910 40.6%Math/Statistics 171 71.0%Other Tech Engineering 414 28.2%
27% BACHELOR’S OR HIGHER
Source: The National Center for Education Statistics (Region), July 2016.
Virginia Beach Metro Area
Source: U.S. Census Bureau (City), 2016.
Growth 2011-15
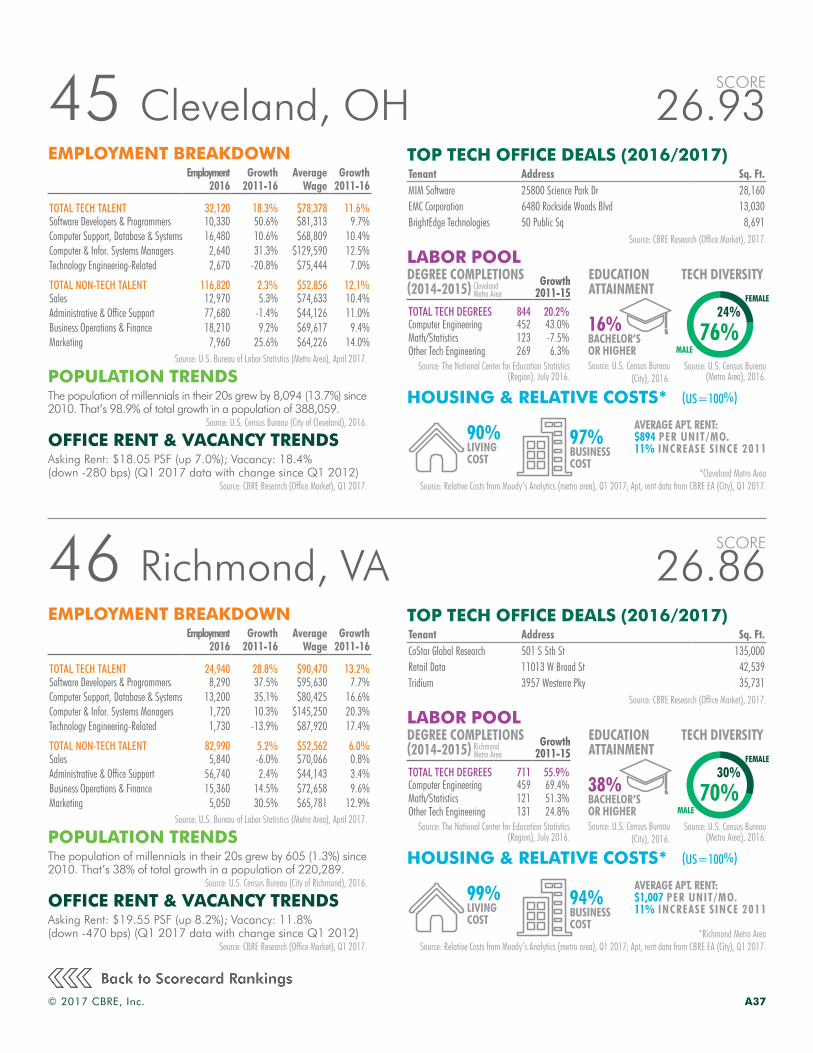
A37 © 2017 CBRE, Inc.
SCORE
HOUSING & RELATIVE COSTS* (US=100%)
TOP TECH OFFICE DEALS (2016/2017)EMPLOYMENT BREAKDOWN
POPULATION TRENDS
OFFICE RENT & VACANCY TRENDS
LABOR POOLTECH DIVERSITY
26.86
99% LIVING COST
94% BUSINESS COST
Tenant Address Sq. Ft.CoStar Global Research 501 S 5th St 135,000Retail Data 11013 W Broad St 42,539Tridium 3957 Westerre Pky 35,731
AVERAGE APT. RENT: $1,007 PER UNIT/MO.11% INCREASE SINCE 2011
Employment 2016
Growth 2011-16
Average Wage
Growth 2011-16
TOTAL TECH TALENT 24,940 28.8% $90,470 13.2%Software Developers & Programmers 8,290 37.5% $95,630 7.7%Computer Support, Database & Systems 13,200 35.1% $80,425 16.6%Computer & Infor. Systems Managers 1,720 10.3% $145,250 20.3%Technology Engineering-Related 1,730 -13.9% $87,920 17.4%
TOTAL NON-TECH TALENT 82,990 5.2% $52,562 6.0%Sales 5,840 -6.0% $70,066 0.8%Administrative & Office Support 56,740 2.4% $44,143 3.4%Business Operations & Finance 15,360 14.5% $72,658 9.6%Marketing 5,050 30.5% $65,781 12.9%
The population of millennials in their 20s grew by 605 (1.3%) since 2010. That’s 38% of total growth in a population of 220,289.
Asking Rent: $19.55 PSF (up 8.2%); Vacancy: 11.8% (down -470 bps) (Q1 2017 data with change since Q1 2012)
Source: U.S. Bureau of Labor Statistics (Metro Area), April 2017.
Source: U.S. Census Bureau (City of Richmond), 2016.
Source: CBRE Research (Office Market), Q1 2017.
Source: CBRE Research (Office Market), 2017.
*Richmond Metro AreaSource: Relative Costs from Moody’s Analytics (metro area), Q1 2017; Apt, rent data from CBRE EA (City), Q1 2017.
FEMALE
MALE70%
30%
Source: U.S. Census Bureau (Metro Area), 2016.
46 Richmond, VA
SCORE
HOUSING & RELATIVE COSTS* (US=100%)
TOP TECH OFFICE DEALS (2016/2017)EMPLOYMENT BREAKDOWN
POPULATION TRENDS
OFFICE RENT & VACANCY TRENDS
LABOR POOLTECH DIVERSITYEDUCATION
ATTAINMENT
90% LIVING COST
97% BUSINESS COST
Tenant Address Sq. Ft.MIM Software 25800 Science Park Dr 28,160EMC Corporation 6480 Rockside Woods Blvd 13,030BrightEdge Technologies 50 Public Sq 8,691
AVERAGE APT. RENT: $894 PER UNIT/MO.11% INCREASE SINCE 2011
Employment 2016
Growth 2011-16
Average Wage
Growth 2011-16
TOTAL TECH TALENT 32,120 18.3% $78,378 11.6%Software Developers & Programmers 10,330 50.6% $81,313 9.7%Computer Support, Database & Systems 16,480 10.6% $68,809 10.4%Computer & Infor. Systems Managers 2,640 31.3% $129,590 12.5%Technology Engineering-Related 2,670 -20.8% $75,444 7.0%
TOTAL NON-TECH TALENT 116,820 2.3% $52,856 12.1%Sales 12,970 5.3% $74,633 10.4%Administrative & Office Support 77,680 -1.4% $44,126 11.0%Business Operations & Finance 18,210 9.2% $69,617 9.4%Marketing 7,960 25.6% $64,226 14.0%
The population of millennials in their 20s grew by 8,094 (13.7%) since 2010. That’s 98.9% of total growth in a population of 388,059.
Asking Rent: $18.05 PSF (up 7.0%); Vacancy: 18.4% (down -280 bps) (Q1 2017 data with change since Q1 2012)
Source: U.S. Bureau of Labor Statistics (Metro Area), April 2017.
Source: U.S. Census Bureau (City of Cleveland), 2016.
Source: CBRE Research (Office Market), Q1 2017.
Source: CBRE Research (Office Market), 2017.
*Cleveland Metro AreaSource: Relative Costs from Moody’s Analytics (metro area), Q1 2017; Apt, rent data from CBRE EA (City), Q1 2017.
DEGREE COMPLETIONS (2014-2015)
TOTAL TECH DEGREES 844 20.2%Computer Engineering 452 43.0%Math/Statistics 123 -7.5%Other Tech Engineering 269 6.3%
16% BACHELOR’S OR HIGHER
FEMALE
MALE76%
24%
Source: U.S. Census Bureau (Metro Area), 2016.
Source: The National Center for Education Statistics (Region), July 2016.
Cleveland Metro Area
45 Cleveland, OH 26.93
Source: U.S. Census Bureau (City), 2016.
Growth 2011-15
EDUCATION ATTAINMENT
DEGREE COMPLETIONS (2014-2015)
TOTAL TECH DEGREES 711 55.9%Computer Engineering 459 69.4%Math/Statistics 121 51.3%Other Tech Engineering 131 24.8%
38% BACHELOR’S OR HIGHER
Source: The National Center for Education Statistics (Region), July 2016.
Richmond Metro Area
Source: U.S. Census Bureau (City), 2016.
Growth 2011-15
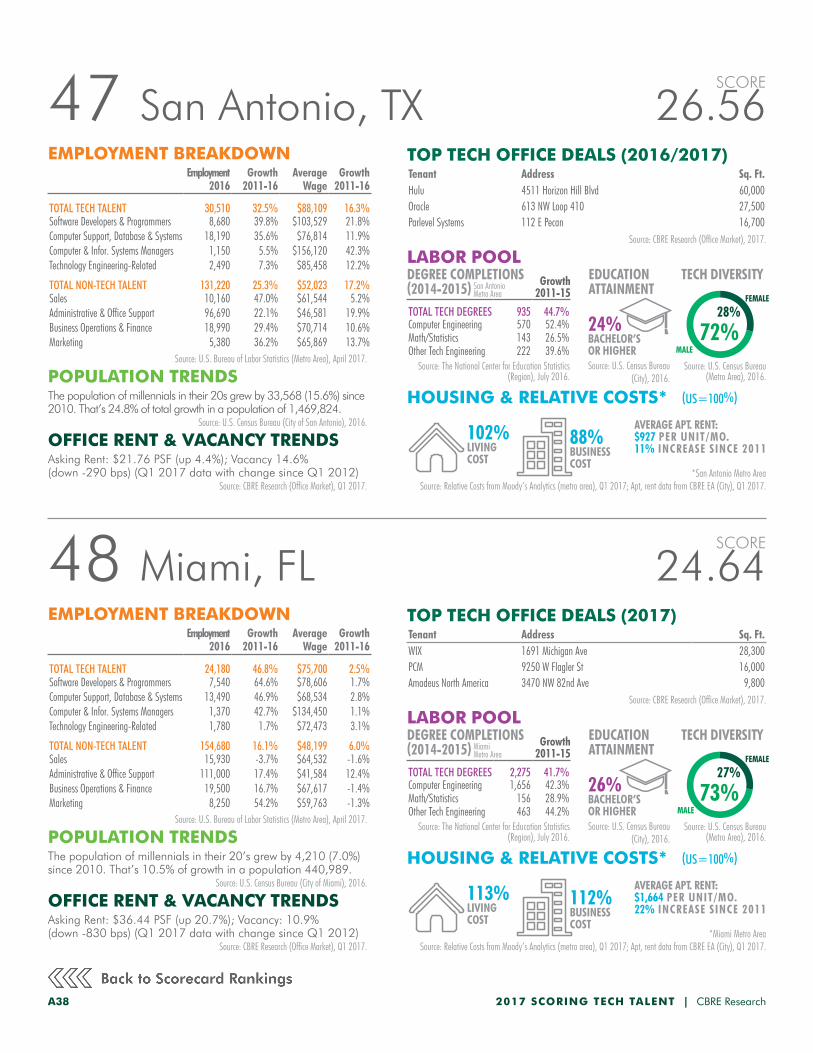
2017 SCORING TECH TALENT | CBRE ResearchA38
SCORE
HOUSING & RELATIVE COSTS* (US=100%)
TOP TECH OFFICE DEALS (2017)EMPLOYMENT BREAKDOWN
POPULATION TRENDS
OFFICE RENT & VACANCY TRENDS
LABOR POOLTECH DIVERSITY
24.64
113% LIVING COST
112% BUSINESS COST
Tenant Address Sq. Ft.WIX 1691 Michigan Ave 28,300PCM 9250 W Flagler St 16,000Amadeus North America 3470 NW 82nd Ave 9,800
AVERAGE APT. RENT: $1,664 PER UNIT/MO.22% INCREASE SINCE 2011
Employment 2016
Growth 2011-16
Average Wage
Growth 2011-16
TOTAL TECH TALENT 24,180 46.8% $75,700 2.5%Software Developers & Programmers 7,540 64.6% $78,606 1.7%Computer Support, Database & Systems 13,490 46.9% $68,534 2.8%Computer & Infor. Systems Managers 1,370 42.7% $134,450 1.1%Technology Engineering-Related 1,780 1.7% $72,473 3.1%
TOTAL NON-TECH TALENT 154,680 16.1% $48,199 6.0%Sales 15,930 -3.7% $64,532 -1.6%Administrative & Office Support 111,000 17.4% $41,584 12.4%Business Operations & Finance 19,500 16.7% $67,617 -1.4%Marketing 8,250 54.2% $59,763 -1.3%
The population of millennials in their 20’s grew by 4,210 (7.0%) since 2010. That’s 10.5% of growth in a population 440,989.
Asking Rent: $36.44 PSF (up 20.7%); Vacancy: 10.9% (down -830 bps) (Q1 2017 data with change since Q1 2012)
Source: U.S. Bureau of Labor Statistics (Metro Area), April 2017.
Source: U.S. Census Bureau (City of Miami), 2016.
Source: CBRE Research (Office Market), Q1 2017.
Source: CBRE Research (Office Market), 2017.
*Miami Metro AreaSource: Relative Costs from Moody’s Analytics (metro area), Q1 2017; Apt, rent data from CBRE EA (City), Q1 2017.
FEMALE
MALE73%
27%
Source: U.S. Census Bureau (Metro Area), 2016.
48 Miami, FL
SCORE
HOUSING & RELATIVE COSTS* (US=100%)
TOP TECH OFFICE DEALS (2016/2017)EMPLOYMENT BREAKDOWN
POPULATION TRENDS
OFFICE RENT & VACANCY TRENDS
LABOR POOLTECH DIVERSITYEDUCATION
ATTAINMENT
102% LIVING COST
88% BUSINESS COST
Tenant Address Sq. Ft.Hulu 4511 Horizon Hill Blvd 60,000Oracle 613 NW Loop 410 27,500Parlevel Systems 112 E Pecan 16,700
AVERAGE APT. RENT: $927 PER UNIT/MO.11% INCREASE SINCE 2011
Employment 2016
Growth 2011-16
Average Wage
Growth 2011-16
TOTAL TECH TALENT 30,510 32.5% $88,109 16.3%Software Developers & Programmers 8,680 39.8% $103,529 21.8%Computer Support, Database & Systems 18,190 35.6% $76,814 11.9%Computer & Infor. Systems Managers 1,150 5.5% $156,120 42.3%Technology Engineering-Related 2,490 7.3% $85,458 12.2%
TOTAL NON-TECH TALENT 131,220 25.3% $52,023 17.2%Sales 10,160 47.0% $61,544 5.2%Administrative & Office Support 96,690 22.1% $46,581 19.9%Business Operations & Finance 18,990 29.4% $70,714 10.6%Marketing 5,380 36.2% $65,869 13.7%
The population of millennials in their 20s grew by 33,568 (15.6%) since 2010. That’s 24.8% of total growth in a population of 1,469,824.
Asking Rent: $21.76 PSF (up 4.4%); Vacancy 14.6% (down -290 bps) (Q1 2017 data with change since Q1 2012)
Source: U.S. Bureau of Labor Statistics (Metro Area), April 2017.
Source: U.S. Census Bureau (City of San Antonio), 2016.
Source: CBRE Research (Office Market), Q1 2017.
Source: CBRE Research (Office Market), 2017.
*San Antonio Metro AreaSource: Relative Costs from Moody’s Analytics (metro area), Q1 2017; Apt, rent data from CBRE EA (City), Q1 2017.
DEGREE COMPLETIONS (2014-2015)
TOTAL TECH DEGREES 935 44.7%Computer Engineering 570 52.4%Math/Statistics 143 26.5%Other Tech Engineering 222 39.6%
24% BACHELOR’S OR HIGHER
FEMALE
MALE72%
28%
Source: U.S. Census Bureau (Metro Area), 2016.
Source: The National Center for Education Statistics (Region), July 2016.
San Antonio Metro Area
47 San Antonio, TX 26.56
Source: U.S. Census Bureau (City), 2016.
Growth 2011-15
EDUCATION ATTAINMENT
DEGREE COMPLETIONS (2014-2015)
TOTAL TECH DEGREES 2,275 41.7%Computer Engineering 1,656 42.3%Math/Statistics 156 28.9%Other Tech Engineering 463 44.2%
26% BACHELOR’S OR HIGHER
Source: The National Center for Education Statistics (Region), July 2016.
Miami Metro Area
Source: U.S. Census Bureau (City), 2016.
Growth 2011-15

A39 © 2017 CBRE, Inc.
SCORE
HOUSING & RELATIVE COSTS* (US=100%)
TOP TECH OFFICE DEALS (2017)EMPLOYMENT BREAKDOWN
POPULATION TRENDS
OFFICE RENT & VACANCY TRENDS
LABOR POOLTECH DIVERSITY
15.86
97% LIVING COST
86% BUSINESS COST
Tenant Address Sq. Ft.Stim-Lab, Inc 7406 N Highway 81 17,000Spiers New Technologies 3815 N Sante Fe Ave 11,214TEKsystems 29 E Reno Ave 9,728
AVERAGE APT. RENT: $704 PER UNIT/MO.5% INCREASE SINCE 2011
Employment 2016
Growth 2011-16
Average Wage
Growth 2011-16
TOTAL TECH TALENT 18,970 46.6% $74,424 12.6%Software Developers & Programmers 5,330 71.9% $80,015 18.3%Computer Support, Database & Systems 9,180 52.0% $62,763 10.0%Computer & Infor. Systems Managers 1,680 44.8% $103,220 15.1%Technology Engineering-Related 2,780 5.3% $84,814 13.8%
TOTAL NON-TECH TALENT 74,990 5.9% $46,782 13.4%Sales 7,680 51.5% $58,338 6.2%Administrative & Office Support 52,940 -3.2% $41,319 11.4%Business Operations & Finance 11,070 24.1% $63,534 8.9%Marketing 3,300 56.4% $51,335 16.8%
The population of millennials in their 20s declined by 1,288 (-1.3%) since 2010. Thats -2.6% in a population of 631,263.
Asking Rent: $17.28 PSF (up 14.0%); Vacancy: 15.1% (up 230 bps) (Q1 2017 data with change since Q1 2012)
Source: U.S. Bureau of Labor Statistics (Metro Area), April 2017.
Source: U.S. Census Bureau (City of Oklahoma City), 2016.
Source: CBRE Research (Office Market), Q1 2017.
Source: CBRE Research (Office Market), 2017.
*Oklahoma City Metro AreaSource: Relative Costs from Moody’s Analytics (metro area), Q1 2017; Apt, rent data from CBRE EA (City), Q1 2017.
FEMALE
MALE77%
23%
Source: U.S. Census Bureau (Metro Area), 2016.
50 Oklahoma City, OK
SCORE
HOUSING & RELATIVE COSTS* (US=100%)
TOP TECH OFFICE DEALS (2016/2017)EMPLOYMENT BREAKDOWN
POPULATION TRENDS
OFFICE RENT & VACANCY TRENDS
LABOR POOLTECH DIVERSITYEDUCATION
ATTAINMENT
92% LIVING COST
88% BUSINESS COST
Tenant Address Sq. Ft.Puma Aero Marine 1005 Bunker Ave 60,000Wyle Laboratories 320 & 340 Corporate Way 19,970GRACE Aerospace 13541 Lake Newman St 13,000
AVERAGE APT. RENT: $965 PER UNIT/MO.16% INCREASE SINCE 2011
Employment 2016
Growth 2011-16
Average Wage
Growth 2011-16
TOTAL TECH TALENT 19,020 41.0% $80,585 19.5%Software Developers & Programmers 6,170 82.0% $90,128 21.2%Computer Support, Database & Systems 10,450 37.3% $71,215 19.5%Computer & Infor. Systems Managers 1,030 45.1% $123,690 5.5%Technology Engineering-Related 1,370 -23.0% $76,672 12.6%
TOTAL NON-TECH TALENT 87,970 9.1% $44,685 6.1%Sales 7,630 11.4% $60,302 -2.0%Administrative & Office Support 64,890 5.7% $38,447 6.2%Business Operations & Finance 11,960 24.3% $64,726 2.8%Marketing 3,490 26.9% $57,846 9.6%
The population of millennials in their 20s grew by 5,508 (4.1%) since 2010. That’s 12.3% of total growth in a population of 868,031.
Asking Rent: $19.07 PSF (up 10.7%); Vacancy: 15.9% (down -730 bps) (Q1 2017 data with change since Q1 2012)
Source: U.S. Bureau of Labor Statistics (Metro Area), April 2017.
Source: U.S. Census Bureau (City of Jacksonville), 2016.
Source: CBRE Research (Office Market), Q1 2017.
Source: CBRE Research (Office Market), 2017.
*Jacksonville Metro AreaSource: Relative Costs from Moody’s Analytics (metro area), Q1 2017; Apt, rent data from CBRE EA (City), Q1 2017.
DEGREE COMPLETIONS (2014-2015)
TOTAL TECH DEGREES 360 54.5%Computer Engineering 257 52.1%Math/Statistics 46 31.4%Other Tech Engineering 57 96.6%
28% BACHELOR’S OR HIGHER
FEMALE
MALE72%
28%
Source: U.S. Census Bureau (Metro Area), 2016.
Source: The National Center for Education Statistics (Region), July 2016.
Jacksonville Metro Area
49 Jacksonville, FL 23.70
Source: U.S. Census Bureau (City), 2016.
Growth 2011-15
EDUCATION ATTAINMENT
DEGREE COMPLETIONS (2014-2015)
TOTAL TECH DEGREES 679 15.9%Computer Engineering 331 20.4%Math/Statistics 78 -8.2%Other Tech Engineering 270 19.5%
30% BACHELOR’S OR HIGHER
Source: The National Center for Education Statistics (Region), July 2016.
Oklahoma City Metro Area
Source: U.S. Census Bureau (City), 2016.
Growth 2011-15

2017 SCORING TECH TALENT | CBRE ResearchA40

B1 © 2017 CBRE, Inc.
F U L L R E P O R T D A T A S U M M A R Y

2017 SCORING TECH TALENT | CBRE ResearchB2
W H A T I S T E C H T A L E N T A N D W H Y I S I T I M P O R T A N T ?
TABLE 1 TECH TALENT LABOR BY INDUSTRY (2016)Tech Talent Occupations in Each Industry as a % of U.S. Tech Talent
Industry% of Total Tech
Talent LaborCore High-Tech* 37.1%Management of Companies and Enterprises 6.0%Professional, Scientific, and Technical Services (Excluding High-Tech) 10.6%Information (Excluding High-Tech) 6.1%FIRE 7.9%Government 6.1%Transportation, Warehousing, and Wholesale 5.1%Manufacturing (Excluding High-Tech) 4.7%Education 4.8%Other 8.9%Healthcare 2.7%
*Includes computer software and services and computer product manufacturing.Source: U.S. Bureau of Labor Statistics (National), April 2016.
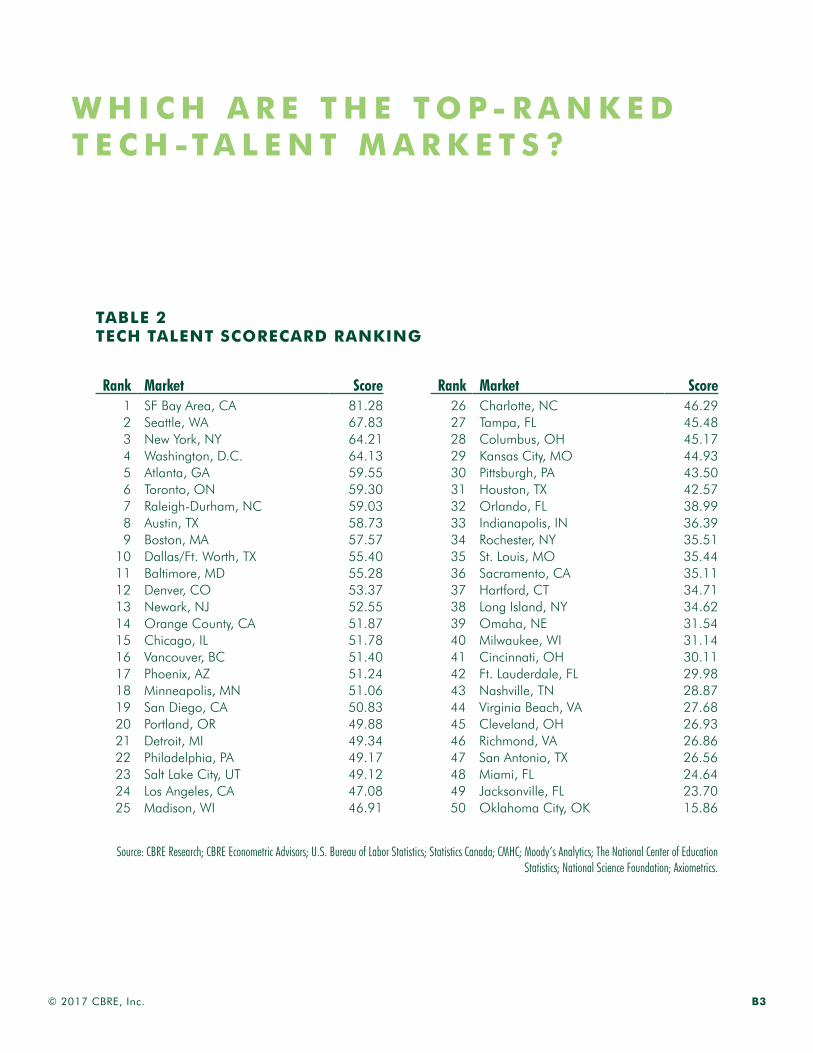
B3 © 2017 CBRE, Inc.
W H I C H A R E T H E T O P - R A N K E D T E C H -T A L E N T M A R K E T S ?
Rank Market Score1 SF Bay Area, CA 81.282 Seattle, WA 67.833 New York, NY 64.214 Washington, D.C. 64.135 Atlanta, GA 59.556 Toronto, ON 59.307 Raleigh-Durham, NC 59.038 Austin, TX 58.739 Boston, MA 57.57
10 Dallas/Ft. Worth, TX 55.4011 Baltimore, MD 55.2812 Denver, CO 53.3713 Newark, NJ 52.5514 Orange County, CA 51.8715 Chicago, IL 51.7816 Vancouver, BC 51.4017 Phoenix, AZ 51.2418 Minneapolis, MN 51.0619 San Diego, CA 50.8320 Portland, OR 49.8821 Detroit, MI 49.3422 Philadelphia, PA 49.1723 Salt Lake City, UT 49.1224 Los Angeles, CA 47.0825 Madison, WI 46.91
Rank Market Score26 Charlotte, NC 46.2927 Tampa, FL 45.4828 Columbus, OH 45.1729 Kansas City, MO 44.9330 Pittsburgh, PA 43.5031 Houston, TX 42.5732 Orlando, FL 38.9933 Indianapolis, IN 36.3934 Rochester, NY 35.5135 St. Louis, MO 35.4436 Sacramento, CA 35.1137 Hartford, CT 34.7138 Long Island, NY 34.6239 Omaha, NE 31.5440 Milwaukee, WI 31.1441 Cincinnati, OH 30.1142 Ft. Lauderdale, FL 29.9843 Nashville, TN 28.8744 Virginia Beach, VA 27.6845 Cleveland, OH 26.9346 Richmond, VA 26.8647 San Antonio, TX 26.5648 Miami, FL 24.6449 Jacksonville, FL 23.7050 Oklahoma City, OK 15.86
Source: CBRE Research; CBRE Econometric Advisors; U.S. Bureau of Labor Statistics; Statistics Canada; CMHC; Moody’s Analytics; The National Center of Education Statistics; National Science Foundation; Axiometrics.
TABLE 2TECH TALENT SCORECARD RANKING
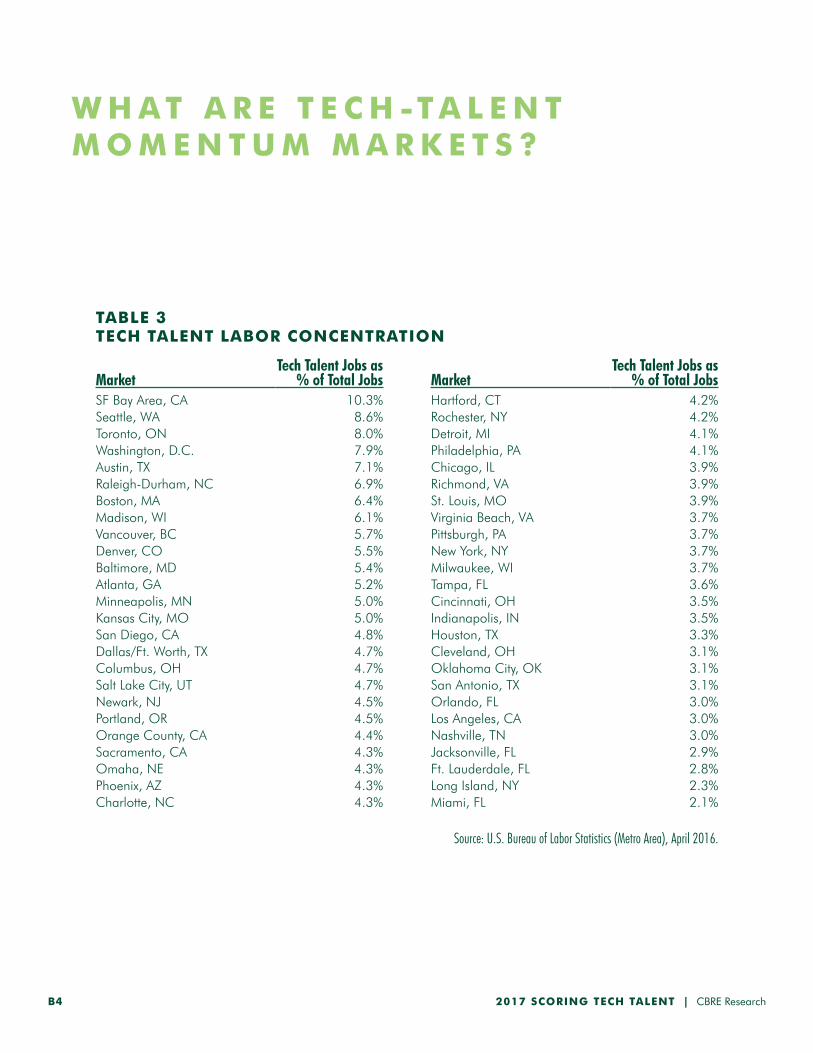
2017 SCORING TECH TALENT | CBRE ResearchB4
W H A T A R E T E C H -T A L E N T M O M E N T U M M A R K E T S ?
MarketTech Talent Jobs as
% of Total JobsSF Bay Area, CA 10.3%Seattle, WA 8.6%Toronto, ON 8.0%Washington, D.C. 7.9%Austin, TX 7.1%Raleigh-Durham, NC 6.9%Boston, MA 6.4%Madison, WI 6.1%Vancouver, BC 5.7%Denver, CO 5.5%Baltimore, MD 5.4%Atlanta, GA 5.2%Minneapolis, MN 5.0%Kansas City, MO 5.0%San Diego, CA 4.8%Dallas/Ft. Worth, TX 4.7%Columbus, OH 4.7%Salt Lake City, UT 4.7%Newark, NJ 4.5%Portland, OR 4.5%Orange County, CA 4.4%Sacramento, CA 4.3%Omaha, NE 4.3%Phoenix, AZ 4.3%Charlotte, NC 4.3%
MarketTech Talent Jobs as
% of Total JobsHartford, CT 4.2%Rochester, NY 4.2%Detroit, MI 4.1%Philadelphia, PA 4.1%Chicago, IL 3.9%Richmond, VA 3.9%St. Louis, MO 3.9%Virginia Beach, VA 3.7%Pittsburgh, PA 3.7%New York, NY 3.7%Milwaukee, WI 3.7%Tampa, FL 3.6%Cincinnati, OH 3.5%Indianapolis, IN 3.5%Houston, TX 3.3%Cleveland, OH 3.1%Oklahoma City, OK 3.1%San Antonio, TX 3.1%Orlando, FL 3.0%Los Angeles, CA 3.0%Nashville, TN 3.0%Jacksonville, FL 2.9%Ft. Lauderdale, FL 2.8%Long Island, NY 2.3%Miami, FL 2.1%
Source: U.S. Bureau of Labor Statistics (Metro Area), April 2016.
TABLE 3TECH TALENT LABOR CONCENTRATION

B5 © 2017 CBRE, Inc.
TABLE 4 TECH TALENT LABOR POOLS BY MARKET (2016)
TABLE 5 TECH LABOR POOL GROWTH RATES (2011-2016)
Labor Pool Size MarketTech Talent
TotalLarge Tech Talent Markets SF Bay Area, CA 328,070(>50,000 Labor Pool) New York, NY 246,180
Washington, D.C. 243,360Toronto, ON 212,500Dallas/Ft. Worth, TX 161,150Chicago, IL 143,190Seattle, WA 136,910Atlanta, GA 133,810Los Angeles, CA 126,730Boston, MA 115,560Houston, TX 97,550Minneapolis, MN 95,220Phoenix, AZ 83,140Detroit, MI 78,510Philadelphia, PA 77,700Denver, CO 77,310Baltimore, MD 72,710Austin, TX 68,810Orange County, CA 68,220San Diego, CA 66,340Vancouver, BC 65,100Raleigh-Durham, NC 60,900Newark, NJ 52,600St. Louis, MO 52,190Kansas City, MO 51,770Portland, OR 50,880
Small Tech Talent Markets Charlotte, NC 49,830(<50,000 Labor Pool) Columbus, OH 48,230
Tampa, FL 45,340Pittsburgh, PA 42,130Sacramento, CA 39,430Cincinnati, OH 36,450Orlando, FL 35,320Indianapolis, IN 35,010Cleveland, OH 32,120Salt Lake City, UT 31,750Milwaukee, WI 30,810San Antonio, TX 30,510Long Island, NY 29,870Virginia Beach, VA 27,660Nashville, TN 27,270Richmond, VA 24,940Hartford, CT 24,620Miami, FL 24,180Madison, WI 23,350Ft. Lauderdale, FL 22,370Rochester, NY 21,510Omaha, NE 20,780Jacksonville, FL 19,020Oklahoma City, OK 18,970
Labor Pool Size Market%
Changeby
VolumeLarge Tech Talent Markets Raleigh-Durham, NC 51.3% 20,660(>50,000 Labor Pool) SF Bay Area, CA 49.9% 109,280
Atlanta, GA 47.6% 43,180Detroit, MI 40.7% 22,710Portland, OR 40.4% 14,650Kansas City, MO 39.1% 14,540Vancouver, BC 36.8% 17,500Baltimore, MD 35.2% 18,940Phoenix, AZ 33.5% 20,870Seattle, WA 33.4% 34,260Dallas/Ft. Worth, TX 33.4% 40,310New York, NY 32.9% 60,962Chicago, IL 32.8% 35,370Toronto, ON 31.8% 51,300Houston, TX 31.4% 23,320Denver, CO 29.0% 17,370Austin, TX 28.3% 15,170San Diego, CA 27.7% 14,380Philadelphia, PA 27.1% 16,550Minneapolis, MN 25.5% 19,340Orange County, CA 23.2% 12,850Los Angeles, CA 19.0% 20,230Newark, NJ 16.5% 7,457Boston, MA 11.4% 11,790Washington, D.C. 9.6% 21,330St. Louis, MO 7.9% 3,830
Small Tech Talent Markets Charlotte, NC 77.1% 21,690(<50,000 Labor Pool) Tampa, FL 55.3% 16,140
Madison, WI 51.2% 7,910Miami, FL 46.8% 7,710Oklahoma City, OK 46.6% 6,030Salt Lake City, UT 45.3% 9,900Orlando, FL 45.0% 10,960Nashville, TN 43.5% 8,270Indianapolis, IN 42.3% 10,400Jacksonville, FL 41.0% 5,530Ft. Lauderdale, FL 37.2% 6,060San Antonio, TX 32.5% 7,480Richmond, VA 28.8% 5,570Omaha, NE 25.6% 4,240Sacramento, CA 25.3% 7,970Long Island, NY 24.0% 5,790Pittsburgh, PA 23.9% 8,140Milwaukee, WI 21.1% 5,370Cincinnati, OH 21.0% 6,330Cleveland, OH 18.3% 4,980Rochester, NY 17.8% 3,250Hartford, CT 17.1% 3,590Virginia Beach, VA 16.9% 3,990Columbus, OH 12.9% 5,510
Source: U.S. Bureau of Labor Statistics (Metro Area) April 2017, Statistics Canada (Metro Area), 2017.
Source: U.S. Bureau of Labor Statistics (Metro Area) April 2017, Statistics Canada (Metro Area), 2017.

2017 SCORING TECH TALENT | CBRE ResearchB6
W H A T D E F I N E S A T E C H T A L E N T M A R K E T ?
TABLE 6 TOP 10 MARKETS FOR EDUCATIONAL ATTAINMENT25+ Years Old, Bachelors Degree or Higher
TABLE 7 TOP 10 REGIONS FOR TECH DEGREE COMPLETIONS (2014-2015)
MarketEducational
Attainment RateSeattle, WA 62.1%Washington, D.C. 56.7%Madison, WI 55.0%Portland, OR 48.6%Raleigh-Durham, NC 48.4%Atlanta, GA 48.3%Austin, TX 48.3%Minneapolis, MN 48.3%Denver, CO 47.1%SF Bay Area, CA 46.7%
Source: U.S. Census Bureau (City/County), 2016.
Market
Tech Degree Completions (2014-2015)
Growth (2011-2015)
New York Metro Area 14,419 37.8%Long Island, NYNew York, NYNewark, NJ
Washington, D.C. Metro Area 13,058 40.9%Washington, D.C.Baltimore, MD
Los Angeles Metro Area 10,632 26.7%Los Angeles, CAOrange County, CA
Chicago Metro Area 7,866 15.6%Chicago, ILMilwaukee, WI
Boston Metro Area 7,507 40.5%SF Bay Area Metro Area 6,503 27.0%
Silicon Valley, CASan Francisco, CASan Francisco Peninsula, CAOakland, CA
Atlanta Metro Area 5,120 30.2%Phoenix Metro Area 4,744 18.9%Columbus Metro Area 4,655 33.8%Detroit Metro Area 4,614 60.7%
Source: The National Center for Education Statistics (Region), July 2016.

B7 © 2017 CBRE, Inc.
TABLE 8 WHERE ARE TECH TALENT WORKERS COMING FROM AND WHERE ARE THEY HEADED?
Source: CBRE Research, U.S. Bureau of Labor Statistics, The National Center for Education Statistics (Region)Los Angeles Metro Area includes Orange County
New York Metro Area includes Newark and Long IslandMiami Metro Area includes Ft. Lauderdale
Columbus Metro Area include Columbus, Cleveland and CincinnatiBay Area Metro Area includes San Francisco, Oakland and Silicon Valley
Chicago Metro Area includes Chicago and MilwaukeeWashington D.C. Metro Area includes Baltimore
*Tech degrees cover the most recent five-year period available (2011-2015) and tech jobs added cover the time period reflecting when most graduates would be counted in employment figures (2012-2016).
MarketTech Degrees (2011-2015)*
Tech Jobs Added (2012-2016)*
Brain Gain/Drain
SF Bay Area, CA 28,804 109,280 80,476Dallas/Ft. Worth, TX 17,750 40,310 22,560Seattle, WA 12,043 34,260 22,217Atlanta, GA 22,634 43,180 20,546Charlotte, NC 4,639 21,690 17,051
Houston, TX 8,578 23,320 14,742New York, NY 60,678 74,209 13,531Kansas City, MO 3,192 14,540 11,348Tampa, FL 5,808 16,140 10,332Portland, OR 7,563 14,650 7,087
Raleigh-Durham, NC 13,738 20,660 6,922Indianapolis, IN 3,514 10,400 6,886Austin, TX 9,660 15,170 5,510Minneapolis, MN 14,138 19,340 5,202Nashville, TN 3,337 8,270 4,933
Chicago, IL 36,459 40,740 4,281Miami, FL 9,817 13,770 3,953Jacksonville, FL 1,612 5,530 3,918San Antonio, TX 4,005 7,480 3,475Denver, CO 13,918 17,370 3,452
Oklahoma City, OK 3,170 6,030 2,860Richmond, VA 2,964 5,570 2,606Orlando, FL 8,806 10,960 2,154San Diego, CA 12,382 14,380 1,998Sacramento, CA 5,977 7,970 1,993
Detroit, MI 21,155 22,710 1,555Omaha, NE 2,916 4,240 1,324Madison, WI 6,695 7,910 1,215Hartford, CT 5,150 3,590 -1,560Columbus, OH 18,898 16,820 -2,078
St. Louis, MO 6,485 3,830 -2,655Virginia Beach, VA 6,828 3,990 -2,838Phoenix, AZ 23,969 20,870 -3,099Salt Lake City, UT 13,155 9,900 -3,255Philadelphia, PA 19,891 16,550 -3,341
Rochester, NY 8,953 3,250 -5,703Pittsburgh, PA 17,795 8,140 -9,655Los Angeles, CA 45,968 33,080 -12,888Washington, D.C. 56,623 40,270 -16,353Boston, MA 31,400 11,790 -19,610

2017 SCORING TECH TALENT | CBRE ResearchB8
TABLE 9TOP 10 MOST CONCENTRATED MILLENNIAL MARKETS* (2016)
Market
Population Concentration of Millennials
UNITED STATES 14.2%Madison, WI 26.5%Pittsburgh, PA 25.3%Boston, MA 24.6%Richmond, VA 21.8%Salt Lake City, UT 21.8%Hartford, CT 21.8%Minneapolis, MN 21.7%Orlando, FL 21.6%Seattle, WA 20.4%Columbus, OH 20.3%
U.S. Average = 4.6%
TABLE 10MILLENNIAL POPULATION CHANGE BY MARKET* (2010-2015)
Labor Pool Size Market % ChangeLarge Tech Talent Markets Seattle, WA 16.6%(>50,000 Labor Pool) Raleigh-Durham, NC 11.2%
Toronto, ON 9.5%SF Bay Area, CA 9.5%Atlanta, GA 9.3%Detroit, MI 9.2%Houston, TX 8.5%Phoenix, AZ 7.1%Denver, CO 7.0%Los Angeles, CA 6.4%Washington, D.C. 5.9%Orange County, CA 5.7%Austin, TX 5.5%Vancouver, BC 5.3%Dallas/Ft. Worth, TX 3.8%New York, NY 2.6%San Diego, CA 1.1%Philadelphia, PA 0.9%Boston, MA 0.8%Newark, NJ 0.5%Baltimore, MD -0.9%Chicago, IL -1.4%Minneapolis, MN -2.2%St. Louis, MO -5.3%Portland, OR 1.2%Kansas City, MO 0.5%
Small Tech Talent Markets Pittsburgh, PA 17.7%(<50,000 Labor Pool) Hartford, CT 17.7%
San Antonio, TX 15.6%Cleveland, OH 13.7%Charlotte, NC 13.3%Orlando, FL 12.3%Long Island, NY 8.7%Salt Lake City, UT 8.4%Sacramento, CA 7.5%Madison, WI 7.3%Miami, FL 7.0%Nashville, TN 6.8%Columbus, OH 6.4%Tampa, FL 6.3%Virginia Beach, VA 5.5%Jacksonville, FL 4.1%Indianapolis, IN 3.6%Richmond, VA 1.3%Rochester, NY 0.7%Omaha, NE -0.2%Ft. Lauderdale, FL -0.5%Oklahoma City, OK -1.3%Milwaukee, WI -1.9%Cincinnati, OH -12.7%
* Millennials aged 20-29 Years.Source: U.S. Bureau of Labor Statistics April 2016, Statistics Canada May
2017, CBRE Econometric Advisors, Axiometrics, CMHC, Q1 2017; U.S. Census Bureau (City/County), 2016.
* Millennials aged 20-29 years living in downtown areas..Source: U.S. Census Bureau (City/County), 2016.
TABLE 11TOP AND BOTTOM 10 MARKETS BY GENDER DIVERSITY IN TECH OCCUPATIONS (2015)
Source: U.S. Census Bureau (City/County), 2016.
Market % Male % FemaleWashington, D.C. 68.20 31.80Baltimore, MD 68.80 31.20Hartford, CT 69.50 30.50Sacramento, CA 69.80 30.20Richmond, VA 70.20 29.80Raleigh-Durham, NC 70.30 29.70Boston, MA 71.20 28.80Minneapolis, MN 71.50 28.50Philadelphia, PA 71.60 28.40San Antonio, TX 72.00 28.00
Kansas City, MO 79.20 20.80Salt Lake City, UT 78.90 21.10Phoenix, AZ 78.60 21.40Seattle, WA 77.30 22.70Oklahoma City, OK 77.20 22.80Austin, TX 76.80 23.20Cincinnati, OH 76.50 23.50Detroit, MI 75.91 24.09Cleveland, OH 75.90 24.10Indianapolis, IN 75.90 24.10
TOP 10(most diverse)
BOTTOM 10(least diverse)
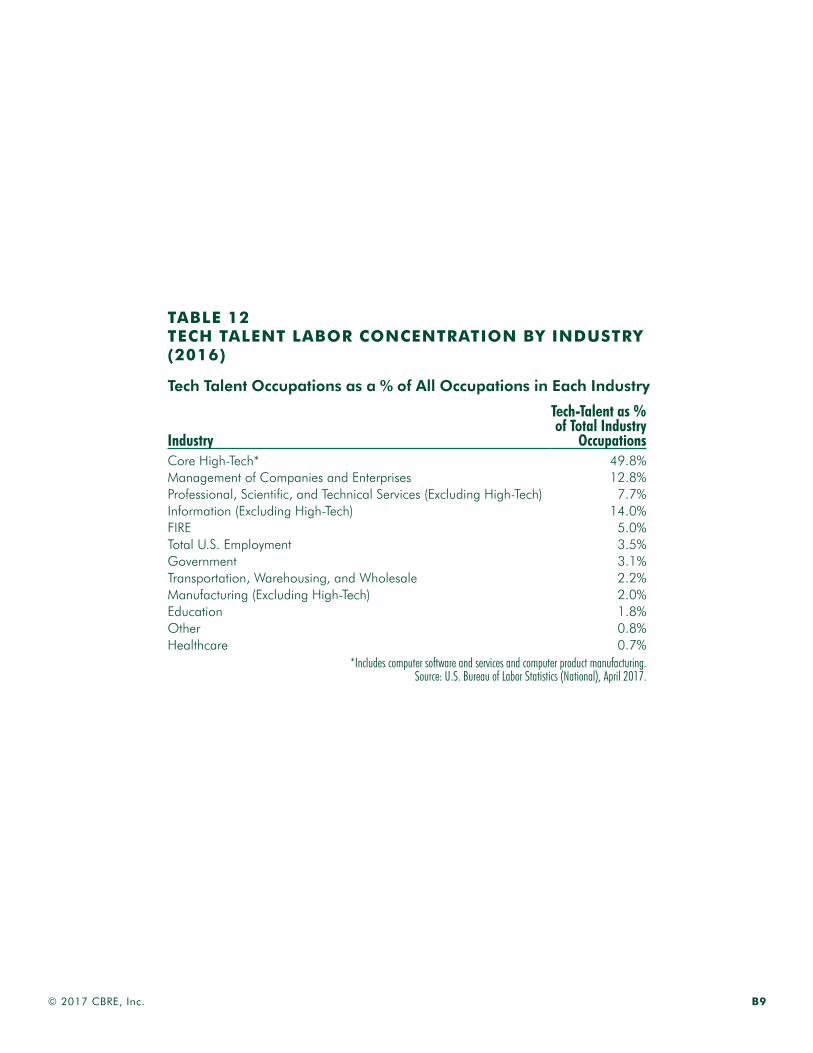
B9 © 2017 CBRE, Inc.
TABLE 12TECH TALENT LABOR CONCENTRATION BY INDUSTRY (2016)
Tech Talent Occupations as a % of All Occupations in Each Industry
Industry
Tech-Talent as % of Total Industry
OccupationsCore High-Tech* 49.8%Management of Companies and Enterprises 12.8%Professional, Scientific, and Technical Services (Excluding High-Tech) 7.7%Information (Excluding High-Tech) 14.0%FIRE 5.0%Total U.S. Employment 3.5%Government 3.1%Transportation, Warehousing, and Wholesale 2.2%Manufacturing (Excluding High-Tech) 2.0%Education 1.8%Other 0.8%Healthcare 0.7%
*Includes computer software and services and computer product manufacturing. Source: U.S. Bureau of Labor Statistics (National), April 2017.

2017 SCORING TECH TALENT | CBRE ResearchB10
T E C H T A L E N T H A S U N I Q U E C O N C E N T R A T I O N S A C R O S S M A R K E T S
TABLE 13TECH TALENT BY TYPE: SOFTWARE DEVELOPERS AND PROGRAMMERS
Note: Software developers include: computer programmers; software application developers, software systems software developers, and web developers.Source: U.S. Bureau of Labor Statistics, April 2017.
Market
Software Developers & Programmers
% of Tech
TalentSeattle, WA 70,740 52%SF Bay Area, CA 147,580 45%Boston, MA 47,840 41%New York, NY 100,310 41%Madison, WI 9,490 41%Portland, OR 20,410 40%Salt Lake City, UT 12,130 38%Sacramento, CA 14,680 37%Orange County, CA 25,360 37%Austin, TX 25,150 37%San Diego, CA 23,870 36%Newark, NJ 18,910 36%Denver, CO 27,750 36%Ft. Lauderdale, FL 7,770 35%Philadelphia, PA 26,910 35%Los Angeles, CA 43,480 34%Omaha, NE 7,110 34%Raleigh-Durham, NC 20,600 34%Vancouver, BC 22,000 34%Columbus, OH 16,080 33%Richmond, VA 8,290 33%Atlanta, GA 44,290 33%Hartford, CT 8,050 33%Jacksonville, FL 6,170 32%Orlando, FL 11,450 32%
Market
Software Developers & Programmers
% of Tech
TalentCleveland, OH 10,330 32%Phoenix, AZ 26,700 32%Tampa, FL 14,220 31%Detroit, MI 24,500 31%Miami, FL 7,540 31%Indianapolis, IN 10,880 31%Chicago, IL 44,390 31%Dallas/Ft. Worth, TX 49,410 31%Charlotte, NC 15,250 31%Pittsburgh, PA 12,760 30%Minneapolis, MN 28,630 30%Washington, D.C. 73,100 30%Kansas City, MO 15,400 30%Long Island, NY 8,810 29%Rochester, NY 6,290 29%San Antonio, TX 8,680 28%Milwaukee, WI 8,660 28%Oklahoma City, OK 5,330 28%Cincinnati, OH 10,170 28%Houston, TX 27,020 28%Baltimore, MD 20,010 28%St. Louis, MO 14,170 27%Nashville, TN 7,400 27%Toronto, ON 52,100 25%Virginia Beach, VA 6,750 24%
Ranked by % of Tech Talent

B11 © 2017 CBRE, Inc.
TABLE 14TECH TALENT BY TYPE: COMPUTER, SUPPORT DATABASE & SYSTEMS
Note: Computer Support, Database & Systems include: computer and information research scientists, computer systems analysts, information security analysts, database administrators, network and computer systems administrators, computer network architects, computer user support specialists, computer network support specialists,
and all other computer occupations.Source: U.S. Bureau of Labor Statistics, April 2017.
Market
Computer, Support Database
& Systems
% of Tech
TalentSan Antonio, TX 18,190 60%St. Louis, MO 30,500 58%Cincinnati, OH 20,650 57%Washington, D.C. 136,680 56%Tampa, FL 25,340 56%Miami, FL 13,490 56%Jacksonville, FL 10,450 55%Baltimore, MD 39,560 54%Indianapolis, IN 18,990 54%Chicago, IL 77,120 54%Phoenix, AZ 44,720 54%Omaha, NE 11,170 54%Charlotte, NC 26,650 53%Nashville, TN 14,570 53%Milwaukee, WI 16,450 53%Columbus, OH 25,700 53%Ft. Lauderdale, FL 11,910 53%Richmond, VA 13,200 53%Kansas City, MO 27,390 53%Minneapolis, MN 50,330 53%Dallas/Ft. Worth, TX 84,750 53%Orlando, FL 18,330 52%Houston, TX 50,530 52%Virginia Beach, VA 14,260 52%Cleveland, OH 16,480 51%
Market
Computer, Support Database
& Systems
% of Tech
TalentPhiladelphia, PA 39,310 51%Rochester, NY 10,870 51%Pittsburgh, PA 21,280 51%Atlanta, GA 67,510 50%Denver, CO 38,050 49%Long Island, NY 14,590 49%Raleigh-Durham, NC 29,630 49%Oklahoma City, OK 9,180 48%Hartford, CT 11,660 47%Detroit, MI 36,960 47%Los Angeles, CA 58,990 47%Madison, WI 10,860 47%Austin, TX 31,910 46%Newark, NJ 24,070 46%New York, NY 109,870 45%Sacramento, CA 17,150 43%Salt Lake City, UT 13,440 42%Portland, OR 21,320 42%Orange County, CA 27,230 40%Toronto, ON 83,600 39%Boston, MA 43,900 38%San Diego, CA 23,620 36%Seattle, WA 46,240 34%SF Bay Area, CA 107,560 33%Vancouver, BC 19,900 31%
Ranked by % of Tech Talent

2017 SCORING TECH TALENT | CBRE ResearchB12
TABLE 15TECH TALENT BY TYPE: COMPUTER & INFORMATION SYSTEMS MANAGERS
Source: U.S. Bureau of Labor Statistics, April 2017.
Market
Computer & Information
Systems Managers
% of Tech
TalentToronto, ON 26,000 12%Hartford, CT 2,990 12%Nashville, TN 3,040 11%Newark, NJ 5,340 10%Vancouver, BC 6,500 10%New York, NY 24,120 10%Boston, MA 11,200 10%Charlotte, NC 4,800 10%Minneapolis, MN 8,530 9%Oklahoma City, OK 1,680 9%Salt Lake City, UT 2,810 9%Cincinnati, OH 3,190 9%Long Island, NY 2,560 9%Milwaukee, WI 2,590 8%Cleveland, OH 2,640 8%Portland, OR 4,160 8%Chicago, IL 11,410 8%Atlanta, GA 10,620 8%Raleigh-Durham, NC 4,730 8%SF Bay Area, CA 25,440 8%Columbus, OH 3,720 8%Washington, D.C. 17,620 7%Indianapolis, IN 2,530 7%Orange County, CA 4,920 7%Kansas City, MO 3,730 7%
Market
Computer & Information
Systems Managers
% of Tech
TalentSeattle, WA 9,860 7%Philadelphia, PA 5,530 7%Los Angeles, CA 8,910 7%Richmond, VA 1,720 7%Madison, WI 1,600 7%Pittsburgh, PA 2,870 7%Phoenix, AZ 5,570 7%Detroit, MI 5,080 6%Omaha, NE 1,310 6%San Diego, CA 4,160 6%Ft. Lauderdale, FL 1,390 6%St. Louis, MO 3,240 6%Baltimore, MD 4,380 6%Houston, TX 5,790 6%Rochester, NY 1,270 6%Orlando, FL 2,060 6%Sacramento, CA 2,290 6%Miami, FL 1,370 6%Denver, CO 4,290 6%Jacksonville, FL 1,030 5%Dallas/Ft. Worth, TX 8,220 5%Tampa, FL 2,210 5%Virginia Beach, VA 1,280 5%Austin, TX 3,030 4%San Antonio, TX 1,150 4%
Ranked by % of Tech Talent

B13 © 2017 CBRE, Inc.
TABLE 16TECH TALENT BY TYPE: TECHNOLOGY ENGINEERING-RELATED
Note: Technology Engineering-Related includes: computer programmers; computer hardware engineers, electrical engineers, electronics engineers except computer, electrical and electronics drafters, electrical and electronics engineering technicians, and electro-mechanical technicians.
Source: U.S. Bureau of Labor Statistics, April 2017.
Market
Technology Engineering
Related
% of Tech
TalentVancouver, BC 16,700 26%Toronto, ON 50,800 24%San Diego, CA 14,690 22%Virginia Beach, VA 5,370 19%Orange County, CA 10,710 16%Detroit, MI 11,970 15%Oklahoma City, OK 2,780 15%Houston, TX 14,210 15%SF Bay Area, CA 47,490 14%Rochester, NY 3,080 14%Sacramento, CA 5,310 13%Long Island, NY 3,910 13%Austin, TX 8,720 13%Pittsburgh, PA 5,220 12%Los Angeles, CA 15,350 12%Baltimore, MD 8,760 12%Dallas/Ft. Worth, TX 18,770 12%Boston, MA 12,620 11%Salt Lake City, UT 3,370 11%Kansas City, MO 5,250 10%Milwaukee, WI 3,110 10%Orlando, FL 3,480 10%Portland, OR 4,990 10%Raleigh-Durham, NC 5,940 10%Denver, CO 7,220 9%
Market
Technology Engineering
Related
% of Tech
TalentAtlanta, GA 11,390 9%Cleveland, OH 2,670 8%Nashville, TN 2,260 8%St. Louis, MO 4,280 8%San Antonio, TX 2,490 8%Newark, NJ 4,280 8%Minneapolis, MN 7,730 8%Tampa, FL 3,570 8%Hartford, CT 1,920 8%Philadelphia, PA 5,950 8%Indianapolis, IN 2,610 7%Phoenix, AZ 6,150 7%Miami, FL 1,780 7%Seattle, WA 10,070 7%Jacksonville, FL 1,370 7%Chicago, IL 10,270 7%Richmond, VA 1,730 7%Cincinnati, OH 2,440 7%Washington, D.C. 15,960 7%Charlotte, NC 3,130 6%Madison, WI 1,400 6%Ft. Lauderdale, FL 1,300 6%Omaha, NE 1,190 6%Columbus, OH 2,730 6%New York, NY 11,880 5%
Ranked by % of Tech Talent

2017 SCORING TECH TALENT | CBRE ResearchB14
W H A T A R E T H E H I G H E S T- A N D L O W E S T- C O S T M A R K E T S T O O P E R A T E I N ?
TABLE 17TECH TALENT WAGES BY MARKET (2016)
Market
Average Tech
Talent Wage
Wage Relative
to U.S. Average
Talent Wage 5 yr.
GrowthSF Bay Area, CA $123,158 133% 14%Seattle, WA $113,906 123% 21%New York, NY $108,878 118% 16%Washington, D.C. $108,330 117% 9%Newark, NJ $107,612 116% 11%Boston, MA $103,979 113% 9%Denver, CO $100,383 109% 20%San Diego, CA $100,258 108% 13%Orange County, CA $99,256 107% 11%Baltimore, MD $98,824 107% 12%Hartford, CT $96,225 104% 15%Los Angeles, CA $95,617 103% 7%Houston, TX $95,229 103% 15%Raleigh-Durham, NC $94,400 102% 15%Philadelphia, PA $93,551 101% 10%Dallas/Ft. Worth, TX $93,339 101% 9%Charlotte, NC $93,105 101% 8%Long Island, NY $92,546 100% 9%Columbus, OH $92,510 100% 20%Atlanta, GA $92,380 100% 16%Sacramento, CA $91,892 99% 8%Minneapolis, MN $91,686 99% 12%Austin, TX $91,443 99% 8%Chicago, IL $91,200 99% 12%Richmond, VA $90,470 98% 13%
Market
Average Tech
Talent Wage
Wage Relative
to U.S. Average
TalentWage 5 yr.
GrowthPortland, OR $90,040 97% 13%San Antonio, TX $88,109 95% 16%St. Louis, MO $87,174 94% 13%Phoenix, AZ $86,231 93% 10%Virginia Beach, VA $84,514 91% 11%Detroit, MI $83,482 90% 9%Cincinnati, OH $83,390 90% 12%Kansas City, MO $83,024 90% 9%Salt Lake City, UT $82,803 90% 13%Toronto, ON* $82,385 89% 15%Orlando, FL $82,313 89% 13%Jacksonville, FL $80,585 87% 19%Pittsburgh, PA $80,432 87% 12%Omaha, NE $80,155 87% 10%Ft. Lauderdale, FL $79,484 86% 15%Nashville, TN $79,421 86% 13%Vancouver, BC* $79,402 86% 13%Milwaukee, WI $79,368 86% 8%Tampa, FL $78,434 85% 6%Cleveland, OH $78,378 85% 12%Madison, WI $77,773 84% 9%Indianapolis, IN $77,672 84% 8%Rochester, NY $77,649 84% 9%Miami, FL $75,700 82% 2%Oklahoma City, OK $74,424 81% 13%
*in CAD; Source: U.S. Bureau of Labor Statistics (Metro Area), April 2017.
U.S Average = 100%

B15 © 2017 CBRE, Inc.
TABLE 18AVERAGE U.S. TECH COMPANY OCCUPATION POOLS
Source: U.S. Bureau of Labor Statistics (National), April 2017.* Tech Talent includes the following occupation categories: software developers and programmers; computer support, database
and systems; technology and engineering related; and computer information system managers.
500 Employees
Occupation Pools Employees % of Total LaborTech Talent Employees* 250 50%Support Non-Tech Employees (excluding Management) 213 42%Management 37 8%
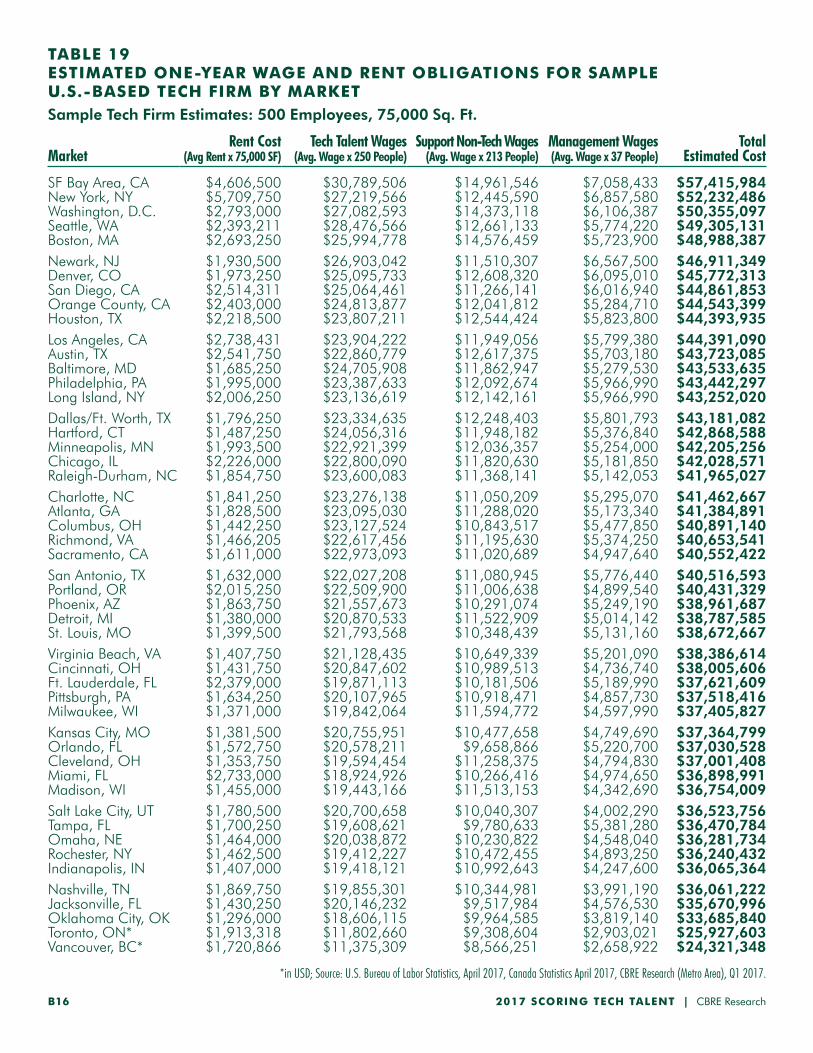
2017 SCORING TECH TALENT | CBRE ResearchB16
*in USD; Source: U.S. Bureau of Labor Statistics, April 2017, Canada Statistics April 2017, CBRE Research (Metro Area), Q1 2017.
TABLE 19ESTIMATED ONE-YEAR WAGE AND RENT OBLIGATIONS FOR SAMPLE U.S.-BASED TECH FIRM BY MARKETSample Tech Firm Estimates: 500 Employees, 75,000 Sq. Ft.
MarketRent Cost
(Avg Rent x 75,000 SF)Tech Talent Wages
(Avg. Wage x 250 People)Support Non-Tech Wages
(Avg. Wage x 213 People)Management Wages(Avg. Wage x 37 People)
Total Estimated Cost
SF Bay Area, CA $4,606,500 $30,789,506 $14,961,546 $7,058,433 $57,415,984New York, NY $5,709,750 $27,219,566 $12,445,590 $6,857,580 $52,232,486Washington, D.C. $2,793,000 $27,082,593 $14,373,118 $6,106,387 $50,355,097Seattle, WA $2,393,211 $28,476,566 $12,661,133 $5,774,220 $49,305,131Boston, MA $2,693,250 $25,994,778 $14,576,459 $5,723,900 $48,988,387Newark, NJ $1,930,500 $26,903,042 $11,510,307 $6,567,500 $46,911,349Denver, CO $1,973,250 $25,095,733 $12,608,320 $6,095,010 $45,772,313San Diego, CA $2,514,311 $25,064,461 $11,266,141 $6,016,940 $44,861,853Orange County, CA $2,403,000 $24,813,877 $12,041,812 $5,284,710 $44,543,399Houston, TX $2,218,500 $23,807,211 $12,544,424 $5,823,800 $44,393,935Los Angeles, CA $2,738,431 $23,904,222 $11,949,056 $5,799,380 $44,391,090Austin, TX $2,541,750 $22,860,779 $12,617,375 $5,703,180 $43,723,085Baltimore, MD $1,685,250 $24,705,908 $11,862,947 $5,279,530 $43,533,635Philadelphia, PA $1,995,000 $23,387,633 $12,092,674 $5,966,990 $43,442,297Long Island, NY $2,006,250 $23,136,619 $12,142,161 $5,966,990 $43,252,020Dallas/Ft. Worth, TX $1,796,250 $23,334,635 $12,248,403 $5,801,793 $43,181,082Hartford, CT $1,487,250 $24,056,316 $11,948,182 $5,376,840 $42,868,588Minneapolis, MN $1,993,500 $22,921,399 $12,036,357 $5,254,000 $42,205,256Chicago, IL $2,226,000 $22,800,090 $11,820,630 $5,181,850 $42,028,571Raleigh-Durham, NC $1,854,750 $23,600,083 $11,368,141 $5,142,053 $41,965,027Charlotte, NC $1,841,250 $23,276,138 $11,050,209 $5,295,070 $41,462,667Atlanta, GA $1,828,500 $23,095,030 $11,288,020 $5,173,340 $41,384,891Columbus, OH $1,442,250 $23,127,524 $10,843,517 $5,477,850 $40,891,140Richmond, VA $1,466,205 $22,617,456 $11,195,630 $5,374,250 $40,653,541Sacramento, CA $1,611,000 $22,973,093 $11,020,689 $4,947,640 $40,552,422San Antonio, TX $1,632,000 $22,027,208 $11,080,945 $5,776,440 $40,516,593Portland, OR $2,015,250 $22,509,900 $11,006,638 $4,899,540 $40,431,329Phoenix, AZ $1,863,750 $21,557,673 $10,291,074 $5,249,190 $38,961,687Detroit, MI $1,380,000 $20,870,533 $11,522,909 $5,014,142 $38,787,585St. Louis, MO $1,399,500 $21,793,568 $10,348,439 $5,131,160 $38,672,667Virginia Beach, VA $1,407,750 $21,128,435 $10,649,339 $5,201,090 $38,386,614Cincinnati, OH $1,431,750 $20,847,602 $10,989,513 $4,736,740 $38,005,606Ft. Lauderdale, FL $2,379,000 $19,871,113 $10,181,506 $5,189,990 $37,621,609Pittsburgh, PA $1,634,250 $20,107,965 $10,918,471 $4,857,730 $37,518,416Milwaukee, WI $1,371,000 $19,842,064 $11,594,772 $4,597,990 $37,405,827Kansas City, MO $1,381,500 $20,755,951 $10,477,658 $4,749,690 $37,364,799Orlando, FL $1,572,750 $20,578,211 $9,658,866 $5,220,700 $37,030,528Cleveland, OH $1,353,750 $19,594,454 $11,258,375 $4,794,830 $37,001,408Miami, FL $2,733,000 $18,924,926 $10,266,416 $4,974,650 $36,898,991Madison, WI $1,455,000 $19,443,166 $11,513,153 $4,342,690 $36,754,009Salt Lake City, UT $1,780,500 $20,700,658 $10,040,307 $4,002,290 $36,523,756Tampa, FL $1,700,250 $19,608,621 $9,780,633 $5,381,280 $36,470,784Omaha, NE $1,464,000 $20,038,872 $10,230,822 $4,548,040 $36,281,734Rochester, NY $1,462,500 $19,412,227 $10,472,455 $4,893,250 $36,240,432Indianapolis, IN $1,407,000 $19,418,121 $10,992,643 $4,247,600 $36,065,364Nashville, TN $1,869,750 $19,855,301 $10,344,981 $3,991,190 $36,061,222Jacksonville, FL $1,430,250 $20,146,232 $9,517,984 $4,576,530 $35,670,996Oklahoma City, OK $1,296,000 $18,606,115 $9,964,585 $3,819,140 $33,685,840Toronto, ON* $1,913,318 $11,802,660 $9,308,604 $2,903,021 $25,927,603Vancouver, BC* $1,720,866 $11,375,309 $8,566,251 $2,658,922 $24,321,348
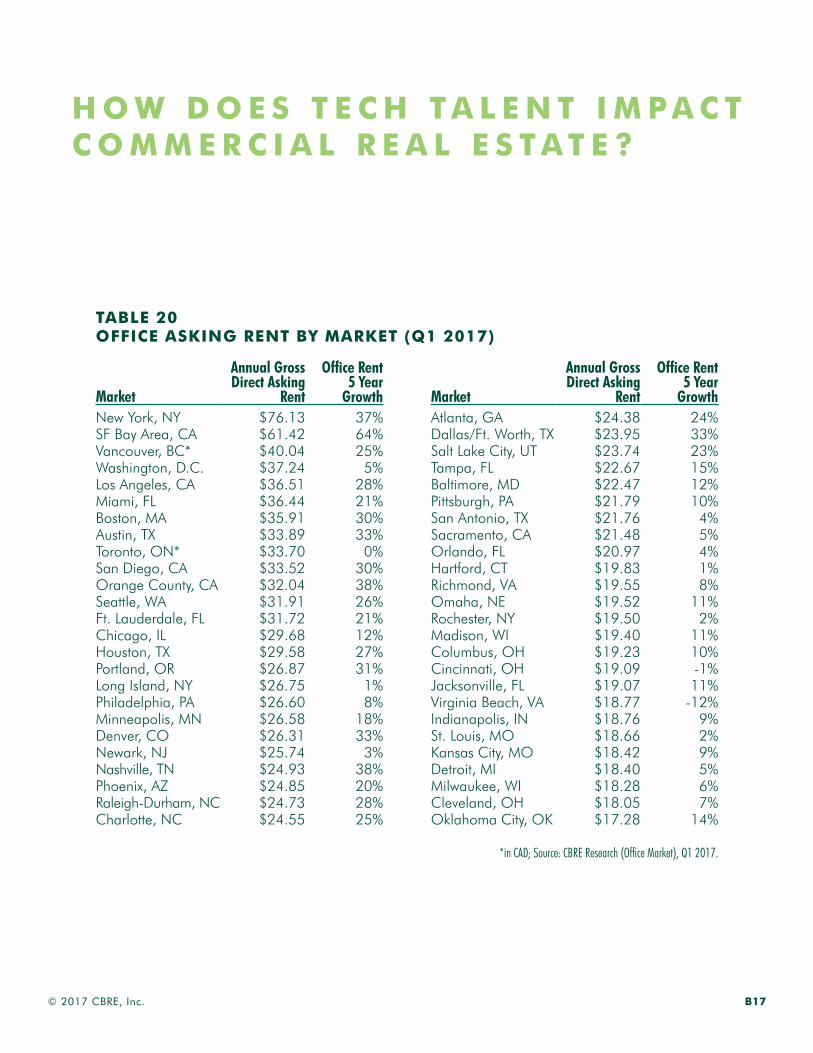
B17 © 2017 CBRE, Inc.
H O W D O E S T E C H T A L E N T I M PA C T C O M M E R C I A L R E A L E S T A T E ?
TABLE 20OFFICE ASKING RENT BY MARKET (Q1 2017)
Market
Annual Gross Direct Asking
Rent
Office Rent 5 Year
Growth New York, NY $76.13 37%SF Bay Area, CA $61.42 64%Vancouver, BC* $40.04 25%Washington, D.C. $37.24 5%Los Angeles, CA $36.51 28%Miami, FL $36.44 21%Boston, MA $35.91 30%Austin, TX $33.89 33%Toronto, ON* $33.70 0%San Diego, CA $33.52 30%Orange County, CA $32.04 38%Seattle, WA $31.91 26%Ft. Lauderdale, FL $31.72 21%Chicago, IL $29.68 12%Houston, TX $29.58 27%Portland, OR $26.87 31%Long Island, NY $26.75 1%Philadelphia, PA $26.60 8%Minneapolis, MN $26.58 18%Denver, CO $26.31 33%Newark, NJ $25.74 3%Nashville, TN $24.93 38%Phoenix, AZ $24.85 20%Raleigh-Durham, NC $24.73 28%Charlotte, NC $24.55 25%
Market
Annual Gross Direct Asking
Rent
Office Rent 5 Year
Growth Atlanta, GA $24.38 24%Dallas/Ft. Worth, TX $23.95 33%Salt Lake City, UT $23.74 23%Tampa, FL $22.67 15%Baltimore, MD $22.47 12%Pittsburgh, PA $21.79 10%San Antonio, TX $21.76 4%Sacramento, CA $21.48 5%Orlando, FL $20.97 4%Hartford, CT $19.83 1%Richmond, VA $19.55 8%Omaha, NE $19.52 11%Rochester, NY $19.50 2%Madison, WI $19.40 11%Columbus, OH $19.23 10%Cincinnati, OH $19.09 -1%Jacksonville, FL $19.07 11%Virginia Beach, VA $18.77 -12%Indianapolis, IN $18.76 9%St. Louis, MO $18.66 2%Kansas City, MO $18.42 9%Detroit, MI $18.40 5%Milwaukee, WI $18.28 6%Cleveland, OH $18.05 7%Oklahoma City, OK $17.28 14%
*in CAD; Source: CBRE Research (Office Market), Q1 2017.

2017 SCORING TECH TALENT | CBRE ResearchB18
TABLE 21OFFICE VACANCY RATE BY MARKET (Q1 2017)
Source: CBRE Research (Office Market), Q1 2017.
MarketVacancy
Rate5 Years Ago
(Q1 2012)SF Bay Area, CA 7.7% 11.6%New York, NY 7.7% 7.6%Madison, WI 8.0% 12.5%Nashville, TN 8.1% 12.6%Charlotte, NC 8.1% 20.1%Toronto, ON 9.0% 7.9%Orange County, CA 9.3% 15.1%Austin, TX 9.5% 16.4%Vancouver, BC 10.1% 7.6%Long Island, NY 10.4% 14.8%Orlando, FL 10.4% 19.2%Miami, FL 10.9% 19.2%Portland, OR 11.2% 15.2%Omaha, NE 11.2% 15.2%Tampa, FL 11.2% 20.4%San Diego, CA 11.5% 16.8%Salt Lake City, UT 11.6% 15.5%Seattle, WA 11.7% 17.2%Richmond, VA 11.8% 16.5%Pittsburgh, PA 11.9% 10.2%Columbus, OH 12.3% 18.2%Kansas City, MO 12.8% 17.6%Ft. Lauderdale, FL 12.9% 19.2%Milwaukee, WI 13.0% 16.7%Boston, MA 13.7% 15.5%
MarketVacancy
Rate5 Years Ago
(Q1 2012)Baltimore, MD 14.0% 16.8%Raleigh-Durham, NC 14.0% 18.0%Philadelphia, PA 14.1% 18.4%St. Louis, MO 14.2% 17.6%Denver, CO 14.2% 15.4%Los Angeles, CA 14.3% 17.8%Sacramento, CA 14.5% 23.7%San Antonio, TX 14.6% 17.5%Rochester, NY 14.8% 19.5%Chicago, IL 15.0% 17.3%Oklahoma City, OK 15.1% 12.8%Virginia Beach, VA 15.6% 17.6%Jacksonville, FL 15.9% 23.3%Hartford, CT 16.0% 18.6%Indianapolis, IN 16.4% 19.2%Washington, D.C. 16.5% 13.4%Newark, NJ 16.6% 15.8%Minneapolis, MN 16.7% 18.7%Detroit, MI 16.7% 26.9%Houston, TX 16.8% 14.5%Atlanta, GA 16.9% 23.3%Phoenix, AZ 17.3% 26.0%Cleveland, OH 18.4% 21.2%Cincinnati, OH 18.8% 23.1%Dallas/Ft. Worth, TX 19.1% 19.9%
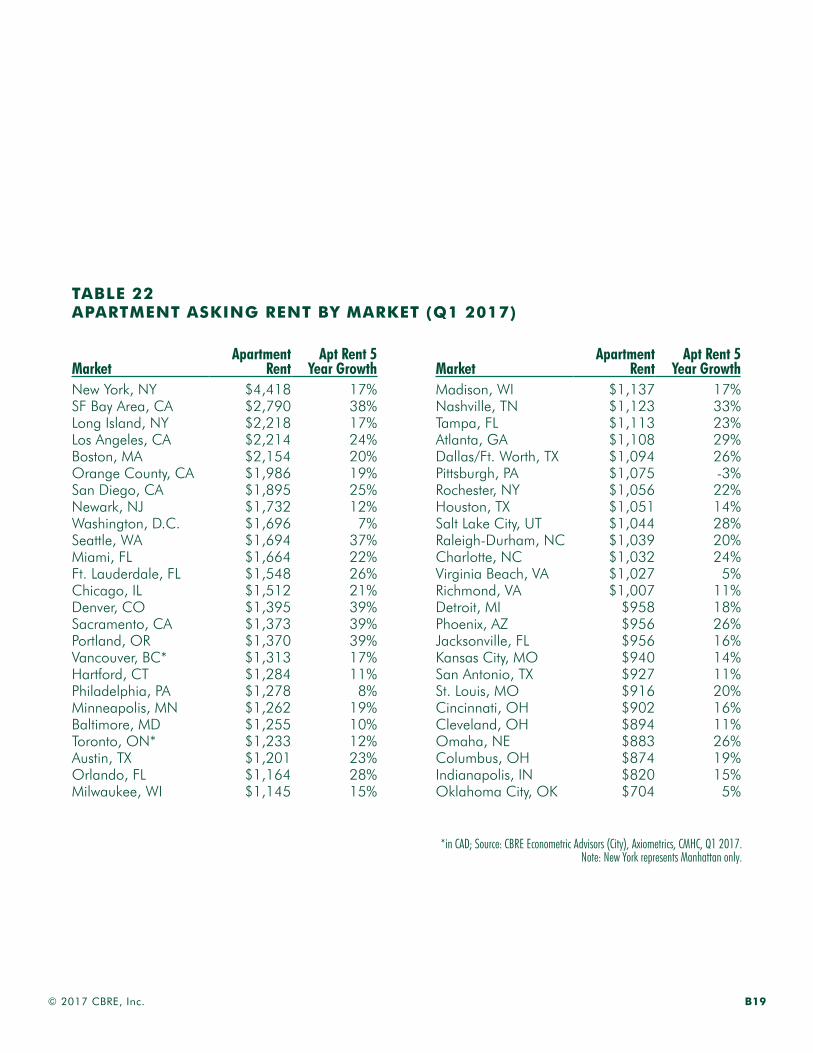
B19 © 2017 CBRE, Inc.
TABLE 22APARTMENT ASKING RENT BY MARKET (Q1 2017)
*in CAD; Source: CBRE Econometric Advisors (City), Axiometrics, CMHC, Q1 2017. Note: New York represents Manhattan only.
MarketApartment
RentApt Rent 5
Year GrowthNew York, NY $4,418 17%SF Bay Area, CA $2,790 38%Long Island, NY $2,218 17%Los Angeles, CA $2,214 24%Boston, MA $2,154 20%Orange County, CA $1,986 19%San Diego, CA $1,895 25%Newark, NJ $1,732 12%Washington, D.C. $1,696 7%Seattle, WA $1,694 37%Miami, FL $1,664 22%Ft. Lauderdale, FL $1,548 26%Chicago, IL $1,512 21%Denver, CO $1,395 39%Sacramento, CA $1,373 39%Portland, OR $1,370 39%Vancouver, BC* $1,313 17%Hartford, CT $1,284 11%Philadelphia, PA $1,278 8%Minneapolis, MN $1,262 19%Baltimore, MD $1,255 10%Toronto, ON* $1,233 12%Austin, TX $1,201 23%Orlando, FL $1,164 28%Milwaukee, WI $1,145 15%
MarketApartment
RentApt Rent 5
Year GrowthMadison, WI $1,137 17%Nashville, TN $1,123 33%Tampa, FL $1,113 23%Atlanta, GA $1,108 29%Dallas/Ft. Worth, TX $1,094 26%Pittsburgh, PA $1,075 -3%Rochester, NY $1,056 22%Houston, TX $1,051 14%Salt Lake City, UT $1,044 28%Raleigh-Durham, NC $1,039 20%Charlotte, NC $1,032 24%Virginia Beach, VA $1,027 5%Richmond, VA $1,007 11%Detroit, MI $958 18%Phoenix, AZ $956 26%Jacksonville, FL $956 16%Kansas City, MO $940 14%San Antonio, TX $927 11%St. Louis, MO $916 20%Cincinnati, OH $902 16%Cleveland, OH $894 11%Omaha, NE $883 26%Columbus, OH $874 19%Indianapolis, IN $820 15%Oklahoma City, OK $704 5%

2017 SCORING TECH TALENT | CBRE ResearchB20
TABLE 23COST OF LIVING RELATIVE TO U.S. AVERAGE
MarketCost of Living
Bay Area, CA 151%Orange County, CA 145%San Diego, CA 126%New York, NY 125%Long Island, NY 125%Seattle, WA 123%Los Angeles, CA 123%Washington, D.C. 122%Newark, NJ 122%Boston, MA 119%Miami, FL 113%Austin, TX 112%Fort Lauderdale, FL 111%Denver, CO 109%Portland, OR 108%Houston, TX 108%Baltimore, MD 107%
MarketCost of Living
Salt Lake City, UT 106%Sacramento, CA 106%Hartford, CT 106%Dallas/Ft. Worth, TX 105%Phoenix, AZ 105%Orlando, FL 103%Nashville, TN 102%San Antonio, TX 102%Atlanta, GA 101%Minneapolis, MN 101%Madison, WI 101%Jacksonville, FL 101%Tampa, FL 100%Raleigh-Durham, NC 99%Philadelphia, PA 99%Charlotte, NC 99%Richmond, VA 99%
MarketCost of Living
Chicago, IL 98%Milwaukee, WI 98%Virginia Beach, VA 98%Vancouver, BC 97%Oklahoma City, OK 97%Kansas City, MO 96%Columbus, OH 95%St. Louis, MO 94%Pittsburgh, PA 93%Omaha, NE 93%Indianapolis, IN 92%Detroit, MI 92%Cincinnati, OH 91%Toronto, ON 91%Cleveland, OH 90%Rochester, NY 89%
Source: Moody’s Analytics, Numbeo, Q1 2017.
U.S. Average = 100%

B21 © 2017 CBRE, Inc.
*in CAD; Source: U.S. Bureau of Labor Statistics April 2016, Statistics Canada May 2017, CBRE Econometric Advisors, Axiometrics, CMHC, Q1 2017.
TABLE 24TECH WAGE TO APARTMENT RENT RATIO
MarketAnnualized
Apartment Rent2016 Average
Annual Tech WageRent-to-Tech Wage Ratio
New York, NY $53,015 $108,878 30.8%Long Island, NY $26,620 $92,546 28.8%Los Angeles, CA $26,564 $95,617 27.8%SF Bay Area, CA $33,483 $123,158 27.2%Miami, FL $19,964 $75,700 26.4%
Boston, MA $25,845 $103,979 24.9%Orange County, CA $23,834 $99,256 24.0%Ft. Lauderdale, FL $18,570 $79,484 23.4%San Diego, CA $22,735 $100,258 22.7%Chicago, IL $18,139 $91,200 19.9%
Vancouver, BC* $15,756 $79,402 19.8%Newark, NJ $20,785 $107,612 19.3%Washington, D.C. $20,350 $108,330 18.7%Portland, OR $16,441 $90,040 18.3%Toronto, ON* $14,796 $82,385 18.0%
Sacramento, CA $16,473 $91,892 17.9%Seattle, WA $20,328 $113,906 17.8%Madison, WI $13,647 $77,773 17.5%Milwaukee, WI $13,746 $79,368 17.3%Tampa, FL $13,354 $78,434 17.0%
Orlando, FL $13,971 $82,313 17.0%Nashville, TN $13,474 $79,421 17.0%Denver, CO $16,741 $100,383 16.7%Minneapolis, MN $15,146 $91,686 16.5%Philadelphia, PA $15,338 $93,551 16.4%
Rochester, NY $12,675 $77,649 16.3%Pittsburgh, PA $12,898 $80,432 16.0%Hartford, CT $15,411 $96,225 16.0%Austin, TX $14,408 $91,443 15.8%Baltimore, MD $15,054 $98,824 15.2%
Salt Lake City, UT $12,528 $82,803 15.1%Virginia Beach, VA $12,319 $84,514 14.6%Atlanta, GA $13,301 $92,380 14.4%Jacksonville, FL $11,469 $80,585 14.2%Dallas/Ft. Worth, TX $13,127 $93,339 14.1%
Detroit, MI $11,490 $83,482 13.8%Cleveland, OH $10,726 $78,378 13.7%Kansas City, MO $11,285 $83,024 13.6%Richmond, VA $12,089 $90,470 13.4%Phoenix, AZ $11,478 $86,231 13.3%
Charlotte, NC $12,386 $93,105 13.3%Houston, TX $12,613 $95,229 13.2%Omaha, NE $10,600 $80,155 13.2%Raleigh-Durham, NC $12,464 $94,400 13.2%Cincinnati, OH $10,825 $83,390 13.0%
Indianapolis, IN $9,836 $77,672 12.7%San Antonio, TX $11,121 $88,109 12.6%St. Louis, MO $10,989 $87,174 12.6%Oklahoma City, OK $8,452 $74,424 11.4%Columbus, OH $10,491 $92,510 11.3%

WHITLEY COLLINS Global President Occupier Advisory & Transaction Services +1 310 363 4842 [email protected]
TODD HUSAK Managing Director Technology and Media Practice +1 650 494 5182 [email protected]
SPENCER G. LEVY Americas Head of Research Senior Economic Advisor +1 617 912 5236 [email protected] Follow Spencer on Twitter: @SpencerGLevy
COLIN YASUKOCHI Director, Research and Analysis +1 415 772 0190 [email protected]
LEXI RUSSELL Senior Research Analyst +1 415 772 0272 [email protected]
Disclaimer: Information contained herein, including projections, has been obtained from sources believed to be reliable. While we do not doubt its accuracy, we have not verified it and make no guarantee, warranty or representation about it. It is your responsibility to confirm independently its accuracy and completeness. This information is presented exclusively for use by CBRE clients and professionals and all rights to the material are reserved and cannot be reproduced without prior written permission of CBRE.
FOR MORE INFORMATION ABOUT OCCUPIER SERVICES, PLEASE CONTACT:
FOR MORE INFORMATION REGARDING CBRE RESEARCH, PLEASE CONTACT:
FOR MORE INFORMATION REGARDING SCORING TECH TALENT, PLEASE CONTACT:
C O N T A C T S
Visit the Scoring Tech Talent website for an interactive report overview.To learn more about CBRE Research or to download our reports, visit cbre.com/research.Additional U.S. research produced by CBRE Research can be found at www.cbre.us/research.
MARK SEELEY Senior Vice President +1 602 735 5230 [email protected]
FOR MORE INFORMATION ABOUT LABOR ANALYTICS, PLEASE CONTACT: