Embed Size (px)
Citation preview

Scopolamine Poisoning among Heroin Users —New York City, Newark, Philadelphia, and Baltimore, 1995 and 1996
Scopolamine Poisoning — ContinuedHeroin is mixed (“cut”) frequently with other substances primarily to increase its
weight for retail sale (e.g., mannitol and starch) and to add pharmacologic effects
(e.g., dextromethorphan and lidocaine). During 1995 and 1996, health departments
and poison-control centers in New York City (NYC); Newark, New Jersey; Philadelphia;
and Baltimore reported at least 325 cases of drug overdoses requiring medical treat-
ment in persons who had used “street drugs” sold as heroin that probably also con-
tained scopolamine, an anticholinergic drug. This report summarizes the clinical and
epidemiologic features of these cases, which represent a new type of drug overdose.
New York City
On March 16, 1995, eight persons were treated in the emergency department (ED)
of a Bronx hospital for acute onset of agitation and hallucinations approximately
1 hour after “snorting” heroin. On physical examination, all these persons had clinical
manifestations of anticholinergic toxicity (i.e., tachycardia, mild hypertension, dilated
pupils, dry skin and mucous membranes, and diminished or absent bowel sounds);
five had urinary retention. All were initially lethargic and became agitated and com-
bative after emergency medical service (EMS) personnel treated them with parenteral
naloxone, which is routinely used for suspected heroin overdose to reverse the toxic
effects of opioids (e.g., coma and respiratory depression). All patients received diaze-
pam or lorazepam for sedation, and signs and symptoms resolved during the next
12–24 hours.
During March 17–April 5, 1995, a total of 10 persons who reported using heroin
presented with similar clinical findings to hospital EDs in the Bronx and Manhattan.
Seven patients reported having used heroin with the street names “Point on Point” or
“Sting.” Specimens of “Sting” heroin obtained from two patients on April 5 and ana-
lyzed by gas chromatography-mass spectrophotometry (GC–MS) by the Bureau of
Laboratories, New York City Department of Health (NYCDOH), contained heroin and
scopolamine. The GC–MS patterns of the scopolamine suggested it was synthetic
rather than derived from a plant source. As a result of this finding, these patients were
treated for suspected scopolamine poisoning with physostigmine (an antidote for
anticholinergic toxicity). While receiving physostigmine intravenously for 5–10 min-
utes, their paranoia, hallucinations, and agitation resolved (1 ).
During March 17–April 10, 1995, NYCDOH issued press releases warning of
scopolamine-adulterated heroin sold under the street names “Point on Point” and
June 7, 1996 / Vol. 45 / No. 22
U.S. DEPARTMENT OF HEALTH AND HUMAN SERVICES / Public Health Service
457 Scopolamine Poisoning amongHeroin Users — 1995 and 1996
460 Trends in Rates of Homicide —United States, 1985–1994
464 Work-Related Injuries and IllnessesAssociated With Child Labor —United States, 1993
468 Update: Provisional Public HealthService Recommendations ForChemoprophylaxis AfterOccupational Exposure to HIV

“Sting.” During March 16, 1995–May 27, 1996, the New York City Poison Control Cen-
ter (NYPCC) recorded 121 cases that met a case definition of both historical or clinical
evidence of heroin use and clinical manifestations consistent with anticholinergic tox-
icity. NYPCC continues to receive several reports each week of presumed combined
heroin/scopolamine overdoses that respond to physostigmine treatment.
Newark
During a 24-hour period on December 28–29, 1995, a Newark hospital ED treated
22 persons who, approximately 30 minutes after using heroin with the street name
“Polo,” developed clinical manifestations of anticholinergic toxicity. Naloxone treat-
ment increased agitation and hallucinations, and physostigmine treatment resolved
the signs of toxicity.
On December 29, the New Jersey Poison Center (NJPC) informed all EDs in the
state about the syndrome of severe anticholinergic toxicity associated with the use of
”Polo“ heroin. Later that day, after GC–MS testing of a sample of heroin obtained from
a patient identified both heroin and scopolamine, the New Jersey Department of
Health (NJDOH) held an emergency press conference to alert the public to this drug
combination.
NJDOH and NJPC identified a total of 61 persons with 1) recent histories of snorting
or ingesting heroin with the street name “Polo” and 2) clinical manifestations of anti-
cholinergic toxicity for which treatment had been provided at 13 EDs in the Newark
metropolitan area during December 28–30, 1995. During December 31, 1995–June 1,
1996, NJPC was consulted 2–3 times each week about patients with similar conditions.
Philadelphia
During February 19–21, 1996, a total of 12 patients who had injected or snorted
heroin and had clinical manifestations of anticholinergic toxicity were treated in EDs
at four hospitals in northeastern Philadelphia and reported to the Delaware Valley Poi-
son Control Center (DVPCC). DVPCC estimated that in the Philadelphia area, during
February 19–21, a total of 35 persons were treated for apparent combined scopola-
mine/ heroin overdose, and during March 15–May 5, six persons were treated.
On May 9, a total of 27 persons presented to one Philadelphia hospital ED between
4:30 p.m. and 11 p.m. because of drug overdoses after taking heroin (mostly by injec-
tion). Of these, 16 were admitted to the hospital for observation because of tachy-
cardia, hallucinations, or semi-coma. In addition to these cases, DVPCC was consulted
about apparent anticholinergic toxicity among 72 heroin users during May 9–11, and
among 12 during May 22–23.
Baltimore
During May 10–12, 1996, a total of 22 persons presented to one hospital ED with
clinical manifestations of anticholinergic toxicity. Although these persons reported
taking heroin with street names of “Homicide” and “Super Buick,” GC–MS testing of
a specimen identified scopolamine, quinine, and dextromethorphan but no heroin.
Testing of Heroin by the Drug Enforcement Administration
The Drug Enforcement Administration monitors the purity of and adulterants in
heroin through “street” purchases of heroin (i.e., the “Domestic Monitor Program”
[DMP]) and testing of heroin obtained during criminal justice operations. From June
1979 through February 1996, DMP did not detect scopolamine in specimens sold as
458 MMWR June 7, 1996
Scopolamine Poisoning — Continued

heroin. During 1995, DMP made a total of 806 purchases, including 195 from Mary-
land, New Jersey, New York, and Pennsylvania; none contained scopolamine. During
1996, of the 147 DMP purchases, including 46 from Maryland, New Jersey, New York,
and Pennsylvania, only two (made in March 1996 in Elizabeth and Passaic, New Jer-
sey) contained scopolamine. In addition, four of 23,288 non-DMP specimens believed
to be heroin and obtained through criminal justice operations contained scopolamine.
The earliest was obtained in October 1995 in Bohemia, New York; two in March 1996
in Philadelphia; and one in March 1996 in NYC.Reported by: J Perrone, MD, R Hamilton, MD, L Nelson, MD, F DeRoos, MD, J Brubacher, MD,WJ Meggs, MD, RS Hoffman, MD, New York City Poison Control Center; P Ravikumar, PhD,S Reimer, PhD, A Ramon, MD, Bur of Laboratories; B Mojica, MD, New York City Dept of Health.RD Shih, MD, SM Marcus, MD, New Jersey Poison Center; E Karkevandian, DO, PM Podrazik,MD, JJ Calabro, DO, Newark Beth Israel Medical Center; JL York, MD, Clara Maass MedicalCenter, Newark; JW Farrell, JF French, T O’Connor, New Jersey Dept of Health. F Henretig, MD,Delaware Valley Poison Control Center, Philadelphia; W Thompson, Philadelphia CoordinatingOffice for Drug and Alcohol Abuse Programs; R Kastner, L Trimmer, Lancaster County Drug andAlcohol Commission, Lancaster, Pennsylvania. G Kelen, MD, K Nordenholtz, MD, B Blok, MD,G Green, MD, Dept of Emergency Medicine, Johns Hopkins Univ Hospital, Baltimore; TM Muller,S Soni, PhD, Laboratory Div, Baltimore City Police Dept; P Beilenson, MD, Baltimore City HealthDept; G Benjamin, MD, J Smialek, MD, Maryland State Dept of Health and Mental Hygiene.S Springer, C Heilig, Drug Enforcement Administration, US Dept of Justice. Div of Health Effectsand Hazard Evaluation, National Center for Environmental Health; National Center for HIV, STD,and TB Prevention (proposed), CDC.
Editorial Note: Scopolamine is pharmacologically similar to atropine and other bella-
donna drugs; it occurs naturally in plants, such as henbane, and can be manufactured.
Scopolamine and other anticholinergic drugs are components of some over-the-
counter and prescription medications used to prevent nausea, vomiting, and motion
sickness (e.g. scopolamine transdermal patches) or in combination with other medica-
tions.
The cases described in this report underscore one of the multiple risks associated
with use of illegal drugs (2,3 ). Before the reports of these cases in the Northeast, sco-
polamine contamination of heroin was usually not considered in the evaluation of
persons with drug overdose. In the initial clusters of anticholinergic toxicity, some
EMS staff and clinicians did not recognize the manifestations suggesting scopolamine
poisoning and treated some patients for drug overdose with the opioid antagonist
naloxone, which was associated with increased severity of agitation, hallucinations,
and other manifestations of anticholinergic toxicity. Following the identification of
scopolamine in the street drugs sold as heroin, notices and publicity from poison-
control centers, health departments, drug-treatment programs, syringe-exchange
programs, and other community agencies were used to rapidly inform clinicians, drug
users, and others in the community about the scopolamine contamination of heroin.
The use of multiple drugs and alcohol complicates assessment of the causes of the
acute mental status changes in drug users. Many of the cases described in this report
probably were associated with use of at least two drugs—heroin and scopolamine.
Overdose of heroin and other opioids usually is characterized by lethargy, respiratory
depression, and pinpoint pupils. In comparison, overdose with scopolamine and other
anticholinergic medicines is characterized by dilated pupils, flushing, dry skin and mu-
cous membranes, absent bowel sounds, rapid heart rate, and altered mental status
(4 ). Interaction between scopolamine and heroin or other drugs (e.g., cocaine) may
Vol. 45 / No. 22 MMWR 459
Scopolamine Poisoning — Continued

obscure the classical effects and differences. Although some of these patients im-
prove dramatically with intravenous physostigmine therapy, such treatment should
be administered only by experienced staff and with appropriate patient monitoring
because of the potential for serious side effects, including seizures, bronchospasm,
and bradycardia. For many patients, treatment may be restricted to sedation and ob-
servation, and manifestations may resolve over a period of hours. Naloxone remains
the treatment of choice for coma and severe respiratory distress associated with pos-
sible drug overdose. Because of the complexities of both the diagnosis and treatment
of patients with mental status changes and possible drug overdose, practitioners car-
ing for such patients should consult their local poison-control center.
Surveillance based on data from the system of poison-control centers in the North-
east was critical in recognizing the cause of this new type of drug overdose among
heroin users and alerting health departments. The impact of the effects of these drug
overdoses was limited further by timely recognition of the combined heroin and anti-
cholinergic toxicity, use of sedation or physostigmine to treat the patients, and prompt
investigation and reporting by state and local health departments. The continued oc-
currence of drug overdoses associated with use of scopolamine-containing heroin in-
dicates the need for clinicians, public health programs, and organizations working
with drug users to be aware of this problem; new cases should be reported promptly
to the local poison-control center and health department.
References1. Hamilton R, Perrone J, Meggs WJ, et al. Epidemic anticholinergic poisoning from scopolamine
tainted heroin [Abstract]. J Toxicol Clin Toxicol 1995;33:502.
2. CDC. AIDS associated with injecting-drug use—United States, 1995. MMWR 1996;45:392–8.
3. Kaa E. Impurities, adulterants and diluents of illicit heroin: changes during a 12-year period.
Forensic Sci International 1994;64:171–9.
4. CDC. Anticholinergic poisoning associated with an herbal tea—New York City, 1994. MMWR
1995;44:193–5.
Scopolamine Poisoning — Continued
Trends in Rates of Homicide — United States, 1985–1994
Homicide — ContinuedDuring 1993, a total of 26,009 homicides were reported in the United States; 71%
were firearm-related, and one third of all homicides occurred among persons aged
15–24 years (1 ). Since 1985, national homicide rates have increased sharply, espe-
cially firearm-related homicides and homicides among persons aged 15–24 years.
However, based on data from the Supplementary Homicide Report compiled by the
Federal Bureau of Investigation and reports from some cities, homicide rates have
been stable or declining since 1993. To examine this trend and to assess the relative
contributions of firearm- and nonfirearm-related homicide to these recent changes,
CDC analyzed national vital statistics data for 1985–1994. This report summarizes this
analysis, which indicates that overall rates of homicide increased from 1985 to 1991
and decreased from 1992 to 1994, and that during these two periods, rates for total
firearm-related homicides and homicide among persons aged 15–24 years increased
then stabilized but remained at record-high levels.
Data for 1985–1993 (the most recent year for which complete data are available)
were from final mortality statistics (FMS), and data for 1994 were from the Current
460 MMWR June 7, 1996
Scopolamine Poisoning — Continued

Mortality Sample (CMS). FMS are based on information from death certificates sub-
mitted by all 50 states and the District of Columbia, and CMS data provide national
estimates based on a 10% systematic sample of death certificates received monthly by
the vital statistics offices in the 50 states, the District of Columbia, and New York City.
A homicide was defined as death resulting from injury purposefully inflicted by an-
other person (including those caused by law enforcement officers or legal interven-
tion), for which the underlying cause listed on the death certificate was International
Classification of Diseases, Ninth Revision (ICD-9), codes E960–E978. Population esti-
mates are based on data from the Bureau of the Census (2 ). Trends for both firearm-
and nonfirearm-related homicides for all ages and for persons aged 15–24 years were
reviewed. To assess the accuracy with which the CMS data reflect final statistics, 1993
CMS and FMS homicide rates were compared. During sequential quarters of 1993,
compared with FMS quarterly homicide rates, CMS rates differed by –0.4%, –4.6%,
+1.2% and –4.6%, indicating the accuracy of weighted CMS rates for estimating final
homicide rates.
Quarterly homicide rates were analyzed using piecewise regression models to ac-
count for the observed changes in linear relations over time. Three time periods
(1985–1987, 1988–1991, and 1992–1994) were selected for analysis based on a prelimi-
nary review of scatter plots of observed rates and their apparent changes in slopes.
Statistical testing was conducted to determine whether the slope of the predicted val-
ues of the regression line (i.e., predicted rates) changed over each of these time peri-
ods. Statistical testing for a discontinuous piecewise regression model also was
conducted to determine whether the rate changed significantly at the beginning of
each new time period (i.e., “jump point”). No significant jump points were observed,
and analyses consistently indicated that the slope of the regression line for 1985–1987
was similar to that for 1988–1991. Therefore, regression lines are presented only for
two periods: 1985–1991 and 1992–1994. Overall results and interpretation of the
piecewise model using two pieces are no different from those using a model with
three pieces.
During 1985–1991, the overall rate of homicide in the United States increased sig-
nificantly (p<0.01) (slope=<0.1, 4% annually); during 1992–1994, the rate decreased
significantly (p<0.01) (slope=–0.1, 1% annually) (Figure 1). During 1985–1991,
nonfirearm-related homicide rates remained stable, and firearm-related homicide
rates increased significantly (p<0.01). During 1992–1994, nonfirearm-related homicide
rates declined significantly (p<0.01), and firearm-related homicide rates stabilized.
During 1985–1991, the rate of total homicide increased significantly for persons
aged 15–24 years (p<0.01) (slope=0.4, 16% annually). Firearm-related homicide rates
for this age group also increased during 1985–1991 (p<0.01) (slope=0.4, 23% annually)
(Figure 2), with most of the increase occurring during 1988–1991. During 1992–1994,
the rates of total and firearm-related homicide were stable. For all other age groups,
the trend in firearm-related homicide rates followed a similar pattern, with significant
increases during 1985–1991 (p<0.01) and stable rates during 1992–1994 (Figure 2).
Nonfirearm-related homicide rates for persons aged 15–24 years and all other ages
were lower than firearm-related homicide rates and were stable during 1985–1991 and
decreased significantly during 1992–1994 (p<0.01).
Analysis of firearm-related homicide rates by sex for persons aged 15–24 years
indicates that rates for males and females reflected the overall trend for this age
Vol. 45 / No. 22 MMWR 461
Homicide — Continued

0
3
6
9
12
15
Rat
e
Total
Firearm
Nonfirearm
1985 1986 1987 1988 1989 1990 1991 1992 1993 1994
Quarter and Year
Symbol=ObservedLine=Predicted
*Per 100,000 population.†Final Mortality Statistics were used for 1985–1993. Current Mortality Sample was used for1994.
FIGURE 1. Observed and predicted homicide rates*, by method of injury, quarter,and year — United States, 1985–1994†
0
4
8
12
16
20
24
Rat
e
1985 1986 1987 1988 1989 1990 1991 1992 1993 1994
Quarter and Year
15-24 Years0-14, >25 Years
Symbol=ObservedLine=Predicted
_
*Per 100,000 population.†Final Mortality Statistics were used for 1985–1993. Current Mortality Sample was used for1994.
FIGURE 2. Observed and predicted firearm-related homicide rates* in persons aged15–24 years and all others, by age group, quarter, and year — United States,1985–1994†
462 MMWR June 7, 1996
Homicide — Continued

group. Rates for females were substantially lower than those for males. For both
sexes, rates increased significantly during 1985–1991 (p<0.01) and stabilized during
1992–1994.Reported by: Div of Violence Prevention, Office of Statistics and Programming, National Centerfor Injury Prevention and Control; Div of Vital Statistics, National Center for Health Statistics,CDC.
Editorial Note: The findings in this report confirm that the overall homicide rate in-
creased rapidly during the late 1980s and began to decline in 1992; in addition, non-
firearm-related homicide rates decreased, and the percentage of firearm-related
homicides increased. During 1985–1994, the percentage of firearm-related homicides
among all homicides in the total population increased from 60% to 72% and among
persons aged 15–24 years, from 67% to 87% (3 ). These increases illustrate that
changes in overall homicide rates primarily reflect changes in firearm-related homi-
cides. The stabilization of firearm-related homicide rates during 1992–1994—particu-
larly among those aged 15–24 years—reflects a change from the increasing rates in
previous years, even though rates remain at record-high levels. The findings in this
report also indicate the usefulness of CMS data as a source of information for moni-
toring homicide in the United States. Because of the timely availability of CMS data
and their accuracy in reflecting final mortality-based homicide rates, these data enable
more timely analyses of temporal trends, objective policy formulation, and measure-
ment of progress toward public health goals.
The findings in this report are subject to at least two limitations. First, because of
the small numbers based on CMS data, rates were not examined among age-, race-,
and sex-specific subgroups. Second, estimates for some causes of death may be in-
complete or skewed because reporting of the underlying cause of death data may not
have been complete when the monthly sample was obtained (the data for this poten-
tial undercount are adjusted in the annual summary [2 ]).
Strategies for preventing homicide and violence require integration of approaches
from multiple disciplines, including criminal justice, education, social services, com-
munity advocacy, and public health. For example, public health approaches to prevent
violence have focused on 1) changing individual knowledge, skills, and/or attitudes;
2) changing the social and physical environments; and 3) increasing community
awareness of the causes and prevention of violence. The public health community
also has recognized the influence of social class and poverty on violence. Communi-
ties increasingly are adopting programs emphasizing strategies to enhance the skills
of youth and parents to reduce violence. These strategies include, for example,
1) school-based curricula that teach coping, communication, and mediation skills (4 );
2) family-intervention programs that focus on parental training to positively alter pa-
rental practices and family cohesion (5 ); and 3) preschool efforts to develop intellec-
tual and social skills (6 ). Because evaluation of prevention strategies is a critical
component of public health interventions, CDC is evaluating the effectiveness of se-
lected programs in reducing violent behavior and injury (7 ).
Homicide and assaultive violence now are recognized as global public health prob-
lems. Although the U.S. homicide rate ranks higher overall and higher for males aged
15–24 years than those of other highly industrialized countries (8,9 ), in many less-
industrialized countries homicide rates exceed those in the United States (8 ). To ad-
dress this global problem, in May 1996 the 190 nations of the World Health Organiza-
Vol. 45 / No. 22 MMWR 463
Homicide — Continued

tion (WHO) passed a resolution declaring violence a worldwide public health problem,
urging member states to assess the public health impact of violence, and requesting
the Director-General of WHO to initiate a science-based public health approach to vio-
lence prevention. This resolution provides a scientific framework for action through-
out the world addressing global violence.
References1. Gardner P, Hudson BL. Advance report of final mortality statistics, 1993. Hyattsville, Maryland:
US Department of Health and Human Services, Public Health Service, CDC, National Center
for Health Statistics, 1996. (Monthly vital statistics report; vol 44, no. 7, suppl).
2. Singh GK, Royer CE. Documentation of the current mortality sample file for 1994 data.
Hyattsville, Maryland: US Department of Health and Human Services, Public Health Service,
CDC, National Center for Health Statistics, 1996.
3. CDC. Injury mortality: national summary of injury mortality data, 1986–1992. Atlanta, Georgia:
US Department of Health and Human Services, Public Health Service, CDC, 1995.
4. Hammond WR, Yung BR. Preventing violence in at-risk African-American youth. J Health Care
Poor Underserved 1991;2:359–73.
5. Tolan P, Guerra N. What works in reducing adolescent violence: an empirical review of the
field. Boulder, Colorado: University of Colorado, Boulder, Institute for Behavioral Sciences, Cen-
ter for the Study and Prevention of Violence, 1994:29.
6. Zigler E, Taussing C, Black K. Early childhood intervention: a promising preventative for juvenile
delinquency. Am Psychol 1992;47:997–1006.
7. Powell KE, Hawkins DH, eds. Youth violence prevention: descriptions and baseline data from
13 evaluation projects. Am J Prev Med 1996;12(suppl) (in press).
8. World Health Organization. 1994 World health statistics annual. Geneva, Switzerland: World
Health Organization, 1995.
9. Fingerhut LA, Kleinman JC. International and interstate comparisons of homicide among
young males. JAMA 1990;263:3292–5.
Homicide — Continued
Work-Related Injuries and Illnesses Associated With Child Labor —United States, 1993
Child Labor — ContinuedDuring 1993, an estimated 2.1 million persons aged 16–17 years in the United
States were employed* (1 ). Although many children aged <16 years work, employ-
ment data are neither routinely collected nor reported for this age group, and there are
no reliable estimates of the number of children in this age group who work. During
summer months, when most children are not in school, employment and hours
worked by children aged <18 years increase substantially. To characterize workplace-
related health and safety hazards for children, CDC’s National Institute for Occupa-
tional Safety and Health (NIOSH) analyzed 1993 data for workers aged <18 years from
the Survey of Occupational Injuries and Illnesses (SOII), a survey administered by the
Bureau of Labor Statistics (BLS), U.S. Department of Labor.† This report summarizes
the results of this analysis and indicates that substantial numbers of persons aged
<18 years sustain work-related injuries and illnesses each year.
*Wage and salary workers (including domestic and other private household workers), self-employed persons, and unpaid workers who work ≥15 hours a week in family-operated busi-nesses.
†For persons aged <20 years, BLS publication of SOII data used the standard age groups of<14 years, 14–15 years, and 16–19 years.
464 MMWR June 7, 1996
Homicide — Continued

The SOII is a collaborative federal/state program administered by BLS and is based
on employer reports from approximately 250,000 private industries in the United
States (2 ); the sampling frame is representative at the national level and at the state
level for most states (data for 1993 were the most recent available).§ Employers iden-
tify injuries and illnesses that meet recordkeeping requirements¶ of the Occupational
Safety and Health Administration (OSHA); based on these data, BLS estimates the
national incidence of work-related injuries and illnesses. For those injuries and ill-
nesses resulting in lost work days, employers provide demographic information and
data about the nature and circumstances of injuries and illnesses. Because employ-
ment data provided by employers were not stratified by age, injury and illness rates
could not be calculated for specific age groups.
National Estimates
In 1993, persons aged <18 years incurred an estimated 21,620 injuries and illnesses
involving lost work days. Of these, 24% involved 1 lost work day; 43%, 2–5 days; 13%,
6–10 days; 13%, 11–30 days; and 8%, ≥31 days (median: 3 days). Most (96%) injuries
and illnesses occurred among persons aged 16–17 years, and males accounted for
59% of cases. Sprains/strains were the most commonly reported problem (31%), fol-
lowed by cuts/lacerations (17%), contusions/abrasions (13%), heat burns (8%), and
fractures/dislocations (5%).
Injured and ill persons were employed most frequently by eating and drinking es-
tablishments (39%), followed by grocery stores (14%), nursing and personal-care fa-
cilities (6%), and department stores (5%). The most common occupations were food
preparation and service workers (i.e., waiters and waitresses, cooks, and food counter
and kitchen workers) (37%), followed by cashier (10%), stock handler or bagger (9%),
health or nursing aide (7%), and janitor and cleaner (5%).
Common events resulting in injury included falls on the same level (i.e., falls to
floors and falls onto or against objects) (21%), overexertion (i.e., from lifting, pulling,
pushing, turning, wielding, holding, carrying, or throwing objects) (17%), striking
against objects (i.e., bumping into, stepping on, kicking, and being pushed or thrown
into or against objects) (10%), contact with hot objects or substances (9%), being
struck by falling objects (7%), and being struck by a slipping hand-held object (e.g.,
knife, razor, or tool) (6%).
State-Specific Variations
In general, national patterns were reflected at the state level, although there were
state-specific variations. Median number of lost work days ranged from 1 day (Ne-
braska and Vermont) to 6 days (Alabama, Arkansas, New York, and Wyoming) (Ta-
ble 1). The most common worksites were eating and drinking establishments and
grocery stores. However, in Alaska, laundry, cleaning, and garment services and the
manufacture of specific food products each accounted for 16%–17% of cases. In Cali-
§The base sample for SOII is designed to produce national estimates. However, each year,approximately 40 states participate in a federal/state cooperative program through which, inthese states, the base sample is augmented to generate state-specific estimates that meet theindividual needs of participating states. In 1993, 42 states participated in this program.
¶OSHA requires employers to record information on every occupational illness and injury thatinvolves one or more of the following: loss of consciousness, restriction of work or motion,transfer to another job, or medical treatment (other than first aid). Employers who are selectedfor the SOII sample but who are not usually required to keep these records are provided witha copy of instructions and recordkeeping forms for the survey.
Vol. 45 / No. 22 MMWR 465
Child Labor — Continued

fornia, worksites providing social and rehabilitation services accounted for 24% of
cases. In Florida, Nevada, and South Carolina, 12%–15% of incidents occurred in work-
sites providing amusement and recreation services. In Hawaii, nearly one fourth (24%)
of incidents occurred in construction/special trade worksites (e.g., carpentry and
painting). Hotels and motels were the most common site of work-related injuries and
illnesses in Vermont (27%) and second most common in Utah (11%).
The types of events and exposures resulting in injuries and illnesses varied from
national patterns in some states. Exposures to caustic, noxious, or allergenic sub-
stances accounted for 11%–23% of cases in Alaska, Montana, Nebraska, Nevada, New
Mexico, and Wyoming. Exposure to sun accounted for 22% of cases in Vermont, and
falls through roofs accounted for 28% of injuries in Wyoming.Reported by: Div of Safety Research, National Institute for Occupational Safety and Health, CDC.
Editorial Note: The findings in this report are the first to provide comparable state-
specific data for work-related injuries and illnesses among persons aged <18 years;
however, the inability to calculate state-specific rates limits comparisons between
states. Although many state-specific patterns of injuries and illnesses reflected na-
tional patterns, the variations identified are important for targeting prevention efforts
at the state level. Workers’ compensation data can provide supplemental information
to assist state-specific intervention efforts (3–7 ).
TABLE 1. Estimated number of injuries and illnesses and median number of lost workdays among persons aged <18 years, by state* — 1993
State
No.injuries and
illnessesMedian no.
lost work days State
No.injuries and
illnessesMedian no.
lost work days
Alabama 330 6 Missouri 615 5
Alaska 86 3 Montana 84 4
Arizona 592 2 Nebraska 440 1
Arkansas 238 6 Nevada 159 5
California 1418 2 New Jersey 248 3
Connecticut 220 4 New Mexico 231 2
Delaware 39 5 New York 1060 6
Florida 1527 3 North Carolina 947 3
Georgia 499 3 Oklahoma 383 4
Hawaii 141 4 Oregon 410 2
Indiana 706 3 Pennsylvania 719 3
Iowa 340 3 Rhode Island 158 2
Kansas 225 3 South Carolina 234 2
Kentucky 490 3 Tennessee 859 4
Louisiana 175 4 Texas 992 3
Maine 93 4 Utah 303 3
Maryland 425 2 Vermont 24 1
Massachusetts 519 4 Virginia 686 3
Michigan 544 4 Washington 361 2
Minnesota 336 4 Wisconsin 435 4
Mississippi 227 3 Wyoming 43 6
*Data not available from Colorado, District of Columbia, Idaho, Illinois, New Hampshire, NorthDakota, Ohio, South Dakota, and West Virginia because the sample design in these statescould not generate state-specific estimates.
Source: Survey of Occupational Injuries and Illnesses, Bureau of Labor Statistics, U.S. Depart-ment of Labor.
466 MMWR June 7, 1996
Child Labor — Continued

The approximately 22,000 injuries and illnesses involving lost work days among
children aged <18 years in 1993 is probably an underestimate because SOII excludes
some categories (e.g., self-employed workers, farms with <11 employees, private
households, and government employees) (2 ); employment data suggest that at least
11% of working children aged <18 years are not represented by the SOII (1 ). These
estimates exclude injuries and illnesses that did not result in lost work days or in
death. During 1992, an estimated 64,000 children aged <18 years were treated in emer-
gency departments for work-related injuries; approximately 70 die from work-related
injuries each year (8 ).
Safety and health regulations, such as those promulgated and enforced by OSHA,
apply to workers of all ages. In addition, children aged <18 years are protected by
provisions of child labor laws. For example, federal child labor laws specifically pro-
hibit cooking and baking by persons aged 14–15 years (9 ); however, in this analysis,
one third of cases among children aged 14–15 years occurred among persons identi-
fied as cooks. During 1983–1990, 1475 serious injuries among persons aged <18 years
were associated with violations of federal child labor laws (10 ), and studies during the
1980s suggest that 38%–86% of work-related deaths among children were associated
with activities prohibited by federal child labor laws (8 ).
The risks for work-related injuries and illnesses among workers of all ages can be
reduced through adherence to routine precautions such as prescribed housekeeping
practices; training and safe work procedures; use of proper shoes, gloves, and protec-
tive clothing; and maintenance and use of equipment with safety features. In addition,
workers aged <18 years should not be required to lift objects weighing >15 pounds
more often than once per minute or ever to lift objects >30 pounds; tasks involving
continuous lifting should never last more than 2 hours (8 ). Children aged <18 years
should not participate in work requiring routine use of respirators (a means of protect-
ing workers from inhaling hazardous substances) (8 ). Employers should be knowl-
edgeable about and comply with child labor laws, and school guidance counselors
and physicians who sign work permits for children also should be familiar with child
labor laws and ensure that the work they approve does not involve prohibited activi-
ties.
Most persons aged <18 years enter the workplace with minimal prior experience
for a job. During the summer of 1992, more than half (54%) of persons aged
14–16 years treated in emergency departments for work injuries reported that they
had received no training in prevention of the injury they sustained and that a supervi-
sor was present at the time of injury in only approximately 20% of the cases (8 ). Dif-
ferences in maturity and developmental level regarding learning styles, judgement,
and behavior should be considered when providing training for youth in occupational
safety and health.
Additional state-specific data and information about prevention of work-related in-
juries can be obtained from NIOSH, telephone (800) 356-4674 or (513) 533-8328.
References1. Bureau of Labor Statistics. Employment and earnings, vol 41, no. 1. Washington, DC: US
Department of Labor, January, 1994.2. Bureau of Labor Statistics. Occupational injuries and illnesses: counts, rates, and charac-
teristics, 1992. Washington, DC: US Department of Labor, April, 1995; bulletin 2455.3. Brooks DR, Davis LK. Work-related injuries to Massachusetts teens, 1987–1990. Am J Ind Med
1996;29:153–60.
Vol. 45 / No. 22 MMWR 467
Child Labor — Continued

4. Miller M. Occupational injuries among adolescents in Washington state, 1988–1991: a reviewof workers’ compensation data. Olympia, Washington: Safety and Health Assessment andResearch for Prevention, Washington Department of Labor and Industries, 1995; technicalreport no. 35-1-1995.
5. Parker Dl, Carl WR, French LR, Martin F. Characteristics of adolescent work injuries reportedto the Minnesota Department of Labor and Industry. Am J Public Health 1994;84:606–11.
6. Belville R, Pollack S, Godbold JH, Landrigan PJ. Occupational injuries among working ado-lescents in New York state. JAMA 1993;269:2754–9.
7. Banco L, Lapidus G, Braddock M. Work-related injury among Connecticut minors. Pediatrics1992;89:957–60.
8. NIOSH. Request for assistance in preventing deaths and injuries of adolescent workers. Cin-cinnati, Ohio: U.S. Department of Health and Human Services, Public Health Service, CDC,1995; DHHS publication no. (NIOSH)95-125.
9. Wage and Hour Division, Employment Standards Administration. Child labor requirementsin nonagricultural occupations under the Fair Labor Standards Act. Washington DC: US De-partment of Labor, Employment Standards Administration, August 1990 (WH-1330).
10. General Accounting Office. Child labor: characteristics of working children. Washington, DC:General Accounting Office, 1990;(GAO)/HRD-90-116.
Child Labor — Continued
Notice to Readers
Update: Provisional Public Health Service RecommendationsFor Chemoprophylaxis After Occupational Exposure to HIV
Occupational Exposure to HIV — ContinuedAlthough preventing blood exposures is the primary means of preventing occupa-
tionally acquired human immunodeficiency virus (HIV) infection, appropriate post-
exposure management is an important element of workplace safety (1 ). Information
suggesting that zidovudine (ZDV) postexposure prophylaxis (PEP) may reduce the risk
for HIV transmission after occupational exposure to HIV-infected blood (2 ) prompted
a Public Health Service (PHS) interagency working group*, with expert consultation†,
to update a previous PHS statement on management of occupational exposure to HIV
with the following findings and recommendations on PEP (1 ).§
Background
Although failures of ZDV PEP have occurred (3 ), ZDV PEP was associated with a
decrease of approximately 79% in the risk for HIV seroconversion after percutaneous
exposure to HIV-infected blood in a case-control study among health-care workers
(2 ). In a prospective trial in which ZDV was administered to HIV-infected pregnant
women and their infants, a direct effect of ZDV prophylaxis on the fetus and/or infant
may have contributed to the observed 67% reduction in perinatal HIV transmission
(4 ); the protective effect of ZDV was only partly explained by reduction of the HIV titer
*The interagency working group comprised representatives of CDC, the Food and Drug Admini-stration (FDA), the Health Resources and Services Administration, and the National Institutesof Health. Information included in these recommendations may not represent FDA approvalor approved labeling for the particular products or indications in question. Specifically, theterms “safe” and “effective” may not be synonymous with the FDA-defined legal standardsfor product approval.
†CDC and the National Foundation for Infectious Diseases cosponsored a workshop, HIV Post-Exposure Management for Health Care Workers, on March 4–5, 1996; proceedings of theworkshop will be published in the American Journal of Medicine.
§Single copies of this report will be available free until June 7, 1997, from the CDC NationalAIDS Clearinghouse, P.O. Box 6003, Rockville, MD 20849-6003; telephone (800) 458-5231 or(301) 217-0023.
468 MMWR June 7, 1996
Child Labor — Continued
in maternal blood (5 ). PEP also prevented or ameliorated retroviral infection in some
studies in animals (6,7 ).
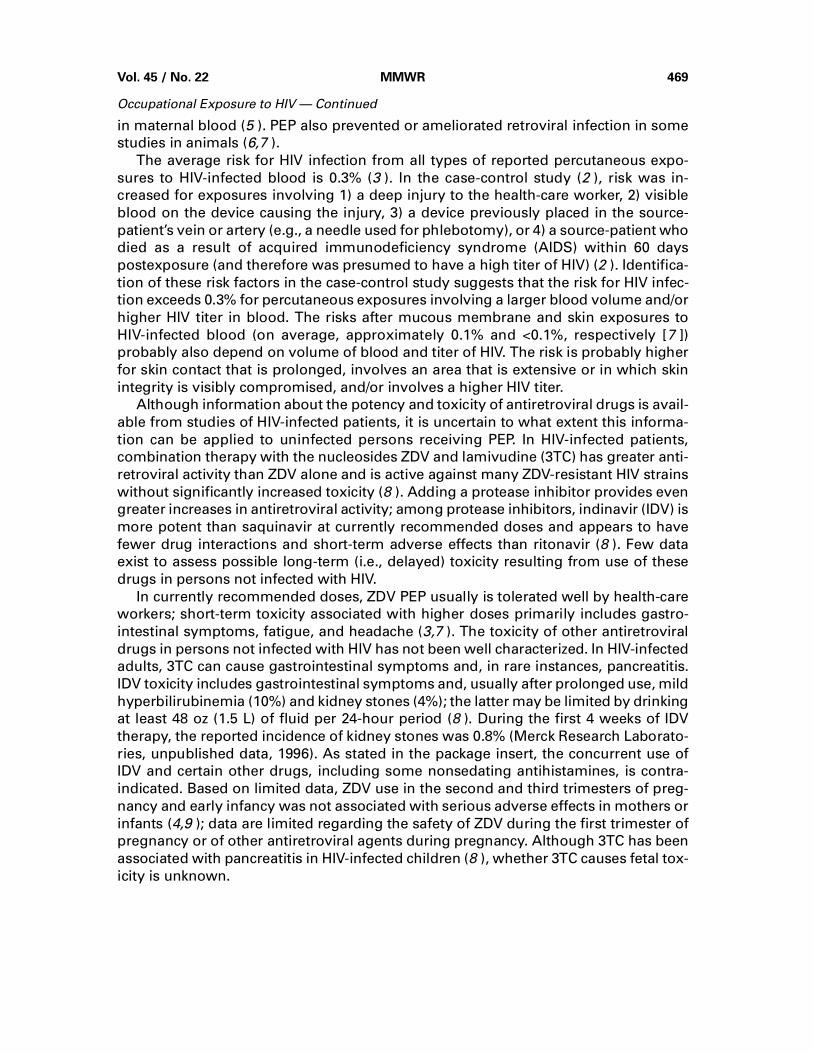
The average risk for HIV infection from all types of reported percutaneous expo-
sures to HIV-infected blood is 0.3% (3 ). In the case-control study (2 ), risk was in-
creased for exposures involving 1) a deep injury to the health-care worker, 2) visible
blood on the device causing the injury, 3) a device previously placed in the source-
patient’s vein or artery (e.g., a needle used for phlebotomy), or 4) a source-patient who
died as a result of acquired immunodeficiency syndrome (AIDS) within 60 days
postexposure (and therefore was presumed to have a high titer of HIV) (2 ). Identifica-
tion of these risk factors in the case-control study suggests that the risk for HIV infec-
tion exceeds 0.3% for percutaneous exposures involving a larger blood volume and/or
higher HIV titer in blood. The risks after mucous membrane and skin exposures to
HIV-infected blood (on average, approximately 0.1% and <0.1%, respectively [7 ])
probably also depend on volume of blood and titer of HIV. The risk is probably higher
for skin contact that is prolonged, involves an area that is extensive or in which skin
integrity is visibly compromised, and/or involves a higher HIV titer.
Although information about the potency and toxicity of antiretroviral drugs is avail-
able from studies of HIV-infected patients, it is uncertain to what extent this informa-
tion can be applied to uninfected persons receiving PEP. In HIV-infected patients,
combination therapy with the nucleosides ZDV and lamivudine (3TC) has greater anti-
retroviral activity than ZDV alone and is active against many ZDV-resistant HIV strains
without significantly increased toxicity (8 ). Adding a protease inhibitor provides even
greater increases in antiretroviral activity; among protease inhibitors, indinavir (IDV) is
more potent than saquinavir at currently recommended doses and appears to have
fewer drug interactions and short-term adverse effects than ritonavir (8 ). Few data
exist to assess possible long-term (i.e., delayed) toxicity resulting from use of these
drugs in persons not infected with HIV.
In currently recommended doses, ZDV PEP usually is tolerated well by health-care
workers; short-term toxicity associated with higher doses primarily includes gastro-
intestinal symptoms, fatigue, and headache (3,7 ). The toxicity of other antiretroviral
drugs in persons not infected with HIV has not been well characterized. In HIV-infected
adults, 3TC can cause gastrointestinal symptoms and, in rare instances, pancreatitis.
IDV toxicity includes gastrointestinal symptoms and, usually after prolonged use, mild
hyperbilirubinemia (10%) and kidney stones (4%); the latter may be limited by drinking
at least 48 oz (1.5 L) of fluid per 24-hour period (8 ). During the first 4 weeks of IDV
therapy, the reported incidence of kidney stones was 0.8% (Merck Research Laborato-
ries, unpublished data, 1996). As stated in the package insert, the concurrent use of
IDV and certain other drugs, including some nonsedating antihistamines, is contra-
indicated. Based on limited data, ZDV use in the second and third trimesters of preg-
nancy and early infancy was not associated with serious adverse effects in mothers or
infants (4,9 ); data are limited regarding the safety of ZDV during the first trimester of
pregnancy or of other antiretroviral agents during pregnancy. Although 3TC has been
associated with pancreatitis in HIV-infected children (8 ), whether 3TC causes fetal tox-
icity is unknown.
Vol. 45 / No. 22 MMWR 469
Occupational Exposure to HIV — Continued

Recommendations
The following recommendations are provisional because they are based on limited
data regarding efficacy and toxicity of PEP and risk for HIV infection after different
types of exposure. Because most occupational exposures to HIV do not result in infec-
tion transmission, potential toxicity must be carefully considered when prescribing
PEP. When possible, these recommendations should be implemented in consultation
with persons having expertise in antiretroviral therapy and HIV transmission. Changes
in drug regimens may be appropriate, based on factors such as the probable anti-
retroviral drug resistance profile of HIV from the source patient; local availability of
drugs; and medical conditions, concurrent drug therapy, and drug toxicity in the ex-
posed worker. These recommendations were not developed to address nonoccupa-
tional (e.g., sexual) exposures.
1. Chemoprophylaxis should be recommended to exposed workers after occupa-
tional exposures associated with the highest risk for HIV transmission. For expo-
sures with a lower, but nonnegligible risk, PEP should be offered, balancing the
lower risk against the use of drugs having uncertain efficacy and toxicity. For expo-
sures with negligible risk, PEP is not justified (Table 1). Exposed workers should be
informed that a) knowledge about the efficacy and toxicity of PEP is limited; b) for
agents other than ZDV, data are limited regarding toxicity in persons without HIV
infection or who are pregnant; and c) any or all drugs for PEP may be declined by
the exposed worker.
2. At present, ZDV should be considered for all PEP regimens because ZDV is the only
agent for which data support the efficacy of PEP in the clinical setting. 3TC should
usually be added to ZDV for increased antiretroviral activity and activity against
many ZDV-resistant strains. A protease inhibitor (preferably IDV because of the
characteristics summarized in this report) should be added for exposures with the
highest risk for HIV transmission (Table 1). Adding a protease inhibitor also may be
considered for lower risk exposures if ZDV-resistant strains are likely, although it is
uncertain whether the potential additional toxicity of a third drug is justified for
lower risk exposures. For HIV strains resistant to both ZDV and 3TC or resistant to
a protease inhibitor, or if these drugs are contraindicated or poorly tolerated, the
optimal PEP regimen is uncertain; expert consultation is advised¶.
3. PEP should be initiated promptly, preferably within 1–2 hours postexposure. Al-
though animal studies suggest that PEP probably is not effective when started later
than 24–36 hours postexposure (6,7 ), the interval after which there is no benefit
from PEP for humans is undefined. Initiating therapy after a longer interval (e.g.,
1–2 weeks) may be considered for the highest risk exposures; even if infection is
not prevented, early treatment of acute HIV infection may be beneficial (10 ). The
optimal duration of PEP is unknown; because 4 weeks of ZDV appeared protective
(2 ), PEP should probably be administered for 4 weeks, if tolerated.
4. If the source patient or the patient’s HIV status is unknown, initiating PEP should be
decided on a case-by-case basis, based on the exposure risk and likelihood of HIV
infection in known or possible source patients. If additional information becomes
available, decisions about PEP can be modified.
¶An HIV strain is more likely to be resistant to a specific antiretroviral agent if it is derived froma patient who has been exposed to the agent for a prolonged period of time (e.g., 6–12 monthsor longer). In general, resistance develops more readily in persons with more advanced HIVinfection (e.g., CD4+ T-lymphocyte count of <200 cells/mm3), reflecting the increasing rate ofviral replication during later stages of the illness.
470 MMWR June 7, 1996
Occupational Exposure to HIV — Continued

5. Workers with occupational exposures to HIV should receive follow-up counseling
and medical evaluation, including HIV-antibody tests at baseline and periodically
for at least 6 months postexposure (e.g., 6 weeks, 12 weeks, and 6 months), and
should observe precautions to prevent possible secondary transmission (1 ). If PEP
is used, drug-toxicity monitoring should include a complete blood count and renal
and hepatic chemical function tests at baseline and 2 weeks after starting PEP. If
subjective or objective toxicity is noted, dose reduction or drug substitution should
be considered with expert consultation, and further diagnostic studies may be indi-
TABLE 1. Provisional Public Health Service recommendations for chemoprophylaxisafter occupational exposure to HIV, by type of exposure and source material — 1996
Type ofexposure Source material*
Antiretroviral prophylaxis†
Antiretroviral regimen§
Percutaneous Blood¶
Highest risk Recommend ZDV plus 3TC plus IDVIncreased risk Recommend ZDV plus 3TC, ± IDV**No increased risk Offer ZDV plus 3TC
Fluid containing visibleblood, other potentiallyinfectious fluid††, or tissue Offer ZDV plus 3TC
Other body fluid (e.g., urine) Not offer
Mucous membrane Blood Offer ZDV plus 3TC, ± IDV**Fluid containing visible
blood, other potentiallyinfectious fluid††, or tissue Offer ZDV, ± 3TC
Other body fluid (e.g., urine) Not offer
Skin,increased risk§§ Blood Offer ZDV plus 3TC, ± IDV**
Fluid containing visibleblood, other potentiallyinfectious fluid††, or tissue Offer ZDV, ± 3TC
Other body fluid (e.g., urine) Not offer
*Any exposure to concentrated HIV (e.g., in a research laboratory or production facility) istreated as percutaneous exposure to blood with highest risk.
†Recommend—Postexposure prophylaxis (PEP) should be recommended to the exposedworker with counseling (see text). Offer—PEP should be offered to the exposed worker withcounseling (see text). Not offer—PEP should not be offered because these are notoccupational exposures to HIV (1 ).
§Regimens: zidovudine (ZDV), 200 mg three times a day; lamivudine (3TC), 150 mg two timesa day; indinavir (IDV), 800 mg three times a day (if IDV is not available, saquinavir may beused, 600 mg three times a day). Prophylaxis is given for 4 weeks. For full prescribinginformation, see package inserts.
¶Highest risk—BOTH larger volume of blood (e.g., deep injury with large diameter hollowneedle previously in source patient’s vein or artery, especially involving an injection ofsource-patient’s blood) AND blood containing a high titer of HIV (e.g., source with acuteretroviral illness or end-stage AIDS; viral load measurement may be considered, but its usein relation to PEP has not been evaluated). Increased risk—EITHER exposure to largervolume of blood OR blood with a high titer of HIV. No increased risk—NEITHER exposureto larger volume of blood NOR blood with a high titer of HIV (e.g., solid suture needle injuryfrom source patient with asymptomatic HIV infection).
**Possible toxicity of additional drug may not be warranted (see text).††Includes semen; vaginal secretions; cerebrospinal, synovial, pleural, peritoneal, pericardial,
and amniotic fluids.§§For skin, risk is increased for exposures involving a high titer of HIV, prolonged contact, an
extensive area, or an area in which skin integrity is visibly compromised. For skin exposureswithout increased risk, the risk for drug toxicity outweighs the benefit of PEP.
Vol. 45 / No. 22 MMWR 471
Occupational Exposure to HIV — Continued

cated. Health-care workers who become infected with HIV should receive appropri-
ate medical care.
6. Beginning July 15, 1996, health-care providers in the United States are encouraged
to enroll all workers who receive PEP in an anonymous registry being developed by
CDC, Glaxo Wellcome Inc., and Merck & Co., Inc., to assess toxicity (telephone
[888] 737-4448 [(888) PEP-4HIV]). Unusual or severe toxicity from antiretroviral
drugs should be reported to the manufacturer and/or the Food and Drug Admini-
stration (telephone [800] 332-1088). Updated information about HIV PEP will be
available beginning in early 1997 from the Internet at CDC’s home page
(http://www.cdc.gov); CDC’s fax information service, telephone (404) 332-4565
(Hospital Infections Program directory); the National AIDS Clearinghouse, tele-
phone (800) 458-5231; and the HIV/AIDS Treatment Information Service, telephone
(800) 448-0440.Reported by: Center for Drug Evaluation and Research, Food and Drug Administration. AIDSProgram Office, Health Resources and Svcs Administration. National Institute of Allergy andInfectious Diseases, Warren H. Magnuson Clinical Center, National Institutes of Health. NationalCenter for HIV, STD, and TB Prevention (proposed); National Institute for Occupational Safetyand Health; and National Center for Infectious Diseases, CDC.
References1. CDC. Public Health Service statement on management of occupational exposure to human
immunodeficiency virus, including considerations regarding zidovudine postexposure use.MMWR 1990;39(no. RR-1).
2. CDC. Case-control study of HIV seroconversion in health-care workers after percutaneous ex-posure to HIV-infected blood—France, United Kingdom, and United States, January1988–August 1994. MMWR 1995;44:929–33.
3. Tokars JI, Marcus R, Culver DH, et al. Surveillance of HIV infection and zidovudine use amonghealth care workers after occupational exposure to HIV-infected blood. Ann Intern Med1993;118:913–9.
4. Connor EM, Sperling RS, Gelber R, et al. Reduction of maternal-infant transmission of humanimmunodeficiency virus type 1 with zidovudine treatment. N Engl J Med 1994;331:1173–80.
5. Sperling RS, Shapiro DE, Coombs R, et al. Maternal plasma HIV-1 RNA and the success ofzidovudine in the prevention of mother-child transmission [Abstract no. LB1]. In: Programand abstracts of the 3rd conference on retroviruses and opportunistic infections. Alexandria,Virginia: Infectious Diseases Society of America, 1996.
6. Niu MT, Stein DS, Schnittmann SM. Primary human immunodeficiency virus type 1 infection:review of pathogenesis and early treatment interventions in humans and animal retrovirusinfections. J Infect Dis 1993;168:1490–501.
7. Gerberding JL. Management of occupational exposures to blood-borne viruses. N Engl J Med1995;332:444–51.
8. Anonymous. New drugs for HIV infection. The Medical Letter on Drugs and Therapeutics1996;38:35–7.
9. Connor E, Sperling R, Shapiro D, et al. Long term effect of zidovudine exposure among un-infected infants born to HIV-infected mothers in pediatric AIDS Clinical Trials Group protocol076. In: Abstracts of the 35th Interscience Conference on Antimicrobial Agents and Chemo-therapy. Washington, DC: American Society for Microbiology, 1995;205.
10. Kinloch-de Loës S, Hirschel BJ, Hoen B, et al. A controlled trial of zidovudine in primary humanimmunodeficiency virus infection. N Engl J Med 1995;333:408–13
Occupational Exposure to HIV — Continued
472 MMWR June 7, 1996
Occupational Exposure to HIV — Continued

FIGURE I. Selected notifiable disease reports, comparison of 4-week totals endingJune 1, 1996, with historical data — United States
Anthrax - HIV infection, pediatric*§ 122Brucellosis 34 Plague -Cholera 1 Poliomyelitis, paralytic¶ -Congenital rubella syndrome 1 Psittacosis 13Cryptosporidiosis* 620 Rabies, human -Diphtheria 1 Rocky Mountain spotted fever (RMSF) 86Encephalitis: California* - Streptococcal toxic-shock syndrome* 10
eastern equine* 1 Syphilis, congenital** -St. Louis* - Tetanus 5western equine* - Toxic-shock syndrome 60
Hansen Disease 37 Trichinosis 11Hantavirus pulmonary syndrome*† 5 Typhoid fever 133
Cum. 1996Cum. 1996
TABLE I. Summary — cases of selected notifiable diseases, United States,cumulative, week ending June 1, 1996 (22nd Week)
*Not notifiable in all states.† Updated weekly from reports to the Division of Viral and Rickettsial Diseases, National Center for Infectious Diseases (NCID).§ Updated monthly to the Division of HIV/AIDS Prevention, National Center for HIV, STD, and TB Prevention (NCHSTP)
(proposed), last update May 28, 1996.¶ One suspected case of polio with onset in 1996 has been reported to date.
**Updated quarterly from reports to the Division of STD Prevention, NCHSTP. First quarter 1996 is not yet available. -: no reported cases
DISEASE DECREASE INCREASECASES CURRENT
4 WEEKS
Ratio (Log Scale)†
AAAAAAAAAAAA
AAAAAA
Beyond Historical Limits
4210.50.250.125
1,412
524
226
40
71
64
188
41
265
327
8
Hepatitis A
Hepatitis B
Hepatitis, C/Non-A, Non-B
Legionellosis
Malaria
Measles, Total*
Meningococcal Infections
Mumps
Pertussis
Rabies, Animal
Rubella
AAAAAAAAAAAAAAAAAAAA
AAAAAAAAAAAAAAAAAAAA
AAAAA
AAAAAAAAAAAAAAA
AAAAAAAAAA
*The large apparent decrease in the number of reported cases of measles (total) reflects dramaticfluctuations in the historical baseline.
† Ratio of current 4-week total to mean of 15 4-week totals (from previous, comparable, andsubsequent 4-week periods for the past 5 years). The point where the hatched area begins isbased on the mean and two standard deviations of these 4-week totals.
Vol. 45 / No. 22 MMWR 473

TABLE II. Cases of selected notifiable diseases, United States, weeks endingJune 1, 1996, and June 3, 1995 (22nd Week)
UNITED STATES 28,480 30,156 107,756 373 163 108,585 161,929 1,502 1,689 293 508
NEW ENGLAND 1,123 1,600 3,921 32 17 3,092 2,138 50 55 17 8Maine 16 26 - 3 - 18 32 - - 1 3N.H. 31 47 315 1 2 63 44 3 8 - -Vt. 9 13 - 5 5 26 17 20 5 2 -Mass. 550 792 2,729 12 10 901 1,251 24 41 8 4R.I. 73 120 877 4 - 219 221 3 1 6 1Conn. 444 602 - 7 - 1,865 573 - - N N
MID. ATLANTIC 7,891 7,703 17,023 43 23 12,937 18,196 146 154 60 66Upstate N.Y. 1,000 966 N 28 12 2,492 4,164 121 73 14 19N.Y. City 4,489 3,955 7,225 - - 3,955 6,715 1 1 - 1N.J. 1,511 1,763 2,047 15 5 2,231 1,701 - 69 7 14Pa. 891 1,019 7,751 N 6 4,259 5,616 24 11 39 32
E.N. CENTRAL 2,298 2,482 15,314 92 44 16,504 32,888 185 138 90 169Ohio 521 537 3,636 34 8 2,094 10,514 4 5 41 78Ind. 347 197 4,390 17 9 3,021 3,423 6 - 23 38Ill. 974 1,101 - 21 12 6,970 8,485 22 47 2 17Mich. 323 493 4,101 20 15 2,911 7,715 153 86 20 18Wis. 133 154 3,187 N - 1,508 2,751 - - 4 18
W.N. CENTRAL 691 685 10,498 68 30 5,031 8,541 99 30 20 34Minn. 126 149 - 17 13 U 1,230 - 2 1 -Iowa 51 40 1,732 12 8 462 599 77 3 4 12Mo. 327 277 5,592 11 - 3,381 4,985 14 10 4 9N. Dak. 6 1 2 1 1 1 12 - 3 - 2S. Dak. 7 7 578 3 - 81 89 - 1 2 -Nebr. 49 62 762 7 2 153 437 2 8 7 9Kans. 125 149 1,832 17 6 953 1,189 6 3 2 2
S. ATLANTIC 7,305 7,926 20,785 21 4 40,334 45,861 103 117 43 79Del. 142 153 - - - 614 862 1 - - -Md. 853 1,123 2,602 N 1 5,298 5,303 1 3 6 14D.C. 452 506 N - - 1,832 1,996 - - 2 3Va. 396 550 4,954 N 1 4,092 4,411 7 5 11 5W. Va. 49 35 - N - 192 293 7 23 1 3N.C. 355 405 - 6 2 8,095 10,229 19 27 3 15S.C. 387 402 - 1 - 4,669 4,954 14 8 3 14Ga. 1,096 1,092 4,735 4 - 8,850 8,924 - 11 - 10Fla. 3,575 3,660 8,494 10 - 6,692 8,889 54 40 17 15
E.S. CENTRAL 953 982 11,745 10 5 11,753 17,593 308 557 23 16Ky. 153 118 2,832 - 1 1,731 1,915 12 15 3 5Tenn. 352 402 5,378 5 4 4,632 5,547 262 540 10 7Ala. 278 261 3,535 2 - 5,390 6,884 2 2 1 3Miss. 170 201 U 3 - U 3,247 32 - 9 1
W.S. CENTRAL 2,656 2,489 5,467 12 4 7,913 19,736 171 97 2 10Ark. 121 108 - 6 2 1,198 2,060 1 2 - 4La. 656 360 2,926 4 2 3,284 4,972 73 59 - 2Okla. 96 130 2,541 1 - 1,603 10 59 22 2 3Tex. 1,783 1,891 - 1 - 1,828 12,694 38 14 - 1
MOUNTAIN 811 976 4,020 37 16 2,993 3,875 268 203 16 58Mont. 10 8 - 4 - 13 38 9 8 1 4Idaho 19 24 654 11 4 38 55 70 26 - 1Wyo. 2 5 291 - - 12 20 87 80 2 4Colo. 248 340 - 13 5 709 1,241 23 32 6 24N. Mex. 45 81 - 2 - 366 436 34 28 - 4Ariz. 240 267 2,005 N 7 1,583 1,400 28 14 4 5Utah 90 58 254 5 - 49 98 11 7 1 3Nev. 157 193 816 2 - 223 587 6 8 2 13
PACIFIC 4,752 5,313 18,983 58 20 8,028 13,101 172 338 22 68Wash. 366 457 4,284 12 5 965 1,050 26 85 1 5Oreg. 223 184 - 17 10 201 202 3 24 - -Calif. 4,074 4,506 13,829 28 - 6,523 11,261 60 219 21 58Alaska 11 45 379 1 - 204 318 2 1 - -Hawaii 78 121 491 N 5 135 270 81 9 - 5
Guam 3 - 102 N - 24 52 1 3 - 1P.R. 426 1,332 N 5 U 136 252 25 63 - -V.I. 9 19 N - U - 17 - - - -Amer. Samoa - - - - U - 8 - - - -C.N.M.I. - - N - U 11 12 - - - -
N: Not notifiable U: Unavailable -: no reported cases C.N.M.I.: Commonwealth of Northern Mariana Islands
*Updated monthly to the Division of HIV/AIDS Prevention, National Center for HIV, STD, and TB Prevention (proposed), last update May28, 1996.
†National Electronic Telecommunications System for Surveillance.§Public Health Laboratory Information System.
Reporting Area
AIDS* Chlamydia
Escherichia
coli O157:H7
Gonorrhea
Hepatitis
C/NA,NB LegionellosisNETSS† PHLIS§
Cum.
1996
Cum.
1995
Cum.
1996
Cum.
1996
Cum.
1996
Cum.
1996
Cum.
1995
Cum.
1996
Cum.
1995
Cum.
1996
Cum.
1995
474 MMWR June 7, 1996

TABLE II. (Cont’d.) Cases of selected notifiable diseases, United States, weeks endingJune 1, 1996, and June 3, 1995 (22nd Week)
UNITED STATES 1,454 2,120 426 431 1,600 1,557 4,239 7,139 6,534 7,025 2,139 3,074
NEW ENGLAND 59 191 14 18 56 71 69 90 148 173 256 736Maine 2 2 3 1 9 5 - 2 4 - - -N.H. 2 12 1 1 1 14 1 1 5 5 35 87Vt. - 2 2 - 3 6 - - - 1 73 102Mass. 29 18 5 5 21 23 32 35 61 97 45 267R.I. 21 36 3 2 - - 1 1 20 18 21 113Conn. 5 121 - 9 22 23 35 51 58 52 82 167
MID. ATLANTIC 1,215 1,581 98 106 130 195 189 403 1,190 1,466 350 895Upstate N.Y. 645 884 27 21 39 58 25 38 127 165 205 511N.Y. City 157 146 42 52 21 24 63 208 642 789 - -N.J. 85 163 24 23 35 52 55 81 282 280 64 158Pa. 328 388 5 10 35 61 46 76 139 232 81 226
E.N. CENTRAL 19 73 38 60 207 233 662 1,137 751 607 18 10Ohio 15 5 6 2 80 61 228 396 112 114 4 1Ind. 4 7 7 4 32 33 102 104 82 58 1 -Ill. - 4 8 40 46 66 224 425 482 411 1 2Mich. - 1 11 9 27 43 41 130 39 - 7 6Wis. U 56 6 5 22 30 67 82 36 24 5 1
W.N. CENTRAL 43 31 12 10 129 88 180 342 182 253 198 146Minn. 1 - 3 3 15 16 27 18 35 57 12 8Iowa 16 1 2 1 28 16 10 27 25 35 104 46Mo. 7 14 5 4 58 33 134 281 81 94 12 16N. Dak. - - - - 2 - - - 2 1 21 15S. Dak. - - - - 3 4 - - 13 10 37 37Nebr. - 1 - 2 10 8 5 7 7 13 3 -Kans. 19 15 2 - 13 11 4 9 19 43 9 24
S. ATLANTIC 58 160 102 86 345 250 1,638 1,808 1,068 1,148 1,042 913Del. 1 19 2 1 2 3 16 7 20 42 30 48Md. 25 94 21 21 31 17 262 176 115 179 250 176D.C. 1 1 4 8 6 2 75 56 58 43 2 8Va. - 12 11 16 30 29 205 281 82 105 227 169W. Va. 4 12 1 1 8 4 1 1 24 44 38 41N.C. 16 11 10 6 40 45 471 506 159 121 278 180S.C. 2 5 3 - 34 32 203 291 40 132 24 54Ga. - 4 8 10 85 55 263 316 266 10 125 133Fla. 9 2 42 23 109 63 142 174 304 472 68 104
E.S. CENTRAL 20 13 11 9 96 92 741 1,683 460 581 74 116Ky. 4 3 1 - 18 22 62 89 105 126 17 8Tenn. 6 7 5 4 10 29 444 350 74 191 30 46Ala. 1 1 2 5 34 24 235 257 186 165 27 60Miss. 9 2 3 - 34 17 U 987 95 99 - 2
W.S. CENTRAL 11 34 11 8 190 188 519 1,257 765 794 25 49Ark. 6 2 - 1 26 21 134 194 30 90 3 22La. - - 1 1 36 27 245 457 - 12 12 9Okla. 2 14 - - 16 21 66 - 34 - 10 18Tex. 3 18 10 6 112 119 74 606 701 692 - -
MOUNTAIN - 2 27 26 94 120 56 112 214 238 39 54Mont. - - 2 2 3 2 - 3 7 3 5 19Idaho - - - 1 11 5 1 - 4 6 - -Wyo. - 1 2 - 3 5 1 - 3 1 13 17Colo. - - 14 15 15 27 16 65 32 5 3 -N. Mex. - - 1 3 19 25 - 4 38 40 1 3Ariz. - - 3 2 26 42 35 17 88 126 15 13Utah - - 3 2 9 7 - 4 10 10 - 1Nev. - 1 2 1 8 7 3 19 32 47 2 1
PACIFIC 29 35 113 108 353 320 185 307 1,756 1,765 137 155Wash. 1 1 8 10 48 54 3 7 108 111 - -Oreg. 7 2 8 6 65 59 4 6 43 23 - -Calif. 20 32 92 84 234 200 178 293 1,512 1,522 129 148Alaska - - 1 1 4 5 - 1 25 34 8 7Hawaii 1 - 4 7 2 2 - - 68 75 - -
Guam - - - - 1 2 2 1 35 50 - -P.R. - - - - 3 13 63 146 58 86 19 28V.I. - - - - - - - 1 - - - -Amer. Samoa - - - - - - - - - 3 - -C.N.M.I. - - - - - - 1 3 - 13 - -
N: Not notifiable U: Unavailable -: no reported cases
Reporting Area
Lyme
Disease Malaria
Meningococcal
Disease
Syphilis
(Primary & Secondary) Tuberculosis Rabies, Animal
Cum.
1996
Cum.
1995
Cum.
1996
Cum.
1995
Cum.
1996
Cum.
1995
Cum.
1996
Cum.
1995
Cum.
1996
Cum.
1995
Cum.
1996
Cum.
1995
Vol. 45 / No. 22 MMWR 475

TABLE III. Cases of selected notifiable diseases preventable by vaccination,United States, weeks ending June 1, 1996, and June 3, 1995 (22nd Week)
UNITED STATES 546 582 10,663 10,896 3,656 4,153 20 156 - 17
NEW ENGLAND 13 30 131 97 61 96 - 5 - 1Maine 2 2 11 14 2 6 - - - -N.H. 7 7 4 5 5 12 - - - -Vt. - 1 3 3 3 1 - 1 - -Mass. 4 7 64 41 19 31 - 3 - 1R.I. - - 5 11 5 8 - - - -Conn. - 13 44 23 27 38 - 1 - -
MID. ATLANTIC 78 65 658 697 546 570 - 4 - 4Upstate N.Y. 25 19 169 159 139 141 - - - -N.Y. City 10 14 279 335 257 189 - 4 - 3N.J. 26 9 133 93 98 143 - - - -Pa. 17 23 77 110 52 97 - - - 1
E.N. CENTRAL 75 107 908 1,458 391 488 - 4 - 3Ohio 49 50 412 838 53 51 - 2 - -Ind. 4 15 143 61 68 99 - - - -Ill. 14 26 137 282 61 133 - 1 - 1Mich. 3 14 154 169 183 173 - - - 2Wis. 5 2 62 108 26 32 - 1 - -
W.N. CENTRAL 23 33 838 666 211 272 - 15 - 1Minn. 10 14 37 66 13 21 - 13 - 1Iowa 6 2 195 36 69 18 - - - -Mo. 5 13 380 475 100 199 - 2 - -N. Dak. - - 22 13 - 3 - - - -S. Dak. 1 - 35 15 - 1 - - - -Nebr. 1 2 103 17 8 14 - - - -Kans. - 2 66 44 21 16 - - - -
S. ATLANTIC 136 147 452 486 544 554 - 3 - 2Del. 1 - 5 7 1 4 - 1 - -Md. 32 41 91 88 132 117 - 2 - -D.C. 5 - 15 4 15 10 - - - -Va. 4 16 66 83 62 38 - - - 2W. Va. 4 6 10 11 14 29 - - - -N.C. 14 20 51 54 129 120 - - - -S.C. 3 - 29 15 39 21 - - - -Ga. 64 31 15 43 7 50 - - - -Fla. 9 33 170 181 145 165 - - - -
E.S. CENTRAL 9 4 776 532 352 439 - - - -Ky. 2 1 17 29 31 43 - - - -Tenn. 1 - 544 423 219 342 - - - -Ala. 5 3 95 47 24 54 - - - -Miss. 1 - 120 33 78 - - - - -
W.S. CENTRAL 21 30 1,820 1,170 364 435 - - - 2Ark. - 4 227 101 31 18 - - - -La. 1 1 60 42 52 76 - - - -Okla. 19 16 793 254 44 58 - - - -Tex. 1 9 740 773 237 283 - - - 2
MOUNTAIN 62 58 1,660 1,778 457 345 1 15 - 1Mont. - - 53 27 4 9 U - U -Idaho 1 2 126 178 56 41 - 1 - -Wyo. 32 3 18 63 14 9 - - - -Colo. 5 8 161 217 58 56 1 4 - 1N. Mex. 7 9 220 357 152 142 - - - -Ariz. 9 17 617 501 104 44 - 3 - -Utah 6 5 381 378 54 28 - 3 - -Nev. 2 14 84 57 15 16 - 4 - -
PACIFIC 129 108 3,420 4,012 730 954 19 110 - 3Wash. 1 5 237 247 47 72 19 45 - -Oreg. 18 14 479 847 34 52 - 1 - -Calif. 107 87 2,635 2,817 644 815 - 1 - 2Alaska 1 - 29 15 3 6 - 63 - -Hawaii 2 2 40 86 2 9 - - - 1
Guam - - 2 2 - - U - U -P.R. 1 3 52 28 170 142 - 1 - -V.I. - - - - - 2 U - U -Amer. Samoa - - - 5 - - U - U -C.N.M.I. 10 5 1 15 5 7 U - U -
*Of 117 cases among children aged <5 years, serotype was reported for 28 and of those, 5 were type b.†For imported measles, cases include only those resulting from importation from other countries.
N: Not notifiable U: Unavailable -: no reported cases
Reporting Area
H. influenzae,
invasive
Hepatitis (viral), by type Measles (Rubeola)
A B Indigenous Imported†
Cum.
1996*
Cum.
1995
Cum.
1996
Cum.
1995
Cum.
1996
Cum.
1995 1996
Cum.
1996 1996
Cum.
1996
476 MMWR June 7, 1996

UNITED STATES 173 204 11 275 417 37 1,206 1,126 - 71 47
NEW ENGLAND 6 4 - - 5 12 197 179 - 8 6Maine - - - - 2 - 8 18 - - -N.H. - - - - - 1 18 13 - - 1Vt. 1 - - - - - 7 5 - 2 -Mass. 4 2 - - 2 11 161 136 - 4 2R.I. - 2 - - - - - - - - -Conn. 1 - - - 1 - 3 7 - 2 3
MID. ATLANTIC 8 3 3 39 62 5 97 104 - 4 6Upstate N.Y. - - - 10 15 2 55 60 - 3 -N.Y. City 7 - - 9 8 - 14 15 - 1 5N.J. - 3 - - 8 - - 6 - - 1Pa. 1 - 3 20 31 3 28 23 - - -
E.N. CENTRAL 7 8 2 67 69 4 150 123 - 3 -Ohio 2 1 1 27 20 3 69 41 - - -Ind. - - - 5 5 - 12 11 - - -Ill. 2 - 1 16 23 - 51 27 - 1 -Mich. 2 5 - 19 21 1 13 32 - 2 -Wis. 1 2 - - - - 5 12 - - -
W.N. CENTRAL 16 1 - 3 27 2 58 73 - 1 -Minn. 14 - - 1 2 2 40 27 - - -Iowa - - - - 8 - 2 2 - 1 -Mo. 2 1 - - 14 - 10 17 - - -N. Dak. - - - 2 - - - 6 - - -S. Dak. - - - - - - 1 7 - - -Nebr. - - - - 3 - 1 4 - - -Kans. - - - - - - 4 10 - - -
S. ATLANTIC 5 1 - 31 60 - 123 102 - 12 10Del. 1 - - - - - 8 5 - - -Md. 2 - - 12 17 - 50 13 - - -D.C. - - - - - - - 2 - 1 -Va. 2 - - 3 13 - 5 8 - - -W. Va. - - - - - - 2 - - - -N.C. - - - - 16 - 25 50 - - -S.C. - - - 5 6 - 5 10 - 1 -Ga. - - - 2 - - 7 - - - -Fla. - 1 - 9 8 - 21 14 - 10 10
E.S. CENTRAL - - - 13 12 1 43 29 - - -Ky. - - - - - - 23 5 - - -Tenn. - - - 2 - - 13 4 - - -Ala. - - - 4 4 1 4 20 - - -Miss. - - - 7 8 - 3 - N N N
W.S. CENTRAL 2 9 1 13 27 1 25 61 - 2 2Ark. - 2 - - 5 - 2 7 - - -La. - 7 1 10 7 - 4 4 - 1 -Okla. - - - - - - 4 9 - - -Tex. 2 - - 3 15 1 15 41 - 1 2
MOUNTAIN 16 61 - 19 15 2 151 262 - 3 4Mont. - - U - 1 U 4 3 U - -Idaho 1 - - - 2 - 65 71 - - -Wyo. - - - - - - - - - - -Colo. 5 21 - 1 - - 19 38 - 1 -N. Mex. - 29 N N N 2 29 31 - - -Ariz. 3 10 - 1 2 - 11 106 - 1 3Utah 3 - - 2 3 - 6 10 - - 1Nev. 4 1 - 15 7 - 17 3 - 1 -
PACIFIC 113 117 5 90 140 10 362 193 - 38 19Wash. 45 16 1 9 10 10 146 33 - 1 -Oreg. 1 1 N N N - 27 14 - 1 1Calif. 3 98 3 64 114 - 179 131 - 34 16Alaska 63 - - 2 12 - 1 - - - -Hawaii 1 2 1 15 4 - 9 15 - 2 2
Guam - - U 3 3 U - 2 U - 1P.R. 1 9 - 1 1 1 1 8 - - -V.I. - - U - 2 U - - U - -Amer. Samoa - - U - - U - - U - -C.N.M.I. - - U - - U - - U - -
N: Not notifiable U: Unavailable -: no reported cases
TABLE III. (Cont’d.) Cases of selected notifiable diseases preventable by vaccination,United States, weeks ending June 1, 1996, and June 3, 1995 (22nd Week)
Reporting Area
Measles (Rubeola), cont’d.
Mumps Pertussis RubellaTotal
Cum.
1996
Cum.
1995 1996
Cum.
1996
Cum.
1995 1996
Cum.
1996
Cum.
1995 1996
Cum.
1996
Cum.
1995
Vol. 45 / No. 22 MMWR 477
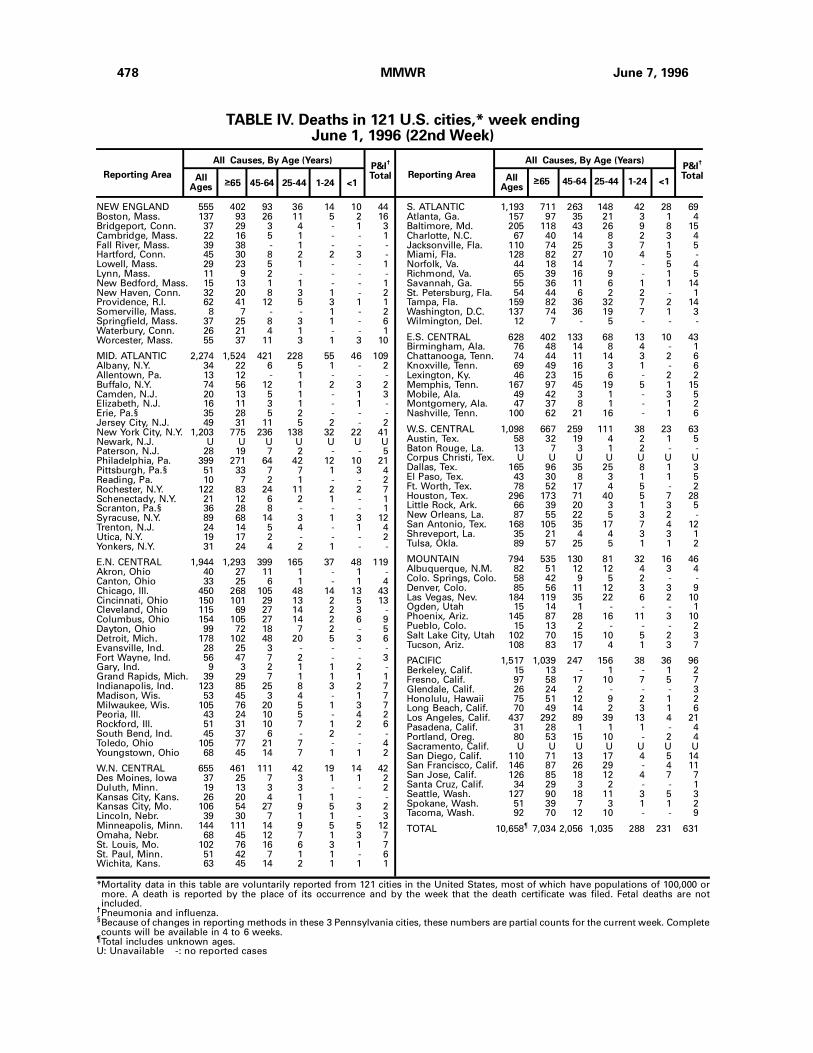
NEW ENGLAND 555 402 93 36 14 10 44Boston, Mass. 137 93 26 11 5 2 16Bridgeport, Conn. 37 29 3 4 - 1 3Cambridge, Mass. 22 16 5 1 - - 1Fall River, Mass. 39 38 - 1 - - -Hartford, Conn. 45 30 8 2 2 3 -Lowell, Mass. 29 23 5 1 - - 1Lynn, Mass. 11 9 2 - - - -New Bedford, Mass. 15 13 1 1 - - 1New Haven, Conn. 32 20 8 3 1 - 2Providence, R.I. 62 41 12 5 3 1 1Somerville, Mass. 8 7 - - 1 - 2Springfield, Mass. 37 25 8 3 1 - 6Waterbury, Conn. 26 21 4 1 - - 1Worcester, Mass. 55 37 11 3 1 3 10
MID. ATLANTIC 2,274 1,524 421 228 55 46 109Albany, N.Y. 34 22 6 5 1 - 2Allentown, Pa. 13 12 - 1 - - -Buffalo, N.Y. 74 56 12 1 2 3 2Camden, N.J. 20 13 5 1 - 1 3Elizabeth, N.J. 16 11 3 1 - 1 -Erie, Pa.§ 35 28 5 2 - - -Jersey City, N.J. 49 31 11 5 2 - 2New York City, N.Y. 1,203 775 236 138 32 22 41Newark, N.J. U U U U U U UPaterson, N.J. 28 19 7 2 - - 5Philadelphia, Pa. 399 271 64 42 12 10 21Pittsburgh, Pa.§ 51 33 7 7 1 3 4Reading, Pa. 10 7 2 1 - - 2Rochester, N.Y. 122 83 24 11 2 2 7Schenectady, N.Y. 21 12 6 2 1 - 1Scranton, Pa.§ 36 28 8 - - - 1Syracuse, N.Y. 89 68 14 3 1 3 12Trenton, N.J. 24 14 5 4 - 1 4Utica, N.Y. 19 17 2 - - - 2Yonkers, N.Y. 31 24 4 2 1 - -
E.N. CENTRAL 1,944 1,293 399 165 37 48 119Akron, Ohio 40 27 11 1 - 1 -Canton, Ohio 33 25 6 1 - 1 4Chicago, Ill. 450 268 105 48 14 13 43Cincinnati, Ohio 150 101 29 13 2 5 13Cleveland, Ohio 115 69 27 14 2 3 -Columbus, Ohio 154 105 27 14 2 6 9Dayton, Ohio 99 72 18 7 2 - 5Detroit, Mich. 178 102 48 20 5 3 6Evansville, Ind. 28 25 3 - - - -Fort Wayne, Ind. 56 47 7 2 - - 3Gary, Ind. 9 3 2 1 1 2 -Grand Rapids, Mich. 39 29 7 1 1 1 1Indianapolis, Ind. 123 85 25 8 3 2 7Madison, Wis. 53 45 3 4 - 1 7Milwaukee, Wis. 105 76 20 5 1 3 7Peoria, Ill. 43 24 10 5 - 4 2Rockford, Ill. 51 31 10 7 1 2 6South Bend, Ind. 45 37 6 - 2 - -Toledo, Ohio 105 77 21 7 - - 4Youngstown, Ohio 68 45 14 7 1 1 2
W.N. CENTRAL 655 461 111 42 19 14 42Des Moines, Iowa 37 25 7 3 1 1 2Duluth, Minn. 19 13 3 3 - - 2Kansas City, Kans. 26 20 4 1 1 - -Kansas City, Mo. 106 54 27 9 5 3 2Lincoln, Nebr. 39 30 7 1 1 - 3Minneapolis, Minn. 144 111 14 9 5 5 12Omaha, Nebr. 68 45 12 7 1 3 7St. Louis, Mo. 102 76 16 6 3 1 7St. Paul, Minn. 51 42 7 1 1 - 6Wichita, Kans. 63 45 14 2 1 1 1
S. ATLANTIC 1,193 711 263 148 42 28 69Atlanta, Ga. 157 97 35 21 3 1 4Baltimore, Md. 205 118 43 26 9 8 15Charlotte, N.C. 67 40 14 8 2 3 4Jacksonville, Fla. 110 74 25 3 7 1 5Miami, Fla. 128 82 27 10 4 5 -Norfolk, Va. 44 18 14 7 - 5 4Richmond, Va. 65 39 16 9 - 1 5Savannah, Ga. 55 36 11 6 1 1 14St. Petersburg, Fla. 54 44 6 2 2 - 1Tampa, Fla. 159 82 36 32 7 2 14Washington, D.C. 137 74 36 19 7 1 3Wilmington, Del. 12 7 - 5 - - -
E.S. CENTRAL 628 402 133 68 13 10 43Birmingham, Ala. 76 48 14 8 4 - 1Chattanooga, Tenn. 74 44 11 14 3 2 6Knoxville, Tenn. 69 49 16 3 1 - 6Lexington, Ky. 46 23 15 6 - 2 2Memphis, Tenn. 167 97 45 19 5 1 15Mobile, Ala. 49 42 3 1 - 3 5Montgomery, Ala. 47 37 8 1 - 1 2Nashville, Tenn. 100 62 21 16 - 1 6
W.S. CENTRAL 1,098 667 259 111 38 23 63Austin, Tex. 58 32 19 4 2 1 5Baton Rouge, La. 13 7 3 1 2 - -Corpus Christi, Tex. U U U U U U UDallas, Tex. 165 96 35 25 8 1 3El Paso, Tex. 43 30 8 3 1 1 5Ft. Worth, Tex. 78 52 17 4 5 - 2Houston, Tex. 296 173 71 40 5 7 28Little Rock, Ark. 66 39 20 3 1 3 5New Orleans, La. 87 55 22 5 3 2 -San Antonio, Tex. 168 105 35 17 7 4 12Shreveport, La. 35 21 4 4 3 3 1Tulsa, Okla. 89 57 25 5 1 1 2
MOUNTAIN 794 535 130 81 32 16 46Albuquerque, N.M. 82 51 12 12 4 3 4Colo. Springs, Colo. 58 42 9 5 2 - -Denver, Colo. 85 56 11 12 3 3 9Las Vegas, Nev. 184 119 35 22 6 2 10Ogden, Utah 15 14 1 - - - 1Phoenix, Ariz. 145 87 28 16 11 3 10Pueblo, Colo. 15 13 2 - - - 2Salt Lake City, Utah 102 70 15 10 5 2 3Tucson, Ariz. 108 83 17 4 1 3 7
PACIFIC 1,517 1,039 247 156 38 36 96Berkeley, Calif. 15 13 - 1 - 1 2Fresno, Calif. 97 58 17 10 7 5 7Glendale, Calif. 26 24 2 - - - 3Honolulu, Hawaii 75 51 12 9 2 1 2Long Beach, Calif. 70 49 14 2 3 1 6Los Angeles, Calif. 437 292 89 39 13 4 21Pasadena, Calif. 31 28 1 1 1 - 4Portland, Oreg. 80 53 15 10 - 2 4Sacramento, Calif. U U U U U U USan Diego, Calif. 110 71 13 17 4 5 14San Francisco, Calif. 146 87 26 29 - 4 11San Jose, Calif. 126 85 18 12 4 7 7Santa Cruz, Calif. 34 29 3 2 - - 1Seattle, Wash. 127 90 18 11 3 5 3Spokane, Wash. 51 39 7 3 1 1 2Tacoma, Wash. 92 70 12 10 - - 9
TOTAL 10,658¶
7,034 2,056 1,035 288 231 631
Reporting Area>65 45-64 25-44 1-24 <1
P&I†
TotalAllAges
All Causes, By Age (Years)
Reporting AreaP&I
†
TotalAllAges
All Causes, By Age (Years)
>65 45-64 25-44 1-24 <1
*Mortality data in this table are voluntarily reported from 121 cities in the United States, most of which have populations of 100,000 ormore. A death is reported by the place of its occurrence and by the week that the death certificate was filed. Fetal deaths are notincluded.
†Pneumonia and influenza.§Because of changes in reporting methods in these 3 Pennsylvania cities, these numbers are partial counts for the current week. Completecounts will be available in 4 to 6 weeks.
¶Total includes unknown ages.U: Unavailable -: no reported cases
TABLE IV. Deaths in 121 U.S. cities,* week endingJune 1, 1996 (22nd Week)
478 MMWR June 7, 1996

Contributors to the Production of the MMWR (Weekly)
Weekly Notifiable Disease Morbidity Data and 121 Cities Mortality Data
Denise Koo, M.D., M.P.H.
Deborah A. Adams
Timothy M. Copeland
Patsy A. Hall
Carol M. Knowles
Sarah H. Landis
Myra A. Montalbano
Graphics Support
Sandra L. Ford
Beverly J. Holland
Desktop Publishing
Jolene W. Altman
Morie M. Higgins
Peter M. Jenkins
Vol. 45 / No. 22 MMWR 479

The Morbidity and Mortality Weekly Report (MMWR) Series is prepared by the Centers for Disease Controland Prevention (CDC) and is available free of charge in electronic format and on a paid subscription basisfor paper copy. To receive an electronic copy on Friday of each week, send an e-mail message [email protected]. The body content should read subscribe mmwr-toc. Electronic copy also is availablefrom CDC’s World-Wide Web server at http://www.cdc.gov/ or from CDC’s file transfer protocol server atftp.cdc.gov. To subscribe for paper copy, contact Superintendent of Documents, U.S. Government PrintingOffice, Washington, DC 20402; telephone (202) 512-1800.
Data in the weekly MMWR are provisional, based on weekly reports to CDC by state health departments.The reporting week concludes at close of business on Friday; compiled data on a national basis are officiallyreleased to the public on the following Friday. Address inquiries about the MMWR Series, including materialto be considered for publication, to: Editor, MMWR Series, Mailstop C-08, CDC, 1600 Clifton Rd., N.E., Atlanta,GA 30333; telephone (404) 332-4555.
All material in the MMWR Series is in the public domain and may be used and reprinted withoutpermission; citation as to source, however, is appreciated.
Director, Centers for Disease Control and PreventionDavid Satcher, M.D., Ph.D.
Deputy Director, Centers for Disease Controland PreventionClaire V. Broome, M.D.
Director, Epidemiology Program OfficeStephen B. Thacker, M.D., M.Sc.
Editor, MMWR SeriesRichard A. Goodman, M.D., M.P.H.
Managing Editor, MMWR (weekly)Karen L. Foster, M.A.
Writers-Editors, MMWR (weekly)David C. JohnsonDarlene D. Rumph-PersonCaran R. Wilbanks
✩U.S. Government Printing Office: 1996-733-175/47008 Region IV
480 MMWR June 7, 1996

![CLINICAL TOXICOLOGY CONSPECTUS 1...Nicotine (pyridine) alkaloids Tropane alkaloids [scopolamine (=hyoscine), hyoscyamine, atropine and others] Phalaris aquatica poisoning – sudden](https://img.dokumen.tips/doc/110x75/614a0b4912c9616cbc692875/clinical-toxicology-conspectus-1-nicotine-pyridine-alkaloids-tropane-alkaloids.jpg)