Embed Size (px)
Citation preview
MIDDLE SCHOOLScope & Sequence
Mat
h in
Foc
us®
is a
regi
ster
ed tr
adem
ark
of T
imes
Pub
lishi
ng L
imite
d.
© H
ough
ton
Miffl
in H
arco
urt P
ublis
hing
Com
pany
. All
right
s re
serv
ed. P
rinte
d in
the
U.S
.A. 0
6/13
MS7
7941
n
GRADES 15
1 2
Scope and SequenceScope and Sequence by Common Core Domain GRADES 6-8
Course 1 Course 2 Course 3
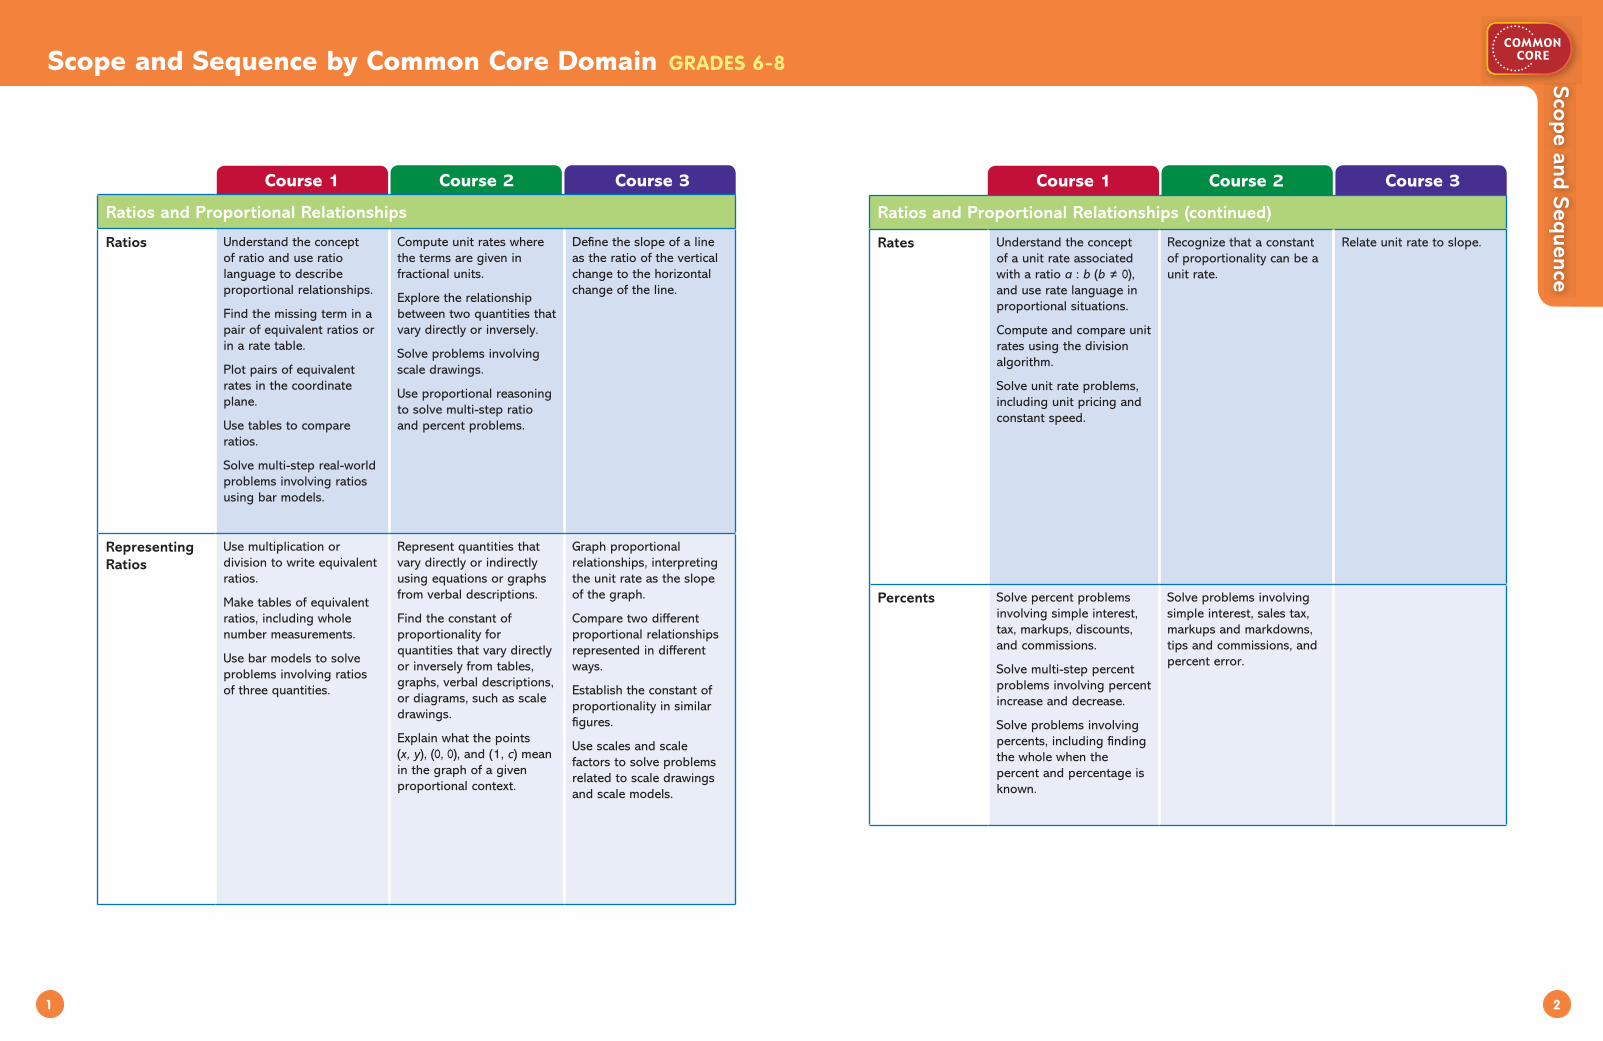
Ratios and Proportional Relationships
Ratios Understand the concept of ratio and use ratio language to describe proportional relationships.
Find the missing term in a pair of equivalent ratios or in a rate table.
Plot pairs of equivalent rates in the coordinate plane.
Use tables to compare ratios.
Solve multi-step real-world problems involving ratios using bar models.
Compute unit rates where the terms are given in fractional units.
Explore the relationship between two quantities that vary directly or inversely.
Solve problems involving scale drawings.
Use proportional reasoning to solve multi-step ratio and percent problems.
Define the slope of a line as the ratio of the vertical change to the horizontal change of the line.
Representing Ratios
Use multiplication or division to write equivalent ratios.
Make tables of equivalent ratios, including whole number measurements.
Use bar models to solve problems involving ratios of three quantities.
Represent quantities that vary directly or indirectly using equations or graphs from verbal descriptions.
Find the constant of proportionality for quantities that vary directly or inversely from tables, graphs, verbal descriptions, or diagrams, such as scale drawings.
Explain what the points (x, y), (0, 0), and (1, c) mean in the graph of a given proportional context.
Graph proportional relationships, interpreting the unit rate as the slope of the graph.
Compare two different proportional relationships represented in different ways.
Establish the constant of proportionality in similar figures.
Use scales and scale factors to solve problems related to scale drawings and scale models.
Course 1 Course 2 Course 3
Ratios and Proportional Relationships (continued)
Rates Understand the concept of a unit rate associated with a ratio a : b (b ≠ 0), and use rate language in proportional situations.
Compute and compare unit rates using the division algorithm.
Solve unit rate problems, including unit pricing and constant speed.
Recognize that a constant of proportionality can be a unit rate.
Relate unit rate to slope.
Percents Solve percent problems involving simple interest, tax, markups, discounts, and commissions.
Solve multi-step percent problems involving percent increase and decrease.
Solve problems involving percents, including finding the whole when the percent and percentage is known.
Solve problems involving simple interest, sales tax, markups and markdowns, tips and commissions, and percent error.
GRADES 15
3 4
Scope and SequenceScope and Sequence by Common Core Domain GRADES 6-8
Course 1 Course 2 Course 3
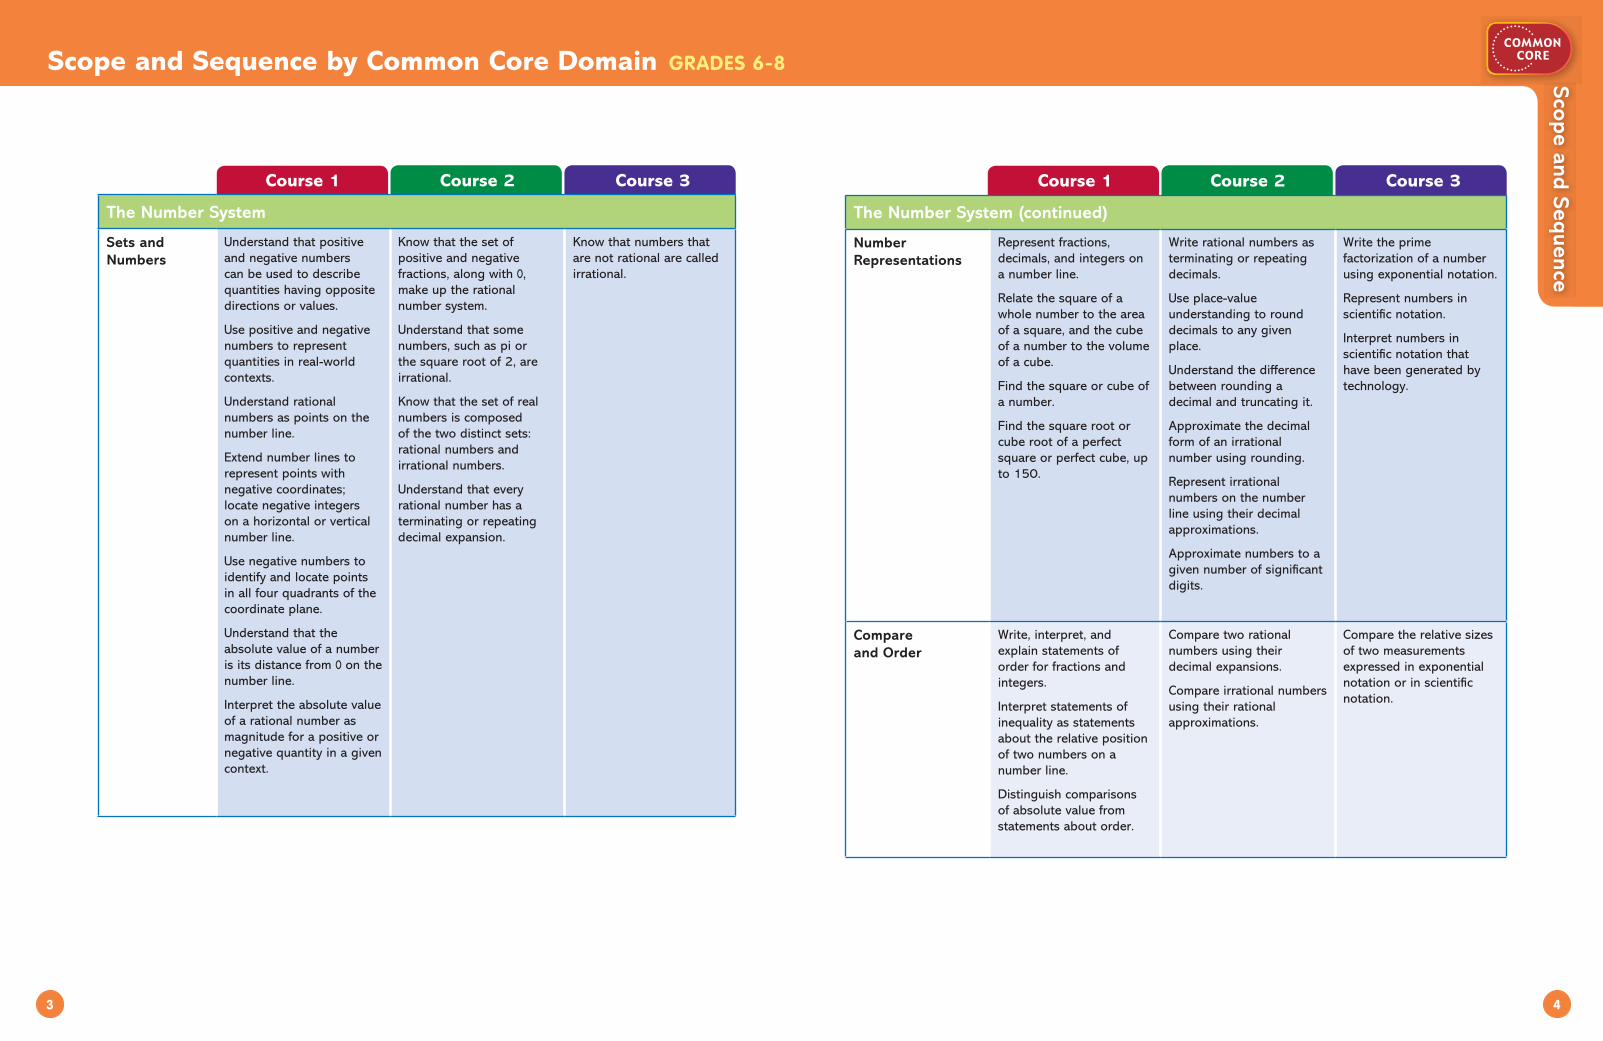
The Number System
Sets and Numbers
Understand that positive and negative numbers can be used to describe quantities having opposite directions or values.
Use positive and negative numbers to represent quantities in real-world contexts.
Understand rational numbers as points on the number line.
Extend number lines to represent points with negative coordinates; locate negative integers on a horizontal or vertical number line.
Use negative numbers to identify and locate points in all four quadrants of the coordinate plane.
Understand that the absolute value of a number is its distance from 0 on the number line.
Interpret the absolute value of a rational number as magnitude for a positive or negative quantity in a given context.
Know that the set of positive and negative fractions, along with 0, make up the rational number system.
Understand that some numbers, such as pi or the square root of 2, are irrational.
Know that the set of real numbers is composed of the two distinct sets: rational numbers and irrational numbers.
Understand that every rational number has a terminating or repeating decimal expansion.
Know that numbers that are not rational are called irrational.
Course 1 Course 2 Course 3
The Number System (continued)
Number Representations
Represent fractions, decimals, and integers on a number line.
Relate the square of a whole number to the area of a square, and the cube of a number to the volume of a cube.
Find the square or cube of a number.
Find the square root or cube root of a perfect square or perfect cube, up to 150.
Write rational numbers as terminating or repeating decimals.
Use place-value understanding to round decimals to any given place.
Understand the difference between rounding a decimal and truncating it.
Approximate the decimal form of an irrational number using rounding.
Represent irrational numbers on the number line using their decimal approximations.
Approximate numbers to a given number of significant digits.
Write the prime factorization of a number using exponential notation.
Represent numbers in scientific notation.
Interpret numbers in scientific notation that have been generated by technology.
Compare and Order
Write, interpret, and explain statements of order for fractions and integers.
Interpret statements of inequality as statements about the relative position of two numbers on a number line.
Distinguish comparisons of absolute value from statements about order.
Compare two rational numbers using their decimal expansions.
Compare irrational numbers using their rational approximations.
Compare the relative sizes of two measurements expressed in exponential notation or in scientific notation.

GRADES 15
5 6
Scope and SequenceScope and Sequence by Common Core Domain GRADES 6-8
Course 1 Course 2 Course 3
The Number System (continued)
Place Value Use place-value concepts to round decimals to a given place.
Round a number to a given number of significant digits.
Write numbers in scientific notation.
Fraction Concepts
Write rational numbers in m/n form, where m and n are integers.
Decimal Concepts
. Write rational numbers as decimals.
Understand that the decimal representation of a rational number is either terminating or repeating.
Understand the difference between rounding a decimal and truncating it.
Approximate the decimal form of an irrational number using rounding.
Whole Number Computation: Multiplication and Division
Fluently divide multi-digit numbers using the standard algorithm.
Identify the number of significant digits in a whole number, decimal number, or measurement.
Compute with very large and very small numbers written in scientific notation.
Solve real-world problems that involve calculations using scientific notation.
Course 1 Course 2 Course 3
The Number System (continued)
Fraction Computation
Interpret and compute quotients of fractions.
Represent situations involving multiplication and division of fractions using models, such as bar models and area models.
Solve real-world problems involving division of fractions by fractions.
Extend multiplication of fractions to include multiplication of rational numbers.
Interpret the sum, product, or quotient of two rational numbers in a real-world context.
Decimal Computation
Fluently multiply and divide multi-digit decimals using standard algorithms.
Represent situations involving multiplication and division of fractions using models, such as bar models and area models.
Solve problems by multiplying and dividing decimals, interpreting remainders to suit the context of the problem.
Solve real-world problems involving all four operations with rational numbers.
Compute with very large and very small numbers written in scientific notation.
Solve real-world problems that involve calculations using scientific notation.
Estimation and Mental Math
Estimate answers to percent problems to check for reasonableness.
Solve real-world and mathematical problems and assess reasonableness of answers using estimation and mental math strategies.
Estimate the square root of a number less than 150 to the nearest whole number mentally.

GRADES 15
7 8
Scope and SequenceScope and Sequence by Common Core Domain GRADES 6-8
Course 1 Course 2 Course 3
The Number System (continued)
Computations with Rational Numbers: Addition and Subtraction
Describe situations in which opposite quantities combine to make 0.
Understand the sum p + q as the number located at a distance |q| from p.
Understand subtraction of a rational number as adding its inverse.
Find the distance between two numbers on a number line using absolute value.
Solve real-world problems involving addition and subtraction with rational numbers.
Interpret the sum of two rational numbers in a real-world context.
Computations with Rational Numbers: Multiplication and Division
Apply properties of operations to multiply and divide rational numbers.
Understand that the quotient of any two integers a and b is the rational number a/b (b ≠ 0).
Understand that –p/q = –p/q = p/–q.
Solve real-world problems involving multiplication and division of rational numbers.
Interpret the product or quotient of two rational numbers in a real-world context.
Course 1 Course 2 Course 3
Expressions and Equations
Patterns Use a number pattern to explore multiplication of negative numbers.
Use number patterns as a context for generating equations in two variables.
Properties Use the distributive property to factor the sum of two whole numbers, or algebraic terms with whole-number coefficients.
Use the properties of real numbers to add and subtract rational numbers.
Use the properties of real numbers to extend multiplication and division of fractions to multiplication and division of rational numbers.
Use the distributive property to show that (–1)(–1) = 1.
Apply properties of real numbers to add, subtract, factor, and expand algebraic expressions with rational coefficients.
Apply properties of real numbers to manipulate variables when solving linear equations in two variables.
Number Theory Write a composite number as a product of its prime factors.
Find the greatest common factor or least common multiple of two whole numbers.
Write the prime factorization of a number using divisibility rules and exponential notation.

GRADES 15
9 10
Scope and SequenceScope and Sequence by Common Core Domain GRADES 6-8
Course 1 Course 2 Course 3
Expressions and Equations (continued)
Functional Relationships
Use variables to write equations representing two real-world quantities that change in relation to one another.
Analyze the relationship between an independent and dependent variable using graphs, tables, and equations.
Create function tables using a spreadsheet.
Represent a direct proportion as a function table, an equation, and a graph.
Represent an inverse proportion using a function table (with an appropriate range), an equation, and a graph.
Understand that a function is a rule that assigns to each input exactly one output.
Represent functions algebraically, in tables, and in graphs.
Know that the graph of a function is the set of ordered pairs consisting on an input and its corresponding output.
Compare properties of two functions each represented in a different way (algebraically, graphically, numerically in tables, or by verbal descriptions).
Interpret the equation y = mx + b as defining a linear function.
Determine and interpret the rate of change and initial value of a function from the context or data.
Give examples of functions that are not linear.
Construct a function to model a linear relationship between two quantities.
Course 1 Course 2 Course 3
Expressions and Equations (continued)
Expressions/ Models
Write and evaluate numerical expressions and geometric formulas involving whole-number exponents.
Write and evaluate algebraic expressions using the order of operations.
Identify parts of an expression using terms such as sum, term, product, and coefficient.
Use the properties of addition and multiplication to write equivalent expressions, including factoring a common factor from a sum.
Identify equivalent expressions and like and unlike terms of an expression.
Solve problems using variable expressions in real-world contexts.
Apply properties of real numbers to add, subtract, factor, and expand algebraic expressions with rational coefficients.
Represent an expression in equivalent forms to help solve a problem.
Represent an expression using a bar model.
Write equivalent expressions by knowing and applying the following properties of integer exponents:
• the product and quotient of powers
• the power of powers• the powers of products
and quotients• zero and negative
exponents
Write two numbers in scientific notation to compare their relative sizes.

GRADES 15
11 12
Scope and SequenceScope and Sequence by Common Core Domain GRADES 6-8
Course 1 Course 2 Course 3
Expressions and Equations (continued)
Number Sentences, Equations and Inequalities
Use substitution to identify value(s) that make an equation or inequality true.
Write and solve addition and multiplication equations to solve real-world problems.
Write and evaluate an inequality of the form x < c or x > c to represent a real-world situation.
Recognize that an inequality of the form x < c or x > c has an infinite number of solutions and represent the solutions on a number line.
Identify equivalent equations.
Write equivalent equations using properties of equality.
Solve two-step equations of the form ax + b = c and a(x + b) = c.
Solve equations with the variable on both sides of the equation.
Solve one-step inequalities using addition, subtraction, multiplication, or division.
Solve word problems that lead to inequalities of the form ax + b > c or ax + b < c.
Graph the solution set of an inequality in one variable on a number line and interpret it in the context of a real-world problem.
Use square root and cube root radicals to represent solutions to equations.
Give examples of linear equations in one variable with one solution, infinitely many solutions, or no solution.
Solve linear equations with rational coefficients, including equations that require expanding and collecting like terms.
Identify the slope, x-intercept, and y-intercept of a linear equation.
Sketch the graph of a linear equation and write a linear equation from a graph or set of data.
Know that the solutions to a system of linear equations in two variables correspond to points of intersection of their graphs.
Solve systems of two linear equations in two variables algebraically.
Estimate the solution of a system of two linear equations in two variables graphically.
Solve real-world problems leading to two linear equations in two variables.
Identify inconsistent and dependent systems of equations.
Course 1 Course 2 Course 3
Expressions and Equations (continued)
The Coordinate Plane
Use negative numbers to identify and locate points in all four quadrants of the coordinate plane.
Find the length of horizontal and vertical segments in the coordinate plane.
Use tables and graphs to represent linear equations.
Solve real-world problems by graphing points in all four quadrants of the coordinate plane.
Plot pairs of equivalent rates represented in the coordinate plane.
Draw polygons in the coordinate plane given the coordinates of the vertices.
Explain what the points (x, y), (0, 0), and (1, c) mean in a given proportional context.
Find the constant of proportionality for quantities that vary directly or inversely from their graphs.
Graph proportional relationships, interpreting the unit rate as the slope of the graph.
Define the slope of a line as the ratio of the vertical change to the horizontal change of the line.
Use similar triangles to explain why the slope m is the same between any two distinct points on a non-vertical line in the coordinate plane.
Know that the solutions to a system of linear equations in two variables correspond to points of intersection of their graphs.
Estimate solutions to systems of two linear equations in two variables graphically.
Know that the graph of a function is the set of ordered pairs consisting of an input and its corresponding output.
Know that the graph of a linear function, given by an equation of the form y = mx + b, is a straight line.
Interpret the graph of a non-linear function as a curve.

GRADES 15
13 14
Scope and SequenceScope and Sequence by Common Core Domain GRADES 6-8
Course 1 Course 2 Course 3
The Number System (continued)
The Coordinate Plane (continued)
Sketch the graph of a relationship whose verbal description has given qualities.
Find the image of a figure in the coordinate plane under a translation, rotation, reflection, or dilation.
Apply the Pythagorean Theorem to find the distance between two points in the coordinate plane.
Course 1 Course 2 Course 3
Geometry
Lines and Angles Find the lengths of horizontal and vertical segments on a coordinate plane.
Identify supplementary and complementary angles.
Use supplementary, complementary, vertical, and adjacent angles to write and solve simple equations for unknown angle measures.
Identify parallel lines and their transversals.
Identify and use corresponding angles, alternate angles, and interior angles formed from parallel lines and a transversal to solve problems.
Use properties of interior angles and exterior angles of a triangle and the related sums.
Construct and use angle bisectors and perpendicular bisectors.
Apply the equidistant properties of angle bisectors and perpendicular bisectors to solve problems.
Find the images of lines, angles, and parallel lines under rotations, reflections, and translations.

GRADES 15
15 16
Scope and SequenceScope and Sequence by Common Core Domain GRADES 6-8
Course 1 Course 2 Course 3
Geometry (continued)
Polygons Identify regular polygons.
Draw polygons in the coordinate plane given the coordinates of the vertices.
Use coordinates to find the length of horizontal or vertical sides of polygons.
Solve problems involving drawings of geometric figures.
Reproduce a scale drawing at a different scale.
Know that if the measures of two angles and the non- included side of a triangle are given, then 0, 1, or 2 triangles may be possible.
Construct a unique triangle given the lengths of its three sides, or the lengths of two sides and the measure of one angle, or the measures of two angles and the length of the included side.
Know that no triangle is possible if, given the lengths of the three sides, the sum of any two of them is less than or equal to the length of the third side.
Construct a quadrilateral from given conditions, including angle measures or lengths of sides or diagonals.
Explain a proof of the Pythagorean Theorem and its converse.
Use the Pythagorean Theorem to find unknown side lengths in right triangles in real-world problems.
Use the converse of the Pythagorean Theorem to determine whether a triangle is a right triangle.
Solid Figures Find the cross sections formed by slicing a rectangular prism.
Identify pyramids, cylinders, cones, and spheres.
Find cross sections and volumes of right pyramids.
Recognize that a cylinder can be thought of as a right prism with a circular base.
Apply the Pythagorean Theorem to find the slant height of pyramids and cones, or the length of diagonals in prisms.
Course 1 Course 2 Course 3
Geometry (continued)
Congruence and Similarity
Identify and use the congruent angles formed by two intersecting lines to solve problems.
Identify and use the congruent angles formed by two parallel lines and a transversal to solve problems.
Understand that two figures are congruent if one can be moved onto the other by a series of translations, reflections, and rotations.
Understand that two figures are similar if one can be moved onto the other by a series of translations, reflections, rotations, and dilations.
Given two congruent or similar figures in a plane, find a sequence of transformations that moves one onto the other.
Establish the constant of proportionality in similar figures.
Establish through informal arguments the AA Similarity Theorem for triangles.
Understand that if two figures are related by a scale factor of k, then their areas are related by a scale factor of k2.
Use similar triangles to explain why the slope m is the same between any two distinct points on a non-vertical line in the coordinate plane.

GRADES 15
17 18
Scope and SequenceScope and Sequence by Common Core Domain GRADES 6-8
Course 1 Course 2 Course 3
Geometry (continued)
Transformations Verify experimentally that rotations, reflections, and translations preserve lengths, angle measures, parallelism, and perpendicularity.
Find the image of a figure in the coordinate plane under a translation, rotation, reflection, or dilation.
Understand that two figures are congruent if one can be moved onto the other by a series of translations, reflections, and rotations.
Understand that two figures are similar if one can be moved onto the other by a series of translations, reflections, rotations, and dilations.
Given two congruent or similar figures in a plane, find a sequence of transformations that moves one onto the other.
Circles Identify the center, radius, diameter, and circumference of a circle.
Understand π to be the ratio of the circumference to the diameter of a circle.
Solve real-world problems involving rates and circles.
Apply the formula for the area of a circle to develop the surface area and volume formulas of cylinders and cones.
Know that arcs of circles can be used to mark off equal distances on a line or in a plane.
Course 1 Course 2 Course 3
Geometry (continued)
Perimeter and Circumference
Understand how the formula for the circumference of a circle is derived.
Use a formula to calculate the circumference of circles, semi-circles, and quarter circles.
Solve problems involving the circumference of circles.
Area Find the area of triangles, parallelograms, trapezoids, and regular polygons by decomposing into rectangles or triangles.
Find a missing dimension of a plane figure given its area and other dimension(s).
Understand how the formula for the area of a circle is derived.
Use a formula to calculate areas of circles and semi-circles.
Solve real-world problems involving the areas of triangles, parallelograms, trapezoids, regular polygons, and circles.
Use the formula for the area of a circle to find the surface area of a cylinder and cone.
Solve problems involving the areas of triangles, quadrilaterals, and other polygons.
Compute lengths and areas for a real figure from its scale drawing.
Understand that if two figures are related by a scale factor of k, then their areas are related by a scale factor of k2.
GRADES 15
19 20
Scope and SequenceScope and Sequence by Common Core Domain GRADES 6-8
Course 1 Course 2 Course 3
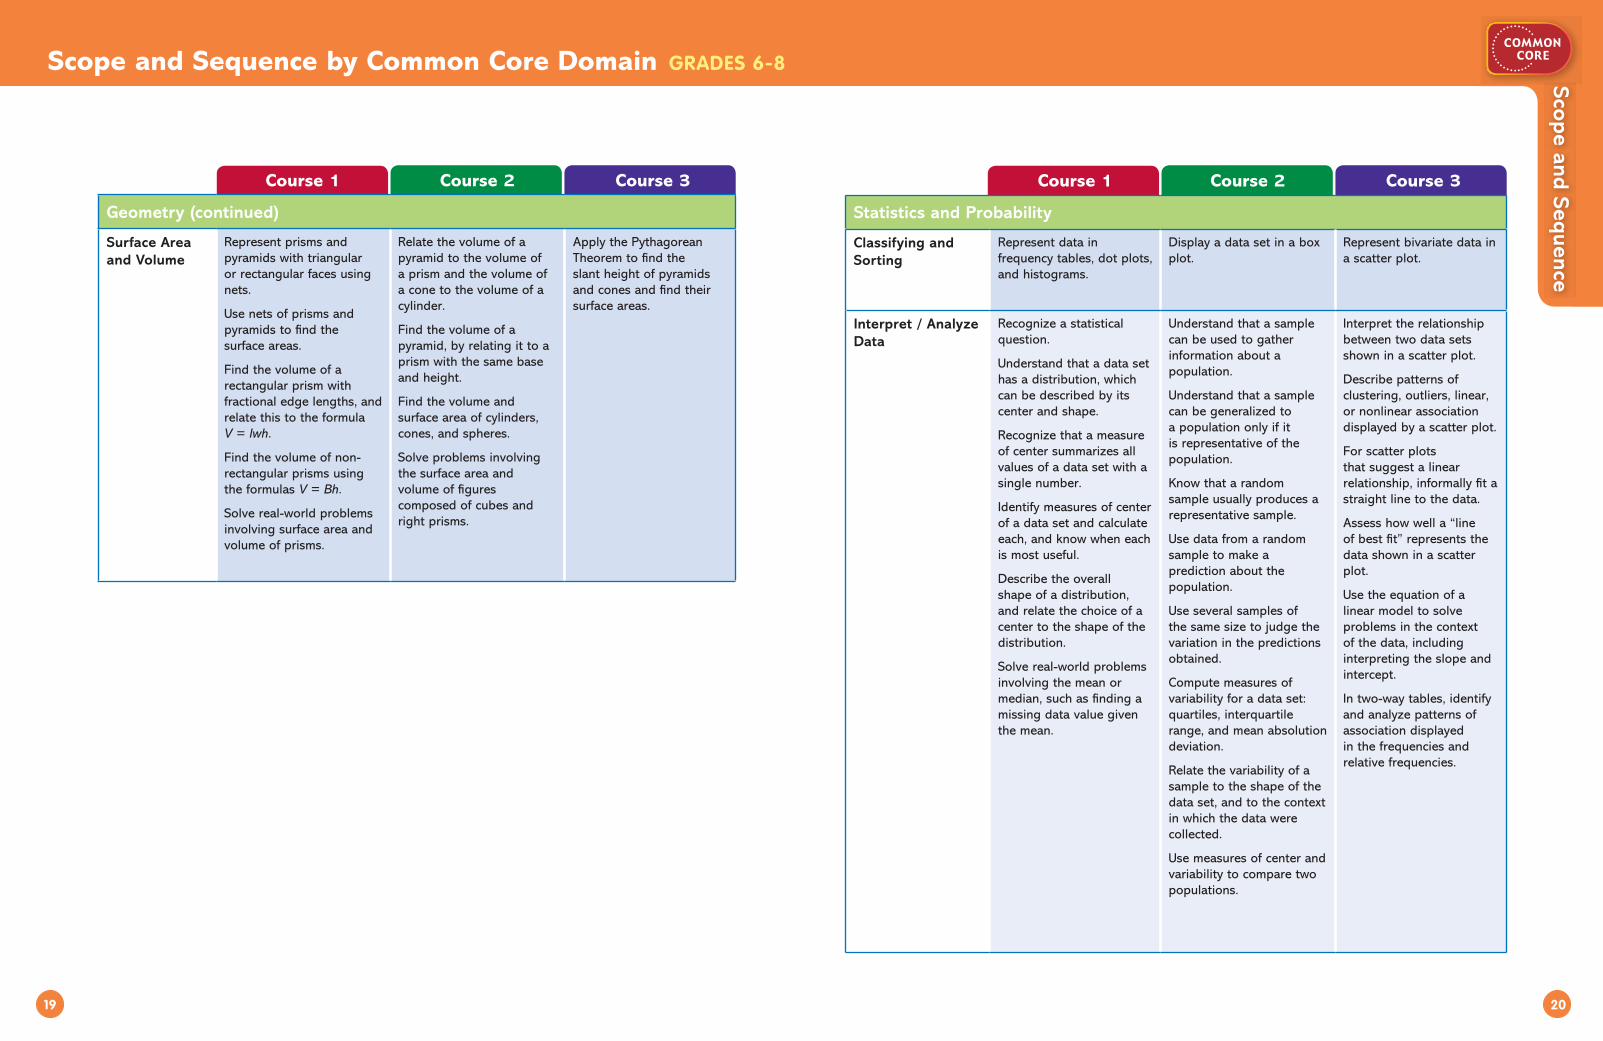
Geometry (continued)
Surface Area and Volume
Represent prisms and pyramids with triangular or rectangular faces using nets.
Use nets of prisms and pyramids to find the surface areas.
Find the volume of a rectangular prism with fractional edge lengths, and relate this to the formula V = lwh.
Find the volume of non-rectangular prisms using the formulas V = Bh.
Solve real-world problems involving surface area and volume of prisms.
Relate the volume of a pyramid to the volume of a prism and the volume of a cone to the volume of a cylinder.
Find the volume of a pyramid, by relating it to a prism with the same base and height.
Find the volume and surface area of cylinders, cones, and spheres.
Solve problems involving the surface area and volume of figures composed of cubes and right prisms.
Apply the Pythagorean Theorem to find the slant height of pyramids and cones and find their surface areas.
Course 1 Course 2 Course 3
Statistics and Probability
Classifying and Sorting
Represent data in frequency tables, dot plots, and histograms.
Display a data set in a box plot.
Represent bivariate data in a scatter plot.
Interpret / Analyze Data
Recognize a statistical question.
Understand that a data set has a distribution, which can be described by its center and shape.
Recognize that a measure of center summarizes all values of a data set with a single number.
Identify measures of center of a data set and calculate each, and know when each is most useful.
Describe the overall shape of a distribution, and relate the choice of a center to the shape of the distribution.
Solve real-world problems involving the mean or median, such as finding a missing data value given the mean.
Understand that a sample can be used to gather information about a population.
Understand that a sample can be generalized to a population only if it is representative of the population.
Know that a random sample usually produces a representative sample.
Use data from a random sample to make a prediction about the population.
Use several samples of the same size to judge the variation in the predictions obtained.
Compute measures of variability for a data set: quartiles, interquartile range, and mean absolution deviation.
Relate the variability of a sample to the shape of the data set, and to the context in which the data were collected.
Use measures of center and variability to compare two populations.
Interpret the relationship between two data sets shown in a scatter plot.
Describe patterns of clustering, outliers, linear, or nonlinear association displayed by a scatter plot.
For scatter plots that suggest a linear relationship, informally fit a straight line to the data.
Assess how well a “line of best fit” represents the data shown in a scatter plot.
Use the equation of a linear model to solve problems in the context of the data, including interpreting the slope and intercept.
In two-way tables, identify and analyze patterns of association displayed in the frequencies and relative frequencies.

GRADES 15
21 22
Scope and SequenceScope and Sequence by Common Core Domain GRADES 6-8
Course 1 Course 2 Course 3
Statistics and Probability (continued)
Outcomes Use a Venn diagram to illustrate sample spaces and events.
Identify the outcomes of a sample space that make up an event, when the event is stated in everyday language.
Represent the outcomes of compound events using organized lists or tree diagrams.
Expressing Probability
Know that the probability of an event is a number between 0 and 1 inclusive.
Find the probability of complementary and mutually exclusive events.
Approximate the probability of a chance event using an appropriate sampling technique.
Compute the approximate relative frequency of a chance event from its probability.
Develop a sampling technique (probability model) for equally likely events.
Develop a sampling technique (probability model) for events that are not equally likely.
Compare the theoretical and experimental probabilities of an event.
Design and use a simulation to generate frequencies for a chance process.
Use tree diagrams and multiplication to find the probabilities of dependent and independent events.
Represent non-mutually exclusive events using Venn diagrams.
Course 1 Course 2 Course 3
1. Make sense of problems and persevere in solving them
Build skills through a problem-solving perspective.
Build skills in multiplication and division of fractions and decimals, ratios, and percents; algebra, data analysis, and geometry; and measurement through problem solving.
Build skills in operations with integers and rational numbers, proportionality, measurement, statistics, and probability through problem solving.
Build skills in operations with integers and rational numbers, proportionality, measurement, statistics, and probability through problem solving.
Plan how and use appropriate strategies, tools, and thinking skills to solve problems.
Discuss mathematical ideas, use appropriate strategies, solve real-world problems, and explain solution methods in class.
Discuss mathematical ideas, use appropriate strategies, solve real-world problems, and explain solution methods in class.
Discuss mathematical ideas, use appropriate strategies, solve real-world problems, and explain solution methods in class.
Use bar and other models consistently to persevere in problem solving.
Use bar models to solve real-world problems involving multiplication, division, fractions, decimals, ratios, percents, data analysis, geometry, and measurement.
Apply the problem-solving process to non-routine problems in Challenging Practice and Brain@Work, Chapter Projects, and other activities.
Use models to solve multi-step real-world problems involving integers, equations, inequalities, proportions, scale drawings, formulas, probability, and statistics.
Apply the problem-solving process to non-routine problems in Challenging Practice and Brain@Work, Chapter Projects, and other activities.
Use models to solve multi-step real-world problems involving rational and irrational numbers, equations, inequalities, proportions, formulas, probability, and statistics.
Apply the problem-solving process to non-routine problems in Challenging Practice and Brain@Work, Chapter Projects, and other activities.
Monitor and evaluate the solution process and explain problem solving.
Explain problem solving in Guided Practice, Math Journal, and “explain” exercises.
Explain problem solving in Guided Practice, Math Journal, and “explain” exercises.
Explain problem solving in Guided Practice, Math Journal, and “explain” exercises.
STANDARDS FOR MATHEMATICAL PRACTICE

GRADES 15
23 24
Scope and SequenceScope and Sequence by Common Core Domain GRADES 6-8
STANDARDS FOR MATHEMATICAL PRACTICE
Course 1 Course 2 Course 3
2. Reason abstractly and quantitatively
Investigate mathematical ideas and models through a concrete to pictorial to abstract progression.
Use concrete and visual models to explore concepts more deeply, formulate conjectures, and justify reasoning in Let’s Explore and Hands-On activities.
Represent a wide variety of real-world contexts through the use of numbers, variables, equations, and inequalities.
Apply the properties of operations in manipulating symbolic representations.
Use concrete and visual models to explore concepts more deeply, formulate conjectures, and justify reasoning in Hands-On and other activities.
Represent a wide variety of real-world contexts through the use of real numbers, variables, equations, and inequalities.
Apply the properties of operations in manipulating symbolic representations.
Use concrete and visual models to explore concepts more deeply, formulate conjectures, and justify reasoning in Hands-On, Technology, and other activities.
Represent a wide variety of real-world contexts through the use of real numbers, variables, equations, and inequalities.
Apply the properties of operations in manipulating symbolic representations.
Make sense of quantities and their relationships.
Use models to show relationships involving fractions, decimals, percents, and ratios.
Apply understanding of models for multiplication and division of fractions and decimals.
Generalize place value understanding for division with multi-digit decimals.
Analyze the relationship between the dependent and independent variables using graphs and tables, and relate these to the equation.
Use ratio and rate language in the context of a ratio relationship.
Analyze data shown in frequency tables, line plots, dot plots, and histograms.
Use models to show the relationships between the types of real numbers.
Apply understanding of models for operations with integers and other rational numbers.
Extend place value understanding to show that all rational numbers can be written as either terminating or repeating decimals.
Analyze the relationship between quantities in a proportional relationship using tables, graphs, and equations.
Identify the constant of proportionality in tables, graphs, and equations.
Use numbers expressed in the form of a single digit times an integer power of 10 to estimate very large or very small quantities.
Use scientific notation and choose units of appropriate size for measurements of very large or very small quantities.
Graph proportional relationships, interpreting the unit rate as the slope of the graph.
Know that straight lines are widely used to model relationships between two quantitative variables.
Construct a function to model a linear relationship between two quantities.
Course 1 Course 2 Course 3
2. Reason abstractly and quantitatively (continued)
Make sense of quantities and their relationships (continued).
Analyze and summarize numerical data sets in frequency tables, box plots, and experiments. Use data from a random sample to draw inferences about a population.
Relate symbols such as negative numbers, absolute values, and variables to real-world and mathematical situations.
Construct and interpret scatter plots for bivariate measurement data to investigate patterns of association between two quantities.
Investigate mathematical ideas and models.
Explore concepts and models more deeply and justify reasoning in Hands-On and other activities.
Investigate mathematical ideas through non-routine problems in Brain @ Work activities.
Explore concepts and models more deeply and justify reasoning in Hands-On, Technology, and other activities.
Investigate mathematical ideas through non-routine problems in Brain @ Work activities.
Explore concepts and models more deeply and justify reasoning in Hands-On, Technology, and other activities.
Investigate mathematical ideas through non-routine problems in Brain @ Work activities.

GRADES 15
25 26
Scope and SequenceScope and Sequence by Common Core Domain GRADES 6-8
STANDARDS FOR MATHEMATICAL PRACTICE
Course 1 Course 2 Course 3
3. Construct viable arguments and critique the reasoning of others
Identify, demonstrate, and explain mathematical proof.
Identify, describe, and extend patterns in tables of equivalent ratios.
Use properties to classify prisms and pyramids.
Find the area of right triangles, other triangles, special quadrilaterals, and polygons by composing into rectangles or decomposing into triangles and other shapes.
Explain the relationships among the volume formulas of different prisms and pyramids.
Identify the constant of proportionality in tables, graphs, equations, and verbal descriptions.
Use properties to classify polygons, cylinders, cones, pyramids, and spheres.
Use properties of complementary, supplementary, vertical, and adjacent angles to find the unknown angles in a figure.
Use informal arguments to establish facts about angle sum and exterior angles of triangles.
Explain the relationships among the volume formulas of prisms, cones, cylinders, and spheres.
Analyze numerical data by quantitative measures of variability (such as mean absolute deviation).
Know and apply the properties of integer exponents to generate equivalent numerical expressions.
Use similar triangles to explain why the slope m is the same between any two distinct points on a non-vertical line in the coordinate plane.
Derive the equation y = mx for a line through the origin and the equation y = mx + b for a line intercepting the vertical axis at b.
Emphasize the process skills: look for a pattern in generalizing and comparing the properties of two functions.
Explain a proof of the Pythagorean Theorem and its converse.
Establish through informal arguments the AA Similarity Theorem for triangles.
Course 1 Course 2 Course 3
3. Construct viable arguments and critique the reasoning of others (continued)
Use a variety of reasoning skills to communicate arguments.
Use ratio and rate reasoning to solve real-world and mathematical problems, e.g., by reasoning about tables of equivalent ratios, tape diagrams, double number line diagrams, or equations.
Apply the properties of operations to generate equivalent numerical and algebraic expressions.
Communicate arguments through algebraic models (expressions, equations, inequalities), graphs, tables, and data displays.
Use activities to describe what a chance process is and explain the discrepancy between relative frequency and probability.
Apply the properties of operations to add, subtract, multiply, and divide rational numbers in numerical and algebraic operations.
Communicate arguments through algebraic models (expressions, equations, inequalities), graphs, tables, and data displays.
Interpret scientific notation that has been generated by technology.
Describe qualitatively the functional relationship between two quantities by analyzing a graph.
Verify experimentally the properties of rotations, reflections, and translations.
Construct and interpret a two-way table summarizing data on two categorical variables collected from the same subjects.
Share and communicate mathematical thinking and ideas.
Express and explain ideas in Math Journal and other activities, using lesson vocabulary.
Work together in pairs or groups in Projects and other activities.
Express and explain ideas in Math Journal and other activities, using lesson vocabulary.
Work together in pairs or groups in Projects and other activities.
Express and explain ideas in Math Journal and other activities, using lesson vocabulary.
Work together in pairs or groups in Projects and other activities.

GRADES 15
27 28
Scope and SequenceScope and Sequence by Common Core Domain GRADES 6-8
STANDARDS FOR MATHEMATICAL PRACTICE
Course 1 Course 2 Course 3
4. Model with mathematics
Interpret phenomena through representations.
Use exponents to represent repeated multiplication.
Represent negative numbers on a number line and in the coordinate plane.
Represent solutions of inequalities on a number line.
Understand absolute value of a rational number as its distance from 0 on a number line.
Find equivalent ratios and rates.
Introduce integers and rational numbers and their definitions.
Introduce irrational numbers and illustrate with examples such as √2 and π.
Map rational and irrational numbers on the number line.
Understand subtraction of rational numbers as adding the additive inverse.
Use the laws of equality to write equivalent equations.
Write numbers in exponential notation.
Interpret numbers in scientific notation that have been generated by technology.
Apply properties of real numbers to manipulate variables when solving linear equations in two variables.
Give examples of linear equations in one variable with one solution, infinitely many solutions, or no solution.
Represent functions algebraically, in tables, and in graphs.
Construct a function to model a linear relationship between two quantities.
Use representations to model, organize, and record quantities.
Translate between fractions, decimals, ratios, and percents.
Select the most useful form (fraction or decimal) for solving problems involving percents.
Use a variety of models to solve problems involving ratios, rates, and percents.
Use visual models (area models, sets, and number line drawings) to represent problems involving fractions, decimals, ratios, rates, and percents.
Translate among the various forms for rational numbers.
Select the most useful form of a rational number to solve real-world and mathematical problems.
Use activities with various models to understand sampling, chance, and probability.
Use various models to solve multi-step real-world problems involving integers, equations, inequalities, proportions, scale drawings, formulas, probability, and statistics.
Know and apply the properties of integer exponents to write equivalent expressions.
Use square root and cube root radicals to represent solutions to equations.
Write two numbers in scientific notation to compare their relative sizes.
Sketch the graph of a linear equation and write a linear equation from a graph or set of data.
Course 1 Course 2 Course 3
4. Model with mathematics (continued)
Use representations to model, organize, and record quantities(continued).
Use part/whole, comparison, and before and after bar models to represent multi-step real-world problems with whole numbers, fractions, decimals, ratios, rates, and percents.
Measure distances in the coordinate plane.
Use a net to find the surface area of pyramids and prisms.
Represent data in dot plots and histograms.
Display numerical data in plots on a number line, including line plots, dot plots, and histograms.
Solve problems involving scale drawings of geometric figures, including measuring actual lengths and areas.
Identify the constant of proportionality in scale drawings and other diagrams.
Show how to use a random number table to simulate random samples.
Display data in line plots, dot plots, box plots, Venn diagrams, and histograms.
Use overlapping data distributions to measure the difference between two populations.
Use similar triangles to explain why the slope m is the same between any two distinct points on a non-vertical line in the coordinate plane.
Use the Pythagorean Theorem to find unknown side lengths in right triangles in real-world problems.
Define and illustrate transformations, using graphs, geometric software and diagrams, the properties of translations, reflections, rotations, and dilations.
Describe patterns of clustering, outliers, and linear or nonlinear association displayed by a scatter plot.
Find probabilities for compound events using organized lists or tables.
Use tree diagrams and multiplication to find the probabilities of dependent and independent events.
Represent non-mutually exclusive events using Venn diagrams.
Design and use a simulation to generate frequencies for compound events.

GRADES 15
29 30
Scope and SequenceScope and Sequence by Common Core Domain GRADES 6-8
STANDARDS FOR MATHEMATICAL PRACTICE
Course 1 Course 2 Course 3
4. Model with mathematics (continued)
Use variables and coordinate grids to represent and model.
Understand that a variable can represent an unknown number, or, depending on the purpose at hand, any number in a specified set.
Use letters as variables in algebraic expressions, equations, inequalities, and formulas.
Represent equivalent ratios and rates in tape diagrams, double number line diagrams, equations, or coordinate graphs.
Use a coordinate grid to represent polygons and equations.
Extend the use of variables to write and solve simple equations for an unknown angle in a figure.
Understand that rewriting a variable expression in different forms can shed light on how the quantities in a problem are related.
Identify the constant of proportionality in tables, graphs, and equations.
Use a coordinate grid to represent direct and inverse variation.
Use number patterns as a context for generating equations in two variables.
Apply properties of real numbers to manipulate variables when solving linear equations in two variables.
Represent functions algebraically, in tables, and in graphs.
Know that the graph of a function is the set of ordered pairs consisting on an input and its corresponding output.
Compare properties of two functions each represented in a different way (algebraically, graphically, numerically in tables, or by verbal descriptions).
Sketch the graph of a linear equation and write a linear equation from a graph or set of data.
Represent systems of linear equations algebraically and graphically.
Graph proportional relationships, interpreting the unit rate as the slope of the graph.
Course 1 Course 2 Course 3
5. Use appropriate tools strategically
Choose among tools: pencil and paper, concrete models, or technology in developing skills.
Use paper and pencil to calculate and draw.
Use geometry tools (protractor, set squares, grid paper) to model problems.
Use technology (virtual manipulatives and computers) to model and draw.
Select appropriate formulas and units in solving problems involving perimeter, area, surface area, and volume.
Use a calculator to model, compute, and solve.
Use paper and pencil to calculate and draw.
Use geometry tools (protractor, set squares, grid paper) to model problems.
Use technology (virtual manipulatives and computers) to model and draw.
Use tools such as rulers, protractors, and technology to draw geometric figures with given conditions.
Use geometry tools to construct triangles and quadrilaterals.
Select appropriate formulas and units in solving problems involving perimeter, area, surface area, and volume.
Use a calculator to model, compute, and solve problems involving rational numbers.
Use paper and pencil to calculate and draw.
Use geometry tools (protractor, set squares, grid paper) to model problems.
Use technology (virtual manipulatives and computers) to model and draw.
Use geometry tools to construct triangles and quadrilaterals.
Use a calculator to model, compute, and solve problems involving rational and irrational numbers.
Interpret numbers in scientific notation that have been generated by technology.
Solve real-world problems that involve calculations with very large and very small numbers using scientific notation.
Verify experimentally the properties of rotations, reflections, and translations regarding the images of lines, angles, and parallel lines.

GRADES 15
31 32
Scope and SequenceScope and Sequence by Common Core Domain GRADES 6-8
STANDARDS FOR MATHEMATICAL PRACTICE
Course 1 Course 2 Course 3
6. Attend to precision
Communicate precisely by using mathematical language and symbols clearly in discussion with others.
Understand and use the lesson vocabulary to explain reasoning.
Interpret symbols of relation in comparing positive and negative numbers, as well as absolute values.
Recognize opposite signs of numbers as indicating locations on opposite sides of 0 on the number line or in the coordinate plane.
Draw and label bar models, identifying parts and units.
Identify parts of an algebraic expression using mathematical terms (sum, term, product, factor, quotient, coefficient).
Understand that pi represents the relationship between the circumference and diameter of a circle.
Express surface area in square units and volume in cubic units.
Use estimation to check the reasonableness of multi-digit computations with decimals and percents.
Understand and use the lesson vocabulary to explain reasoning.
Interpret symbols of relation in comparing real numbers.
Show that all rational numbers can be written as either terminating or repeating decimals.
Understand that rewriting an expression in different forms can shed light on how the quantities in a problem are related.
Identify and label parts of cylinders, cones, and spheres.
Understand that pi is an irrational number.
Express surface area in square units and volume in cubic units.
Use estimation strategies to check the reasonableness of computations with rational and irrational numbers.
Write numbers to a specific number of significant digits.
Use the lesson vocabulary to explain reasoning.
Know that numbers that are not rational are irrational.
Interpret symbols of relation in comparing real numbers and the relative sizes of two measurements expressed in scientific notation.
Use square root and cube root radicals to represent solutions to equations.
Identify and interpret the slope, x-intercept, and y-intercept of a linear equation.
Understand that a function is a rule that assigns to each input exactly one output.
Interpret the equation y = mx + b as defining a linear function.
Identify inconsistent and dependent systems of equations.
Describe the effect of dilations, translations, rotations, and reflections on two-dimensional figures in the coordinate plane.
Given two congruent figures, describe a sequence of transformations that will transform one to the other.
Describe patterns of clustering, outliers, and linear or nonlinear association displayed by a scatter plot.
Course 1 Course 2 Course 3
7. Look for and make use of structure
Consolidate mathematical thinking.
Present mathematical thinking through Math Journals, Explains, and in-class discussions.
Present mathematical thinking through Math Journals, Explains, and in-class discussions.
Present mathematical thinking through Math Journals, Explains, and in-class discussions.
Recognize connections in mathematical ideas.
Relate ratios, fractions, and rates.
Understand that ratios can represent part-to-part as well as part-to-whole relationships.
Make connections between squares and square roots, cubes and cube roots.
Convert among fractions, decimals, and percents.
Apply the properties of operations to generate equivalent numerical and algebraic expressions.
Examine the relationships between cross-sections of prisms and their volume.
Show that a number and its opposite have a sum of 0.
Examine the relationships among integers and rational numbers.
Extend understanding of operations with fractions to operations with positive and negative rational numbers.
Convert among various forms of rational numbers depending on the real-world or mathematical situation.
Relate the patterns that exist in ratio tables to the constant of proportionality in a graph.
Describe the two- dimensional figures that result from slicing three-dimensional figures.
Describe the sample space for events using tree diagrams, Venn diagrams, and organized lists.
Relate unit rate to slope.
Apply properties of real numbers to manipulate variables when solving linear equations in two variables.
Use number patterns as a context for generating equations in two variables.
Construct a function to model a linear relationship between two quantities.
Use similar triangles to explain why the slope m is the same between any two distinct points on a non-vertical line in the coordinate plane.
Use experiments to describe the effects of transformations on congruent and similar figures.
Interpret the relationship between two data sets shown in a scatter plot.
In two-way tables, identify and analyze patterns of association displayed in the frequencies and relative frequencies.
GRADES 15
33 34
Scope and SequenceScope and Sequence by Common Core Domain GRADES 6-8
STANDARDS FOR MATHEMATICAL PRACTICE
Course 1 Course 2 Course 3
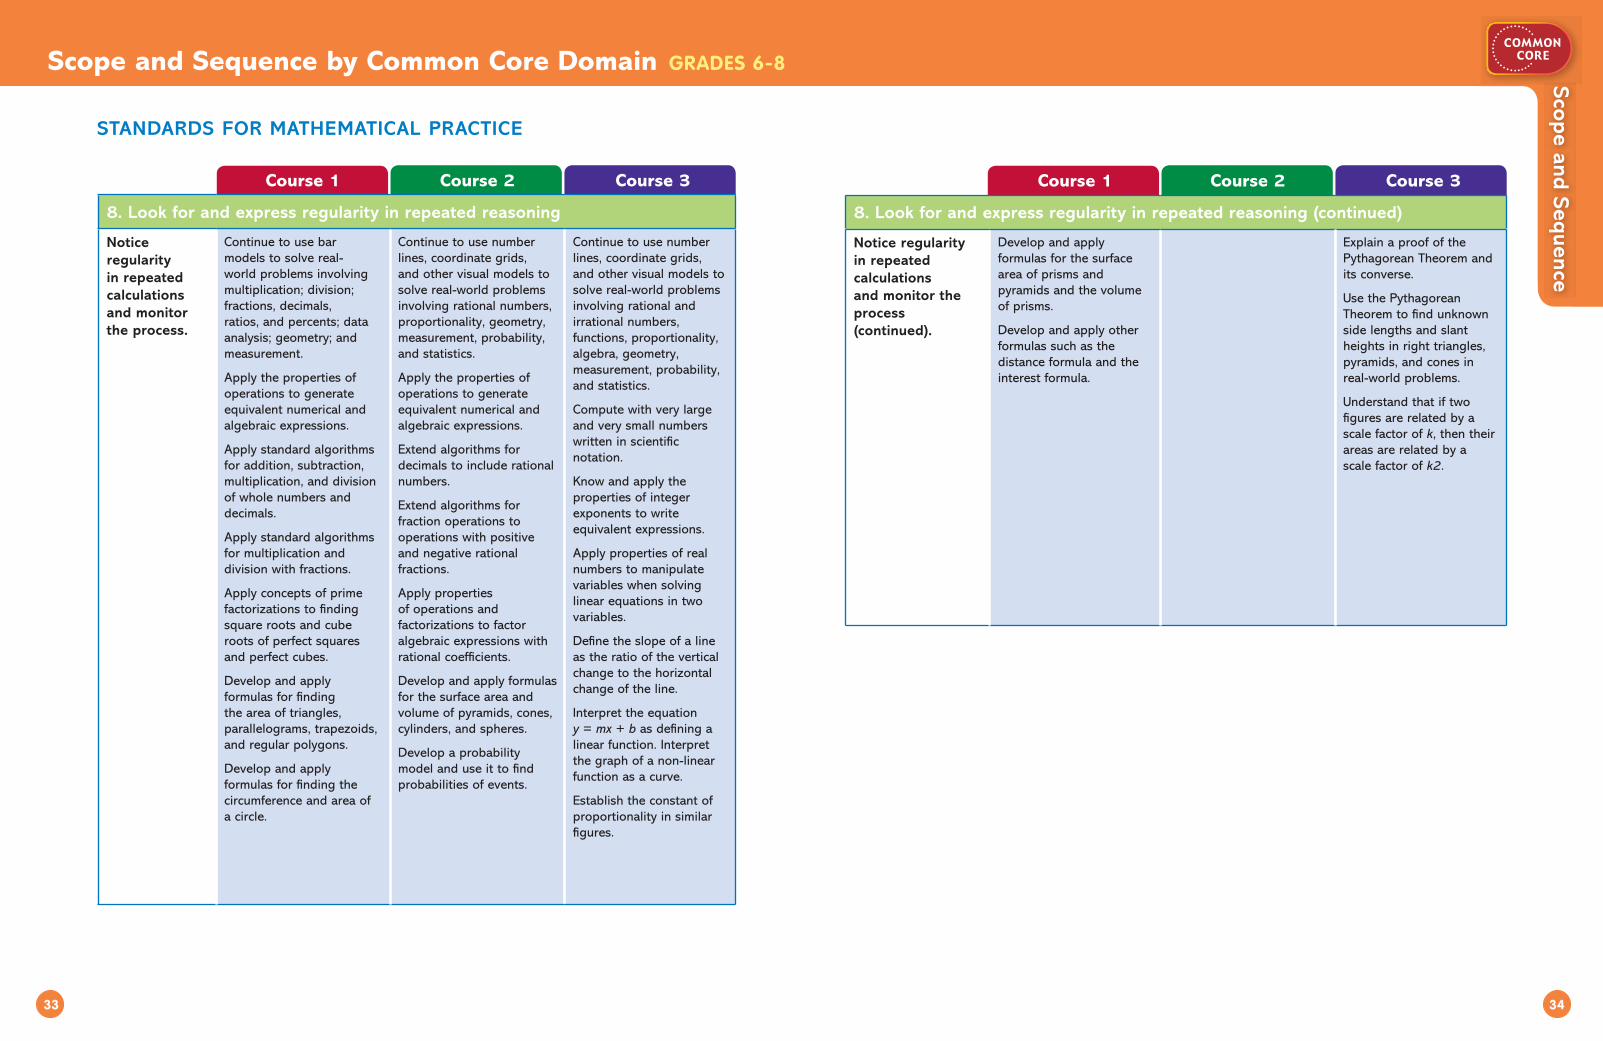
8. Look for and express regularity in repeated reasoning
Notice regularity in repeated calculations and monitor the process.
Continue to use bar models to solve real-world problems involving multiplication; division; fractions, decimals, ratios, and percents; data analysis; geometry; and measurement.
Apply the properties of operations to generate equivalent numerical and algebraic expressions.
Apply standard algorithms for addition, subtraction, multiplication, and division of whole numbers and decimals.
Apply standard algorithms for multiplication and division with fractions.
Apply concepts of prime factorizations to finding square roots and cube roots of perfect squares and perfect cubes.
Develop and apply formulas for finding the area of triangles, parallelograms, trapezoids, and regular polygons.
Develop and apply formulas for finding the circumference and area of a circle.
Continue to use number lines, coordinate grids, and other visual models to solve real-world problems involving rational numbers, proportionality, geometry, measurement, probability, and statistics.
Apply the properties of operations to generate equivalent numerical and algebraic expressions.
Extend algorithms for decimals to include rational numbers.
Extend algorithms for fraction operations to operations with positive and negative rational fractions.
Apply properties of operations and factorizations to factor algebraic expressions with rational coefficients.
Develop and apply formulas for the surface area and volume of pyramids, cones, cylinders, and spheres.
Develop a probability model and use it to find probabilities of events.
Continue to use number lines, coordinate grids, and other visual models to solve real-world problems involving rational and irrational numbers, functions, proportionality, algebra, geometry, measurement, probability, and statistics.
Compute with very large and very small numbers written in scientific notation.
Know and apply the properties of integer exponents to write equivalent expressions.
Apply properties of real numbers to manipulate variables when solving linear equations in two variables.
Define the slope of a line as the ratio of the vertical change to the horizontal change of the line.
Interpret the equation y = mx + b as defining a linear function. Interpret the graph of a non-linear function as a curve.
Establish the constant of proportionality in similar figures.
Course 1 Course 2 Course 3
8. Look for and express regularity in repeated reasoning (continued)
Notice regularity in repeated calculations and monitor the process(continued).
Develop and apply formulas for the surface area of prisms and pyramids and the volume of prisms.
Develop and apply other formulas such as the distance formula and the interest formula.
Explain a proof of the Pythagorean Theorem and its converse.
Use the Pythagorean Theorem to find unknown side lengths and slant heights in right triangles, pyramids, and cones in real-world problems.
Understand that if two figures are related by a scale factor of k, then their areas are related by a scale factor of k2.