Embed Size (px)
Citation preview
PROFILE ON THE PRODUCTION OF CHILDREN’S
CLOTH

Table of ContentsI. SUMMARY...........................................................................................................................................................1
II. PRODUCT DESCRIPTION AND APPLICATION.............................................................................................3
III. MARKET STUDY AND PLANT CAPACITY................................................................................................3
IV. RAW MATERIALS AND INPUTS.................................................................................................................8
V. TECHNOLOGY AND ENGINEERING...............................................................................................................9
VI. HUMAN RESOURCE AND TRAINING REQUIREMENT.........................................................................15
VII. FINANCIAL ANALYSIS..............................................................................................................................17
FINANCIAL ANALYSES SUPPORTING TABLES.................................................................................................22
ii

iii

I. SUMMARY
This profile envisages the establishment of a plant for the production of children’s cloth with a
capacity of 280,000 pieces per annum. Children’s cloth is an article of outer clothing (same as
coat or dress) usually exclusive of accessories, and which gives warmth and protection for babies
and children.
The demand for children’s cloth is met both from local production and imports. The present
(2012) unsatisfied demand for children’s cloth is estimated at 499,883 kg. The unsatisfied
demand for children’s cloth is projected to reach 805,066 kg and 1,296,568 kg by the year 2017
and 2022, respectively.
The principal raw materials required are fabrics, buttons, zippers, elastic braid and sewing
threads which are available locally.
The total investment cost of the project including working capital is estimated at Birr 9.80
million. From the total investment cost the highest share (Birr 6.29 million or 64.34%) is
accounted by fixed investment cost followed by initial working capital (Birr 2.09 million or
21.40%) and pre operation cost (Birr 1.39 million or 14.26%). From the total investment cost
Birr 1.97 million or 20.18% is required in foreign currency.
The project is financially viable with an internal rate of return (IRR) of 33.55% and a net present
value (NPV) of Birr 15.18 million discounted at 10%.
The project can create employment for 39 persons. The establishment of such factory will have a
foreign exchange saving effect to the country by substituting the current imports. The project
will also create backward linkage with the textile sub sector and also generates income for the
Government in terms of tax revenue and payroll tax.
iv
II. PRODUCT DESCRIPTION AND APPLICATION
For a very long period of the human history, children wore what can be called smaller versions
of adult clothing with only minor differences that can save the kids from any hazard like strings
in place of any harmful closure. It was not before early 1800s that specific kids clothing started
to be manufactured.
Babies/children garment is an article of outer clothing (same as coat or dress) usually exclusive
of accessories, and which gives warmth and protection for babies and children. The clothing is
also provided with attractive and well fitting aesthetic look.
These products are produced from woven fabrics of cotton or cotton/polyester blead. They are
produced in different designs and fashions. They consist of jacket/coat and trouser for boys (and
girls) and skirts for girls. These garments are finding wide application in all parts of the country,
particularly in urban towns.
III. MARKET STUDY AND PLANT CAPACITY
A. MARKET STUDY
1. Past Supply and Present Demand
The demand for children's cloth in Ethiopia is met both from local production and imports.
However, local production of children's cloth is undertaken mainly by individual tailors
throughout the country. The existing garment factories that are concentrated in Addis Ababa and
its surroundings produce garments predominantly for civil adults, police and defense forces and
workers uniforms.
Current production of children's cloth, which is undertaken by individual tailors, is on piece by
piece basis in accordance with the desire of the clients. This method of production combined
v

with inefficient operation of individual tailors makes children's cloth more expensive than the
process based on industrial mass production.
Due to the shortage of children's cloth from domestic sources, the country has been importing a
substantial amount of children cloth. Table 3.1 presents imports of children garments during
2000-2011. The country imports a variety of ready-made children garments that are made of
various materials. The following selected products are considered for the purpose of this
project.
Children garments of wool,
Children garments of cotton,
Children garments of synthetic fibers and
Children garments of other textiles
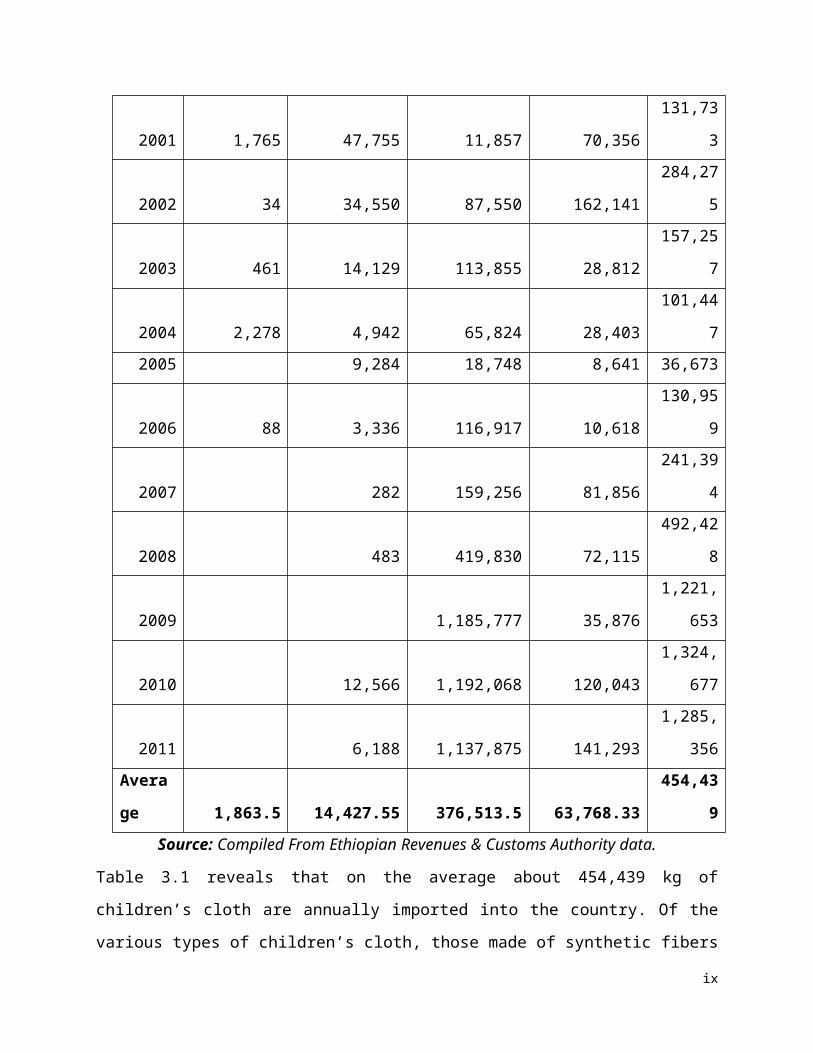
Table 3.1
IMPORTS OF CHILDREN’S GARMENTS OF WOOL, COTTON, SYNTHETIC FIBER
AND OTHER TEXTILES (IN KG)
Year
Children
garments of
wool
Children
garments of
cotton
Children
garments of
synthetic fibers
Children
garments of
other textiles Total
2000 6,555 25,188 8,605 5,066 45,414
2001 1,765 47,755 11,857 70,356 131,733
2002 34 34,550 87,550 162,141 284,275
2003 461 14,129 113,855 28,812 157,257
2004 2,278 4,942 65,824 28,403 101,447
2005 9,284 18,748 8,641 36,673
2006 88 3,336 116,917 10,618 130,959
2007 282 159,256 81,856 241,394
2008 483 419,830 72,115 492,428
2009 1,185,777 35,876 1,221,653
2010 12,566 1,192,068 120,043 1,324,677
2011 6,188 1,137,875 141,293 1,285,356
vi
Average 1,863.5 14,427.55 376,513.5 63,768.33 454,439
Source: Compiled From Ethiopian Revenues & Customs Authority data.
Table 3.1 reveals that on the average about 454,439 kg of children’s cloth are annually imported
into the country. Of the various types of children’s cloth, those made of synthetic fibers on the
average accounted for about 83% of total imports. Children cloth made of cotton and other
textiles accounts for about 3% and 14% of the total imports, respectively. The average share of
children garment made of wool from the total quantity imported during the period under
reference is negligible. The customs data also reveal that the country on the average exported
57,032 kg of children’s cloth during the same period.
As could be seen form Table 3.1, there is a substantial growth in the imports of children’s cloth.
Total imports of the product on the average grew at the rate of 69% annually during the reference
period. To determine the present unsatisfied demand for the product average import of the period
under consideration is first assumed to reflect the demand for the year 2011. Then, a modest
estimate of average annual growth rate of 10% is applied to arrive at the current (year 2012)
unsatisfied demand for the product. Thus, the current unsatisfied demand for the product is
estimated at 499,883 kg.
2. Projected Demand
Demand for children cloth is mainly influenced by the population of children as well as income
of households. Given the country’s rapid economic growth and the substantially high average
rate of growth of imports of children’s cloth (69%) observed during 2000-2011, a modest
estimate of 10% average annual growth rate is considered in projecting the demand for children
cloth. The projected future demand for the product is shown in Table 3.2.
vii

Table 3.2
PROJECTED DEMAND FOR CHILDREN'S CLOTH (KG)
Year Qty
2013 549,871
2014 604,858
2015 665,344
2016 731,879
2017 805,066
2018 885,573
2019 974,130
2020 1,071,543
2021 1,178,698
2022 1,296,568
3. Pricing and Distribution
The price of children's cloth depends on the type of the material used. Cotton fabrics and
synthetic fabrics are assumed to be the main materials to be used by the envisaged plant. Based
on the recent import data on imports of children’s cloth made of cotton and synthetic fabrics, a
factory gate price of Birr 54.70 per piece is recommended for projection of sales revenue.
The products will find their market outlet through existing wholesale and retail channel and by
opening a factory shop at strategic locations.
B. PLANT CAPACITY AND PRODUCTION PROGRAMME
1. Plant Capacity
Based on the market study and considering other technical factors the envisaged plant production
capacity is set at 280,000 pieces of assorted children’s cloth per annum. The type of children’s
viii
cloth and proposed composition is presented in Table 3.3. A total of 300 working days per
annum and a single shift of eight hours per day is the basis of capacity determination.
Table 3.3
PRODUCTION CAPACITY
Sr.
No.
Type of Cloth Quantity (pcs)
1 Trousers & shirts 140,000
2 Girl’s dress 140,000
Total 280,000
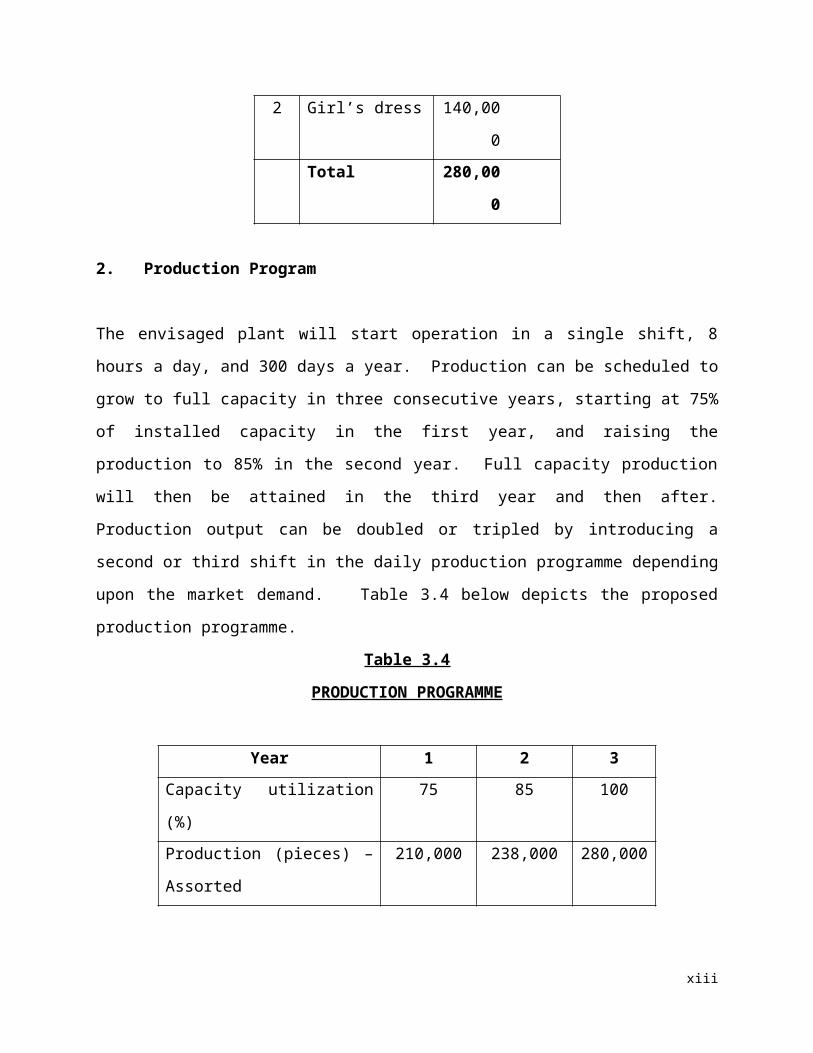
2. Production Program
The envisaged plant will start operation in a single shift, 8 hours a day, and 300 days a year.
Production can be scheduled to grow to full capacity in three consecutive years, starting at 75%
of installed capacity in the first year, and raising the production to 85% in the second year. Full
capacity production will then be attained in the third year and then after. Production output can
be doubled or tripled by introducing a second or third shift in the daily production programme
depending upon the market demand. Table 3.4 below depicts the proposed production
programme.
Table 3.4
PRODUCTION PROGRAMME
Year 1 2 3
Capacity utilization (%) 75 85 100
Production (pieces) – Assorted 210,000 238,000 280,000
ix
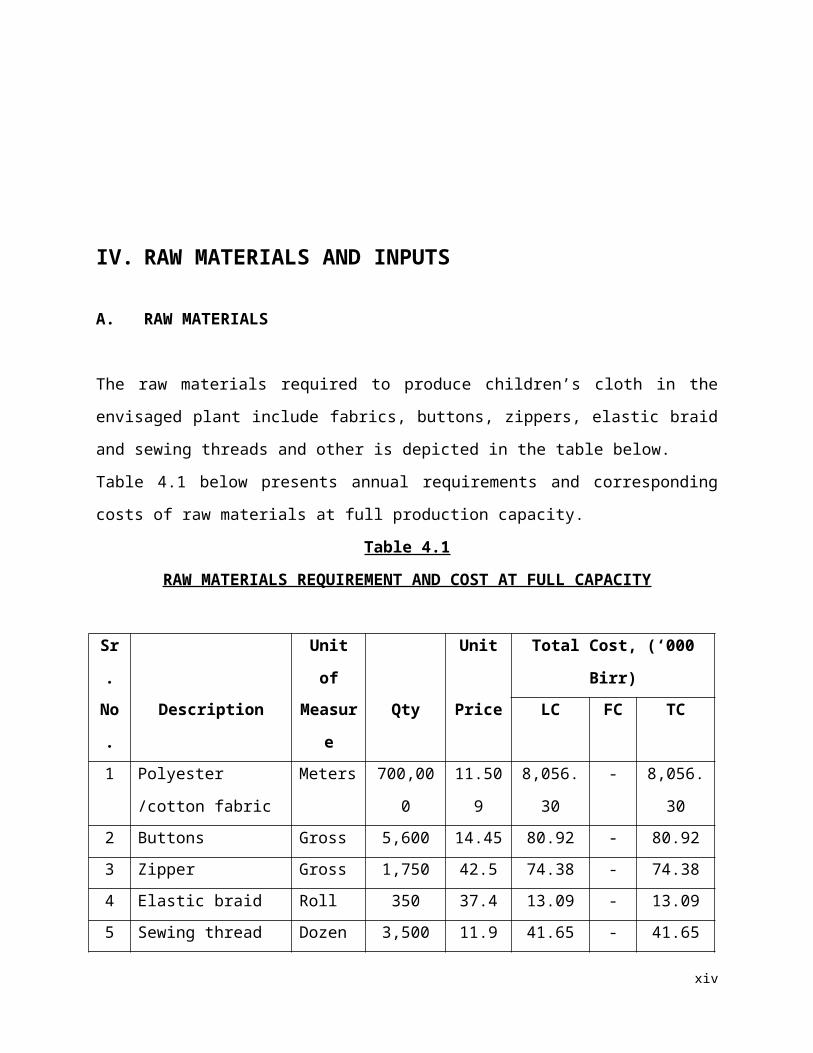
IV. RAW MATERIALS AND INPUTS
A. RAW MATERIALS
The raw materials required to produce children’s cloth in the envisaged plant include fabrics,
buttons, zippers, elastic braid and sewing threads and other is depicted in the table below.
Table 4.1 below presents annual requirements and corresponding costs of raw materials at full
production capacity.
Table 4.1
RAW MATERIALS REQUIREMENT AND COST AT FULL CAPACITY
Sr. Unit of Unit Total Cost, (‘000 Birr)
No. Description Measure Qty Price LC FC TC
1 Polyester /cotton
fabric
Meters 700,000 11.509 8,056.30 - 8,056.30
2 Buttons Gross 5,600 14.45 80.92 - 80.92
3 Zipper Gross 1,750 42.5 74.38 - 74.38
4 Elastic braid Roll 350 37.4 13.09 - 13.09
5 Sewing thread Dozen 3,500 11.9 41.65 - 41.65
6 Sewing thread (cones) Pcs 9,240 2.55 23.56 - 23.56
7 Packing material As req. - 30.00 - 30.00
Grand Total 8,319.90 8,319.90
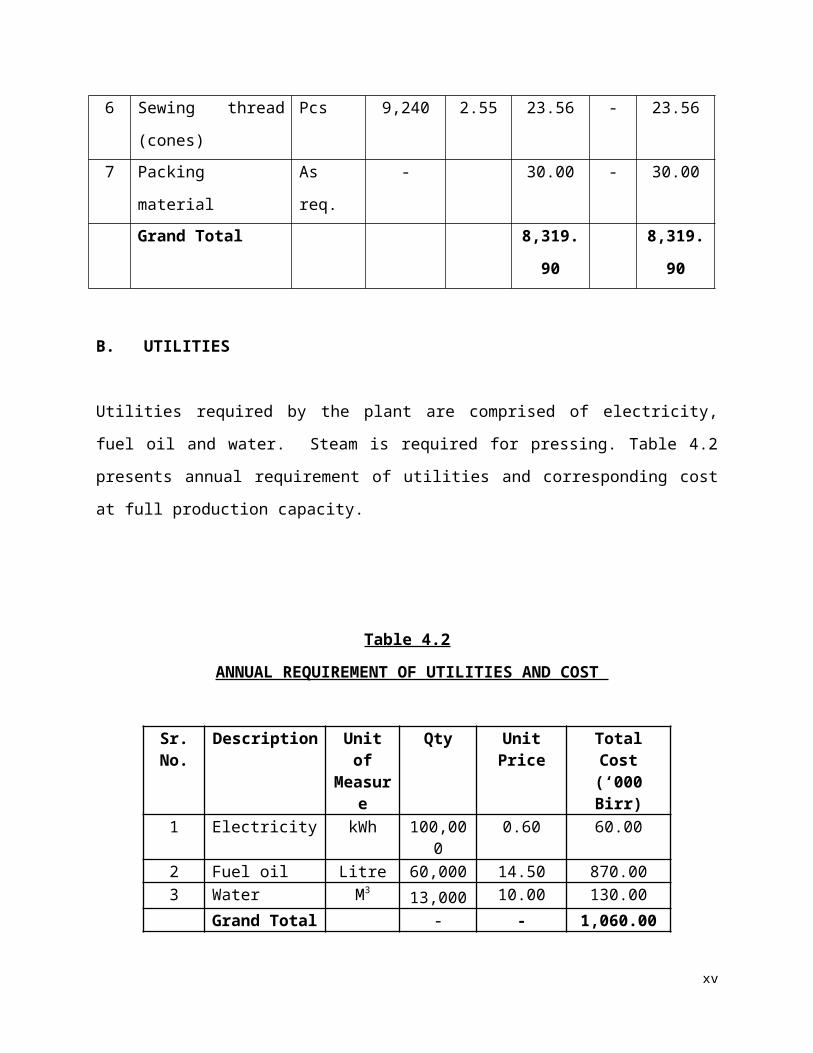
B. UTILITIES
Utilities required by the plant are comprised of electricity, fuel oil and water. Steam is required
for pressing. Table 4.2 presents annual requirement of utilities and corresponding cost at full
production capacity.
x

Table 4.2
ANNUAL REQUIREMENT OF UTILITIES AND COST
Sr. No.
Description Unit of Measure
Qty Unit Price Total Cost (‘000 Birr)
1 Electricity kWh 100,000 0.60 60.002 Fuel oil Litre 60,000 14.50 870.003 Water M3
13,000 10.00 130.00
Grand Total - - 1,060.00
V. TECHNOLOGY AND ENGINEERING
A. TECHNOLOGY
1. Process Description
Kids clothing are made in various steps of cutting, sewing, assembling, decorating, and finishing.
With the help of spreading machines, fabric is stacked on one another in reaches or lays that may
go over 30.5m long and hundreds of plies (fabric pieces) thick. Markers, made in accordance to
the patterns are attached to the fabric with the help of adhesive stripping or staples. Markers are
laid in such a way so that minimum possible fabric gets wasted during cutting operation. The
fabric is then cut with the help of cloth cutting machines suitable for the type of the cloth. These
can be band cutters having similar work method like that of band saws; cutters having rotary
blades; machines having reciprocal blades which saw up and down; die clickers similar to die or
punch press; or computerized machines that use either blades or laser beams to cut the fabric in
desired shapes.
There are what is called sewing stations for sewing different parts of the cut pieces. In this
workplace, there are many operators who perform a single operation. One operator may make
only straight seams, while another may make sleeve insets. Yet another two operators can sew
the waist seams, and make buttonholes. Various industrial sewing machines too have different
types of stitches that they can make. These machines also have different configuration of the
xi
frame. Some machines work sequentially and feed their finished step directly into the next
machine, while the gang machines have multiple machines performing the same operation
supervised by a single operator. All these factors decide what parts of a garment can be sewn at
that station.
Finally, the sewn parts of the garment, such as sleeves or pant legs, are assembled together to
give the final form to the kids clothing. The next operations are those of finishing and/or
decorating. Molding may be done to change the finished surface of the garment by applying
pressure, heat, moisture, or certain other combination. Pressing, pleating and creasing are the
basic molding processes. Creasing is mostly done before other finishing processes like that of
stitching a cuff. Creasing is also done before decorating the garment with something like a
pocket, appliqués, embroidered emblems etc. Then the finished garments are sorted based on size
and packed.
Although the completed pieces of garments are checked at the quality station, yet it is a
continuous process observed during all the manufacturing stages. Textile Machinery used for
making kids clothing are also inspected at regular intervals. Most of them have shutoffs built into
their structure and operation if they run out of threads or perform below the expected standards.
The major unit of operations involved in children garment making consist of the following.
Pattern design and patternmaking
Cloth cutting, grading process by mechanical cutting system and piece bundling;
Sewing by sewing machine;
Trimming and inspection;
Ironing and pressing for finishing process; and
Button-hole making, bottoming, fixing of zippers and elastic are done at all required
points.
2. Environmental Impact Assessment
The main operation of the envisaged plant involves cutting, stitching, and ironing and such
process does not have any direct negative impact in environment.
xii
B. ENGINEERING
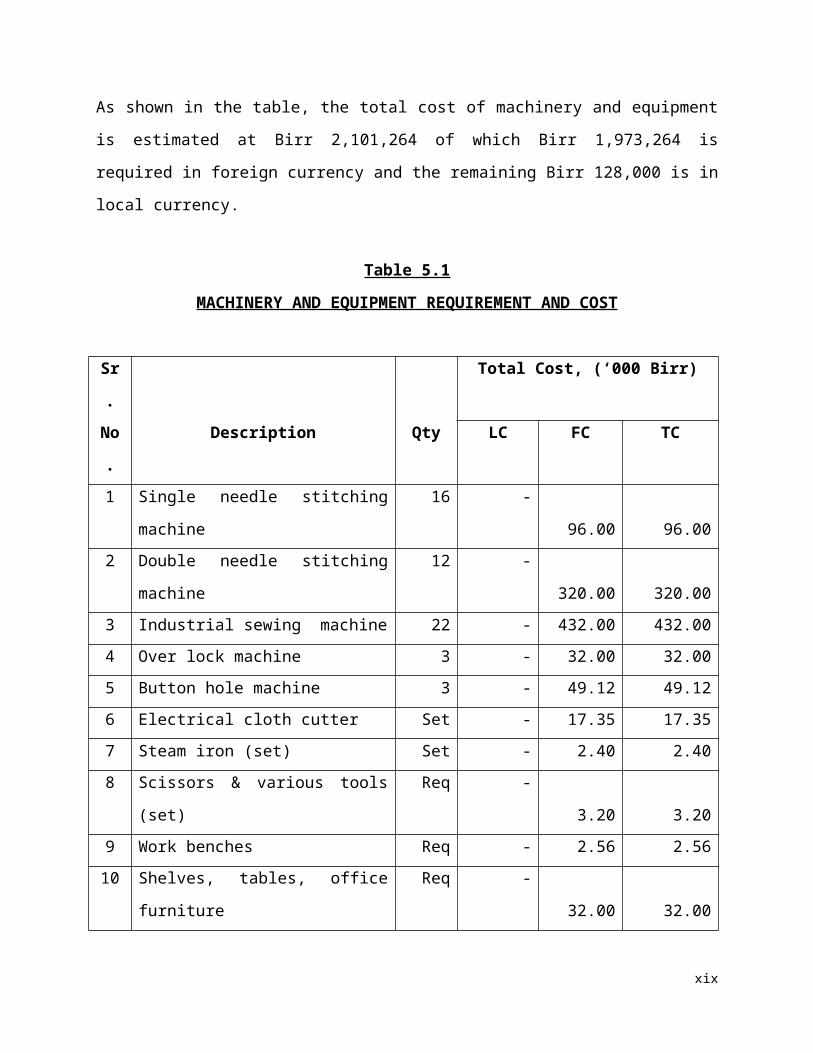
1. Machinery and Equipment Machinery and equipment required for the envisaged plant are conventional tailoring/sewing
machinery. The list of equipment, quantity and associated costs are given in Table 5.1.
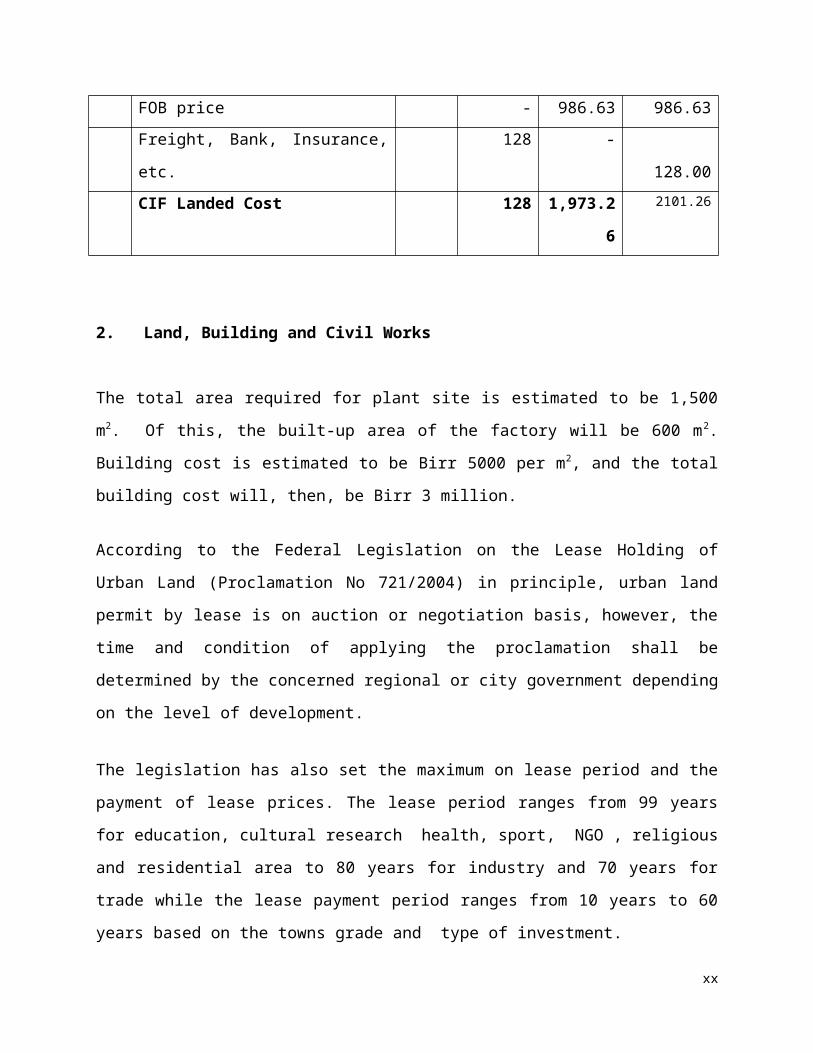
As shown in the table, the total cost of machinery and equipment is estimated at Birr 2,101,264
of which Birr 1,973,264 is required in foreign currency and the remaining Birr 128,000 is in
local currency.
Table 5.1
MACHINERY AND EQUIPMENT REQUIREMENT AND COST
Sr. Total Cost, (‘000 Birr)
No. Description Qty LC FC TC
1 Single needle stitching machine 16 - 96.00 96.00
2 Double needle stitching machine 12 - 320.00 320.00
3 Industrial sewing machine 22 - 432.00 432.00
4 Over lock machine 3 - 32.00 32.00
5 Button hole machine 3 - 49.12 49.12
6 Electrical cloth cutter Set - 17.35 17.35
7 Steam iron (set) Set - 2.40 2.40
8 Scissors & various tools (set) Req - 3.20 3.20
9 Work benches Req - 2.56 2.56
10 Shelves, tables, office furniture Req - 32.00 32.00
FOB price - 986.63 986.63
Freight, Bank, Insurance, etc. 128 - 128.00
CIF Landed Cost 128 1,973.26 2101.26
xiii
2. Land, Building and Civil Works
The total area required for plant site is estimated to be 1,500 m2. Of this, the built-up area of the
factory will be 600 m2. Building cost is estimated to be Birr 5000 per m2, and the total building
cost will, then, be Birr 3 million.
According to the Federal Legislation on the Lease Holding of Urban Land (Proclamation No
721/2004) in principle, urban land permit by lease is on auction or negotiation basis, however,
the time and condition of applying the proclamation shall be determined by the concerned
regional or city government depending on the level of development.
The legislation has also set the maximum on lease period and the payment of lease prices. The
lease period ranges from 99 years for education, cultural research health, sport, NGO , religious
and residential area to 80 years for industry and 70 years for trade while the lease payment
period ranges from 10 years to 60 years based on the towns grade and type of investment.
Moreover, advance payment of lease based on the type of investment ranges from 5% to
10%.The lease price is payable after the grace period annually. For those that pay the entire
amount of the lease will receive 0.5% discount from the total lease value and those that pay in
installments will be charged interest based on the prevailing interest rate of banks. Moreover,
based on the type of investment, two to seven years grace period shall also be provided.
However, the Federal Legislation on the Lease Holding of Urban Land apart from setting the
maximum has conferred on regional and city governments the power to issue regulations on the
exact terms based on the development level of each region.
In Addis Ababa, the City’s Land Administration and Development Authority is directly
responsible in dealing with matters concerning land. However, regarding the manufacturing
sector, industrial zone preparation is one of the strategic intervention measures adopted by the
City Administration for the promotion of the sector and all manufacturing projects are assumed
to be located in the developed industrial zones.
xiv
Regarding land allocation of industrial zones if the land requirement of the project is below
5,000 m2, the land lease request is evaluated and decided upon by the Industrial Zone
Development and Coordination Committee of the City’s Investment Authority. However, if the
land request is above 5,000 m2, the request is evaluated by the City’s Investment Authority and
passed with recommendation to the Land Development and Administration Authority for
decision, while the lease price is the same for both cases.
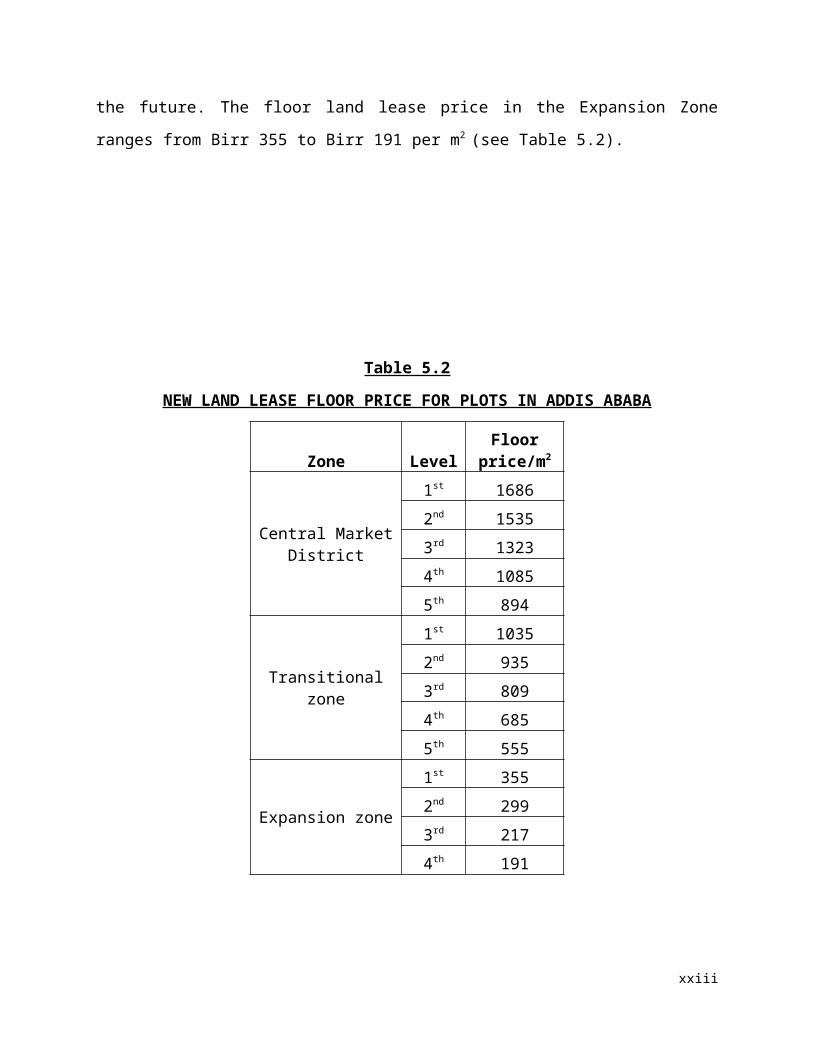
Moreover, the Addis Ababa City Administration has recently adopted a new land lease floor
price for plots in the city. The new prices will be used as a benchmark for plots that are going to
be auctioned by the city government or transferred under the new “Urban Lands Lease Holding
Proclamation.”
The new regulation classified the city into three zones. The first Zone is Central Market District
Zone, which is classified in five levels and the floor land lease price ranges from Birr 1,686 to
Birr 894 per m2. The rate for Central Market District Zone will be applicable in most areas of the
city that are considered to be main business areas that entertain high level of business activities.
The second zone, Transitional Zone, will also have five levels and the floor land lease price
ranges from Birr 1,035 to Birr 555 per m2 .This zone includes places that are surrounding the city
and are occupied by mainly residential units and industries.
The last and the third zone, Expansion Zone, is classified into four levels and covers areas that
are considered to be in the outskirts of the city, where the city is expected to expand in the future.
The floor land lease price in the Expansion Zone ranges from Birr 355 to Birr 191 per m2 (see
Table 5.2).
Table 5.2
NEW LAND LEASE FLOOR PRICE FOR PLOTS IN ADDIS ABABA
xv
Zone LevelFloor
price/m2
Central Market District
1st 1686
2nd 1535
3rd 1323
4th 1085
5th 894
Transitional zone
1st 1035
2nd 935
3rd 809
4th 685
5th 555
Expansion zone
1st 355
2nd 299
3rd 217
4th 191
Accordingly, in order to estimate the land lease cost of the project profiles it is assumed that all
new manufacturing projects will be located in industrial zones located in expansion zones.
Therefore, for the profile a land lease rate of Birr 266 per m2 which is equivalent to the average
floor price of plots located in expansion zone is adopted.
On the other hand, some of the investment incentives arranged by the Addis Ababa City
Administration on lease payment for industrial projects are granting longer grace period and
extending the lease payment period. The criterions are creation of job opportunity, foreign
exchange saving, investment capital and land utilization tendency etc. Accordingly, Table 5.3
shows incentives for lease payment.
Table 5.3
INCENTIVES FOR LEASE PAYMENT OF INDUSTRIAL PROJECTS
xvi

Scored point
Grace
period
Payment
Completion
Period
Down
Paymen
t
Above 75% 5 Years 30 Years 10%
From 50 - 75% 5 Years 28 Years 10%
From 25 - 49% 4 Years 25 Years 10%
For the purpose of this project profile the average i.e. five years grace period, 28 years payment
completion period and 10% down payment is used. The land lease period for industry is 60
years.
Accordingly, the total land lease cost at a rate of Birr 266 per m2 is estimated at Birr 399,000 of
which 10% or Birr 39,900 will be paid in advance. The remaining Birr 359,100 will be paid in
equal installments with in 28 years i.e. Birr 12,825 annually.
NB: The land issue in the above statement narrates or shows only Addis Ababa’s city
administration land lease price, policy and regulations.
Accordingly the project profile prepared based on the land lease price of Addis Ababa region.
To know land lease price, police and regulation of other regional state of the country updated
information is available at Ethiopian Investment Agency’s website www.eia.gov.et on the factor
cost.
VI. HUMAN RESOURCE AND TRAINING REQUIREMENT
A. HUMAN RESOURCE REQUIREMENT
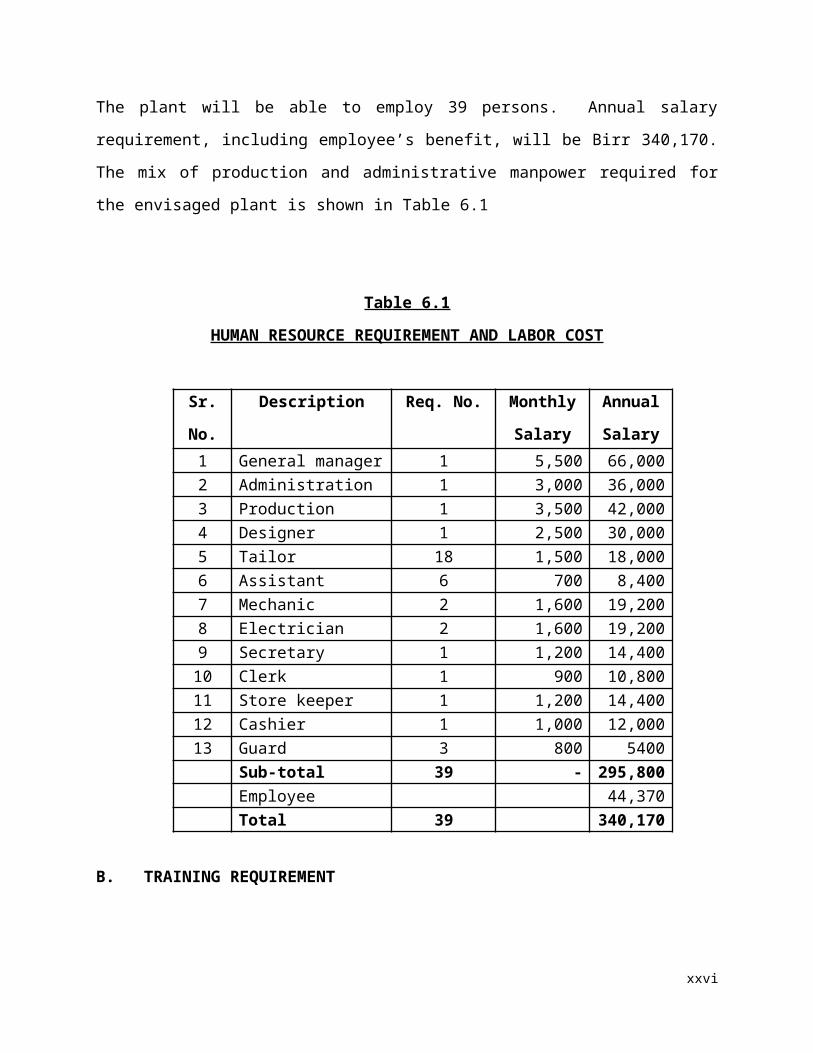
The plant will be able to employ 39 persons. Annual salary requirement, including employee’s
benefit, will be Birr 340,170. The mix of production and administrative manpower required for
the envisaged plant is shown in Table 6.1
Table 6.1
xvii

HUMAN RESOURCE REQUIREMENT AND LABOR COST
Sr.
No.
Description Req. No. Monthly
Salary
(Birr)
Annual
Salary
(Birr)1 General manager 1 5,500 66,0002 Administration 1 3,000 36,0003 Production supervisor 1 3,500 42,0004 Designer 1 2,500 30,0005 Tailor 18 1,500 18,0006 Assistant tailor 6 700 8,4007 Mechanic 2 1,600 19,2008 Electrician 2 1,600 19,2009 Secretary 1 1,200 14,40010 Clerk 1 900 10,80011 Store keeper 1 1,200 14,40012 Cashier 1 1,000 12,00013 Guard 3 800 5400 Sub-total 39 - 295,800 Employee benefit
(15% of basic salary)
44,370 Total 39 340,170
B. TRAINING REQUIREMENT
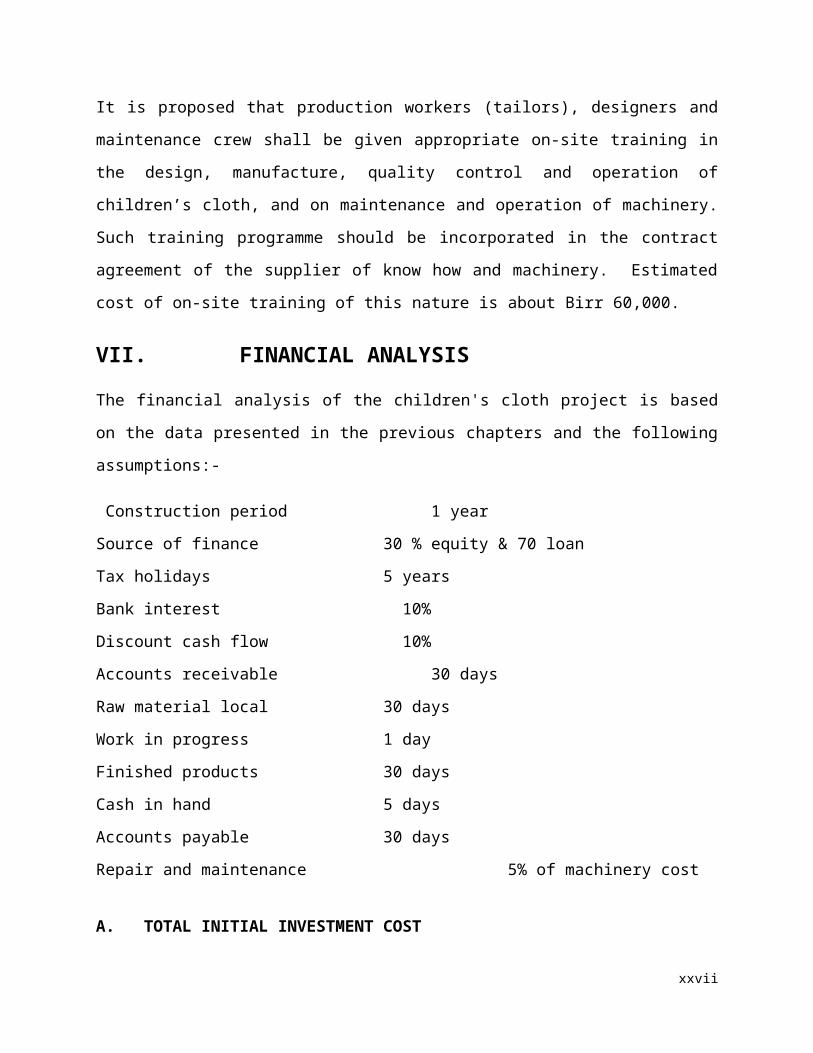
It is proposed that production workers (tailors), designers and maintenance crew shall be given
appropriate on-site training in the design, manufacture, quality control and operation of
children’s cloth, and on maintenance and operation of machinery. Such training programme
should be incorporated in the contract agreement of the supplier of know how and machinery.
Estimated cost of on-site training of this nature is about Birr 60,000.
VII. FINANCIAL ANALYSIS
The financial analysis of the children's cloth project is based on the data presented in the
previous chapters and the following assumptions:-
xviii
Construction period 1 year
Source of finance 30 % equity & 70 loan
Tax holidays 5 years
Bank interest 10%
Discount cash flow 10%
Accounts receivable 30 days
Raw material local 30 days
Work in progress 1 day
Finished products 30 days
Cash in hand 5 days
Accounts payable 30 days
Repair and maintenance 5% of machinery cost
A. TOTAL INITIAL INVESTMENT COST
The total investment cost of the project including working capital is estimated at Birr 9.80
million (See Table 7.1). From the total investment cost the highest share (Birr 6.29 million or
64.34%) is accounted by fixed investment cost followed by initial working capital (Birr 2.09
million or 21.40%) and pre operation cost (Birr 1.39 million or 14.26%). From the total
investment cost Birr 1.97 million or 20.18% is required in foreign currency.
Table 7.1
INITIAL INVESTMENT COST ( ‘000 Birr)
Sr.No Cost Items
Local Cost
Foreign Cost
Total Cost
% Share
1 Fixed investment 1.1 Land Lease 39.90 39.90 0.41
xix
1.2 Building and civil work 3,000.00 3,000.00 30.681.3 Machinery and equipment 128.00 1,973.26 2,101.26 21.491.4 Vehicles 900.00 900.00 9.201.5 Office furniture and equipment 250.00 250.00 2.56 Sub total 4,317.90 1,973.26 6,291.16 64.342 Pre operating cost *
2.1 Pre operating cost 755.06 755.06 7.722.2 Interest during construction 639.69 639.69 6.54 Sub total 1,394.75 1,394.75 14.263 Working capital ** 2,092.21 2,092.21 21.40 Grand Total 7,804.86 1,973.26 9,778.12 100
* N.B Pre operating cost include project implementation cost such as installation, startup, commissioning, project engineering, project management etc and capitalized interest during construction.
** The total working capital required at full capacity operation is Birr 3.03 million. However, only the initial working capital of Birr 2.09 million during the first year of production is assumed to be funded through external sources. During the remaining years the working capital requirement will be financed by funds to be generated internally (for detail working capital requirement see Appendix 7.A.1).
B. PRODUCTION COST
The annual production cost at full operation capacity is estimated at Birr 12.30 million (see Table
7.2). The cost of raw material account for 67.65% of the production cost. The other major
components of the production cost are financial cost, depreciation, utility, and cost of marketing
and distribution which account for 4.29%, 7.29%, 8.62% and 5.69% respectively. The remaining
6.46% is the share of direct labour ,repair and maintenance, labour overhead and administration
cost. For detail production cost see Appendix 7.A.2.
Table 7.2
ANNUAL PRODUCTION COST AT FULL CAPACITY (year three)
Items Cost
( 000 Birr) %
Raw Material and Inputs 8,320 67.65
xx
Utilities 1,060 8.62Maintenance and repair 105 0.85Labor direct 296 2.41Labor overheads 44 0.36Administration Costs 350 2.85Land lease cost 0 0.00Cost of marketing and distribution 700 5.69Total Operating Costs 10,875 88.42Depreciation 896 7.29Cost of Finance 528 4.29Total Production Cost 12,299 100.00
C. FINANCIAL EVALUATION
1. Profitability
Based on the projected profit and loss statement, the project will generate a profit throughout its
operation life. Annual net profit after tax will grow from Birr 2.11 million to Birr 3.00 million
during the life of the project. Moreover, at the end of the project life the accumulated net cash
flow amounts to Birr 30.68 million. For profit and loss statement and cash flow projection see
Appendix 7.A.3 and 7.A.4, respectively.
2. Ratios
In financial analysis financial ratios and efficiency ratios are used as an index or yardstick for
evaluating the financial position of a firm. It is also an indicator for the strength and weakness of
the firm or a project. Using the year-end balance sheet figures and other relevant data, the most
important ratios such as return on sales which is computed by dividing net income by revenue,
return on assets (operating income divided by assets), return on equity (net profit divided by
equity) and return on total investment (net profit plus interest divided by total investment) has
been carried out over the period of the project life and all the results are found to be satisfactory.
3. Break-even Analysis
xxi
The break-even analysis establishes a relationship between operation costs and revenues. It
indicates the level at which costs and revenue are in equilibrium. To this end, the break-even
point for capacity utilization and sales value estimated by using income statement projection are
computed as followed.
Break Even Sales Value = Fixed Cost + Financial Cost = Birr 6,433,000
Variable Margin ratio (%)
Break Even Capacity utilization = Break even Sales Value X 100 = 26 %
Sales revenue
4. Pay-back Period
The pay-back period, also called pay – off period is defined as the period required for recovering
the original investment outlay through the accumulated net cash flows earned by the project.
Accordingly, based on the projected cash flow it is estimated that the project’s initial investment
will be fully recovered within 2 years.
xxii
5. Internal Rate of Return
The internal rate of return (IRR) is the annualized effective compounded return rate that can be
earned on the invested capital, i.e., the yield on the investment. Put another way, the internal rate
of return for an investment is the discount rate that makes the net present value of the
investment's income stream total to zero. It is an indicator of the efficiency or quality of an
investment. A project is a good investment proposition if its IRR is greater than the rate of return
that could be earned by alternate investments or putting the money in a bank account.
Accordingly, the IRR of this project is computed to be 33.55% indicating the viability of the
project.
6. Net Present Value
Net present value (NPV) is defined as the total present (discounted) value of a time series of cash
flows. NPV aggregates cash flows that occur during different periods of time during the life of a
project in to a common measuring unit i.e. present value. It is a standard method for using the
time value of money to appraise long-term projects. NPV is an indicator of how much value an
investment or project adds to the capital invested. In principal a project is accepted if the NPV is
non-negative.
Accordingly, the net present value of the project at 10% discount rate is found to be Birr 15.18
million which is acceptable. For detail discounted cash flow see Appendix 7.A.5.
D. ECONOMIC AND SOCIAL BENEFITS
The project can create employment for 39 persons. The project will generate Birr 7.99 million in
terms of tax revenue. The establishment of such factory will have a foreign exchange saving
effect to the country by substituting the current imports. The project will also create backward
linkage with the textile sub sector and also generates income for the Government in terms of
payroll tax.
xxiii

Appendix 7.A
FINANCIAL ANALYSES SUPPORTING TABLES
xxiv

Appendix 7.A.1NET WORKING CAPITAL ( in 000 Birr)
Items Year 2 Year 3 Year 4 Year 5 Year 6 Year 7 Year 8 Year 9 Year 10 Year 11
Total inventory1,456.0
01,664.0
01,872.0
02,080.0
02,080.0
02,080.0
02,080.0
02,080.0
02,080.0
02,080.0
0
Accounts receivable 651.88 736.67 821.46 906.25 907.32 907.32 907.32 907.32 907.32 907.32
Cash-in-hand 7.73 8.83 9.94 11.04 11.22 11.22 11.22 11.22 11.22 11.22
CURRENT ASSETS2,115.6
02,409.5
02,703.4
02,997.2
92,998.5
42,998.5
42,998.5
42,998.5
42,998.5
42,998.5
4
Accounts payable 23.39 26.73 30.08 33.42 33.42 33.42 33.42 33.42 33.42 33.42
CURRENT LIABILITIES 23.39 26.73 30.08 33.42 33.42 33.42 33.42 33.42 33.42 33.42
TOTAL WORKING CAPITAL
2,092.21
2,382.77
2,673.32
2,963.88
2,965.12
2,965.12
2,965.12
2,965.12
2,965.12
2,965.12
23
Appendix 7.A.2PRODUCTION COST ( in 000 Birr)
Item Year 2 Year 3 Year 4 Year 5 Year 6 Year 7 Year 8 Year 9 Year 10 Year 11
Raw Material and Inputs 5,824 6,656 7,488 8,320 8,320 8,320 8,320 8,320 8,320 8,320
Utilities 742 848 954 1,060 1,060 1,060 1,060 1,060 1,060 1,060
Maintenance and repair 74 84 95 105 105 105 105 105 105 105
Labour direct 207 237 266 296 296 296 296 296 296 296
Labour overheads 31 35 40 44 44 44 44 44 44 44
Administration Costs 245 280 315 350 350 350 350 350 350 350
Land lease cost 0 0 0 0 13 13 13 13 13 13Cost of marketing and distribution 700 700 700 700 700 700 700 700 700 700
Total Operating Costs 7,823 8,840 9,858 10,875 10,888 10,888 10,888 10,888 10,888 10,888
Depreciation 896 896 896 896 896 145 145 145 145 145
Cost of Finance 0 704 616 528 440 352 264 176 88 0
Total Production Cost 8,719 10,440 11,369 12,299 12,224 11,385 11,297 11,209 11,121 11,033
24
Appendix 7.A.3INCOME STATEMENT ( in 000 Birr)
ItemYear 2
Year 3
Year 4
Year 5
Year 6
Year 7
Year 8
Year 9
Year 10
Year 11
Sales revenue10,72
113,78
415,31
615,31
615,31
615,31
615,31
615,31
6 15,316 15,316
Less variable costs 7,123 8,140 9,15810,17
510,17
510,17
510,17
510,17
5 10,175 10,175
VARIABLE MARGIN 3,599 5,644 6,159 5,141 5,141 5,141 5,141 5,141 5,141 5,141
in % of sales revenue 33.56 40.95 40.21 33.57 33.57 33.57 33.57 33.57 33.57 33.57
Less fixed costs 1,596 1,596 1,596 1,596 1,609 858 858 858 858 858
OPERATIONAL MARGIN 2,002 4,048 4,562 3,545 3,532 4,283 4,283 4,283 4,283 4,283
in % of sales revenue 18.68 29.37 29.79 23.14 23.06 27.97 27.97 27.97 27.97 27.97
Financial costs 704 616 528 440 352 264 176 88 0
GROSS PROFIT 2,002 3,344 3,947 3,017 3,092 3,931 4,019 4,107 4,195 4,283
in % of sales revenue 18.68 24.26 25.77 19.70 20.19 25.67 26.24 26.82 27.39 27.97
Income (corporate) tax 0 0 0 905 928 1,179 1,206 1,232 1,259 1,285
NET PROFIT 2,002 3,344 3,947 2,112 2,164 2,752 2,814 2,875 2,937 2,998
in % of sales revenue 18.68 24.26 25.77 13.79 14.13 17.97 18.37 18.77 19.17 19.58
25

Appendix 7.A.4CASH FLOW FOR FINANCIAL MANAGEMENT ( in 000 Birr)
Item Year 1 Year 2 Year 3 Year 4 Year 5 Year 6 Year 7 Year 8 Year 9 Year 10 Year 11 Scrap
TOTAL CASH INFLOW 7,046 13,476 13,787 15,319 15,316 15,316 15,316 15,316 15,316 15,316 15,316 5,445
Inflow funds 7,046 2,755 3 3 0 0 0 0 0 0 0 0
Inflow operation 0 10,721 13,784 15,316 15,316 15,316 15,316 15,316 15,316 15,316 15,316 0
Other income 0 0 0 0 0 0 0 0 0 0 0 5,445TOTAL CASH OUTFLOW 7,046 10,578 10,717 11,647 13,481 13,136 13,299 13,237 13,175 13,114 12,173 0Increase in fixed assets 7,046 0 0 0 0 0 0 0 0 0 0 0
Increase in current assets 0 2,116 294 294 294 1 0 0 0 0 0 0
Operating costs 0 7,123 8,140 9,158 10,175 10,188 10,188 10,188 10,188 10,188 10,188 0Marketing and Distribution cost 0 700 700 700 700 700 700 700 700 700 700 0
Income tax 0 0 0 0 905 928 1,179 1,206 1,232 1,259 1,285 0Financial costs 0 640 704 616 528 440 352 264 176 88 0 0Loan repayment 0 0 880 880 880 880 880 880 880 880 0 0
SURPLUS (DEFICIT) 0 2,899 3,070 3,673 1,835 2,180 2,017 2,079 2,141 2,202 3,143 5,445
CUMULATIVE CASH BALANCE 0 2,899 5,969 9,641 11,476 13,656 15,673 17,752 19,893 22,095 25,238 30,683
26

Appendix 7.A.5DISCOUNTED CASH FLOW ( in 000 Birr)
Item Year 1Year
2 Year 3Year
4 Year 5Year
6 Year 7Year
8 Year 9Year
10 Year 11Scra
p
TOTAL CASH INFLOW 0 10,721 13,784 15,316 15,316 15,316 15,316 15,316 15,316 15,316 15,316 5,445
Inflow operation 0 10,721 13,784 15,316 15,316 15,316 15,316 15,316 15,316 15,316 15,316 0
Other income 0 0 0 0 0 0 0 0 0 0 0 5,445
TOTAL CASH OUTFLOW 9,138 8,113 9,131 10,148 11,781 11,815 12,067 12,094 12,120 12,146 12,173 0
Increase in fixed assets 7,046 0 0 0 0 0 0 0 0 0 0 0
Increase in net working capital 2,092 291 291 291 1 0 0 0 0 0 0 0
Operating costs 0 7,123 8,140 9,158 10,175 10,188 10,188 10,188 10,188 10,188 10,188 0
Marketing and Distribution cost 0 700 700 700 700 700 700 700 700 700 700 0
Income (corporate) tax 0 0 0 905 928 1,179 1,206 1,232 1,259 1,285 0
NET CASH FLOW -9,138 2,608 4,653 5,168 3,535 3,501 3,249 3,222 3,196 3,170 3,143 5,445
CUMULATIVE NET CASH FLOW -9,138 -6,530 -1,877 3,291 6,826 10,326 13,575 16,797 19,993 23,163 26,30631,75
1
Net present value -9,138 2,371 3,846 3,883 2,414 2,174 1,834 1,654 1,491 1,344 1,212 2,099
Cumulative net present value -9,138 -6,768 -2,922 961 3,375 5,549 7,383 9,036 10,527 11,871 13,08315,18
2
NET PRESENT VALUE 15,182INTERNAL RATE OF RETURN 33.55%NORMAL PAYBACK 2 years
27
130- 27