Embed Size (px)
Citation preview

Scientific Method at Work
Science is like a puzzle. There is always a problem to solve. Usually the problem is broken down into
pieces, much like a puzzle, to help understand and solve the problem.
Our problem today involves chocolate!

M & M (CANDY!) Lab• We are using this lab report. After it is graded,
you can use this as a model for all other labs.

Rubric (How this will be graded)

Title
• What the experiment is:
We will open a bag of M & M’s to determine how many of each color are in an average bag.
What might be an appropriate title?
Write it down now.

An investigation on the amount of m & m’s candy in a standard snack sized bag

Question
• What is our question for this experiment?

An investigation on the amount of m & m’s candy in a standard snack sized bag
What is the proportion of each color m&m’s are in a bag?

Remember that a Hypothesis is:
A possible explanation for an observation that can be testedby scientific investigation. It refers back to the question or problem.
It must be stated in a way that is testable. A statement is considered “testable”if evidence can be collected that either does or does not support it.

Writing a Hypothesis “format”
A common format for hypotheses:
"If _____[I do this] _____, then _____[this]_____ will happen.“
To make this more complex add variables or parts of the experiment that you can change.
What can we do with this bag of m & m’s?

Hypothesis
What would be a testable hypothesis?
Keep in mind, the more specific the better!
Work with your group to determine a hypothesis. Once you decide, everyone write it down on their lab page.

Next Step…For this lab, these steps are short and sweet.
This is not always the case! Fill these in now:
Colors in a bag of m&m’s
Numbers of each color in a bag of m&m’s
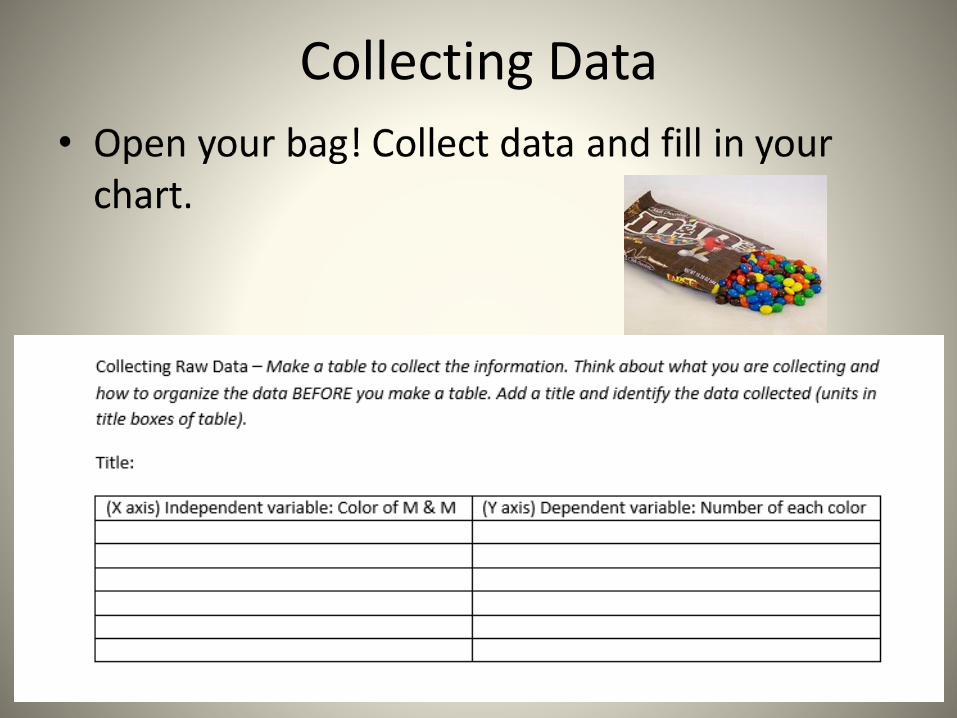
Collecting Data

Reporting Data
• Now your chart is filled in, you need to make some sort of sense with it. In other words, you need to communicate your findings.
• You need to process the data and then graph it.
• Bar Graph- Data displayed using vertical bars, labels, title, and equal number intervals

Data Processing
• Work with your group to calculate the numbers
• You may use calculators, but do write one example problem on the lab page.

Making a Bar Graph example:
• In your group, make your bar graph using the data in the table –use this example as a guide

Graphing Rules Handout
• Use this to help you make a graph!

Identifying Patterns
• What does the collected data tell you?
• Can you identify what happened to the variables?

What’s next?• We have done
almost all of the steps of the scientific method – one of the most important parts is last – the conclusion!
• Make sure you have a copy of this:

For the first time -
• There is a lot of information on this page – for this lab, let’s start simple and cover just a few key points.
• Put both the graphing page and the conclusion handout in your binder section marked “Labs”
• Read your Lab pages to find out what to write for this first conclusion.

Remember!
• Homework for tonight:
Finish the lab write up – anything you did not finish in class and the conclusion.
*refer to the instructions on these pages and the rubric to help you!