Embed Size (px)
Citation preview

SCIENTIFIC CRITERIA DOCUMENT FOR CANADIAN SOIL QUALITY GUIDELINES FOR THE PROTECTION
OF ENVIRONMENTAL AND HUMAN HEALTH:
NICKEL
PN 1540 ISBN 978-1-77202-019-9 PDF
© Canadian Council of Ministers of the Environment, 2015

i
TABLE OF CONTENTS
ABSTRACT ..................................................................................................................... 6 RÉSUMÉ .......................................................................................................................... 8
1 INTRODUCTION .................................................................................................. 1
2 BACKGROUND INFORMATION .......................................................................... 3 2.1 Physical and Chemical Properties ............................................................. 3 2.2 Geochemical Occurrence .......................................................................... 3 2.3 Analytical Methods ..................................................................................... 5 2.4 Production and Uses in Canada ................................................................ 6 2.5 Sources and Concentrations in the Canadian Environment ....................... 6
2.5.1 Ambient Air ..................................................................................... 8 2.5.2 Indoor Air ........................................................................................ 9 2.5.3 Indoor Dust ................................................................................... 10 2.5.4 Soil ............................................................................................... 10 2.5.5 Surface Water .............................................................................. 11 2.5.6 Groundwater................................................................................. 12 2.5.7 Drinking Water .............................................................................. 12 2.5.8 Sediment ...................................................................................... 13 2.5.9 Biota ............................................................................................. 13 2.5.10 Commercial Foods ..................................................................... 15 2.5.11 Infant Formula and Human Breast Milk ...................................... 16 2.5.12 Consumer Products .................................................................... 17
2.6 Existing Criteria and Guidelines ............................................................... 18
3 ENVIRONMENTAL FATE AND BEHAVIOUR .................................................... 20 3.1 Atmosphere ............................................................................................. 20 3.2 Water ....................................................................................................... 21 3.3 Sediment .................................................................................................. 22 3.4 Indoor Dust .............................................................................................. 22 3.5 Soil ........................................................................................................... 22
4 Essentiality ......................................................................................................... 24 4.1 Microorganisms ....................................................................................... 24 4.2 Terrestrial Plants ...................................................................................... 24 4.3 Terrestrial Invertebrates ........................................................................... 24 4.4 Mammals and Birds ................................................................................. 24 4.5 Humans ................................................................................................... 25
5 BEHAVIOUR AND EFFECTS IN BIOTA ............................................................ 26 5.1 Soil microbial processes .......................................................................... 26 5.2 Terrestrial Plants ...................................................................................... 28
5.2.1 Metabolic fate and behaviour ....................................................... 28

ii
5.2.2 Toxicity ......................................................................................... 29 5.3 Terrestrial Invertebrates ........................................................................... 30
5.3.1 Metabolic fate and behaviour ....................................................... 30 5.3.2 Toxicity ......................................................................................... 31
5.4 Non-mammalian Vertebrates, Birds and Other Wildlife............................ 31 5.4.1 Toxicokinetics ............................................................................... 31 5.4.2 Toxicity ......................................................................................... 32
6 BEHAVIOUR AND EFFECTS IN HUMANS AND EXPERIMENTAL ANIMALS .. 34 6.1 Overview .................................................................................................. 34 6.2 Classification ............................................................................................ 34 6.3 Bioaccessibility of nickel .......................................................................... 34 6.4 Toxicokinetics .......................................................................................... 36
6.4.1 Cellular uptake at primary sites of absorption .............................. 36 6.4.2 Absorption and bioavailability of nickel ......................................... 37 6.4.3 Distribution ................................................................................... 41 6.4.4 Metabolism ................................................................................... 42 6.4.5 Elimination .................................................................................... 42
6.5 Acute Toxicity .......................................................................................... 44 6.6 Subchronic and Chronic Systemic Toxicity .............................................. 44
6.6.1 Oral Exposure .............................................................................. 44 6.6.2 Inhalation Exposure ...................................................................... 45 6.6.3 Reproductive Effects and Teratogenicity ...................................... 46
6.7 Nickel allergy ........................................................................................... 47 6.7.1 Allergic contact dermatitis ............................................................ 47 6.7.2 Systemic contact dermatitis .......................................................... 49 6.7.3 Rhinitis/Asthma ............................................................................ 50
6.8 Genotoxicity, carcinogenicity and carcinogenic mode of action ............... 50 6.8.1 Genotoxicity.................................................................................. 50 6.8.2 Carcinogenicity ............................................................................. 52 6.8.3 Carcinogenic mode of action ........................................................ 54 6.8.4 Classification ................................................................................ 56
6.9 Toxicological Reference Values ............................................................... 56 6.9.1 Oral Exposure .............................................................................. 57 6.9.2 Inhalation Exposure – Non-Cancer Effects .................................. 57 6.9.3 Inhalation - Carcinogenic Effects .................................................. 59
7 DERIVATION OF ENVIRONMENTAL SOIL QUALITY GUIDELINES ................ 61 7.1 Agricultural and Residential/Parkland Land Uses .................................... 61
7.1.1 Soil Quality Guidelines for Soil Contact ........................................ 61 7.1.2 Soil Quality Guidelines for the Protection of Nutrient and Energy Cycling ..................................................................................................... 63 7.1.3 Soil Quality Guidelines for Soil and Food Ingestion ...................... 64
7.2 Commercial and Industrial Land Uses ..................................................... 67 7.2.1 Soil Quality Guidelines for Soil Contact ........................................ 67

iii
7.2.2 Soil Quality Guidelines for the Protection of Nutrient and Energy Cycling ..................................................................................................... 67 7.2.3 Environmental Soil Quality Guidelines for Off-site Migration ........ 68
7.3 Final Environmental Soil Quality Guidelines ............................................ 68
8 DERIVATION OF HUMAN HEALTH SOIL QUALITY GUIDELINES .................. 70 8.1 Protocol .................................................................................................... 70 8.2 Estimated Daily Intake ............................................................................. 71 8.3 Nickel Speciation in the Environment ...................................................... 72 8.4 Relative Absorption Factors ..................................................................... 73 8.5 Ingestion and Dermal Pathways .............................................................. 74
8.5.1 Agricultural and Residential/Parkland Land Uses......................... 74 8.5.2 Commercial Land Use .................................................................. 75 8.5.3 Industrial Land Use ...................................................................... 77
8.6 Inhalation Pathway (All land uses) ........................................................... 77 8.7 Protection of Groundwater Used as a Source of Raw Water for Drinking 79 8.8 Guideline for Off-site Migration for Commercial and Industrial Land Uses79 8.9 Final Human Health Soil Quality Guidelines ............................................ 80
9 RECOMMENDED CANADIAN SOIL QUALITY GUIDELINES ........................... 82 LIST OF FIGURES Figure 1: Rank probability plot of nickel bioassay data for plants and invertebrates…..65
LIST OF TABLES Table 1. Physical and chemical properties of some nickel compounds ........................... 4 Table 2. Existing environmental criteria and guidelines for nickel in various jurisdictions18 Table 3. Summary of human health soil quality guidelines for the inhalation of fugitive
dust (mg/kg). ........................................................................................................... 79 Table 4. Exposure Pathways for the Development of the Human Health Soil Quality
Guidelines ............................................................................................................... 80 Table 5. Canadian soil quality guidelines for nickel (mg/kg) .......................................... 83
LIST OF APPENDICES Appendix 1. Summary tables of nickel concentrations in environmental media .......... 120 Appendix 2. Toxicity of nickel to soil microbial processes. .......................................... 142 Appendix 3. Toxicity of nickel to terrestrial plants. ....................................................... 149 Appendix 4. Toxicity of nickel to terrestrial invertebrates. ............................................ 156 Appendix 5. Toxicity of nickel to mammals .................................................................. 159 Appendix 6. Toxicity of nickel to birds. ........................................................................ 161 Appendix 7. Terrestrial bioconcentration factors. ........................................................ 163 Appendix 8. Receptor Characteristics of the Canadian General Population ............... 165

iv
Appendix 9. Typical Intake Values for Environmental Media by the Canadian General Population ......................................................................................................... 166
Appendix 10. Estimated Total Daily Nickel Intake for the Canadian General Population167 Appendix 11. Alternative approach for calculating human health soil quality guidelines
for Ni when EDI > TDI. ...................................................................................... 168

v
ABSTRACT Canadian environmental quality guidelines are numerical concentrations or narrative statements recommended to provide a healthy, functioning ecosystem capable of sustaining the existing and likely future uses of the site by ecological receptors and humans. Canadian soil quality guidelines can be used as the basis for consistent assessment and remediation of contaminated sites in Canada.
The Guidelines were derived according to procedures described in A Protocol for the Derivation of Environmental and Human Health Soil Quality Guidelines (CCME 2006). According to this protocol, both environmental and human health soil quality guidelines are developed and the lowest value generated from the two approaches for each of the four land uses is recommended by the Canadian Council of Ministers of the Environment (CCME) as the Canadian Soil Quality Guidelines (CCME 2006).
This scientific criteria document provides the background information and rationale for the derivation of environmental and human health soil quality guidelines for nickel. This document contains a review of the chemical and physical properties of nickel, the sources and emissions in Canada, the distribution and behaviour of nickel in the environment, the toxicological effects of nickel on microbial processes, plants, invertebrates, livestock, wildlife, and the behaviour and effects in humans and mammalian species. This information is used to derive soil quality guidelines for nickel to protect human and ecological receptors in four types of land uses: agricultural, residential/parkland, commercial, and industrial.
The environmental soil quality guidelines for nickel for each of the four land uses are: 45 mg/kg soil for agricultural land use, 45 mg/kg soil for residential/parkland land use, 89 mg/kg soil for commercial land use, and 89 mg/kg soil for industrial land use. These guidelines are protective of ecological receptors and are optimised for soils within the pH range of 4.0 to 8.6 because the toxicological studies upon which they are based were conducted within this pH range. The environmental soil quality guidelines were selected from the following ecological exposure pathways developed for nickel: Soil Quality Guidelines for Soil Contact; Soil Quality Guideline for the Protection of Nutrient and Energy Cycling; Soil Quality Guidelines for Soil and Food Ingestion; and Off-site migration check.
The human health soil quality guidelines for nickel for each of the four land uses are: 200 mg/kg for agricultural land use, 200 mg/kg for residential/parkland land use, 310 mg/kg for commercial land use, and 1000 mg/kg for industrial land use based on an incremental lifetime cancer risk of 1 x 10⁻⁶ or 2500 mg/kg for industrial land use based on an incremental lifetime cancer risk of 1 x 10⁻⁵. The human health soil quality guidelines were selected from direct human health-based soil quality guidelines for soil ingestion and dermal contact, direct human health-based soil quality guidelines for soil particulate inhalation (assessed for cancer and non cancer effects), and the Off-site migration check.
The Canadian Soil Quality Guidelines for the protection of environmental and human health, as recommended by the Canadian Council of Ministers of the Environment (CCME 2006) are based on the lowest of the environmental soil quality guidelines or the human health-based soil quality guidelines. Therefore, they are: 45 mg/kg soil for agricultural land use, 45 mg/kg soil for residential/parkland land use, 89 mg/kg soil for commercial land use, and 89 mg/kg soil for industrial land use. This revision to the Canadian Soil Quality Guideline for Nickel supersedes

vi
the original nickel soil quality guideline derived in 1999 (CCME 1999; EC 1999), and the interim remediation criteria for nickel in soil (CCME 1991).

vii
RÉSUMÉ Les recommandations canadiennes pour la qualité de l’environnement sont des limites quantitatives ou descriptives recommandées dans le but d’assurer un écosystème sain, capable de supporter les utilisations actuelles et probables du site par les récepteurs écologiques et humains. Les recommandations canadiennes pour la qualité des sols peuvent être utilisées comme base pour l’uniformisation des processus d’évaluation et d’assainissement des terrains contaminés au Canada.
Les recommandations ont été élaborées selon les procédures décrites dans le Protocole d’élaboration de recommandations pour la qualité des sols en fonction de l’environnement et de la santé humaine (CCME 2006). Conformément à ce protocole, les recommandations pour la qualité des sols visant la protection de l’environnement et de la santé humaine sont développées et la plus petite valeur obtenue de ces deux procédures, pour chacune des quatre types de vocation des terrains, est recommandée par le Conseil canadien des ministres de l’environnement (CCME) comme étant la recommandation canadienne pour la qualité des sols (CCME 2006).
Ce document scientifique contient l’information pertinente sur les données de fond et la justification pour la détermination des recommandations pour la qualité des sols pour le nickel. Ce document contient une revue de l’information sur les propriétés chimiques et physiques du nickel, sur les sources et émissions au Canada, sur la distribution et le comportement du nickel dans l’environnement, sur ses effets toxicologiques sur les processus microbiens, les plantes, les invertébrés et les animaux et son comportement et ses effets chez les humains et les mammifères. Cette information est utilisée pour l’élaboration des recommandations pour la qualité des sols relatives au nickel afin de protéger les récepteurs écologiques et humains dans quatre types de vocation des terrains: agricole, résidentielle/parc, commerciale et industrielle.
Les recommandations pour la qualité des sols visant la protection de l’environnement établies pour le nickel pour chacune des quatre vocations des terrains sont de : 45 mg/kg pour les terrains à vocation agricole, 45 mg/kg pour les terrains à vocation résidentielle/parc, 89 mg/kg pour les terrains à vocation commerciale et 89 mg/kg pour les terrains à vocation industrielle. Ces recommandations sont protectrices des récepteurs écologiques et optimisées pour les sols ayant un pH entre 4,0 et 8,6 puisque les études toxicologiques utilisées pour leur élaboration ont été effectuées dans ces mêmes conditions de pH. Les recommandations pour la qualité des sols pour le nickel ont été sélectionnées parmi les voies d’exposition écologiques suivantes : recommandations pour la qualité des sols fondées sur le contact avec le sol; recommandations pour la qualité des sols en fonction du cycle des nutriments et de l’énergie; recommandations pour la qualité des sols relative à l’ingestion de sol et de nourriture; et recommandations pour la qualité des sols en fonction de l’environnement relatives au migrations hors site.
Les recommandations pour la qualité des sols visant la protection de la santé humaine établies pour le nickel pour chacune des quatre vocations des terrains sont de : 200 mg/kg pour des terrains à vocation agricole/résidentielle/parc, 310 mg/kg pour les terrains à vocation commerciale et, pour les terrains à vocation industrielle, 1000 mg/kg pour un risque additionnel de cancer à vie de 1 x 10⁻⁶ et 2500 mg/kg pour un risque additionnel de cancer à vie de 1 x 10⁻⁵. Les recommandations pour la qualité des sols visant la protection de la santé humaine ont été sélectionnées parmi les voies d’exposition humaines suivantes : recommandations pour la qualité des sols relatives au contact direct pour l’ingestion et le contact dermique, recommandations

viii
pour la qualité des sols relatives au contact direct pour l’inhalation des particules du sol (évaluées pour les effets cancérogènes et non-cancérogènes), et la migration hors site de sol et de poussière provenant des terrains commerciaux ou industriels.
Les recommandations canadiennes pour la qualité des sols visant la protection de l’environnement et de la santé humaine, telles que recommandées par le Conseil canadien des ministres de l’environnement (CCME 2006) sont basées sur les recommandations les plus faibles des recommandations visant la protection de l’environnement ou de la santé humaine. Par conséquent, elles sont: 45 mg/kg pour les terrains à vocation agricole, 45 mg/kg pour les terrains à vocation résidentielle/parc, 89 mg/kg pour les terrains à vocation commerciale et 89 mg/kg pour les terrains à vocation industrielle. Les présentes recommandations pour la qualité des sols pour le nickel remplacent les recommandations pour la qualité des sols, développées en 1999 (EC 1999; CCME 1999), ainsi que les critères provisoires pour l’assainissement du sol pour le nickel (CCME 1991).

1
1 INTRODUCTION Canadian Environmental Quality Guidelines are intended to protect, sustain, and enhance the quality of the Canadian environment and its many beneficial uses. They are generic numerical concentrations or narrative statements that specify levels of toxic substances or other parameters in the ambient environment that are recommended to protect and maintain wildlife and/or the specified uses of water, sediment, and soil. These values are developed by the Canadian Council of Ministers of the Environment (CCME) for toxic substances and other parameters (e.g., nutrients, pH) of concern in the ambient environment.
The development of Canadian Soil Quality Guidelines was initiated through the National Contaminated Sites Remediation Program (NCSRP). In response to the urgent need to begin remediation of high priority “orphan” contaminated sites, an interim set of soil remediation criteria was adopted from values that were in use in various jurisdictions across Canada (CCME 1991). Although the NCSRP program ended in March of 1995, soil quality guidelines continue to be developed by CCME because of the continued need for soil quality guidelines for the management of soil quality with a particular focus on remediation of contaminated sites.
Canadian Soil Quality Guidelines are developed according to a protocol developed by CCME (CCME 1996a, later revised as CCME 2006). According to this protocol, both environmental and human health soil quality guidelines are developed for four land uses: agricultural, residential/parkland, commercial and industrial. The lowest value generated by the two approaches for each of the four land uses is recommended by CCME as the Canadian Soil Quality Guideline. The original Canadian Soil Quality Guideline for nickel was first published in the Canadian Environmental Quality Guidelines (CCME 1999) in 1999. The original nickel soil quality guideline only included guidelines for environmental health (i.e., no human health soil quality guidelines), and its derivation was documented in a supporting scientific document developed by Environment Canada (EC 1999). This revision to the Canadian Soil Quality Guideline for Nickel supersedes the 1999 nickel soil quality guidelines and the 1991 interim remediation criteria for soil (CCME 1991). The 1991 CCME interim remediation criteria for soil (CCME 1991) should be used only when soil quality guidelines based on the CCME protocol (CCME 1996a, or 2006 update) have not yet been developed for a given substance.
This scientific criteria document provides the background information and rationale for the derivation of environmental and human health soil quality guidelines for nickel. This document contains a review of information on the chemical and physical properties of nickel, sources and emissions in Canada, the distribution and behaviour of nickel in the environment, and the toxicological effects of nickel on microbial processes, plants, invertebrates, livestock, wildlife, and the behaviour and effects in humans and mammalian species. This information is used to derive soil quality guidelines for nickel to protect human and ecological receptors in four types of land uses: agricultural, residential/parkland, commercial, and industrial (CCME 2006). The current revision to the environmental soil quality guidelines builds upon toxicity data first reported in the original nickel scientific supporting document (EC 1999), whereas, the derivation of human health soil quality guidelines for nickel represent new work that first appears in this document.
The Canadian Soil Quality Guidelines presented in this document are intended as general guidance. Site-specific conditions should be considered in the application of these values (CCME 1996b) for guidance on developing site-specific soil objectives). The reader is referred

2
to CCME (2006) for further generic implementation guidance pertaining to the guidelines. Soil quality guidelines are derived to approximate a “no- to low-” effect level (or threshold level) based only on the toxicological information and other scientific data (fate, behaviour, etc.) available for the substance of concern, and they do not consider socioeconomic, technological, or political factors. These non-scientific factors are to be considered by site managers at the site-specific level as part of the risk management process. Because these guidelines may be used and applied differently across provincial and territorial jurisdictions, the reader should consult the laws and regulations of the jurisdiction they are working within for applicable implementation procedures.

3
2 BACKGROUND INFORMATION
2.1 Physical and Chemical Properties Nickel (Ni; CAS #7440-02-0), is a hard but brittle, silvery white metal with high thermal and electrical conductivities. Powdered nickel is reactive and may spontaneously ignite in air (ATSDR 2005). Nickel is a transition element of Group VIIIa of the Periodic Table, with an atomic number of 28, an atomic weight of 58.693, a melting point of 1455°C, a boiling point of 2913°C and a specific density of 8.9 g/cm3 at 25°C (Haynes 2011). Nickel exhibits magnetism (but is less magnetic than iron) (Cotton & Wilkinson 1988). Some physical and chemical properties of nickel and nickel compounds are presented in Table 1.
Although nickel can exist in oxidation states of -1, 0, +1,+2, +3 and +4, the most common valence state in the environment and biological organisms is Ni(II) (otherwise noted as Ni2+) (ATSDR 2005). Elemental nickel is insoluble in water and commonly forms stable complexes with ligands containing oxygen, sulphur, phosphorus or arsenic as donor atoms (Cotton & Wilkinson 1988; Haynes 2011). In water, Ni2+ forms a number of compounds of varying solubilities with sulphate, nitrate, chloride, hydroxide and carbonate: nickel chloride, nickel sulphate and nickel nitrate are the dominant forms in water; Nickel carbonyl, nickel sulphide and nickel oxide are considered insoluble in water (Haynes 2011). Ni2+ has an ionic radius close to those of iron, magnesium, copper and zinc, and can replace essential metals in metallo-enzymes thus causing disruptions in metabolic pathways (McGrath 1995).
2.2 Geochemical Occurrence Nickel occurs particularly in iron and magnesium ores such as olivine and pyroxenes (NRCC 1981). In minerals, it occurs most frequently in combination with sulphur, arsenic or antimony. Millerite (NiS), red nickel ore (e.g., NiAs) and pentlandite (NiFe)9S8 are the main minerals. Pentlandite and pyrrhotite represent the most important commercial deposits of nickel in Canada (NRCC 1981; Haynes 2011). In the environment, nickel may be present commonly in a divalent state and can be found in a variety of inorganic and organic compounds, depending on such factors as the medium considered and ambient environmental conditions. Nickel ranks as the 24th most abundant element in the earth's crust, with a crustal abundance range of 37 to 72 mg/kg (Nriagu et al. 1982). The highest natural concentrations of nickel tend to occur in ultramafic and mafic rocks with typical nickel concentrations of 1400 to 2000 mg/kg and 130 to 160 mg/kg, respectively (Kabata-Pendias & Pendias 1984).

4
Table 1. Physical and chemical properties of some nickel compounds*
* Haynes 2011 NA = Not Available
PROPERTY COMPOUND
Nickel Nickel chloride
Nickel sulphate
Nickel sulphide
Nickel subsulphide
Nickel carbonate
Nickel oxide
Nickel carbonyl
Chemical Formula Ni NiCl2 NiSO4 NiS Ni3S2 NiCO3 NiO Ni(CO)4
CAS Registry Number 7440-02-0 7718-54-9 7786-81-4 16812-54-7 12035-72-2 3333-67-3 1313-99-1 13463-39-3
Molecular Weight 58.693 129.599 154.756 90.758 240.210 118.702 74.692 170.734
Physical State (@25ºC)
silvery white metal
yellow hexagonal
crystals
green-yellow orthorhombic
crystals
yellow hexagonal
crystals
yellow hexagonal
crystals
green rhombic crystals
green cubic
crystals
colourless liquid
% Nickel % nickel in hexahydrate
100 45.29
25 37.9 22.3 64.67 73.30 49.45 78.59 34.38
Melting Point (ºC) 1455 1031 840
(decomposes) 976 789 NA 1957 -19.3
Boiling Point (ºC) 2913 Sublimation
pt. 985 NA NA NA NA NA 42.1
(explodes ≈60°C )
Density (g·cm3 @ or near room temperature)
8.9 3.55 4.01 5.5 5.87 4.389 6.72 1.31
Water Solubility (g/100 mL)
insoluble 67.5
@ 25°C 40.4
@ 25°C insoluble NA 0.0043 @ 20°C
insoluble insoluble

5
2.3 Analytical Methods As with numerous other metals, inadvertent sample contamination has been a source of error in nickel analysis. Partially because of this, much of the older published data, especially concentrations in body tissues and fluids, are considered to be inaccurate (Nielsen 1986; Nieboer 1992). The use of ultra-trace and clean-lab techniques has resulted in more reliable data than data generated in the past.
Inorganic nickel in environmental media is most commonly analysed using voltammetry, inductively coupled plasma atomic emission spectrometry (ICP/AES) or mass spectrometry (ICP/MS), neutron activation analyses (NAA) and X-ray fluorescence (XRF). In a review of various analytical methodologies for sewage sludge and digestion solutions, detection limits of 1 µg/L were achieved using voltammetry, whereas detection limits in the ng/L range (0.66-36 ng/L) were reported for water using electrothermal, flame, and graphite furnace techniques of atomisation (EC 1994).
In soil samples, the amount of nickel available for analysis can vary depending on the extraction treatment of the samples prior to analysis (Lutwick 1994; Pastorek 1995). For example, aqua regia (1HNO3:3HCl) digestion releases the “biologically-relevant” forms of nickel, that is, the forms of nickel adsorbed to soil particles, the forms present in soluble salts and organic matter, and the forms contained in some weak silicates. This treatment leaves most silicates and stable mineral matrices intact. The release of all the nickel from soil for total nickel analysis requires digestion with hydrofluoric acid, generally used in combination with perchloric and nitric acids.
U.S. EPA sample preparation methods for extraction of nickel from sample materials include: EPA Method 3050B Acid Digestion of Sediments, Sludges, and Soils (hydrochloric acid digestion); EPA Method 3005A Acid Digestion of Waters for Total Recoverable or Dissolved Metals for Analysis for FLAA or ICP Spectroscopy (nitric acid digestion) for extraction from surface and groundwater samples, or; EPA Method 3015 Microwave Assisted Acid Digestion of Aqueous Samples and Extracts (US EPA 2003).
CCME recommends the following three analytical methods for the determination of nickel in water and wastewater samples: method SM 3111B, Direct Air-Acetylene Flame Method for the Determination of Metals; method SM 3113B, Electrothermal Atomic Absorption Spectrometric of Water and Wastewater; and method SM 3120B Inductively Coupled Plasma (ICP) Method, for the Determination of Metals (CCME 1993). In addition, US EPA Method 6010, Revision 0, "Inductively Coupled Plasma-Atomic Emission Spectroscopy" is recommended by CCME (1993) for the analysis of nickel in ground water, soil, sludge, sediment and other solid waste samples. The estimated instrumental detection limit (DL) of the latter method is 15 μg/L (1 g of soil digested in 100 mL water). The US EPA analytical method 6020 Inductively Coupled Plasma with Mass Spectrometry is a more sensitive technique, with an estimated instrumental detection limit (DL) of <0.02 µg/L. This method is applicable to groundwater, aqueous samples, industrial wastes, soils, sludges, sediments and other solid wastes. Preliminary treatment by acid digestion is required for all samples (with the exception of water) to determine total nickel content. Water samples must be filtered and acid-preserved prior to analysis to determine dissolved nickel content (US EPA 2003).
Nickel in PM2.5 (particulate matter less than 2.5 µm in diameter) in ambient air samples collected across Canada were measured for the National Air Pollution Surveillance (NAPS) network using

6
x-ray fluorescence or ICP-MS (EC 2003a). Data quality of the most recent data (2003 to 2009) from the NAPS database has improved with the better method detection limits achieved with ICP-MS analyses (Dann 2007).
2.4 Production and Uses in Canada Nickel is a commercially viable natural resource in Canada, with industrial activities focussed in nickel mining, smelting and refining. Canada is one of the top five producers of nickel in the world, responsible for approximately 10% of global nickel production (USGS 2011). Canadian nickel production is estimated at 155 000 tonnes in 2010 (USGS 2011). In 2009, 136 594 tonnes of nickel was produced in Canada with the largest amounts produced in Ontario (33.6%), Manitoba (23.7%), Newfoundland and Labrador (21.3%) and Québec (21.3%) (NRCan 2009). Canada exports nickel and nickel products to over 70 countries worldwide (NRCan 2009) and is one of the top five producers of nickel in the world, responsible for approximately 10% of global nickel production (USGS 2011).
The commercial sector accounts for about two-thirds of the nickel market in Canada and nickel-containing stainless steel continues to be the major growth market for nickel (MAC 1991). Approximately 7195 tonnes of nickel were estimated to have been used in Canada in 2007. Nickel from stainless steel scrap is recycled at a rate of 45 to 48% in the production of stainless steel (NRCan 2009). Metallic nickel, sold in the form of cathodes, pellets, powders, briquettes, rondelles and coinage, is used in approximately 3000 alloys that have more than 250 000 applications (MAC 1991). For example, nickel-containing stainless steel is used by chemical and food processing industries and in the medical profession. Iron-nickel alloys are also important materials for the electric industry while nickel-copper alloys are used in shipbuilding.
Nickel compounds are also useful in various industries. Nickel carbonate hydroxide is employed in plating and catalysis; nickel carbonate used in electric components; anhydrous nickel chloride is used as an adsorbent in certain gas masks and in nickel plating; nickel hydroxide is an electrode material; nickel oxide is an important raw material in metallurgical operations for smelting and alloy-producing processes; nickel sulphate can be a catalyser or employed in electrolyte solution and jewellery; and nickel nitrate is employed by nickel-plating and nickel-containing battery industries (WHO 1991).
2.5 Sources and Concentrations in the Canadian Environment The background concentrations and environmental fate of metals strongly depend on geological and biological characteristics and therefore, any assessment of potential risks associated with metals should take into consideration regional differences in metal content in the natural environment (Chapman & Wang 2000). High concentrations of metals can occur naturally in Canadian soils, stream sediments, and water, blurring the distinction between anthropogenic pollution versus naturally occurring bodies of ore (EC 1996). Soils and sediments reflect the composition of parent material, resulting in higher metal concentrations in mineralised areas (Wilson et al. 1998) and lake or stream sediments can act as sinks, accumulating elements derived from surrounding watersheds (i.e., nickel within bedrock, glacial sediments and soils). Mining districts are characterised by naturally occurring metals in soil, sediment, rock and water at concentrations that could result in their classification as "contaminated sites". In the determination

7
of anthropogenic metal contamination of soils, no single guideline concentration can adequately represent the variance in background concentrations across Canada (Painter et al. 1994).
Nickel is naturally released into Canadian surface waters, sediments, and soils by weathering and erosion of geological materials (i.e., bedrock) (Painter et al. 1994). In addition, nickel enters the aquatic environment in effluent and leachates as well as through atmospheric deposition from anthropogenic releases (EC 1994). Natural sources of airborne nickel include soil dust, sea salt, volcanoes, forest fires and particulate exudates from vegetation (NRCC 1981; Richardson et al. 2001; Schmidt & Andren 1980; Warren & Delavaut 1954). In Canada, the estimated contribution of natural sources to airborne nickel is approximately 170 to 2700 t/y, with wind-blown dust being the dominant source (Richardson et al. 2001). Sea spray may be a major contributor to atmospheric nickel in coastal areas. Although forest fires can be short-term sources, they are intense sources (Havas & Hutchinson 1983).
There is very little quantitative information available on the speciation of nickel in various environmental media. Concentrations of nickel are generally reported as total nickel, and unless otherwise specified, are assumed to be reported as such. Concentrations are given on a wet weight basis for food, biota and human tissues and on a dry weight basis for other media, unless otherwise indicated. Reviews on the emission of nickel from major anthropogenic sources have been presented for Canada (e.g., Jacques 1987; NRCC 1981). Primary base metal production represents an important anthropogenic source in Canada. The contribution of smelting and refining of base metals was estimated to be 1100 tonnes of nickel as air emission and 64 tonnes as effluents in the 1988 mining year (MacLatchy 1992). Based on data from Environment Canada’s National Pollutant Release Inventory (NPRI), 412 tonnes of nickel were released to the environment by major emitters in 2006, of which 356 tonnes were released to air, 49 tonnes were released to water and 1.9 tonnes to land; over half of this amount was released from the Vale Inco facility in Thompson, MB. Other major emitters were facilities in the mining, smelting, petroleum refining and manufacturing industries (EC 2007). Some minor atmospheric releases have been attributed to the alloy production and the scrap reprocessing industries, the incineration of municipal garbage and sewage sludge, the manufacture of cement, coke oven and cooling tower operations and the mining/milling of asbestos (EC and HC 1994; Jacques 1987; WHO 1991). Globally, the largest anthropogenic releases are from fossil fuel (predominantly coal and oil) combustion and nickel mining and smelting (McGrath 1995). Virtually every industry (e.g., electric power stations and heating and industrial plants, gasoline combustion, non-ferrous metal smelters, kiln operations in cement plants, and refuse incineration) will emit heavy metals via high temperature processes into the atmospheric, aquatic, and terrestrial ecosystems (Wilson et al. 1998).
The natural oxidation of sulphide minerals in ore and acid mine drainage contributes a significant portion of the nickel in mine effluents (MacLatchy 1992). Effluents from gold mines can contain significant amounts of nickel (Boyd 1991-92). The cyanidation process that leaches gold from ore also extracts nickel and other metals. Uranium and stainless steel industries contribute additional emissions into the Canadian aquatic environment (Boyd 1991-92; MacLatchy 1992). Although not as significant as the metal production processes, fossil fuel combustion also represents an important part (20%) of the national emission inventory for nickel (Jacques 1987).
Industrial effluents containing significant amounts of nickel come from nickel mining, smelting

8
and refining, metal plating, gold mining and uranium extraction and iron and steel processing. Nickel from nickel mining and refining operations is disposed of onto land as waste rock, in the form of slags and sludges and as tailings released into ponds (EC 1994; Jacques 1987).
Anthropogenic nickel is found in a variety of compounds from a high-temperature green variety to low-temperature black products. High-temperature green nickel oxide is relatively inert and is the predominant form in nickel refineries, whereas black nickel oxides are more chemically active. More complex and reactive nickel oxides, such as copper-nickel oxides, are often formed as by-products of industrial processes. Nickel subsulfide (Ni3S2) and nickel sulfide (NiS) occur as intermediates in the processing of sulfidic ores. Nickel subsulfide is found in two forms: the low-temperature green form, α-Ni3S2 (heazlewoodite), and the high-temperature bronze-yellow form (β-Ni3S2). Nickel sulfide forms dark green to black crystals or a powder (α-NiS, β-NiS, or amorphous NiS, respectively) (cited in Goodman 2011). Sections 2.5.1 to 2.5.12 form the basis for selection of typical environmental concentrations (background) of nickel in environmental media that are not associated with contamination for use in the derivation of Canadian Soil Quality Guidelines (chapters 7 and 8 and Appendix 10).
2.5.1 Ambient Air
Little information is available on speciation of nickel in ambient air. Most data in the literature refer to total concentrations in particles; however, Ontario has implemented species-specific measurements of nickel in their ambient air monitoring program in 2003. The results from urban areas and areas influenced by a nickel source showed that nickel sulphate was the dominant species (57-85%), followed by nickel oxide and nickel hydroxide, which made up less than 20%. Limited sampling of air filters and house dust in Sudbury, ON, indicated a small amount of nickel subsulphide (<10%) may be emitted from the Copper Cliff smelter (OMOE 2011a). Available data are summarised in Appendix 1.
Data on Canadian nickel concentrations in air in Canada, reported as PM2.5 (particulate matter less than 2.5 µm in aerodynamic diameter) were provided by Environment Canada from the National Air Pollution Surveillance (NAPS), a Canada-wide network of monitoring stations operated by federal, provincial, territorial and municipal governments and agencies. Based on the 2003 to 2009 NAPS dataset, the overall mean concentration of nickel in PM2.5 from urban and rural stations was 0.94 ng/m3 (n=3054 samples) (HC 2011). The mean concentration of PM2.5 calculated from the 2003 to 2009 NAPS dataset was used to estimate typical nickel concentrations in ambient air in Canada for the purposes of this document.
Nickel PM2.5 concentrations measured in ambient air in Canada were found to be similar between urban and rural areas (Appendix 1). A median rural PM2.5 concentration of 1.0 ng/m3 and a median urban PM2.5 concentration of 0.6 ng/m3 were reported in the vicinity of Ottawa-area homes (Rasmussen et al. 2006). Similarly, an analysis of a subset of the NAPS dataset from 2007 to 2009 showed a mean PM2.5 concentration of 0.5 ng/m3 in rural areas compared to 0.8 ng/m3 in urban areas (Dann 2010). Similar outdoor air concentration ranges were reported in other studies (Niu et al. 2010a; Bell et al. 1994). Niu et al. (2010a) reported median outdoor air concentrations of 1.0 ng/m3 and 1.3 ng/m3 (ED-XRF and ICP-MS respectively), and a mean concentration of 1.4 ng/m3 (based on ICP-MS results). When size-selective particle sampling was used to separate two urban PM samples collected in Ottawa, ON (without nearby industrial sources) into nano (57-100 nm), fine (100-1000 nm) and coarse (1000-10 000 nm) fractions, a general trend of increasing nickel
9
concentration with decreasing aerodynamic diameter was evident, but there were significant differences between the concentrations of nickel in the smaller diameter fractions in the two samples. The median concentration among ten fractions (10 000, 5600, 3200, 1800, 1000, 560, 320, 180, 97 and 57 nm diameter) of the two samples were 251±195 (range 46-853) µg/g and 269±200 (range 58-37 041) µg/g. Particle size distribution and element correlation analysis suggest that the elements concentrated in the nano- and fine-size fractions originated mainly from vehicular combustion and emission. Long-range airborne transport and soil or road dust resuspension may also contribute (Niu et al. 2010).
The annual mean concentration of nickel was reported to be less than 0.5 ng/m3 in remote areas such as the Canadian Arctic (Hoff & Barrie 1986; Chan & Lusis 1988). Higher levels reported in older data for remote or rural sites may be due in part to higher detection limits at the time of analyses (i.e. prior to the use of ICP/MS), rather than actual observed levels (Dann 2010).
A time-dependent decrease in annual average concentrations of nickel was observed between 1994 (0.34 ng/m3) and 2001 (0.13 ng/m3), along with more frequent occurrence of non-detectable (nd) concentrations (i.e., 4 nd in 1994 and 32 nd in 2001) in Alert, NWT (INAC 2003). Annual averages for nickel from 1994 to 2001 (n=374) were derived based on ICP-MS analysis of PM10 (Gong 2004).
Higher concentrations of nickel in total suspended particulates (TSP) have been reported in the vicinity of industrial sources. For example, maximum concentrations of nickel in air samples taken near Copper Cliff, ON in 1980, 1986 and 1988 were 4400, 2300 and 6100 ng/m3, respectively (Brecher et al. 1989; Dobrin 1992; OMOE 1992) and average nickel concentrations in air samples from the Copper Cliff-Sudbury area ranged from 100 to 250 ng/m3 between 1978 and 1988 (Dobrin 1992; Chan & Lusis 1988).
Vegetation biomonitoring has been conducted to evaluate metal content in air and airborne deposition. Tree foliage sampling data were available for background locations in Ontario and Manitoba. In Ontario, nickel was detected in the foliage of silver maple trees (n=63) at rural locations in Essex and Kent counties in trace amounts (0.8 to 2.1 µg/g dry weight) (Gizyn 2002). By comparison, nickel concentrations in coniferous trees (n=3) were below detection (i.e., <0.1 µg/g, dry weight) in rural northern Manitoba (Yee 2004).
2.5.2 Indoor Air
The available data on nickel concentrations in indoor air are summarised in Appendix 1. Limited data from Canadian sources on indoor air are available. As such, data from non-Canadian sources (Van Winkle & Scheff 2001; USEPA 2009; Stranger et al. 2009; Molnár et al. 2006; Li et al. 1993; Balasubramanian & Lee 2007; Adgate et al. 1998; Graney et al. 2004) were considered, in addition to selected Canadian sources of indoor air data (AB Health 1998; Bell et al. 1994; Rasmussen et al. 2006). Using this expanded data set, a mean indoor air concentration of 7.21±10.4 ng/m3 (mean ± SD) for the PM2.5 fraction was estimated as representative of indoor air concentrations in Canada (HC 2011).
In Ottawa, ON, Rasmussen et al. (2006) measured particulate matter (PM) simultaneously in indoor air (in two size ranges: PM2.5 and PM10) and outdoor air (PM10) in ten rural homes and ten urban homes. The median nickel PM2.5 and PM10 levels in rural homes were found to be slightly higher (0.7 ng/m3 and 1.5 ng/m3, respectively) in comparison to urban homes (0.6 ng/m3 and 1.0
10
ng/m3). Nickel concentrations in ambient PM2.5 were slightly higher (1.0 ng/m3) than concentrations measured in rural homes (0.7 ng/m3), but there was no difference between median nickel concentrations in ambient PM2.5 and those found air in urban homes (0.6 ng/m3).
Indoor air quality studies in Windsor, ON reported an average nickel concentration of 1.5 ng/m3, which was in the same range as levels in corresponding outdoor air samples (daily averages ranged from 1.3 to 1.9 ng/m3). In a statistical analysis of all three phases of the Windsor Air Quality study, the indoor mean concentration of nickel (n=37) was reported to be 1.3 ng/m3 (range: 0.3-9.2 ng/m3) with airborne nickel concentrations found to be slightly lower in smoke-free homes (n=22; mean 1.1 ng/m3 and range 0.4-2.3 ng/m3) than in the homes of smokers (n=15; mean 1.6 ng/m3 and range 0.3-9.2 ng/m3) (Bell et al. 1994). In a U.S. indoor air quality study conducted in 1986, week-long samples of fine (PM2.5) air particles collected from 394 homes in two counties in New York State reported mean nickel concentrations in the 2 to 3 ng/m3 range (Koutrakis et al. 1992).
2.5.3 Indoor Dust
Similar to indoor air, there is a lack of data on indoor settled dust concentrations. As such, indoor dust concentrations based on studies from Canada (Rasmussen et al. 2001; 2008), the United States (USEPA 2009; Adgate et al. 1998) and data from other developed countries (Chattopadhyay et al. 2003; Davis & Gulson 2005; Lisiewicz et al. 2000; Madany et al. 1994; Turkoglu et al. 2004; Turner & Simmonds 2006) were used to estimate typical Canadian concentrations of nickel in indoor dust, and are summarised in Appendix 1. A mean nickel concentration of 48.14±40.97 µg/g in indoor settled dust was derived based on these studies (HC 2011). A slightly lower median nickel concentration in house dust (40 µg/g) was derived from a review of several studies from various cities around the world (Fergusson & Kim 1991). Similarly, Rasmussen et al. (2008) reported a median total nickel concentration of 41 μg/g in house dust based on dust samples collected from 22 residential homes in Ottawa, ON. In an earlier study, total nickel concentrations in house dust ranged from 16.0 to 243.3 μg/g with an arithmetic mean of 62.9 μg/g, a geometric mean of 53.6 μg/g and a median of 51.5 μg/g (Rasmussen et al. 2001).
In the Ottawa house dust studies, Rasmussen et al. (2001 and 2008) reported that metals in house dust may be found at higher concentrations compared to concentrations in residential garden soil. Therefore house dust may contribute significantly to exposure to metals in residential urban environments. Rasmussen et al. (2008) noted that the elevated indoor/outdoor (I/O) ratios in this study were comparable to reported I/O ratios in other urban residential settings in the United Kingdom and New Zealand (Kim & Fergusson 1993; Culbard et al. 1988).
2.5.4 Soil
Nickel is naturally present in soil as a result of chemical and mechanical weathering of parent rock material. Nickel is present in granites, sandstones and limestones in concentrations ranging from 5 to 20 mg/kg, but it can also occur in high concentrations in ultramafic and mafic bedrock and soils overlying these types of bedrock, where nickel is naturally enriched. Nickel concentrations in Canadian soils and world averages are summarised in Appendix 1.
For the purpose of this soil quality guideline, a mean total nickel concentration of 26.8 mg/kg calculated from background till data (excluding areas of nickel enriched rocks and nickel bearing mineral occurrences) compiled by the Geological Survey of Canada (Grunsky 2010; Rencz et al. 2006) is considered to be representative of typical nickel concentration in background soils in

11
Canada. Similar mean concentrations of total nickel in Canadian background soils have been reported by other researchers (Sheppard et al. 2007; Sanei et al. 2007; SENES 2002; McKeague & Wolynetz 1980).
Background nickel concentrations can range up to four orders of magnitude and can differ widely due to local geological conditions (Rencz et al. 2006). High concentrations of nickel in soils and tills are often associated with mafic and ultramafic rock types in Canada (Rencz 1980; Roberts 1980; Klassen & Thompson 1990; Kaszycki 1986). Areas of naturally nickel-enriched soils exist in most regions, with the possible exception of the St. Lawrence River lowlands and the southern plain regions of Alberta and Saskatchewan (Doyle 1991). Rencz and Shilts (1980) reported total nickel concentrations of up to about 1200 µg/g in the silt- and clay-size fraction (<64 µm) of till, near an outcrop of ultramafic rock in the Thetford Mines, QC area, and from 80 to 560 mg/kg total nickel in acidic soils associated with sulphide ore bodies near Ferguson Lake, NWT. Roberts (1980) reported naturally high concentrations (mean of 3460 mg/kg total nickel) in neutral (pH 6.8-7.3) nickel-enriched soils developed on ultramafic (serpentine) bedrock in western Newfoundland. In areas which may be naturally enriched with nickel, additional information on a regional or local background levels of nickel is required to support the development of regional or site specific soil quality objectives for sites in Canada.
Atmospheric deposition of nickel from anthropogenic sources can increase concentrations of nickel in topsoil near major sources of emissions such as nickel mining, smelting and refinery operations. Depth-specific sampling at several sites in the Sudbury, ON, area indicated that nickel concentrations were much higher in samples collected from depths of 0-5 cm than in samples from depths of 6-10 cm or 11-15 cm (Gratton et al. 2000). Another study near Sudbury in 2001 reported nickel concentrations in soils ranging from 14 mg/kg to 435 mg/kg (Feisthauer et al. 2006). Similarly, nickel levels in surface soils from the Rodney Street Community in Port Colborne, ON, which is influenced by industrial emissions, were found to average approximately 2500 mg/kg (OMOE 2002). Nickel concentrations in undisturbed soil in rural woodlots, downwind of the INCO nickel refinery were found to be much higher than in adjacent residential and agricultural properties in the Port Colborne area due to emissions from the nickel refinery. The observed differences were reported to be due to atmospheric deposition of particulates from the refinery emissions and absorption of nickel in air by tree foliage, resulting in the accumulation of nickel in leaf litter and other organic matter in the upper surface layer of the forest soil over time (Leece & Rifat 1997). Nickel concentrations of up to 17 000 mg/kg were reported in soil adjacent to a nickel refinery in southern Ontario (Birmingham & McLaughlin 2006).
Although it is unlikely that there will be a large build-up of nickel in soils as a result of application of most fertilisers and agricultural wastes (McGrath 1995), sewage sludge applications may increase nickel levels in soils (Webber et al. 1983; Adamo et al. 1996).
2.5.5 Surface Water
Nickel concentrations in surface waters in Canada are typically below 2 µg/L. The reported range of concentrations for uncontaminated fresh waters in Canada is 1 to 10 µg/L (Leger 1991; Moore & Ramamoorthy 1984; NRCC 1981). A summary of concentrations is provided in Appendix 1.
Higher concentrations of nickel can be found in waters near point source discharges. Historically, concentrations in surface water samples in the Sudbury area have been elevated. Nickel

12
concentrations in water ranged from 7.0 to 9.7 µg/L in reference lakes and 52.0 to 338.2 µg/L in five Sudbury, ON area lakes located downstream from a metal point source and three other lakes independent of the downstream gradient (Pyle et al. 2005). Nickel concentrations in surface water collected between 1993 and 1994 in the Sudbury region ranged from 14 to 130 µg/L (Graham 1995). Mean concentrations of nickel ranging from 50 to 1400 µg/L were reported in lakes near Sudbury (Hutchinson & Havas 1986; Keller et al. 1992; Dixit et al. 1991) suggested that a significant fraction of this nickel originates from deposition following releases from local smelters.
Elevated concentrations of nickel in surface waters have also been reported as a result of natural inputs. For example, mean concentrations of up to 6300 µg/L were determined in water samples taken from naturally acidic ponds associated with spontaneous burning of bituminous shales near Smoking Hills, NWT (Havas & Hutchinson 1983).
2.5.6 Groundwater
Groundwater data are summarised in Appendix 1. Groundwater that is used as drinking water is discussed in section 2.5.7.
In British Columbia, total nickel in groundwater ranged from 5.6 to 2910 µg/L, with an overall average of 47 µg/L (n=97) and dissolved nickel concentrations ranged from 5.6 to 920, with an overall average of 26 µg/L (n=94) (Evans 2004). In Alberta, groundwater monitoring data for nickel were provided for deep (n=101) and shallow (n=111) wells. Nickel concentrations in deep wells ranged from <2 to 272 µg/L (with over 64% of samples below 2 µg/L) and ranged from <1 to 62 µg/L in shallow (with less than 10% of samples below the detection limit of 1 µg/L). An overall average of 6 µg/L was calculated for nickel in shallow groundwater wells (Holt-Oduro 2004).
2.5.7 Drinking Water
Based on nickel concentrations in drinking water from Newfoundland and Labrador, Ontario, and Saskatchewan, an average concentration of 2.9 μg/L (n=12 251) was calculated. The data are based on 1998 to 2007 nickel concentrations in treated water from the Ontario Drinking Water Surveillance Program (DWSP), Saskatchewan drinking water from 2000 to 2009 and tap water concentrations from public water supplies in Newfoundland and Labrador sampled from January 2000 to June 2009 (HC 2011). This value was used as the average nickel concentration for Canada and it is slightly higher than the overall average nickel concentration reported in the 2000 to 2003 TDS, but it is within the range of mean concentrations reported in the TDS. A summary of available nickel concentrations in drinking water is included in Appendix 1.
A nickel concentration of 1.1 µg/L was reported for drinking water from a treatment plant (n=1) in rural northern Manitoba (Yee 2004) An average nickel concentration of 1.2 µg/L was reported for treated water from three locations in Saskatchewan from 1994 to 2006. Concentrations were primarily below the analytical detection limit of 1.0 µg/L and the detection limit was used to calculate the average (Hase 2004).
Drinking water data from the Ontario Drinking Water Surveillance Program for total nickel were provided for 6096 distribution water samples from groundwater (n=996), lake (n=2878), and river (n=2222) drinking water sources from 1990 to 2002 (Cheung 2004) concentrations were reported to be 1.12 µg/L in groundwater, 3.33 µg/L in lake water, and 1.02 µg/L in surface water.

13
In the Yukon, drinking water concentrations measured from 1999 to 2003 were typically found to be at, or below analytical detection limits (<0.5 to 2 µg/L) (Bergsam 2004). Similarly, total nickel concentrations reported in samples collected from 1995 to 2001 (n=32) were found to be at or below analytical detection limits (<2 µg/L) in over 95% of the samples (Beckerton 2004).
In groundwater sampling in central New Brunswick (Fredericton) from 1993 to 1995, total metals were assessed in 465 water samples obtained from residential kitchen taps. Nickel concentrations were found to range from <7 to 97 µg/L with concentrations below the detection limit of 13 µg/L in 254 samples. A mean nickel concentration of 16.4 µg/L and median of 6.5 µg/L were reported (Boyle et al. 1996). In a similar 1991-93 groundwater survey in the Moncton, NB area, nickel concentrations ranged from <13 to 289 µg/L with a mean value of 18.4 µg/L and median of 6.0 µg/L, with nickel concentrations in approximately half the water samples below the detection limit of 13 µg/L (Boyle et al. 1994).
As part of the Canada Total Diet Study (TDS), a survey of tap water was conducted from 2000 to 2003 in four Canadian cities. Kitchen tap water was collected from Ottawa, St. John’s, Vancouver and Montréal. Mean concentrations ranged from 1.43 µg/L to 3.10 µg/L, with an overall average of 2.37 µg/L. Mean area tap water collected in St. John’s and Vancouver were <0.07 µg/L while mean area tap water from Montréal was found to be 0.80 µg/L (Dabeka 2009). These values are within the same range as earlier studies from Ontario, the Atlantic provinces and Alberta (EC 1989a; Jones-White 1992; Moon et al. 1988). Some bottled water data is available for Canada (Dabeka et al. 2002) and is reported in Appendix 1 (commercial foods section). This data was not considered in estimating exposure via drinking water.
2.5.8 Sediment
A summary of available background concentrations in sediment is provided in Appendix 1.
Concentrations of nickel in sediments from Canadian lakes varied from <10 to >4000 mg/kg dry weight (dw) (Bradley & Morris 1986; Bodo 1989). The highest concentrations were generally reported in contaminated surface or subsurface sediments while the lowest were measured in deeper or uncontaminated sediments. Background concentrations in Canadian freshwater sediments range from 2 to 50 mg/kg dw (Bodo 1989; Arafat & Nriagu 1986; Jackson 1988; Moore & Ramamoorthy 1984).
Nickel in stream sediments collected in 2004 from 20 ecoregions in the Yukon were analysed using a Leforte (reverse aqua regia) hot digest and instrumental neutron activation. Mean concentrations of total nickel ranged from 16.31 to 111.1 mg/kg and median concentrations ranged from 8 to 38 mg/kg (Garrett 2004).
2.5.9 Biota
Nickel concentrations in biota are reported as total nickel on a wet weight (ww) or fresh weight basis, unless otherwise indicated. A summary table is provided in Appendix 1.
Concentrations of nickel were measured in produce (lettuce, beet tops, carrots and potatoes) collected from 9 urban gardens in east Saint John, NB, 2 urban gardens in west Saint John, NB and 1 rural garden (with the exception of beet tops) in Fredericton, NB (Pilgrim & Schroeder 1997). Concentrations were reported to be consistently higher in produce collected from the city gardens. Mean nickel concentration from urban gardens ranged from 0.17 µg/g to 0.22 µg/g (potatoes), 0.9

14
µg/g to 2.4 µg/g (lettuce) and 1.2 µg/g to 3.1 µg/g (beet tops), while rural mean concentrations for nickel ranged from 0.5 µg/g (carrots) to 1.5 µg/g (lettuce).
Nickel was detected in radishes (0.5 and 0.7 µg/g, wet weight), but was below detection (i.e., <0.1 µg/g) in potatoes, carrots, turnips, strawberries, blueberries and mossberries sampled in rural northern Manitoba (Yee 2004).
Higher nickel concentrations in fruits and vegetables may occur as a result of regional sources of contamination. For example, the concentration of nickel in washed lettuce grown within a 40 km radius of Sudbury, ON, was reported to be as high as 166 µg Ni/g dry weight (dw) (Hutchinson et al. 1981). However, the Sudbury Soil Study (SARA 2008) showed lettuce levels more similar to those from NB. The Sudbury study analysed root, leafy and above-ground vegetables from residential (n=64), commercial (n=15) and wildland sites (n=10) at locations selected to represent a variety of soil nickel concentrations. In residential soils the following ranges of concentrations (µg/g w.w.) were observed: <dl-1.169 (beets); 0.061-2.512 (carrots); 0.035-2.705 (cucumbers); 0.088-2.960 (lettuce); 0.116-2.364 (onions); <dl-2.030 (potatoes); <dl-1.843 (tomatoes); and 0.047-1.888 (zucchini). For commercial sites concentrations (µg/g w.w.) ranges were: <dl-0.930 (cucumbers); <dl-1.580 (potatoes); and <dl-0.432 (strawberries). For wildlands blueberry nickel concentrations ranged from 0.264-1.034 and 0.103-0.255 µg/g w.w. for mushrooms.
Arctic surfclam and male crabs (Atlantic snowcrab, queen crab and spider crab) were collected in 1996 from various locations off the coast of Newfoundland as part of the National Contaminants Information System (NCIS) (Fancey 2004). Tissue analyses were conducted by ICP-MS with a method detection limit of 0.01 µg/g. Nickel concentrations of clams and crabs are summarised in Appendix 1 and reported in µg/g as total nickel (dw). In arctic surfclam collected south of Newfoundland (Banquereau Bank), nickel concentrations ranged from 0.73 to 5.57 µg/g (whole organism, n=19). Nickel levels in tissue (gills, testes, viscera, cheliped muscle, coxal muscle and leg muscle) from male crabs sampled from eight locations in Newfoundland were found to range from 0.13 µg/g to 51.4 µg/g (Fancey 2004). The maximum detected nickel concentration consistently occurred in the gills of the crabs. In the data provided for both crab and clams there was a greater frequency of occurrence of lower range concentrations compared to high concentrations.
Nickel concentrations in muscle or combined livers/hepatopancreas tissues from marine fish and crabs (n=5/species) collected from two sites in Boundary Bay (inshore and offshore) and from Roberts Bank, BC (Swain & Walton 1994) were conducted using ICP-MS. Nickel concentrations in muscle tissue from Dungeness crab (Cancer magister) and starry flounder (Platichthys stellatus) were below the analytical detection limit of 1.0 µg/g in all samples. Both median and mean nickel concentrations in muscle tissue of butter sole were <1.0 µg/g and a maximum concentration of 3.1 µg/g. In composite samples of hepatopancreas, median nickel concentrations (dw) of 1.4 µg/g (0.20 µg/g ww), 2.3 µg/g (0.31 µg/g ww) and 2.1 µg/g (0.38 µg/g ww) were reported for crabs collected from the in-shore Boundary Bay, off-shore Boundary Bay and Roberts Bank sites, respectively. The mean nickel concentration in whole staghorn sculpins collected from the in-shore Boundary Bay site was 2.2 µg/g dw (0.44 µg/g ww).
Total nickel concentrations in walleye fish collected from two sites in Lake Erie (n=15), were below the analytical detection limit of 0.02 µg/g in 80% of the samples. In Lake Huron, a mean nickel concentration of 0.052 µg/g was determined assuming a value of ½ the detection limit for

15
samples (10%) below analytical detection. In Lake Ontario, nickel concentrations were below detection (<0.02 µg/g) in 55% of the samples collected in 1995-1997 and below detection (<0.05 µg/g) in 95% of samples collected in 2002 (Trivedi 2004). Whole animal analyses were conducted using graphite furnace atomic absorption spectrophotometry (AAS); a detection limit of 0.02 µg/g (dw) was reported for 1995-1997 samples and 0.05 µg/g (dw) for 2002 samples (Trivedi 2004).
As part of a contaminant monitoring program in the Northwest Territories, the livers and kidneys of 20 barren ground caribou (Beverly herd) were analysed for metals and nickel concentrations were generally below analytical detection limits, although the detection limits were not reported in this study (Elkin 2001). Nickel concentrations ranging from <0.01 to 1.33 µg/g were reported in caribou tissue from the Northwest Territories. Nickel was also measured in the kidney tissue of Banks Island Peary caribou (n=22) and barren-ground caribou (Bluenose herd, n=52) of the western NWT. All samples were below analytical detection (<0.1 µg/g, or, in the case one sample, <0.8 µg/g) (Larter & Nagy 2000).
It should be noted that in the case of all biota monitoring, the age and size of the species collected and analysed are variables that can affect metal uptake and resulting metal concentrations in tissues.
2.5.10 Commercial Foods
Nickel concentrations in foods are reported as total nickel on a wet weight or fresh weight basis, unless otherwise indicated. Since 1969, Health Canada has conducted Total Diet Studies (TDS) to estimate the dietary intakes of chemicals by Canadians in different age-sex groups. For the most recent Total Diet Studies (as cited in HC 2011), food samples were analysed using inductively coupled plasma-mass spectrometry (ICP-MS) and concentrations were reported in ng/g (fresh weight). The detection limits of the analyses varied depending on the type of food and the reagent blanks. The 1995 Canadian Total Diet Study indicated the major contributors of nickel to the typical Canadian diet included meat and poultry (37%), bakery goods and cereals (19%), soups (15%) and vegetables (11%) (Dabeka & McKenzie 1995); however, beans (including cocoa), grains, nuts and seeds may contribute more to intake in vegetarians and other groups with higher than average intakes of these foods (Anke et al. 2000). Nickel concentrations were determined in 143 food composites in 2000. The highest levels of nickel in foods purchased in Ottawa in 2000 as part of the 2000-2004 Total Diet Study were found in shelled seeds (3.173 µg/g), white sugar (2.600 µg/g), herbs and spices (2.122 µg/g) and nuts (1.960 µg/g). Data from the Canadian Total Diet Studies from 2000 to 2007 were used in the determination of the estimated daily intake of nickel from food sources, with the exception of infant formula, which is based on Dabeka (1989) and explained further in Section 2.5.11. Foods data is discussed further in section 8.2 and found in Appendices 1 and 9.
Data from the 2000-2007 Canadian Total Diet Studies were provided directly by Health Canada’s Food Directorate and then normalised to correspond to the age groups used in this document. Depending on the body weight used, mean daily intakes of 280 µg Ni/day from food for Canadian adult consumers based on a 70.7 kg adult and 240 µg Ni/day based on a 60 kg adult were calculated. These intakes are similar to the intake of 282 µg Ni/day previously reported for Canada for 1986-1988 (Dabeka & McKenzie 1995). The nickel intake rates calculated from the 2000-2007 studies are within the range of 200 to 300 µg/day reported by the World Health

16
Organization (WHO 1991), but are above those reported in Total Diet Studies conducted in the United Kingdom (i.e., 120 µg/day) (Ysart et al. 2000), France (i.e., 74 µg/day) (Noel et al. 2003) and Australia (i.e., 150 µg/day for men and 115 µg/day for women) (Food Standards Australia New Zealand FSANZ 2008). While the total daily nickel intake from an average Danish diet was estimated to be 150 (Nielsen & Flyvholm 1984) to 167 (Larsen et al. 2002) µg/day, daily intake in Danes could reach over 900 μg/day due to consumption of certain high-nickel foods (oatmeal, legumes [including soybeans], nuts, cocoa and chocolate) (Nielsen & Flyvholm 1984). Analysis of the 1984 U.S. Food and Drug Administration Total Diet Study found the mean nickel intakes for infants and young children ranged 69 to 90 μg/day, 71 to 97 μg/day for adolescents and 74 to 100 μg/day for adults and the elderly (Pennington & Jones 1987).
A significant issue regarding nickel determination in foods analysed in the 2000-2004 Canadian Total Diet Study involves potential nickel contamination of foods from cooking sources (utensils and cookware) and from the nickel analyses itself (see Section 2.3). It is well known that leaching of nickel from stainless steel cookware may significantly increase the nickel content of foods prepared in contact with this alloy (WHO 1991; Grandjean et al. 1989; Dabeka & McKenzie 1995). Nickel was detected in the leachates from seven different stainless steel utensils, subjected to corrosion tests, at concentrations ranging from 0.01 to 0.21µg/g (Kuligowski & Halperin 1992). A study conducted on electric kettles in the Netherlands found that 10 of 26 kettles tested released more than 50 µg/L of nickel into water (Berg et al. 2000). An investigation of the impact of using stainless steel utensils in cooking found that their contribution to total nickel intake was negligible, but that new frying pans could contribute anywhere from 5% to 50% of the total dietary nickel intake during the first use (Flint & Packirisamy 1995; 1997). Nickel release during cooking with stainless steel utensils may be enhanced if the foods cooked are acidic (Christensen & Moller 1978). In addition to adventitious nickel from cookware, some food processing methods such as milling of flour and the catalytic hydrogenation of fats and oils using nickel catalysts may result in higher than average nickel concentrations in some foods (WHO 1991).
There was some concern that nickel-based samplers and skimming cones used in the ICP-MS analyses in the 2000, 2001 and 2002 Canadian Total Diet Studies, could have resulted in nickel contamination during analysis (Dabeka 2009). In order to resolve this, the results of the 2000, 2001 and 2002 Total Diet Study were compared to the results of the 1986 Total Diet Study. The food samples in the 1986 Total Diet Study were analysed using a different analytical analysis (graphic furnace atomic absorption spectroscopy) from the current analytical method (ICP-MS) where nickel contamination from skimmers and cones could potentially be introduced. The results of the 1986 study were slightly lower than the results of the 2000-2002 estimated daily intake values when appropriate age groups were compared but show the same trend of decreasing intake of nickel as the age groups increased. Considering that the results of the 1986 and 2000 to 2002 studies are very similar and show the same trend across all age groups, any nickel contamination that may have been introduced during the analyses of the food samples does not appear to have made a significant contribution of nickel to the food samples, therefore, the data from the 2000 to 2002 study are considered valid.
2.5.11 Infant Formula and Human Breast Milk
Nickel concentrations in infant formulas measured in the 2000-2002 Canadian Total Diet Study were typically below the method detection limits. For milk-based formula, nickel concentrations
17
were below detection limits that ranged from <18 ng/g to <67 ng/g while the average nickel concentrations in soy based formula were 306 ng/g in 2000, <67 ng/g in 2001 and 86 ng/g in 2002 (Dabeka 2004). The reported detection limits for nickel in infant formulas analysed in the 2000-2002 Canadian Total Diet Study do not appear to be adequately sensitive to obtain meaningful values to estimate daily dietary intake. However, nickel concentrations of 2.7 ng/g to 171 ng/g were detected in ready-to-use infant formulas available in Canada. Milk-based formula with added iron (n=27) and without added iron (n=6) contained mean (and median) nickel concentrations of 7.5 (7.4) ng/g and 5.7 (5.5) ng/g, respectively. Soy-based formula (n=16) contained higher concentrations of nickel with reported mean and median of 63.7 ng/g and 31.2 ng/g, respectively. The overall mean and median concentrations for ready-to-use formula were 24.9 ng/g and 7.6 ng/g, respectively (Dabeka 1989). Metals and other elements are generally found at higher concentrations in soy-based infant formulas in comparison to milk-based formulas (Ikem et al. 2002).
In a U.S. study of 13 healthy, well-nourished women, nickel concentrations in breast milk (n=46) ranged from 0.52 to 2.04 µg/L with an average concentration of 1.16±0.41 µg/L (Casey & Neville 1987). A median nickel concentration of 13.3 µg/L (range 11-16 µg/L) was reported in a study of human whole milk samples collected from six countries and analysed at three months post-partum (Parr et al. 1991), and mean and median nickel concentrations of 5.8 µg/L and 5.3 µg/L respectively, (range 3.7-10.7 µg/L) were detected in milk from Portuguese mothers (Almeida et al. 2008). In a Canadian study, breast milk was collected once a week for 8 weeks with a final sample collected at 3 months, from mothers living in Newfoundland. The milk samples were analysed for a range of elements using inductively coupled plasma-mass spectrometry. In 19 mothers with full-term infants, median nickel concentrations increased from 3µg/L, one week after birth to 28 µg/L after 12 weeks. Median concentrations in milk from 24 mothers with pre-term infants ranged from undetectable to 18 µg/L with no clear temporal trend (Friel et al. 1999). For the purpose of calculating an EDI (Appendix 10), a mean nickel concentration of 19.3μg/L for exclusively breast-fed infants was derived based on Friel et al. (1999 in HC 2011).
2.5.12 Consumer Products
Nickel is found in a variety of medical devices such as joint implants, intrauterine devices, and acupuncture needles. It is also found in products used in dentistry such as fixation devices and fixed and removable prostheses. Research indicates that nickel release from dental casting alloys into acidic salivary solutions can occur (Covington et al. 1985; Wolfaardt & Peters 1992) and that localised, high concentrations in air (25.9 µg/m3) can result from the grinding of such alloys (Rom et al. 1984). Various household products contain nickel, which was detected in 33 of 34 samples of different types of cleaning agents with a mean concentration range of 0.08 µg/g in bleaching agents to 19.17 µg/g in scouring powders (Nava et al. 1987); pigmented makeup products (Cha et al. 2010), including “play” makeup for children (Corazza et al. 2009), may contain nickel, as may lotions (Bocca et al. 2007) and other personal consumer products (although generally at concentrations below those thought to trigger allergic reactions) (Basketter et al. 1993). Mobile phones (Jensen et al. 2011), hand tools (Thyssen et al. 2011), children’s toys (Thyssen 2010), hair accessories (Thyssen et al. 2009) and other common household products (Thyssen et al. 2010) may also release nickel.
Mainstream smoke produced by five samples each of five brands of Canadian cigarettes (n=300) sampled from 1968 to 1988 contained from 0.21 to 0.74 µg of nickel per cigarette with a mean

18
concentration of 0.42 µg per cigarette. Levels of nickel present in side stream smoke were similar, ranging from 0.2 to 0.64 µg per cigarette with a mean of 0.35 µg per cigarette (Rickert 1991). Domestic cigarettes analysed in 2004, were found to contain a mean nickel concentration of 0.2504 µg/cigarette, while imported brands contained 0.8233 µg/cigarette (Hammond & O’Connor 2008). The imported cigarette brands were found to contain significantly higher nickel levels than those found in domestic brands, but no corresponding emissions data were available.
2.6 Existing Criteria and Guidelines Guidelines, criteria and standards for nickel in soil, surface water and groundwater from various jurisdictions in Canada and around the world are listed in Table 2 below.
Table 2. Existing environmental criteria and guidelines for nickel in various jurisdictions
Jurisdiction Category Criterion/Guideline Reference Canada Soil Quality Guideline (all land uses) 50 mg/kg (CCME 1999) Canada Water Quality Guideline (Aquatic Life) 0.025-0.15 mg/L (CCME 1999) Water Quality Guideline (Irrigation) 0.2 mg/L (CCME 1999) Water Quality Guideline (Livestock) 1.0 mg/L (CCME 1999)
Québec
Generic Soil Quality Criteria
(MEF 1998)
A (background concentrations and quantification limits for organics) 50 mg/kg B (maximum acceptable limit for residential, recreational, institutional and commercial (in residential area) land uses) 100 mg/kg C (Maximum acceptable limit for commercial (in non-residential areas) and industrial land uses) 500 mg/kg Groundwater - drinking water 20 μg/L Groundwater - seepage into surface water 260 μg/L
Alberta
Alberta Tier 1 Soil Remediation Guidelines (fine and coarse soils)
(AENV 2010)
Natural Area 50 mg/kg Agricultural 50 mg/kg Residential/Parkland 50 mg/kg Commercial 50 mg/kg Industrial 50 mg/kg
British Columbia
Soil remediation standards
(BCMOE 2011)
Agricultural 150 mg/kg Residential/Urban park 100 mg/kg Industrial/Commercial 500 mg/kg
Yukon
Generic Numerical Soil Standard
(YTDOE 2002)
Agricultural 150 mg/kg Park 100 mg/kg Residential 100 mg/kg Commercial 500 mg/kg Industrial 500 mg/kg
Ontario
Full Depth Background Site Condition Standards
(OMOE 2011b) Background values typical of uncontaminated soils, groundwater and sediments
Agricultural 37 mg/kg Residential/Parkland/Commercial/Industrial/Institutional 82 mg/kg Groundwater (all uses) 14 µg/L
Sediment 16 mg/kg

19
Jurisdiction Category Criterion/Guideline Reference
Ontario (continued)
Full Depth Generic Site Condition Standards in a Potable Ground Water Condition
(OMOE 2011b) *Standard in brackets applies to medium and fine textured soils
Agricultural (130 mg/kg)* 100
mg/kg
Residential/Parkland/Institutional Use (130 mg/kg)* 100
mg/kg
Industrial/Commercial/Community Property (340 mg/kg)* 270
mg/kg Groundwater (all uses) 100 μg/L Full Depth Generic Site Condition Standards in a Non-Potable Ground Water Condition
Residential/Parkland/Institutional Use (130 mg/kg)* 100
mg/kg
Industrial/Commercial/Community Property (340 mg/kg)* 270
mg/kg Groundwater (all uses) 490 μg/L
Stratified Site Condition Standards in a Potable Ground Water Condition Residential/Parkland/Institutional Property (subsurface soil) 510 mg/kg Commercial/Industrial/Community Property (subsurface soil) 510 mg/kg Stratified Site Condition Standards in a Non-Potable Ground Water Condition Residential/Parkland/Institutional Use (subsurface soil) 510 mg/kg Commercial/Industrial/Community Property (subsurface soil) 510 mg/kg
Denmark Soil Quality Guideline 10.0 mg/kg (DEPA 1995)
Netherlands
Environmental Quality Objectives
(MHSPE 1994)
Standard Soil Target Value 35 mg/kg Intervention Value 210 mg/kg

20
3 ENVIRONMENTAL FATE AND BEHAVIOUR Due to its use and release into the environment, nickel is distributed in the atmosphere, water, sediment, soils and biota worldwide. As an element, nickel cannot be degraded in the environment. As such, the fate of nickel is dependent on the many physicochemical and biological factors that influence cycling among biotic and abiotic components of the environment. The most important of these factors are pH and the presence and abundance of organic materials, hydroxides, clay minerals, cations and complexing ligands (NRCC 1981). Nickel has a high affinity for negatively charged surfaces associated with clay minerals, hydroxides, organic compounds and carbonates. Consequently, it tends to be removed rapidly from solution. Although surface soils and aquatic sediments may act as temporary sinks for nickel, changes in environmental conditions have the potential to remobilise and transport it to other compartments of the ecosystem. The following discussion is intended to provide an overview of the fate and persistence of nickel in the environment.
3.1 Atmosphere Nickel has a boiling point of 2913°C (Haynes 2011) and therefore, is not likely to volatilise. In Canada, most nickel entering the atmosphere is in particulate form and originates from from metal production activities (Jacques 1987). In Ontario, sampling in urban areas and areas influenced by a nickel source indicated nickel sulphate was the dominant species (57-85%), followed by nickel oxide and nickel hydroxide, which made up less than 20% of the nickel detected (OMOE 2011a). Atmospheric nickel originating from smelting operations and fossil fuel combustion is predominantly in the form of nickel sulphate, subsulphide and oxide (Henry & Knapp 1980; Gilman & Ruckerbauer 1962). Limited sampling of air filters and house dust in Sudbury, ON, indicated a small amount of nickel subsulphide (<10%) may be emitted from the Copper Cliff smelter (OMOE 2011a). Speciation of nickel compounds in Florida ambient air (PM10), using X-ray absorption fine structure (XAFS) spectroscopy and sequential extraction, showed NiSO4•xH2Owas much more abundant (78%) than oxidic nickel, possibly in the form of NiFe2O4 (22%) but lacked NiS (<5%) (Galbreath et al. 2003). Fuchjohann et al. (2001) speciated total suspended particulate samples from both urban and industrial sites in Dortmund, Germany using sequential extraction. Soluble and oxidic forms predominated (>84% of extractable nickel) followed by metallic and sulfidic fractions. Metallic nickel is believed to comprise only a small proportion of the total nickel present in ambient air in Canada (MacLatchy 1992). Nickel carbonyl is formed during metallurgical operations involving nickel and released in gaseous form (NRCC 1981); however, this volatile compound is of little concern in the environment since its half-life in air is less than 0.1 second (Stedman & Hikade 1980). The transport and distribution of nickel particulates is strongly influenced by particle diameter and meteorological conditions (Schmidt & Andren 1980). Anthropogenic nickel has been reported to enter the atmosphere in particulate matter in the 0.1-2 µm size range; naturally emitted nickel is typically found in larger particles, ranging from 2 to 10 µm (OMOE 2011a.; Beijer & Jernelov 1986). The residence time of nickel particles in the atmosphere was estimated to be 5 to 8 days for most nickel-containing particles of natural and anthropogenic origin (Schmidt & Andren 1980); however, the atmospheric half-life of small airborne nickel particulates (0.3-0.5 µm) can be as long as 30 days.

21
Nickel associated with fine particulate matter (<10 µm) is transported over long distances (Beijer & Jernelov 1986). The potential for long-range transport of nickel particles was demonstrated in the Norwegian Arctic where high atmospheric nickel concentrations were traced to emission sources in North America, Greenland and Europe (ATSDR 2005). Similar studies in the Canadian Arctic have demonstrated that 86% of the atmospheric nickel in Alert, NWT results from anthropogenic sources in Eurasia (INAC 2003).
Coagulation and condensation may occur as aerosols age and particles may be recaptured by micro- and mesoscale convection and become incorporated into the microstructure of clouds. Precipitation (including both wet and dry deposition) is expected to represent the most important environmental fate process for nickel released into the atmosphere (Schmidt & Andren 1980). Larger particles (>5µm) are removed by gravitational settling, while smaller particles are removed by wet and dry deposition processes with the importance of wet deposition (versus dry) increasing as particle size decreases (Schmidt & Andren 1980; ATSDR 2005). Nickel deposition rates measured in 1982 for southern, central and northern Ontario were 0.25, 0.28 and 0.18 mg/m2/year (dry deposition) and 0.5, 0.5 and 0.4 mg/m2/year (wet deposition). The atmospheric input of nickel into the Great Lakes was estimated (1993) to range from 160-590 ng Ni/m2/year; this pathway accounted for 60-80% of the total anthropogenic nickel input to Lake Superior, and 20-70% of nickel input in Lakes Erie and Ontario (ATSDR 2005). Rates of nickel deposition to sediments were found to be highest in spring and fall, and lower in summer and winter in studies conducted in the Lake Hertel area of Québec (Gelinas et al. 2000).
3.2 Water Nickel is naturally present in waters as a result of natural atmospheric and hydrological processes, but its distribution is largely influenced by anthropogenic sources (Brecher et al. 1989; WHO 1991). Nickel is known to enter the aquatic environment through atmospheric deposition (dry and wet), soil erosion, as well as in effluents and leachates. Nickel is relatively mobile and is transported in natural waters in both particulate and dissolved forms. Nickel adsorbs strongly to mineral surfaces (e.g., oxides and hydrous oxides of iron, manganese, and aluminum) which affects concentrations of nickel in water (ATSDR 2005). It has been reported that 95% of the nickel transported in the Yukon River was in suspended particulate form (Gibbs 1977); however, other reports suggest that relatively little nickel is present in suspended solids in most Canadian lake waters (Nriagu et al. 1982; Rossman & Barnes 1988). The nickel which is present in sediments and suspended solids is distributed among organic materials, precipitated and co-precipitated particle coatings, and crystalline particles. In natural waters, the divalent ion is generally the dominant form while nickel sulphate is the predominant soluble form if sulphate concentrations are high. Nickel sulphate can also be increased by disturbance of sediments through dredging or other activities (Richter 1980; Degtiareva & Elektorowica 2001).
The factors affecting the transport, fate and biological availability of nickel in fresh and salt water are the pH, oxidation-reduction potential, ionic strength, type and concentration of organic and inorganic ligands (in particular humic and fulvic acids) and the presence of solid surfaces for adsorption (in particular, hydrous iron and manganese oxides) (Callahan et al. 1979; Semkin 1975; Snodgrass 1980). Decreasing pH or increasing concentrations of organic ligands, may result in desorption of nickel from suspended particulate material or sediment into the water column in the divalent cation form (Callahan et al. 1979). The presence of reducing conditions, along with

22
sulphur in some sediments results in the formation of the relatively insoluble nickel sulphide (Ankley et al. 1991). Notably, under reducing conditions, microbial activity can play a role in nickel sulphide formation via the conversion of sulphate to sulphide (Babich & Stotzky 1983a; 1983b). When aerobic conditions exist and the pH is less than 9, soluble nickel compounds are formed with hydroxide carbonate, sulphate, and naturally occurring organic ligands, resulting in the presence of nickel in the water phase (Callahan et al. 1979).
3.3 Sediment Nickel in sediments and suspended solids can be distributed between various phases such as organic material, precipitated/coprecipitated particle coatings and crystalline particles. As an example, nickel distribution in the Yukon River has been documented to be 48% in particle coatings, 30% in crystalline particles and 15% associated with the organically-bound particulate material (Gibbs 1977).
The distribution is strongly affected by physical and chemical parameters such as pH, ionic strength, and the type and concentration of organic and inorganic compounds that can act as ligands or adsorbents for nickel (Callahan et al. 1979; Snodgrass 1980). Humic and fulvic acids as well as hydrous iron and manganese play an important role in adsorption processes. Changes in some physical and chemical parameters may result in desorption of nickel from particulate matter into the water column (DiToro et al. 1986). Microbial activity can alter the oxidation-reduction conditions of sediment and, under reducing conditions, insoluble nickel sulphide is formed in the presence of sulphur (Ankley et al. 1991).
3.4 Indoor Dust Rasmussen et al. (2008) reported that indoor dust and soil are geochemically distinct. Indoor dust has approximately five times the organic matter of soil samples. In studies of house dust, street dust and residential garden soils in Ottawa, ON, Rasmussen et al. (2001; 2008) showed that metals in house dust may accumulate at higher concentrations than in residential garden soil and can contribute significantly to exposure to metals in residential urban environments. Organic carbon is a key factor controlling metal partitioning and bioavailability. The higher metal concentrations in indoor dust compared to soils may be explained by the affinity some metals have for organic matter, in addition to the smaller particle size of dust (Rasmussen 2004).
3.5 Soil Natural nickel concentrations have been found to be correlated to aluminum and iron concentrations, as well as clay content, and negatively correlated with soil particles >20 µm (Echevarria et al. 2006). Nickel can be substituted for iron or magnesium in ferromagnesian and sulphide minerals (Massoura et al. 2006) and the binding of nickel to soil may result in the displacement of calcium, magnesium and sodium into soil solution (Ponizovsky et al. 2008).
Based on sequential extraction methods, the predominant forms of nickel in dust arising from soil are likely to be silicates and oxides (NRCC 1981). Generally, over 50% of the nickel in soils may be associated with the residual fraction (HF and HClO4 soluble), around 20% may be associated with the iron and manganese oxide fraction and most of the rest is bound up with the carbonate fraction (Hickey & Kittrick 1984) with only minimal amounts associated with the exchangeable and organic fractions (McGrath 1995). Nickel in contaminated soils has been found to occur
23
primarily in the precipitated and adsorbed or complexed forms as particulates, with very small amounts present in water-soluble form (Ma 1997; Cottenie et al. 1979). Nickel is generally strongly sorbed and chelated to soil surfaces (with Fe and Mn oxides, clays and organic matter) and may be occluded in oxides. In soil solution, nickel occurs mainly as organic or inorganic complexes, particularly NiCO3 at high pH (Ge et al. 2000). The organic fraction has been reported to assume more importance in sewage sludge amended soils, where sandy loam soil treated for seven years with composted sludge was reported to contain 23% nickel in the organic form, 41% in the sulphide/residual form and 34% in the carbonate form (Chang et al. 1984)..
The distribution of nickel in soil profiles can vary depending on the origin of the soil and pedogenic processes (McGrath 1995). The adsorption of nickel to soil is site-specific and is affected by pH, soil texture, bulk density, organic matter, clay minerals, hydroxides and groundwater flow (ATSDR 2005). The origin of the nickel may also have a role; naturally occurring nickel may be less bioavailable than nickel associated with anthropogenic sources (Echevarria et al. 2006). Nickel concentrations in surface and subsurface soils may be similar. However, numerous studies (Griffith et al. 1984; McKeague & Wolynetz 1980; Soon & Abboud 1990; Wall & Marsh. 1988) have indicated that surface A horizons, subjected to leaching by rain, can be nickel-depleted leading to lower concentrations in the A soil horizons than in relatively unweathered C horizons. The leached nickel accumulates in subsurface B horizon soils where it tends to sorb onto iron and manganese oxide and where it can substitute for magnesium in the lattice of soil clay minerals (NRCC 1981). Such processes tend to decrease the solubility and mobility of nickel resulting in less nickel reaching the ground water. These factors, however, only play a secondary role in nickel distribution between the solid and solution phases of soil (Anderson & Christensen 1988). The primary factor determining the distribution of nickel between the two phases is pH. Decreases in pH, specifically below 6.5, result in increased solubility and mobilisation of nickel and higher concentrations in the aqueous phase (Sunderman Jr. & Oskarsson 1988; Weng et al. 2003; ATSDR 2005). Notably, plant (and soil organisms) bioavailability is strongly favoured under such conditions of low pH (Bisessar 1989; Echevarria et al. 2006; Halstead et al. 1969). This pH effect is very pronounced in acid soils from the nickel-contaminated soils from the Sudbury region (McGrath 1995). Nickel mobility may also be affected by clay mineralogy, soil organic matter content, infiltration, and soil drainage (Hesterberg 1998).
On the basis of nickel concentrations in soils and estimates of the loss of nickel from continents, the residence time of nickel in soils was estimated to be about 3500 years (Nriagu 1980). Nickel rapidly adsorbs to soils and is desorbed very slowly; bioavailable nickel may be reduced more quickly than total nickel by processes such as uptake by plants and leaching, resulting in a lower proportion of bioavailable nickel in aged soils (Lee et al. 2001; Echevarria et al. 2006).

24
4 ESSENTIALITY
4.1 Microorganisms Microbes generally concentrate nickel from their growth medium, possibly via Mg2+ uptake pathways (Webb 1970). Nickel may also facilitate iron absorption or metabolism. Microorganisms which possess nickel-containing proteins appear to have evolved nickel homeostatic mechanisms (cited in Macomber & Hausinger 2011). Nickel is a cofactor or structural component of several microbial metalloenzymes including urease, [NiFe] hydrogenase, Ni-superoxide dismutase, acireductone dioxygenase, acetyl CoA synthase/decarbonylase, carbon monoxide dehydrogenase and methyl coenzyme M reductase (the latter three also critical in methanogenic archea) (Konhauser et al. 2009), as well as some forms of glyoxalase and glycerol-1-phosphate (cited in IOM 2001; Macomber & Hausinger 2011; Denkhaus & Salnikow 2002).
4.2 Terrestrial Plants Nickel is an essential element, or micronutrient in plants (Brown et al. 1987a; 1987c; Aller et al. 1990; Dixon et al. 1975; EU 2008; Salt et al. 2002; Eskew et al. 1983). Nickel is a known cofactor of urease in many plants and is essential for nitrogen metabolism, as well as proper germination in cereal grains: nickel deficiency may produce chlorosis and necrotic spots, reduce crop yields, disrupt iron metabolism and reduce urease activity (cited in Phipps et al. 2002). Foliar urea treatment of low-Ni soybean plants suffered leaf damage, which was alleviated with higher seed nickel and external nickel supply and resulted in significantly higher yields (Kutman et al. 2013). Nickel deficiency may be observed in urea-fed plants.
4.3 Terrestrial Invertebrates Nickel is considered potentially essential in invertebrates (as an enzyme cofactor and in nitrogen metabolism) (Hopkin 1989), but has been proven essential in only a few species (e.g., ground beetles) (Bednarska & Laskowski 2008). There are no data regarding the required nickel intake for invertebrates (cited in Phipps et al. 2002 and EU 2008).
4.4 Mammals and Birds Nickel is thought to be an ultratrace essential element in several animal species (Phipps et al. 2002; Nielsen & Sandstead 1974; Mertz 1979; Arpasova et al. 2007; Apostoli et al. 2006; Anke et al. 1984; Adriano 2001). The dietary requirements to prevent nickel deficiency appear to be quite variable, but have been estimated for some species, including rats and chicks (50 μg/kg diet), monogastric mammals (over 50 μg/kg diet; minipigs 100 μg/kg diet), and ruminants (over 110 μg/kg diet) (cited in Phipps et al. 2002). Nickel deficiency generally does not occur naturally in mammals and birds. Nickel is thought to act as an enzyme cofactor/activator in animals. In animals fed nickel-depleted diets, adverse effects include depressed growth, reproductive performance and plasma glucose, altered distribution and function of other divalent cations, such as iron, copper, calcium and zinc (Spears 1984; Annora et al. 2009), changes in pigmentation, reduced hematocrit and liver abnormalities (Stangl & Kirchgessner 1996) (and cited in Phipps et al. 2002 and ATSDR 2005). Nickel is suspected to interact with folate or vitamin B12 in the metabolism of methionine

25
(Uthus 1997). Nickel depletion also impaired glucose metabolism and reduced specific activities of many enzymes involved in carbohydrate and amino acid metabolism (cited in Nielsen 1991).
However, depletion of dietary nickel may also have expended or impaired intestinal absorption of iron and other metals, as evidenced by reduced hepatic iron, copper and zinc concentrations in the nickel-depleted animals. The alterations in serum and hepatic lipid profiles in nickel-depleted animals (Stangl & Kirchgessner 1996) were similar to those occurring in animals fed a moderately iron-deficient diet. Some of the hematological effects of nickel may also have been pharmacologic, rather than physiological (Nielsen et al. 1984). It is also possible nickel may not be strictly essential in animals (or humans), but may instead be required for normal development of the gastrointestinal microflora (Denkhaus & Salnikow 2002).
4.5 Humans There is considerable debate as to the essentiality of nickel as a dietary trace mineral in humans. Extrapolation from animal data led some researchers to conclude nickel likewise serves an essential function in humans (Anke et al. 1984; Nielsen & Sandstead 1974). However, there have been no studies assessing the essentiality of nickel in humans and no deficiency symptoms have been described (Anke et al. 1995), nor has a biochemical function been clearly demonstrated in higher animals or humans (Uthus & Seaborn 1996). The Institute of Medicine (IOM) concluded there is no clear biological function in humans and provides no daily recommended intakes for nickel (IOM 2001).

26
5 BEHAVIOUR AND EFFECTS IN BIOTA The available information on the toxicological effects of nickel on soil microbial processes, terrestrial plants and invertebrates, as well as mammals and birds has been reviewed and summarised in this chapter in support of the derivation of environmental soil quality guidelines. This information has been tabulated in Appendices 2 to 6.
One way to assess the potential hazards of nickel-contaminated soils to terrestrial organisms is to examine effects-based toxicity studies. The LOEC endpoints reported in the toxicity tables represent the lowest-observed-effects concentration at which there was a statistically significant difference from controls, as reported by the author(s) (biological significance was determined during guideline derivation before inclusion to the data-set used to derive the guideline). If the author(s) reported no such statistical tests, the percentage of adverse effects, as compared to the controls, resulting from nickel concentrations within the soil will be calculated by CCME from the data presented by the author(s). This percentage of adverse effect is represented by an EC (effects concentration) endpoint in the toxicity appendices. Actual ECx endpoints reported by the author(s), such as EC50 or EC25, will be presented as such without any calculation of a percentage of adverse effect. Measured concentrations and metal extraction methods are reported in the toxicity tables only if they involve a strong acid, such as HCl or HNO3; otherwise, the nominal concentrations are reported.
Plants and animals may accumulate contaminants over time if the amount to which they are directly exposed is greater than the amount they can eliminate through excretion and metabolic activity (Noble 1990). The transfer of contaminants directly from a medium to an organism is termed bioconcentration. The process by which contaminants are taken up by terrestrial and aquatic organisms directly from the medium and through consuming contaminated food is referred to as bioaccumulation (CCME 2006). The bioconcentration factor (BCF) is the ratio of a substance's concentration in an organism to its concentration in ambient water, soil, sediment, or air (Connell 1990). Most studies in the scientific literature do not directly state BCFs, but report concentrations in organisms and in soil separately.
5.1 Soil microbial processes Microorganisms are a critical part of most terrestrial ecosystems. Heavy metals affect microbial growth and survival if they are present in relatively high concentrations (Bååth 1989). Changes to the structure and function of microorganism populations may have adverse effects on the functioning of the ecosystem. The toxicity of nickel to microorganisms in soil varies among a variety of soil types. The addition of clay minerals (montmorillonite, kaolinite) in soil can reduce the toxicity to fungi (Babich & Stotzky 1982). Enhancement of clay content in soil increases its cation exchange capacity (CEC), and then protects against nickel toxicity. In a study investigating nickel toxicity in five Dutch soil types, inhibition of respiration rate was greatest in the sandy soil and least in the clay soil (Doelman & Haanstra 1984). Similarly, toxicity thresholds for soil microbial processes including nitrification, glucose-induced respiration and carbon mineralisation were found to be increased in soils with higher CEC and clay content (Oorts et al. 2006). Increasing soil pH was also reported to decrease the toxicity of nickel to several microorganisms such as eurobacteria, actinomycetes, yeasts and fungi (Babich and Stotzky 1982). The toxicity of nickel to carbon mineralisation and nitrification in soil is also lower in alkaline than acidic soil (Giashuddin & Cornfield 1979). Doelman and Haanstra (1984)

27
have reported that pH is the main abiotic factor controlling the effects of nickel on soil microbial respiration. Aging of soils and leaching have both been found to reduce the toxicity of nickel to microbial processes, and toxicity tests conducted using freshly spiked soils may therefore overestimate toxicity when compared to typical contaminated sites (Oorts et al. 2007).
A summary of the available toxicological information of the effects of nickel to microorganisms and microbial toxicity studies consulted or selected for use in soil quality guidelines derivation are presented in Appendix 2. The toxic level of nickel for microorganisms and microbial processes is highly variable. In at least some cases the toxicity may be a function of the free Ni2+ concentration rather than the total nickel concentration (Hu et al. 2002), although other studies have found that toxicity could not be predicted by nickel speciation (Van Nostrand et al. 2005). Effect concentrations for soil microbial processes ranged from 10 to more than 2000 mg/kg (Appendix 2).
The addition of nickel to soil (as NiCl2) of 294 mg Ni/kg reduced nitrification and nitrogen mineralisation by 17% (Liang & Tabatabai 1978; 1977). A nickel concentration of 1000 mg/kg reduced nitrogen mineralisation by 36% and nitrification by 68% (Giashuddin & Cornfield 1978).
In a study of various fungi, the growth and survival of Aspergillus flavus and Gliocladium sp. were reduced after a three-day exposure to 250 mg/kg of NiCl2 in an acidic (pH 4.7) soil (Babich & Stotzky 1982). The most sensitive species in this study was Aspergillus clavatus which showed reduced growth when exposed to a nickel concentration of 50 mg/kg.
In studies assessing the effects of nickel on phosphatase and urease activities in various types of soil, nickel was much less toxic in sand, with EC50 values of 1109 and 100 mg/kg, respectively, for phosphatase and urease activities; higher EC50 values after 18 months than after 6 weeks (Doelman & Haanstra 1989; 1986). This reduction in toxicity with time may be due to an ability of some microorganisms to adapt (Cornfield 1977). An additional explanation may be a slow binding of nickel to certain types of soil.
Sensitivity of other enzymatic activities, such as arylsulphate and pyrophosphatase to nickel has been demonstrated. Addition of 1468 mg Ni/kg decreased arylsulphate and pyrophosphatase activities by 26% and 5%, respectively (Al-Khafaji & Tabatabai 1979; Scott et al. 1985).
Carbon mineralisation was also affected by addition of nickel to soils. Carbon mineralisation decreased after a 2 to 6 week exposure to 10 mg Ni/kg of NiSO4 (the lowest exposure concentration tested) in sandy soil (Cornfield 1977). Carbon mineralisation was reduced 55% at nickel concentration as low as 6.6 mg/kg in a sandy loam with unreported pH (Brookes & McGrath 1984). In contrast, only a 24% reduction in carbon mineralisation was reported at soil nickel concentrations as high as 1000 mg/kg (Bhuiya 1972). In a study on effects of several metals (such as Ni) from a Cu-Zn smelter in Québec, soil respiration was suggested to be a better indicator than phosphatase activity in assessing metal stresses to soil microbial populations (Dumonet et al. 1992).

28
5.2 Terrestrial Plants
5.2.1 Metabolic fate and behaviour
Nickel is an essential trace element in plants, used in various coenzymes and regulatory functions (Salt et al. 2002). Good correlations were reported between concentrations of nickel in terrestrial plants and those in numerous Canadian soils (Rencz 1980; Elmosly & Abdel-Sabour 1997; Cataldo et al. 1978; Aschmann & Zasoski 1987). Availability of nickel to plants is largely controlled by various soil factors such as pH, organic matter content, clay and hydrous iron and manganese oxide content, and cation exchange capacity (Haq et al. 1980; Richter 1980) with soil pH being of particular importance. Low soil pH (≤6.0) strongly favours the bioavailability of nickel (Halstead et al. 1969; Bisessar 1989). At low pH, acid-soluble nickel compounds are unstable and the capacity of soil to remove nickel from pore water through adsorption is low. The chemical species of nickel does not appear to be a major factor in predicting plant uptake. Nickel uptake was higher in freshly added salt solutions, compared to field studies, at lower concentrations and lower uptake at higher nickel concentrations, possibly due to toxicity; however, nickel plant concentrations from salt solutions were within the 95% prediction interval of field data regressions (Efroymson et al. 2004).
A number of methods have been proposed for the evaluation of nickel availability from soil to plants. Correlations between metal content in plants and extractable nickel in soils using different extractants showed that 0.1 M HCl is the best selective extraction method to estimate the plant-availability of nickel (Qian et al. 1996). Other studies have suggested that extraction with diethylenetriaminepentaacetic acid (DTPA) and 0.01 M Sr(NO3)2 can be used to estimate the available nickel concentration (Kukier & Chaney 2001). Menzies et al. (2007) analyzed results from the literature for the effectiveness of various extractants in predicting availability of metals to plants and concluded that neutral salt extractants (e.g., CaCl2) provided the most reliable estimate of phytoavailability (compared to total concentration, acid extractant, and complexing reagents) for a variety of metals; however, for nickel only results for DTPA and CaCl2 extraction were presented. A study of soils from inactive railway yards in Montréal found that plant uptake could not be predicted by any of the free, total dissolved or total soil concentrations (Ge et al. 2000).
Accumulation of nickel in plants is not only influenced by soil properties, accumulation is also dependent on the plant species (Appendix 7). The amount of nickel accumulation appears to be affected by xylem transport rates and the accumulation of organic acids in plants (Yang et al. 1997). Some plant species, termed hyperaccumulators, may contain more than 1000 mg Ni/kg (Greger 1999; Brooks 1980; Adriano 2001). Nickel hyperaccumulators with foliar nickel concentrations above 10000 mg/kg, and annual removal rates of 100-400 kg Ni/ha, may provide significant remediation over time. Environment Canada’s PHYTOREM database identifies plants which have demonstrated the ability to tolerate, accumulate, or hyperaccumulate for a range of metals (EC 2003b). Nickel accumulation can also be affected by the life stage of the plant and varies between different parts of the plant; a study conducted using oats found that nickel concentrations increased during initial growth stages then subsequently decreased and that concentrations were higher in the grain than the straw (Poulik 1997).

29
Although some plant species can bioconcentrate nickel to higher levels than in the soil, most plants have bioconcentration factors of less than 1 (Torres & Johnson 2001a; 2001b; Gratton et al. 2000; Efroymson et al. 2004) (see Appendix 7 for soil-to-plant bioconcentration factors).
5.2.2 Toxicity
Although nickel is essential for plant growth (Aller et al. 1990; Brown et al. 1987a; 1987b; Salt et al. 2002; Dixon et al. 1975), relatively high concentrations of nickel can have adverse effects on plants. Appendix 3 summarises the toxicological effects of nickel on plants, listing studies that were used for guideline derivation and those consulted but not used in guideline derivation.
Several authors have reported that nickel can affect the iron status of plants (Adriano 2001; Khalid & Tinsley 1980). Toxicity may also be caused by nickel accumulating in cell cytoplasm and binding to cell components; nickel-tolerant plants are capable of flushing nickel from the cytoplasm to vacuoles (Salt et al. 2002). But most nickel tolerant plants actually exclude nickel by not absorbing nickel into the roots, or not translocating it to the shoots. Only a small fraction of nickel tolerant plants are accumulators or hyperaccumulators of nickel. General signs of nickel phytotoxicity are reduced growth of roots and shoots, poor branching, deformation of various plant parts, decreased yield, leaf spotting, abnormal flower shape, mitotic root tip disturbance, germination inhibition and chlorosis (McIlveen & Negusanti 1993; Rauser 1978). Effect levels are normally below 80 mg/kg dw of plant, but effects have been reported in tolerant plants containing up to 1000 mg/kg dw tissues (Kabata-Pendias & Pendias 1984; Cox & Hutchinson 1981; Brooks 1980). Symptoms of injury were observed for a variety of vegetables containing as little as 15 to 95 mg Ni/kg in plant tops (Frank et al. 1982). Generally, the degree of toxic effect on plants is a function of nickel concentrations in their tissues. For example, inhibition of photosynthesis and transpiration in sunflowers depends on the nickel concentration in leaves and the exposure period (Bazzaz et al. 1974).
Nickel toxicity to plants can be significantly affected by soil pH, with lower pH resulting in higher toxicity (Weng et al. 2004). This is believed to be primarily due to the higher bioavailability at lower pH. The use of limestone to raise the soil pH has been found to reduce nickel toxicity; the addition of hydrous ferric oxide has been found to be less effective and crop-specific (Kukier & Chaney 2001; Everhart et al. 2006). The opposite effect has been observed in toxicity tests using nutrient solutions instead of soils, with higher toxicity observed with increasing pH; this is believed to be because high pH increases binding to the soil (decreases toxicity), but also increases bioaccumulation (Weng et al. 2003); therefore, studies conducted using nutrient solutions, which lack soil binding processes, may not be representative of toxicity in soil. In studies investigating the relationship between soil properties (in 16-17 different soils) and nickel toxicity, soil pH has been observed to be the single best predictor of toxicity (Li et al. 2011), as well as cation exchange capacity (Rooney et al. 2007).
Some studies have shown that soil texture also affects nickel phytotoxicity; for example, clover was found to be more nickel-tolerant in fine soils than coarse soils (Elmosly & Abdel-Sabour 1997). Toxicity may also be affected by soil nutrients; for example, one study found that nickel was less toxic to sunflowers if both nitrate and ammonium were supplied than if only nitrate was supplied (Zornoza et al. 1999).
Studies on the effects of dissolved nickel on plants grown in nutrient or sand cultures indicated that effect levels are typically in the range of 2 to 15 mg Ni/L in solution (Whitby & Hutchinson

30
1974; Vesper & Weidensaul 1978; Vergnano & Hunter 1952; Davis et al. 1978). These concentrations in solution can correspond to critical levels of 4 to 26 mg Ni/kg dw in barley tissues (Davis et al. 1978). Nickel toxicity in terrestrial plants depends on the plant species: the radicle lengths of various plants grown in hydroponic solutions showed the following order of sensitivity to nickel: turnip > lettuce > cabbage > wheat = radish > millet (Carlson et al. 1991). A concentration of 2 mg/L reduced lettuce radicle lengths by 59%. A study of the effects of nickel on four different tree species resulted in similar effect levels. The authors reported retarded growth and development of trees grown in solution containing 2 mg/L (Heale & Ormrod 1982). However, results from plants grown on filter paper may not be relevant to properly assess the phytotoxicity of nickel in soil. Nickel-mediated effects of on radicle growth of selected woody species germinated on paper filters occur at concentrations ranging from 1 to 5 mg/L, 100 times lower than those in organic soils producing similar effects (Patterson & Olson 1982).
Tolerance to nickel in soils has been documented for a variety of plants that grow in ultramafic (serpentine) soils and mine waste (Verkleij 1990). Many of these species are tolerant by reduced nickel uptake. However, other plant species hyperaccumulate nickel (Baker & Brooks 1989) and avoid toxicity by sequestration of nickel ions as the citrate complex (Shier 1994). In some cases, the presence of these hyperaccumulating plants is a result of adaptation mechanisms allowing them to grow on highly contaminated soils.
As indicated above, various soil properties have shown an influence on nickel toxicity and in some cases these relationships have been described using statistical models where soil parameter(s) have demonstrated to be reliable predictors of toxicity. However, currently the soil protocol (CCME 2006) does not provide a method for incorporating known factors that influence toxicity in the derivation process for generic soil quality guidelines. Assessing the influence of soil properties on the risk of adverse effects to organisms should be evaluated using a ecological risk assessment. For guidance on developing site-specific remediation objectives incorporating toxicity-modifying environmental factors, please consult A Protocol for the Derivation of Water Quality Guidelines for the Protection of Aquatic Life 2007 (CCME 2007), and the Canadian water quality guideline for the protection of aquatic life for cadmium.
5.3 Terrestrial Invertebrates
5.3.1 Metabolic fate and behaviour
Many studies have indicated that uptake and accumulation of nickel by earthworms occurs in contaminated soils, but only to a limited extent (Gish & Christensen 1973; Ma 1982; Neuhauser et al. 1985). Generally, concentrations in the animal increase with increasing ambient soil concentration, but concentration factors were often found to be much lower than 1. A study of earthworms in 20 Dutch field soils found bioconcentration factors ranging from 0.07 to 1.2, with the nickel concentration in earthworms correlated with both the total soil concentration and the total pore water concentration (Janssen et al. 1997). Arthropods from a wetland with elevated nickel were found to have nickel concentrations approximately two orders of magnitude lower than the soil concentrations (Torres & Johnson 2001a). In a field study, Ma (1982) demonstrated that soil pH and CEC both affected nickel uptake in earthworms. Significant negative correlations were found between the concentration factor of heavy metals and these two soil properties. Reduction of pH and CEC led to increased desorption of metal cations and higher nickel concentrations in pore water. After a literature review of concentrations in earthworm,

31
isopod, and beetle species, and concentrations in soil, a soil-to-invertebrate BCF of 0.30 (range=0.06-2.4) has been estimated (Appendix 7).
Bioaccumulation in earthworms may be a considerable threat to those organisms feeding on earthworms (e.g., robins). Studies have shown that earthworms accumulate nickel from soil or litter (Pietz et al. 1984; Neuhauser et al. 1985; Ma 1982; Gish & Christensen 1973), but no studies have shown that birds have been poisoned by feeding on contaminated earthworms.
5.3.2 Toxicity
Nickel is considered to be essential to terrestrial invertebrates (Hopkin 1989), but the level of nickel required to maintain normal function is not known. However, relatively high concentrations in soils may result in toxicity symptoms for invertebrates. Appendix 4 summarises the collected toxicological studies available for terrestrial invertebrates, listing studies that were used for guideline derivation, and those consulted but not used in guideline derivation. The principal terrestrial invertebrate used to investigate nickel toxicity has been the earthworm since it is one of the largest and most easily obtained organisms of the soil biota. Effect levels ranged from 20 to 40 000 mg/kg for two earthworm species (Eisenia foetida and Lumbricus rubellus). An LC50 value of 243 mg Ni/kg soil was estimated for Eisenia foetida in an artificial soil (Neuhauser et al. 1985). Using the same test (growth rate) and the same organism (Eisenia foetida), effects of nickel acetate, nickel carbonate, nickel chloride, nickel nitrate and nickel sulphate were reported to occur at concentrations ranging between 200 and 500 mg/kg while an effect level for nickel oxide, the least soluble, was as high as 40 000 mg/kg (Malecki et al. 1982). Using a contact test (filter paper), Neuhauser et al. (1985) found similar results indicating that each of the soluble nickel salts tested (acetate, chloride, nitrate and sulphate) was not significantly different from any of the others. This contrasts with nematodes, for which nickel chloride has been observed to be more toxic than nickel nitrate (Peredney & Williams 2000a).
The toxicity of soil nickel to earthworms also depends on the influence of soil factors determining the bioavailability of that metal to earthworms. Factors influencing bioaccumulation of nickel in the terrestrial biota are discussed in Section 4.4 below. Ma (1982) documented that concentration factors of heavy metals in earthworms were negatively correlated with the soil pH and cation exchange capacity (CEC).
5.4 Vertebrates, Birds and Other Wildlife
5.4.1 Toxicokinetics
Mammals and birds are capable of accumulating nickel, and dietary exposure is probably the most important route under most circumstances. Upon ingestion, the absorption of nickel is influenced by many factors including solubility of the nickel compound, dose, age and diet. Absorption often results in relatively low bioaccumulation factors (BAF = [nickel] in bird or mammal tissues/[nickel] in diet). Studies in rats, dogs and mice indicate that only 1 to 10% of orally-administered nickel (Ni, NiCl2 and NiSO4) is absorbed by the gastrointestinal tract from diet or drinking water (Ho & Furst 1973; Schroeder et al. 1974; Ambrose et al. 1976). The low potential for bioaccumulation of nickel by avian species has been confirmed by results of monitoring programs conducted in the field. For example, a field study showed reduced

32
accumulation of nickel in terrestrial wild birds and noted concentrations in body tissues of ruffed grouse (Bonasa umbellus) living near Sudbury, ON were 10 times lower than those in dietary items of grouse collected in contaminated areas (Rose & Parker 1983).
Numerous studies on rats (Whanger 1973), ducks (Cain & Pafford 1981), livestock (O’Dell et al. 1971; Spears et al. 1986), and wild mammals and birds (Rose & Parker 1983; Outridge & Scheuhammer 1993) have indicated that after nickel is absorbed and distributed in the body, it accumulates to a high extent in the kidney of animals and birds. However, no accumulation of nickel in any tissues was observed in rats exposed to 5 mg/L in drinking water (Schroeder et al. 1974).
Animals have a high capability to eliminate absorbed nickel. The majority of nickel that is absorbed by animals is eliminated in urine (Angerer & Lehnert 1990; Elias et al.1989; Ghezzi et al. 1989; Hassler et al. 1983; Torjussen & Andersen 1979). Faeces appear to be the most important routes of elimination for unabsorbed nickel, such as nickel oxide and nickel subsulphide (ATSDR 2005). Tedeschi and Sunderman (1957) noted that dogs excreted 90% of ingested nickel in faeces and 10% in urine.
Biomagnification of bioaccumulated chemicals occurs when the concentration of the chemical increases as the chemical passes up through two or more trophic levels, resulting in an efficient transfer of chemicals from food to consumer (CCREM 1987). No avian or mammalian species are known to biomagnify nickel in the environment. Studies comparing nickel concentrations in wildlife and their food reported that concentrations were either similar in different trophic levels or even declined with increasing trophic level (Beyer & Miller 1990; Scanlon 1987). Similarly, nickel concentrations measured in mouse carcasses from a wetland were less than the detection limit of 0.6 mg/kg, despite higher nickel concentrations being measured in food sources (Torres & Johnson 2001a); concentrations were also much lower than those predicted using published bioaccumulation models (Torres & Johnson 2001b).
Further information on the biomagnification of nickel, as well as exposure of biota to nickel and nickel toxicokinetics, aas elimination rates, ingestion and exposure of nickel to biota are required to more accurately model the behaviour of nickel through food webs. However, the low concentration factors strongly indicate that biomagnification does not present a problem for nickel in the lower food chain.
5.4.2 Toxicity
Avian toxicity studies selected for use in soil quality guidelines derivation are presented in Appendix 6. Only a few studies on the toxicity of nickel to livestock and no studies with wildlife, except rats, mice and mallards, were available. The results of controlled acute toxicity studies have demonstrated that nickel is moderately toxic to mammals and birds. The toxic level of nickel for these terrestrial vertebrates is highly variable. Doses associated with harmful effects in laboratory animals, livestock and mallards ranged from 500 to 2500 mg/kg (administered in food) (see Appendices 5 and 6).
According to studies of Ambrose et al. (1976) and Weber and Reid (1969), female mammals appeared to be less sensitive to nickel than males. Doses with observed effects on growth of rats (Wistar) were 125 and 50 mg Ni/kg bw per day for females and males, respectively (Ambrose et
33
al. 1976). Similarly, Weber and Reid (1969) who studied growth and feed uptake in mice (Webster) reported higher effect levels for females than those for males.
Several authors have investigated the effects of nickel on reproduction and development in terrestrial mammals (Appendix 5). Changes to sperm quality in laboratory animals have been reported (ATSDR 2005). Generally, the reproduction performance is only slightly affected by oral nickel exposure. Ambrose et al. (1976) studied three generations of rats and did not observe any adverse effects on fertility, gestation, viability and lactation in rats exposed to diets containing 1000 mg Ni/kg. Studies on the effects of nickel on growth of several mammals indicated highly toxic levels. For example, effects on growth were observed in mice exposed to a daily dose of 1600 mg Ni/kg body weight (Weber and Reid 1969). Growth rate of rats and dogs significantly decreased at similar nickel concentrations (1000 to 2500 mg/kg) in the diet (Ambrose et al. 1976).
According to the available toxicity data, terrestrial birds appear to be less sensitive to nickel than terrestrial mammals. Adult mallards (Anas platyrhynchos) ingesting diets containing 800 mg Ni/kg bw for 90 days exhibited no observable effects on the following endpoints: body weight, histological changes in liver and kidney and changes in blood chemistry (Eastin Jr. & O’Shea 1981). Even reproductive endpoints (egg laying, hatchability and hatchling survival) were unaffected at such nickel levels in the diet. However, newly-hatched mallard ducklings were more sensitive to nickel and presented symptoms when exposed to diet levels of 1200 mg Ni/kg (Cain & Pafford 1981). Newly hatched chickens (Gallinus domesticus) had significantly slower growth rates when maintained on diets containing 300 mg Ni/kg (Ling & Leach 1979). The form of ingested nickel was reported to be independent of effect levels. Decreased growth rates in chicks fed diets containing nickel have been reported, but no significant difference between the two forms (sulphate and acetate) of ingested nickel were noted (Weber & Reid 1968). Nickel and its inorganic compounds do not appear to be carcinogenic to animals when orally administered, but the data are still uncertain because of the limited number of studies. In chronic oral studies (e.g., Schroeder & Mitchener 1975), absorption of nickel acetate dissolved in drinking water at 5 mg/L did not result in increased tumour incidences throughout the lifetime of mice. Similar results were observed with rats fed nickel sulphate at 2500 mg Ni/kg diet for 2 years (Ambrose et al. 1976). On the other hand, many studies have tested nickel for carcinogenicity in animals by injection (Sunderman & Horak 1981). For example, Sunderman (1984) reported nickel carcinogenic activity and found metastases in rats receiving a single injection of 14 mg Ni per rat.
Limited information exists on the effects of nickel on mammalian immune systems. Dieter et al. (1988) studied immunologic responses in mice exposed to nickel sulphate in drinking water. The authors noted several immune function responses such as changes in spleen cellularity and natural killer cell (NK) activity. However, nickel concentrations in the drinking water were very high (1 to 10 g/L) and probably not comparable to assess standard contaminated environments.
34
6 BEHAVIOUR AND EFFECTS IN HUMANS AND EXPERIMENTAL ANIMALS The toxicological review of nickel is focused on NiSO4, NiCl2, NiO and Ni3S2, which are the predominant forms of nickel in the environment and in contaminated soils. Nickel carbonyl (Ni(CO)4), for which exposure is primarily occupational, will be addressed only briefly.
6.1 Overview The mammalian toxicology of nickel has been recently reviewed by various health agencies that include the Agency for Toxic Substances and Disease Registry (ATSDR 2005), the US Environmental Protection Agency (US EPA 1996), the Institute of Medicine (IOM 2001), the Office of Environmental Health Hazard Assessment (OEHHA 2012), the Texas Commission on Environmental Quality (TCEQ 2011), the International Agency for Research on Cancer (IARC 2011), and the World Health Organization (2007). In addition, Health Canada (1996) completed a human health based toxicological review of the various species of nickel.
It is not the role or the intent of this document to comprehensively re-evaluate the mammalian toxicology of nickel. Such reviews have been carried out by agencies responsible for protecting human health in Canada and other jurisdictions, as noted above. Accordingly, the sections below briefly describe the key studies that have been completed on nickel and that have been used for the development of toxicological reference values (TRVs) for nickel, and present recommendations for the TRVs that are most appropriate for the development of SQGs.
6.2 Classification Both cancer and non-cancer endpoints are significant in the toxicological evaluation of nickel. Health Canada (1996) classifies oxidic, sulphidic and soluble nickel as Group I carcinogens (carcinogenic to humans) via inhalation. This classification is specific to these forms of nickel via the inhalation route. US EPA (1996) classifies nickel refinery dust (most of which is considered to be nickel subsulphide) as a Class A carcinogen (carcinogenic to humans) based on human data where lung and nasal tumours were elevated in workers exposed to nickel refinery dust and on animal data in which carcinomas were produced in rats by inhalation and injection (e.g., Sunderman 1984; Sunderman & Horak 1981).
Considering the relevant environmental exposure pathways, the relative toxicities of different salts, and the toxicological data available, it was determined that the toxicological reference values (TRVs) for nickel should be based on nickel sulphate (for oral exposures) and nickel sulphate/oxide (for inhalation exposures). In development of TRVs for the inhalation route, it was found that the non-cancer endpoint for inhalation of nickel sulphate/oxide was not necessarily protective of cancer risks. Consequently, the SQG have been developed for protection of both non-cancer and cancer endpoints (section 6.9).
6.3 Bioaccessibility of nickel The selection of an appropriate estimate of nickel bioaccessibility in soil and dust is complicated by the variety of in vitro methods used (Saikat et al. 2007), none of which are able to fully mimic in vivo processes. Particle size fractionation and nickel speciation may also affect results.
The choice of the solvent phase used to assess nickel bioaccessibility may influence the results significantly. In physiologically based extraction test (PBET) assays using soils from Torino,

35
Italy, more nickel was extracted in the second phase, likely due to the high affinity of nickel for the glycine in the extraction solution, and suggesting the intestine may play a significant role in nickel solubilisation (Poggio et al. 2009). However this effect does not appear to be consistent for all PBET assays. When testing pure nickel compounds, Ni2+ release in synthetic gastric juice was much greater than in synthetic intestinal fluid, even for water-soluble substances (Henderson et al. 2012). In dust samples from seven English homes, the mean (±SD) nickel bioaccessibility in the gastric phase of the PBET was ≈18±15%, and ≈15±10% in the intestinal phase (Turner & Ip 2007). More nickel was dissolved in simulated lung fluid soil in 1 hr than in two weak leach (salt) solutions in 3 hr. The authors speculated that the organic components (amino acids in the simulated lung fluid) act as weak chelating agents, dissolving compounds otherwise insoluble in aqueous solutions (Drysdale et al. 2011). However, studies assessing dissolution of commercially available powdered nickel compounds in various solutions concluded deionised water produces more representative results than synthetic lung fluids (containing citrate and acetate, but no amino acids) (Oller et al. 2009).
The dominant nickel species present in the soil may also modify bioaccessibility. In studies using pure nickel compounds, water-soluble forms of nickel (NiSO4, NiCl2, Ni(CH3COO)2, Ni(SO3N2)2 and NiF2) and nickel hydroxycarbonate were all nearly completely dissolved in simulated gastric fluid (0.07 N HCl) within 2 hr. In contrast, Ni2+ released from the water soluble substances in intestinal fluid (neutral pH, without glycine or amino acids) ranged from 29-78% after 72 hr, and nickel hydroxycarbonate released only 1.35% of available nickel. The gastric bioaccessibility of sparingly- or insoluble (green or black) oxidic and sulfidic nickel compounds did not exceed 30% of available nickel within the first few hours and. The most refractory of these materials, green NiO, released essentially no available nickel. No appreciable nickel release was measured in neutral intestinal fluid (all <1%) (Henderson et al. 2012).
Soil particle size fractionation may also affect bioaccessibility. Several studies indicate that bioaccessibility is higher in the smaller soil size fractions (<2µm) than the larger size fractions (15-53% vs. 8-14% (Drysdale et al. 2011); 58% vs. 43% (Rasmussen 2004; 2008)). In a Spanish study of urban soils from Torino and Sevilla, nickel bioaccessibility (Simple Bioacessibility Extraction Test; SBET) for whole soils ranged from 8 to 14%, but was highest (15-53%) in the <2 µm fraction. Sevilla soils, in contrast, had lower bioaccessibility (18-58%) in the <2 µm fraction than in whole soil (34-86%), and the 2-10 µm fraction had the highest values (46-83%) (Madrid et al. 2008).
The US Geological Survey and the Geological Survey of Canada sampled soils at approximately 40 km intervals along north-south and east-west transects across the two countries to examine variations in bioaccessibility of various metals in unpolluted soils. Two size fractions (<2 mm and <250 mm) were extracted and analysed using a low pH in vitro PBET test to simulate the gastric phase of digestion. No difference was observed in bioaccessibility values for nickel between the two size fractions. The observed range for the <2 mm fraction is 3-30.6% (median 15%) and that of the <250 mm size fraction is 3.6-34.1% (median 14%) (Moman et al. 2009).
Organic matter content of the soil/dust, might have played a role in some bioaccessibility studies, but testing has proved inconclusive, appearing to explain approximately 65% of variability in nickel bioaccessibility in Canadian house dust (Rasmussen 2004; Rasmussen et al. 2008), while a similar study of house dust from UK homes found no clear correlations between organic carbon content of the dust samples and nickel bioaccessibility (Turner & Simmonds 2006). In an

36
Italian study assessing nickel bioaccessibilty of soils in the Torino region, significant differences were noted for soils from agricultural vs. residential sites in the PBET assay (phase 1 mean ± SD: 4 ± 0.2 vs. 16 ± 2, and phase 2; 8 ± 0.4 vs. 27 ± 6.7, respectively) (Poggio et al. 2009). In urban samples from the Torino area, a higher proportion of the soil metal content was found in bioaccessible forms at roadsides than in parks (Sialelli et al. 2011).
The duration and route of exposure of bioaccessibility assays must also be considered. Many studies assess bioaccessibility over a 24-48 hr period; however, retention of nickel particles in the nose and lung may be much longer (Torjussen & Andersen 1979). One hour to seven day incubation of soil samples initially subjected to a water/salt extraction (weak leach) in simulated lung fluid resulted in 0.5-1% nickel bioaccessibility after 1 hr, rising to 1-2% after 1 day and 1.5-3% after 1 week, with no peak (Drysdale et al. 2011).
In vivo relative oral bioavailability of nickel from three soil types from Port Colborne, ON was determined through oral administration to Sprague-Dawley rats (Ollson et al. 2003; Koch et al. 2005). In vitro bioaccessibility ranged from 4.8-18%. The relative bioavailability of nickel from soils was 3.9% for Welland clay, 3.2% for organic soil and 2.1% for fill. A bioaccessibility study (in vitro simulated gastric or gastrointestinal digestion) using two naturally weathered surface soils from nickel-impacted areas indicated that average bioaccessibility was 3.59% in the <70 µm size fraction of sandy soil from Sudbury, ON vs. 18.7% in the 150-250 µm fraction (soil concentration≈200 mg/kg) (Vasiluk et al. 2011). There was little difference in bioaccessibility in the two size fractions analysed from heavy clay soil Port Colborne, ON (11%; soil concentration≈2000 mg/kg). The bioaccessiblity results for the larger size fraction from Sudbury were comparable to OMOE (mean 16.5%; range 11.8-23.3%) and external laboratory (means 14 and 18%; ranges 7.6-28%) (Birmingham & McLaughlin 2006) measurements; however another study reported 44% bioaccessibility (SARA 2008). Co-incubation of the PBET-solubilised soil with Caco-2 cells resulted in ≈7-fold lower estimates of oral bioaccessibility than the PBET alone for <70 μm Sudbury soil and almost negligible bioaccessiblity for both Port Colborne soil fractions. Comparison of absolute and relative absorption after gavage-administration of soils vs. NiSO4·6H2O in rats indicated 0% nickel absorption from the <70 µm fractions, ≈12% (31% RBA) and 22% (56% RBA) from the 150-250 μm fractions and approximately 39% of NiSO4·6H2O were absorbed within 24 hr, as estimated by fecal excretion (Vasiluk et al. 2011). See section 8.3: Nickel Speciation in the Environment.
6.4 Toxicokinetics
6.4.1 Cellular uptake at primary sites of absorption
According to the "Nickel-Ion (Bioavailability) Hypothesis" (Costa et al. 1981; Goodman et al. 2011b; Hansen & Stern 1983), the Ni2+ ion is the active agent in nickel toxicity, mutagenesis and carcinogenesis, and the intracellular nickel concentration is a major determinant of toxicity, regardless of the nickel compound or the cell uptake mechanism.
Lipid-soluble Ni(CO)4 likely enters cells rapidly due to simple diffusion, and thus has pronounced cytotoxic and carcinogenic effects.
Soluble nickel may be dissolved in extracellular fluids, fluids lining the gastrointestinal (GI) and respiratory tracts and in sweat. Some extracellular Ni2+ may be transferred to the cytosol via ion channels, but uptake is thought to occur more readily after binding to small, diffusible proteins

37
and low-molecular-weight ligands (histidine, albumin and other cation carriers) to form lipophilic complexes (Menon & Nieboer 1986; Nieboer et al. 1984; Weinzierl & Webb 1972). Alveolar macrophages, alveolar Type I cells and renal cells may take up dissolved Ni2+ via fluid pinocytosis and exocytosis which maintains stable cell volume and osmolarity (Steinman et al. 1983; Grant & Donaldson 2009). Exocytosis possibly explains the rapid loss of soluble nickel taken into the cell (Edwards et al. 1998; Ke et al. 2007). Alternately, at high concentrations, dissolved metals may precipitate in the lysosomal compartment, due to acid phosphatase-mediated reactions. Precipitation may serve as a protective mechanism for the organism: if formed within airway macrophages, they may be removed by mucuciliary activity; when trapped within airway epithelial cells, they may be unable to cross into the circulation; when formed in renal cells, they may be excreted in urine (Galle et al. 1992; Berry et al. 1993; 1988; 1997).
Particles containing moderately-soluble nickel (e.g., Ni3S2) may also release some Ni2+ into solution prior to uptake, (the mechanisms of dissolution of poorly soluble nickel are not completely understood) (cited in Costa et al. 1981 and Fletcher et al. 1994). In primary cultures of guinea pig alveolar macrophages, two different pathways for Ni3S2 uptake were observed: (i) phagocytosis of α-Ni3S2 crystals and subsequent degradation to minute particles, which were recovered bound to the membranes of phagocytic vacuoles and lysosomal membranes, and (ii) extracellular degradation to regular round particles (0.1-0.2 μm diam) and irregular minute particles (10-30 nm diam). The round particles entered the cell by pinocytosis, while the minute particles were bound preferentially to cell membranes and cytoplasmic organelles, liposomes and the euchromatinic part of nuclei (Shirali et al. 1991).
Inhaled particles of poorly-soluble nickel (e.g., NiO) may be taken up by active phagocytosis or non-specific pinocytosis. They are then thought to undergo dissolution (likely after fusion with acidic secondary lysosomes) to release high concentrations of Ni2+ ions into the cytosol or other cellular compartments (Steinman et al. 1983; Grant & Donaldson 2009), which may include the nucleus. Some Ni2+ from poorly soluble nickel particles may be released extracellularly, depending on the composition of biological fluids: Ni2+ released by both green and black NiO particles in an aqueous solution containing amino acids was much greater than for NiO particles in water. The solubility of poorly soluble nickel particles also increases as particle size is reduced: ultrafine NiO (20-100 nm) particles showed up to150-fold higher solubility than fine NiO (1-2 µm) particles (Horie et al. 2009).
Pino-/phagocytosis is therefore greatly influenced by aqueous solubility as a function of the form of nickel, particle size and the physical properties of the nickel-containing particles. Crystalline particles are taken up much more readily than amorphous forms. Negative surface charge appears to favour greater uptake. Particles >5 um diam are generally not endocytosed, especially by epithelial cells. The general trend for endo-/phagocytosis of nickel particles of similar size therefore appears to be: water-soluble Ni < metallic Ni < amorphous NiS < [NiO < nickel-copper oxides] < crystalline NiS < crystalline Ni3S2 (Goodman et al. 2011).
6.4.2 Absorption and bioavailability of nickel
6.4.2.1 Absorption and bioavailability of ingested nickel:
The rate of absorption of ingested nickel is generally dependent upon its aqueous solubility (Ishimatsu et al. 1995). The reported bioavailability of soluble nickel in human oral challenge studies has ranged from 1 to 40%, with significant inter-individual differences noted. In fasted

38
subjects, bioavailability ranged from 28.7-40.1% (mean=33.1%) for physiologically-relevant doses of 62NiO or 62Ni metal (Patriarca et al. 1997) and from 12 to 32% for large doses of soluble NiSO4 or NiCl2 (Cronin et al. 1980; Nielsen et al. 1999; Sunderman Jr et al. 1989) and from 0.7 to 5.7% when administered with food (Sunderman Jr et al. 1989; Nielsen et al. 1999; Menne et al. 1978; Gawkrodger et al. 1986; Christensen & Lagesson 1981).
While co-administration of food appears to limit the uptake of nickel (Sunderman Jr et al. 1989; Solomons et al. 1982), ≈1% of nickel in food is absorbed (Horak & Sunderman Jr 1973). There is currently no quantitative information regarding the absorption of insoluble nickel compounds after ingestion or the human bioavailability of nickel in soil.
The estimated absorbed fraction of various nickel compounds to rats increased with solubility: 0.01-0.09% for insoluble Ni metal and NiOs; 0.5-2.1% for slightly soluble Ni3S2 and NiS and 9.8, 11.1 and 33.8% for soluble NiCl2, NiSO4 and Ni(NO3)2, respectively (Ishimatsu et al. 1995). Other studies found slightly lower values for NiCl2 (1.7-10%) (Nielsen et al. 1993) or 3-6% for 63Ni (Ho & Furst 1973). The relative oral bioavailability of NiCl2 in an aqueous slurry with sandy loam soil was 63.1%, but was only 33.5% for a clay loam soil slurry (Griffin et al. 1990). Hack et al., (2002) compared the in vitro bioaccessiblity of contaminants from German soils with the in vivo bioavailability of these contamniants in young minipigs. The in vivo bioavailability of nickel in seven contaminated soils following oral dosing to young minipigs was low (0.14-2.2%). The bioaccesssibility of soil nickel from 22 conatminated soils added to milk powder was 8-54%. The relative oral bioavailability of soil nickel ranged from 2-36%. See section 8.4 for more on relative absorption factors. 6.4.2.2 Absorption and bioavailability of inhaled nickel
The fate of inhaled nickel particles depends upon their size and solubility (cited in Goodman et al. 2011; Hack et al. 2007; Hsieh 1999; Oller 2002). Following inhalation exposure of rats to green 63NiO or 63Ni3S2 aerosols, the fractional deposition patterns showed ≈60-65% deposition in the upper respiratory tract and 35-40% in the lower respiratory tract (Benson et al. 1994).
Poorly-soluble nickel (e.g., NiO) particles have limited systemic absorption, and are largely cleared from the lung by mucociliary activity and airway/alveolar macrophage phagocytosis, and then swallowed and excreted, unabsorbed, in feces (Benson et al. 1994; English et al. 1981). Pinocytosis of nickel particles may also occur in nasal and pulmonary epithelial cells with retention within the interstitium or transport to lymph nodes. Finer particles may be more readily absorbed than larger particles. Urinary elimination data from one subject working with finer NiO particles had much greater systemic absorption than 19 co-workers exposed to larger particles (Roels et al. 1993).
Inhaled moderately-soluble nickel particles (e.g., Ni3S2) are partially cleared by mucociliary activity and phagocytosis, and may be taken up into the epithelium. Moderately-soluble particles may also be dissolved in the respiratory tract lining with epithelial uptake of the resulting Ni2+ ions by pinocytosis or ion channels. Systemic absorption of some of this nickel is indicated by both urinary and fecal elimination in laboratory animals in vivo (Valentine & Fisher 1984).
Particles containing soluble nickel are likely fully or partially dissolved in the fluid lining the respiratory tract. Some of the resulting ionic or complexed nickel may be removed by mucociliary clearance, but urinary elimination of the bulk of inhaled soluble nickel in laboratory

39
animals indicates that most is absorbed systemically (Benson et al. 1995). See section 8.4 for information on relative absorption factors for nickel. 6.4.2.3 Dermal absorption and bioavailability of nickel
The interpretation of dermal permeation or absorption estimates for nickel is complicated by the variety of approaches taken by individual investigators, e.g., with respect to diffusion cell design, vehicle, nickel species, skin thickness, age of the donor or subject, anatomical site, open application or occlusion, human vs animal, or data acquired in vivo vs. in vitro.
6.4.2.3.1 Nickel uptake in vitro
In formalin-fixed sections of human skin soaked in NiSO4, Ni2+ binding was most evident in the stratum corneum (SC), especially within the deeper layers, sweat ducts and hair follicles; with a particular affinity for keratin (Wells 1956). Nickel was also preferentially taken up from the cell culture medium by mouse (Lacy et al. 1996) and human keratinocyte (Ermolli et al. 2001) cell lines. In studies of NiSO4·6H2O or NiCl2·6H2O, full-thickness human skin samples were mounted in diffusion cells for 144-239 hr. Permeation was slow, with a lag time of ≈50 hr (Fullerton et al. 1986) or 70-98 hr (cited in Hostýnek 2003) before nickel appeared in the recipient chamber.
After 144 hr without occlusion, Fullerton et al. (1986) observed only 0.23% recovery of the applied dose of NiCl2 and ≈3.5% with occlusion in breast skin samples. Follow-up tape stripping experiments showed 50% of the unoccluded dose was found in the SC after 96 hr, 10.6% in the viable epidermis, 1.6% in the dermis and only 0.4% found in the recipient chamber. Application of higher nickel concentrations increased the rate of transfer to the recipient solution (Fullerton et al. 1988). When the permeation of NiCl2 and NiSO4 were compared in two additional breast skin samples and a leg skin sample under occluded conditions, Ni2+ from NiCl2 permeated the skin ≈4- to 50-fold more rapidly (≈4.5-15% after ≈150 hr, with the lower value obtained for the leg skin sample) than NiSO4 (<0.5% of the applied dose) (Fullerton et al. 1986).
There is limited information regarding dermal permeation of nickel in soil in vitro. In pig skin samples, total permeation of 63NiCl2 (in ethanol) alone was 57.9% after 16 hr, with 57.6% retained in the skin and 0.4% in the receptor solution. The effects of a soil matrix were assessed using two different soils (one with a three-fold greater organic matter content than the other; pHs of 4.2 and 5), as was the influence of weathering (3 months) of the soil-nickel mixtures (Abdel-Rahman et al. 2010, Abdel-Rahman & Turkall 2011). Permeation was reduced to a similar extent for freshly 63NiCl2-spiked samples of either soil type (to 11.5 or 12.4% of the available dose), and was further reduced after aging of the soil-nickel mixtures (to 2.8 or 1.8% of the available dose) (Turkall et al. 2008). In a 24-hr dermal permeation study of 63NiCl2 with and without a soil matrix in viable human breast skin 63NiCl2 (in acetone) or an aqueous slurry of soil and nickel (soil load of 5 mg/cm2; soil pH 4.5) were added to occluded diffusion cells, and the recipient chamber solution was collected at 6-hr intervals for 24 hr. Dermal permeation was 22.8% (20.9% in the skin depot and 1.8% in the recipient chamber) in the absence of soil and only 1.0% with soil (Moody et al. 2009). In this study, the authors estimated that hand exposure to nickel-contaminated soil (assuming 840 cm2 surface area, total adhesion of the 5 mg/cm2 of the soil load and equivalent skin retention and permeation) would result in an uptake rate of 0.4 ng Ni/cm2/hr or 0.3 µg Ni/hr

40
x 8 hr work day, yielding a total systemic exposure of 2.4 µg/day. Barring saturation, absorption was predicted to increase linearly with soil nickel concentration and surface area exposed.
Both Moody et al. (2009) and Turkall et al. (2008) obtained greater permeation of 63NiCl2 without soil. Disruption of the skin barrier by acetone or ethanol vehicles may also have increased permeation without soil, giving the appearance of a much greater retarding effect of soil. Dermal permeation of soluble nickel is increased by solvents (Sharata & Burnette 1988; Turkall et al. 2003), which induce ultrastructural changes in the skin as early as 5 min after application, possibly creating a more porous intracellular structure and alteration of diffusion pathways (Sharata & Burnette 1988).
While the above in vitro data indicate slow dermal permeation, nickel contact allergy is frequent, indicating facile skin penetration and/or nickel accumulation on repeated exposure. A significant limitation of in vitro assays is lack of blood flow, which can remove absorbed nickel and maintain the diffusion gradient (Hostýnek 2003); dissolution of soil nickel in sweat and other skin exudates may also increase nickel dermal uptake through “shunt” pathways (transappendageal diffusion via hair follicles, sweat and sebaceous glands) in vivo (Hostýnek et al. 2002; Emmett et al. 1988). See section 8.4 for relative absorption factors.
6.4.2.3.2 Dermal absorption of nickel in vivo
After application of 57NiSO4 to forearm or leg sites (occluded), detectable radioactivity declined by 61% after 41 hr, indicating penetration and/or systemic uptake. The most rapid reductions occurred in the early hours of the experiment (Norgaard 1955).
Analysis of sequential tape strippings after the application of NiCl2, NiSO4, Ni(NO3)2 or Ni(CH3COO)2 solutions (in methanol) to arm and back skin of human volunteers showed the arm SC was ≈2-fold more permeable to nickel than back SC. During the first 24 hr, most of the nickel salts remained at the skin surface or in the outer layers. Similar to in vivo studies, the ratio of nickel concentrations in the outer SC to those in the inner SC was directly proportional to the size of the counter ion (i.e., Ni(CH3COO)2 > Ni(NO3)2 > NiSO4 > NiCl2) (Fullerton et al. 1986). Only Ni(NO3)2 penetrated the SC to a significant degree. These findings are suggestive of ion pairing in the diffusion of Ni2+ through the SC, which likely involves transcellular pathways for most nickel compounds. More lipophilic forms, such as Ni(NO3)2, may also penetrate skin via intercellular and “shunt” transport (Hostýnek et al. 2001a).
When metallic nickel dust was applied to the forearm of three volunteers under an occlusive dressing, nickel was present in the outer SC after 5 min, and in the epidermis after ≤96 hr exposures. The authors concluded the nickel metal was oxidised to soluble compounds able to penetrate the SC (Hostýnek 2003), presumably by the intercellular route (Hostýnek et al. 2001b).
When allergic subjects immersed a finger for 10 min daily into 10 mg Ni/L (as NiCl2) solutions in water for one week, and into 100 mg Ni/L solutions for a second week, local uptake occurred, as indicated by increased local vesicle formation and blood flow (Nielsen et al. 1999).
Systemic absorption of nickel (NiSO4 or NiCl2) has been demonstrated in laboratory animals within 24 hr of application (Norgaard 1957; Lloyd 1980; Lacy et al. 1996); however chemical depilatories and/or alcohol-based vehicles may have enhanced nickel absorption. Significant amounts of nickel remained at the site of application 48 hr after application (Lacy et al. 1996).

41
6.4.3 Distribution
Once solubilised, nickel is readily distributed throughout the body (Li et al. 2008), but the resulting tissue concentrations may be influenced by the chemical form, route of exposure and the time since exposure. While renal nickel concentrations may initially be greater than other tissues, nickel clearance from the kidney is more rapid than for lung, liver or adrenal glands (Oskarsson & Tjalve 1979a; Wase et al. 1954; Nielsen et al. 1993; Clary 1975).
Most blood nickel is found in red blood cells (Barashkov et al. 2003; Templeton et al. 1994). Plasma nickel is bound to histidine, albumin and an α2-macroglobulin (Sunderman Jr et al. 1972; Nomoto et al. 1971; 1973; Lucassen & Sarkar 1979). The target of nickel binding in tissues is not known: it is a weak metallothionein (MT) inducer (Kurowska & Bal 2010; Fleet et al. 1990).
Mean nickel concentrations in autopsy tissue samples were greatest in the lung, followed by the thyroid, adrenal tissues, kidney, heart, liver, brain, spleen and pancreas; hilar lymph nodes, spinal cord/pituitary, testes and ovary (Rezuke et al. 1987). Elevated ovarian nickel was also noted in a Norwegian study (Rahil-Khazen et al. 2002). Pulmonary and renal accumulation was also noted in the general public (data from Zober et al. (1984); Sunderman et al. (1971); Seemann et al. (1985); Chen et al. (1977) as compiled by Rezuke et al. (1987)). Bone had higher nickel concentrations than lungs (Bocio et al. 2005). Tissue (especially lung) concentrations increase with increased air or water concentrations and with age (Bocio et al. 2005; Kollmeier et al. 1990). Lungs from males in the industrialised Ruhr region had two-fold greater nickel concentrations than those from females (Kollmeier et al. 1990).
Selective respiratory tract retention has been demonstrated in occupationally-exposed workers. Pulmonary nickel concentrations were 112- to 5800-fold higher in refinery workers and ≈500-fold higher in stainless steel welders than in controls (Raithel et al. 1993; Raithel et al. 1988). Pulmonary nickel concentrations averaged 330±380 μg/g (dry weight) in workers exposed to less-soluble nickel compounds, 34±48 μg/g in workers exposed to soluble nickel compounds and 0.76±0.39 μg/g in controls (Andersen & Svenes 1989). Nasal tissues of exposed workers, especially to Ni3S2 and NiO dusts, also retain inhaled nickel for long periods (T1/2 = 3.5 yr) (Torjussen & Andersen 1979).
Single or repeated inhalation/IT exposures to NiO particles in rats (Kodama et al. 1993; English et al. 1981), showed minimal extra-respiratory tract distribution and greater pulmonary retention than for Ni3S2 (Benson et al. 1994) or NiCl2 (Carvalho & Ziemer 1982; Clary 1975), the nickel from which was detected in blood and tissues within hours of exposure (Benson et al. 1994).
Dermal nickel accumulation was evident in mice administered 63NiCl2 IV (Oskarsson & Tjalve 1979b) and was greater in iron-deficient rats administered 63NiCl2 by gavage or IP injection than in iron-sufficient animals (Tallkvist & Tjälve 1997). When female subjects were administered a single 12 μg/kg bw dose of 61NiSO4 in drinking water after fasting overnight, dermal intercellular nickel concentrations (collected by the suction-blister technique) (Benfeldt et al. 1999) increased ≈8-fold in the first few hours after administration (Benfeldt et al. 1999).
Nickel uptake in the olfactory epithelium, with migration to the olfactory bulb and related areas in the brain was noted in rats after intranasal instillation of 63NiCl2 (Henriksson et al. 1997; Tallkvist et al. 1998), and a dog exposed to urban pollution (Calderón-Garcidueñas et al. 2003).

42
Oral administration of NiCl2 in rats resulted in tissue and serum nickel concentrations proportional to intake; with the highest concentrations in the kidney, lung and serum, testes and ovaries (100-1200 mg Ni/L; 3 or 6 mths in drinking water (Cempel & Janicka 2002; Severa et al. 1995)); however, no nickel accumulation was evident in liver, heart, lung, kidney or spleen at lower doses (5 mg/L in drinking water; lifetime exposure (Schroeder et al. 1974)). After gavage administration of eight nickel compounds, nickel concentrations were higher in rat tissue after exposure to soluble nickel, and were very low after exposure to sparingly-soluble nickel compounds (Ishimatsu et al. 1995). After gavage administration of NiCl2, mice stomach, intestines, kidneys, carcass, lungs, testicles, liver and spleen all retained nickel initially, whereas the intestines retained nickel after repeated administration (Nielsen et al. 1993) as did additional tissue types (hair, hypothalamus, hypophysis and pancreas) (Li et al. 2008).
In pregnant rats administered NiSO4 by gavage, nickel appeared in the fetal blood and amniotic fluid in a dose-dependent fashion, producing nickel concentrations in the fetus similar to those in the dam (Morvai et al. 1992; Szakmáry et al. 1995).
6.4.4 Metabolism
While Ni2+ is subject to ligand transfer processes, nickel cannot be altered by enzymatic processes in the body. Nickel carbonyl (Ni(CO)4) undergoes intracellular decomposition and oxidation to Ni2+ and CO (Kasprzak & Sunderman Jr 1969); other nickel compounds appear to undergo only dissolution. After decomposition of Ni3S2, the free nickel appears to form an organic Ni-P complex (Hachimi et al. 1995; Hildebrand et al. 1990; Hildebrand et al. 1991). Once inside the cell, Ni2+ may participate in the formation of reactive oxygen and/or nitrogen species (likely by Fenton- and Haber-Weiss-type reactions); however, Ni2+ redox activity may vary depending on the degree of complex formation with free amino acids or proteins (cited in Beyersmann & Hartwig 2008). The oxidation of Ni2+ by reactive oxygen species within the skin, leads to the formation of immunogenic Ni3+ and Ni4+ (Artik et al. 1999), which may react with low-molecular weight ligands to form diffusible lipophilic species (Hostýnek 2003). Biomethylation of nickel occurs in methanogenic bacteria, but has not been reported in higher organisms (cited in Thayer 2002).
6.4.5 Elimination
Absorbed nickel may be eliminated in urine, bile, sweat or breast milk; elimination via exhalation occurs only after exposure to 63Ni(CO)4 (Sunderman Jr & Selin 1968). In laboratory animals, much systemically-absorbed nickel is eliminated in urine in a dose-dependent fashion (Koizumi et al. 2004), regardless of the exposure route (Clary 1975; Li et al. 2008; Smith & Hackley 1968). In humans, much absorbed nickel is eliminated in urine (Torjussen & Andersen 1979), although urinary excretion may be quite variable after inhalation exposure (Hassler et al. 1983; Ghezzi et al. 1989) and especially after ingestion (Christensen et al. 1979; Menne et al. 1978).
Over 90% of ingested nickel is excreted in the feces in both humans (Horak & Sunderman Jr 1973) and laboratory animals (Ho & Furst 1973; Uthus 1999; Tedeschi & Sunderman 1957). For the first few days after inhalation/IT instillation, fecal elimination of insoluble nickel particles dominates; thereafter, urinary elimination becomes progressively more dominant (Benson et al. 1994). In contrast, urinary elimination predominates after inhalation/IT instillation of soluble

43
nickel (English et al. 1981). Inhaled moderately soluble nickel particles are eliminated in both the urine and feces (Valentine & Fisher 1984).
Biliary nickel excretion in laboratory animals is estimated at 0.5-5% of the administered dose (Sunderman Jr & Selin 1968; Smith & Hackley 1968; Marzouk & Sunderman Jr 1985) and may average 2-5 µg/day in non-exposed humans (Rezuke et al. 1987). Enterohepatic recirculation is not considered significant (Patriarca et al. 1997); however, intestinal cells may secrete nickel into the intestinal lumen (Tallkvist & Tjälve 1998).
Nickel excretion in human sweat may be significant with concentrations of 5-116 ug Ni/L (Tallkvist & Tjälve 1998; Hohnadel et al. 1973; Horak & Sunderman Jr 1973; Christensen et al. 1979) and production ranging from <1 litre to several litres per day (Weinheimer et al. 2008; Stofan et al. 2007). Mean nickel concentrations in human milk ranged from 1.16 to 19.3 μg/L (Parr et al. 1991; Friel et al. 1999; Casey & Neville 1987; Almeida et al. 2008).
Laboratory animal data for soluble Ni2+ (oral/IV) fit a two-compartment model with bi-phasic elimination (T1/2α and T1/2β ranging from 0.79-6 hr and 41-83 hr, respectively) (Li et al. 2008; Onkelinx et al. 1973). Extending the Onkelinx et al. (1973) model to humans, provided a urinary elimination T1/2 of 28±9 hr (Sunderman Jr et al. 1989). Kinetic modelling predicted urinary elimination T1/2s of 17-39 hr in electroplaters (Tossavainen et al. 1980), and 30-53 hr for mould makers and welders inhaling insoluble nickel compounds (Zober et al. 1984; Raithel et al. 1982).
The relatively short T1/2 values for animals and humans do not preclude longer-term storage deposits in the body, as suggested by retention of absorbed dietary nickel (14% in women and 26% in men) (Anke et al. 1995), and similar retention of 16.73% (Li et al. 2008) and 11% (7.2-14.2%) (Patriarca & Fell 1996) of exogenous Ni2+ in rats and humans, respectively, and persistently elevated urinary elimination in retired (Torjussen & Andersen 1979) and current nickel workers (Akesson & Skerfving 1985; Morgan & Rouge 1984). Assuming 30% retention of absorbed nickel, half lives of 200 (Bennett 1982) and 1200 days (ICRP 1981) for retained nickel in humans have been estimated.
After ingestion, the gastrointestinal tract may retain significant quantities of nickel (Nielsen et al. 1993; Li et al. 2008). Retention of inhaled particles in the respiratory tract may represent another storage depot. Particle phagocytosis is largely completed within hours of exposure, but may become delayed at high lung particle burdens (>1 μL/g of lung) or with protracted exposure; Ni-induced cytotoxicity may also limit clearance (Benson et al. 1995; Lehnert et al. 1989; Menzel et al. 1987; Oberdorster et al. 1995), as may low solubility. Following acute inhalation or IT instillation in rats, the pulmonary clearance T1/2 was 20 hr for NiS (amorphous), 2-3 days for NiSO4, 4-6 days for Ni3S2, 32 days for metallic Ni (ultrafine) and >120 days for NiO (Tanaka et al. 1988; Serita et al. 1999; Hirano et al. 1994; Benson et al. 1994). Clearance of NiO increased with decreasing particle diameter (Kodama et al. 1985), with T1/2s of 11.5 and 21 months for 1.2 and 4.0 μm particles, respectively (Tanaka et al. 1985). Repeated inhalation of NiSO4, amorphous NiS or Ni3S2 did not alter pulmonary clearance or result in pulmonary accumulation in rats or mice (Tanaka et al. 1988; Dunnick et al. 1989; Benson et al. 1995). In contrast, in mice and rats repeat exposure to green NiO, resulted in accumulation in the lungs and impaired clearance of acutely inhaled 63NiO (Benson et al. 1995; Dunnick et al. 1989; Oberdorster et al. 1995b; Tanaka et al. 1985; Tanaka et al. 1986; Wehner & Craig 1972).

44
6.5 Acute Toxicity ATSDR (2005) summarised the acute effects following ingestion in laboratory animals and humans. The LD50 for nickel sulphate (the most soluble and acutely toxic of the nickel species) has been reported to from 39-46 mg/kg body weight (bw) in rats. Health Canada (EC and HC 1994) reported that "soluble" nickel salts (e.g., nickel chloride, nickel sulphate, nickel nitrate and nickel ammonium sulphate) are moderately to highly acutely toxic to rats (LD50s = 42.5-112 mg Ni/kg bw) while nickel powder and the insoluble nickel salts (green and black nickel oxides, nickel subsulphide, and amorphous nickel sulphide) are less acutely toxic (LD50s = 3200-9000 mg Ni/kg bw).
Accidental ingestion of water containing nickel sulphate, nickel chloride and chloride hexahydrate (range= 0.5-2.5 g Ni) caused acute gastrointestinal and neurological symptoms including nausea, abdominal pain, diarrhea, vomiting and shortness of breath in 20/38 workers (Sunderman et al. 1988). Another subject who ingested approximately 50 μg Ni/kg as nickel sulfate in water was reported to have developed transient hemianopsia coincident with peak serum concentrations (Sunderman Jr et al. 1989). A 2 yr old child died (due to cardiac arrest) within hours of accidental ingestion of nickel sulphate crystals (estimated exposure = 570 mg Ni/kg bw) (Daldrup et al. 1983).
A worker became ill and died 13 days later after a 90-minute exposure to an estimated concentration of 382 mg Ni/m3 (estimated total inhaled dose = 1 g), of principally metallic nickel, of which 65% of particles were <1.4 μm, and the majority were 50 nm in diameter. Histological examination of the man’s lungs revealed alveolar wall damage and oedema in alveolar spaces and marked tubular necrosis in the kidneys. Nickel particles <25nm in diameter were identified in lung macrophages using transmission electron microscopy. High levels of nickel were also measured in his urine (Phillips et al. 2010; Rendall et al. 1994).
Acute dermal exposure to nickel seems to be primarily associated with the development of nickel sensitivity (see 6.7, Nickel allergy, below).
6.6 Subchronic and Chronic Systemic Toxicity
6.6.1 Oral Exposure
A number of studies have investigated the effects of longer term oral exposure to nickel in both laboratory animals and humans. Loss in body weight, renal, developmental and reproductive effects have been well documented (Vermeire et al. 1991; SLI 2000; Ambrose et al. 1976; ABC 1988). Effects in other systems (cardiac, gastrointestinal, hematological, immunological, and neurological) were also summarised in ATSDR (2005) report. The studies with the most relevance to the development of the toxicological reference value for nickel sulphate are discussed below and in Section 6.9.1.
In a 2-year study, Ambrose et al. (1976) reported decreased body weights in Wistar rats fed nickel sulphate. In this study, rats (25 per sex per dose) were fed 0, 100, 1000 or 2500 ppm nickel in food (dose rates estimated as 0, 5, 50 and 125 mg Ni/kg bw/day). Various effects were noted in the mid-dose group including significantly higher heart-to-body weight and lower liver-to-body weight ratios than controls (females only). In addition, the high dose male and female rats had decreased overall body weights but males showed effects at lower doses than females

45
(50 vs. 125 mg Ni/kg bw/day respectively). No significant effects were reported at the low dose group. In terms of growth effects, male rats showed effects at lower doses than females. The growth rates of dogs were likewise reduced when similar concentrations of nickel added to their feed (Ambrose et al. 1976). In a 4-week study in Webster mice, significant negative effects on growth and feed utilisation occurred at lower doses of nickel acetate for females (estimated doses = 250 and 208 mg/kg bw, respectively) than in males (293 and 293 mg/kg bw, respectively) (Weber and Reid 1969) (see also Appendix 5).
Based on the Ambrose et al (1976) study, a Lowest Observed Adverse Effect Level (LOAEL) of 50 mg/kg bw/day was identified while the No Observed Adverse Effect Level (NOAEL) was identified to be 5 mg/kg bw/day. This study has been used as the basis of the oral TRVs published by Health Canada (HC 1996), the US Environmental Protection Agency (US EPA 1996) and the IOM (IOM 2001).
6.6.2 Inhalation Exposure
Numerous studies have investigated the effects of long term inhalation exposure to nickel in both laboratory animals and humans (see also Rhinitis/Asthma, below). Mortality studies have not shown evidence of an increase in the risk of death as a result of non-malignant (non-cancerous) respiratory disease among several cohorts of nickel-exposed workers (from Canada, Norway, Finland and the UK) (IARC 1990).
A cross-sectional study, pulmonary function testing indicated vital capacity and expiratory flows were reduced in shipyard stainless steel welders exposed to elevated concentrations of nickel and chromium (Kilburn et al. 1989) No evidence of lung effects associated with lung and nasal cancers were evident in workers exposed to concentrations as high as 100mg/m3 from Sudbury, ON. When chest radiographs from 745 nickel sinter plant workers from the Copper Cliff, Sudbury plant (where a high incidence of nasal and lung cancers was found among workers employed from 1948 to 1963 (IARC 1990) who had been exposed to nickel at concentrations as high as 100 mg/m3 were examined, there was no evidence of increased small irregular opacities, which can be indicative of inflammatory or fibrogenic response in the lungs (pneumoconiosis (Muir et al. 1993)). Evaluation of nickel refinery workers in Norway showed a dose-response dependant increased risk of pulmonary fibrosis after controlling for age, smoking status and asbestos exposure for both soluble and suphidic nickel, although the dose-response trend was less clear for sulphidic nickel (Berge & Skyberg 2003).
In the case of inhalation exposures, the ATSDR (2005) review concluded that nickel sulphate is more acutely toxic than nickel subsulphide or nickel oxide. In rats exposed to nickel via the inhalation route for 6 hours per day for 12 days at 700 µg Ni/m3, effects included alveolitis, chronic lung inflammation, alveolar macrophage hyperplasia and atrophy of the nasal olfactory epithelium. Non-respiratory effects include loss in body weight, renal, developmental and reproductive effects. Immunological effects have also been noted in mice (Dunnick et al. 1989; NTP 1996a; 1996b; 1996c; Spiegelberg et al. 1984; Weischer et al. 1980; Vyskočil et al. 1994). The studies of most relevance to the development of the toxicological reference values (section 6.9.2) for nickel sulphate and nickel oxide are discussed below.
Spiegelberg et al. (1984) reported dose-related effects to the respiratory and immune systems in a study exposing rats to nickel oxide at concentrations of 25 and 150 µg Ni/m3 for 24 hours/day, 7 days/week for 4 months. Increases in lung granulocytes, lymphocytes and multinucleated

46
macrophage counts were noted in all groups. The LOAEL was reported to be 25 µg Ni/m3 while a NOAEL was not identified. This study was used by Health Canada (1996) to develop an inhalation TRV for nickel oxide (section 6.9.2).
Dunnick et al. (1989) reported dose-related effects on nasal tissue and the respiratory system in mice and rats exposed to nickel sulphate. In this study, groups of male and female mice and rats (7-10 per sex per dose group) were exposed to concentrations of 0, 20, 50, 100, 200 and 400 µg Ni/m3 for 6 hours/day, 5 days/week for 13 weeks. Inflammation of the lungs, alveolar macrophage hyperplasia and nasal olfactory epithelium atrophy were noted as critical effects. The LOAEL was reported to be 20 µg Ni/m3 in rats (due to alveolar macrophage hyperplasia in females) while a NOAEL was not identified. This study was used by Health Canada (1996) to develop an inhalation TRV for nickel sulphate. It is noted that no information is provided on whether or not the control group received sulphate aerosols (without nickel), therefore, it is not possible to determine whether the effects may have been at least partially due to inhalation of particulate sulphates.
NTP (1996a) reported respiratory effects in rats exposed to nickel sulphate in air. In this study, groups of rats (63-65 per sex, per dose group) were exposed to nickel sulphate hexahydrate at concentrations of 0, 120, 250 or 500 µg/m3, (equivalent to 0, 30, 60 or 110 µg Ni/m3), for 6 hours/day, 5 days/week for 2 years. No significant effects on survival, body weight or clinical signs were observed. Treatment-related effects included lung lesions (chronic active inflammation, alveolar macrophage hyperplasia, alveolar proteinosis and fibrosis) in rats exposed to 60 or 110 µg Ni/m3. In addition, a significant increase in the incidence of lymphoid hyperplasia and atrophy of the olfactory epithelium were noted in the high concentration group. No alteration on tumour incidence was noted. The LOAEL was reported to be 60 µg Ni/m3 while the NOAEL was identified at 30 µg/m3.
In a second study, groups of mice (80 per sex per dose group) were exposed to nickel sulphate hexahydrate at concentrations of 0, 250, 500 or 1000 µg/m3 (equivalent to 0, 60, 110 or 220 µg Ni/m3) for 6 hours/day, 5 days/week for 2 years (NTP 1996a). No significant effects on survival, body weight or clinical signs were observed. Treatment-related effects included lung lesions (macrophage and lymphoid hyperplasia) and atrophy of the olfactory epithelium in mice exposed to 110 or 220 µg Ni/m3. Additionally, significant increases in the incidence of lymphoid hyperplasia and atrophy of the olfactory epithelium were noted in the high concentration group. No change in tumour incidence was noted. NTP (1996a) reported a LOAEL of 110 µg Ni/m3 and a NOAEL of 60 µg Ni/m3.
6.6.3 Reproductive Effects and Teratogenicity
There is evidence that oral exposure to nickel may cause reproductive effects in laboratory animals (Appendix 5). Ambrose et al. (1976) studied three generations of rats and did not observe any adverse effects on fertility, gestation, viability and lactation in rats exposed to diets containing 1000 mg Ni/kg. However, changes to sperm quality in laboratory animals have been reported (cited in ATSDR 2005). Generally, reproductive performance is only slightly affected by oral nickel exposure. The most relevant studies with regard to derivation of the oral TRV (SLI 2000b; Smith et al. 1993) (section 6.9.1) are discussed below.
Post-implantation loss and perinatal mortality were investigated in a two-generation rat study: 1, 2.5, 5.0 and 10 mg/kg bw/day (equivalent to 0.22, 0.55, 1.1 and 2.2 mg Ni/kg bw/day) nickel

47
sulphate hexahydrate dissolved in water was administered by oral gavage to male and female rats (28 animals/sex). A NOAEL of 2.2 mg Ni/kg bw/day was reported. In addition to the developmental endpoints, the authors reported slight changes to liver weight (<10% of the controls) in the two highest dose groups but they were concluded to be of no toxicological significance (SLI 2000b). Based on a re-evaluation of the SLI (2000b) data, the Danish Environmental Protection Agency (DEPA) considered that there was a mechanistic basis to assume that post-implantation loss and perinatal mortality represented similar endpoints (EU 2004; 2008). WHO (2005) supported the EU (2004) analysis and likewise concluded that effects on the developing fetus resulting in post-implantation loss or death shortly after birth appeared to be due to the same mechanism and that the combination of the endpoints was considered appropriate. Combination of the endpoints resulted in the identification of a LOAEL of 2.2 mg Ni/kg bw/day (EU 2004) and a NOAEL of 1.1 mg/kg bw/day (EU 2004; 2008) using the DEPA approach. A revised statistical analysis of the SLI (2000b) study data also supported a LOAEL of 2.2 mg/kg bw/day and a NOAEL of 1.1 mgkg bw/day for perinatal lethality (Sommer et al. 2002). Both WHO (2005) and EU (2008) adopted the DEPA re-analysis of the SLI (2000b) data and the NOAEL of 1.1 mg/kg bw/day was used to develop the human health-based soil quality guideline (SQGHH) in the current document (see Section 6.9).
Smith et al. (1993) reported increased perinatal death in rats administered nickel chloride in drinking water (0, 10, 50 or 250 ppm Ni) for 11 weeks prior to mating and then during two successive gestation and lactation periods. Results indicated an increased frequency of perinatal death at all doses, giving a LOAEL of 10 ppm Ni. This concentration was calculated by Smith et al. (1993) as equivalent to a dose of 1.3 mg Ni/kg bw/day, based on median intake levels. The more recent study of SLI (2000b) is deemed most suitable for estimation of health effects from soluble nickel.
Effects of soluble nickel compounds on male reproductive organs in rats and mice have been reported. Effects on the testes and epidiymus include motility, morphology, motility, decreased sperm count and alterations in marker testiculary enzyme activity (Pandey et al. 1999; Pandey & Srivastava 2000; Käkelä et al. 1999; Bábiková et al. 2007; Toman et al. 2012). Though limited by small numbers of animals and poor dose-response design, effects on male reproductive organs occurred at levels similar to those in developmental toxicity studies, i.e., down to a NOAEL of 1.1. mg Ni/bw (Pandey et al. 1999; Pandey & Srivastava 2000) and support the selection of the animal developmental toxicity endpoint (section 6.9.1).
6.7 Nickel allergy
6.7.1 Allergic contact dermatitis
Nickel is one of the major causes of allergic contact dermatitis (ACD) worldwide, with an estimated median incidence of 8.6% (range 0.7-27.8%) among the general population and 17.1% for the female population (Thyssen et al. 2007). In the UK, nickel is believed to play a role in up to 18% of cases of occupational contact dermatitis (Meyer et al. 2000).
The induction of sensitisation and the elicitation of nickel ACD are dependent upon T lymphocytes, which orchestrate a typical delayed type hypersensitivity reaction. Skin sensitisation occurs as a result of Ni2+ hapten formation by binding to proteins or immunogenic peptides (likely via histidine residues (Sinigaglia 1994)).
48
Major determinants of induction and elicitation of nickel ACD include the nature (source composition, anatomic site, vehicle, skin penetration [e.g., piercing] and/or occlusion) and extent (duration, surface area and concentration of nickel per unit area of skin) of exposure. In challenge testing, NiCl2 produces positive reactions more frequently than NiSO4 (Wall 1980; Räsänen et al. 1999), likely due to greater dermal permeation and/or greater irritant/cytotoxic properties (Fullerton et al. 1989). Both NiCl2 and NiSO4 may penetrate through rubber (but not PVC) gloves to elicit skin reactions; the occlusion provided by the gloves may increase nickel dermal permeation and sweating (Wall 1980). Typically, the response to nickel patch testing is more consistent as the concentration and/or duration increase (Kalimo et al. 1985). Elicitation of ACD is generally independent of the skin surface area to which the allergen is applied (cited in Kimber et al. 2002); however, for nickel, the size of the exposed area, and therefore the total amount applied, may also influence reaction severity and latency, even though the dose per unit area is the same (Fischer et al. 2007a).
In the mouse local lymph node assay (LLNA), the induction threshold for nickel was 140 µg/cm2 (Ryan et al. 2002). Generally LLNA and human thresholds correlate well (Peiser et al. 2012).
The amount of absorbed nickel required to elicit dermal reactions appears to be very small: X-ray microanalysis of reactive patch-tested skin detected nickel only with the keratin cell layer, sweat ducts and hair follicles (Kalimo et al. 1985). Studies assessing the nickel ACD elicitation threshold, obtained positive dermal challenge responses after single or repeated exposures using open occluded, penetrating or oral (see 6.7.2) protocols.
Most dose-response studies have employed a single occluded Finn chamber exposure to NiSO4·H2O in ethanol or water (Allenby & Goodwin 1983; Emmett et al. 1988; Fischer, Johansen, et al. 2007; Hindsén & Bruze 1998; Hindsén et al. 1997; 1999; 2005; Nielsen et al. 1999; Rystedt & Fischer 1983; Wahlberg & Skog 1971). The lowest dose per unit area at which 10% of allergic individuals will react within two days of application (ED10) was calculated to be 0.78 µg Ni/cm2 (95% CI 0.13-2.2), while the ED1 was 0.048 µg/cm2 (95% CI 0.0018-0.24) (Fischer et al. 2007b). Meta-analysis of pre-2005 studies concluded that 5% of sensitised subjects react to 0.44 μg Ni/cm2 and 10% react to 1.04 μg Ni/cm2 (Fischer et al. 2005).
In one study employing single open application, 4 of 51 (7.8%) of sensitised persons responded with redness/vesicles to 15 µg Ni/cm2 (as NiCl2 in ethanol), while 20 more had papular follicular reactions, which may have been local reactions in areas of high nickel uptake (sweat ducts and hair follicles - see 6.4.2.3); follicular reactions were also seen at 0.015-1.5 µg Ni/cm2 (Menne & Calvin 1993). In a similar open testing study, 7 of 15 (46%) Ni-sensitive subjects reacted at 37.5 µg Ni/cm2, and 10 (66%) reacted at 75 µg Ni/cm2; papules were also seen in some subjects at 37.5 and 75 µg Ni/cm2 (Christensen & Wall 1987). In contrast, 20% NiCl2 produced no response in normal subjects (Christensen & Wall 1987). In single open application of NiSO4, 0/2 subjects reacted at 0.05 or 0.5 μg Ni/cm2, and 0/3 subjects reacted to 2.5 μg Ni/cm2, but increasing numbers reacted at the higher concentrations as follows: 6/21 (28%) at 5.0 μg Ni/cm2, 6/19 (31%) at 15 μg Ni/cm2, 7/19 (37%) at 30 μg Ni/cm2 and 11/18 (61%) at 45 μg Ni/cm2 (Gawkrodger et al. 2012).
In repeated open application testing (ROAT) for up to 21 days, 22% of Ni-allergic subjects reacted at 0.035 µg Ni/cm2 (as NiSO46H2O). The cumulative ROAT dose at 1, 2 and 3 weeks

49
was equivalent to the ED10 for patch tests (0.78 µg Ni/cm2) (Fischer et al. 2007), likely reflecting cumulative absorption of nickel (EDxx(ROAT) = 0.0330 EDxx(patch test)) (Fischer et al. 2009).
Another key determinant of ACD is the susceptibility of the exposed individual (Kimber et al. 2002), which may vary significantly over time (Hindsén et al. 1999). In humans, nickel-induced allergic contact dermatitis develops much more readily in irritated skin (cited in Hostýnek 2003) and at sites of previous allergic contact dermatitis and varies directly with the intensity of, and inversely with the time since the previous episode (Hindsén et al. 1997; 2001). The potential to induce or elicit allergic reactions to nickel in areas of thinner skin and/or abraded skin may be of greater concern (Dickel et al. 2010); the irritant potency may also be greater in young children (Jøhnke et al. 2004). Conversely, tanned skinned may be thicker and therefore more resistant to nickel or produce delayed reactions (Christensen & Wall 1987). Co-exposure to skin lotions (Zachariae et al. 2003) or irritants (Shah et al. 1998; Fischer et al. 2005; Agner et al. 2002) may increase the severity of response. Once sensitised, allergic response on re-exposure appears to be a long-term phenomenon (Nielsen et al. 2001).
6.7.2 Systemic contact dermatitis
Systemic Nickel Allergy Syndrome (SNAS) is characterised by new-onset urticaria and eczema or exacerbation of previous positive patch tests/eczema triggered by dietary nickel intake. Abdominal pain, diarrhea or constipation, respiratory and other minor symptoms may also be noted (Nielsen et al. 1999; Picarelli et al. 2011; Turi et al. 2008; Veien 2011). SNAS appears to be induced after oral provocation tests using soluble forms of nickel (generally NiSO4) (Kaaber et al. 1978; 1979; Hindsén et al. 2001; Gawkrodger et al. 1986; Cronin et al. 1980; Christensen & Moller 1975); symptoms were reduced in some subjects following a nickel-reduced diet (Gawkrodger et al. 1988; Picarelli et al. 2011; Silvestri & Barmettler 2011; Tennstedt 2011; Veien et al. 1983; 1993) and hand eczema was aggravated in women fed a high-nickel diet (Nielsen et al. 1990). The response to nickel ingestion is antigen-specific: only the nickel patch-test site was reactivated after oral challenge in subjects who had a previous positive nickel patch test and an irritant reaction to a benzalkonium chloride patch test (Christensen et al. 1981). Some controversy remains as to the veracity of systemic symptons due to dietary nickel, in part owing to the difficulty in measuring or controlling intake from food (Pizzutelli 2011).
Some studies have established LOAELs of 0.6 mg (9.7 μg Ni/kg bw) (Cronin et al. 1980) and 12 μg Ni/kg bw (Nielsen et al. 1999) in females for exacerbation of hand eczema. The lowest LOAEL was obtained in a double-blind, placebo-controlled study in which 4 of 10 subjects in each dose group reacted to challenge after administration of 1 and 0.3 mg (the latter corresponding to 4.8 µg/kg for a 62 kg female and 4.3 µg/kg for a 70 kg man) (Jensen et al. 2003). Subjects were generally fasted overnight (see 6.4.2.1), although no other measures to control nickel intake were instituted.
In a modified meta-analysis of oral nickel challenge studies with similar designs and protocols (9 studies and 171 subjects) (Bedello et al. 1985; Christensen & Moller 1975; Gawkrodger et al. 1986; Kaaber et al. 1979; 1978; Hindsén et al. 2001; Roduner et al. 1987; Sertoli et al. 1985; Veien & Kaaber 1979), the authors concluded that reaction rates tended to increase with challenge dose. Model results predicted dermal reactions in 1% of nickel-sensitive patients after ingestion of 0.22, 0.35 or 0.53 mg nickel (depending on which of three dose-response curves was

50
used). Similarly, 10% of these patients would react after ingestion of 0.55, 0.87 or 1.33 mg nickel (Jensen et al. 2006).
The oral elicitation threshold for dermatitis (Nielsen et al. 1999) has been used to develop guidelines for drinking water (WHO 2005), soil guidelines for Ni (Environment Agency, 2009; Australia 2010), EU Risk Assessment of nickel for the indirect exposure of man via the environment (for REACH) (EU 2008b; DeBrouwere et al. 2012) and supports the selection of the animal developmental toxicity endpoint (section 6.9.1). Migration limits for Ni (µg/cm2/week) have been used by the European Union to develop limits for dermal contact with Ni-based products (EU 2004a; Manchananda 2011).
6.7.3 Rhinitis/Asthma
The allergic/immune manifestations of nickel exposure may also include nasal inflammation (rhinitis, rhinorrea, sneezing and nasal obstruction) and bronchial asthma/bronchitis, with or without nickel-induced ACD/hand eczema.
Sporadic cases of nickel-induced rhinitis and/or asthma, often work-related, have been reported in the literature, generally among patients who tested positive on skin allergy testing (Block & Yeung 1982; Davies 1986; De Hauteclocque et al. 2002; Dolovich et al. 1984; Fisher et al. 1982; Hong et al. 1986; Malo et al. 1982; 1985; Maciariello et al. 2010; McConnell et al. 1973; Novey et al. 1983; Spinelli et al. 2005; Stelting & Platzek 2005). Analyses of data from Canada and the UK place NiSO4 among the 10 most frequent causes of occupational allergic contact dermatitis (OACD) and occupational asthma (OA) (Arrandale et al. 2012). Seven out of eight asthmatic patients with hard metal asthma due to cobalt, showed reduced FEV1 (-20% or more) after inhaling NiSO4. Eight control subjects with no history of hard metal exposure, including six asthmatics, had no bronchoconstrictive response to NiSO4 (Shirakawa et al. 1990).
Temporal associations among ambient PM2.5, individual metal constituents of PM2.5 (nickel, vanadium, zinc and elemental carbon) and longitudinal reports of respiratory symptoms through 24 months of age were assessed in a New York City cohort study involving 653 children. An increase in interquartile range (IQR) concentration of ambient nickel (0.014 mg/m3) was associated significantly with a 28% increased probability of wheeze (P=0.0006); larger effect estimates were obtained in models containing observations from only the cold/flu season (Patel et al. 2009).
There are limited experimental data regarding the effects of nickel on the mammalian immune systems. Several immune function responses such as changes in spleen cellularity and natural killer cell (NK) activity were noted in mice exposed to nickel sulphate in drinking water; however, concentrations were very high (1-10 g/L) (Dieter et al. 1988).
6.8 Genotoxicity, carcinogenicity and carcinogenic mode of action
6.8.1 Genotoxicity
6.8.1.1 Direct DNA reactivity
The induction of DNA damage has been linked to nickel’s ability to bind to DNA and nuclear proteins; however, nickel compounds are not mutagenic in bacterial test systems and only weakly mutagenic in cultured mammalian cells. In addition, no increase of ouabain-resistant or

51
6-thioguanine-resistant colonies has been found in human diploid fibroblasts, even at concentrations of Ni3S2 that caused a 200-fold increase in the frequency of anchorage-independence (cited in Cameron et al. 2011; Costa et al. 2005; IARC 2011; Salnikow & Zhitkovich 2008; Sivulka 2005; Zhao et al. 2009). 6.8.1.2 Indirect DNA reactivity (via Ni-induced reaction oxygen species)
Nickel may bind to histone proteins within heterochromatin and generate reactive oxygen species (ROS) through Ni3+/Ni2+. These radicals could interact with DNA to damage bases, induce DNA strand breaks, sister chromatid exchange and/or cross-links between DNA and protein. However, such effects are generally noted only at cytotoxic concentrations and such damage may be predominantly confined to local heterochromatic regions of DNA that lack active genes. As noted above, all in vitro mutation assays with nickel have been negative for the induction of point mutations. Damage to heterochromatin may nonetheless lead to chromosomal aberrations (breaks, gaps, exchanges) involving nearby coding regions, which could affect critical tumour suppressor or cell senescence genes. Nickel-mediated cytotoxicity may also lead to secondary ROS generation, which may damage DNA if able to access the nucleus (cited in IARC 2011; Oller et al. 1997). 6.8.1.3 Indirect genotoxicity through epigenetic, cytotoxic, immunosuppressive, inflammatory or
proliferative effects
Epigenetic changes, including DNA methylation alterations, changes in histone acetylation, methylation or ubiquitylation levels, structural changes and/or activation or suppression of a number of transcription factors, may be primary events in nickel carcinogenesis.
In human lung cells exposed to soluble nickel compounds, histone modifications included loss of acetylation, increased dimethylation and increased ubiquitylation. The mechanisms by which nickel induces DNA hypermethylation and consequent gene silencing are presently unknown. A major action of nickel is its ability to silence the expression of genes located near heterochromatin by inducing a loss of histone H4 and H3 acetylation and DNA hypermethylation. It can also bind to and selectively damage histones within (non-coding) heterochromatin. Nickel has also been shown to suppress histone H4 acetylation in vitro in yeast and mammalian cells. Loss of histone acetylation may reduce the access of transcription-associated proteins to DNA, while histone methylation results in more compacted chromatin and gene silencing. When nickel silences critical genes, such as tumour suppressor genes, the cell is altered to a greater state of neoplastic transformation. It has been postulated that Ni2+ may substitute for magnesium (Mg2+) to increase chromatin condensation and trigger de novo DNA methylation.
Given Ni2+ is similar to Fe2+, Ni2+ may either replace Fe2+ or interfere with Fe2+ uptake, leading to cellular iron. Nickel may also inhibit cellular ascorbate uptake and/or deplete ascorbate due to nickel-induced ROS. Ascorbate is the only anti-oxidant able to maintain the reduced state of enzyme-bound iron of prolyl hydroxylases, which is vital for maintaining enzyme activity. Depletion of intracellular iron and/or ascorbate may therefore inactivate prolyl hydroxylases, including the hypoxia inducible factor (HIF) prolyl- and asparaginyl-hydroxylases. Inhibition of the HIF proline hydroxylases stabilises the HIF protein and activates hypoxic signaling, and produces an alteration of cellular metabolism to a state that mimics permanent hypoxia, including the induction of HIF-1 and activation expression of hypoxia-inducible genes.

52
Nickel-induced cytotoxicity and inflammation (including upregulation of ROS generation and chronic activation and inflammation of airway/alveolar macrophages leading to general inhibition of phagocytic clearance) within the respiratory tract may promote cellular proliferation and mutation and may reduce respiratory tract defences. Nickel may also suppress natural killer cell activity and interferon production.
Nickel-induced carcinogenesis is known to be tissue-, strain- and species-dependent, indicating genetic predispositions (e.g., variations in the expression of genes involved in the metabolism of antioxidants) may play a role.
Overall, nickel may change gene expression motifs, contributing to stimulated cell proliferation, either by activation of proto-oncogenes or interfering with tumour suppressor genes. Together, the activation of HIF-1 transcription factor, hypermethylation and modification of histones may represent a molecular basis for cellular adaptation in growing tumours. Specifically, a nickel-induced state of activated hypoxic signaling under normal oxygen tension may promote the selection of cells that have altered energy metabolism, changed growth control and/or have become resistant to apoptosis. However, it is possible additional mutagenic events (DNA damage) are required for successful cell transformation (cited in Oller et al. 1997; Salnikow & Zhitkovich 2008; Zhao et al. 2009; Costa et al. 2005; Cameron et al. 2011). 6.8.1.4 Nickel(II) as a co-carcinogen
Most metallic compounds, including soluble and insoluble nickel compounds, are able to enhance the cytotoxicity, genotoxicity and carcinogenicity of directly-acting genotoxic agents as a result of inhibition of DNA repair. In particular, nickel may interfere with iron-dependent DNA-repair enzymes (including alkyl DNA dioxygenases and O6-methylguanine-DNA methyltransferase (MGMT); Ni2+ may specifically inhibit nucleotide excision and base excision repair. Inhibition of DNA repair may therefore underly the phenomenon of delayed mutagenicity and chromosomal instability evident long after treatment of cells with nickel (cited in IARC 2011; Salnikow & Zhitkovich 2008).
6.8.2 Carcinogenicity
Orally-administered nickel and its inorganic compounds do not appear to be carcinogenic in laboratory animals (Heim et al. 2007, Ambrose et al. 1976; Schroeder & Mitchener 1975), but carcinogenic activity has been reported when administered by any other route (inhalation, intramuscular (i.m.), intrarenal (i.r.), intraperitoneal (i.p.), intraocular (i.o.), subcutaneous (s.c.) and intra-articular space (i.a.)) and at all sites of application. Carcinogenic activity depends strongly on the solubility of nickel compounds in water and tissue fluids. As a rule, insoluble compounds, such as NiS, NiO and Ni3S2, are better experimental carcinogens than soluble compounds, Ni2+ acetate, chloride, or sulfate. However, experiments with Ni2+ acetate as the initiating agent (i.p. injection) have shown strong positive results in rodents (cited in Kasprzak et al. 2003) (see section 6.9.3 for Unit Risk selection).
In a comprehensive epidemiological analysis of 10 occupational cohorts (>60 000 subjects) exposed to nickel, including workers employed at mining, smelting and refinery operations in Ontario, in which measured total nickel was used to estimate four nickel compounds (metallic nickel, oxidic nickel, sulphidic nickel and soluble nickel salts) Doll et al. (1990) concluded that "respiratory cancer risks are primarily related to exposure to 'soluble' nickel at concentrations in

53
excess of 1 mg Ni/m3 and to exposure to less 'soluble' forms at concentrations greater than 10 mg Ni/m3.", the 1990 International Report of the International Committee on Nickel Carcinogenesis in Man concluded
“…although much of the respiratory cancer risk seen among nickel refinery workers could be attributed to exposure to a mixture of oxidic and sulfidic nickel at very high concentrations, exposure to large concentrations of oxidic nickel in the absence of sulfidic nickel was also associated with increased lung and nasal cancer risks. There was also evidence that soluble nickel exposure increased the risk of these cancers and that it may enhance risks associated with exposure to less soluble forms of nickel. There was no evidence that metallic nickel was associated with increased lung and nasal cancer risks, and no substantial evidence was obtained to suggest that occupational exposure to nickel or any of its compounds was likely to produce cancers elsewhere than in the lung or nose. No excess of any type of cancer was observed in the cohorts that did not show an excess of cancer of the lung and nose… …Although the investigation did not provide dose-specific estimates of risks for individual nickel species, it is possible to comment on the cancer risks associated with the level of airborne nickel to which the general population is exposed. The evidence…suggests that respiratory cancer risks are primarily related to exposure to soluble nickel at concentrations in excess of 1 mg Ni/m3 and to exposure to less soluble forms at concentrations greater than 10 mg Ni/m3. With excess risks being confined to these high levels of exposure and the absence of any evidence of hazard from metallic nickel, it can be concluded that the risk to the general population from exposure to the extremely small concentrations (less than 1 ug Ni/m3 to which it is exposed in the ambient air is minute, if indeed there is any risk at all.” (IARC 1990)
Additional reviews of the respiratory cancer risks in Welsh, Finnish and Norwegian nickel refiners support these findings, indicating that water-soluble nickel compounds were central in the development of cancer (even after adjustment for confounders such as smoking, exposure to arsenic, asbestos, sulphuric acid mists, cobalt and occupational lung carcinogens) (Grimsrud & Andersen 2010; Grimsrud et al. 2005; 2002; 2003; 2000; Grimsrud & Peto 2006). These studies also indicated oxidic nickel may be a stronger hazard for nasal cancer than soluble nickel and a multiplicative effect of smoking and total nickel exposure to the risk of lung cancer (Andersen et al. 1996). Other reviews have also concluded that oxidic and sulphidic nickel are carcinogenic via inhalation, but found the carcinogenicity of soluble nickel cannot be determined (TERA 1999). Cohort studies from Canada, Norway, Finland and the UK analysed in the 1990 IARC evaluation of nickel and nickel compounds, indicated elevated risks of lung and nasal cancers among workers involved in nickel sulfide ore smelting and nickel refining processes (high-temperature processing of nickel matte, nickel-copper matte, electrolytic refining and Mond process refining) and exposed to various forms of nickel (metallic nickel, nickel oxides, nickel subsulfide, soluble nickel compounds and nickel carbonyl). Additional support was provided by in vivo and in vitro carcinogenicity studies. In their 2011 evaluation, IARC again concluded that there is an elevated risk of lung and nasal sinus cancer among nickel refinery workers (Grimsrud & Peto 2006; IARC 1990; Anttila et al. 1998; Andersen et al. 1996), and of lung cancer risk among nickel smelter workers (Anttila et al. 1998; IARC 1990). IARC also concluded there is currently no consistent

54
epidemiological evidence to suggest nickel compounds cause cancer at sites other than the lung and nasal cavity (IARC 2011).
IARC (2011) found evidence of elevated risk of lung cancer in humans exposed to nickel chloride (Grimsrud et al. 2003), nickel sulfate, water-soluble nickel compounds in general (Grimsrud et al. 2003; 2002; 2005; Andersen et al. 1996), insoluble nickel compounds, nickel oxides (Andersen et al. 1996; Anttila et al. 1998; Grimsrud et al. 2003), nickel sulfides (Grimsrud et al. 2002) and mostly insoluble nickel compounds (Andersen et al. 1996). An additional study, in which various nickel compounds and lung cancer risk were modelled, identified risk from water-soluble nickel and metallic nickel (Easton et al. 1992). The largest study addressing worker exposure to metallic nickel (in combination with nickel oxide) showed a small but significant elevation in lung cancer risk (Arena et al. 1998). However, IARC (2011) found the available epidemiological data was insufficient to produce entirely separate dose-response analyses for specific nickel compounds.
Data obtained in experimental animals supported the IARC (2011) analysis of the epidemiological study findings, indicating increased lung tumours (regardless of the exposure route). In rats, chronic inhalation of nickel oxide (NTP 1996a), nickel subsulfide (NTP 1996b; Dunnick et al. 1995; Ottolenghi et al. 1975) and nickel carbonyl (Sunderman et al. 1959; 1957) increased the incidence of lung tumours; however, inhalation of metallic nickel did not (Oller et al. 2008). Chronic intratracheal instillation of nickel oxide, nickel subsulfide or metallic nickel increased lung tumours in rats (Pott et al. 1987). In mice, chronic intraperitoneal injection of nickel acetate (Poirier et al. 1984; Stoner et al. 1976) or intramuscular injection of nickel subsulfide (Waalkes et al. 2004) also produced lung tumours. Chronic inhalation of nickel oxide, nickel subsulfide (NTP 1996b; Dunnick et al. 1995) and metallic nickel (Oller et al. 2008) was also associated with increased adrenal medulla pheochomocytoma in rats. Lung tumour formation did not increase after chronic inhalation of nickel sulfate in rats (NTP 1996c; Dunnick et al. 1995), gavage exposure of rats to nickel sulfate (Heim et al. 2007) or inhalation of nickel subsulfide in mice (Dunnick et al. 1995). Transplacental nickel acetate exposure induced malignant pituitary tumours in rat pups (Diwan et al. 1992). In addition, various nickel compounds (nickel oxides, nickel sulfides, including nickel subsulfide, nickel sulfate, nickel chloride, nickel acetate, nickel sulfarsenide, nickel arsenide, nickel antimonide, nickel telluride, nickel selenide, nickelocene and metallic nickel) administered by repository injection caused local sarcomas in multiple studies and models (cited in IARC 2011).
6.8.3 Carcinogenic mode of action
According to the "Nickel-Ion (Bioavailability) Hypothesis" (Hansen & Stern 1983; Goodman et al. 2011; Costa et al. 1981), the carcinogenic potential of the various nickel compounds appear to be a function of the capacity to raise the intracellular concentration of nickel ions and the duration of the increase. The intracellular nickel concentration is a function of the exposure concentration, nickel species, particle size and duration of exposure.
Fluorescent labeling studies have been used to compare the cellular uptake of soluble and insoluble nickel compounds. Both soluble and insoluble nickel compounds were able to elevate Ni2+ concentrations in the cytoplasmic and nuclear compartments of the human bronchial epithelial adenocarcinoma A549 cell line after 8 hr incubation; however, when the nickel source was removed, intracellular Ni2+ derived from NiCl2 was lost from the cells significantly faster

55
than that derived from Ni3S2 (Ke et al. 2007). In the human THP-1 monocyte-macrophage cell line, the time of initial exposure appeared to be a critical factor in the reversibility of soluble Ni uptake: as the initial exposure period increased, the loss of soluble nickel slowed and a greater percentage of cellular nickel was found in the nucleus. Increased nickel retention appeared to be a function of the distribution (i.e., to the nucleus, and nucleoli, which increased from 25% after a 8 hr incubation to 60% after 48 hr) and/or binding, and was not merely the result of increased uptake with prolonged incubation (Edwards et al. 1998). Similar reductions in the rate of release of cellular Ni2+ as the initial exposure period increased were reported in mouse fibroblast cell lines cultured with 63NiCl2, although intracellular nickel concentrations were higher than those reported for human macrophages in Edwards et al. (1998): only 36% of the 63Ni2+ was found in fibroblast nuclei after 48hr (Webb & Weinzierl 1972; Wataha et al. 1992). In HaCaT human keratinocytes cultured with 0.1 and 1 mM 63NiCl2 for 24 hr, the HaCaT cells were able to take up nickel at concentrations 1.8- to 4-fold greater than those present in the media, suggesting specific intracellular binding sites (which may, in part explain the greater propensity of soluble nickel to remain within the cell after more prolonged incubation); however, the proportion of nickel in the cell pellets (nuclei plus cellular membranes) after lysis never exceeded 4.4% of total cellular nickel (Ermolli et al. 2001).
These results indicate that nuclear nickel may be elevated in the continuous presence of any form of nickel. For insoluble nickel particles, intracellular levels are expected to be high as particles are phagocytosed and nickel ions gradually released inside cells, as opposed to the more rapid clearance of soluble nickel (due to maintenance of fluid balance by fluid pinocytosis or other mechanisms; see Cellular Uptake). The greater carcinogenic activity of crystalline nickel sulfides may therefore be a function of greater and more persistent Ni2+ accumulation in the cell and/or nucleus than can occur after exposure to soluble nickel salts. Such differences may be particularly important for single or intermittent (e.g., occupational) exposure, but may be less distinct with more prolonged exposure. After 1-3 day exposures to crystalline nickel particles, genes placed near heterochromatin are epigenetic silenced, an effect not seen after similar short-term exposure to soluble nickel compounds; however, a 3-week exposure to soluble NiCl2 is also able to induce gene silencing (Costa et al. 2005). Alternately, solubilisation of crystalline nickel may form a more carcinogenic intermediate (as yet unidentified). Soluble nickel may nonetheless have extranuclear effects (e.g., at the cell membrane to alter signal transduction) in target cells; although not sufficient to induce tumours by themselves, may enhance tumour induction by co-exposures to other carcinogenic substances (e.g., Ni3S2, cigarette smoke) (cited in Costa et al. 1981; Fletcher et al. 1994; Goodman et al. 2011; Ke et al. 2007). Cigarette smoking has been postulated to cause the transformation of respiratory epithelium to squamous epithelium, which may promote and enhance the carcinogenic effects of inhaled nickel from the occupational atmosphere of nickel industry workers (Torjussen et al. 2003).
A recent weight of evidence review of the carcinogenicity of water-soluble nickel compounds concluded there was no evidence that soluble nickel compounds act as complete carcinogens (Goodman et al. 2009); however, soluble species are suspected to enhance the carcinogenicity of insoluble nickel species (ATSDR 2005; OMOE 2004).
Available data indicate nickel has a limited capacity to interact directly with DNA to produce mutagenic effects (cited in IARC 2011). However, nickel produces significant alterations in cellular metabolism, including stimulation of glycolytic activity, alteration of iron homeostasis,

56
depletion of ascorbate and hypoxic stress, which lead to the modulation of gene expression through epigenetic changes. Co-exposure to genotoxic carcinogens may exacerbate the genotoxic effects of nickel (cited in Salnikow et al. 1999).
6.8.4 Classification
Health Canada (1996) and several other agencies classify nickel as a human carcinogen via inhalation. Health Canada (1996) includes oxidic, sulphidic and soluble nickel in Group I (carcinogenic to humans) via the inhalation route. This is supported by both human epidemiological studies and laboratory animal carcinogenicity studies. Health Canada (1996), the US EPA (1996), WHO (2002) and the European Commission (Eur Comm 2007; 2001) have calculated unit risk values for various species of nickel via inhalation. Both cancer and non-cancer endpoints are significant in the toxicological evaluation of nickel. Nickel refinery dust (most of which is believed to be nickel subsulphide) and Ni3S2 are classified as a Class A carcinogens (carcinogenic to humans) by the US EPA (1996) based on human data where lung and nasal tumours were elevated in exposed workers and on rat data in which carcinomas were produced by inhalation and injection (e.g., Sunderman 1984; Sunderman & Horak 1981). The US EPA also classifies nickel carbonyl as a probable human carcinogen (Group B2) based on the incidences of pulmonary carcinomas and malignant tumours in rats after inhalation and intravenous injection.
The International Agency for Research on Cancer (IARC 1990) evaluation recognised all Ni2+ compounds as human carcinogens (Group 1), and metallic nickel was classified as possibly carcinogenic to humans (Group 2B) (IARC 1990).
In view of the overall findings in animals, IARC (2011) concluded there was sufficient evidence for the carcinogenicity of nickel compounds and nickel metal in experimental animals. IARC (2011) also concluded there was sufficient evidence in humans for nasal and/or pulmonary carcinogenicity of mixtures that include nickel compounds and nickel metal. Based on the Norwegian refinery worker studies, the strongest evidence of association was between exposure to water-soluble nickel compounds and the risk of lung cancer; there was also independent evidence for the carcinogenicity of oxidic and sulfidic nickel compounds.
IARC (2011) acknowledged that nickel metal dust can become solubilised and bioavailable after inhalation. In recognition of the underlying concept that all nickel compounds can generate nickel ions at critical sites in their target cells, provision of separate classifications for nickel and nickel compounds was no longer considered warranted and all nickel compounds were considered carcinogenic to humans (Group 1) (IARC 2011)
6.9 Toxicological Reference Values The potency of nickel appears to be dependent upon its form/speciation in the environment and the route of exposure. For nickel in soils, the most toxic form via oral exposure was considered to be total nickel as soluble salts (predominantly nickel sulphate and nickel chloride). For the inhalation pathway, combined soluble, oxidic and sulphidic nickel species were considered to be of greatest toxicological concern. The toxicity reference values (TRVs) selected for combined oral and dermal exposure and for inhalation exposure are discussed below and summarised as follows:

57
• Combined Oral + Dermal TDI 11µg Ni/kg bw/d
• Inhalation Tolerable Concentration (TC) (non-cancer effects) 0.02 µg/m3
• Inhalation Unit Risk Value (non-threshold effects) 1.3x10⁻³ (µg Ni/m3)-1
6.9.1 Oral Exposure
For evaluation of oral exposures, the TRVs for soluble nickel (including nickel sulphate and nickel chloride) from various agencies were considered. TRVs for soluble forms of nickel were identified from Health Canada (1994), US EPA (1996) and IOM (2001); however, a more recent evaluation from WHO (2005) with a Tolerable Daily Intake (TDI) of 11 µg Ni/kg bw/day, was used for the purpose of this assessment. WHO (2005) developed this TDI based on the EU (2004) re-analysis of the SLI (2000b) two-generation rat study, where a LOAEL of 2.2 mg/kg bw/day (for post-implantation loss and perinatal mortality) and a NOAEL of 1.1 mg/kg bw/day were derived. Using an uncertainty factor of 100 (10-fold for interspecies differences and 10-fold for intraspecies differences), the TDI for nickel, as nickel sulphate, was identified as 11 µg Ni/kg bw/day.
Nickel is not considered to be carcinogenic via the combined oral and dermal routes and, thus, the TDI of 11 µg Ni/kg bw/day is considered to be protective of all endpoints.
Since the estimated daily intake (EDI, an estimate of exposure) is larger than the TDI for certain exposure scenarios for nickel. An alternate approach (sections 8.5.1 and 8.5.2 and Appendix 11) was adopted that is based on a negligible increase to estimated exposure rather than tolerable intakes. This approach is considered conservative while technically applicable.
6.9.2 Inhalation Exposure – Non-Cancer Effects
For evaluation of inhalation exposures, the TRVs for nickel sulphate and nickel oxide from various agencies were considered. Although a TRV for nickel sulphate via the inhalation route was identified from Health Canada (EC and HC 1994), a series of more recent inhalation studies from the National Toxicology Program using nickel sulphate, nickel oxide and nickel subsulphide (NTP 1996a; 1996b; 1996c) have been identified (see Section 6.6.2). The OEHHA (2012) identifies inhalation TRVs for nickel and nickel compounds (except NiO) as well as a separate inhalation TRV for nickel oxide. The inhalation TRV for nickel sulphate and nickel oxide was based on a weight of evidence approach using Environment Canada and Health Canada (1994), ATSDR (2005) and European Commission (2001; 2007) information.
Health Canada (EC and HC 1994) recommended a Tolerable Concentration (TC) of 0.0035 µg Ni/m3 for nickel sulphate based on a LOAEL of 20 µg/m3 (Dunnick et al. 1989), adjustment for less than continuous experimental conditions, and application of a 1000-fold uncertainty factor (10 for interspecies differences, 10 for intraspecies differences and 10 for use of a subchronic study).
Health Canada (1996) recommended a TC of 0.02 µg Ni/m3 for nickel oxide based on a LOAEL of 25 µg Ni/m3 (Spiegelberg et al. 1984) and application of a 1000-fold uncertainty factor (10 for interspecies differences, 10 for intraspecies difference and 10 for use of a subchronic study and minimal effects at the LOAEL).

58
Since the publication of the above TCs, additional research has been completed by NTP (1996a, 1996b; 1996c) that is considered more appropriate for the selection of an inhalation toxicity value (EC 2007; Eur Comm 2001; ATSDR 2005). Consequently, the Health Canada values were not used in a direct quantitative manner as the inhalation TRVs for nickel sulphate and nickel oxide but were considered in the overall analysis.
For nickel sulphate, ATSDR (2005) developed a Minimal Risk Level (MRL) for chronic exposures (a TRV that is essentially equivalent to the Health Canada term “Tolerable Concentration” and defined as estimates of daily human exposures to a substance that would not cause appreciable risk of non-carcinogenic adverse human health effects over specified exposure durations [Chou et al. 1998] based on NTP (1996a). The ATSDR derives MRLs by dividing a NOAEL by an uncertainty factor. For inhalation exposures, a regional deposited dose ratio (RDDR) is used to derive a human equivalent concentration for particles from animal exposure studies when no adequate human data are available. The RDDR is used to adjust the exposure effect level for interspecies dosimetric differences for a given exposure in an animal species to the same exposure in a human (US EPA 1994).
The LOAEL based on active lung inflammation in the NTP (1996a) two-year nickel sulphate inhalation study on rats was reported to be 60 µg Ni/m3, while the NOAEL was identified to be 30 µg Ni/m3 (see Section 6.6.2). ATSDR (2005) then estimated a chronic MRL based on:
• Use of the NOAEL of 30 µg/m3; a time adjusted NOAEL (NOAELADJ) of 5.4 µg/m3 (i.e., 30 µg/m3 x 6 hr/24 hr x 5 days/7 days); a NOAEL human equivalent concentration (NOAELHEC) of 2.7 µg/m3 (i.e., NOAELHEC = NOAELADJ by the Regional Deposited Dose Ratio [RDDR], of 0.506) (i.e., 5.4 µg/m3 x 0.506 = 2.7 µg/m3); and, an uncertainty factor of 30 (3-fold for interspecies differences with dosimetric adjustment and 10-fold for intraspecies differences).
Based on the above NTP studies, ATSDR calculated a chronic MRL of 0.090 µg Ni/m3 for nickel sulphate as follows:
MRL =NOAEL × Time Adjustment × RDDR
Uncertainty Factor
=30 µg m3⁄ × 6 hr 24 hr × 5 days 7 days × RDDR⁄⁄
30
= 0.090 µg Ni m3⁄
Using the same NTP studies as above, the European Commission (2007) recommended an air quality standard of 0.020 µg Ni/m3 for nickel (all forms) for protection of cancer and non-cancer effects. To develop a “limit value” for nickel sulphate (which is then assumed to represent all forms of nickel), the European Commission (2001) relied upon the NTP (1996a) nickel sulphate study. Contrary to the ATSDR (2005) interpretation, the European Commission (2001) concluded that there was no clear NOAEL in rats or mice, as they concluded that there was a possible increased rate of fibrosis in rats at 30 µg/m3, and based their analysis on a statistically significant LOAEL of 60 µg/m3 in both mice and rats. The European Commission (2001) then calculated an upper limit based on the following:

59
• Use of a LOAEL of 60 µg/m3; a time adjusted LOAEL (LOAELADJ) of 11 µg/m3 (i.e., 60 µg/m3 x 6 hr/24 hr x 5 days/7 days); and an uncertainty factor of 1000 (10-fold for interspecies differences, 10-fold for intraspecies differences and 10-fold for use of a LOAEL).
Based on the above, an upper limit was calculated as follows:
UL =LOAEL ∗ Time Adjustment
Uncertainty Factor
=60µg/m3 × 6hr/24hr × 5 days/7days
1000
= 0.011 µg Ni/m3
The European Commission (2001) noted that if a NOAEL approach (i.e.,30 µg/m3) was used, the upper limit would have been 0.05 µg/m3 (same time adjustment but an uncertainty factor of 100). Thus, they (Eur Comm 2001) recommended that the upper limit value for nickel should be between 0.010 and 0.050 µg/m3, which are also considered protective of an incremental lifetime cancer risk of 1 in 1 000 000.
Based on the above range, the EU (2008) recommended an air quality standard of 0.020 µg/m3. It is not clear how this specific value was selected from the range of values available but this value lies toward the lower end of acceptable values.
Overall, for the purposes of SQGHH development, a Tolerable Concentration of 0.020 µg Ni/m3 was assumed for both nickel sulphate and nickel oxide for protection of non-cancer effects. This value is based on the air quality standard recommended by the EU (2008) for nickel sulphate, as well as the TC of 0.02 µg Ni/m3 for nickel oxide (HC 1994). The LOAEL and NOAEL derived from the NTP (1996a; 1996b; 1996c) studies are considered more relevant than the LOAEL from Dunnick et al. (1989) because the NTP studies were chronic studies (2 year study) compared to the subchronic study (13 weeks) by Dunnick et al. (1989). The TC of 0.02 µg Ni/m3 recommended by the EU (2008) for all forms of nickel for the protection of non-cancer effects is the same value as the TC for nickel oxide based on Spiegelberg et al. (1984) established previously (HC 1996).
6.9.3 Inhalation - Carcinogenic Effects
Health Canada (1996) provided a TC05 of 40 µg Ni/m3 for exposure to combined oxidic, sulphidic and soluble nickel, based on the estimated TC05 for lung cancer mortality for the same combination of compounds from concentrations of 40-1000 µg/m3 in mining, smelting and refining operations in Ontario and Norway (IARC 1990). In calculating nickel cancer potency, Health Canada (1996) reported that lung cancer was a more sensitive endpoint than nasal cancer. The TC05 corresponds to a unit risk value of 1.3 x 10⁻³ (µg Ni/m3)-1 and risk specific concentrations of 0.0008 µg/m3 and 0.008 µg/m3 for an incremental lifetime cancer risks of 1 x 10⁻⁶ and 1 x 10⁻⁵ respectively. The values for protection of carcinogenic effects are more stringent than the Tolerable Concentration of 0.02 µg Ni/m3 for protection of non-cancer effects (see Section 6.9.2).
60
In addition to the TC05 for oxidic, sulphidic and soluble nickel, Health Canada (1996) provided a soluble nickel salts TC05 of 70 µg/m3 for lung cancer mortality based on data from an epidemiology cohort study from Norway (IARC 1990). Soluble nickel was considered to consist primarily of nickel sulphate and nickel chloride. This TC05 corresponds to a unit risk value of 7.1 x 10⁻⁴ (µg Ni/m3)-1 and risk specific concentrations of 0.0014 µg/m3 and 0.014 µg/m3 for an incremental lifetime cancer risks of 1 x 10⁻⁶ and 1 x 10⁻⁵ respectively. These values are more stringent than the Tolerable Concentration of 0.02 µg/m3 for protection of non-cancer effects (see Section 6.9.2).
Some research has indicated that soluble nickel salts may not be carcinogenic in the absence of other forms of nickel. Using US EPA guidelines for assessment of carcinogenicity, TERA (1999) concluded that soluble nickel by itself should be considered to be unclassifiable with respect to carcinogenic potential (i.e., Class D). Nevertheless, the more sensitive TRV for combined oxidic, sulphidic and soluble nickel was used for derivation of SQGHH for nickel; therefore, this SQGHH would be protective of potential carcinogenic effects associated with exposure to soluble nickel salts alone.
Overall, a unit risk value of 1.3 x 10⁻³ (µg Ni/m3)-1 was used for nickel sulphate and nickel oxide for the purposes of SQGHH development, for protection of carcinogenic effects.

61
7 DERIVATION OF ENVIRONMENTAL SOIL QUALITY GUIDELINES Canadian soil quality guidelines are derived for the protection of receptors under four different land uses: agricultural, residential/parkland, commercial and industrial. The derivation of the following environmental soil quality guidelines are based on “A Protocol for the Derivation of Environmental and Human Health Soil Quality Guidelines” (CCME 2006). The information presented in this chapter builds upon, and adds to, data collected and evaluated for the derivation of the original Canadian Soil Quality Guideline for nickel in 1999 (EC 1999), and first published in CCME (CCME 1999).
This chapter describes the derivation of the Soil Quality Guidelines for Soil Contact, Nutrient and Energy Cycling check, Soil Quality Guidelines for Soil and Food Ingestion and Off-site migration check. The Soil Quality Guidelines for the Protection of Freshwater Life and the Soil Quality Guidelines for the Protection of Livestock Watering and Irrigation Water were not derived because the soil protocol (CCME 2006) does not evaluate subsurface transport of inorganic compounds. Concerns about soil based inorganic contaminants impacting water resources should be addressed on a site-specific basis.
7.1 Agricultural and Residential/Parkland Land Uses
7.1.1 Soil Quality Guidelines for Soil Contact
The derivation of the soil quality guidelines for soil contact (SQGSC) is based on toxicological data for vascular plants and soil invertebrates. The toxicological data available for plants and invertebrates are presented in Chapter 4 and Appendix 3 (plants) and Appendix 4 (invertebrates). Data in the Appendices that are listed as “Selected” were considered during guideline development, while those listed as “Consulted” were not considered acceptable for guideline derivation. Common reasons for classifying a study as consulted include test soil properties which may result in conditions of excessively high (e.g., <pH 4) or low bioavailability (e.g., high OM), study information lacking, improper or lacking statistics, controls, or replication, or no obvious dose-response relationship. A total of 12 plant studies covering 16 species and 147 endpoints, and 9 invertebrate studies covering 7 species and 51 endpoints were acceptable for use (i.e., toxicity studies that were classified as “Selected”). All acceptable endpoints were screened to ensure that only the most appropriate endpoints, and derivation method, were retained in guideline derivation. Briefly, the screening criteria are (see section 7.5.5.1 of CCME 2006);
• If multiple endpoints exist from a single study, only discrete endpoints were used, e.g., if a study reported an EC25 and EC50 from the same experiment, only one endpoint was used. EC25 and/or IC25 endpoints were preferred (or ECx or ICx where “X” is close to 25)
• Biologically relevant effects were preferred (e.g., growth over physiological) • Studies with longer test durations were preferred • Endpoints expressed as > X mg/kg were not used Two EC25s for alfalfa (Kapustka et al. 2006) were combined due to similar responses, and test conditions, in two separate soils (EC25 for alfalfa total dw/plant used in guideline derivation = 31.8 mg/kg = √(33.9 mg/kg × 29.8 mg/kg)). In contrast, oat and barley are represented more than once in the derivation data set (twice each) because of varying responses potentially due to
62
different soil conditions. Significant positive relationships between cation exchange capacity (CEC) and EC10 and EC50 21-d tomato shoot growth were reported in 16 European soils (p <0.001, each). The EC50 (50% inhibition) ranged from 17 to 920 mg/kg in the 16 soils (Rooney et al. 2007). To account for the variation in response due to different soil types, but not to bias the guideline data set with too many tomato data points, a total of two data points were selected from Rooney et al. (2007) as follows; a geometric mean of EC20s were taken from soils with CEC <12 cmol/kg, and a separate geometric mean from soils with CEC >12 cmol/kg (CEC median value was ~12 cmol/kg). Four soils were omitted from the calculations because of, pH <4 (Houthalen, Belgium), elevated background levels of nickel (Souli, Greece; Brécy, France) and the estimated effect concentration is less than the lowest added nickel dose (Aluminusa, Italy). The resulting data points are 55 mg/kg and 280 mg/kg for 21-d EC20 tomato shoot growth.
The minimum data requirements for use of the preferred weight-of-evidence approach for guideline derivation were met using an EC25 (or IC25) distribution. The resulting data-points for plants, 16 data-points from 13 species, and invertebrates, 5 data-points from 5 species, were combined in an “estimated species sensitivity distribution" in which the rank percentile was plotted against observed effect concentrations on a log scale (Figure 1). There were insufficient invertebrate data (minimum 10 data-points needed) to derive separate soil contact guidelines for plants and invertebrates.
The threshold effects concentration (TEC) was calculated as follows:
TEC =ESSD25
UF
where, TEC = threshold effects concentration (mg/kg) - i.e., guideline value ESSD25 = estimated species sensitivity distribution - 25th percentile of the distribution (mg/kg) UF = uncertainty factor (if needed); no uncertainty factor was applied.
A total of 21 acceptable EC20 or EC25 were ranked and the 25th percentile is used as the basis for the soil contact guidelines for agricultural and residential/parkland land uses (CCME 2006). The 25th percentile of the ESSD corresponds to a rank of 5.5. The 5th and 6th ranked data points in the distribution were 42 mg/kg and 47.3 mg/kg, respectively. A value was interpolated for rank 5.5 (25th percentile) as follows;
ESSD25= rank 5 + 0.5 × (rank 6- rank 5)
= 42 mg/kg + 0.5 × (47.3 mg/kg – 42 mg/kg)
= 44.7 mg/kg
The Threshold Effects Concentration is calculated as 44.7 mg/kg, and is rounded to two significant figures to equal 45 mg/kg.
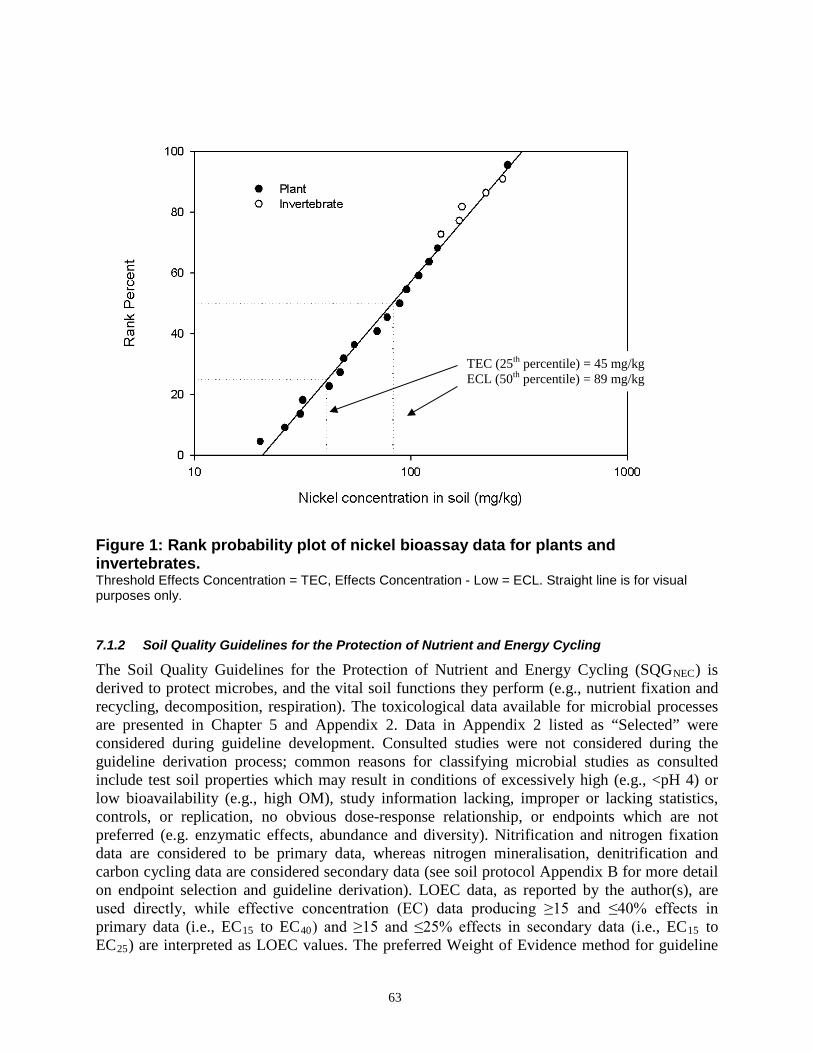
63
Figure 1: Rank probability plot of nickel bioassay data for plants and invertebrates. Threshold Effects Concentration = TEC, Effects Concentration - Low = ECL. Straight line is for visual purposes only.
7.1.2 Soil Quality Guidelines for the Protection of Nutrient and Energy Cycling
The Soil Quality Guidelines for the Protection of Nutrient and Energy Cycling (SQGNEC) is derived to protect microbes, and the vital soil functions they perform (e.g., nutrient fixation and recycling, decomposition, respiration). The toxicological data available for microbial processes are presented in Chapter 5 and Appendix 2. Data in Appendix 2 listed as “Selected” were considered during guideline development. Consulted studies were not considered during the guideline derivation process; common reasons for classifying microbial studies as consulted include test soil properties which may result in conditions of excessively high (e.g., <pH 4) or low bioavailability (e.g., high OM), study information lacking, improper or lacking statistics, controls, or replication, no obvious dose-response relationship, or endpoints which are not preferred (e.g. enzymatic effects, abundance and diversity). Nitrification and nitrogen fixation data are considered to be primary data, whereas nitrogen mineralisation, denitrification and carbon cycling data are considered secondary data (see soil protocol Appendix B for more detail on endpoint selection and guideline derivation). LOEC data, as reported by the author(s), are used directly, while effective concentration (EC) data producing ≥15 and ≤40% effects in primary data (i.e., EC15 to EC40) and ≥15 and ≤25% effects in secondary data (i.e., EC15 to EC25) are interpreted as LOEC values. The preferred Weight of Evidence method for guideline
Ran
k Pe
rcen
tile
TEC (25th percentile) = 45 mg/kg ECL (50th percentile) = 89 mg/kg

64
derivation could not be used because no nitrogen fixation studies were available. The modified LOEC method was used to derive the guideline using both primary (1 nitrification data point) and secondary data (8 data points covering nitrogen or carbon mineralisation).
The Soil Quality Guideline for the Protection of Nutrient and Energy Cycling (SQGNEC) was calculated as follows:
SQGNEC = (LOEC1 × LOEC2 × LOEC3 × … LOECn)l n⁄ where, SQGNEC = nutrient and energy cycling check (mg/kg) LOEC = lowest observed effect concentration, or ECx equivalent (mg/kg) n = number of available LOECs thus,
NEC= (10×100×100×100×250×294×294×583×1000)1/9
= 171 mg/kg
The Soil Quality Guideline for the Protection of Nutrient and Energy Cycling (SQGNEC) for agricultural and residential land uses is 171 mg/kg.
7.1.3 Soil Quality Guidelines for Soil and Food Ingestion
The soil quality guideline for soil and food ingestion (SQGI) for nickel applies only to agricultural land use.
Calculation of the Daily Threshold Effect Dose Calculation of the SQGI is based on the lowest-observed-adverse-effects level (LOAEL) taken from the mammalian and avian toxicological data listed in Appendices 5 and 6. The lowest LOAEL was 14.6 mg Ni/kg bw/d, which resulted in a 44% reduction in growth rate for Holstein calves over an 8 week period (O’Dell et al. 1971). Two mammalian studies had lower LOECs, however they were not selected because the relevance of decreased sperm cell counts (Pandey & Srivastava 2000) to population viability is unknown, and the biological relevance of an 8% decrease in growth (Adjroud 2011) is considered negligible. For avian toxicity, a LOEC of 0.051 mg Ni/kg bw/d for reduced growth (36% reduction) in laying hens was calculated (Arpasova et al. 2007). This study was not used because there are no corroborating toxicity tests showing similar magnitude of effects at this dose level (see Appendix 6), and two publications by the same group of authors, with a similar experimental design, indicate that test concentrations reported in Arpasova et al. (2007) were likely incorrectly reported as 1000 times lower than the actual test concentrations used (Kolesarova et al. 2008; Capcarova et al. 2008).
The LOAEL is used to calculate the daily threshold effects dose (DTED) according to the equation:
DTED =lowest LOAEL
UF
where, DTED = daily threshold effects dose (mg/kg bw/d)
65
LOAEL = lowest observed adverse effects level (mg/kg bw/d) UF = uncertainty factor; no uncertainty factor was applied as the LOAEL was considered
to be significant. Thus,
DTED = 14.6 mg kg bw d⁄⁄
An animal may be exposed to a contaminant by more than one route. Total exposure comes from a combination of contaminated food, direct soil ingestion, dermal contact, contaminated drinking water and inhalation of air and dust. Exposure from all of these routes should not exceed the DTED. Assuming that drinking water, dermal contact and inhalation account for 25% of the total exposure (CCME 2006), the remaining 75% of exposure is attributed to the ingestion of food and soil. It follows then, that exposure from soil and food ingestion should not exceed 75% of the DTED:
Exposure from direct soil ingestion + Exposure from food ingestion = 0.75 × DTED
7.1.3.1 Exposure from Direct Soil Ingestion
To estimate the exposure of an animal from direct soil ingestion, the rate of soil ingestion must be calculated. The soil ingestion rate is usually calculated by multiplying the dry matter intake rate (DMIR; the ingestion rate of soil and forage together) by the proportion of soil ingested (PSI) (CCME 2006). As an alternative to estimating a DMIR for cattle from the literature, the soil ingestion rate was estimated from the PSI and food ingestion rate as follows:
SIR =FIR × PSI
1 − PSI
where, SIR = soil ingestion rate (kg dw soil/d) FIR = food ingestion rate (kg dw food/d); 5.6 kg/d for Holstein calves (O’Dell et al. 1971) PSI = geometric mean of available soil ingestion proportions reported with DMIR. As no
information is available on the PSI for Holstein calves, a generic default value of 0.082 for cows (McMurter 1993) was used for the above equation.
Thus,
SIR =5.6 kg d × 0.082⁄
1 − 0.082
SIR = 0.5 kg dw soil d⁄ The SIR can then be combined with the bioavailability factor (BF), body weight (BW) and a concentration of the contaminant in the soil (SQGI) to represent the exposure from soil ingestion:
Exposure from soil ingestion =SQGI × SIR × BF
BW
where, SIR = soil ingestion rate (kg dw soil/d) BF = bioavailability factor; due to insufficient information on the bioavailability of nickel
66
from ingested soil for livestock and terrestrial wildlife, a BF of 1 is assumed SQGI = concentration of the contaminant in soil that will not result in >75% DTED (mg/kg) BW = mean body weight (kg); 116 kg for Holstein calves (O’Dell et al. 1971)
The soil concentration at this point is unknown, but it should not be greater than 75% of the DTED when combined with the exposure calculated for food ingestion. 7.1.3.2 Exposure from Food Ingestion
Similar to SIR, the food ingestion rate (FIR) for livestock and wildlife, is expressed as a portion of DMIR (CCME 2006). However, the FIR was taken directly from O’Dell et al. (1971) which reported a food ingestion rate of 5.6 kg dw food/d for the Holstein calves control group. The FIR can then be combined with the bioconcentration factor (BCF), BW and the SQGI to express the exposure from food ingestion:
Exposure from food ingestion =SQGI x FIR x BCF
BW
where, FIR = food ingestion rate (kg dw food/d); 5.6 kg/d for Holstein calves (O’Dell et al. 1971) BCF = bioconcentration factor; calculated from the data on plant accumulation of nickel to be
0.34 (see Appendix 7). SQGI = concentration of the contaminant in soil that will not result in greater than 75% DTED
(mg/kg). BW = mean body weight (kg); 116 kg for Holstein calves (O’Dell et al. 1971) 7.1.3.3 Calculation of the Soil Quality Guidelines for Soil and Food ingestion–Primary Consumers
The equations for exposure from soil ingestion and exposure from food ingestion can be combined and rearranged to solve for the SQGI:
(SQGI × SIR × BF)
BW+
(SQGI × FIR × BCF)BW
= 0.75 × DTED Thus,
SQGI =0.75 × DTED × BW
(SIR × BF) + (FIR × BCF)
SQGI =(0.75 × 14.6 mg kg bw d⁄ × 116 kg⁄ )
(0.5 kg dw soil d⁄ × 1) + (5.6 kg dw food d × 0.34⁄ )
SQGI = 528 mg kg⁄
The Soil Quality Guideline for Soil and Food Ingestion (SQGI) for agricultural land use is 528 mg/kg.

67
7.2 Commercial and Industrial Land Uses
7.2.1 Soil Quality Guidelines for Soil Contact
The derivation of the soil quality guideline for soil contact (SQGSC) is based on toxicological data for vascular plants and soil invertebrates. The SQGSC for commercial and industrial land uses was derived using the same data and weight-of-evidence approach for guideline derivation as described in section 7.1.1 of this chapter.
The effects concentration low (ECL) was calculated as follows:
ECL = ESSD50 where, ECL = effects concentration low (mg/kg) - i.e., guideline value ESSD50 = estimated species sensitivity distribution - 50th percentile of the distribution (mg/kg)
A total of 21 acceptable EC20 and EC25 were ranked and the 50th percentile is used as the basis for soil contact guidelines for commercial and industrial land uses (CCME 2006). The 50th percentile of the ESSD corresponds to a rank of 11. The 11th ranked data-point has a value of 89 mg/kg, therefore, the Effects Concentration - Low was calculated as 89 mg/kg (see Figure 1 from section 7.1.1).
7.2.2 Soil Quality Guidelines for the Protection of Nutrient and Energy Cycling
The Soil Quality Guideline for the Protection of Nutrient and Energy Cycling (SQGNEC) is derived to protect microbes, and the vital soil functions they perform (e.g. nutrient fixation and recycling, decomposition, respiration). The toxicological data available for microbial processes are presented in Chapter 5 and Appendix 2. Data in Appendix 2 listed as “Selected” were considered during guideline development. Consulted studies were not considered during the guideline derivation process; common reasons for classifying microbial studies as consulted include test soil properties which may result in conditions of excessively high (e.g., <pH 4) or low bioavailability (e.g., high OM), study information lacking, improper or lacking statistics, controls, or replication, no obvious dose-response relationship and endpoints which are not preferred (e.g., enzymatic effects, abundance and diversity). Nitrification and nitrogen fixation data are considered to be primary data, whereas nitrogen mineralisation, denitrification and carbon cycling data are considered secondary data. LOEC data, as reported by the author(s), are used directly, while effective concentration (EC) data producing ≥15 and ≤50% effects in primary data (i.e., EC15 to EC50) and ≥15 and ≤35% effects in secondary data (i.e., EC15 to EC35) are interpreted as LOEC values. The preferred Weight of Evidence method for guideline derivation could not be used because no nitrogen fixation studies were available. The modified LOEC method was used to derive the guideline using both primary (13 nitrification data point) and secondary data (13 data points covering nitrogen or carbon mineralisation).
The Soil Quality Guideline for the Protection of Nutrient and Energy Cycling (SQGNEC) was calculated as follows:
SQGNEC = (LOEC1 × LOEC2 × LOEC3 × … LOECn)l n⁄
where,

68
SQGNEC = nutrient and energy cycling check (mg/kg) LOEC = lowest observed effect concentration, or ECx equivalent (mg/kg) n = number of available LOECs thus,
SQGNEC= (10×72×100×100×100×106×116×172×183×183×193×224×235×250× 294×294×294×294×294×294×309×502×583×1000×1982×3086)1/26 =235 mg/kg
The Soil Quality Guideline for the Protection of Nutrient and Energy Cycling (SQGNEC) for commercial and industrial land uses is 235 mg/kg.
7.2.3 Environmental Soil Quality Guidelines for Off-site Migration
When deriving soil quality guidelines for commercial and industrial sites, exposure scenarios only consider on-site exposure. However, transfers of contaminated soil from one property to another are possible by environmental routes such as wind and water erosion (CCME 2006).
The environmental soil quality guideline for off-site migration (SQGOM-E) refers to the concentration in soil eroded from a commercial or industrial site that will raise the contaminant concentration in an adjacent, more sensitive land (e.g., agricultural property) within a specific time frame. The purpose or the SQGOM-E is to establish commercial or industrial soil guidelines that will not result in unacceptable adverse effects (i.e., not to exceed agricultural guideline) to more sensitive land uses due to contaminant migration over a specified time period. The SQGOM-
E was derived as follows:
SQGOM−E = 14.3 × SQGE−agricultural land use − 13.3 × BSC where,
SQGOM-E = environmental soil quality guideline for off-site migration (mg/kg); SQGE-agricultural land use = environmental soil quality guideline (SQGE) for agricultural land use (45
mg/kg; see Table 5); BSC = background concentration of nickel in the receiving soil (26.8 mg/kg, see
Section 2.5.4).
The environmental soil quality guideline for off-site migration (SQGOM-E) is 287 mg/kg.
7.3 Final Environmental Soil Quality Guidelines The environmental soil quality guidelines are derived using the available toxicological data to determine the threshold level of effects for key ecological receptors. Exposure from direct soil contact is the primary derivation procedure used for calculating environmental quality guidelines for residential/parkland, commercial and industrial land uses. Exposure from direct soil contact as well as soil and food ingestion are considered in calculating guidelines for agricultural land use, with the lower of the two values generated from these derivation procedures being recommended as the environmental soil quality guideline for this land use. In addition to these primary derivation procedures, check mechanisms such as the nutrient and energy cycling and off-site migration are used to consider additional important direct and indirect soil exposure pathways. The soil contact and nutrient and energy cycling guidelines are applicable to soils
69
within the pH range of 4.0 to 8.6, as the toxicological studies upon which these guidelines are based were conducted within this pH range.
Agricultural Land Use The final environmental soil quality guideline (SQGE) is the lowest of the values calculated for all exposure pathways applicable for nickel (i.e., the lower of the SQGSC, SQGNEC and SQGI) for this land use. Therefore, the SQGE for agricultural land use is 45 mg Ni/kg soil, based on the SQGSC.
Residential/Parkland Land Use
For contaminants that do not bioaccumulate and/or biomagnify, the SQGE is the lowest of the values calculated for all exposure pathways applicable for nickel (i.e., the lower of the SQGSC and SQGNEC) for this land use. Therefore, the SQGE for residential/parkland use is 45 mg Ni/kg soil, based on the SQGSC.
Commercial and Industrial land uses
The SQGE is the lowest of the values calculated for all exposure pathways applicable for nickel (i.e., the lowest of the SQGSC and SQGNEC) for this land use. The SQGE may also be modified by the environmental soil quality guideline for off-site migration (SQGOM-E). Therefore, the SQGE for commercial and industrial land uses is 89 mg Ni/kg soil, based on the SQGSC.

70
8 DERIVATION OF HUMAN HEALTH SOIL QUALITY GUIDELINES
8.1 Protocol Human health soil quality guidelines describe concentrations of substances in soil at or below which no appreciable risks to human health are expected. In order to derive a quantitative guideline, it is necessary to define one or more scenarios by which exposure will occur. This assessment has been prepared assuming an urban setting, because 80% of the Canadian population resides in urban and suburban areas (Statistics Canada 2005). Given that 84% of these urban dwellers receive treated water supplies, mostly from surface water sources (EC 2005), the most likely route of exposure to contaminants in soil is expected to be direct contact with soil.
Human health Canadian soil quality guidelines are defined for agricultural, residential/parkland, commercial and industrial land uses according to the Protocol for the Derivation of Environmental and Human Health Soil Quality Guidelines (CCME 2006). Receptor characteristics, typical intake values for environmental media and estimated daily intakes used to calculate the human health SQGs are summarised in Appendices 8, 9 and 10 and are discussed in the relevant sections of this document.
As per the CCME (2006) protocol for inorganic parameters, human health soil quality guidelines are developed for the following three direct exposure pathways: soil ingestion, dermal contact with soil and inhalation of soil particulates. Health effects were assumed to be similar for exposures via the ingestion and dermal contact pathways; therefore, a single direct human health-based soil quality guideline (SQGDH) for combined ingestion and dermal contact exposures was developed for each land use category.
Exposure via the inhalation pathway is expected to result in different types of health effects. Therefore, separate soil quality guidelines were developed for exposures via inhalation of soil particles.
Nickel is not considered to be carcinogenic to humans via ingestion (see Section 6.2) and is therefore treated as a threshold toxicant for derivation of human health soil guidelines for soil ingestion and dermal contact (CCME 2006). For threshold toxicants two key factors are considered in the setting of soil guidelines in Canada. First, it is recognised that, exclusive of hazardous waste sites or any other point source of pollution or elevated exposure attributable to lifestyle choices, everyone is exposed to a "background" level of contamination that cannot be avoided. For nickel (as total), this background exposure arises primarily from foods. In setting soil quality guidelines for inorganic, threshold substances, the background estimated daily intake (EDI) is subtracted from the Tolerable Daily Intake (TDI) before guidelines are derived using the approach outlined by CCME (2006). In addition to using CCME (2006) approach, an alternative approach (Appendix 11) was also used to set soil quality guidelines for nickel (as total) to address issues when the EDI approaches or exceeds the TDI.
Secondly, a multimedia approach to guideline development has evolved whereby guidelines for one medium are established recognising that guidelines for other media may also be required. Guidelines must be established in a manner such that total simultaneous exposure at the guideline levels for all media will not result in exposure which exceeds the TDI. Therefore, in order to set soil guidelines for threshold contaminants, some portion of the residual tolerable daily intake (TDI-EDI) must be attributed to each medium. As recommended by CCME (2006),

71
20% of the residual tolerable daily intake for threshold (non-carcinogenic) toxicants was apportioned to each environmental medium, namely air, water, soil, food and consumer products.
Nickel is considered a potential carcinogen via the inhalation pathway. Therefore, for the derivation of the direct human health-based soil quality guideline for particulate inhalation pathway (SQGDH-PI), nickel was treated as a non-threshold toxicant (a substance for which there is considered to be some probability of harm for the critical effect at any level of exposure). The appropriate derivation for a soil quality guideline, therefore, employs a critical RSD (risk specific dose), based on incremental lifetime cancer risks (ILCR) from inhalation of soil-borne particulates. For all land uses, the adult was chosen as the receptor when considering lifetime cancer risk (CCME 2006).
The CCME Soil Quality Guidelines Task Group recommends the development of a soil guideline for a non-threshold toxicant based on an incremental risk from soil exposure of 10-6 or 10-5 (CCME 2006) (i.e., an incremental risk of 1 in 1 000 000 or 1 in 100 000, respectively) above background. Health Canada considers an incremental risk of less than 10-5 to 10-6 to be "essentially negligible" for the purpose of deriving Maximum Acceptable Concentrations (MACs) for carcinogenic chemicals in drinking water (NHW Canada 1989). Some provinces in Canada have adopted through policy an acceptable incremental lifetime cancer risk (ILCR) of 10-5, and others have chosen 10-6. Therefore, soil quality guidelines that are based on a cancer endpoint in humans associated with ILCRs of both 10-6 and 10-5 are presented in this document.
In addition to the direct contact soil quality guidelines, the CCME (2006) protocol includes the derivation of two check values for inorganic substances: 1) consumption of produce, meat and milk and 2) off-site migration of contaminated soil. The check values are considered to be “Management Adjustment Factors” and may or may not be included in the calculation of the overall human health soil quality guideline, based on professional judgement and the information available on the substance under consideration.
8.2 Estimated Daily Intake Estimated daily intakes (EDIs) for the Canadian population have been derived on the basis of the environmental concentrations of nickel in background environmental media that are not associated with contamination (see Section 2.5). In general, the EDI is an estimate (in µg/kg bw/day) of the typical total concurrent background exposure from all known or suspected sources via a multimedia exposure assessment for the average Canadian. It does not include exposures that may occur from a contaminated or remediated site, or activities that may result in increased exposure of substances, not considered background exposure.
CCME prescribes the use of an EDI estimated using a deterministic approach (CCME 2006). Recently, Health Canada developed a probabilistic approach to estimating the EDI (HC 2011). In 2010, the CCME Soil Quality Guidelines Task Group (SQGTG) accepted that a probabilistic approach to estimate the EDI could be used instead of a deterministic approach as data and substance-specific characteristics warrant. In the case of nickel, data were sufficient to determine a probabilistic EDI and that approach was used herein to determine the SQGDH. The EDI methodology is briefly described below and more information is available in Health Canada (2011).
The EDI calculation is illustrated in the equation below (CCME 2006):

72
EDI = �EDi
n
i=1
The EDIs are intended to represent the average exposure that the Canadian general population may receive from nickel. The general population is subdivided into five age classes including infants (birth to 0.5 years), toddlers (>0.5 to 4 years), children (5 to 11 years), teenagers (12 to 19 years) and adults (>20 years). The following media were considered in calculating the EDI: ambient air, indoor air, indoor dust, soil, drinking water, food and breast milk (for breastfed infants). Consumer products were not included in the EDI estimate because there are limited data for this medium. The equation below illustrates the media- and pathway-specific EDI calculation (CCME 2006):
EDi =C × CR × BF × EF
BW
where, EDi = exposure dose from pathway i (mg/kg-day) C = contaminant concentration in medium (e.g., mg/L) CR = media specific contact rate (e.g., L/day) BF = bioavailability factor (unitless) EF = exposure factor (i.e., exposure frequency (events/year) x exposure duration
(years/lifetime)) BW = body weight (kg)
Appendices 8 and 9 list the receptor characteristics used to develop the EDIs including: body weights and intake rates of air, drinking water, soil and dust for each specified age group of the population. Appendix 10 summarises the typical concentrations of nickel in environmental media and the daily intake estimates for nickel via all media for four age classes of the Canadian general population.
The estimated median daily intakes for adults, teenagers, children and toddlers are 3.8, 4.7, 7.7 and 10.6 µg Ni/kg bw/d. For infants up to 6 months, the EDI can range from 1.8 µg Ni/kg bw/d, for exclusively breast fed infants to 12 µg Ni/kg bw/d for non-breast fed infants. For the purpose of soil quality guidelines derivation, the EDI for toddlers and adults were used.
8.3 Nickel Speciation in the Environment Nickel may exist in a variety of forms, including soluble (primarily nickel sulphate and nickel chloride), oxidic, sulphidic and metallic species.
8.3.1 Soil and Dust
Data on nickel speciation in soil are limited to sites in the vicinity of nickel processing facilities. These data suggest that nickel in soil is predominantly in the form of oxides and hydroxides with smaller contributions of metallic nickel and nickel sulphide (SARA 2008; OMOE 2002) (section 3.5). Soil speciation data is not available for sites that are free of the influence of nickel processing facilities.

73
For the purposes of SQG development, soluble nickel species are considered the most relevant for development of the SQGs for oral and dermal exposure because they are generally considered more potent than insoluble species and soluble nickel species are expected to comprise a significant proportion of total nickel in soils. Nickel sulphate has been chosen for the development of the Tolerable Daily Intake (TDI) used in this SQG (section 6.9.1). Nickel sulphate serves as a surrogate, in this case, for soluble nickel species which are, generally, more bioaccessible than insoluble species (section 6.3).
8.3.2 Air
Speciation data from the PM10 fraction of ambient air samples collected in several locations in Ontario, Canada indicate that nickel is present primarily in soluble forms with a significant contribution of oxidic forms (OMOE 2004; 2011a) (section 3.1). The predominant forms of nickel in total suspended particulate samples collected from both urban and industrial sites in Germany were nickel oxides and soluble nickel species with a small fraction of sulphidic and metallic nickel species (Füchtjohann et al. 2001). Speciation data from ambient air samples suggest that soluble and oxidic forms would be the primary forms present.
For the purposes of SQG development, oxidic, sulphidic and soluble nickel species were considered most relevant for inhalation exposure based on the following:
• Nickel in ambient air is expected to exist primarily as a combination of oxidic and soluble species.
• Oxidic and sulphidic forms of nickel are also considered carcinogenic via inhalation and soluble nickel species are suspected to enhance the carcinogenicity of these insoluble species.
• For the purpose of SQG derivation, a conservative inhalation toxicity reference value was identified as the speciation of nickel is unknown at all sites. The inhalation toxicity reference value applies to nickel in fugitive dust from soils, where speciation is unknown, rather than the species of nickel which may be common in ambient air.
8.4 Relative Absorption Factors Relative absorption factors (RAF) may be applied when the critical toxicological study used a different medium than that under investigation, in order to account for the difference in absorption of the contaminant by the body from the two different media (HC 2010).
An RAF of 100% was assumed for inhalation since inhalation epidemiological studies were used to derive the TRVs for inhalation exposure (section 6.9.2 and 6.9.3) and it is assumed that nickel adsorbed to soils in fugitive dust would have a similar bioavailability as that of nickel adsorbed to particles in the epidemiological studies.
Nickel was administered to test animals by gavage in water in the critical study used to develop the TRV for oral exposure (section 6.9.1) and this TRV was also used to assess dermal exposure since no dermal TRV was identified. The bioavailability of nickel in soil via oral exposure will vary significantly depending on factors such as soil conditions, the form of nickel present in the soil and gastrointestinal conditions. There is insufficient information to relate the bioavailability of nickel in Canadian soils for the purpose of guideline derivation to that of nickel in water

74
administered via gavage in the critical study used to derive the TRV. Therefore, a relative absorption factor of 100% was selected for exposure via ingestion.
Moody et al. (2009) derived a dermal absorption of 1% for nickel in soil based on in vitro dermal absorption of soluble nickel across human skin (section 6.4.2.3.1). The relative dermal absorption factor (e.g., dermal absorption relative to absorption via oral exposure) is calculated by adjusting for absorption efficiency in the principle study used to derive the oral TRV (section 6.9.1). This can be calculated according to the following formula:
Relative dermal absorption factor =Absolute dermal absorption rate
Absolute oral absorption rate in TRV study
A relative dermal absorption factor of 0.091 was calculated, based on the dermal absorption of 1.0% reported in Moody et al. (2009) for nickel in soils, divided by the estimated oral bioavailability of 9.8% for nickel in water (Ishimatsu et al. 1995) (see Section 6.4.2). This RAF was selected for the derivation of human health soil quality guidelines (i.e., 1.0/9.8 = 0.102).
8.5 Ingestion and Dermal Pathways
8.5.1 Agricultural and Residential/Parkland Land Uses
For purposes of determining an agricultural and residential/parkland soil guideline for a threshold substance, it has been assumed that the receptor with the greatest exposure per unit mass is the most likely to have adverse effects. Based on the general characteristics attributed to the Canadian population (HC 1994; Richardson et al. 1997), this is a toddler aged >6 months to 4 years.
Using the above assumption, a guideline for soil ingestion and dermal contact which applies to agricultural, residential/parkland soil can be determined as:
SQGDH =(TDI − EDI) × SAF × BW
[(AFG × SIR) + (AFS × SR)] × ET+ BSC
where, SQGDH = agricultural and residential/parkland direct human health-based soil quality guideline
for soil ingestion and dermal contact (mg/kg) TDI = tolerable daily intake (total nickel as soluble salts) = 11 µg/kg bw/day (WHO 2005) EDI = estimated daily intake for toddler = 10.6 µg/kg bw/day (Section 8.2) SAF = soil allocation factor = 20% by default (CCME 2006) BW = body weight for toddler = 16.5 kg (CCME 2006) AFG = absorption factor from gut (medium specific) = 1 by default AFS = relative absorption factor for skin = 0.102 (Section 8.4) SIR = soil ingestion rate for toddler = 0.08 g/day (CCME 2006) SR = soil dermal contact rate for toddler

75
= 6.88 x 10⁻² g/d [surface area of hands of 0.043 m2 x soil adherence factor of 0.001 kg/m2/d + surface of arms & legs of 0.258 m2 x soil adherence factor of 0.0001 kg/m2/d] (CCME 2006)
ET = exposure term (unitless) = 1 (7/7 d/wk x 52/52 wk/yr at the site, CCME 2006) BSC = background soil concentration = 26.8 mg/kg dw (Section 2.5.4)
As shown above, the background soil concentration is added back into the equation to calculate the SQG. It is initially removed when the exposure resulting from it is subtracted out along with the estimated daily intake. If the estimated daily intake of nickel, as total nickel is greater or equal to the TDI for total nickel, as soluble salts (i.e., EDI ≥11 µg/kg bw/day) the human health soil quality guideline derived using the CCME (2006) protocol would be set to the background soil concentration of nickel. However,
• Recently, alternative approaches to address issues when the EDI approaches or exceeds the TDI have been considered (Appendix 11). Under such circumstances, soil quality guidelines (and risk assessments) could be based on an acceptable level of exposure that would be equal to the lower of the following: 20% of the TDI; or 10% of the EDI.
For nickel, “10% of the EDI” (i.e., 1.06 µg/kg bw/day for toddlers) represents a more conservative value than “20% of the TDI” (i.e., 2.2 µg/kg bw/day) for the toddler age group (for adults considered for industrial land use guidelines, the EDI does not exceed the TDI and, thus, this adjustment is not applicable). Using this approach, the value of “10% of the EDI” is recommended for use in derivation of the soil quality guideline for nickel. Consequently, the SQGDH may be modified to:
SQGDH =(0.1 × EDI) × BW
[(AFG × SIR) + (AFS × SR)] × ET
where, SQGDH = agricultural and residential/parkland direct human health-based soil quality guideline
for soil ingestion and dermal contact (mg/kg) EDI = estimated daily intake for toddler =10.6 µg/kg bw/d (Section 8.2) BW = body weight for toddler =16.5 kg (CCME 2006) SIR = soil ingestion rate for toddler = 0.08 g/d (CCME 2006) SR = soil dermal contact rate for toddler = 6.88 x 10⁻² g/d (surface area of hands of
0.043 m2 x soil adherence factor of 0.001 kg/m2/d + surface of arms & legs of 0.258 m2 x soil adherence factor of 0.0001 kg/m2/d) (CCME 2006)
AFG = relative absorption factor for nickel across the gut = 1 (100%, assumed by default) AFS = relative absorption factor for skin = 0.102 (Section 8.4) ET = exposure term (unitless) = 1 (7 d/wk x 52 wk/yr at the site) (CCME 2006)
The agricultural and residential/parkland SQGDH for nickel based on the 10% of the EDI approach is recommended for use. This approach is considered to be scientifically defensible and will provide adequate protection for the health of Canadians. Therefore, using the above approach, the SQGDH for nickel at agricultural and residential/parkland sites is 200 mg/kg.
8.5.2 Commercial Land Use
Commercial lands are generically defined as sites at which commercial activities predominate. No manufacturing activities and no residential occupancy are expected to take place at

76
commercial sites. A commercial site is fully accessible to all age classes but it is used with less intensity, duration and frequency than a residential site. An example of a commercial site would be a typical urban shopping mall.
For threshold contaminants, it is assumed that a toddler is the most sensitive receptor but with access restricted to 10 hours per day, 5 days per week and 48 weeks per year (e.g., daycare). Using the above assumptions, a guideline which applies to commercial soil can be determined as:
SQGDH =(TDI − EDI) × SAF × BW
[(AFG × SIR) + (AFS × SR)] × ET+ BSC
where, SQGDH = commercial direct human health-based soil quality guideline for soil ingestion and
dermal contact (mg/kg) TDI = tolerable daily intake (total nickel as soluble salts) = 11 µg/kg bw/day (WHO 2005) EDI = estimated daily intake by ingestion for toddlers = 10.6 µg/kg bw/day (Section 8.2) SAF = soil allocation factor = 20% by default (CCME 2006) BW = body weight for toddler = 16.5 kg (CCME 2006) AFG = relative absorption factor for nickel across the gut = 1 (100%, assumed by default) AFS = relative absorption factor for skin = 0.102 (Section 8.4) SIR = soil ingestion rate for toddler = 0.08 g/day (CCME 2006) SR = soil dermal contact rate for toddler = 6.88 x 10⁻² g/d [surface area of hands of
0.043 m2 x soil adherence factor of 0.001 kg/m2/d + surface of arms & legs of 0.258 m2 x soil adherence factor of 0.0001 kg/m2/d] (CCME 2006)
ET = exposure term (unitless) = 0.66 (5/7 d/wk x 48/52 wk/yr at site) (CCME 2006) BSC = background soil concentration = 26.8 mg/kg dw (Section 2.5.4).
As with residential land use, the EDI is greater than the TDI under the commercial land use scenario. Therefore, the human health soil quality guideline derived using the CCME (2006) protocol would be set to the background soil concentration of nickel.
As discussed above, an alternate approach is to use the value of “10% of the EDI” and this approach is recommended for use in soil quality guideline development. Consequently, the SQGDH may be modified to:
SQGDH =(0.1 × EDI) × BW
[(AFG × SIR) + (AFS × SR)] × ET
where, SQGDH = commercial direct human health-based soil quality guideline for soil ingestion and
dermal contact (mg/kg) EDI = estimated daily intake for toddler = 10.6 µg/kg bw/d (Section 8.2) BW = body weight for toddler = 16.5 kg (CCME 2006) SIR = soil ingestion rate for toddler = 0.08 g/d (CCME 2006) SR = soil dermal contact rate for toddler = 6.88 x 10⁻² g/d (surface area of hands of
0.043 m2 x soil adherence factor of 0.001 kg/m2/d + surface of arms & legs of 0.258 m2 x soil adherence factor of 0.0001 kg/m2/d) (CCME 2006)
AFG = relative absorption factor for nickel across the gut = 1 (100%, assumed by default)

77
AFS = relative absorption factor for skin = 0.102 (Section 8.4) ET = exposure term 1 (unitless) = 0.66 (5/7 d/wk x 48/52 wk/yr at the site) (CCME 2006)
The commercial SQGDH for nickel based on the 10% of the EDI approach is recommended for use as this approach is scientifically defensible and will provide adequate protection to the health of Canadians. Therefore, using the above approach, the SQGDH for nickel in dry soil at commercial sites is calculated to be 310 mg/kg.
8.5.3 Industrial Land Use
Industrial lands typically have limited or restricted access to the public so that adult, occupational exposure will predominate. The typical exposure period for an adult at an industrial site is assumed to be 10 hours per day, 5 days per week and 48 weeks per year. For industrial land use, only adult receptors are considered. The industrial soil guideline is derived as:
SQGDH =(TDI − EDI) × SAF × BW
[(AFG × SIR) + (AFS × SR)] × ET+ BSC
where, SQGDH = industrial direct human health-based soil quality guideline for soil ingestion and
dermal contact (mg/kg) TDI = tolerable daily intake (total nickel as soluble salts) = 11 µg/kg bw-day (WHO 2005) EDI = estimated daily intake by ingestion for adult = 3.8 µg/kg bw-day (Section 8.2) SAF = soil allocation factor (unitless) = 20% by default (CCME 2006) BW = body weight for adult = 70.7 kg (CCME 2006) AFG = relative absorption factor for nickel across the gut = 1 (100%, assumed by default) AFS = relative absorption factor for skin = 0.102 (Section 8.4) SIR = soil ingestion rate for adult = 0.02 g/d (CCME 2006) SR = soil dermal contact rate for adult = 1.14 x 10⁻¹ g/day [surface area of hands of
0.089 m2 x soil adherence factor of 0.001 kg/m2/d + surface of arms of 0.25 m2 x soil adherence factor of 0.0001 kg/m2/d] (CCME 2006)
BSC = background soil concentration = 26.8 mg/kg (Section 2.5.4) ET = exposure term (unitless) = 0.66 (5/7 d/wk x 48/52 wks/yr at the site) (CCME 2006)
Therefore, using the above approach, the SQGDH for nickel at industrial sites is calculated to be 5100 mg/kg.
8.6 Inhalation Pathway (All land uses) For the derivation of an SQG where speciation is unknown, a conservative approach was taken, assuming that the nickel species present may be potential carcinogens via the inhalation pathway and therefore, to have non-threshold health effects. It is noted that there are also threshold-based effects associated with exposure to nickel via inhalation. For this reason, nickel soil quality guidelines for soil inhalation were developed by adapting the indoor air quality equation specified in the protocol (CCME 2006) for both non-threshold and threshold substances. Adults are considered the most appropriate receptor for evaluating life-time cancer risk for non-threshold substances. Given that the exposure period is greater than the likely latency period for most carcinogens, the CCME (2006) default exposure term for all land uses is one. The non-

78
threshold soil quality guideline for nickel based on inhalation of soil particles is calculated as follows:
SQGDH−PI =TILCR
(DC × UR × AFL) × ET+ BSC
(This is a mathematical re-arrangement of the CCME equation for estimation of soil quality guidelines for carcinogens when the cancer potency factor is expressed as a unit risk factor.)
where, SQGDH-PI = direct human health-based soil quality guideline for particulate inhalation - non-
threshold effects (mg/kg) TILCR = Target Incremental Lifetime Cancer Risk (10-6 or 10-5) UR = unit risk = 1.3 x 10⁻³ (µg/m3)-1 (Section 6.9.3) AFL = relative absorption factor for lungs = 1 (100% assumed by default) (CCME 2006) DC = dust concentration from resuspension of soil = 7.6 x 10⁻⁷ g/m3 (CCME 2006) ET = exposure term (unitless) =1 (i.e., continuous lifetime exposure for an individual) BSC = background soil concentration = 26.8 mg/kg (Section 2.5.4)
Derivations are provided based on incremental lifetime cancer risks (ILCR) of both 10-6 and 10-5.
The inhalation SQGDH-PI for soil-borne particulates for all land uses are 1000 mg Ni/kg for incremental lifetime cancer risk (ILCR) of 10-6 and 10 000 mg Ni/kg for an ILCR of 10-5.
The threshold soil quality guidelines for nickel based on inhalation of soil particles are calculated as follows:
SQGDH−PI =TC × SAF
(DC × AFL) × ET1 × ET2+ BSC
(This is a mathematical re-arrangement of the CCME equation for estimation of soil quality guidelines for non-carcinogens when the toxicity reference value is expressed as a tolerable concentration instead of a risk-specific dose.)
where, SQGDH-PI = direct human health-based soil quality guideline for particulate inhalation –
threshold effects (mg/kg) TC = tolerable concentration in air = 0.020 µg/m3 (Section 6.9.2) SAF = soil allocation factor = 20% by default (CCME 2006) AFL = absorption factor from lung (medium specific) = 1 (100% assumed by default) DC = dust concentration from resuspension of soil = 7.6 x 10⁻⁷ g/m3 (CCME 2006) BSC = background soil concentration = 26.8 mg/kg (Section 2.5.4) ET1 = exposure term 1 (unitless) = 1 for residential land use (24 hr/d) ET1 = 0.66 (unitless) for commercial and industrial land use (5/7 d/wk x 48/52 wk/yr at
the site) (CCME 2006)

79
ET2 = exposure term 2 (unitless) = 1 for residential land use; 0.42 for commercial and industrial land use - 10/24 hr/d at the site (CCME 2006)
The SQGDH-PI for inhalation of soil-borne particulates for protection of non-cancer risks are 5300 mg/kg for agricultural and residential/park land uses, and 19 000 mg/kg for commercial and industrial land uses.
A summary of SQGs for inhalation of fugitive dust (i.e SQGDH-PIs) is provided in Table 3 below along with the overall inhalation of fugitive dust SQG for each land use category.
Table 3. Summary of human health soil quality guidelines for the inhalation of fugitive dust (mg/kg). Land Use Target risk Agricultural Residential/Parkland Commercial Industrial Overall inhalation SQG protective of both threshold and non-threshold effects 10-5 ILCR & threshold 5300a 5300a 10 000 10 000 10-6 ILCR & threshold 1000 1000 1000 1000 Separate inhalation SQGs to protect against either threshold or non-threshold effects Non-Threshold (10-5) 10 000 10 000 10 000 10 000 Non-Threshold (10-6) 1000 1000 1000 1000 Threshold 5300 5300 19 000 19 000 a The guideline values is set at the lowest of the guideline values. For the soil inhalation pathway, the threshold guideline value is lower than the non-threshold value for an incremental lifetime cancer risk of 10-5 and is therefore, set as the guideline value for this land use.
8.7 Protection of Groundwater Used as a Source of Raw Water for Drinking No guideline for protection of groundwater used as a source of raw water as drinking was derived for nickel (as total) due to constraints on the mathematical model when applied to inorganic compounds (CCME 2006).
8.8 Guideline for Off-site Migration for Commercial and Industrial Land Uses When deriving soil quality guidelines for commercial and industrial sites, exposure scenarios only consider on-site exposure. Transfers of contaminated soil, from one property to another are possible by environmental routes such as wind and water erosion (CCME 2006).
The human health soil quality guideline for off-site migration (SQGOM-HH) refers to the concentration in soil eroded from the site that will raise the contaminant concentration in the receiving soil to the level of the agricultural guideline within a specific time frame. The SQGOM-
HH was derived as follows:
SQGOM−HH = 14.3 × SQGA−HH − 13.3 × BSC where, SQGOM-HH = Human health-based soil quality guideline for off-site migration (mg/kg) SQGA-HH = Human health-based soil quality guideline for agricultural land use (200 mg/kg) BSC = Background concentration of nickel in the receiving soil (26.8 mg/kg, Section
2.5.4).

80
Therefore, using the above approach, the human health-based soil quality guideline for off-site migration (SQGOM-HH) is calculated to be 2500 mg/kg. It was derived for protection of an off-site property with a SQGA-HH of 200 mg/kg (Section 8.5.1).
8.9 Final Human Health Soil Quality Guidelines Human health soil quality guidelines were derived for nickel at agricultural, residential/parkland, commercial and industrial sites, based on ingestion, dermal contact and inhalation of soil. Nickel was assumed to behave as a threshold substance via the ingestion, dermal contact and inhalation pathways and a non-threshold substance via the inhalation pathway. For the ingestion, dermal contact pathways and non-cancer inhalation-related effects, soluble nickel salts toxicity data were used for guideline development. For the inhalation pathway, the SQGDH-PI was developed based on combined soluble, oxidic and sulphidic nickel toxicity data. The soil quality guidelines calculated for each land use are presented in Table 4 below.
The overall human health soil quality guideline (SQGHH) is set as the lowest of the human health guidelines and checks derived for the land use. Based on this, the overall SQGHH based on ingestion and dermal contact pathways are: 200 mg/kg for agricultural land use, 200 mg/kg for residential/parkland land use and 310 mg/kg for commercial land use. For industrial land, the SQGHH is 1000 mg/kg for industrial land use based on an incremental lifetime cancer risk of 10-6 or 2500 mg/kg for industrial land use based on an incremental lifetime cancer risk of 10-5 based on the check mechanism for the migration of eroded soil from off-site commercial and industrial and use deposited onto adjacent agricultural land use.
Table 4. Exposure Pathways for the Development of the Human Health Soil Quality Guidelines Pathway Agricultural
(mg/kg) Residential/
Parkland (mg/kg) Commercial
(mg/kg) Industrial (mg/kg)
Overall SQGHH or PSQGHH Non-Cancer and 10-6 ILCR Non-Cancer and 10-5 ILCR
200 200
200 200
310 310
1000b, c
2500b, d
Direct contact
Ingestion + Dermal contact (SQGDH)
200a
200a
310a
5100
Inhalationc (SQGDH-PI)
Non-threshold
10-6 ILCR
10-5 ILCR
Threshold
1000
10 000
5300
1000
10 000
5300
1000
10 000
19 000
1000
10 000
19 000
Potable groundwater (SQGPW) NC NC NC NC
Consumption of produce, meat and milk (SQGFI) NC,d NC,d
Offsite migration (SQGOM-HH) 2500 2500 Notes: NC = not calculated a – pathway is required (i.e. final guideline cannot be developed without it) b – the SQGHH is the lowest of the human health guidelines and check values c – Ni forms included in the development of the inhalation guideline based on combined soluble, oxidic and sulphidic nickel. d – Applies to non-polar organic compounds and is not calculated for metal substances. Concerns about metal substances should be addressed on a site specific basis.
It is noted that the SQGHH provided above are considered to be protective at most sites; however, certain exposure pathways have not been evaluated in the development of the SQGHH. More

81
specifically, the SQGHH have not evaluated garden produce consumption or drinking water consumption (see footnotes in Table 5).
For dermal exposure, it is noted that persons particularly sensitive to nickel (e.g., contact dermatitis) may not be adequately protected by the SQG provided above. Appropriate TRVs for evaluating this type of scenario were not identified in the literature. Furthermore, nickel concentrations in soil that are developed to be protective of such effects were not identified in the literature.
With the above in mind, the SQGHH are considered to be protective of human health at most sites.

82
9 RECOMMENDED CANADIAN SOIL QUALITY GUIDELINES According to the soil protocol (CCME 2006), both environmental and human health soil quality guidelines are developed for four land uses: agricultural, residential/parkland, commercial, and industrial. The lower value generated by the two approaches for each of the four land uses is recommended by CCME as the Canadian Soil Quality Guideline. The environmental soil quality guidelines, presented in Chapter 7, were considered along with the human health guidelines, presented in Chapter 8, in making final recommendations for Canadian Soil Quality Guidelines for the protection of environmental and human health (CCME 2006). The recommended Canadian Soil Quality Guidelines for the protection of environmental and human health are presented below in Table 5. The interim remediation criteria (CCME 1991) and previous soil quality guidelines for nickel (EC 1999) are replaced by the soil quality guidelines recommended in this document. Human health soil quality guidelines were not developed for the previous soil quality guidelines for nickel (EC 1999), thus, the current soil quality guidelines represent a first time that the soil quality guidelines for nickel are based on considerations of both environmental and human health.

83
Table 5. Canadian soil quality guidelines for nickel (mg/kg)
Notes: NC = not calculated; ILCR = Incremental Lifetime Cancer Risk; SQGE = soil quality guideline for environmental health; SQGHH = soil quality guideline for human health. aData are sufficient and adequate to calculate a SQGE and SQGHH for this land use. Therefore the soil quality guideline is the lower of the two
(CCME 2006). The original nickel soil quality guideline derived in 1999 (and the interim soil quality criteria (CCME 1991) are superseded by the 2011 nickel soil quality guideline (this document).
bThe SQGHH is set at the non-threshold direct contact guideline for particulate inhalation because it is the lowest of the of the human health guidelines and check mechanisms for this land use at an ILCR of 1 in 1 000 000.
cThe SQGHH is set at the off-site migration check value because it is the lowest of the human health guidelines and check values for this land use at an ILCR of 1 in 100 000.
d Inhalation pathway was developed for combined soluble, oxidic and sulphidic nickel. e Applies to organic compounds and is not calculated for metal substances. Concerns about metal substances should be addressed on a site
specific basis. f Applies to non-polar organic compounds and is not calculated for metal substances. Concerns about metal substances should be addressed on a
site specific basis.
Land use
Agricultural Residential/ Parkland Commercial Industrial
Guideline 45a 45a 89a 89a
Human health guidelines/check values
SQGHH Non-Cancer and 10-6 ILCR 200 200 310 1000b
SQGHH Non-Cancer and 10-5 ILCR 200 200 310 2500c
Direct contact guideline (ingestion and dermal) 200 200 310 5100
Direct contact guideline (particulate inhalation)d
10-6 ILCR 1000 1000 1000 1000
10-5 ILCR 10 000 10 000 10 000 10 000
Threshold 5300 5300 19 000 19 000
Groundwater check (drinking water) NCe NCe NCe NCe
Produce, meat and milk check NCf NCf - -
Off-site migration check - - 2500 2500
Environmental health guidelines/check values
SQGE 45 45 89 89
Soil contact guideline 45 45 89 89
Soil and food ingestion guideline 528 - - -
Nutrient and energy cycling check 171 171 235 235
Off-site migration check - - 287 287
Groundwater check (aquatic life) NCe NCe NCe NCe
Guideline derived in 1999 (original Ni SQG) 50 50 50 50
Interim Soil Quality Criteria (CCME 1999) 150 100 500 500

84
REFERENCES ABC, 1988. Ninety day gavage study in albino rats using nickel. Draft final report submitted to Research
Triangle Institute and U.S. EPA, Office of Solid Waste. Study 410-2520. Abdel-Rahman, M.S and R.M. Turkall. 2011. Nickel Dermal Bioavailability in Pig Skin Increased by a
Chemical Mixture: Role of Gender. Proceedings of the Annual International Conference on Soils, Sediments, Water and Energy. Vol. 16, Article 4. 29-36.
Abdel-Sabour, M.F., A.S. Abdel-Haleem, A.Sroor & R.A. Zaghloul. 1997. Accumulation of heavy metals in two crop seeds due to soil contamination as determined by neutron activation analysis techniques. Environmental Sciences. 10(2)
AB Health, 1998. Assessing air quality in high level report 1: A preliminary analyses of physician vists and air particulate data. Prepared for Northwestern Health Services Region #17 AB Health, Health Surveillance, as cited in Health Canada (2011) .
Adamo, P. et al., 1996. Chemical and mineralogical forms of Cu and Ni in contaminated soils from the Sudbury mining and smelting region, Canada. Environmental Pollution, 91(1), pp.11-19.
Adgate, J.L. et al., 1998. Chemical mass balance of lead in house dust. Environ. Sci. Technol. 32, pp.108-114.
Adgate, J.L. et al., 2007. Relationships between personal, indoor, and outdoor exposures to trace elements in PM2.5. Science of the Total Environment, 386(1-3), pp.21-32.
Adjroud, O., 2011. The toxic effects of nickel chloride on liver, erythropoiesis, and development in Wistar albino preimplanted rats can be reversed with selenium pretreatment. Environmental Toxicology, 13(4).
Adriano, D.C., 2001. Trace Elements in the Terrestrial Environments: Biogeochemistry, Bioavailability and Risk Assessments. 2nd edition, Berlin Heidelberg: Springer-Verlag.
AENV, 2010. Alberta Tier 1 Soil and Groundwater Remediation Guidelines E. A. D. AB Environment Air, Land and Waste Policy Branch, ed.
Agner, T. et al., 2002. Combined effects of irritants and allergens: Synergistic effects of nickel and sodium lauryl sulfate in nickel-sensitized individuals. Contact Dermatitis, 47(1), pp.21-26.
Åkerblom, S., E. Bååth & L. Bringmark, 2007. Experimentally induced effects of heavy metal on microbial activity and community structure of forest mor layers. Biology and Fertility of Soils, 44, pp.79-91.
Akesson, B. & S. Skerfving, 1985. Exposure in welding of high nickel alloy. International Archives of Occupational and Environmental Health, 56(2), pp.111-117, as cited in Roels et al. (1993).
Al-Khafaji, A.A. & M.A. Tabatabai, 1979. Effects of trace elements on arylsulfatase activity in soils. Soil Sci. , 127, pp.129-133.
Allan, M. & G.M. Richardson, 2008. Probability Density Functions Describing 24-Hour Inhalation Rates for Use in Human Health Risk Assessments: An Update and Comparison. HERA, 14(2), pp.372-391.
Allen-Gil, S.M. et al., 1997. Heavy metal accumulation in sediment and freshwater fish in U.S. Arctic lakes. Environmental Toxicology and Chemistry, 16(4), pp.733-741.
Allenby, C.F. & B.F.J. Goodwin, 1983. Influence of detergent washing powders on minimal eliciting patch test concentrations of nickel and chromium. Contact Dermatitis, 9(6), pp.491-499.
Aller, A.J. et al., 1990. Effects of selected trace elements on plant growth. Journal of the Science of Food and Agriculture, 51(4), pp.447-479. Available at: http://dx.doi.org/10.1002/jsfa.2740510404.
Allinson, D.W. & C. Dzialo, 1981. The influence of lead, cadmium, and nickel on the growth of ryegrass and oats. Plant and Soil, 62, pp.81-89.
Almeida, A.A. et al., 2008. Trace elements in human milk: Correlation with blood levels, inter-element correlations and changes in concentration during the first month of lactation. Journal of Trace Elements in Medicine and Biology, 22(3), pp.196-205.
Ambrose, A.M., P.S. Larson & J.R. Borzelleca, 1976. Long term toxicologic assessment of nickel in rats and dogs. J. Food Sci. Technol., 13, pp.181-187.

85
Andersen, A. et al., 1996. Exposure to nickel compounds and smoking in relation to incidence of lung and nasal cancer among nickel refinery workers. Occupational and Environmental Medicine, 53(10), pp.708-713.
Andersen, I. & K.B. Svenes, 1989. Determination of nickel in lung specimens of thirty-nine autopsied nickel workers. International Archives of Occupational and Environmental Health, 61(4), pp.289-295.
Anderson, A-M., 2004. Unpublished monitoring data for ambient metal concentrations in Alberta surface waters. AB Environment, Edmonton, AB.
Anderson, P.R. & T.H.Christensen, 1988. Distribution coefficients of Cd, Co, Ni and Zn in soils . Journal of Soil Science, 39, pp.15-22.
Anke, M. et al., 1984. Nickel-an essential element. IARC Scientific Publications, (53), pp.339-365. Anke, M. et al., 1995. The biological importance of nickel in the food chain. Fresenius’ Journal of
Analytical Chemistry, 352(1-2), pp.92-96. Anke, M. et al., 2000. Intake of nickel in Germany: Risk or normality? Journal of Trace and Microprobe
Techniques, 18(4), pp.549-556. Ankley, G.T. et al., 1991. Acid volatile sulphide as a factor mediating cadmium and nickel bioavailability
in contaminated sediments. Environmental Toxicology and Chemistry, 10, pp.1299-1307. Annora, S. et al., 2009. Advanced Nutrition and Human Metabolism. 5th Edition , Belmont, CA:
Wadsworth, Cenege Learning . Anttila, A. et al., 1998. Update of cancer incidence among workers at a copper/nickel smelter and nickel
refinery. International Archives of Occupational and Environmental Health, 71(4), pp.245-250. Apostoli, P. et al., 2006. Elemental speciation in human health risk assessment. Environmental Health
Criteria (World Health Organization), 234, p.ix-235. Arafat, N. & J.O. Nriagu, 1986. Simulated mobilization of metals from sediments in response to lake
acidification. Water, Air, and Soil Pollution, 31(3-4), pp.991-998. Archambault, D.J.P., 1991. Metal tolerance studies on populations of Agrostis scabra (Tickle grass) from
Sudbury area. Laurentian Univ. Sudbury, ON. Arena, V.C. et al., 1998. Using alternative comparison populations to assess occupation-related mortality
risk. Results for the high nickel alloys workers cohort. Journal of Occupational and Environmental Medicine, 40(10), pp.907-916.
Arocena, J.M., S.K. Nepal & M. Rutherford, 2006. Visitor-induced changes in the chemical composition of soils in back country areas of Mt Robson Provincial Park, BC, Canada. J. Environ. Management, 79(1), pp.10-19.
Arpasova, H. et al., 2007. Nickel induced alteration of hen body weight, egg production and egg quality after an experimental peroral administration. Journal of Environmental Science and Health - Part B Pesticides, Food Contaminants, and Agricultural Wastes, 42(8), pp.913-918.
Arrandale, V. et al., 2012. Occupational contact allergens: Are they also associated with occupational asthma? American Journal of Industrial Medicine.
Artik, S. et al., 1999. Nickel allergy in mice: enhanced sensitization capacity of nickel at higher oxidation states. Journal of Immunology, 163(3), pp.1143-1152. Available at: http://www.ncbi.nlm.nih.gov/pubmed/10415008.
Aschmann, S.G. & R.J. Zasoski, 1987. Nickel and rubidium uptake by whole oat plants in solution culture. Physiologia Plantarum, 71, pp.191-196.
ATSDR, 2005. Toxicological Profile for Nickel US Department of Health and Human Services Public Health Service, ed. Available at: http://www.atsdr.cdc.gov/toxprofiles/tp.asp?id=245&tid=44.
Australia. 2010. NEPC (National Environment Protection Council) ASC (Assessment of Site Contamination) NEPM_Schedule B7_Appendix A1 (Metals and Inorganics), pp 64-71
Bååth, E., 1989. Effects of heavy metals in soil on microbial processes and populations (a review). Water Air Soil Pollution, 47, pp.335-379.

86
Babich, H. & G. Stotzky, 1982. Toxicity of nickel to microorganisms in soil: Influence of some physicochemical characteristics. Environmental Pollution Series A, Ecological and Biological, 29(4), pp.303-315. Available at: http://www.sciencedirect.com/science/article/pii/0143147182900691.
Babich, H. & G. Stotzky, 1983a. Further studies on environmental factors that modify the toxicity of nickel to microbes. Regulatory Toxicology and Pharmacology, 3(1), pp.82-99. Available at: http://www.ncbi.nlm.nih.gov/pubmed/6412320.
Babich, H. & G. Stotzky, 1983b. Nickel toxicity to estuarine/marine fungi and its amelioration by magnesium in seawater. Water Air Soil Pollut., 19, pp.193-202, as cited in Environment Canada and Health Canada.
Bábiková, L., R. Toman, S. Hluchý & P. Massányi, 2007. Quantitative Morphometry Analysis of the Rat Epididymis After A Peroral Administration Of Nickel. Lucrări ştiinţifice Zootehnie şi Biotehnologii (Scientific Papers, Animal Science and Biotechnologies), vol. 40(1): 330-334. Available at: http://www.spasb.ro/index.php/spasb/article/view/1595
Baker, A.J.M. & R.R. Brooks, 1989. Terrestrial higher plants which hyperaccumulate metallic elements - A review of their distribution, ecology and phytochemistry. Biorecovery, 1, pp.81-126.
Balasubramanian, R. & S.S. Lee, 2007. Characteristics of Indoor Aerosols in Residential Homes in Urban Locations: A Case Study in Singapore. Journal of the Air & Waste Management Association, 57(8), pp.981-990. Available at: http://www.tandfonline.com/doi/abs/10.3155/1047-3289.57.8.981.
Barashkov, G.K. et al., 2003. Distribution of chemical elements in whole blood and plasma. Biomeditsinskaya Khimiya, 49(3), pp.297-302.
Basketter, D.A. et al., 1993. Nickel, cobalt and chromium m consumer products: A role in allergic contact dermatitis? Contact Dermatitis, 28(1), pp.15-25.
Bazzaz, F.A., R.W. Carlson & G.L. Rolfe, 1974. The effect of heavy metals on plants: Part I. Inhibition of gas exchange in sunflower by Pb, Cd, Ni and Tl. Environmental Pollution, 7, pp.241-246.
BCMOE, 1999. Protocol 4 Determining background soil quality prepared pursuant to Section 53 of the Contaminated Sites Regulation under the Environmental Management Act. BCMOE Environmental Protection Division Land Remediation Section, ed.
BCMOE, 2008. Water and Sediment Quality Monitoring Reports. State of Water Quality Reports for some BC locations BCMOE Environmental Protection Division. Available at: http://www.env.gov.bc.ca/wat/wq/quality/sowq.html.
BCMOE, 2011. Environmental Management Act: Contaminated Sites Regulation. Available at: http://www2.gov.bc.ca/gov/topic.page?id=9A8B9BE814A1471F86EF4CA87BCE0CE2
Beckerton, J., 2004. pers. comm. Unpublished data for metal concentrations in Yukon groundwater samples (1995 to 2001). Environment Yukon, Whitehorse, Yukon Territory.
Bedello, P.G. et al., 1985. Nickel: Ubiquitary hapten. NICHEL: APTENE UBIQUITARIO, 120(4), pp.293-296.
Bednarska, A.J. & R. Laskowski, 2008. Effects of nickel and temperature on the ground beetle Pterostichus oblongopunctatus (Coleoptera: Carabidae). Ecotoxicology, 17(3), pp.189-198.
Beijer, K. & A. Jernelov, 1986. Sources, transport and transformation of metals in the environment. In L. Friberg, G.F. Nordberg & V.B. Vouk, eds. Handbook on the Toxicology of Metals. New York, Oxford, Amsterdam: Elsevier Science Publ, pp. 68-84.
Bell, R.W. et al., 1994. Windsor Air Quality Study: Personal Exposure Survey Results. Belzile, N., Chen, Y-W. & Gunn, J.M., 2004. Sediment trace metal profiles in lakes of Killarney Park,
Canada: from regional to continental influence. Environmental Pollution, 130, pp.239-248. Benfeldt, E., J. Serup, & T. Menne, 1999. Microdialysis vs. suction blister technique for in vivo sampling
of pharmacokinetics in the human dermis. Acta Dermato-Venereologica, 79(5), pp.338-342. Bennett, B.G., 1982. Exposure of man to environmental nickel - An exposure commitment assessment.
Science of the Total Environment, 22(3), pp.203-212.
87
Benson, J.M. et al., 1994. Fate of inhaled nickel oxide and nickel subsulfide in F344/N rats. Inhalation Toxicology, 6(2), pp.167-183.
Benson, J.M. et al., 1995. Particle clearance and histopathology in lungs of F344/N rats and B6C3F1 mice inhaling nickel oxide or nickel sulfate. Fundamental and Applied Toxicology, 28(2), pp.232-244.
Berg, T. et al., 2000. The release of nickel and other trace elements from electric kettles and coffee machines. Food Additives and Contaminants, 17(3), pp.189-196.
Berge, S.R. & K. Skyberg, 2003. Radiographic evidence of pulmonary fibrosis and possible etiologic factors at a nickel refinery in Norway. Journal of Environmental Monitoring, 5(4), pp.681-688, in ATSDR (2005).
Bergsam, E., 2004. Unpublished data for metal concentrations in Yukon drinking water (1999 to 2003). Yukon Department of Environmental Health, Whitehorse, YT.
Berry, J.P. et al., 1988. Inhaled soluble aerosols insolubilised by lysosomes of alveolar cells. Application to some toxic compounds; electron microprobe and ion microprobe studies. Toxicology, 52(1-2), pp.127-139.
Berry, J.P. et al., 1997. Role of alveolar macrophage lysosomes in metal detoxification. Microscopy Research and Technique, 36(4), pp.313-323.
Berry, J.P., F. Bertrand & P. Galle, 1993. Selective intra-lysosomal concentration of niobium in kidney and bone marrow cells: a microanalytical study. BioMetals, 6(1), pp.17-23.
Beyer, W.N. & G. Miller, 1990. Trace elements in soil and biota in confined disposal facilities for dredged material. Environmental Pollution, 65, pp.19-32.
Beyersmann, D. & A. Hartwig, 2008. Carcinogenic metal compounds: Recent insight into molecular and cellular mechanisms. Archives of Toxicology, 82(8), pp.493-512.
Bhuiya, M.R.H., 1972. Effects of addition of 1000 ppm Cu, Ni, Pb, and Zn on carbon dioxide release during incubation of soil alone and after treatment with straw. Environmental Pollution, 3, pp.173-177.
Birmingham, B. & D. McLaughlin, 2006. Soil investigation and human health risk assessment for nickel in community soils near a former nickel refinery in southern Ontario, Canada. Journal of Toxicology and Environmental Health - Part A, 69(9), pp.845-892.
Biró, B., K. Köves-Péchy & I. Vörös, 1998. Toxicity of some field applied heavy metal salts to the rhizobial and fungal microsymbionts of alfalfa and red clover. Agrokémia és Talajtan, 1-4, pp.265-276.
Bisessar, S., 1989. Effects of lime on nickel uptake and toxicity in celery grown on muck soil contaminated by a nickel refinery. Science of the Total Environment, 84, pp.83-90.
Bisson, M., 2004. Statistical data on elemental concentrations in suspended particulate matter (PM10) at different industrial sites in Québec (1999-2002). Ministère de l’Environnement du Québec, Quebec City, QC.
Block, G.T. & M. Yeung, 1982. Asthma induced by nickel. Journal of the American Medical Association, 247(11), pp.1600-1602.
Bocca, B. et al., 2007. Levels of nickel and other potentially allergenic metals in Ni-tested commercial body creams. Journal of Pharmaceutical and Biomedical Analysis, 44(5), pp.1197-1202.
Bocio, A. et al., 2005. Monitoring metals in the population living in the vicinity of a hazardous waste incinerator: Concentrations in autopsy tissues. Biological Trace Element Research, 106(1), pp.41-50.
Bodo, B.A., 1989. Heavy metals in water and suspended particulates from an urban basin impacting lake Ontario. Science of the Total Environment, 87-88, pp.329-344.
Boyd, D, 1991-92. Personal communication. ON Ministry of the Environment, Toronto, ON. Boyd, D., 2004. Unpublished data on metal concentrations in surface waters and sediments from lakes
and rivers sampled across Ontario (1994 to 2003). ON Ministry of the Environment, Toronto, ON.

88
Boyd, W.A. & P.L. Williams, 2003. Availability of metals to the nematode Caenorhabditis elegans: toxicity based on total concentration in soil and extracted fractions. Environmental Toxicology and Chemistry, 22(5), pp.1100-1106.
Boyle, D.R., W.A. Spirito, and S.W. Adcock, 1994. Groundwater hydrogeochemical survey of southeastern New Brunswick (211I/1; 21I/2; 21I/3; 21H/15; 21H/16; 11L/4). Open File 2912 Geological Survey of Canada, ed. Available at: geoscan.nrcan.gc.ca
Boyle, D.R., W.A. Spirito and S.W. Adcock, 1996. Groundwater hydrogeochemical survey of central New Brunswick. Open File 3306. Available at: geoscan.nrcan.gc.ca
Bradley, R.W. & J.R. Morris, 1986. Heavy metals in fish from a series of metal-contaminated lakes near Sudbury, Ontario. Water, Air, and Soil Pollution, 27(3-4), pp.341-354.
Brassard, P., J.R. Kramer & P.V. Collins, 1997. Dissolved metal concentrations and suspended sediment in Hamilton harbour. Journal of Great Lakes Research, 23(1), pp.86-96.
Brecher, R.W. et al., 1989. Eco Logic Inc., Contract report for the Environmental Substances Division, Environmental Health Centre, Health and Welfare Canada, Ottawa, ON, Canada.
Brera, S. & A. Nicolini, 2005. Respiratory manifestations due to nickel. Acta otorhinolaryngologica Italica : organo ufficiale della Societa italiana di otorinolaringologia e chirurgia cervico-facciale, 25(2), pp.113-115.
Broerse, M. & C.A.M. van Gestel, 2010. Chlorpyrifos reduces nickel-induced growth retardation of the soil dwelling collembolan Folsomia candida. Ecotoxicology and Environmental Safety, 73, pp.1051-1056.
Brookes, P.C. & S.P. McGrath, 1984. Effects of metal toxicity on the size of the soil microbial biomass. J. Soil. Sci. , 35, pp.341-346.
Brooks, N.N., 1980. Accumulation of nickel by terrestrial plants. In J.O. Nriagu, ed. Nickel in the Environment. New York: Wiley and Sons .
Brown, P.H., R.M. Welch et al., 1987a. Beneficial effects of nickel on plant growth. Journal of Plant Nutrition, 10, pp.2125-2135.
Brown, P.H., R.M.Welch, E.E. Cary et al., 1987b. Micronutrients. Journal of Plant Nutrition, 10(9-16), pp.2125-2135. Available at: http://www.tandfonline.com/doi/abs/10.1080/01904168709363763.
Brown, P.H., R.M. Welch & E.E. Cary, 1987c. Nickel: A Micronutrient Essential for Higher Plants. Plant Physiology, 85(3), pp.801-803. Available at: http://www.plantphysiol.org/content/85/3/801.abstract.
Bruland, K.W. et al., 1979. Sampling and analytical methods for the determination of copper, cadmium, zinc, and nickel at the nanogram per liter level in seawater. Analytica Chimica Acta, 105, pp.233-245.
Burnett, R.T. et al., 2000. Association between particulate- and gas-phase components of urban air pollution and daily mortality in eight Canadian cities. Inhalation Toxicology, 12(4), pp.15-39.
CCME, 1991. Interim Canadian environmental quality criteria for contaminated sites CCME. CCME, 1993. Guidance manual on sampling, analysis and data management guidelines for contaminated
sites. Vol. 1: Main Report, Vol. II: Analytical Method Summaries CCME CCME, 2007. A Protocol for the Derivation of Water Quality Guidelines for the Protection of Aquatic Life 2007.
CCME, 1996a. A Protocol for the Derivation of Environmental and Human Health Soil Quality Guidelines CCME.
CCME, 1996b. Guidance Manual for Developing Site-Specific Soil Quality Remediation Objectives for Contaminated Sites in Canada CCME.
CCME, 2006. A Protocol for the Derivation of Environmental and Human Health Soil Quality Guidelines CCME.
CCME, 1999. Canadian Environmental Quality Guidelines CCME. Available at: ccme.ca CCREM, 1987. Canadian Water Quality Guidelines Task Force on Water Quality Guidelines. Cain, B.W. & E.A. Pafford, 1981. Effects of dietary nickel on survival and growth of mallard ducklings.
Environ. Contam. Toxicol., 10, pp.737-745.

89
Calderón-Garcidueñas, L. et al., 2003. DNA damage in nasal and brain tissues of canines exposed to air pollutants is associated with evidence of chronic brain inflammation and neurodegeneration. Toxicologic Pathology, 31(5), pp.524-538.
Callahan, M.A. et al., 1979. Nickel: Water-related environmental fate of 129 priority pollutants, Vol. 1: Introduction and technical background, metals and inorganics, pesticides and PCBs U.S. Environmental Protection Agency Office of Water and Waste Management.
Cameron, K.S., V. Buchner & P.B. Tchounwou, 2011. Exploring the molecular mechanisms of nickel-induced genotoxicity and carcinogenicity: A literature review. Reviews on Environmental Health, 26(2), pp.81-92.
Capcarova, M., A. Kolesarova, H. Arpasova, P. Massanyi, N. Lukac, J. Kovacik, A. Kalafova & M. Schneidgenova. 2008. Blood biochemical dynamics and correlations in laying hens after experimental nickel administration. Int. J. Poultry Sci. 7:538-547.
Carlson, C.L. et al., 1991. Effects of selected trace metals on germinating seeds of six plant species. Water Air Soil Pollut., 59, pp.231-240.
Carvalho, S.M.M. & P.L. Ziemer, 1982. Distribution and clearance of 63Ni administered as 63NiCl2 in the rat: Intratracheal study. Archives of Environmental Contamination and Toxicology, 11(2), pp.245-248. Available at: http://dx.doi.org/10.1007/BF01054903.
Casey, C.E. & M.C. Neville, 1987. Studies in human lactation 3: Molybdenum and nickel in human milk during the first month of lactation. American Journal of Clinical Nutrition, 45(5), pp.921-926.
Cataldo, D.A. et al., 1978. Nickel in plants: I. Uptake kinetics using intact soybean seedlings. Plant Physiology, 62, pp.563-565.
Cempel, M. & K. Janicka, 2002. Distribution of nickel, zinc, and copper in rat organs after oral administration of nickel(II) chloride. Biological Trace Element Research, 90(1-3), pp.215-226.
Cha, N.R. et al., 2010. Determination of iron, copper, zinc, lead, nickel and cadmium in cosmetic matrices by flame atomic absorption spectroscopy. Analytical Letters, 43(2), pp.259-268.
Chan, W.H. & M.A. Lusis, 1988. Smelting operations and trace metals in air and precipitation in the Sudbury Basin. In Adv. Environ. Sci. Tech. Toronto, ON: Ontario Ministry of the Environment, pp. 113-143.
Chang, A.C. et al., 1984. Sequential extraction of soil heavy metals following a biosolids applciation. Journal of Environment Quality, 13, pp.33-38.
Chapman, P. & R. Wang, 2000. Issues in ecological risk assessment of metals and metalloids . HERA , 6, p.6.
Chattopadhyay, G., K.C.P. Lin & A.J. Feitz, 2003. Household dust metal levels in the Sydney metropolitan area. Environmental Research, 93(3), pp.301-307.
Chaudri, A.M. & S.P. McGrath, 1992. Survival of the indigenous population of Rhizobium leguminosarum biovar trifolii in soil spiked with Cd, Zn, Cu, and Ni salts. Soil Biology and Biochemistry, 24(7), pp.625-632.
Chen, J.R., R.B. Francisco & T.E. Miller, 1977. Legionnaires’ disease: nickel levels. Science, 196(4292), pp.906-908, in Rezuke et al. (1987).
Cheung, P., 2004. Unpublished summary of data on ambient metal concentrations in Ontario drinking water monitored by the Ontario Drinking Water Surveillance Program (DWSP) from 1990 to 2002. ON Ministry of the Environment, Toronto, ON.
Choinière, J. & M. Beaumier, 1997. Bruits de Fond Geochimiques pour Differents Environnements Geologiques au Québec. Ministère Des Ressources Naturelles du Québec.
Chou, C.H.S.J., J. Holler & C.T. De Rosa, 1998. Minimal risk levels (MRLs) for hazardous substances. Journal of Clean Technology, Environmental Toxicology and Occupational Medicine, 7(1), pp.1-24.
Christensen, O.B. et al., 1979. Nickel concentration of blood, urine and sweat after oral administration. Contact Dermatitis, 5(5), pp.312-316.
Christensen, O.B. et al., 1981. Micromorphology and specificity of orally induced flare-up reactions in nickel-sensitive patients. Acta Dermato-Venereologica, 61(6), pp.505-510.

90
Christensen, O.B. & V. Lagesson, 1981. Nickel concentration of blood and urine after oral administration. Annals of Clinical and Laboratory Science, 11(2), pp.119-125, as cited in CalEPA OEHHA (2011).
Christensen, O.B. & H. Moller, 1975. External and internal exposure to the antigen in the hand eczema of nickel allergy. Contact Dermatitis, 1(3), pp.136-141.
Christensen, O.B. & H. Moller, 1978. Release of nickel from cooking utensils. Contact Dermatitis, 4(6), pp.343-346.
Christensen, O.B. & L.M. Wall, 1987. Open, closed and intradermal testing in nickel allergy. Contact Dermatitis, 16(1), pp.21-26.
Clary, J.J., 1975. Nickel chloride induced metabolic changes in the rat and guinea pig. Toxicology and Applied Pharmacology, 31(1), pp.55-65.
Connell, D.W., 1990. Bioaccumulation of Xenobiotic Compounds, Boca Raton, FL: CRC Press. Corazza, M. et al., 2009. Measurement of nickel, cobalt and chromium in toy make-up by atomic
absorption spectroscopy. Acta Dermato-Venereologica, 89(2), pp.130-133. Cornfield, A.H., 1977. Effects of addition of 12 metals on carbon dioxide release during incubation of an
acid sandy soil. Geoderma , 19, pp.199-203. Costa, M. et al., 2005. Nickel carcinogenesis: Epigenetics and hypoxia signaling. Mutation Research -
Fundamental and Molecular Mechanisms of Mutagenesis, 592(1-2), pp.79-88. Costa, M., J. Simmons-Hansen & C.W.M. Bedrossian, 1981. Phagocytosis, cellular distribution, and
carcinogenic activity of particulate nickel compounds in tissue culture. Cancer Research, 41(7), pp.2868-2876.
Cottenie, A.R. et al., 1979. Fractionation and determination of trace elements in plants, soils and sediments. Pure and Applied Chemistry, 52, pp.45-53.
Cotton, F.A. & G. Wilkinson, 1988. Advanced Inorganic Chemistry: A Comprehensive Text, 5th edition. Wiley-Interscience, New York, NY, in Environment Canada and Health Canada (1994).
Covington, J.S. et al., 1985. Quantization of nickel and beryllium leakage from base metal casting alloys. The Journal of Prosthetic Dentistry, 54(1), pp.127-136.
Cox, R.M. & T.C. Hutchinson, 1981. Environmental factors influencing the rate of spread of the grass Deschampsia Cespitosa invading areas around the Sudbury nickel-copper smelters. Water Air Soil Pollution, 16, pp.83-106.
Cronin, E., A.D. Di Michiel & S.S. Brown, 1980. Oral challenge in nickel-sensitive women with hand eczema. In S.S. Brown & F.W. Sunderman, eds. Nickel Toxicology. London, UK: Academic Press Inc. (London) Ltd, in OEHHA (2011, draft).
Culbard, E.B. et al., 1988. Metal contamination in British urban dusts and soils. J. Environ Qual., 17, pp.226-234.
Dabeka, R., 2004. Data on trace elements in food from the 2000-2004 Canadian Total Diet Study Health Canada. Available at: http://www.hc-sc.gc.ca/fn-an/surveill/total-diet/concentration/index-eng.php.
Dabeka, R., 2009. Food Research Division, Bureau of Chemical Safety, Food Directorate, Health Products and Food Branch, Health Canada. Various emails.
Dabeka, R.W., 1989. Survey of lead, cadmium, cobalt and nickel in infant formulas and evaporated milks and estimation of dietary intakes of the elements by infants 0-12 months old. Science of the Total Environment, 89(3), pp.279-289.
Dabeka, R.W. et al., 2002. Survey of bottled drinking waters sold in Canada for chlorate, bromide, bromate, lead, cadmium and other trace elements. Food Additives and Contaminants, 19(8), pp.721-732.
Dabeka, R.W. & A.D. McKenzie, 1995. Survey of lead, cadmium, fluoride, nickel, and cobalt in food composites and estimation of dietary intakes of these elements by Canadians in 1986-1988. Journal of AOAC International, 78(4), pp.897-909.
Daldrup, T., K. Haarhoff & S.C. Szathmary, 1983. Toedliche nickel sulfaye-intoxikation. Berichte zur Serichtlichen Medizin., 41, pp.141-144, in ATSDR (2005).

91
Dang, Y.P., R. Chabra & K.S. Verna, 1990. Effects of Cd, Ni, Pb, and Zn on growth and chemical composition of onion and fenugreek. Comm. Soil Sci. Plant Anal., 21, pp.717-735.
Dann, T., 1991. Measurement Program for toxic contaminants. In Environment Canada. Canadian Urban Air. Update and summary report. Pollution measurement division., Rep. PMD #91-2. Ottawa, ON: Environment Canada.
Dann, T., 2007. Environmental Technology Centre, Environment Canada, Ottawa, ON. Dann, T., 2010. Head, Air Toxics, Analysis and Air Quality, Environment Canada, Ottawa ON. NAPS
data for Nickel 01 Jan 2007 - 31 Dec 2009 PM2.5 (via email) To Deanna Lee. Davies, J.E., 1986. Occupational asthma caused by nickel salts. Journal of the Society of Occupational
Medicine, 36(1), pp.29-31. Davis, J.J. & B.L. Gulson, 2005. Ceiling (attic) dust: A “museum” of contamination and potential hazard.
Environmental Research, 99(2), pp.177-194. Davis, R.D., P.H.T. Beckett & E. Wollan, 1978. Critical levels of twenty potentially toxic elements in
young spring barley. Plant and Soil, 49, pp.395-408. De Brouwere, K, J.Buekers, C. Cornelis, C.E. Schlekat and A.R. Oller. 2012. Assessment of indirect
human exposure to environmental sources of nickel: Oral exposure and risk characterization for systemic effects. Science of the Total Environment 419(2012): 25-36
deCatanzaro, J.B. & T.C. Hutchinson, 1985. Effects of nickel addition on nitrogen mineralization, nitrification, and nitrogen leaching in some boreal forest soils. Water, Air, and Soil Pollution, 24, pp.153-164.
Degtiareva, A. & M. Elektorowica, 2001. Change in the water quality of industrial channels due to resuspension of sediments contaminated with heavy metals. Water Sci.Tech: Water Supply , 1(2), pp.27-35.
De Hauteclocque, C. et al., 2002. Occupational asthma due to hard metals hypersensitivity. Asthme professionnel par hypersensibilité aux métaux durs, 19(3), pp.363-365.
de Lafontaine, Y. et al., 2000. Biomarkers in zebra mussels (Dreissena polymorpha) for the assessment and monitoring of water quality of the St Lawrence River (Canada). Aquat. Toxicol. 50(1-2), pp.51-71.
Denkhaus, E. & K. Salnikow, 2002. Nickel essentiality, toxicity, and carcinogenicity. Critical Reviews in Oncology/Hematology, 42(1), pp.35-56.
DEPA, 1995. Soil Quality Criteria for Selected Inorganic Compounds Ministry of Environment and Energy DEPA, ed.
Desrosiers, M. et al., 2008. Relationships among total recoverable and reactive metals and metalloid in St. Lawrence River sediment: bioaccumulation by chironomids and implications for ecological risk assessment. Science of the Total Environment, 389(1), pp.101-114.
Dickel, H. et al., 2010. Increased sensitivity of patch testing by standardized tape stripping beforehand: A multicentre diagnostic accuracy study. Contact Dermatitis, 62(5), pp.294-302.
Dieter, M.P. et al., 1988. Evaluation of tissue disposition, myelopoietic, and immunologic responses in mice after long-term exposure to nickel sulphate in the drinking water. Journal of Toxicology and Environmental Health, 24, pp.357-372.
Dinwoodie, G., 2004 pers comm. AB Environment . DiToro, D.M. et al., 1986. Effects of nonreversibility, particle concentration and ionic strength on heavy
metal sorption. Environmental Science & Technology, 20, pp.55-61. Diwan, B.A., K.S. Kasprzak & J.M. Rice, 1992. Transplacental carcinogenic effects of nickel(II) acetate
in the renal cortex, renal pelvis and adenohypophysis in F344/NCr rats. Carcinogenesis, 13(8), pp.1351-1357.
Dixit, S.S., A.S. Dixit & J.P. Smol, 1991. Multivariable environmental interferences based on diatom assemblages from Sudbury (Canada) lakes . Freshwater Biol, 26, pp.251-266.
Dixon, N.E. et al., 1975. Letter: Jack bean urease (EC 3.5.1.5). A metalloenzyme. A simple biological role for nickel? Journal of the American Chemical Society, 97(14), pp.4131-4133.

92
Dixon, R.K., 1988. Response of ectomycorrhizal Quercus rubra to soil cadmium, nickel and lead. Soil Biology and Biochemistry, 20, pp.555-559.
Dixon, R.K. & C.A. Bushena, 1988. Response of ectomycorrhizal Pinus banksiana and Picea glauca to heavy metals in soil. Plant and Soil, 105, pp.265-271.
Dobrin, D.J. & R.Potvin, 1992. Air Quality Monitoring Studies in the Sudbury Area: 1978 to 1988. Ontario Ministry of the Environment, Technical Assessment Section, Northeastern Region, Toronto, ON. in Environment Canada and Health Canada (1994).
Doelman, P. & L. Haanstra, 1984. Short- term and long-term effects of cadmium, chromium, copper, nickel, lead and zinc on soil microbial respiration in relation to abiotic soil factors. Plant and Soil, 79, pp.317-327.
Doelman, P. & L. Haanstra, 1986. Short- and long-term effects of heavy metals on urease activity in soils. Biol. Fertil. Soils, 2, pp.213-218.
Doelman, P. & L. Haanstra, 1989. Short- and long-term effects of heavy metals on phosphatase activity in soils: An ecological dose-response model approach. Biol. Fertil. Soils, 8, pp.235-241.
Dolovich, J., S.L. Evans & E. Nieboer, 1984. Occupational asthma from nickel sensitivity: I. Human serum albumin in the antigenic determinant. British Journal of Industrial Medicine, 41(1), pp.51-55.
Doyle, P., 1991. Nickel and chromium in Canadian soil: Natural variations and anthropogenic additions, Contract Report with Environment Canada.
Dryfhout-Clark, H., 2004. Unpublished monitoring data on air quality of the Great Lakes Basin from the Integrated Atmospheric Deposition Network (IADN). Environment Canada, Egbert, ON .
Drysdale, M. et al., 2011. Evaluating the respiratory bioaccessibility of nickel in soil through the use of a simulated lung fluid. Environmental Geochemistry and Health, pp.1-10.
Dumonet, S., H.Dinel & P.E.N. Lévesque, 1992. The distribution of pollutant heavy metals and their effect on soil respiration and acid phosphatase activity in mineral soils of the Rouyn-Noranda region, Québec. Science of the Total Environment, 121, pp.231-245.
Dunnick, J.K. et al., 1989. Lung toxicity after 13-week inhalation exposure to nickel oxide, nickel subsulfide, or nickel sulfate hexahydrate in F344/N rats and B6C3F1 mice. Fundamental and Applied Toxicology, 12(3), pp.584-594.
Dunnick, J.K. et al., 1995. Comparative carcinogenic effects of nickel subsulfide, nickel oxide, or nickel sulfate hexahydrate chronic exposures in the lung. Cancer Research, 55(22), pp.5251-5256.
Eastin Jr., W.C. & T.J. O’Shea, 1981. Effects of dietary nickel on mallards. Journal of Toxicology and Environmental Health, 7, pp.883-892.
Easton, D.F., J. Peto & L.G. Morgan, et al., 1992. Respiratory cancer mortality in Welsh nickel refiners: Which nickel compounds are responsible?. In E. Niebor & J. Nrigau, eds. Nickel and Human Health: Current Perspectives. Advances in Environmental Sciences and Technology. New York: Wiley & Sons, pp. 603-619, as cited in IARC (2011).
EC, 1989a. Atlantic region federal-provincial toxic chemical survey of municipal drinking water sources. Data summary report, Province of New Brunswick, 1985-1988 EC Environmental Protection Service Water Quality Branch, Atlantic Region.
EC, 1989b. Atlantic region federal-provincial toxic chemical survey of municipal drinking water sources. Data summary report, Province of Nova Scotia, 1985-1988 EC Environmental Protection Service Water Quality Branch, Atlantic Region.
EC, 1994. Priority Substances List Supporting Documentation - Environmental Sections: Nickel and its Compounds Canadian Environmental Protection Act.
EC, 1996. The State of Canada’s Environment - 1996 Environment Canada. EC, 1999. Canadian Soil Quality Guidelines for Nickel: Environmental Effects. Scientific Supporting
Document Environment Canada National Guidelines and Standards Office. EC, 2003a. National Air Pollution Surveillance (NAPS) Network EC Analysis and Air Quality Division.
Available at: www.ec.gc.ca/rnspa-naps/.

93
EC, 2003b. Phytorem and phytopet - selecting plants for site decontamination, in Environmental solutions through technology innovation and partnerships. Environment Canada, Innovative Solutions Division. ISBN: 0-662-67115-5. p 33.
EC, 2005. 2004 Municipal Water Use Report: Municipal Water Use 2001 Statistics. Available at: www.ec.gc.ca/eau-water/default.asp?lang=En&n=ED0E12D7-1
EC, 2007. National Pollutant Release Inventory (NPRI). Available at: http://www.ec.gc.ca/pdb/querysite/query_e.cfm.
EC, 2011. The National Air Pollution Surveillance (NAPS) network - Integrated sampling air monitoring data, as cited in Health Canada (2011).
EC and HC, 1994. Priority Substances List Assessment Report: Nickel and its Compounds Canadian Environmental Protection Act. Available at: http://www.hc-sc.gc.ca/ewh-semt/pubs/contaminants/psl1-lsp1/compounds_nickel_composes/index-eng.php.
Echevarria, G. et al., 2006. Assessment and control of the bioavailability of nickel in soils. Environmental Toxicology and Chemistry, 25(3), pp.643-651.
Edwards, D.L., J.C. Wataha & C.T. Hanks, 1998. Uptake and reversibility of uptake of nickel by human macrophages. Journal of Oral Rehabilitation, 25(1), pp.2-7.
Efroymson, R.A., B.E. Sample & G.W.S. II, 2004. Bioaccumulation of inorganic chemicals from soil by plants: Spiked soils vs. field contamination or background. HERA, 10(6), pp.1117-1127.
Elkin, B., 2001. Heavy Metal and Radionuclide Contaminants in Caribou. In INAC (Indian and Northern Affairs Canada). Abstracts of Synopsis of Research (2000-2001) Conducted under the Northern Contaminants Program - Biotic Monitoring. Indian and Northern Affairs Canada.
Elmosly, W.A. & M.F. Abdel-Sabour, 1997. Transfer characteristics and uptake of nickel by red clover grown on nickel amended alluvial soils of an arid zone. Agri. Ecosystems Environ. , 65(1), pp.49-57.
Emmett, E.A. et al., 1988. Allergic contact dermatitis to nickel: Bioavailability from consumer products and provocation threshold. Journal of the American Academy of Dermatology, 19(2 I), pp.314-322.
English, J.C. et al., 1981. Toxicokinetics of nickel in rats after intratracheal administration of a soluble and insoluble form. American Industrial Hygiene Association Journal, 42(7), pp.486-492, in OEHHA (2011, draft).
Environment Agency (UK), 2009. Contaminants in soil: updated collation of toxicological data and intake values for humans. Nickel. Science report: SC050021/ Tox 8. Bristol: Environment Agency. Available at: www.gov.uk/government/uploads/system/uploads/attachment_data/file/291234/scho0409bpvz-e-e.pdf
Ermolli, M. et al., 2001. Nickel, cobalt and chromium-induced cytotoxicity and intracellular accumulation in human hacat keratinocytes. Toxicology, 159(1-2), pp.23-31.
Eskew, D.L., R.M. Welch & E.E. Cary. 1983. Nickel: An essential micronutrient for legumes and possibly all higher plants. Science, 222(4624), pp. 621-623.
EU, 2004. Nickel sulphate risk assessment. Draft RAR. Prepared by the Danish Environmental Protection Agency for the EU.
EU, 2004a. Commission Directive 2004/96/EC, 27 September 2004. Official Journal of the European Union. Available at: http://eur-lex.europa.eu/LexUriServ/LexUriServ.do?uri=OJ:L:2004:301:0051:0052:EN:PDF. Accessed 15 Aug. 2013.
EU, 2008. European Union risk assessment report - nickel and nickel compounds. Section 3.2 Effects Assessment. Final Version.
EU, 2008b. European Union risk assessment report-Nickel; Nickel Carbonate; Nickel Chloride; Nickel Dinitrate; Nickel Sulphate CAS No: 7440-02-0; 333-67-3; 7718-54-9; 13138-45-9; 7786-81-4; EINECS No: 231-111-4; 222-068-2; 231-743-0; 236-068-5; 232-104-9 Risk Assessment. Humans exposed indirectly via the environment and combined exposure-exposure assessment and risk characterization Final version April 2008. Danish Environmental Protection Agency in collaboration

94
with NiPERA and VITO. Final approved version. Available at: http://echa.europa.eu/documents/10162/cefda8bc-2952-4c11-885f-342aacf769b3
Eur Comm, 2001. European Commission DG Environment. Ambient Air Pollution by As, Cd and Ni compounds. Position Paper. Final Version. Eur Comm Working Group on Arsenic Cadmium and Nickel Compounds, Available at: http://www.ec.europa.eu/environment/air/pdf/pp_as_cd_ni.pdf.
Eur Comm, 2007. Air Quality Standards Eur Comm DG Environment. Available at: http://ec.europa.eu/environment/air/quality/standards.htm.
Evans, M.S. et al., 2005. Persistent organic pollutants and metals in the freshwater biota of the Canadian Subarctic and Arctic: An overview. Sci. Tot. Environ., 351-352, pp.94-147.
Evans, P., 2004. Unpublished data on metal concentrations in British Columbia groundwater. BC Ministry of Water, Land, and Air Protection, Victoria, BC.
Everhart, J.L. et al., 2006. Assessing nickel bioavailability in smelter-contaminated soils. Sci.Tot. Environ., 367(2-3), pp.732-744.
Fait, G. et al., 2006. Tolerance of nitrifying bacteria to copper and nickel. Environmental Toxicology and Chemistry, 25(8), pp.2000-2005.
Fancey, L., 2004. Unpublished monitoring data on metal concentrations in crab and clam tissue collected by S. Ray, L.L. Fancey & D. Scruton for the National Contaminants Information System (NCIS). Fisheries and Oceans Canada, St. John’s, NF.
Feisthauer, N.C. et al., 2006. Effects of metal-contaminated forest soils from the Canadian shield to terrestrial organisms. Environmental Toxicology and Chemistry, 25(3), pp.823-835.
Fergusson, J.E. & N.D. Kim, 1991. Trace elements in street and house dusts: Sources and speciation. Science of the Total Environment, 100, pp.125-150.
Fischer, L.A. et al., 2009. The dose-response relationship between the patch test and ROAT and the potential use for regulatory purposes. Contact Dermatitis, 61(4), pp.201-208.
Fischer, L.A., T. Menné & J.D. Johansen, 2005. Experimental nickel elicitation thresholds - A review focusing on occluded nickel exposure. Contact Dermatitis, 52(2), pp.57-64.
Fischer, L.A., T. Menné & J.D. Johansen, 2007a. Dose per unit area - A study of elicitation of nickel allergy. Contact Dermatitis, 56(5), pp.255-261.
Fischer, L.A., J.D. Johansen & T. Menne, 2007b. Nickel allergy: relationship between patch test and repeated open application test thresholds. British Journal of Dermatology, 157(4), pp.723-729.
Fisher, J.R., G.A. Rosenblum & B.D. Thomson, 1982. Asthma induced by nickel. Journal of the American Medical Association, 248(9), pp.1065-1066.
Fleet, J.C. et al., 1990. Induction of hepatic metallothionein by intraperitoneal metal injection: An associated inflammatory response. American Journal of Physiology - Gastrointestinal and Liver Physiology, 258(6 21-6), pp.G926-G933.
Fletcher, G.G. et al., 1994. Toxicity, uptake, and mutagenicity of particulate and soluble nickel compounds. Environmental Health Perspectives, 102(Supp. 3), pp.69-79.
Flint, G.N. & S. Packirisamy, 1995. Systemic nickel: The contribution made by stainless-steel cooking utensils. Contact Dermatitis, 32(4), pp.218-224.
Flint, G.N. & S. Packirisamy, 1997. Purity of food cooked in stainless steel utensils. Food Additives and Contaminants, 14(2), pp.115-126.
Flora, C.J. & E. Nieboer, 1980. Determination of Nanogram Quantities of Nickel by Differential Pulse Polarography at a Dropping Mercury Electrode and Selected Application. Analytical Chemistry, 52, pp.1013-1020.
Frank, R., K.I. Stonefield & P. Suda, 1982. Impact of nickel contamination on the production of vegetables on an organic soil, Ontario, Canada, 1980-1981. Science of the Total Environment, 26, pp.41-65.
Freedman, B. & T.C. Hutchinson, 1980. Effects of smelter pollutants on forest leaf litter decomposition near a nickel-copper smelter at Sudbury, Ontario. Can. J. Bot., 58, pp.1722-1736.
95
Friel, J.K. et al., 1999. Elemental composition of human milk from mothers of premature and full- term infants during the first 3 months of lactation. Biological Trace Element Research, 67(3), pp.225-247.
Friske, P.W.B. et al., 1993. A detailed lake sediment and water geochemical survey, central Labrador. Open file 2650 Geological Survey of Canada.
FSANZ, 2008. The 22nd Australian Total Diet Study FSANZ. Available at: http://www.foodstandards.gov.au.
Füchtjohann, L., N. Jakurbowski, D. Gladtke, D. Klockow & J. A. C. Broekaert. 2001. Speciation of nickel in airborne particulate matter by means of sequential extraction in a micro flow system and determination by graphite furnace absorption spectrometry and inductively coupled mass spectrometry. J. Environ. Monit. 3, pp.681-687.
Fullerton, A. et al., 1986. Permeation of nickel salts through human skin in vitro. Contact Dermatitis, 15(3), pp.173-177.
Fullerton, A., J.R. Andersen & A. Hoelgaard, 1988. Permeation of nickel through human skin in vitro - Effect of vehicles. British Journal of Dermatology, 118(4), pp.509-516, in Hostynek et al. (2003).
Fullerton, A., T. Menne & A. Hoelgaard, 1989. Patch testing with nickel chloride in a hydrogel. Contact Dermatitis, 20(1), pp.17-20.
Füchtjohann, L. et al., 2001. Speciation of nickel in airborne particulate matter by means of sequential extraction in a micro flow system and determination by graphite furnace atomic absorption spectrometry and inductively coupled plasma mass spectrometry. Journal of Environmental Monitoring, 3(6), pp.681-687, in OMOE.
Gallagher, L. & R.W. Macdonald, 2004. The historical record of metals in sediments from six lakes in the Fraser River Basin, BC. Water Air Soil Pollut., 152(1-4), pp.257-278.
Galbreath, K.C., C.R. Crocker, C.M. Nyberg, F.E. Huggins, G.P. Huffman & K.P. Larson. 2003. Nickel speciation measurements of urban particulate matter: method evaluation and relevance to risk assessmente. J. Environ. Monit. 5(3):56N-61N.
Galle, P., J.P. Berry & C. Galle, 1992. Role of alveolar macrophages in precipitation of mineral elements inhaled as soluble aerosols. Environmental Health Perspectives, 97, pp.145-147.
Garrett, R., 2004. Summary statistics for nickel concentrations in stream sediment according to EcoRegion and EcoDistrict. Data on nickel concentrations in Prairie and Ontario soils. NRCan, Ottawa, ON .
Garrett, R., 2010. Summary statistics for nickel concentrations in stream sediment according to EcoRegion and EcoDistrict. Data on nickel concentrations in Yukon streams. Natural Resources Canada, Geological Survey of Canada E-mail to Deanna Lee.
Gawkrodger, D.J. et al., 1986. Nickel dermatitis: The reaction to oral nickel challenge. British Journal of Dermatology, 115(1), pp.33-38, as cited in Cal EPA OEHHA (2011 draft).
Gawkrodger, D.J., C.W. McLeod & K. Dobson, 2012. Nickel skin levels in different occupations and an estimate of the threshold for reacting to a single open application of nickel in nickel-allergic subjects. British Journal of Dermatology, 166(1), pp.82-87.
Gawkrodger, D.J., I.A. Shuttler & H.T. Delves, 1988. Nickel dermatitis and diet: Clinical improvement and a reduction in blood and urine nickel levels with a low-nickel diet. Acta Dermato-Venereologica, 68(5), pp.453-456.
Ge, Y., P. Murray & W.H. Hendershot, 2000. Trace metal speciation and bioavailability in urban soils. Environmental Pollution, 107(1), pp.137-144.
Gelinas, Y., M. Lucotte & J.P. Schmit, 2000. History of the atmospheric deposition of major and trace elements in the industrialized St. Lawrence Valley, QC, Canada. Atmospheric Environment, 34(11).
Gelinas, Y. & J.P. Schmit, 1998. Estimation of the bulk atmospheric deposition of major and trace elements to a rural watershed. Atmospheric Environment, 32 (9), pp.1473-1483.
Gewurtz, S.B. et al., 2008. Spatial distribution of legacy contaminants in sediments of Lakes Huron and Superior. Journal of Great Lakes Research, 34(1), pp.153-168.

96
Ghezzi, I. et al., 1989. Behaviour of urinary nickel in low-level occupational exposure. Medicina del Lavoro, 80(3), pp.244-50, in ATSDR (2005). Available at: http://www.ncbi.nlm.nih.gov/pubmed/2796834.
Giashuddin, M. & A.H. Cornfield, 1978. Incubation study on effects of adding varying levels of nickel (as sulphate) on nitrogen and carbon mineralisation in soil. Environmental Pollution, 15, pp.231-234.
Giashuddin, M. & A.H. Cornfield, 1979. Effects of adding nickel (as oxide) to soil to nitrogen and carbon mineralization at different pH values. Environmental Pollution, 19, pp.67-70.
Gibbs, R.J., 1977. Transport phases of transition metals in the Amazon and Yukon Rivers. Geol. Soc. Am. Bull., 88, pp.829-843.
Gilman, J.P. & G.M. Ruckerbauer, 1962. Metal carcinogenesis. I. Observations on the carcinogenicity of a refinery dust, cobalt oxide, and colloidal thorium dioxide. Cancer Research, 22, pp.152-157.
Giroux, M. et al., 1992. Caractérisation de la teneur en métaux lourds totaux et disponibles des sols du Québec. Agrosol, 5(2), pp.46-55.
Gish, C.D. & R.E. Christensen, 1973. Cadmium, nickel, lead, and zinc in earthworms from roadside soil. Environmental Science & Technology, 7, pp.1060-1062.
Gizyn, W.I., 1994. Windsor Air Quality Study: Soil and Garden Produce Survey Results. Fall 1994 Phytotoxicology Section Standards Development Branch, OMEE.
Gizyn, W.I., 2002. Phytotoxicology 1999, 2000 and 2001 Investigations: Safety-Kleen Limited - Moore Township.
Gong, S-L., 2004. Unpublished monitoring data on metal concentrations in aerosol samples collected at Alert, NT. Environment Canada, Downsview, ON.
Goodman, J.E., 2011. Nickel metal not associated with lung cancer risk. American Journal of Industrial Medicine, 54(5), p.419.
Goodman, J.E. et al., 2009. Carcinogenicity assessment of water-soluble nickel compounds. Critical Reviews in Toxicology, 39(5), pp.365-417.
Goodman, J.E. et al., 2011. The nickel ion bioavailability model of the carcinogenic potential of nickel-containing substances in the lung. Critical Reviews in Toxicology, 41(2), pp.142-174.
Graham, H., 1995. Drinking Water Surveillance Program summary for 1993/1994 for nickel. Unpublished OMEE data received by Richard Carrier, Health Canada.
Grandjean, P., G.D. Nielsen & O. Andersen, 1989. Human exposure and chemobiokinetics. In T. Menne & H.I. Maibach, eds. Nickel and the Skin: Immunology and Toxicology. Boca Raton, FL: CRC Press, pp. 9-34.
Granero, S. et al., 1998. Biological monitoring of environmental pollution and human exposure to metals in Tarragona, Spain. I. Levels in hair of school children. Trace Elements and Electrocytes, 15(1), pp.39-43.
Graney, J.R., M.S. Landis & G.A. Norris, 2004. Concentrations and solubility of metals from indoor and personal exposure PM2.5 samples. Atmospheric Environment, 38(2), pp.237-247.
Grant, B.D. & J.G. Donaldson, 2009. Pathways and mechanisms of endocytic recycling. Nature Reviews Molecular Cell Biology, 10(9), pp.597-608.
Gratton, W.S., K.K. Nkongolo & G.A. Spiers, 2000. Heavy metal accumulation in soil and jack pine (Pinus banksiana) needles in Sudbury, ON, Canada. Bulletin of Environmental Contamination and Toxicology, 64(4), pp.550-557.
Greger, M., 1999. Metal availability and bioconcentration in plants. In M.N. Prasad & J. Hagemeyer, eds. Heavy Metal Stress in Plants. Berlin, Heidelberg: Springer-Verlag, pp. 1-27.
Griffin, S.R. et al., 1990. Bioavailability in rats of metals adsorbed to soils. USEPA DC, Hazleton Laboratories, America, Inc. Poster presented at the Society of Toxicology 29th Annual Meeting, Miami Beach, FL. February 12-16, 1990. Poster paper no. 623., in Birmingham & McLaughlin (2006).

97
Griffith, M.A., T. Spires & P. Barclay, 1984. Ontario Soil Baseline Survey, Analytical Data 1980-1981, Vol. 3, Analytical Data for Northern Ontario OMOE, Toronto, ON, in Environment Canada and Health Canada (1994).
Grimsrud, T.K. et al., 2000. Assessment of historical exposures in a nickel refinery in Norway. Scandinavian Journal of Work, Environment and Health, 26(4), pp.338-345.
Grimsrud, T.K. et al., 2002. Exposure to different forms of nickel and risk of lung cancer. American Journal of Epidemiology, 156(12), pp.1123-1132.
Grimsrud, T.K. et al., 2003. Lung cancer incidence among Norwegian nickel-refinery workers 1953-2000. Journal of Environmental Monitoring, 5(2), pp.190-197.
Grimsrud, T.K. et al., 2005. Can lung cancer risk among nickel refinery workers be explained by occupational exposures other than nickel. Epidemiology, 16(2), pp.146-154.
Grimsrud, T.K. & A. Andersen, 2010. Evidence of carcinogenicity in humans of water-soluble nickel salts. Journal of Occupational Medicine and Toxicology, 5(1).
Grimsrud, T.K. & J. Peto, 2006. Persisting risk of nickel related lung cancer and nasal cancer among Clydach refiners. Occupational and Environmental Medicine, 63(5), pp.365-366.
Grunsky, E.C., 2010. Geochemical Background in Soil and Till from Selected Areas Across Canada, including New Brunswick and the Maritime Provinces Soil Survey. Part 1: Till Geochemistry from Selected Areas in Canada.
Gül, Ü. et al., 2007. Nickel sensitivity in asthma patients. Journal of Asthma, 44(5), pp.383-384. Gupta, S.K. et al., 1987. The effect of graded doses of nickel on the yield, the nickel content of lettuce
and the soil respiration. Toxicology and Environmental Chemistry, 14, pp.1-9. Gupta, V.K. & R. Kala, 1996. Effect of nickel on yield and its concentration in some rabi crops grown on
typic ustipsamment. J. Indian Soc. Soil Sci., 44(2), pp.348-349. Haanstra, L. & P. Doelman, 1984. Glutamic acid decomposition as a sensitive measure of heavy metal
pollution in soil. Soil Biology and Biochemistry, 16(6), pp.595-600. Hachimi, A. et al., 1995. Interaction study of αNi3S2 with guinea pig alveolar macrophages by resonance
ionization mass spectrometry. Journal of Mass Spectrometry, 30, pp.S183-S191. Hack, A. P. Welge, J. Wittsiepe, M. Wilhelm & B. Marschner. 2002. Balance study for estimation of
bioavaliability of soilborne contaminants in young minipigs. Contract report from Ruhr-Universität, Bochum to the German Umweltbundesamt, Berlin (in German with English summary). Available at: http://www.opengrey.eu/partner/fiz.
Hack, C.E. et al., 2007. A pharmacokinetic model of the intracellular dosimetry of inhaled nickel. Journal of Toxicology and Environmental Health - Part A: Current Issues, 70(5), pp.445-464.
Haq, A.U., T.E. Bates & Y.K. Soon, 1980. Comparison of extractants for plant-available zinc, cadmium, nickel and copper in contaminated soils. Soil Science Society of America Journal, 44, pp.772-777.
Halliwell, D.R. & S. Catto, 2003. How and why is aquatic quality changing at Nahanni National Park Reserve, NWT, Canada. Environ. Monitor. Assess., 88(1-3), pp.243-281.
Halstead, R.L., B.J. Finn & A.J. MacLean, 1969. Extractability of nickel added to soils and its concentration in plants. Canadian Journal of Soil Science, 49, pp.335-342.
Hammond, D. & R.J. O’Connor, 2008. Constituents in tobacco and smoke emissions from Canadian cigarettes. Tobacco Control, 17(supp. 1), pp.i24-i31.
Hansen, K. & R.M. Stern, 1983. In vitro toxicity and transformation potency of nickel compounds. Environmental Health Perspectives, 51, pp.223-226.
Haro, R.T. et al., 1968. Studies on the acute toxicity of nickelocene. Proc. West Pharmacol. Soc., 11, pp.39-42.
Harris, G., 2004. Unpublished data on metal concentrations in British Columbia soils. BC Ministry of Water, Land, and Air Protection, Victoria, BC.
Hase, S., 2004. Unpublished monitoring data for ambient metal concentrations in Saskatchewan surface waters. SK Environment, Regina, SK .

98
Hassler, E. et al., 1983. Urinary and fecal elimination of nickel in relation to air-borne nickel in a battery factory. Annals of Clinical Laboratory Science, 13(3), pp.217-224. Available at: http://www.ncbi.nlm.nih.gov/pubmed/6870185.
Havas, M. & T.C. Hutchinson, 1983. The Smoking Hills: natural acidification of an aquatic ecosystem. Nature, 301, pp.23-27.
Haynes, W.M., 2011. Section 4. Properties of the elements and inorganic compounds. In CRC Handbook of Chemistry and Physics. Boca Raton, FL: CRC Press/Taylor and Francis.
HC, 1994. Canadian Environmental Protection Act. Human health risk assessment for priority substances HC.
HC, 1996. Health-Based Tolerable Daily Intakes/Concentrations and Tumourigenic Doses/Concentrations for Priority Substances HC. Available at: http://www.hc-sc.gc.ca/ewh-semt/pubs/contaminants/hbct-jact/index-eng.php.
HC, 2010. Federal Contaminated Site Risk Assessment in Canada, Part I: Guidance on Human Health Preliminary Quantitative Risk Assessment (PQRA), Version 2.0 HC Safe Environments Directorate Contaminated Sites Division.
HC, 2011 Draft. Estimated Daily Intake Development Methodology Nickel HC Safe Environments Directorate Contaminated Sites Division.
He, Z.L., X.E. Yang & P.J. Stofella, 2005. Trace elements in agroecosystems and impacts on the environment. J. Trace Elements Med. Biol., 19(2-3), pp.125-140.
Heale, E.L. & D.P. Ormrod, 1982. Effects of nickel and copper on Acer rubrum, Cornus stolonifera, Lonicera tatarica and Pinus resinosa. Can. J. Bot., 60, pp.2674-2681.
Heim, K.E. et al., 2007. Oral carcinogenicity study with nickel sulfate hexahydrate in Fischer 344 rats. Toxicology and Applied Pharmacology, 224(2), pp.126-137.
Henderson, R.G. et al., 2012. Oral bioaccessibility testing and read-across hazard assessment of nickel compounds. Regulatory Toxicology and Pharmacology, 63(1), pp.20-28.
Henriksson, J., J. Tallkvist & H. Tjälve, 1997. Uptake of nickel into the brain via olfactory neurons in rats. Toxicology Letters, 91(2), pp.153-162.
Henry, W.M. & K.T. Knapp, 1980. Compound forms of fossil fuel fly ash emissions. Environmental Science and Technology, 14(4), pp.450-456.
Heon, D., 2003. Yukon Regional Geochemical Database 2003 - Stream sediment analyses Exploration and Geological Services Division (Whitehorse) Yukon Region, Indian and Northern Affairs Canada.
Hesterberg, D., 1998. Biogeochemical cycles and processes leading to changes in mobility of chemicals in soils. Agri. Ecosystems Environ., 67(2-3), pp.121-133.
Hickey, M.F. & J.A. Kittrick, 1984. Chemical partitioning of cadmium, copper, nicle and zinc in soils and sediments containing high levels of heavy metals. J. Environ. Qual., 13, pp.372-376, in McGrath (1995).
Hildebrand, H.F. et al., 1990. Uptake and biological transformation of βNiS and αNi3S2 by human embryonic pulmonary epithelial cells (L132) in culture. Carcinogenesis, 11(11), pp.1943-1950.
Hildebrand, H.F. et al., 1991. In vitro and in vivo uptake of nickel sulfides by rat lymphocytes. Archives of Toxicology, 65(4), pp.324-329.
Hill, C.H., 1979. The effect of dietary protein levels on mineral toxicity in chicks. The Journal of nutrition, 109(3), pp.501-7. Available at: http://www.ncbi.nlm.nih.gov/pubmed/430253.
Hindsén, M. & M. Bruze, 1998. The significance of previous contact dermatitis for elicitation of contact allergy to nickel. Acta Dermato-Venereologica, 78(5), pp.367-370.
Hindsén, M., M. Bruze & O.B. Christensen, 1999. Individual variation in nickel patch test reactivity. American Journal of Contact Dermatitis, 10(2), pp.62-67.
Hindsén, M., M. Bruze & O.B. Christensen, 2001. Flare-up reactions after oral challenge with nickel in relation to challenge dose and intensity and time of previous patch test reactions. Journal of the American Academy of Dermatology, 44(4), pp.616-623.
99
Hindsén, M., M. Bruze & O.B. Christensen, 1997. The significance of previous allergic contact dermatitis for elicitation of delayed hypersensitivity to nickel. Contact Dermatitis, 37(3), pp.101-106.
Hindsén, M., A. Spirén & M. Bruze, 2005. Cross-reactivity between nickel and palladium demonstrated by systemic administration of nickel. Contact Dermatitis, 53(1), pp.2-8.
Hirano, S. et al., 1994. Pulmonary clearance and inflammatory potency of intratracheally instilled or acutely inhaled nickel sulfate in rats. Archives of Toxicology, 68(9), pp.548-554.
Ho, W. & A. Furst, 1973. Nickel excretion by rats following a single treatment. Proceedings of the Western Pharmacology Society, Vol.16, pp.245-248, in OEHHA (2011 draft).
Hoff, R.M. & L.A. Barrie, 1986. Air chemistry observations in the Canadian Arctic. Water Science and Technology, 18(2), pp.97-107.
Hohnadel, D.C. et al., 1973. Atomic absorption spectrometry of nickel, copper, zinc, and lead in sweat collected from healthy subjects during sauna bathing. Clinical Chemistry, 19(11), pp.1288-1292.
Holt-Oduro, C., 2004. Unpublished data on metal concentrations in Alberta groundwater. AB Environment, Edmonton, AB.
Hong, C.S. et al., 1986. Occupational asthma caused by nickel and zinc. Korean Journal of Internal Medicine, 1(2), pp.259-262.
Hopfer, S.M., W.P. Fay & F.W. Sunderman, 1989. Serum Nickel Concentrations in Hemodialysis Patients with Environmental Exposure. Annals of Clinical Laboratory Science, 19, pp.161-167.
Hopkin, S.P., 1989. Ecophysiology of Metals in Terrestrial Invertebrates , Barking, UK: Elsevier Appl. Science.
Horak, E. & F.W. Sunderman Jr, 1973. Fecal nickel excretion by healthy adults. Clinical Chemistry, 19(4), pp.429-430. A
Horie, M. et al., 2009. Ultrafine NiO particles induce cytotoxicity in vitro by cellular uptake and subsequent Ni(II) release. Chemical Research in Toxicology, 22(8), pp.1415-1426.
Hostýnek, J.J., 2003. Factors determining percutaneous metal absorption. Food and Chemical Toxicology, 41(3), pp.327-345.
Hostýnek, J.J., F. Dreher, A. Pelosi, et al., 2001a. Human stratum corneum penetration by nickel: In vivo study of depth distribution after occlusive application of the metal as powder. Acta Dermato-Venereologica, Supplement, (212), pp.5-10.
Hostýnek, J.J., F. Dreher, T. Nakada, et al., 2001b. Human stratum corneum adsorption of nickel salts: Investigation of depth profiles by tape stripping in vivo. Acta Dermato-Venereologica, Supplement, (212), pp.11-18.
Hostýnek, J.J., K.E. Reagan & H.I. Maibach, 2002. Oxidative properties of skin exudates - A determinant for nickel diffusion: A review. Exogenous Dermatology, 1(1), pp.7-17.
Hsieh, T.H., 1999. A dosimetry model of nickel compounds in the rat lung. Inhalation Toxicology, 11(3), pp.229-248. Available at: http://informahealthcare.com/doi/abs/10.1080/089583799197168.
Hu K., Z. et al., 2002. Effect of nickel and cadmium speciation on nitrification inhibition. Environmental Science & Technology, 36(14), pp.3074-3078.
Hung, G.A., 2007. Metal accumulation in surface salt marsh sediments of the Bay of Fundy, Canada. Estuaries and Coasts, 30(4), pp.725-734.
Hunter, J.G. & O. Vergnano, 1952. Nickel toxicity in plants. Proceedings of the Association of Applied Biologists, pp.279-284.
Hutchinson, T.C., B. Freedman & L. Whitby, 1981. Nickel in Canadian soils and vegetation. In Effects of Nickel in the Canadian Environment. Ottawa, ON: National Research Council of Canada, pp. 119-157.
Hutchinson, T.C. & M. Havas, 1986. Recovery of previously acidified lakes near Coniston, Canada following reductions in atmospheric sulphur and metal emissions. Water, Air, and Soil Pollution, 28(3-4), pp.319-333.
Hutzell, W.T. & D.J. Luecken, 2007. Fate and transport of emissions for several trace metals over the United States. Science of the Total Environment, 396(2-3), pp.164-179.

100
IARC, 1990. Chromium, Nickel and Welding. IARC Monographs on the Evaluation of Carcinogenic Risks to Humans, 49.
IARC, 2011. Nickel and nickel compounds. IARC Monographs on the Evaluation of Carcinogenic Risks to Humans. Supplement, 100 C, pp.169-218.
ICRP, 1981. Limits for intakes of radionuclides by workers. ICRP Publication 30, Part 2. Ikem, A. et al., 2002. Levels of 26 elements in infant formula from USA, UK, and Nigeria by microwave
digestion and ICP-OES. Food Chemistry, 77(4), pp.439-447. INAC, 2003. Canadian Arctic Contaminants Assessment Report II INAC., pp.148-152. IOM, 2001. Dietary Reference Intakes for Vitamin A, Vitamin K, Arsenic, Boron, Chromium, Copper,
Iodine, Manganese, Molybdenum, Nickel, Silicon, Vanadium and Zinc IOM Food and Nutrition Board.
Ishimatsu, S. et al., 1995. Distribution of various nickel compounds in rat organs after oral administration. Biological Trace Element Research, 49(1), pp.43-52.
Jackson, M.B., 1988. The dominant attached filamentous algae of Georgian Bay, the North Channel and Eastern Lake Huron: Field ecology and biomonitoring potential during 1980. Hydrobiologia, 163(1), pp.149-171.
Jacques, A.P., 1987. Summary of emissions of antimony, arsenic, cadmium, chromium, copper, lead, manganese, mercury and nickel in Canada.Environment Canada. 44 p.
Janssen, R.P., W.J.G. Peijnenburg & L. Posthuma, 1997. Equilibrium partitioning of heavy metals in Dutch field soils. I. Relationship between metal partition coefficients and soil characteristics. Environ. Toxicol. and Chem., 16(12), pp.2470-2478.
Jenkins, G., 1992. Ontario Ministry of the Environment, Water Resources, Toronto, ON. Jensen, C.S. et al., 2003. Experimental systemic contact dermatitis from nickel: A dose-response study.
Contact Dermatitis, 49(3), pp.124-132. Jensen, C.S., T. Menné & J. Duus Johansen, 2006. Systemic contact dermatitis after oral exposure to
nickel: A review with a modified meta-analysis. Contact Dermatitis, 54(2), pp.79-86. Jensen, P. et al., 2011. Excessive nickel release from mobile phones-a persistent cause of nickel allergy
and dermatitis. Contact Dermatitis, 65(6), pp.354-358. Jøhnke, H. et al., 2004. Reactivity to patch tests with nickel sulfate and fragrance mix in infants. Contact
Dermatitis, 51(3), pp.141-147. Johnson, D. & B. Hale, 2004. White birch (Betula papyrifera Marshall) foliar litter decomposition in
relation to trace metal atmospheric inputs at metal-contaminated and uncontaminated sites near Sudbury, ON and Rouyn-Noranda, QC, Canada. Environmental Pollution, 127(1), pp.65-72.
Jones Geoff (via Edwin Yee), 2004. Unpublished monitoring data for ambient metal concentrations in soils across the province of Manitoba (1995 to 2003). MB Conservation, Winnipeg, MB.
Jones-White, D., 1992. Ontario Ministry of the Environment database on drinking water. Various paginations.
Kaaber, K. et al., 1979. Antabuse® treatment of nickel dermatitis. Chelation - a new principle in the treatment of nickel dermatitis. Contact Dermatitis, 5(4), pp.221-228.
Kaaber, K., N.K. Veien & J.C. Tjell, 1978. Low nickel diet in the treatment of patients with chronic nickel dermatitis. British Journal of Dermatology, 98(2), pp.197-201.
Kabata-Pendias, A. & A.B. Mukherjee, 2007. Trace Elements from Soil to Human, Berlin Heidelberg: Springer-Verlag.
Kabata-Pendias, A. & H. Pendias, 1984. Trace Elements in Soils and Plants, Boca Raton, FL: CRC Press Inc.
Käkelä R, A. Käkelä & H.Hyvärinen, 1999. Effects of nickel chloride on reproduction of the rat and possible antagonistic role of selenium. Comp Biochem Physiol C Pharmacol Toxicol Endocrinol. 23(1), 27-37.
Kalimo, K., K. Lammintausta & J. Maki, 1985. Nickel penetration in allergic individuals: Bioavailability versus X-ray microanalysis detection. Contact Dermatitis, 12(5), pp.255-257.

101
Kapustka, L.A., D. Eskew & J.M. Yocum, 2006. Plant toxicity testing to derive ecological soil screening levels for cobalt and nickel. Environmental Toxicology and Chemistry, 25(3), pp.865-874.
Kasprzak, K.S. & F.W. Sunderman Jr, 1969. The metabolism of nickel carbonyl-14C. Toxicology and Applied Pharmacology, 15(2), pp.295-303.
Kasprzak, K.S., F.W. Sunderman Jr & K. Salnikow, 2003. Nickel carcinogenesis. Mutation Research - Fundamental and Molecular Mechanisms of Mutagenesis, 533(1-2), pp.67-97.
Kaszycki, C.A., 1986. Surficial geology and till geochemistry, Lynn Lake - Leaf Rapids Region, Manitoba, in Current Research, Part B, Geological Survey of Canada Paper 861-B, 245-256.
Ke, Q. et al., 2007. Fluorescent tracking of nickel ions in human cultured cells. Toxicology and Applied Pharmacology, 219(1), pp.18-23.
Keller, W., J.R. Pitblado & J. Carbone, 1992. Chemical responses of acidic lakes in the Sudbury, Ontario, area to reduced smelter emissions, 1981-89. Canadian Journal of Fisheries and Aquatic Sciences, 49(Supp.1), pp.25-32.
Kelly, S.J., C. Hertzman & M. Wiens, 1991. Element Analysis of 198 Soil Samples Collected in Trail B.C. Prepared for the B.C. Ministry of Environment.
Khalid, B.Y. & J. Tinsley, 1980. Some effects of nickel toxicity on rye grass. Plant and Soil, 55, pp.139-144.
Kilburn, K.H. et al., 1989. Respiratory symptoms and functional impairment from acute (cross-shift) exposure to welding gases and fumes. American Journal of the Medical Sciences, 298(5), pp.314-319.
Kim, N. & J. Fergusson, 1993. Concentrations and sources of cadmium, copper, lead, and zinc in house dust in Christchurch, New Zealand. Science of the Total Environment, 138, pp.1-21.
Kimber, I. et al., 2002. Allergic contact dermatitis. International Immunopharmacology, 2(2-3), pp.201-211.
Kissel, J.C. et al., 1998. Empirical investigation of hand-to-mouth transfer of soil. Bulletin of environmental contamination and toxicology, 60(3), pp.379-86. Available at: http://link.springer.com/journal/128/60/3.
Kissel, J.C., K.Y. Richter & R. Fenske, 1996. Field measurement of dermal soil loading attributable to various activities: implications for exposure assessment. Risk analysis: an official publication of the Society for Risk Analysis, 16(1), pp.115-25. Available at: http://www.ncbi.nlm.nih.gov/pubmed/8868226.
Klassen, R.A. & F.J. Thompson, 1990. Glacial history, drift composition and till geochemistry, Labrador. GSC-Open File 2170.
Koch, I., K. Reimer & C. Ollson. 2005. Application of Bioaccessibility for Contaminated Site Risk Assessment. Presentation at Health Canada Bioaccessibility Workshop. August 30-31, 2005. Delta Chelsea Hotel, Toronto. Available at: http://www.bioavailabilityresearch.ca/Final%20Bio%20Workshop%20Proceedings%20Jan06.pdf.
Kodama, Y. et al., 1993. Comparative deposition and clearance of various nickel compounds exposed by inhalation in rats. Biological Trace Element Research, 36(3), pp.257-269.
Kodama, Y., S. Ishimatsu & K. Matsuno, 1985. Pulmonary deposition and clearance of a nickel oxide aerosol by inhalation. Biological Trace Element Research, 7(1), pp.1-9.
Koizumi, C. et al., 2004. Urinary nickel: Measurement of exposure by inductively coupled plasma argon emission spectrometry. Toxicology and Industrial Health, 20(6-10), pp.103-108.
Kolesarova, A., M. Capcarova, H. Arpasova, A. Kalafova, P. Massanyi, N. Lukac, J. Kovacik & M. Schneidgenova. 2008. Nickel-induced blood biochemistry alterations in hens after an experimental peroral administration. J. Environ. Sci. Health B43:625-632.
Kollmeier, H. et al., 1990. Age, sex, and region adjusted concentrations of chromium and nickel in lung tissue. British Journal of Industrial Medicine, 47(10), pp.682-687.

102
Konhauser, K.O. et al., 2009. Oceanic nickel depletion and a methanogen famine before the Great Oxidation Event. Nature, 458(7239), pp.750-753.
Korthals, G.W. et al., 1996. Short-term effects of cadmium, copper, nickel, and zinc on soil nematodes from different feeding and life-history strategy groups. Applied Soil Ecology, 4, pp.107-117.
Koutrakis, P., S.L.K. Briggs & B.P. Leaderer, 1992. Source apportionment of indoor aerosols in suffolk and onondaga counties, New York. Environmental Science and Technology, 26(3), pp.521-527.
Kukier, U. & R.L. Chaney, 2001. Amelioration of nickel phytotoxicity in muck and mineral soils. Journal of Environment Quality, 30(6), pp.1949-1960.
Kuligowski, J. & K.M. Halperin, 1992. Stainless steel cookware as a significant source of nickel, chromium, and iron. Archives of Environmental Contamination and Toxicology, 23(2), pp.211-215, in Environment Canada and Health Canada.
Kurowska, E. & W. Bal, 2010. Recent advances in molecular toxicology of cadmium and nickel. , 4, pp.85-126.
Kutman, B.Y., U.B Kutman & I. Cakmak. 2013. Nickel-enriched seed and externally supplied nickel to improve growth and alleviate foliar urea damage in soybean. Plant Soil, 363, pp. 61-75.
Lacy, S.A. et al., 1996. Distribution of nickel and cobalt following dermal and systemic administration with in vitro and in vivo studies. Journal of Biomedical Materials Research, 32(2), pp.279-283.
Laliberté, D., 2004. Teneurs en métaux dans les sédiments et les poissons des lacs aux Dorés, Chibougamau, Obatogamau et Waconichi en 2002. Ministère de l’Environnement du Québec, Direction du suivi de l’état de l’environnement.
Laliberté, D. & G. Trembaly, 2002. Teneurs en métaux, en BPC et en dioxines et furanes dans les poissons et les sédiments de quatre lacs du nord du Québec en 2001. Ministère de l’Environnement du Québec, Direction du suivi de l’état de l’environnement.
Lamoureux, M., 2005. Report on nickel (Ni) speciation in particulate matter collected on filters. Enviroanalytix Services. October 5, 2005, in OMOE (2011) .
Lamoureux, M., 2003. The characterization of nickel and arsenic species in air filters for the Ministry of Environment of Ontario. Preliminary report on nickel speciation. Environanalytix Services. March 25, 2002, in OMOE (2011).
Larsen, E.H. et al., 2002. Monitoring the content and intake of trace elements from food in Denmark. Food Additives Contamin., 19, pp.33-46.
Larter, N.C. & J.A. Nagy, 2000. A comparison of heavy metal levels in the kidneys of High Arctic and mainland caribou populations in the Northwest Territories of Canada. Science of the Total Environment, 246(2-3), pp.109-119.
Lee, S.Z. et al., 2001. The effect of hydration on adsorption and desorption of heavy metals in soils. J. Environ. Sci. Health Part A Toxic/Hazardous Substances and Environmental Engineering, 36 (1), pp.63-74.
Leece, B. & S. Rifat, 1997. Technical Report. Assessment of Potential Health Risk of Reported Soil Levels of Nickel, Copper and Cobalt in Port Colborne and Vicinity May 1997. Available at: http://booksnow1.scholarsportal.info/ebooks/oca5/5/ome/pdf/assessmentofpote00ontauoft.pdf.
Leger, D.A., 1991. Data summary report on nickel in Atlantic Canada (1973-1990). IWD-AR-WQR-91-60 Environment Canada Inland Water Directorate, Water Quality Branch.
Lehnert, B.E., Y.E. Valdez & G.L. Tietjen, 1989. Alveolar macrophage-particle relationships during lung clearance. American Journal of Respiratory Cell and Molecular Biology, 1(2), pp.145-154.
Li, B. et al., 2011. Influences of soil properties and leaching on nickel toxicity to barley root elongation. Ecotoxicology and Environmental Safety, 74, pp.459-466.
Li, C.S., L.Y. Hsu & Y.Y.T. Chuang, 1993. Elemental profiles of indoor and outdoor particulate matter less than 10 μm (PM10) and 2.5 μm (PM2.5) in Taipei. Chemosphere, 27(11), pp.2143-2154.
Li, Z., H. Wang, & W.S. Wu, 2008. Pharmacokinetic parameter and residua of 63Ni-NiCl2 in rat. Yaoxue Xuebao, 43(2), pp.224-226.

103
Liang, C.N. & M.A. Tabatabai, 1977. Effects of trace elements on nitrogen mineralization in soils. Environmental Pollution, 12, pp.141-147.
Liang, C.N. & M.A. Tabatabai, 1978. Effects of trace elements on nitrification in soils. Journal of Environment Quality, 7, pp.291-293.
Liang, J. & J.J. Schoenau, 1995. Development of resin membranes as a sensitive indicator of heavy metal toxicity in the soil environment. International Journal of Environmental Analytical Chemistry, 59, pp.265-275.
Lighthart, B., J. Bahim & V.V. Volk, 1983. Microbial respiration and chemical speciation in metal-amended soils. Journal of Environment Quality, 12.
Ling, J.R. & R.M. Leach, 1979. Studies on nickel metabolism: Interaction with other mineral elements . Poultry Sci., 58, pp.591-596.
Lisiewicz, M., R. Heimburger & J. Golimowski, 2000. Granulometry and the content of toxic and potentially toxic elements in vacuum-cleaner collected, indoor dusts of the city of Warsaw. Science of the Total Environment, 263(1-3), pp.69-78.
Llobet, J.M. et al., 1998. Biological monitoring of environmental pollution and human exposure to metals in Tarragona, Spain. III. Blood levels. Trace Elements and Electrocytes, 15(2), pp.76-80.
Lloyd, G.K., 1980. Dermal absorption and conjugation of nickel in relation to the induction of allergic contact dermatitis: Preliminary results . In S.F.W. Brown (Jr.), ed. Nickel Toxicology. London, England: Academic Press, pp. 145-148, in R.H. Guy, J.J. Hosty.
Lock, K. & C.R. Janssen, 2002. Ecotoxicity of nickel to Eisenia fetida, Enchytraeus albidus, and Folsomia candida. Chemosphere, 46, pp.197-200.
Lucassen, M. & B. Sarkar, 1979. Nickel(II)-binding constituents of human blood serum. Journal of Toxicology and Environmental Health, 5(5), pp.897-905.
Lumb, A., D. Halliwell & T. Sharma, 2006. Application of CCME water quality index to monitor water quality: a case study of the Mackenzie River Basin, Canada. Environ. Monitor. Assess., 113(1-3), pp.411-429.
Lutwick, G., 1994. Unpublished data on nickel levels in Alberta agricultural soils. AB Environment, Environmental Protection Services, Wastes and Chemicals Division, Soil Protection Branch, Lethbridge, AB Received by Sylvie Coad and Victoria Laube.
Ma, L.Q., 1997. Chemical fractionation of cadmium, copper, nickel, and zinc in contaminated soils. J. Environ. Qual., 26(1), pp.259-264.
Ma, W.C., 1982. The influence of soil properties and worm-related factors on the concentration of heavy metals in earthworms. Pedobiologia, 24, pp.109-119.
MAC, 1991. Mining in Canada: Facts and figures, Ottawa, ON. MacLatchy, J., 1992. Environment Canada, Industrial Programs Branch, Hull, QC, unpublished
information. MacLean, A.J. & A.J. Dekker, 1978. Availability of zinc, copper, and nickel to plants grown in sewage-
treated soils. Canadian Journal of Soil Science, 58, pp.381-389. Maciariello, S.L. et al., 2010. Nickel allergy: Description of a case of rhinitis and atypical professional
Asthma [Allergia da nichel: Presentazione di un caso di rinite e di asma professionale Atipico]. Capsula Eburnea , 2010, pp.45-49.
Macomber, L. & R.P. Hausinger, 2011. Mechanisms of nickel toxicity in microorganisms. Metallomics, 3(11), pp.1153-1162.
Madany, I.M., M.S. Akhter & O.A. Al Jowder, 1994. The correlations between heavy metals in residential indoor dust and outdoor street dust in Bahrain. Environment International, 20(4), pp.483-492.
Madrid, F., M. Biasioli & F. Ajmone-Marsan, 2008. Availability and bioaccessibility of metals in fine particles of some urban soils. Archives of Environmental Contamination and Toxicology, 55(1), pp.21-32.

104
Malecki, M.R., E.F. Neuhauser & R.C. Loehr, 1982. The effect of metals on the growth and reproduction of Eisenia foetida (Oligochaeta, Lumbricidae). Pedobiologia, 24, pp.129-137.
Mallory, M.L. et al., 1998. Chemical trends and status of small lakes near Sudbury, ON, 1983-1995: Evidence of continued chemical recovery. Canadian Journal of Fisheries and Aquatic Sciences, 55(1), pp.63-75.
Malo, J.L., A. Cartier & M. Doepner, 1982. Occupational asthma caused by nickel sulfate. Journal of Allergy and Clinical Immunology, 69(1 I), pp.55-59.
Malo, J.L., A. Cartier & G. Gagnon, 1985. Isolated late asthmatic reaction due to nickel sulphate without antibodies to nickel. Clinical Allergy, 15(2), pp.95-99.
Manchananda, D. 2011. Nickel Release Regulations, EN 1811:2011 - What's New? The Laboratory at the Birmingham Assay Office. Birmingham.
Mandal, R. et al., 2002. Chemical speciation and toxicity of nickel species in natural waters from the Sudbury area (Canada). Environmental Science & Technology, 36(7), pp.1477-1484.
Marsalek, J., W.E. Watt & B.C. Anderson, 2006. Trace metal levels in sediments deposited in urban stormwater management facilities. Water Science & Technology, 53(2), pp.175-183.
Martinez, D. & G. Diaz, 1996. Effect of graded levels of dietary nickel and manganese on blood haemoglobin content and pulmonary hypertension in broiler chickens Effect of graded levels of dietary nickel and manganese on blood haemoglobin content and pulmonary hypertension in broiler chickens. Avian Pathology, 25(3), pp. 37-41.
Marvin, C. et al., 2007. Metals associated with suspended sediments in Lakes Erie and Ontario, 2000-2002. Environ. Monitor. Assess., 130(1-3), pp.149-161.
Marvin, C., L. Grapentine & S. Painter, 2004. Application of a sediment quality index to the lower Laurentian Great Lakes. Environ. Monitor. Assess., 91, pp.1-16.
Marzouk, A. & F.W. Sunderman Jr, 1985. Biliary excretion of nickel in rats. Toxicology Letters, 27(1-3), pp.65-71. Available at: http://www.sciencedirect.com/science/article/pii/0378427485901213.
Massoura, S.T. et al., 2006. Control of nickel availability by nickel bearing minerals in natural and anthropogenic soils. Geoderma, 136(1), pp.28-37.
McConnell, L.H. et al., 1973. Asthma caused by nickel sensitivity. Annals of Internal Medicine, 78(6), pp.888-890.
McGrath, S.P., 1995. Nickel. In B. J. Alloway, ed. Heavy Metals in Soils. London UK: Blackie Academic & Professional, pp. 152-174.
McIlveen, W.D., 1998. Investigation into Chemical Composition of Shales in Ontario. OMOE, Phytotoxicology Section, Standards Development Branch.
McIlveen, W.D. & J.J. Negusanti, 1993. Nickel in the terrestrial environment. In E. Nieboer, ed. Proceedings of the Fifth International conference on Nickel Metabolism and Toxicity. Sudbury, ON, Canada, Sept. 1992.
McKeague, J.A. & M.S. Wolynetz, 1980. Background levels of minor elements in some Canadian soils. Geoderma, 24(4), pp.299-307.
McMurter, H.J.G., 1993. Soil ingestion estimates for livestock and wildlife (unpublished report) Environment Canada Eco-Health Branch.
MEF, 1998. Politique de protection des sols et de réhabilitation des terrains contaminés - Nouvelle politique. Available at: http://www.mddelcc.gouv.qc.ca/sol/terrains/politique-en/appendix2.htm.
Melluzi, A., F. Simoncini, F. Sirri, L. Vandi & G. Giordani, 1996. Feeding hens diets supplemented with heavy metals (chromium, nickel and lead). Archiv fuer Gelfuegelkunde. 603(3), pp. 119-125.
Menne, T. & G. Calvin, 1993. Concentration threshold of non-occluded nickel exposure in nickel-sensitive individuals and controls with and without surfactant. Contact Dermatitis, 29(4), pp.180-184.
Menne, T., H.I. Mikkelsen & P. Solgaard, 1978. Nickel excretion in urine after oral administration. Contact Dermatitis, 4(2), pp.106-108.

105
Menon, C.R. & E. Nieboer, 1986. Uptake of nickel(II) by human peripheral mononuclear leukocytes. Journal of Inorganic Biochemistry, 28(2-3), pp.217-225.
Menzel, D.B. et al., 1987. Pharmacokinetic modeling of the lung burden from repeated inhalation of nickel aerosols. Toxicology Letters, 38(1-2), pp.33-43.
Menzies, N.W., M.J. Donn & P.M. Kopittke. 2007. Evaluation of extractants for estimation of the phytoavailable trace metals in soils. Environmental Pollution, 145(1), 121-130.
Méranger, J.C., K.S. Subramanian & C. Chalifoux, 1981. Survey for cadmium, cobalt, chromium, copper, nickel, lead, zinc, calcium, and magnesium in Canadian drinking water supplies. J. Assoc. Analytic Chem, 64, pp.44-53.
Mertz, W., 1979. The newer trace elements. Biological Trace Element Research, 1(3), pp.259-270. Meyer, J.D. et al., 2000. Occupational contact dermatitis in the UK: A surveillance report from
EPIDERM and OPRA. Occupational Medicine, 50(4), pp.265-273. MHSPE, 1994. Environmental Quality Objectives in the Netherlands Risk Assessment and
Environmental Quality Division Directorate for Chemicals, External Safety and Radiation Protection.
Mills, J.G. & M.A. Zwarich, 1975. Heavy metal content of agricultural soils in Manitoba. Canadian Journal of Soil Science, 55, pp.295-300.
Molas, J. & S. Baran, 2004. Relationship between the chemical form of nickel applied to the soil and its uptake and toxicity to barley plants (Hordeum vulgare L.). Geoderma, 122(2-4), pp.247-255.
Molnár, P. et al., 2006. Personal exposures and indoor, residential outdoor, and urban background levels of fine particle trace elements in the general population. Journal of Environmental Monitoring, 8(5), pp.543-551.
Moman, S.A., G.S. Plumlee & D.B. Smith, 2009. Application of in vitro extraction studies to evaluate element bioaccessibility in soils form a transect across the United States and Canada. Applied Geochemistry. 24(2009): 1454-1463.
Moody, R.P. et al., 2009. Contaminated soils (II): In vitro dermal absorption of nickel (Ni-63) and mercury (Hg-203) in human skin. Journal of Toxicology and Environmental Health Part A, 72(8), pp.551-559.
Moon, J. et al., 1988. Correlation clusters in the accumulation of metals in human scalp hair: Effects of age, community of residence, and abundances of metals in air and water supplies. Science of the Total Environment, 72(1), pp.87-112.
Moore, J.W. & S. Ramamoorthy, 1984. Heavy metals in natural waters: applied monitoring and impact assessment.
Moreno, J.L., A. Pérez & A. Aliaga, 2003. The ecological dose of nickel in a semiarid soil amended with sewage sludge related to the unamended soil. Water, Air, and Soil Pollution, 143, pp.289-300.
Morgan, L.G. & P.J.C. Rouge, 1984. Biological monitoring in nickel refinery workers. In F.W. Sunderman, ed. Nickel in the Human Environment. IARC Scientific Publications. Lyon, France: International Agency for Research on Cancer, pp. 507-20, in Roels et al. (1993).
Morvai, V. et al., 1992. The role of maternal and placental circulation in the embryotoxic and teratogenic effects induced by nickel sulphate. Reproductive Toxicology, 6(2), pp.183-184.
Muir, D. et al., 1993. Prevalence of small opacities in chest radiographs of nickel sinter plant workers. British Journal of Industrial Medicine, 50(5), pp.428-431.
Muir, D. et al., 2005. Spatial and temporal trends of mercury and other metals in landlocked char from lakes in the Canadian Arctic archipelago. Sci Total Environ., 351-352, pp.464-478.
Murdoch, A., L. Sarazin & T. Lomas, 1988. Summary of surface and background concentrations of selected elements in the Great Lakes sediments. Journal of Great Lakes Research, 14(2), pp.241-251.
Murray, Y.G. & W.H. Hendershot, 2000. Trace metal speciation and bioavailabiliy in urban soils. Environmental Pollution, 107(1), pp.137-144.
NAS, 1975. Medical and biological effects of environmental pollutants: Nickel Academy of Sciences.

106
Nason, T., 2004. pers. comm. Alberta Environmental Protection. Nava, C. et al., 1987. Chromium and nickel salts: a cause of allergic contact dermatitis due to detergents.
Medicina del Lavoro, 78(5), pp.405-412, in Environment Canada and Health Canada. Neuhauser, E.F. et al., 1985. Toxicity of metals to the earthworm Eisenia foetida. Biol. Fert. Soils, 1,
pp.149-152. Neuhauser, E.F., M.R. Malecki & R.C. Loehr, 1984. Growth and reproduction of the earthworm Eisenia
fetida after exposure to sublethal concentrations of metals. Pedobiologia, 27, pp.89-97. NHW Canada, 1989. Guidelines for Canadian drinking water quality - Supporting documentation.
Updated November 1990, December 1992 and February 1995. Nieboer, E. et al., 1984. Cellular binding and/or uptake of nickel(II) ions. IARC Scientific Publications,
(53), pp.321-331. Nieboer, E., 1992. McMaster University, Hamilton, ON, in Environment Canada and Health Canada
(1994) . Nielsen, F.H. et al., 1984. Nickel influences iron metabolism through physiologic, pharmacologic and
toxicologic mechanisms in the rat. Journal of Nutrition, 114(7), pp.1280-1288. Nielsen, F.H., 1986. Nickel. In W. Mertz, ed. Trace Elements in Human and Animal Nutrition, Volume 1,
5th edition. New York: Academic Press, pp. 245-273. Nielsen, F.H., 1991. Nutritional requirements for boron, silicon, vanadium, nickel, and arsenic: current
knowledge and speculation. FASEB Journal, 5(12), pp.2661-2667. Nielsen, F.H. & H.H. Sandstead, 1974. Are nickel, vanadium, silicon, fluorine, and tin essential for man?
A review. American Journal of Clinical Nutrition, 27(5), pp.515-520. Nielsen, G.D., U. Søderberg, et al., 1999. Absorption and retention of nickel from drinking water in
relation to food intake and nickel sensitivity. Toxicology and Applied Pharmacology, 154(1), pp.67-75.
Nielsen, G.D. et al., 1990. Nickel-sensitive patients with vesicular hand eczema: Oral challenge with a diet naturally high in nickel. British Journal of Dermatology, 122(3), pp.299-308.
Nielsen, G.D., O. Andersen & M. Jensen, 1993. Toxicokinetics of nickel in mice studied with the γ-emitting isotope 57Ni. Fundamental and Applied Toxicology, 21(2), pp.236-243.
Nielsen, G.D. & M. Flyvholm, 1984. Risks of high nickel intake with diet. IARC Scientific Publications, (53), pp.333-338.
Nielsen, N.H., T. Menné, et al., 1999. Effects of repeated skin exposure to low nickel concentrations: A model for allergic contact dermatitis to nickel on the hands. British Journal of Dermatology, 141(4), pp.676-682.
Nielsen, N.H. et al., 2001. Persistence of contact allergy among Danish adults: An 8-year follow-up study. Contact Dermatitis, 45(6), pp.350-353.
Niu, J., P.E. Rasmussen, N.M. Hassan, et al., 2010b. Concentration distribution and bioaccessibility of trace elements in nano and fine urban airborne particulate matter: Influence of particle size. Water, Air, and Soil Pollution, 213(1-4), pp.211-225.
Niu, J., P.E. Rasmussen, A. Wheeler, et al., 2010a. Evaluation of airborne particulate matter and metals data in personal, indoor and outdoor environments using ED-XRF and ICP-MS and co-located duplicate samples. Atmospheric Environment, 44(2), pp.235-245.
Nkongolo, K.K. et al., 2008. Metal content in soil and black spruce (Picea mariana) trees in the Sudbury region (Ontario, Canada): low concentrations of arsenic, cadmium, and nickel detected near smelter sources. Bulletin of Environmental Contamination and Toxicology, 80(2), pp.107-111.
Noble, D.G., 1990. Contaminants in Canadian Seabirds. State of the Environment Report no. 90-2, Canadian Wildlife Service, Environment Canada.
Noel, L., J.C. Leblanc & T. Guerin, 2003. Determination of several elements in duplicate meals from catering establishments using closed vessel microwave digestion with inductively coupled plasma mass spectrometry detection: estimation of daily dietary intake. Food Additives Contamin., 20, p.44.

107
Nomoto, S. et al., 1973. Isolation of 63Ni-labeled nickeloplasmin from rabbit serum. Biochemical Medicine, 8(2), pp.171-181.
Nomoto, S., M.D. McNeely & F.W. Sunderman Jr, 1971. Isolation of a nickel α2-macroglobulin from rabbit serum. Biochemistry, 10(9), pp.1647-1651.
Norgaard, O., 1955. Investigations with radioactive Ni 57 into the resorption of nickel through the skin in normal and in nickel-hypersensitive persons. Acta Dermato-Venereologica, 35(2), pp.111-7, in R.H. Guy, J.J. Hostyne.
Norgaard, O., 1957. Investigations with radioactive nickel, cobalt and sodium on the resorption through the skin in rabbits, guinea-pigs and man. Acta Dermato-Venereologica, 37(6), pp.440-445, in R.H. Guy, J.J. Hostyne.
Novey, H.S., M. Habib & I.D. Wells, 1983. Asthma and IgE antibodies induced by chromium and nickel salts. Journal of Allergy and Clinical Immunology, 72(4), pp.407-412.
NRCan, 2009. Canadian Minerals Yearbook (CMY) - 2009 Nickel. Minerals and Metals Sector Natural Resources Canada. Available at: www.nrcan.gc.ca/mining-materials/markets/canadian-minerals-yearbook/2009/8466
NRCC, 1981. Effects of nickel in the Canadian environment NRCC Associate Committee on Scientific Criteria for Environment Quality.
Nriagu, J.O., 1980. Global cycle and properties of nickel. In J.O. Nriagu, ed. Nickel in the Environment. New York: Wiley, pp. 1-26.
Nriagu, J.O., H.K. Wong & R.D. Coker, 1982. Deposition and chemistry of pollutant metals in lakes around the smelters at Sudbury, ON. Environmental Science & Technology, 16(9), pp.551-560.
NTP, 1996a. Toxicology and carcinogenesis studies of nickel oxide (CAS NO. 1313-99-1) in F344/N rats and B6C3F1 mice (Inhalation Studies). NTP TR 451 US Deparment of Health and Human Services National Toxicology Program.
NTP, 1996b. Toxicology and carcinogenesis studies of nickel subsulfide (CAS NO. 12035-72-2) in F344/N rats and B6C3F1 mice (Inhalation Studies). NTP TR 453 US Deparment of Health and Human Services National Toxicology Program.
NTP, 1996c. Toxicology and carcinogenesis studies of nickel sulfate hexahydrate (CAS NO. 10101-97-0) in F344/N rats and B6C3F1 mice (Inhalation Studies). NTP TR 454 US Deparment of Health and Human Services National Toxicology Program.
Oberdorster, G., R.B. Baggs & J. Finkelstein, 1995. Pulmonary retention and effects of inhaled NiO and Ni3S2 in rats and mice: indicators of maximum tolerated dose? Annals of Clinical Laboratory Science, 25, p.441.
Oberdorster, G., 1995b. Lung Particle Overload: Implications for Occupational Exposures to Particles. Regulatory Toxicology and Pharmacology. 21(1), pp.123-135.
Obone, É. et al., 1999. Toxicity and bioaccumulation of nickel sulfate in Sprague-Dawley rats following 13 weeks of subchronic exposure. Journal of Toxicology and Environmental Health - Part A, 57(6), pp.379-401.
O’Dell, G.D. et al., 1971. Effect of dietary nickel level on excretion and nickel content of tissues in male calves. Journal of Animal Science, 32(4), pp.769-773.
OEHHA, 2012. Nickel Reference Exposure Levels. Nickel and Nickel Compounds. Nickel Oxide. Reference Exposure Levels (RELs). Office of Environmental Health Hazard Assessment. California Environmental Protection Agency. February 2012. Available at: http://oehha.ca.gov/air/chronic_rels/pdf/032312NiREL_Final.pdf
Oller, A.R., 2002. Respiratory carcinogenecity assessment of soluble nickel compounds. Environmental Health Perspectives, 110(Supp. 5), pp.841-844.
Oller, A.R. et al., 2008. Inhalation carcinogenicity study with nickel metal powder in Wistar rats. Toxicology and Applied Pharmacology, 233(2), pp.262-275.

108
Oller, A.R. et al., 2009. Comparison of nickel release in solutions used for the identification of water-soluble nickel exposures and in synthetic lung fluids. Journal of Environmental Monitoring, 11(4), pp.823-829.
Oller, A.R., M. Costa & G. Oberdörster, 1997. Carcinogenicity assessment of selected nickel compounds. Toxicology and Applied Pharmacology, 143(1), pp.152-166.
Ollson, C.A., W. Chi Wan, C.E. Willert, E. Veska, I. Koch & K. Reimer. 2003. Bioavailability of Nickel from Port Colborne Soils: A comparison of in vivo and in vitro Methodologies. 19th Annual International Conference on Soils, Sediments, Water and Energy. University of Massachusetts. Tuesday, Oct. 21, 2003. Available at: http://www.tandfonline.com/doi/abs/10.1080/10588330408984085#
OMEE (Ontario Ministry of Environment and Energy), 1994. Ontario Typical Range of Chemical Parameters in Soil, Vegetation, Moss Bags and Snow. April, 1994 (Version 1.0a) OMEE.
OMOE (Ontario Ministry of the Environment). 1992. Air Quality in Ontario: 1990. Queen’s Printer for Ontario. ISSN 0840-9366, PIBS 1804-01/02, A86-A88. In: Environment Canada and Health Canada) 1994. Priority Substances List Assessment Report: Nickel and its Compounds. Canadian Environmental Protection Act. Ministry of Supply and Services Canada Catalogue No. En 40-215/43E. 82 pp.
OMOE, 1999. Large volume sampling at six Lake Ontario tributaries during 1997 and 1998: Project synopsis and summary of selected results OMOE. Available at: http://agrienvarchive.ca/download/large_vol_samp_L.Ont_trib_1997-98.pdf.
OMOE, 2002. Soil investigation and human health risk assessment for the Rodney Street community, Port Colborne, ON OMOE.
OMOE, 2004. Information Draft on the Development of Ontario Air Standards for Nickel and its Compounds OMOE Standards Development Branch.
OMOE, 2011a. Ontario air standards for nickel and nickel compounds OMOE Standards Development Branch. Available at: http://www.downloads.ene.gov.on.ca/envision/env_reg/er/documents/2011/010-7188.pdf.
OMOE, 2011b. Soil, Ground Water and Sediment Standards for Use Under Part XV.1 of the Environmental Protection Act OMOE. Available at: http://www.ontario.ca/document/soil-ground-water-and-sediment-standards-use-under-part-xv1-environmental-protection-act
Onkelinx, C., J. Becker & F.W. Sunderman Jr, 1973. Compartmental analysis of the metabolism of 63Ni(II) in rats and rabbits. Res. Commun. Chem. Path. Pharmacol., 6(2), pp.663-676, as cited in OEHHA (2011, draft) and WHO (2005).
Oorts, K. et al., 2006. Soil properties affecting the toxicity of CuCl2 and NiCl2 for soil microbial processes in freshly spiked soils. Environmental Toxicology and Chemistry, 25(3), pp.836-844.
Oorts, K., U. Ghesquiere & E. Smolders, 2007. Leaching and aging decrease nickel toxicity to soil microbial processes in soils freshly spiked with nickel chloride. Environmental Toxicology and Chemistry, 26(6), pp.1130-1138.
Oosting, J.S. et al., 1991. Iron, copper, and zinc status in rats fed supplemental nickel. Biological Trace Element Research, 31(1), pp.63-70.
Oskarsson, A. & H. Tjalve, 1979a. An autoradiographic study on the distribution of 63NiCl2 in mice. Annals of Clinical and Laboratory Science, 9(1), pp.47-59.
Oskarsson, A. & H. Tjalve, 1979b. Binding of 63Ni by cellular constituents in some tissues of mice after the administration of 63NiCl2 and 63Ni(CO)4. Acta Pharmacologica et Toxicologica, 45(4), pp.306-314.
Ottolenghi, A.D., J.K. Haseman & W.W. Payne, 1975. Inhalation studies of nickel sulfide in pulmonary carcinogenesis of rats. Journal of the National Cancer Institute, 54(5), pp.1165-1172, in IARC (2011).
Outridge, P.M. & A.M. Scheuhammer, 1993. Bioaccumulation and toxicology of nickel: implications for wild mammals and birds. Environmental Reviews, 1, pp.172-197.

109
Painter, S. et al., 1994. Reconnaissance geochemistry and its environmental relevance. J. Geochem. Explor. 51(3), pp.213-246.
Pandey R., R. Kumar, S.P. Singh, D.K. Saxena & S.P. Srivastava 1999. Male reproductive effect of nickel sulphate in mice. BioMetals, 12(4), Dec. 1999, pp. 339-346(8)
Pandey, R. & S.P. Srivastava, 2000. Spermatotoxic effects of nickel in mice. Bulletin of Environmental Contamination and Toxicology, 64(2), pp.161-167.
Parida, B.K., I.M. Chhibba & V.K. Nayyar, 2003. Influence of nickel-contaminated soils on fenugreek (Trigonella corniculata L.) growth and mineral composition. Scientia Horticulturae, 98(2), pp.113-119.
Parker, G.H., 2001. Metal levels in body tissues, forage and fecal pellets of elk (Cervus elaphus) living near the ore smelters at Sudbury, ON. Environmental Pollution, 113(3), pp.347-355.
Parker, G.H., 2004. Tissue metal levels in Muskrat (Ondatra zibethica) collected near the Sudbury (Ontario) ore-smelters; prospects for biomonitoring marsh pollution. Environmental Pollution, 129(1), pp.23-30.
Parr, R.M. et al., 1991. Minor and trace elements in human milk from Guatemala, Hungary, Nigeria, Philippines, Sweden, and Zaire: Results from a WHO/IAEA joint project. Biological Trace Element Research, 29(1), pp.51-75.
Pastorek, L. 1995. pers. comm. Ontario Ministry of Environment and Energy. Laboratory Services Branch, Personal communication from Liz Pastorek on March 24, 1995.
Patel, M.M. et al., 2009. Ambient metals, elemental carbon, and wheeze and cough in New York city children through 24 months of age. American Journal of Respiratory and Critical Care Medicine, 180(11), pp.1107-1113.
Patriarca, M. & G.S. Fell, 1996. Monitoring of sources of clinical exposure to nickel. Mikrochimica Acta, 123(1-4), pp.261-269.
Patriarca, M., T.D.B. Lyon & G.S. Fell, 1997. Nickel metabolism in humans investigated with an oral stable isotope. American Journal of Clinical Nutrition, 66(3), pp.616-621.
Patterson, W.A.I.I.I. & Olson, J.J., 1982. Effects of heavy metals on radicle growth of selected woody species germinated on filter paper, mineral and organic soil substrates. Can. J. For. Res., 13, pp.233-238.
Peiser, M. et al., 2012. Allergic contact dermatitis: Epidemiology, molecular mechanisms, in vitro methods and regulatory aspects. Cellular and Molecular Life Sciences, 69(5), pp.763-781.
Pennington, J.A.T. & J.W. Jones, 1987. Molybdenum, nickel, cobalt, vanadium, and strontium in total diets. Journal of the American Dietetic Association, 87(12), pp.1644-1650, in IOM (2001).
Peredney, C.L. & P.L. Williams, 2000a. Comparison of toxicological effects of nitrate versus chloride metallic salts on Caenorhabditis elegans in soil. In F.T. Price & K.V. Brix, eds. Environmental Toxicology and Risk Assessment: Recent Achievements in Environmental Fate and Transport. West Conshohocken, PA: American Society for Testing and Materials.
Peredney, C.L. & P.L. Williams, 2000b. Utility of Caenorhabditis elegans for assessing heavy metal contamination in artificial soil. Archives of Environmental Contamination and Toxicology, 39, pp.113-118.
Peris, M., 2004. Unpublished data on elemental concentrations in coarse particulate matter (PM10) from the National Air Pollution Surveillance (NAPS) Program. Environment Canada, Gloucester, ON.
Petruzzelli, G., L. Lubrano & G. Guidi, 1989. Uptake by corn and chemical extractability of heavy metals from a four year compost treated soil. Plant and Soil, 116, pp.23-27.
Phillips, J.I. et al., 2010. Pulmonary and systemic toxicity following exposure to nickel nanoparticles. American Journal of Industrial Medicine, 53(8), pp.763-767.
Phipps, T. et al., 2002. Essentiality of nickel and homeostatic mechanisms for its regulation in terrestrial organisms. Environmental Reviews, 10(4), pp.209-261.
Picarelli, A. et al., 2011. Oral mucosa patch test: A new tool to recognize and study the adverse effects of dietary nickel exposure. Biological Trace Element Research, 139(2), pp.151-159.

110
Pietz, R.I. et al., 1984. Metal concentrations in earthworms from sewage sludge-amended soils at a strip mine reclamation site. Journal of Environment Quality, 13, pp.651-654.
Pilgrim, W. & B. Schroeder, 1997. Multi-media concentrations of heavy metals and major ions from urban and rural sites in New Brunswick, Canada. Environmental Monitoring and Assessment, 47(1), pp.89-108.
Pizzutelli, S., 2011. Systemic nickel hypersensitivity and diet: Myth or reality? European Annals of Allergy and Clinical Immunology, 43(1), pp.5-18.
Poggio, L. et al., 2009. Metals pollution and human bioaccessibility of topsoils in Grugliasco (Italy). Environmental Pollution, 157(2), pp.680-689.
Poirier, L.A. et al., 1984. Inhibition by magnesium and calcium acetates of lead subacetate- and nickel acetate-induced lung tumors in strain A mice. Cancer Research, 44(4), pp.1520-1522.
Ponizovsky, A.A. et al., 2008. Nickel partitioning in acid soils at low moisture content. Geoderma, 145(1-2), pp.69-76.
Pott, F. et al., 1987. Carcinogenicity studies on fibres, metal compounds, and some other dusts in rats. Experimental Pathology, 32(3), pp.129-152, in IARC (2011).
Pott, U. & D.H. Turpin, 1998. Assessment of atmospheric heavy metals by moss monitoring with Isothecium stoloniferum Brid. In the Fraser Valley, B.C., Canada. Water Air Soil Pollut., 101(1-4), pp.25-44.
Poulik, Z., 1997. The danger of accumulation of nickel in cereals on contaminated soil. Agri. Ecosystems Environ., 63(1), pp.25-29.
Pyle, G.G., J.W. Rajotte & P. Couture, 2005. Effects of industrial metals on wild fish populations along a metal contamination gradient. Ecotoxicology and Environmental Safety, 61(3), pp.287-312.
Qian, J. et al., 1996. Distribution and plant availability of heavy metals in different particle-size fractions of soil. Science of the Total Environment, 187, pp.131-141.
Rahil-Khazen, R. et al., 2002. Multi-element analysis of trace element levels in human autopsy tissues by using inductively coupled atomic emission spectrometry technique (ICP-AES). Journal of Trace Elements in Medicine and Biology, 16(1), pp.15-25.
Raithel, H.J. et al., 1982. Untersuchungen zur Ausscheidungskinetik von Nickel bei Beschaftigten in der Glas- und galvanischen Industrie. In T.M. Fliedner, ed. Verhandlungen der deutschen Gesellschaft fur Arbeitsmedizin. Stuttgart: Gentner Verlag, pp. 223-28, in Roels et al. (1993).
Raithel, H.J. et al., 1988. Investigations on the quantitative determination of nickel and chromium in human lung tissue. Industrial medical, toxicological, and occupational medical expertise aspects. International Archives of Occupational and Environmental Health, 60(1), pp.55-66.
Raithel, H.J. et al., 1993. Biomonitoring of nickel and chromium in human pulmonary tissue. International Archives of Occupational and Environmental Health, 65(1 Supp.), p.S197-S200.
Rasmussen, P.E., 2004. Can metal concentrations in indoor dust be predicted from soil geochemistry? Canadian Journal of Analytical Sciences and Spectroscopy, 49(3), pp.166-174.
Rasmussen, P.E. et al., 2006. Challenges in quantifying airborne metal concentrations in residential environments. Canadian Journal of Analytical Sciences and Spectroscopy, 51(1), pp.1-8.
Rasmussen, P.E. et al., 2007. Monitoring personal, indoor, and outdoor exposures to metals in airborne particulate matter: Risk of contamination during sampling, handling and analysis. Atmosp. Environ., 41, pp.5897-5907.
Rasmussen, P.E. et al., 2008. Influence of matrix composition on the bioaccessibility of copper, zinc, and nickel in urban residential dust and soil. Human and Ecological Risk Assessment, 14(2), pp.351-371.
Rasmussen, P.E., K.S. Subramanian & B.J. Jessiman, 2001. A multi-element profile of house dust in relation to exterior dust and soils in the city of Ottawa, Canada. Science of the Total Environment, 267(1-3), pp.125-140.
Rauser, W.E., 1978. Early effects of phytotoxic burdens of cadmium, cobalt, nickel and zinc in white beans. Can. J. Bot., 56, pp.1744-1749.

111
Rehab, F.I. & A. Wallace, 1978. Excess trace metal effects on cotton: Nickel and cadmium in Yolo loam soil. Comm. Soil Sci. Plant Analysis, 9, pp.779-784.
Rencz, A.N., 1980. Nickel in soils and vegetation of glaciated terrains. In J.O. Nriagu, ed. Nickel in the Environment. New York, NY: John Wiley and Sons, pp. 189-202.
Rencz, A.N., R.G. Garrett & S.W. Adcock, 2006. Geochemical Background in Soil and Till. Geological Survey of Canada Open File 5084. Available at: http://geoscan.nrcan.gc.ca/starweb/geoscan/servlet.starweb?path=geoscan/downloade.web&search1=R=222148.
Rendall, R.E.G., J.I. Phillips & K.A. Renton, 1994. Death following exposure to fine particulate nickel from a metal arc process. Annals of Occupational Hygiene, 38(6), pp.921-930.
Rezuke, W.N., J.A. Knight & F.W. Sunderman Jr, 1987. Reference values for nickel concentrations in human tissues and bile. American Journal of Industrial Medicine, 11(4), pp.419-426.
Richardson, G.M., 1997. Compendium of Canadian Human Exposure Factors for Risk Assessment. Richardson, G.M. et al., 2001. Critical review on natural global and regional emissions of six trace metals
to the atmosphere. Richter, O.R., 1980. Nickel speciation in a soil/water system. In J.O. Nriagu, ed. Nickel in the
Environment. New York, NY: Wiley and Sons, pp. 189-202. Rickert, W.S., 1991. An Evaluation of Changes in Pb, Cd, Hg and Ni Contents of Whole Tobacco,
Mainstream Condensate and Sidestream Condensate from Canadian Cigarettes During the Period 1968-1988 Labstat Incorporated.
Robert, C., 2007. Ministère de Développement Durable, de l’Environnement et des Parcs du Québec Email to J. Aldridge of Health Canada.
Roberts, B.A., 1980. Some chemical and physical properties of serpentine soils from western Newfoundland. Canadian Journal of Soil Science, 60(2), pp.231-240.
Roduner, J., E. Haudenschild-Falb & E. Kunz, 1987. Oral nickel challenge in non-pompholyx and pompholyx-type nickel eczema. Perorale Nickelprovokation bei Nichtdyshidrosiformem und Dyshidrosiformem Nickelekzem, 38(5), pp.262-266.
Roels, H. et al., 1993. Relationship between atmospheric and urinary nickel in workers manufacturing electrical resistances using nickel oxide: Role of the bioavailability of nickel. Occupational Medicine, 43(2), pp.95-104.
Rogers, J.E. & S.W. Li, 1985. Effect of metals and other inorganic ions on soil microbial activity: Soil dehydrogenase assay as a simple toxicity test. Bulletin of Environmental Contamination and Toxicology, 34, pp.858-865.
Rom, W.N. et al., 1984. Pneumoconiosis and exposures of dental laboratory technicians. American journal of public health, 74(11), pp.1252-7.
Rooney, C.P., F.J. Zhao & S.P. McGrath, 2007. Phytotoxicity of nickel in a range of European soils: Influence of soil properties, Ni solubility and speciation. Environmental Pollution, 145(2), pp.596-605.
Rose, G.A. & G.H. Parker. 1983. Metal contents of body tissues, diet items, and dung of ruffed grouse near Sudbury, Ontario, Canada. Can. J. Zool. 61: 505-511.
Roshon, R.D., 1988. Genecological studies on two populations of Betula pumila var. glandulifera, with special reference to their ecology and metal tolerance. Sudbury, ON: Laurentian University.
Rossman, R. & J. Barnes, 1988. Trace element concentrations in near-surface waters of the Great Lakes, and methods of collection, storage and analysis. Journal of Great Lakes Research, 14, pp.188-204.
Ryan, C.A. et al., 2002. Examination of a vehicle for use with water soluble materials in the murine local lymph node assay. Food and Chemical Toxicology, 40(11), pp.1719-1725.
Rystedt, I. & T. Fischer, 1983. Relationship between nickel and cobalt sensitization in hard metal workers. Contact Dermatitis, 9(3), pp.195-200.
Räsänen, L., U. Mattila & K. Kalimo, 1999. Patch testing with nickel sulfate versus nickel chloride. Contact Dermatitis, 40(5), pp.287-288.
112
Sadiq, M., 1985. Uptake of cadmium, lead, and nickel by corn grown in contaminated soils. Water Air Soil Pollut., 26, pp.185-190.
Saikat, S., B. Barnes & D. Westwood, 2007. A review of laboratory results for bioaccessibility values of arsenic, lead and nickel in contaminated UK soils. Journal of Environmental Science and Health - Part A Toxic/Hazardous Substances and Environmental Engineering, 42(9), pp.1213-1221.
Salnikow, K. et al., 1999. Nickel-induced transformation shifts the balance between HIF-1 and p53 transcription factors. Carcinogenesis, 20(9), pp.1819-1823.
Salnikow, K. & A. Zhitkovich, 2008. Genetic and epigenetic mechanisms in metal carcinogenesis and cocarcinogenesis: Nickel, arsenic, and chromium. Chemical Research in Toxicology, 21(1), pp.28-44.
Salt, D.E., R.C. Prince & I.J. Pickering, 2002. Chemical speciation of accumulated metals in plants: evidence from X-ray absorption spectroscopy. Microchemical Journal, 71(2-3), pp.255-259. Available at: http://www.sciencedirect.com/science/article/pii/S0026265X02000176.
Sanei, H., F. Goodarzi & S. Hilts, 2007. Site-specific natural background concentrations of metals in topsoil from the Trail region, BC, Canada. Geochemistry: Exploration, Environment, Analysis, 7(1), pp.41-48.
SARA, 2001. Sudbury Area Risk Assessment Volume I: Background, Study Organization and 2001 Soils Survey Chapter 7. The 2001 Soil Survey. Available at: http://www.sudburysoilsstudy.com.
SARA, 2008. Sudbury Area Risk Assessment Volume II: Human Health Risk Assessment- Final Report. Available at: http://www.sudburysoilsstudy.com.
Saviozzi, A., R. Levi-Minzi & R. Cardelli, 1997. The influence of heavy metals on carbon dioxide evolution from a typic xerochrept soil. Water, Air, and Soil Pollution, 93, pp.409-417.
Scanlon, P.F., 1987. Heavy metals in small mammals in roadside environments: implications for food chains. Science of the Total Environment, 59, pp.317-323.
Schmidt, J.A. & A.W. Andren, 1980. The atmospheric chemistry of nickel. In J.O. Nriagu, ed. Nickel in the Environment. New York, NY: John Wiley and Sons, pp. 93-135.
Schnabel, E. et al., 2010. Sensitization to contact allergens and bronchial hyper-responsiveness. Contact Dermatitis, 63(3), pp.157-163.
Schroeder, H.A. & M. Mitchener, 1975. Toxic effects of mercury, methyl mercury and nine other trace metals on mice. Journal of Nutrition, 105, pp.452-458.
Schroeder, H.A., M. Mitchener & A.P. Nason, 1974. Life-term effects of nickel in rats: survival, tumors, interactions with trace elements and tissue levels. Journal of Nutrition, 104(2), pp.239-243. Available at: http://jn.nutrition.org/content/104/2/239.long
Scott, D.E., W.A. Dick & M.A. Tabatabai, 1985. Inhibition of pyrophosphatase activity in soils by trace elements. Soil Sci. , 139, pp.112-117.
Scott-Fordsmand, J.J., P.H. Krogh & S.P. Hopkin, 1999. Toxicity of nickel to a soil-dwelling springtail, Folsomia fimetaria (Collembola: Isotomidae). Ecotoxicology and Environmental Safety, 43(1), pp.57-61.
Scott-Fordsmand, J.J., J.M. Weeks & S.P. Hopkin, 1998. Toxicity of nickel to the earthworm and the applicability of the neutral red retention assay. Ecotoxicology, 7(5), pp.291-295.
Seemann, J. et al., 1985. Analytical measurements of Cd, Pb, Zn, Cr and Ni in human tissues. Lab Med , 9, pp.294-299, in Rezuke et al. (1987).
Semkin, R.G., 1975. A Limnogeochemical Study of Sudbury Area Lakes. Hamilton, ON: McMaster University.
SENES, 2002. Port Radium Site Assessment - Summary Report on Site Conditions and Decommissioning Considerations. Draft Report. .
Serita, F., H. Kyono & Y. Seki, 1999. Pulmonary clearance and lesions in rats after a single inhalation of ultrafine metallic nickel at dose levels comparable to the threshold limit value. Industrial Health, 37(4), pp.353-363. Available at: http://www.ncbi.nlm.nih.gov/pubmed/10547950.

113
Sertoli, A., P. Lombardi & S. Francalanci, 1985. Effects of hapten oral administration in subjects with allergic contact dermatitis. II. Personal contribution. Effetto della Somministrazione Orale di Apteni in Soggetti Sensibilizzati Affetti da Eczema Allergico da Contatto. II. Contributo personale, 120(3), pp.213-218.
Severa, J. et al., 1995. Distribution of nickel in body fluids and organs of rats chronically exposed to nickel sulphate. Human and Experimental Toxicology, 14(12), pp.955-958.
Shah, M., F.M. Lewis & D.J. Gawkrodger, 1998. Nickel as an occupational allergen: A survey of 368 nickel-sensitive subjects. Archives of Dermatology, 134(10), pp.1231-1236.
Sharpe, D.R. & P.E. Rasmussen, 1996. Soil Geochemical Survey of Southern Ontario Geological Survey of Canada Terrain Sciences Division.
Sheppard, M.I., S.C. Sheppard & C.A. Grant, 2007. Solid/liquid partition coefficients to model trace element critical loads for agricultural soils in Canada. Canadian Journal of Soil Science, 87(2 Spec. iss.), pp.189-201.
Shier, W.T., 1994. Metals as toxins in plants. J. Toxicol.-Toxin Reviews, 13, pp.205-216. Shirakawa, T. et al., 1990. Hard metal asthma: Cross immunological and respiratory reactivity between
cobalt and nickel? Thorax, 45(4), pp.267-271. Shirali, P. et al., 1991. Ni3S2 uptake by lung cells and its interaction with plasma membranes. Journal of
Applied Toxicology, 11(4), pp.279-288. Shuhaimi-Othman, M., D. Pascoe & U. Borgmann, 2006. Reduced metals concentrations of water,
sediment and Hyalella azteca from lakes in the vicinity of the Sudbury metal smelters, Ontario, Canada. Environ. Monitor. Assess., 117(1-3), pp.27-44.
Silvestri, D.L. & S. Barmettler, 2011. Pruritus ani as a manifestation of systemic contact dermatitis: Resolution with dietary nickel restriction. Dermatitis, 22(1), pp.50-55.
Singh, B.R., & A.S. Jeng. 1993. Uptake of zinc, cadmium, mercury, lead, chromium and nickel by ryegrass grown in a sandy soil. Norw. J .Agric. Sci., 7(2), pp.147-157.
Sinigaglia, F., 1994. The molecular basis of metal recognition by T cells. Journal of Investigative Dermatology, 102(4), pp.398-401.
Sivulka, D.J., 2005. Assessment of respiratory carcinogenicity associated with exposure to metallic nickel: A review. Regulatory Toxicology and Pharmacology, 43(2), pp.117-133.
SK Environment and Resource Management, 1997. Simple sample report SK. Environmental Resource Management.
Skraba, D., 1989. Effects of Surface Liming of Soils on Streamflow Chemistry in a Denuded, Acid, Metal-contaminated Watershed Near Sudbury, Ontario. Sudbury, ON: Laurentian University.
SLI, 2000a. A one-generation reproduction range-finding study in rats with nickel suofate hexahydrate. Final report. Springborn Laboratory, Inc. Study No. 3472.3. Prepared for Nickel Producers Encironmenatl Research Association, (NiPERA) Inc.), Durham, NC.
SLI, 2000b. An oral (gavage) two-generation reproduction toxicity study in Sprague-Dawley rats with nickel sulphate hexahydrate. Prepared by Springborn Laboratories Inc., Spencerville, OH for Nickel Producers Environmental Research Association, Durham, NC.
Smith, J.C. & B. Hackley, 1968. Distribution and excretion of nickel-63 administered intravenously to rats. Journal of Nutrition, 95(4), pp.541-546.
Smith, M.K. et al., 1993. Perinatal toxicity associated with nickel chloride exposure. Environmental Research, 61(2), pp.200-211.
Snodgrass, W.J., 1980. Distribution and behaviour of nickel in the aquatic environment. In J.O. Nriagu, ed. Nickel in the environment. New York, NY: Wiley and Sons, pp. 203-274.
Solomons, N.W. et al., 1982. Bioavailability of nickel in man: Effects of foods and chemically-defined dietary constituents on the absorption of inorganic nickel. Journal of Nutrition, 112(1), pp.39-50.
Sommer, H.C., U. Hass & P. Thyregod, 2002. Generalized linear model with overdispersion - a case study of the toxicological effect of nickel sulphate hexahydrate on mortality rate of rat

114
reproducibility. In 17th International Workshop on Statistical Modelling. Chania, Crete, pp. 603-607.
Soon, Y.K. & S. Abboud, 1990. Trace elements in agricultural soils of northwest Alberta. Can. J. Soil. Sci. 70, pp.277-288.
Spears, J.W., 1984. Nickel as a “newer trace element” in the nutrition of domestic animals. Journal of Animal Science, 59(3), pp.823-835.
Spears, J.W., R.W. Harvey & L.J. Samsell, 1986. Effects of dietary nickel and protein on growth, nitrogen metabolism and tissue concentrations of nickel, iron, zinc, manganese and copper in calves. Journal of Nutrition, 116(10), pp.1873-1882.
Spears, J.W. & E.E. Hatfield, 1985. Interaction between nickel and copper in the rat. Biological Trace Element Research, 7(3), pp.181-193.
Spiegelberg, T., W. Koerdel & D. Hochrainer, 1984. Effect of NiO inhalation on alveolar macrophages and the humoral immune system of rats. Ecotoxicol. Environ. Safety, 8, pp.516-525.
Spinelli, V. et al., 2005. Asthma induced by nickel. L’asthme au nickel, 45(2), pp.103-107. Stangl, G.I. & M. Kirchgessner, 1996. Nickel deficiency alters liver lipid metabolism in rats. Journal of
Nutrition, 126(10), pp.2466-2473. Available at: http://www.ncbi.nlm.nih.gov/pubmed/8857506. Statistics Canada, 2005. Population urban and rural by province and territory Statistics Canada, Censuses
of Population, 1851-2001. Available at: http://www.statcan.gc.ca/tables-tableaux/sum-som/l01/cst01/demo62a-eng.htm.
Stedman, D.H. & D.A. Hikade, 1980. Nickel toxicology. In S.S. Brown, ed. Proc. of the 2nd International Conference on Nickel Toxicology, Swansea, Wales, Sept. 1980. London, UK: Academic Press, pp. 183-186.
Steinman, R.M. et al., 1983. Endocytosis and the recycling of plasma membrane. Journal of Cell Biology, 96(1), pp.1-27.
Stelting, H.J. & T. Platzek, 2005. Allergy to printer’s ink. The underestimated danger. Tonerallergie. Die unterschätzte gefahr, 45(2), pp.457-461.
Stofan, J.R. et al., 2007. Daily fluid turnover during preseason training in U.S. college football. International Journal of Sport Nutrition and Exercise Metabolism, 17(4), pp.340-351.
Stoner, G.D., M.B. Shimkin & M.C. Troxell, 1976. Test for carcinogenicity of metallic compounds by the pulmonary tumor response in strain A mice. Cancer Research, 36(5), pp.1744-1747.
Stranger, M., S.S. Potgieter-Vermaak & R. Van Grieken, 2009. Particulate matter and gaseous pollutants in residences in Antwerp, Belgium. Science of the Total Environment, 407(3), pp.1182-1192.
Sunderman, F.W. et al., 1957. Nickel poisoning. IV. Chronic exposure of rats to nickel carbonyl; a report after one year of observation. A. M. A. archives of industrial health, 16(6), pp.480-485.
Sunderman, F.W. et al., 1959. Nickel poisoning. IX. Carcinogenesis in rats exposed to nickel carbonyl. A. M. A. archives of industrial health, 20(1), pp.36-41.
Sunderman F.W., Jr. et al., 1986. Biological monitoring of nickel. Toxicol. Industr. Health, 2(1), pp.17-78.
Sunderman, F.W., S. Nomoto & M. Nechay, 1971. Nickel metabolism in myocardial infarction: Measurements of nickel in human tissues. In D.D. Hemphill, ed. Trace Substances in Environmental Health . Columbia: University of Missouri Press, pp. 352-356, in Rezuke et al. (1982).
Sunderman F.W., Jr. & E. Horak, 1981. Biochemical indices of nephrotoxicity, exemplified by studies of nickel nephropathy. In S.S. Brown & D.S. Davies, eds. Organ-Directed Toxicity. Oxford, UK: Pergamon Press , pp. 55-67.
Sunderman, F.W. et al., 1988. Acute nickel toxicity in electroplating workers who accidently ingested a solution of nickel sulfate and nickel chloride. American Journal of Industrial Medicine, 14(3), pp.257-266.
Sunderman, F.W. Jr., 1984. Carcinogenicity of nickel compounds in animals. In F.W. Sunderman Jr., A. Aitio, & A. Berlin, eds. Nickel in the Human Environment. Lyon, Fr.: Oxford University Press for the International Agency for Research on Cancer (IARC), pp. 127-142.

115
Sunderman F.W. Jr, et al., 1989. Nickel absorption and kinetics in human volunteers. Proceedings of the Society for Experimental Biology and Medicine, 191(1), pp.5-11.
Sunderman F.W. Jr., & A. Oskarsson, 1988. Nickel. In E. Merian, ed. Metals and Their Compounds in the Environment. Weinhem, FRG: VCH Verlagsgescellschaft, pp. 1-9, in Environment Canada and Health Canada.
Sunderman F.W. Jr, & C.E. Selin, 1968. The metabolism of nickel-63 carbonyl. Toxicology and Applied Pharmacology, 12(2), pp.207-218.
Sunderman F.W. Jr., M.I. Decsy & M.D. McNeely, 1972. Nickel metabolism in health and disease. Annals of the New York Academy of Sciences, 199, pp.300-312.
Swain, L.G. & D.G. Walton, 1994. 1993 Survey of sediments and tissues from Boundary Bay and Roberts Bank. Fraser River Estuary Monitoring Ministry of Environment Lands and Parks, Water Quality Branch.
Szakmáry, E. et al., 1995. Haemodynamic effect of nickel chloride in pregnant rats. Acta Physiologica Hungarica, 83(1), pp.3-12.
Tabatabai, M.A., 1977. Effects of trace elements on urease activity in soils. Soil Biology and Biochemistry, 9, pp.9-13.
Tallkvist, J. et al., 1998. Transport and subcellular distribution of nickel in the olfactory system of pikes and rats. Toxicological Sciences, 43(2), pp.196-203.
Tallkvist, J. & H. Tjälve, 1997. Effect of dietary iron-deficiency on the disposition of nickel in rats. Toxicology Letters, 92(2), pp.131-138.
Tallkvist, J. & H. Tjälve, 1998. Transport of nickel across monolayers of human intestinal Caco-2 cells. Toxicology and Applied Pharmacology, 151(1), pp.117-122.
Tanaka, I. et al., 1986. Retention of nickel oxide (green) aerosol in rat lungs by long-term inhalation. Biological Trace Element Research, 9(3), pp.187-195.
Tanaka, I. et al., 1988. Biological half-time in rats exposed to nickel monosulfide (amorphous) aerosol by inhalation. Biological Trace Element Research, 17, pp.237-246.
Tanaka, I., S. Ishimatsu & K. Matsuno, 1985. Biological half time of deposited nickel oxide aerosol in rat lung by inhalation. Biological Trace Element Research, 8(3), pp.203-210.
Tarnawska, M.P. W. Migula, J. Przybylowicz, M.A. Mesjasz-Przybylowicz, 2007. Nickel toxicity in the hepatopancreas of an isopod Porcellio scaber (Oniscidea). Nuclear Insturments and Methods in Physics Research Section B: Beam Interactions with Materials and Atoms, 260(1), pp.213-217. Available at: http://dx.doi.org/10.1016/j.nimb.2007.02.082.
TCEQ. 2011. Nickel and Inorganic Nickel Compounds. Development Support Document. Final. Texas Commission on Environmental quality. June 1, 2011. Available at: http://www.tceq.state.tx.us/assets/public/implementation/tox/dsd/final/june11/nickel_&_compounds.pdf.
Tedeschi, R.E. & F.W. Sunderman, 1957. Nickel poisoning. V. The metabolism of nickel under normal conditions and after exposure to nickel carbonyl. A. M. A. Archives of Industrial Health, 16(6), pp.486-488.
Temple, P.J. & S. Bisessar, 1981. Uptake and toxicity of nickel and other metals in crops grown on soil contaminated by a nickel refinery. J. Plant. Nutr., 3, pp.473-482.
Templeton, D.M., F.W. Sunderman Jr. & R.F.M., Herber, 1994. Tentative reference values for nickel concentrations in human serum, plasma, blood, and urine: Evaluation according to the TRACY protocol. Science of the Total Environment, 148(2-3), pp.243-251.
Tennstedt, D., 2011. A nickel-free regimen has its place in the treatment of eczemas and dyshidrosis: Contra. Le régime sans nickel a sa place dans les eczémas et la dysidrose: contre, 51(3), pp.347-349.
TERA, 1999. International Toxicity Estimates for Risk (ITER) Database. Available at: http://www.tera.org/iter/

116
Thayer, J.S., 2002. Biological methylation of less-studied elements. Applied Organometallic Chemistry, 16(12), pp.677-691.
Thyssen, J.P., 2010. Children toys as a cause of nickel allergy should be explored. Dermatitis, 21(3), p.182.
Thyssen, J.P. et al., 2007. The epidemiology of contact allergy in the general population - Prevalence and main findings. Contact Dermatitis, 57(5), pp.287-299.
Thyssen, J.P. et al., 2009. Contact dermatitis caused by nickel release from hair clasps purchased in a country covered by the EU Nickel Directive. Contact Dermatitis, 60(3), pp.180-181.
Thyssen, J.P. et al., 2011. Assessment of nickel and cobalt release from 200 unused hand-held work tools for sale in Denmark - Sources of occupational metal contact dermatitis? Science of the Total Environment, 409(22), pp.4663-4666.
Thyssen, J.P., T. Menné & J.D. Johansen, 2010. Identification of metallic items that caused nickel dermatitis in Danish patients. Contact Dermatitis, 63(3), pp.151-156.
Toman R, P. Massányi, M. Adamkovicova, N. Lukac, M. Cabaj & M. Martiniakova, 2012. Quantitative histological analysis of the mouse testis after the long-term administration of nickel in feed. J Environ Sci Health A Tox Hazard Subst Environ Eng. 47(9):1272-9.
Torjussen, W. & I. Andersen, 1979. Nickel concentrations in nasal mucosa, plasma, and urine in active and retired nickel workers. Annals of Clinical Laboratory Science, 9(4), pp.289-298. Available at: http://www.ncbi.nlm.nih.gov/pubmed/485092.
Torres, K.C. & M.L. Johnson, 2001a. Bioaccumulation of metals in plants, arthropods, and mice at a seasonal wetland. Environmental Toxicology and Chemistry, 20(11), pp.2617-2626.
Torres, K.C. & M.L. Johnson, 2001b. Testing of metal bioaccumulation models with measured body burdens in mice. Environmental Toxicology and Chemistry, 20(11), pp.2627-2638.
Tossavainen, A. et al., 1980. Application of mathematical modelling for assessing the biological half-times of chromium and nickel in field studies. British Journal of Industrial Medicine, 37(3), pp.285-291.
Traynor, M.F. & B.D. Knezek, 1973. Effects of nickel and cadmium contaminated soils on nutrient composition of corn plants. Trace Subst. Environ. Health, 7, pp.83-87.
Trivedi, T., 2004. pers. comm. Unpublished monitoring data on metal concentrations in walleye from inland waters collected for the National Contaminants Information System (NCIS). Fisheries and Oceans Canada, Burlington, ON.
Turi, M.C. et al., 2008. Systemic Nickel Allergy Syndrome: An update. Italian Journal of Allergy and Clinical Immunology, 18(3), pp.98-102.
Turkall, R.M., G.A. Skowronski & M.S. Abdel-Rahman, 2008. Effects of soil and aging on the dermal bioavailability of hydrocarbons and metals in soil. International Journal of Soil, Sediment and Water: 1(1), pp.1-13. Available at: http://scholarworks.umass.edu/intljssw/vol1/iss1/3.
Turkall, R.M., M.S.Abdel-Rahman & G.A. Skowronski, 2010. Effects of Soil Matrix and Aging on The Dermal Bioavailability of Hydrocarbons and Metals in the Soil: Dermal Bioavailability of Soil Contaminants. Proceedings of the Annual International Conference on Soils, Sediments, Water and Energy. V13, Article 29. Available at: http://scholarworks.umass.edu/cgi/viewcontent.cgi?article=1026&context=soilsproceedings.
Turkoglu, O. et al., 2004. Monitoring copper, nickel, cobalt, lead, cadmium, manganese and chromium levels in house dust samples from Kayseri, Turkey. Trace Elements and Electrolytes, 21(1), pp.4-9, as cited in Health Canada (2011).
Turner, A. & K.H. Ip, 2007. Bioaccessibility of metals in dust from the indoor environment: Application of a physiologically based extraction test. Environmental Science and Technology, 41(22), pp.7851-7856.
Turner, A. & L. Simmonds, 2006. Elemental concentrations and metal bioaccessibility in UK household dust. Science of the Total Environment, 371(1-3), pp.74-81.

117
Tyler, G., 1981. Heavy metals in soil biology and biochemistry. In E.A. Paul & J.N. Ladd, eds. Soil Biochemistry. New York: Dekker Inc., pp. 371-404.
USEPA, 1994. Methods for the derivation of inhalation reference concentrations and application of inhalation dosimetry USEPA. Available at: http://www.epa.gov/raf/publications/pdfs/RFCMETHODOLOGY.PDF.
USEPA, 1996. Integrated Risk Information System (IRIS) Database USEPA. Available at: http://www.epa.gov/ncea/iris/subst/0271.htm.
USEPA, 2003. SW-846 On-Line: Test Methods for Evaluating Solid Wastes; Physical/Chemical Methods, USEPA. Available at: http://www.epa.gov/epawaste/hazard/testmethods/sw846/index.htm.
USEPA, 2009. Human exposure database system (HEDS): HEDS studies USEPA. Available at: http://www.epa.gov/heds/.
USGS, 2011. Mineral Commodity Summaries. January 2011. Available at: http://minerals.usgs.gov/minerals/pubs/commodity/nickel/.
Uthus, E.O., 1997. Dietary nickel and folic acid interact to affect folate and methionine metabolism in the rat. Biological Trace Element Research, 58(1-2), pp.25-33.
Uthus, E.O., 1999. Compartmental model of nickel metabolism in rats based on orally administered 63Ni. Proc ND Acad Sci, 53, pp.92-96.
Uthus, E.O. & C.D. Seaborn, 1996. Deliberations and evaluations of the approaches, endpoints and paradigms for dietary recommendations of the other trace elements. Journal of Nutrition, 126(9 Supp.), p.2452S-2459S.
Valentine, R. & G.L. Fisher, 1984. Pulmonary clearance of intratracheally administered 63Ni3S2 in strain A/J mice. Environmental Research, 34(2), pp.328-334.
Van Nostrand, J.D. et al., 2005. Effect of pH on the toxicity of nickel and other divalent metals to Burkholderia cepacia PR1(301). Environmental Toxicology and Chemistry, 24(11), pp.2742-2750.
Van Winkle, M.R. & P.A. Scheff, 2001. Volatile organic compounds, polycyclic aromatic hydrocarbons and elements in the air of ten urban homes. Indoor Air, 11(1), pp.49-64.
Vasiluk, L., M.D. Dutton & B. Hale, 2011. In vitro estimates of bioaccessible nickel in field-contaminated soils, and comparison with in vivo measurement of bioavailability and identification of mineralogy. Science of the Total Environment, 409(14), pp.2700-2706.
Veien, N.K., 2011. Systemic contact dermatitis. International Journal of Dermatology, 50(12), pp.1445-1456.
Veien, N.K., T.O. Hattel Justesen & A. Norholm, 1983. Oral challenge with metal salts. (II). Various types of eczema. Contact Dermatitis, 9(5), pp.407-410.
Veien, N.K., T. Hattel & G. Laurberg, 1993. Low nickel diet: An open, prospective trial. Journal of the American Academy of Dermatology, 29(6), pp.1002-1007.
Veien, N.K. & K. Kaaber, 1979. Nickel, cobalt and chromium sensitivity in patients with pompholyx (dyshidrotic eczema). Contact Dermatitis, 5(6), pp.371-374.
Vergnano, O. & J.G. Hunter, 1952. Nickel and cobalt toxicities in oat plants. Annals of Botany, 17, pp.317-328.
Verkleij, J.A.C., 1990. Mechanisms of metal tolerance in higher plants. In A.J. Shaw, ed. Heavy Metal Tolerance in Plants: Evolutionary Aspects. Boca Raton, FL: CRC Press, pp. 179-193.
Vermeire, T.G. et al., 1991. Voorstel voor de human-toxicologische onderbouwing van C-toetsingswaarden. National Institute of Public Health and the Environment, RIVM-report no. 725201005, February 1991; Bilthoven, The Netherlands. In: Baars, A.J., R.M.C. Theelan, P.J.C.M. Hanssen, J.
Vesper, S.J. & T.C. Weidensaul, 1978. Effects of cadmium, nickel, copper, and zinc on nitrogen fixation by soybeans. Water Air Soil Pollut., 9, pp.413-422.

118
Vyskočil, A., C. Viau & M. Čížková, 1994. Chronic Nephrotoxicity of Soluble Nickel in Rats. Human & Experimental Toxicology, 13(10), pp.689-693. Available at: http://het.sagepub.com/cgi/content/abstract/13/10/689.
Waalkes, M.P. et al., 2004. Minimal influence of metallothionein over-expression on nickel carcinogenesis in mice. Toxicology Letters, 153(3), pp.357-364.
Wahlberg, J.E. & E. Skog, 1971. Nickel allergy and atopy. Threshold of nickel sensitivity and immunoglobulin E determinations. British Journal of Dermatology, 85(2), pp.97-104.
Wall, G.J. & M. Marsh., 1988. Within-pedon variability of trace metals in southern Ontario. Canadian Journal of Soil Science, 68, pp.53-61.
Wall, L.M., 1980. Nickel penetration through rubber gloves. Contact Dermatitis, 6(7), pp.461-463. Wallace, A. et al., 1977. Nickel phytotoxicity in relationship to soil pH manipulation and chelating
agents. Comm. Soil Sci. Plant Anal., 8, pp.757-764. Wang, C. undated pers. comm., Agriculture Canada. Warren, H.V. & R.E. Delavaut, 1954. Variations in the nickel content of some Canadian trees.
Transactions of the Royal Society of Canada, XLVIII, pp.71-74. Wase, A.W., D.M. Goss & M.J. Boyd, 1954. The metabolism of nickel. I. Spatial and temporal
distribution of Ni63 in the mouse. Archives of Biochemistry and Biophysics, 51(1), pp.1-4. Wataha, J.C., C.T. Hanks & R.G. Craig, 1992. Uptake of metal cations by fibroblasts in vitro. Journal of
Biomedical Materials Research, 27(2), pp.227-232. Webb, M., 1970. Interrelationships between the utilization of magnesium and the uptake of other bivalent
cations by bacteria. BBA - General Subjects, 222(2), pp.428-439. Webb, M. & S.M. Weinzierl, 1972. Uptake of 63Ni2+ from its complexes with proteins and other ligands
by mouse dermal fibroblasts in vitro. British Journal of Cancer, 26(4), pp.292-298. Webber, M.D., H.D. Monteith & D.G.M. Corneau, 1983. Assesment of heavy metals and PCBs at sludge
application sites. Journal of the Water Pollution Control Federation, 55(2), pp.187-195. Weber, C.W., 1969. Nickel toxicity in young growing mice. J. Animal Sci., 28, pp.620-623. Weber, C.W. & B.L. Reid, 1968. Nickel toxicity in growing chicks. Journal of Nutrition, 95, pp.612-616. Wehner, A.P. & D.K. Craig, 1972. Toxicology of inhaled NiO and CoO in Syrian golden hamsters.
American Industrial Hygiene Association Journal, 33(3), pp.146-155. Available at: http://www.tandfonline.com/doi/abs/10.1080/0002889728506624#
Weinheimer, E.M. et al., 2008. The Effect of Exercise on Water Balance in Premenopausal Physically Active Women. Journal of the American Dietetic Association, 108(10), pp.1662-1667.
Weinzierl, S.M. & M. Webb, 1972. Interaction of carcinogenic metals with tissue and body fluids. British Journal of Cancer, 26(4), pp.279-291.
Weischer, C.H., W. Kordel & D. Hochrainer, 1980. Effects of NiCl2 and NiO in Wistar rats after oral uptake and inhalation exposure, respectively. Zent Bakteriol Mikrobiol Hyg (B), 171, pp.336-351.
Wells, G.C., 1956. Effects of nickel on the skin. British Journal of Dermatology, 68(7), pp.237-42, in Samitz and Katz (1976).
Welp, G., 1999. Inhibitory effects of the total and water-soluble concentrations of nine different metals on the dehydrogenase activity of a loess soil. Biology and Fertility of Soils, 30, pp.132-139.
Weng, L. et al., 2003. Phytotoxicity and bioavailability of nickel: chemical speciation and bioaccumulation. Environmental Toxicology and Chemistry, 22 (9), pp.2180-2187.
Weng, L.P. et al., 2004. Understanding the effects of soil characteristics on phytotoxicity and bioavailability of nickel using speciation models. Environmental Science & Technology, 38(1), pp.156-162.
Whanger, P.D., 1973. Effects of dietary nickel on enzyme activities and mineral contents in rats. Toxicology and Applied Pharmacology, 25(3), pp.323-331. Available at: http://www.sciencedirect.com/science/article/pii/0041008X73903062.
Whitby, L.M. & T.C. Hutchinson, 1974. Heavy-metal pollution in the Sudbury mining and smelting region of Canada, II. Soil Toxicity tests. Environmental Conservation, 1, pp.191-200.

119
WHO, 1991. Environmental Health Criteria Series #108: Nickel WHO International Program on Chemical Safety, ed. Available at: http://www.inchem.org/documents/ehc/ehc/ehc108.htm.
WHO. 2000. Air Quality Guidelines Second Edition. Copenhagen, Denmark, World Health Organization, Geneva, Switzerland.
WHO, 2005. Nickel in Drinking Water: Background document for development of WHO Guidelines for Drinking-Water Quality WHO. Available at: http://www.who.int/water_sanitation_health/gdwqrevision/nickel2005.pdf.
Willaert, G., M.Verloo, 1988. Biological effects of nickel species and their determination in plant and soil. Plant and Soil, 107, pp.285-292.
Wilson, R., H. Jones-Otazo, S. Petrovic, I. Mitchell, Y. Bonvalot, D. Williams, G.M.Richardson, 2012. Revisiting Dust and Soil Ingestion Rates Based on Hand-to-Mouth Transfer. HERA.
Wilson, R., 2009. pers. comm. Wilson, S., J. Murray & H. Huntington, 1998. AMAP Assessment Report: Arctic Pollution Issues. Arctic
Monitoring and Assessment Programme. Winterhalder, P., 1992. Department of Biology, Laurentian University, Sudbury, ON. Winterhalder, P., 1994. pers. comm. Department of Biology, Laurentian University, Sudbury, ON . Wolfaardt, J.F. & E. Peters, 1992. The base metal alloy question in removable partial dentures-a review of
the literature and a survey of alloys in use in Alberta. Journal (Canadian Dental Association), 58(2), pp.146-151.
Yang, X.E. et al., 1997. Accumulation and transport of nickel in relation to organic acids in ryegrass and maize grown with different nickel levels. Plant and Soil, 196(2), pp.271-276.
Yee, E., 2004. Data on background concentrations of metals within various media in northern Manitoba as reported in the Lynn Lake Risk Assessment completed by Dillon Consulting. MB Conservation, Winnipeg, MB .
Ysart, G. et al., 2000. 1997 UK total diet study - Dietary exposures to aluminium, arsenic, cadmium, chromium, copper, lead, mercury, nickel, selenium, tin and zinc. Food Additives and Contaminants, 17(9), pp.775-786.
YTDOE, 2002. Environment Act. Contaminated Sites Regulation. Schedule 1. Generic Numerical Soil Standards YTDOE Environment Act Regulations and Forms. Available at: http://www.environmentyukon.gov.yk.ca/pdf/csregs.pdf.
Zachariae, C. et al., 2003. Effect of a moisturizer on skin susceptibility to NiCl2. Acta Dermato-Venereologica, 83(2), pp.93-97.
Zhang, Y. et al., 2009. Comparative genomic analyses of nickel, cobalt and vitamin B12 utilization. BMC Genomics, 10(78).
Zhao, J. et al., 2009. Occupational toxicology of nickel and nickel compounds. Journal of Environmental Pathology, Toxicology and Oncology, 28(3), pp.177-208.
Zober, A., K. Kick & K.H. Schaller, 1984. “Normal values” of chromium and nickel in human lung-, kidney-, blood- and urine samples. Untersuchungen zum Nickel- und Chrom-Gehalt Ausgewahlter Menschlicher Organe und Korperflussigkeiten, 179(1), pp.80-95, in Rezuke et al. (1987).
Zober, A., D. Weltle & K.H. Schaller, 1984. Study of the kinetics of chromium and nickel in biological material during a week of arc welding work using chromium-nickel-containing filler metals. Schweissen und Schneiden/Welding and Cutting, 36(10), p.E162-E164, in Roels et al. (1993).
Zornoza, P., S. Robles & N. Martin, 1999. Alleviation of nickel toxicity by ammonium supply to sunflower plants. Plant and Soil, 208(2), pp.221-226.

120
Appendix 1. Summary tables of nickel concentrations in environmental media Outdoor Air
Location Year Concentration
ng/m3 Range ng/m3 Comments Reference
Canada 1987-1990 - 2 - 20 (Dann 1991) Canada 1986 – 1996 1.6 - Only PM2.5 sampled (Burnett et al. 2000)
Canada 2002 3.4 0.63 - 453.8 Extremely low and high values from Iqualuit and Québec City (Peris 2004)
Kejimkujik 2000 1.5 - Annual average; lowest of 14 stations Québec City 2001 49.9 - Annual average; highest of 16 stations Québec City 2002 21.9 Annual average; highest of 13 stations Winnipeg 2001 1.2 - Annual average; lowest of 16 stations Calgary 2002 1.1 - Annual average; lowest of 13 stations Port Moody 2000 9.3 - Annual average; highest of 14 stations
Canada - Urban and rural areas 2003-2009 0.94 + 2.4 NAPS PM2.5 – acid digest, ICP-MS (means reported); n=3054 (EC 2011)
Canada Rural areas: Jan 2007 - April
2009 0.5 0.3 - 0.7 NAPS database, PM2.5 - acid digest; ICP/MS (means reported) (Dann 2010)
Canterbury Jan 2007-Mar 2008 0.3 0.0 - 2.4 mean concentration; n=90 (undeveloped land) (Dann 2010)
Wallaceburg Jan 2007 - Apri
2009 0.7 0.0 - 5.6 mean concentration; n=192 (agricultural land) (Dann 2010)
Simcoe Jan 2007- April
2009 0.4 0.0 - 7.5 mean concentration; n=200 (agricultural land) (Dann 2010)
Canada Urban areas: Jan 2007 - May
2009 0.8 0.1 - 1.4 NAPS database, PM2.5 – acid digest, ICP-MS (means reported) (Dann 2010)
Montréal Jan 2007 - Mar
2008 1.4 0.0 - 6.6 mean concentration; n=122 (commerical land) (Dann 2010 )
Windsor Jan 2007 - May
2009 0.9 0.0 - 4.7 mean concentration; n=209 (residential land) (Dann 2010)
Toronto Jan 2007 - May
2009 0.7 0.0 - 74.1 mean concentration; n=275 (commercial land) (Dann 2010)
Metro Van-Abbotsford Jan 2007 - Jan
2009 0.5 0.0 - 0.7 mean concentration; n=229 (residential land) (Dann 2010)
Metro Van- Burnaby Jan 2007 - May
2009 1.3 0.1 - 11.1 mean concentration; n=225 (residential land) (Dann 2010)

121
Outdoor Air
Location Year Concentration
ng/m3 Range ng/m3 Comments Reference
Kelowna Jan 2007 - Sept
2007 0.1 0.0 - 4.9 mean concentration; n=43 (commercial land) (Dann 2010)
Arctic <0.5 - remote area samples (Chan & Lusis 1988; Hoff & Barrie 1986)
Des Huron River Watershed 1993 - 1995 0.59 mg/m2/yr - depositon estimates (Gelinas & Schmit 1998) Shawinigan 1999 10 95th percentile value (Bisson 2004) Shawinigan 2000 20 95th percentile value (Bisson 2004) Rouyn-Noranda 2002 10 95th percentile value; mining region (Bisson 2004)
Ontario 2001 6.2
1410 PM10 samples from 27 stations; over half of stations reported minimum of 2.0 ng/m3 (OMOE 2002)
Great Lakes 1995 - 1998 0.72 0.61 - 0.87 annual average, three stations (Dryfhout-Clark 2004)
Hamilton 1999 90
mean value; n=2; 24 hr PM10 samples; (steel manufacturing; industrial land) (Lamoureux 2005)
Ottawa (rural) 2004 1 0.4 - 1.8 median PM2.5 (Rasmussen et al. 2006) Ottawa (urban) 2004 0.6 0.5 - 1.3 median PM2.5 (Rasmussen et al. 2006) Port Colborne 1993 13 NS Geometric mean (Leece 1997)
Port Colborne 2001 - 2002 60
mean value; n=4; 24hr PM10 samples (previous Ni refinery; waste processing and precious metal recovery) (Lamoureux 2003)
Sarnia 1998 - 1999 157
mean value; n=4 24 hr PM10 samples; (petroleum refinery, industrial land) (Lamoureux 2003)
Sudbury 1978 - 1988 - 100 - 250 near industrial sources (Chan & Lusis 1988)
Sudbury, Copper Cliff 2000 612
mean value; n=3 24hr PM10 samples (active Ni smelting and refinery, industrial land) (Lamoureux 2005)
Sudbury, Copper Cliff 2003 - 2004 0.21
mean value; n=5 24hr PM10 samples (active Ni smelting and refinery, industrial land) (Lamoureux 2005)
Toronto, Windsor (urban) 1998 - 2000 41 mean value; n=4 24 hr PM10 samples (Lamoureux 2005)

122
Outdoor Air
Location Year Concentration
ng/m3 Range ng/m3 Comments Reference
Windsor 1991-1992 2.1 0.4 - 8.7 mean PM10; n=46; Phase 1 and 2 Windsor Airshed Study (Bell et al. 1994)
Windsor 2004 - 1 - 10 ng/m3 PM2.5 range; outdoor and personal air (Rasmussen et al. 2007)
Windsor 2005 1.3 <DL - 2.9
median PM2.5 from two-week samples collected in the summer for 39 sites ICP/MS (Niu et al. 2010a)
Windsor 2005 1.4 ± 0.6
mean PM2.5 from two-week samples collected in the summer (39 sites) - analyses by ICP/MS (Niu et al. 2010b)
New York State 2 - 3 n=394; range of mean PM2.5 from two counties (Koutrakis et al. 1992)
2001 - 0.0 - 1.252 rural (Hutzell & Luecken 2007) 2001 - 2.93 - 3.043 suburban (Hutzell & Luecken 2007) 2001 - 2.863-12.97 urban (Hutzell & Luecken 2007)
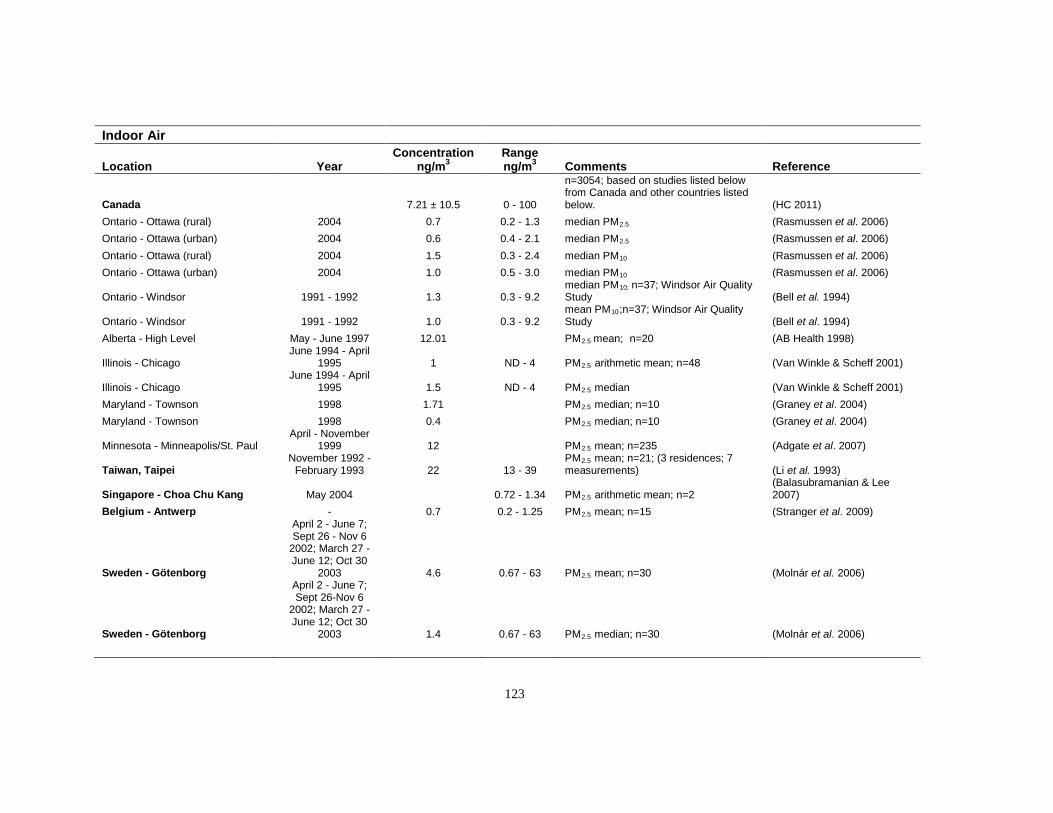
123
Indoor Air
Location Year Concentration
ng/m3 Range ng/m3 Comments Reference
Canada 7.21 ± 10.5 0 - 100
n=3054; based on studies listed below from Canada and other countries listed below. (HC 2011)
Ontario - Ottawa (rural) 2004 0.7 0.2 - 1.3 median PM2.5 (Rasmussen et al. 2006) Ontario - Ottawa (urban) 2004 0.6 0.4 - 2.1 median PM2.5 (Rasmussen et al. 2006) Ontario - Ottawa (rural) 2004 1.5 0.3 - 2.4 median PM10 (Rasmussen et al. 2006) Ontario - Ottawa (urban) 2004 1.0 0.5 - 3.0 median PM10 (Rasmussen et al. 2006)
Ontario - Windsor 1991 - 1992 1.3 0.3 - 9.2 median PM10; n=37; Windsor Air Quality Study (Bell et al. 1994)
Ontario - Windsor 1991 - 1992 1.0 0.3 - 9.2 mean PM10;n=37; Windsor Air Quality Study (Bell et al. 1994)
Alberta - High Level May - June 1997 12.01 PM2.5 mean; n=20 (AB Health 1998)
Illinois - Chicago June 1994 - April
1995 1 ND - 4 PM2.5 arithmetic mean; n=48 (Van Winkle & Scheff 2001)
Illinois - Chicago June 1994 - April
1995 1.5 ND - 4 PM2.5 median (Van Winkle & Scheff 2001) Maryland - Townson 1998 1.71 PM2.5 median; n=10 (Graney et al. 2004) Maryland - Townson 1998 0.4 PM2.5 median; n=10 (Graney et al. 2004)
Minnesota - Minneapolis/St. Paul April - November
1999 12 PM2.5 mean; n=235 (Adgate et al. 2007)
Taiwan, Taipei November 1992 -
February 1993 22 13 - 39 PM2.5 mean; n=21; (3 residences; 7 measurements) (Li et al. 1993)
Singapore - Choa Chu Kang May 2004 0.72 - 1.34 PM2.5 arithmetic mean; n=2 (Balasubramanian & Lee 2007)
Belgium - Antwerp - 0.7 0.2 - 1.25 PM2.5 mean; n=15 (Stranger et al. 2009)
Sweden - Götenborg
April 2 - June 7; Sept 26 - Nov 6
2002; March 27 - June 12; Oct 30
2003 4.6 0.67 - 63 PM2.5 mean; n=30 (Molnár et al. 2006)
Sweden - Götenborg
April 2 - June 7; Sept 26-Nov 6
2002; March 27 - June 12; Oct 30
2003 1.4 0.67 - 63 PM2.5 median; n=30 (Molnár et al. 2006)
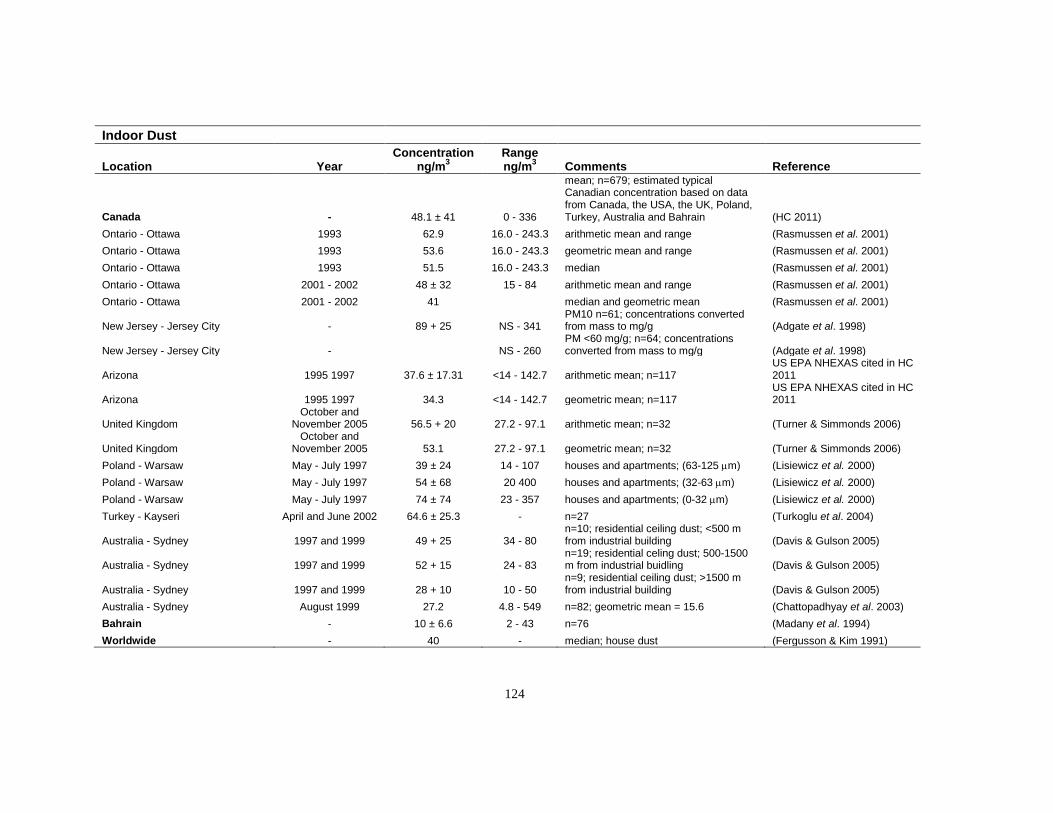
124
Indoor Dust
Location Year Concentration
ng/m3 Range ng/m3 Comments Reference
Canada - 48.1 ± 41 0 - 336
mean; n=679; estimated typical Canadian concentration based on data from Canada, the USA, the UK, Poland, Turkey, Australia and Bahrain (HC 2011)
Ontario - Ottawa 1993 62.9 16.0 - 243.3 arithmetic mean and range (Rasmussen et al. 2001) Ontario - Ottawa 1993 53.6 16.0 - 243.3 geometric mean and range (Rasmussen et al. 2001) Ontario - Ottawa 1993 51.5 16.0 - 243.3 median (Rasmussen et al. 2001) Ontario - Ottawa 2001 - 2002 48 ± 32 15 - 84 arithmetic mean and range (Rasmussen et al. 2001) Ontario - Ottawa 2001 - 2002 41 median and geometric mean (Rasmussen et al. 2001)
New Jersey - Jersey City - 89 + 25 NS - 341 PM10 n=61; concentrations converted from mass to mg/g (Adgate et al. 1998)
New Jersey - Jersey City - NS - 260 PM <60 mg/g; n=64; concentrations converted from mass to mg/g (Adgate et al. 1998)
Arizona 1995 1997 37.6 ± 17.31 <14 - 142.7 arithmetic mean; n=117 US EPA NHEXAS cited in HC 2011
Arizona 1995 1997 34.3 <14 - 142.7 geometric mean; n=117 US EPA NHEXAS cited in HC 2011
United Kingdom October and
November 2005 56.5 + 20 27.2 - 97.1 arithmetic mean; n=32 (Turner & Simmonds 2006)
United Kingdom October and
November 2005 53.1 27.2 - 97.1 geometric mean; n=32 (Turner & Simmonds 2006) Poland - Warsaw May - July 1997 39 ± 24 14 - 107 houses and apartments; (63-125 µm) (Lisiewicz et al. 2000) Poland - Warsaw May - July 1997 54 ± 68 20 400 houses and apartments; (32-63 µm) (Lisiewicz et al. 2000) Poland - Warsaw May - July 1997 74 ± 74 23 - 357 houses and apartments; (0-32 µm) (Lisiewicz et al. 2000) Turkey - Kayseri April and June 2002 64.6 ± 25.3 - n=27 (Turkoglu et al. 2004)
Australia - Sydney 1997 and 1999 49 + 25 34 - 80 n=10; residential ceiling dust; <500 m from industrial building (Davis & Gulson 2005)
Australia - Sydney 1997 and 1999 52 + 15 24 - 83 n=19; residential celing dust; 500-1500 m from industrial buidling (Davis & Gulson 2005)
Australia - Sydney 1997 and 1999 28 + 10 10 - 50 n=9; residential ceiling dust; >1500 m from industrial building (Davis & Gulson 2005)
Australia - Sydney August 1999 27.2 4.8 - 549 n=82; geometric mean = 15.6 (Chattopadhyay et al. 2003) Bahrain - 10 ± 6.6 2 - 43 n=76 (Madany et al. 1994) Worldwide - 40 - median; house dust (Fergusson & Kim 1991)

125
Soil
Location Year Soil type Sample Depth
Concentration mg/kg
Range mg/kg Comments Reference
overall - - 5 - 50 remote areas (McKeague & Wolynetz 1980) Appalachians 18 - remote areas (McKeague & Wolynetz 1980) Canadian Shield 12 - remote areas (McKeague & Wolynetz 1980) St. Lawrence 18 - remote areas (McKeague & Wolynetz 1980) Lowlands 18 - remote areas (McKeague & Wolynetz 1980) Interior Plains 40 - remote areas (McKeague & Wolynetz 1980) Cordilleran 20 - remote areas (McKeague & Wolynetz 1980) Canada - 24 2.5-69 background (Sheppard et al. 2007)
Canada till <0.63 µm - 26.8 ± 42.8 0.5 - 210 mean and provisional range (Rencz et al. 2006; Grunsky 2010) 16 ± 13.3 median (Rencz et al. 2006; Grunsky 2010)
400 local upper limit (ultramafic bedrock) (Rencz et al. 2006; Grunsky 2010)
Great Bear Lake 19.5 unimpacted area (SENES 2002) Great Bear Lake 93.6 impacted area (SENES 2002) New Brunswick-western ultramafic 3.46 neutral soils (pH 6.8 - 7.3) (Roberts 1980) East St. John surface 18 - urban garden soils (Pilgrim & Schroeder 1997) West St. John surface 16 - urban garden soils (Pilgrim & Schroeder 1997) Fredericton surface 46 - urban garden soils (Pilgrim & Schroeder 1997) Québec - agricultural 21.8 2.1 - 54 (Giroux et al. 1992) St. Lawrence Lowlands 50 background estimates (MEF 1998) Appalachians 55 background estimates (MEF 1998) Grenville 30 background estimates (MEF 1998) Superior and Rae 50 background estimates (MEF 1998) Labrador Trough 100 background estimates (MEF 1998) Island of Montréal 1997 surface 0 - 15 cm - 25.6 - 243 urban soils (Ge et al. 2000) Montréal 1997 surface 0 - 15 cm 75.3 - contaminated urban soil (Murray & Hendershot 2000) Rouyn-Noranda organic FH horizon 22 uncontaminated area (Johnson & Hale 2004) Rouyn-Noranda organic FH horizon 19 contaminated area (Johnson & Hale 2004) Ontario - 15 <5 - 35 urban parklands (OMEE 1994) Ontario 13.5 <5 - 56 rural parklands; mean; n=101 (OMEE 1994)

126
Soil
Location Year Soil type Sample Depth
Concentration mg/kg
Range mg/kg Comments Reference
32 <5 - 56 rural parklands (98th percentile) (OMEE 1994)
- all land uses 43 - background estimate (OMEE 1994) Ontario - central and southern - agricultural A horizon 24.98 3 - 500 mean and range (Sharpe & Rasmussen 1996) agricultural A horizon 18.00 3 - 500 median and range (Sharpe & Rasmussen 1996) agricultural C horizon 22.34 4 - 87 mean and range (Sharpe & Rasmussen 1996) agricultural C horizon 22.43 4 - 87 median and range (Sharpe & Rasmussen 1996)
Ontario - central and southern - shales surface - 87 - 225 mean background in shale deposits (McIlveen 1998)
Ontario - central and southern soil surface - 48 - 101 soil concentrations immediately above shale deposits (McIlveen 1998)
Ontario - Essex county - 23 19 - 27 rural soils (Gizyn 1994) Ontario 2000 - NS - 17 000 adjacent to Ni refinery (Birmingham & McLaughlin 2006) Ottawa - clay loam 0 - 20 cm 36 26 - 46 farm field (n=19) (Wang n.d.) Ottawa - clay loam 50 - 65 cm 72 54 - 87 n=20 (Wang n.d.)
Ottawa 1993 Residential urban
garden soil 16.3 ±3.78 10.5 - 27.9 (Rasmussen et al. 2001) Ottawa 2001-2002 urban garden soil garden soil 14 ± 5 5 - 30 mean (Rasmussen et al. 2008)
Ottawa 2001-2002 urban garden soil garden soil 13 5 - 30 median (Rasmussen et al. 2008)
Port Colborne 1991 soils and dust 0 - 5 cm 36 -9800 n=37; near INCO refinery (Leece 1997)
Port Colborne 1991 soils and dust 0 - 5 cm 67 <100 low concentration range (Leece 1997)
Port Colborne 1991 soils and dust 0 - 5 cm 398 100 - 1000 medium concentration range (Leece 1997) Port Colborne 1991 soils and dust 0 - 5 cm 4290 >1000 high concentration range (Leece 1997) Port Colborne 2002 0 - 15 cm - 63.7 - 22 444 contaminated area (Everhart et al. 2006) Sault Ste. Marie & southward 1995 <2 mm 0 - 25 cm 25 3 - 500 mean and range (Garrett 2004) Sault Ste. Marie & southward 1995 <2 mm 0 - 25 cm 18 3 - 500 median and range (Garrett 2004) Southwest Ontario topsoil 20.2 ± 7.6 watersheds (Mills & Zwarich 1975)
Sudbury 1970s surface 2000 within several km of smelters and refineries
(Hutchinson et al. 1981; Freedman & Hutchinson 1980; Temple & Bisessar 1981)

127
Soil
Location Year Soil type Sample Depth
Concentration mg/kg
Range mg/kg Comments Reference
Sudbury
mid 1980s - early 1990s 100 - 725
within 5 km of Sudbury smelters
(Winterhalder 1994; 1992; Skraba 1989; Roshon 1988; Archambault 1991)
Sudbury 1995 5 - 15 cm - 12 - 841 (Gratton et al. 2000) Sudbury - organic FH horizon 670 - contaminated (Johnson & Hale 2004) Sudbury - organic FH horizon 90 - uncontaminated (Johnson & Hale 2004) Sudbury - topsoil 10 - 20 cm - 0.37 - 37.33 (Nkongolo et al. 2008)
Sudbury 2001 urban, rural and undisturbed soils 0 - 20 cm 264 7 - 3700 mean and range (SARA 2001)
Sudbury 2001 urban, rural and undisturbed soils 0 - 20 cm 95 7 - 3700 median and range (SARA 2001)
Sudbury and Rouyn-Noranda 2001 - 14 - 435 (Feisthauer et al. 2006) Windsor area - urban soils 21 14 - 24 (Gizyn 1994)
Prairies - Manitoba, Saskatchewan and Alberta 1992 agricultural 20 3 - 46
mean and range; dpeosits of parent material (moraine/till) (Garrett 2004)
Prairies - Manitoba, Saskatchewan and Alberta 1992 agricultural 19 3 - 46
median and range; dpeosits of parent material (moraine/till) (Garrett 2004)
Manitoba - north rural - - 17.7 - 140.5 background (Yee 2004)
Manitoba - north - organic 0 - 5 cm 14 (Jones Geoff (via Edwin Yee) 2004)
Manitoba - north clay/silt 5 - 10 cm 11 - (Jones Geoff (via Edwin Yee) 2004)
Manitoba - north clay/silt 10 - 15 cm 9 - (Jones Geoff (via Edwin Yee) 2004)
Manitoba - north clay/silt 15 - 30 cm 28 - (Jones Geoff (via Edwin Yee) 2004)
Manitoba - central organic 0 - 12 cm 8 - (Jones Geoff (via Edwin Yee) 2004)
Manitoba - central clay/silt 12 -25 cm 10 - (Jones Geoff (via Edwin Yee) 2004)
Manitoba - south organic 0 - 2 cm 21 - (Jones Geoff (via Edwin Yee) 2004)
Manitoba - south clay/silt/sand 2 - 15 cm 16 - (Jones Geoff (via Edwin Yee) 2004)
Manitoba - south sand 17 - 22 cm 8 - (Jones Geoff (via Edwin Yee) 2004)

128
Soil
Location Year Soil type Sample Depth
Concentration mg/kg
Range mg/kg Comments Reference
Alberta – northwestern agricultural surface, organic 27 <5 - 78 (Soon & Abboud 1990)
Alberta agricultural surface, inorganic 15 <5 - 32 (Soon & Abboud 1990)
Alberta agricultural subsurface 24 11 - 38 (Soon & Abboud 1990) Alberta agricultural 0 - 15 cm 20 - (Lutwick 1994) Alberta agricultural 15 - 30 cm 22 - (Lutwick 1994) Alberta agricultural 30 - 60 cm 25 - (Lutwick 1994) Alberta agricultural 60 - 100 cm 27 - (Lutwick 1994) Alberta agricultural 0 - 15 cm 19.7 2 - 211 (Dinwoodie 2004) Alberta transportation 0 - 5 cm 21.1 6 - 42 (Nason 2004) Alberta - southern half transportation 5 - 15 cm 21.5 6 - 39 (Nason 2004) Alberta - southern half new urban parkland 0 - 5 cm 19.3 10 - 33 (Nason 2004) Alberta - southern half new urban parkland 5 - 15 cm 19.1 8 - 30 (Nason 2004) Alberta - southern half old urban parkland 0 - 5 cm 18.8 11 - 28 (Nason 2004) Alberta - southern half old urban parklland 5 - 15 cm 18.1 11 - 25 (Nason 2004) Alberta - southern half rural parkland 0 - 5 cm 14.4 10 - 18 (Nason 2004) Alberta - southern half rural parkland 5 - 15 cm 15.0 9 - 21 (Nason 2004) Alberta - southern half commercial 0 - 5 cm 17.4 11 - 29 (Nason 2004) Alberta - southern half commercial 5 - 15 cm 16.9 11 - 29 (Nason 2004)
British Columbia surface 50 - 150 Regional background estimates represented by 95th percentiles (BCMOE 1999)
Vancouver Island surface 55 - Regional background estimates represented by 95th percentiles (BCMOE 1999)
Southern Interior surface 75 - Regional background estimates represented by 95th percentiles (BCMOE 1999)
Kootenay surface 50 - Regional background estimates represented by 95th percentiles (BCMOE 1999)
Cariboo surface 150 - Regional background estimates represented by 95th percentiles (BCMOE 1999)

129
Soil
Location Year Soil type Sample Depth
Concentration mg/kg
Range mg/kg Comments Reference
Skeena surface 50 - Regional background estimates represented by 95th percentiles (BCMOE 1999)
Omineca Peace surface 60 - Regional background estimates represented by 95th percentiles (BCMOE 1999)
Lower Mainland (excluding Greater Vancouver) surface 80 -
Regional background estimates represented by 95th percentiles (BCMOE 1999)
Lower Mainland (excluding Greater Vancouver) 0 - 60 cm 27 1.0 - 146
Mean and range; n=408 nitric perchloric digestion (Harris 2004)
Lower Mainland (excluding Greater Vancouver) 0 - 60 cm 36 1.5 - 192
mean and range; n=140; aqua regia digestion (Harris 2004)
Lower Mainland (excluding Greater Vancouver) 0 - 60 cm 90 1.5 - 192 95th percentile; n=140 (Harris 2004)
Greater Vancouver residential and
agricultural 0 - 10 cm 16.81 2.21 - 46.07 Prior to and after start-up of solid waste incinerator (SLI 2000)
Greater Vancouver residential and
agricultural 10 - 20 cm 15.53 1.02 - 43.37 Prior to and after start-up of solid waste incinerator (SLI 2000)
Greater Vancouver residential and
agricultural 20 - 30 cm 14.93 0.21 - 51.3 Prior to and after start-up of solid waste incinerator (SLI 2000)
Greater Vancouver residential and
agricultural Prior to and after start-up of solid waste incinerator (SLI 2000)
Greater Vancouver surface 75 - Regional background estimates represented by 95th percentiles (BCMOE 1999)
Mt. Robson Provincial Park 2002 0 - 25 cm 9.5 - 72.1 disturbed (Arocena et al. 2006) Mt. Robson Provincial Park 2002 0 - 25 cm 27.6 - 67.1 undisturbed (Arocena et al. 2006) Trail 1989 sandbox 16.4 + 5.3 7 - 38 Arithmetic mean (Kelly et al. 1991) Trail 1989 sandbox 15.7 7 - 38 Geometric mean (Kelly et al. 1991) Trail 1989 park 16.9 + 4.0 13 - 35 Arithmetic mean (Kelly et al. 1991) Trail 1989 park 16.5 13 - 35 Geometric mean (Kelly et al. 1991) Trail 1989 residential 18.1 + 4.3 12 - 43 Arithmetic mean (Kelly et al. 1991) Trail 1989 residential 17.7 12 - 43 Geometric mean (Kelly et al. 1991) Trail - 21.8 - background (Sanei et al. 2007) Worldwide - 20 - 40 0.2 - 450 mean values (He et al. 2005; Adriano 2001)
Worldwide 19 - 22 mean values (Kabata-Pendias & Mukherjee 2007)

130
Sediment
Location Year Concentration
mg/kg dw Range
mg/kg dw Comments Reference Canada - - <10 - >4000 lake samples (Bradley & J. R. Morris 1986; Bodo 1989)
Canada - - 2 - 50 background freshwater (Bodo 1989; Arafat & Nriagu 1986; M. B. Jackson 1988; Moore & Ramamoorthy 1984)
Canada - 15 5 - 50
70 000 lake sediment samples, mainly from Shield and Appalachian regions (Friske et al. 1993)
Canada 2004 20 4 - 60
77 891 stream sedimen; median values and range of individual ecozones (Garrett 2010)
Bay of Fundy 1997 - 2002 26 15-36 (Hung 2007)
New Brunswick - lakes - 8.7 (Painter et al. 1994) New Brunswick - streams - 13.5 (Painter et al. 1994) Northern Labrador - 45.2 (Painter et al. 1994) Northern Labrador - 60.7 (Marvin et al. 2007) Québec - 15 lake and stream sediment (Painter et al. 1994)
Québec - Montréal 2004 - 2005 - 11 - 75 St. Lawrence lakes (Desrosiers et al. 2008)
Québec 2001 66 (median) 17 - 345 Lakes Chibougamau and aux Dorés (Laliberté & Trembaly 2002)
Québec 2002 35 (mean) 9 - 140 Lakes Chibougamau, aux Dorés, Waconichi and Obatogamau (Laliberté 2004)
Québec 2002 29 (median) 9 - 140 Lakes Chibougamau, aux Dorés, Waconichi and Obatogamau (Laliberté 2004)
Québec 2002 20 - 140 Lake Chibougamau (n =6) (Laliberté 2004) Québec 2002 28 - 63 Lake Aux Dorés (n=5) (Laliberté 2004) Québec 2002 10 - 13 Lake Waconichi (n=5) (Laliberté 2004) Québec 2002 9 - 40 Lake Obatogamau (n=10) (Laliberté 2004)
Québec 2002 12 - 48 Nemenjiche river (n=5) - river goes through mine site. (Laliberté 2004)
Hamilton Harbour - - 62 - 74 nM (Brassard et al. 1997) Great Lakes - Lake Ontario - 43 - (Murdoch et al. 1988) Great Lakes - Lake Erie - 36.3 - (Murdoch et al. 1988)

131
Sediment
Location Year Concentration
mg/kg dw Range
mg/kg dw Comments Reference Great Lakes - Lake Huron - 30-51 - (Murdoch et al. 1988) Great Lakes - Lake Michigan - 20 - (Murdoch et al. 1988) Great Lakes - Lake Superior - 24-70 - (Murdoch et al. 1988) Great Lakes - Lake Erie - 36.3 - typical background (Marvin et al. 2004) Great Lakes - Lake Erie/Ontario 2001 - 21.7 - 96.2 (Marvin et al. 2007) Ontario - Killarney Park - <100 - remote area (Belzile et al. 2004) Ontario - 12 lakes 1998 - 41.74 - 610.4 near shore sediment (Shuhaimi-Othman et al. 2006)
Ontario lakes and rivers 1994 - 2003 31.7 <0.5 - 850 (Boyd 2004)
Great Lakes 2001 - 2002 22.3 - 51 <1 - 287 (Gewurtz et al. 2008)
Ontario - storm water management facilities - - 11 - 43 (Marsalek et al. 2006)
Ontario - Sudbury - NS - 4000 (Bradley & Morris 1986; Arafat & Nriagu 1986) Ontario - Sudbury 2001 21.9 - 4744.8 (Pyle et al. 2005) Northern Manitoba - - 14.3 - 28.4 freshwater sediment; 5 samples (Yee 2004) British Columbia - lakes - 17.3 (Painter et al. 1994) British Columbia - streams - 12.3 (Painter et al. 1994)
British Columbia - various rivers and bays - 23.9 - 51.3
Extreme low and high values from Boundary Bay and Serpentine River, respectively (Swain & Walton 1994)
Fraser River Basin - 42 - 91 NS - 134 background (pre-1900) (Gallagher & Macdonald 2004)
Yukon 22 stream sediments 30 954 samples from 8 geological provinces (Heon 2003)
Cassiar Platform 19 (Heon 2003) Insular 36 (Heon 2003) Intermontane 18 (Heon 2003) North-American Shelf 21 (Heon 2003) Northern Shelf 23 (Heon 2003) Selwyn Basin 28 (Heon 2003) Triass-Cretac 215 (Heon 2003)

132
Sediment
Location Year Concentration
mg/kg dw Range
mg/kg dw Comments Reference Tanana Terrane 18 (Heon 2003)
Yukon streams 2004 16.31 - 111.1 range of mean T-Ni concentrations from 20 ecoregions (Garrett 2010)
Yukon streams 2004 8 - 38 range of median T-Ni concentrations from 20 ecoregions (Garrett 2010)

133
Water
Location Year Concentration
μg/L Range μg/L Comments Reference Canada - agroecosystems - 0.5 - river samples (He et al. 2005) Canada - 106 nM - tap water (Brassard et al. 1997) Canada - - 0.228 - 0.693 marine water (Bruland et al. 1979)
Canada - 2 1 - 10 surface water (Leger 1991; Moore & Ramamoorthy 1984; NRCC 1981)
Canada - <2.0 (median) <2.0 - 69 Survey of raw, treated and distributed drinking water (Méranger et al. 1981)
Canada - Ontario, Alberta, Atlantic - 2 - drinking water (Moon et al. 1988; Jones-White 1992; EC 1989b)
Canada - 106 nM - tap water (Brassard et al. 1997) Canada 1995 - 1996 0.96 0.73 - 3.3 tap water (Dabeka et al. 2002) Canada - (Ottawa, St. John’s, Vancouver and Montréal) 2000 - 2003 2.37 1.43 - 3.10
Total Diet Study; kitchen tap water (Dabeka 2009)
Canada - (Ottawa, St. John’s, Vancouver and Montréal) 2000 - 2003 2.37 <0.07 - 0.80
Total Diet Study; area tap water (Dabeka 2009)
Canada (Ontario, Saskatchewan, Newfoundland and Labrador) 1999 - 2009 2.85 ± 4.06 0 - 38.5 n=12 251; mean ± SD (HC 2011)
Newfoundland and Labrador 2000 - 2009 1.47 ± 5.94 n=3801 Government of Newfoundland and Labrador cited in HC 2011
New Brunswick, southeastern (Moncton area) 1991 -1 993 18.4 (mean) <13 - 289
n=1002, total Ni from residential kitchen taps (Boyle et al. 1994)
New Brunswick, southeastern (Moncton area) 1991 - 1993 6.0 (median) <13 - 289
n=1002, total Ni from residential kitchen taps (Boyle et al. 1994)
New Brunswick, central (Fredericton) 1993 - 1995 16.4 (mean) <7 - 97
n=465; total Ni from residential kitchen taps (Boyle et al. 1994)
New Brunswick, central (Fredericton) 1993 - 1995 6.5 (median) <7 - 97
n=465; total Ni from residential kitchen taps (Boyle et al. 1994)
Québec - Appalachians 1.7 (geometric mean) <1 - 500 groundwater; n=15 552 (Choinière & Beaumier 1997)
Québec - St. Lawrence Lowlands 1.4 (geometric mean) <1 - 1080 groundwater; n=6745 (Choinière & Beaumier 1997)
Québec - Grenville 1.3 (geometric mean) <1 - 140 groundwater; n=1890 (Choinière & Beaumier 1997)
Québec - Superior and Rae 2.8 (geometric mean) <1 - 140 groundwater; n=1890 (Choinière & Beaumier 1997)

134
Water
Location Year Concentration
μg/L Range μg/L Comments Reference
Québec 1994 - 2006 2.7 (mean) 1 - 9
Drinking water database; n=21; 14 samples <MDL; range doesn’t include <MDL (0.05 & 1 mg/L)samples (Robert 2007)
Ontario 1998 - 2007 3.49 ± 2.59 n=8378 Drinking Water Surveillance Program (Ontario MOE) cited in HC 2011
Lake Ontario 1997 - 1998 - NS - 24.36 Lake Ontario tributaries (OMOE 1999) Ontario - 12 lakes 1998 - 4 - 94.3 12 lakes; surface water (Shuhaimi-Othman et al. 2006)
Ontario 1998 - 2003 1 <1 - 4 Surface water; 19 samples from 6 reference sites (Boyd 2004)
Ontario 1990 - 2002 1.12 (mean)
Groundwater; drinking water distribution (48 supplies; n=996) (Cheung 2004)
Ontario 1990 - 2002 3.33 (mean)
Lakes; drinking water distribution (84 treatment plants; n=2878) (Cheung 2004)
Ontario 1990 - 2002 1.02 (mean)
Lakes; drinking water distribution; lakes (47 treatment plants; n=2222) (Cheung 2004)
Ontario – excluding Sudbury 1993 - 1994 - <0.2 - 7.8 Drinking water survey (Graham 1995)
Ontario - Port Colborne 1990 - 1994 1.2 NS Treated water from Port Colborne treatment plant (Leece 1997)
Ontario - Port Colborne 1990 - 1994 - <2 - 46.2 Residential wells (n=6) (Leece 1997) Ontario - Sudbury 131 NS - 2000 Contaminated lakes (Dixit et al. 1991)
Ontario - Sudbury 1972 - 1992 - 26 - 300 Drinking water (Jenkins 1992; Hopfer et al. 1989; Flora & Nieboer 1980)
Ontario - Sudbury 1983 - 1995 5 1.9 - 33.5 Lake samples (Mallory et al. 1998) Ontario - Sudbury 1999 - 0.6 - 7.3 μM Lake samples (Mandal et al. 2002) Ontario - Sudbury 2001 1 - 338.2 Lake samples (Pyle et al. 2005) Manitoba rural northern sites - - <2 Surface water; 5 samples (Yee 2004)
Saskatchewan 2000 - 2009 1.47 ± 3.48 n=72 SK Environment & Dept of Environment & Conservation cited in HC 2011

135
Water
Location Year Concentration
μg/L Range μg/L Comments Reference
North Saskatchewan River 1991 - 1996 3.25 (SK Environment and Resource Management 1997)
Qu’Appelle River 1991 - 1996 3.02 (SK Environment and Resource Management 1997)
South Saskatchewan River 1991 - 1996 2.58 (SK Environment and Resource Management 1997)
Saskatchewan - Rivers/streams 1998 - 2001 <1 in 90% of samples - 63 samples (Hase 2004)
Tobin Lake 1991 - 1996 1.75 (SK Environment and Resource Management 1997)
Saskatchewan - Lakes 1998 - 2001 <1 103 samples (Hase 2004) McKenzie River Basin - - NS - 6.7 90th percentile value (Lumb et al. 2006)
Alberta - - <2 - 272 groundwater; deep wells; n=101 (Holt-Oduro 2004)
Alberta - 6 <1 - 62 groundwater; shallow wells; n=111 (Holt-Oduro 2004)
Alberta (5 rivers) 1997 - 2003 8.3 <0.5 - 905
locations unlikely to be impacted by anthropogenic metal contamination (Anderson 2004)
Bow River 1997 - 2003 5.1 <0.5 - 26.5
locations unlikely to be impacted by anthropogenic metal contamination (Anderson 2004)
Athabasca River 1997 - 2003 5.9 <0.5 - 83.9
locations unlikely to be impacted by anthropogenic metal contamination (Anderson 2004)
North Saskatchewan River 1997 - 2003 7.6 <0.5 - 87.0
locations unlikely to be impacted by anthropogenic metal contamination (Anderson 2004)
Oldman River 1997 - 2003 5.6 <0.5 - 40.8
locations unlikely to be impacted by anthropogenic metal contamination (Anderson 2004)
Red Deer River 1997 - 2003 17 <0.5 - 905
locations unlikely to be impacted by anthropogenic metal contamination (Anderson 2004)

136
Water
Location Year Concentration
μg/L Range μg/L Comments Reference British Columbia - 47 5.6 - 2910 groundwater; total Ni; n=97 (Evans 2004).
British Columbia 26 5.6 - 920 groundwater; dissolved Ni; n=94 (Evans 2004).
Vancouver Island - Quinsam River 1986 - 2004 - <0.2 - 7.6 mouth of Quinsam River; total Ni in surface water (BCMOE 2008)
Lower Mainland - Fraser River 1979 - 2004 - <0.2 - 24.8 at Hope; total Ni in surface water (BCMOE 2008)
Southern Interior - Bonaparte River 1980 - 1994 - <10 - 20 near mouth; total Ni in surface water (BCMOE 2008)
Southern Interior - Thompson River 1984 - 2004 - <0.2 - 7.6 at Spences Bridge; total Ni in surface water (BCMOE 2008)
Southern Interior - Similkameen River 1966 - 2000 - <0.2 - 0.6
at Princeton; total Ni in surface water (BCMOE 2008)
Kootenay Region - Columbia River 1983-1997 - <0.2 - 3.9 at Birchbank; total Ni in surface water (BCMOE 2008)
Kootenay Region - Columbia River 1979 - 2000 - <0.2 - 4.3 at Waneta; total Ni in surface water (BCMOE 2008)
Kootenay Region - Kootenay River 1984 - 2005 - <0.2 - 3.9 at Fenwick; total Ni in surface water (BCMOE 2008)
Kootenay Region - Kootenay River 1965 - 2000 - <0.2 - 5.3 at Creston; total Ni in surface water (BCMOE 2008)
Cariboo - Fraser River 1984 - 2004 - <0.2 - 43 at Marguerite; total Ni in surface water (BCMOE 2008)
Skeena - Salmon River 1981 - 2002 - <0.2 - 45 near Hyder, Alaska; total Ni in surface water (BCMOE 2008)
Skeena - Salmon River 1981 - 2002 - <0.2 - 45 near Hyder, Alaska; total Ni in surface water (BCMOE 2008)
Great Bear Lake - 1.8 - (SENES 2002)
Nahanni national park - 1.6-8.9 - surface water; historical average (Halliwell & Catto 2003)
Smoking Hills, Cape Bathurst 1975 - 1981 (summers) 7 - 6300
dissolved Ni; 45 ponds; alkaline ponds (pH 8.5-10.5) & acidic ponds (pH 1.5-2.5) -acidic ponds associated with bituminous shales (Havas & Hutchinson 1983)

137
Biota
Species, Tissue type Location, Comments Year Concentration mg/kg dw
Range mg/kg dw Reference
Hyalella azteca 12 lakes in Ontario 1998 - 13.3 - 35.9 (Shuhaimi-Othman et al. 2006) Burbot liver North West Territories, Great Slave Lake 1999 - 2002 <0.05 - (Evans et al. 2005). Burbot muscle, North West Territories, Great Slave Lake 1999 - 2002 <0.05 - (Evans et al. 2005).
Flounder, Starry - muscle British Columbia - Boundary Bay and Roberts Bank 1993 < 1.0 <1.0 (Swain & Walton 1994)
Grayling liver United States, Alaska - Desparation Lake 1991 -1993 1.07 - (Allen-Gil et al. 1997) Grayling liver United States, Alaska - Elusive Lake 1991 -1993 0.2 - (Allen-Gil et al. 1997) Grayling liver United States, Alaska - Feniak Lake 1991 -1993 0.59 - (Allen-Gil et al. 1997) Grayling liver United States, Alaska - Schrader Lake 1991 -1993 0.76 - (Allen-Gil et al. 1997) Grayling muscle United States, Alaska - Desparation Lake 1991 -1993 0.33 - (Allen-Gil et al. 1997) Grayling muscle United States, Alaska - Elusive Lake 1991 -1993 0.12 - (Allen-Gil et al. 1997) Grayling muscle United States, Alaska - Feniak Lake 1991 -1993 0.28 - (Allen-Gil et al. 1997) Grayling muscle United States, Alaska - Schrader Lake 1991 -1993 0.22 - (Allen-Gil et al. 1997) Unknown liver North West Territories, Great Slave Lake 1999 - 2002 <0.05 - (Evans et al. 2005). Unknown muscle North West Territories, Great Slave Lake 1999 - 2002 <0.05 - (Evans et al. 2005). Landlocked lake char Canada - Arctic 1999 - 2003 0.024 - 0.425 ww - (Muir et al. 2005)
Walleye Lake Erie, Wheatley and Port Stanley (n=15) 1996 <0.02 (80% of samples) (Trivedi 2004)
Walleye Lake Huron, French River (n=20) 1995 - 1996 0.052 (Trivedi 2004)
Walleye Lake Ontario, Bay of Quinte-Lennox (n=20) 1995 - 1997 <0.02 in 55% of samples (Trivedi 2004)
Walleye Lake Ontario, Bay of Quinte-Lennox (n=22) 2002 <0.05 in 95% of samples (Trivedi 2004)
Yellow perch liver Ontario - Sudbury lakes 2001 3.8 - 22.4 - (Pyle et al. 2005) Yellow perch muscle Ontario - Sudbury lakes 2001 1.0 - 144.5 - (Pyle et al. 2005) Arctic surfclam Newfoundland - Banquereau Bank; n=19 1996 0.73 - 5.57 (Fancey 2004) Crab tissue - gills, testes, viscera, muscle Newfoundland - Inner Avalon; n=23 1996 0.52 - 18.7 (Fancey 2004) Crab tissue - gills, testes, viscera, muscle Newfoundland - Outer Avalon; n=36 1996 0.25 - 39.3 (Fancey 2004) Crab tissue - gills, testes, viscera, muscle Newfoundland - Bay St. George; n=30 1996 0.30 - 31.2 (Fancey 2004) Crab tissue - gills, testes, viscera, muscle Newfoundland - Bonavista; n=24 1996 0.30 - 25.6 (Fancey 2004)
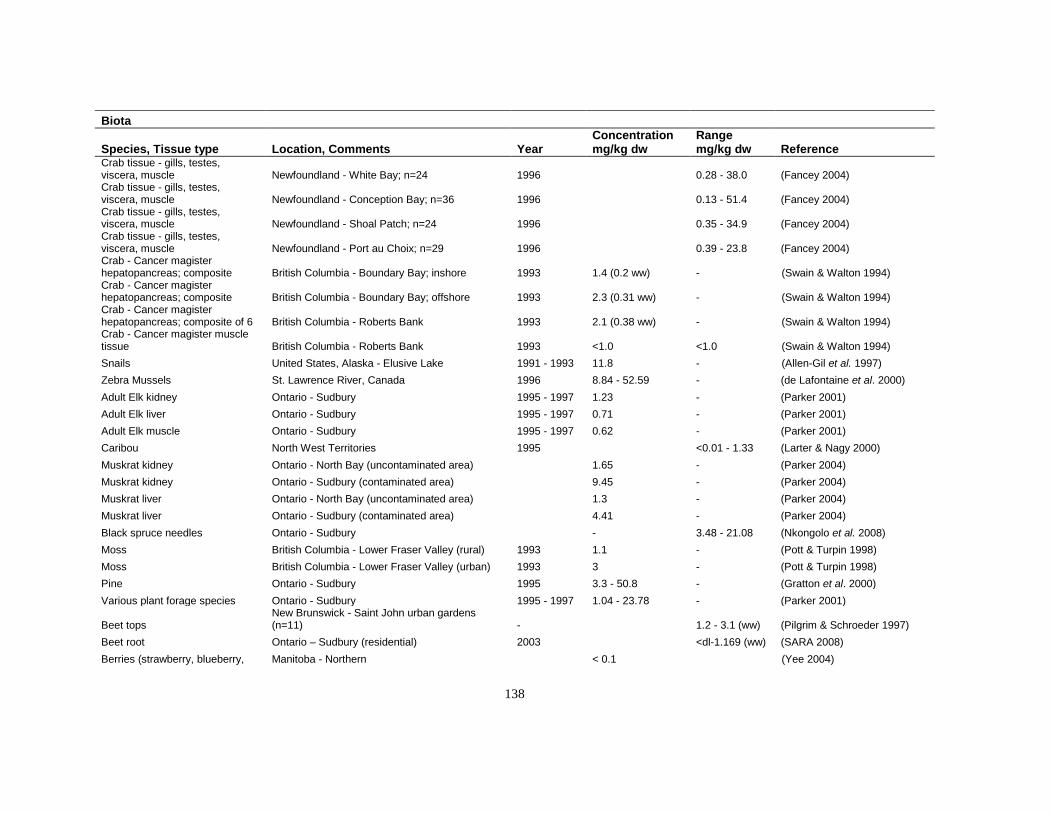
138
Biota
Species, Tissue type Location, Comments Year Concentration mg/kg dw
Range mg/kg dw Reference
Crab tissue - gills, testes, viscera, muscle Newfoundland - White Bay; n=24 1996 0.28 - 38.0 (Fancey 2004) Crab tissue - gills, testes, viscera, muscle Newfoundland - Conception Bay; n=36 1996 0.13 - 51.4 (Fancey 2004) Crab tissue - gills, testes, viscera, muscle Newfoundland - Shoal Patch; n=24 1996 0.35 - 34.9 (Fancey 2004) Crab tissue - gills, testes, viscera, muscle Newfoundland - Port au Choix; n=29 1996 0.39 - 23.8 (Fancey 2004) Crab - Cancer magister hepatopancreas; composite British Columbia - Boundary Bay; inshore 1993 1.4 (0.2 ww) - (Swain & Walton 1994) Crab - Cancer magister hepatopancreas; composite British Columbia - Boundary Bay; offshore 1993 2.3 (0.31 ww) - (Swain & Walton 1994) Crab - Cancer magister hepatopancreas; composite of 6 British Columbia - Roberts Bank 1993 2.1 (0.38 ww) - (Swain & Walton 1994) Crab - Cancer magister muscle tissue British Columbia - Roberts Bank 1993 <1.0 <1.0 (Swain & Walton 1994) Snails United States, Alaska - Elusive Lake 1991 - 1993 11.8 - (Allen-Gil et al. 1997) Zebra Mussels St. Lawrence River, Canada 1996 8.84 - 52.59 - (de Lafontaine et al. 2000) Adult Elk kidney Ontario - Sudbury 1995 - 1997 1.23 - (Parker 2001) Adult Elk liver Ontario - Sudbury 1995 - 1997 0.71 - (Parker 2001) Adult Elk muscle Ontario - Sudbury 1995 - 1997 0.62 - (Parker 2001) Caribou North West Territories 1995 <0.01 - 1.33 (Larter & Nagy 2000) Muskrat kidney Ontario - North Bay (uncontaminated area) 1.65 - (Parker 2004) Muskrat kidney Ontario - Sudbury (contaminated area) 9.45 - (Parker 2004) Muskrat liver Ontario - North Bay (uncontaminated area) 1.3 - (Parker 2004) Muskrat liver Ontario - Sudbury (contaminated area) 4.41 - (Parker 2004) Black spruce needles Ontario - Sudbury - 3.48 - 21.08 (Nkongolo et al. 2008) Moss British Columbia - Lower Fraser Valley (rural) 1993 1.1 - (Pott & Turpin 1998) Moss British Columbia - Lower Fraser Valley (urban) 1993 3 - (Pott & Turpin 1998) Pine Ontario - Sudbury 1995 3.3 - 50.8 - (Gratton et al. 2000) Various plant forage species Ontario - Sudbury 1995 - 1997 1.04 - 23.78 - (Parker 2001)
Beet tops New Brunswick - Saint John urban gardens (n=11) - 1.2 - 3.1 (ww) (Pilgrim & Schroeder 1997)
Beet root Ontario – Sudbury (residential) 2003 <dl-1.169 (ww) (SARA 2008) Berries (strawberry, blueberry, Manitoba - Northern < 0.1 (Yee 2004)

139
Biota
Species, Tissue type Location, Comments Year Concentration mg/kg dw
Range mg/kg dw Reference
mossberry)
Blueberries Ontario- Sudbury (wildland) 2003 0.264-1.034 (ww) (SARA 2008)
Carrots Ontario – Sudbury (residential) 2003 0.061-2.512 (ww) (SARA 2008)
Carrots New Brunswick - Fredericton (rural garden) 0.5 (ww) (Pilgrim & Schroeder 1997) Carrots Manitoba - Northern <0.1 (Yee 2004)
Cucumber Ontario – Sudbury (residential) 2003 0.035-2.705 (ww) (SARA 2008)
Cucumber Ontario – Sudbury (commercial) 2003 <dl-0.930 (ww) (SARA 2008)
Lettuce Ontario – Sudbury (residential) 2003 0.088-2.960 (ww) (SARA 2008)
Lettuce New Brunswick - Fredericton (rural garden) 1.5 (ww) (Pilgrim & Schroeder 1997) Lettuce (washed) Ontario - Sudbury 166 (Hutchinson et al. 1981)
Mushrooms Ontario – Sudbury (wildland) 2003 0.103-0.255 (ww) (SARA 2008)
Onions Ontario – Sudbury (residential) 2003 0.116-2.364 (ww) (SARA 2008)
Potatoes Ontario – Sudbury (residential) 2003 <dl-2.030 (ww) (SARA 2008) Potatoes Ontario – Sudbury (commercial) 2003 <dl-1.580 (ww) (SARA 2008) Potatoes Manitoba - Northern < 0.1 (Yee 2004) Radishes Manitoba - Northern 0.5 - 0.7 (ww) (Yee 2004) Strawberriew Ontario – Sudbury (commercial) 2003 <dl-0.432 (ww) (SARA 2008) Tomatoes Ontario – Sudbury (residential) 2003 <dl-1.843 (ww) (SARA 2008) Turnips Manitoba - Northern < 0.1 (Yee 2004)
Zucchini Ontario – Sudbury (residential) 2003 0.047-1.888 (ww) (SARA 2008)

140
Commercial Food Food Type Year Concentration Range Comment Reference Canada 1995 - 1996 3.5 mg/L 0.73 - 35 retail distilled water (Dabeka et al. 2002) Canada 1995 - 1996 1.96 mg/L 0.73 - 11 retail mineral water (Dabeka et al. 2002) Canada 1995 - 1996 1.32 mg/L 0.73 - 7 retail spring water (Dabeka et al. 2002) Total Diet Studies
shelled seeds 2000 3.173 ng/g Canada (Ottawa -TDS) (Dabeka 2004) white sugar 2000 2.600 ng/g Canada - Ottawa -TDS (Dabeka 2004) herbs and spices 2000 2.122 ng/g Canada - Ottawa - TDS (Dabeka 2004) nuts 2000 1.960 ng/g Canada - Ottawa - TDS (Dabeka 2004) infant formula; ready-to-use - 24.9 and 7.6 ng/g 2.7 - 171 ng/g mean and median (Dabeka 1989) infant formula; milk based with added iron 7.5 and 7.4 ng/L mean and median; n=27 (Dabeka 1989) infant formula; milk based with added iron 5.7 and 5.5 ng/L mean and median; n=6 (Dabeka 1989) infant formula; soy-based 63.7 and 31.2 ng/g mean and median; n=16 (Dabeka 1989)
Canada - human milk for breast fed infants
Newfoundland and Labrador 19.3 µg/L 3 - 28 µg/L samples collected 1/wk for 8 weeks and 3 months (Friel et al. 1999)
United States 1.16 ± 0.41 ng/mL 0.52 - 2.04 ng/mL up to 35 days post=partum (immature milk); n=46; 13 women (Casey & Neville 1987)
Worldwide 13.3 µg/L 11 - 16 µg/L 6 countries; 3 months post-partum (Parr et al. 1991) Portugal 5.8 and 5.3 µg/L 3.7 - 10.7 µg/L mean and median; (Almeida et al. 2008) Canadian food intake rates (µg/kg bw/day)
infant 2000-2007 12.53 ± 2.31 5.59 - 19.48 (HC 2010) toddler 2000-2007 11.14 ± 4.28 0 - 23.98 (HC 2010) child 2000-2007 8.15 ± 3.20 0 - 17.74 (HC 2010) teen 2000-2007 4.96 ± 1.90 0 -10.67 (HC 2010) adult 2000-2007 3.94 ± 1.46 0 - 8.32 (HC 2010)

141
Human and biological Tissues Tissue Year Concentration Range Comment Reference Lungs 1980s 173 µg/kg dw 71-371 µg/kg dw N=10 at autopsy (Rezuke et al. 1987) <1-242 µg/kg dw Data compiled from earlier studies (Rezuke et al. 1987)
330±380 µg/g dw 34±48 µg/g dw
0.76±0.39 µg/g dw
Workers exposed to poorly-soluble Ni Workers exposed to soluble Ni Unexposed controls
(Andersen and Svenes 1989)
Kidneys 1980s 62 µg/kg dw 19-171 µg/kg dw N=10 at autopsy (Rezuke et al. 1987) <1-165 µg/kg dw Data compiled from earlier studies (Rezuke et al. 1987) Thyroid 1980s 141 µg/kg dw 41-240 µg/kg dw N=10 at autopsy (Rezuke et al. 1987) Adrenal 1980s 132 µg/kg dw 53-241 µg/kg dw N=10 at autopsy (Rezuke et al. 1987) Liver 1980s 50 µg/kg dw 11-102 µg/kg dw N=10 at autopsy (Rezuke et al. 1987) 8-21 µg/kg dw Data compiled from earlier studies (Rezuke et al. 1987) Heart 1980s 54 µg/kg dw 10- 110 µg/kg dw N=10 at autopsy (Rezuke et al. 1987) 1-14 µg/kg dw Data compiled from earlier studies (Rezuke et al. 1987) Spleen 1980s 37 µg/kg dw 9-95 µg/kg dw N=10 at autopsy (Rezuke et al. 1987) 1-15 µg/kg dw Data compiled from earlier studies (Rezuke et al. 1987) Brain 1980s 44 µg/kg dw 20-65 µg/kg dw N=10 at autopsy (Rezuke et al. 1987) Pancreas 1980s 34 µg/kg dw 7-71 µg/kg dw N=10 at autopsy (Rezuke et al. 1987) Lymph nodes 282 µg/kg dw 84-486 µg/kg dw (Rezuke et al. 1987) Testes 148 µg/kg dw 9-417 µg/kg dw (Rezuke et al. 1987) Ovaries 102 µg/kg dw 41-163 µg/kg dw (Rezuke et al. 1987) Spinal cord/pituitary 38/33 µg/kg dw 8-77 µg/kg dw (Rezuke et al. 1987) Urine and blood 0.51 - 6.1 µg/L normal levels (WHO 1991)
Serum and plasma <0.005 - 1.08
µg/L normal levels (WHO 1991)
Urine 129 µg/L exposed workers (Sunderman et al. 1986)
Plasma 11.9µ/L exposed workers (Sunderman et al. 1986)
Blood 1.39 µg/dl (geomean) 0.087 - 8.81 µg/dl
Tarragona, Spain; men (n=72); women (n=72) over 16 yrs (Llobet et al. 1998)
Hair 0.38 to 23.83 µg/g Tarragona, Spain; children (11-13yrs); n=124 (Granero et al. 1998)

142
Appendix 2. Toxicity of nickel to soil microbial processes. Candidate data are screened according to whether they are considered "acceptable" (referred to as selected) or "unacceptable" (referred to as consulted) for deriving soil quality guidelines. Acceptable data that were actually used in SQGNEC derivation are in bold and underlined and superscripts are used to identify data used for a particular land use; A/R = agricultural and residential parkland land uses, and C/I = commercial and industrial land uses.
Process Endpoint (exposure) Effect
concentration (mg/kg)
Form of
nickel Soil pH % OM(a) CEC(b) Test Substrate Reference
SELECTED
Carbon mineralisation (CO2 release)
24 % reduction (2 months equilibration of spiked soil + 12 weeks of CO2 measurements)
A/R1000C/I (single dose level)
NiSO4 6.0 2.2 (OC) “Bagshot sand” (5.5% clay, 12% silt, 6 ppm nickel background)
(Bhuiya 1972)
Microbial respiration (CO2 produced)
NOEC (14% decrease) (43 weeks) LOEC (37% decrease) (43 weeks) *IC25 (43 weeks)
400 1000 A/R582C/I
NiCl2 6.0 5.7 10-12 Sandy loam (clay 9%, silt 26%. Sand 65%, 6 mg/kg nickel background)
(Doelman & Haanstra 1984)
Carbon mineralisation (CO2 release)
18% decrease (2 weeks) 6% decrease (8 weeks) 28% decrease (8 weeks)
10 10 A/R100C/I
NiSO4 4.9 2.1 (OC) Loamy sand (82% sand, 9.9% silt, 5.2% clay, 3.1 mg/kg nickel background)
(Cornfield 1977)
Nitrobacter Nitrification
62% decrease (10 days) 294 (single dose level)
NiCl2 7.4 5.45 (OC) Okoboji (16% sand, 50% silt, 34% clay)
(Liang & Tabatabai 1978)
64% decrease (10 days) 294 (single dose level)
NiCl2 7.8 3.74 (OC) Harps (26% sand, 44% silt, 30% clay)
67% decrease (10 days) 294 (single dose level)
NiCl2 5.8 2.58 (OC) Webster (38% sand, 39% silt, 23% clay)
Nitrobacter Nitrogen mineralisation
17% reduction (20 days) A/R294C/I (single dose level)
NiCl2 5.8 2.58 (OC) Webster (38% sand, 39% silt, 23% clay)
(Liang & Tabatabai 1978)
17% reduction (20 days) A/R294C/I (single dose level)
NiCl2 7.8 3.74 (OC) Harps (26% sand, 44% silt, 30% clay)
Microbial respiration (CO2 produced)
34% reduction (45 days) 294C/I NiSO4 7.2 1.7 18.4 Walla Walla (21% sand, 57% silt, 21% clay)
(Lighthart et al. 1983)
34% reduction (45 days) 294C/I NiSO4 8.2 4.7 20.0 Sharpsburg (61% sand, 28% silt, 11% clay)
34% reduction (45 days) 294C/I NiSO4 6.7 3.1 14.0 Crider (10% sand, 63% silt, 27% clay)
34% reduction (45 days) 294C/I NiSO4 7.0 5.5 25.1 Toledo (19% sand, 30% silt, 51% clay)
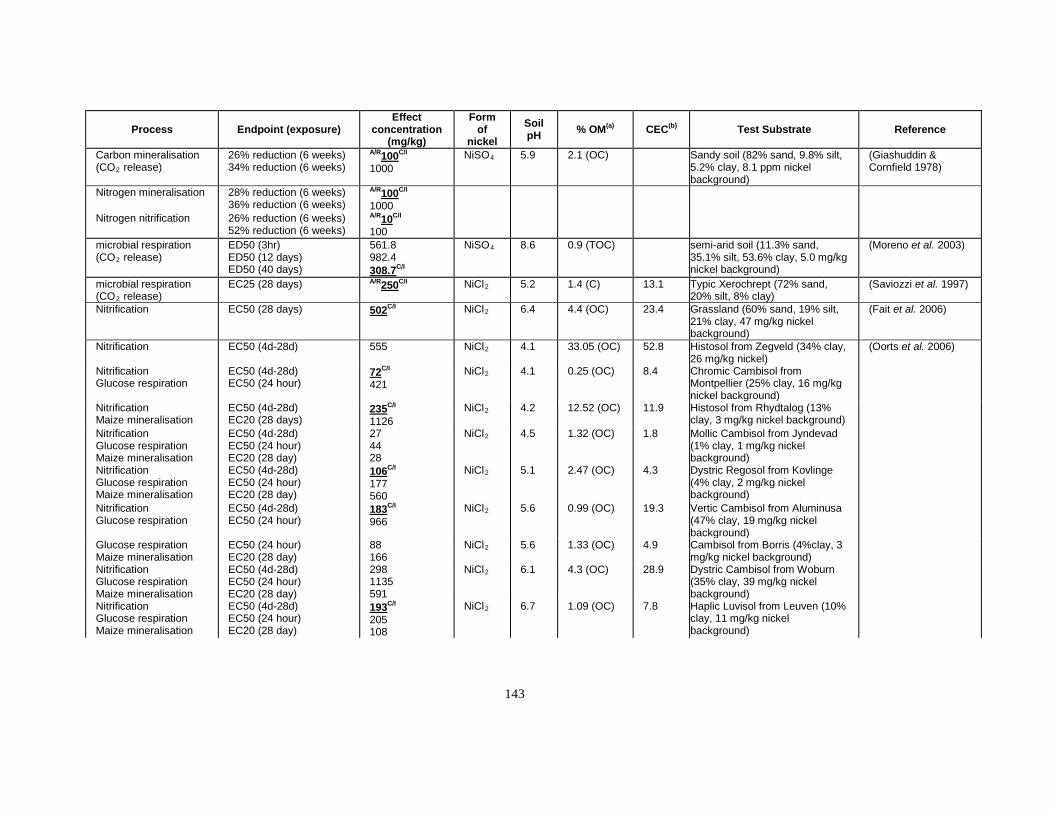
143
Process Endpoint (exposure) Effect
concentration (mg/kg)
Form of
nickel Soil pH % OM(a) CEC(b) Test Substrate Reference
Carbon mineralisation (CO2 release)
26% reduction (6 weeks) 34% reduction (6 weeks)
A/R100C/I 1000
NiSO4 5.9 2.1 (OC) Sandy soil (82% sand, 9.8% silt, 5.2% clay, 8.1 ppm nickel background)
(Giashuddin & Cornfield 1978)
Nitrogen mineralisation 28% reduction (6 weeks) 36% reduction (6 weeks)
A/R100C/I 1000
Nitrogen nitrification 26% reduction (6 weeks) 52% reduction (6 weeks)
A/R10C/I 100
microbial respiration (CO2 release)
ED50 (3hr) ED50 (12 days) ED50 (40 days)
561.8 982.4 308.7C/I
NiSO4 8.6 0.9 (TOC) semi-arid soil (11.3% sand, 35.1% silt, 53.6% clay, 5.0 mg/kg nickel background)
(Moreno et al. 2003)
microbial respiration (CO2 release)
EC25 (28 days) A/R250C/I NiCl2 5.2 1.4 (C) 13.1 Typic Xerochrept (72% sand, 20% silt, 8% clay)
(Saviozzi et al. 1997)
Nitrification EC50 (28 days) 502C/I NiCl2 6.4 4.4 (OC) 23.4 Grassland (60% sand, 19% silt, 21% clay, 47 mg/kg nickel background)
(Fait et al. 2006)
Nitrification EC50 (4d-28d) 555 NiCl2 4.1 33.05 (OC) 52.8 Histosol from Zegveld (34% clay, 26 mg/kg nickel)
(Oorts et al. 2006)
Nitrification Glucose respiration
EC50 (4d-28d) EC50 (24 hour)
72C/I 421
NiCl2 4.1 0.25 (OC) 8.4 Chromic Cambisol from Montpellier (25% clay, 16 mg/kg nickel background)
Nitrification Maize mineralisation
EC50 (4d-28d) EC20 (28 days)
235C/I 1126
NiCl2 4.2 12.52 (OC) 11.9 Histosol from Rhydtalog (13% clay, 3 mg/kg nickel background)
Nitrification Glucose respiration Maize mineralisation
EC50 (4d-28d) EC50 (24 hour) EC20 (28 day)
27 44 28
NiCl2 4.5 1.32 (OC) 1.8 Mollic Cambisol from Jyndevad (1% clay, 1 mg/kg nickel background)
Nitrification Glucose respiration Maize mineralisation
EC50 (4d-28d) EC50 (24 hour) EC20 (28 day)
106C/I 177 560
NiCl2 5.1 2.47 (OC) 4.3 Dystric Regosol from Kovlinge (4% clay, 2 mg/kg nickel background)
Nitrification Glucose respiration
EC50 (4d-28d) EC50 (24 hour)
183C/I 966
NiCl2 5.6 0.99 (OC) 19.3 Vertic Cambisol from Aluminusa (47% clay, 19 mg/kg nickel background)
Glucose respiration Maize mineralisation
EC50 (24 hour) EC20 (28 day)
88 166
NiCl2 5.6 1.33 (OC) 4.9 Cambisol from Borris (4%clay, 3 mg/kg nickel background)
Nitrification Glucose respiration Maize mineralisation
EC50 (4d-28d) EC50 (24 hour) EC20 (28 day)
298 1135 591
NiCl2 6.1 4.3 (OC) 28.9 Dystric Cambisol from Woburn (35% clay, 39 mg/kg nickel background)
Nitrification Glucose respiration Maize mineralisation
EC50 (4d-28d) EC50 (24 hour) EC20 (28 day)
193C/I 205 108
NiCl2 6.7 1.09 (OC) 7.8 Haplic Luvisol from Leuven (10% clay, 11 mg/kg nickel background)

144
Process Endpoint (exposure) Effect
concentration (mg/kg)
Form of
nickel Soil pH % OM(a) CEC(b) Test Substrate Reference
Nitrification Glucose respiration
EC50 (4d-28d) EC50 (24 hour)
454 735
NiCl2 7 0.45 (OC) 12.9 Chromic Luvisol from Souli (33% clay, 81 mg/kg nickel background)
Nitrification Glucose respiration Maize mineralisation
EC50 (4d-28d) EC50 (24 hour) EC20 (28 day)
224C/I 293 94
NiCl2 7.6 1.14 (OC) 19.4 Calcaric Fluvisol from Marknesse (20% caly, 19 mg/kg nickel background)
Nitrification Glucose respiration Maize mineralisation
EC50 (4d-28d) EC50 (24 hour) EC20 (28 day)
792 868 635
NiCl2 7.5 1.37 (OC) 23.6 Calcaric Cambisol from Brecy (49% clay, 113 mg/kg nickel background)
Nitrification Glucose respiration Maize mineralisation
EC50 (4d-28d) EC50 (24 hour) EC20 (28 day)
398 703 785
NiCl2 7.6 0.49 (OC) 35.3 Inceptisol from Cordoba II (55% clay, 24 mg/kg nickel background)
Nitrification Glucose respiration Maize mineralisation
EC50 (4d-28d) EC50 (24 hour) EC20 (28 day)
172C/I 360 154
NiCl2 7.6 0.53 (OC) 13.3 Luvisol from Cordoba I (20% clay, 18 mg/kg nickel background background)
Nitrification Glucose respiration Maize mineralisation
EC50 (4d-28d) EC50 (24 hour) EC20 (28 day)
183C/I 232 591
NiCl2 7.7 0.31 (OC) 13.3 Calcic Cambisol from Guadalajara (17% clay, 11 mg/kg nickel background)
Nitrification EC50 (1-2 wk preincub. + 4 d – 28 d for expt.)
freshly spiked Leached
aged 5 months outdoors aged 10 months outdoors aged 15 months outdoors
27 41 35 52 116C/I
NiCl2 4.5 1.3 (OC) 1.8 Mollic Cambisol from Jyndevad (acid and sandy;1 % clay; 1 mg/kg nickel background)
(Oorts et al. 2007)
Glucose induced respiration
EC50 (1-2 wk preincub.) freshly spiked
aged 5 months outdoors aged 10 months outdoors aged 15 months outdoors NOEC (1-2 wk preincub.)
leached
52 101 84 56 >251
Maize residue mineralisation
EC20 (1-2 wk preincub.) freshly spiked
aged 5 months outdoors aged 10 months outdoors NOEC (1-2 wk preincub.)
leached aged 15 months outdoors
151 221 285 >246 >519

145
Process Endpoint (exposure) Effect
concentration (mg/kg)
Form of
nickel Soil pH % OM(a) CEC(b) Test Substrate Reference
Nitrification EC50 (1-2 wk preincub. + 4 d - 28 d for expt.)
freshly spiked Leached
aged 5 months outdoors aged 10 months outdoors aged 15 months outdoors
313 313 271 621 3086C/I
NiCl2 6.1 4.3 (OC) 28.9 Dystric Cambisol (35% clay, 39 mg/kg Ni background)
Glucose induced respiration
EC50 (1-2 wk preincub.) freshly spiked
NOEC (1-2 wk preincub.) Leached
aged 5 months outdoors aged 10 months outdoors aged 15 months outdoors
1124 >2385 >4582 >3822 >3755
Maize residue mineralisation
EC20 (1-2 wk preincub.) freshly spiked
Leached aged 10 months outdoors aged 15 months outdoors NOEC (1-2 wk preincub.)
aged 5 months outdoors
579 557 1066 784 >4630
Nitrification EC50 (1-2 wk preincub. + 4 d – 28 d for expt.)
freshly spiked leached
aged 5 months outdoors NOEC (1-2 wk preincub. + 4 d - 28 d for expt.) aged 10 months outdoors aged 15 months outdoors
213 945 1982C/I >4342 >4341
NiCl2 7.6 0.5 (OC) 35.3 Inceptisol from Cordoba II (55% clay; 24 mg/kg nickel background)
Glucose induced respiration
EC50 (1-2 wk preincub.) freshly spiked
Leached aged 5 months outdoors
aged 10 months outdoors aged 15 months outdoors
253 484 289 3124 2021

146
Process Endpoint (exposure) Effect
concentration (mg/kg)
Form of
nickel Soil pH % OM(a) CEC(b) Test Substrate Reference
Maize residue mineralisation
EC20 (1-2 wk preincub.) freshly spiked
NOEC (1-2 wk preincub.) Leached
aged 5 months outdoors aged 10 months outdoors aged 15 months outdoors
297 >2339 >4615 >4423 >4423
CONSULTED
Aspergillus clavatus Growth
LOEC (3 days) 50 NiCl2 4.8 Sandy soil (Babich & Stotzky 1982)
Penicilium vermicalatum Growth
LOEC (3 days) 250 NiCl2
4.8 Sandy soil
Aspergillus flavus Growth
LOEC (3 days) 250 NiCl2
4.7 Sandy soil
Gliocladium sp. Growth
LOEC (3 days)
250 NiCl2
4.7 Sandy soil
Rhizopus stolonifer Growth
LOEC (3 days)
500 NiCl2
4.6 Sandy soil
Aspergillus flavipes Growth
LOEC (3 days)
500 NiCl2
4.6 Sandy soil
Aspergillus niger Growth
LOEC (3 days)
500 NiCl2
4.6 Sandy soil
Trichoderma vivide Growth
LOEC (3 days)
750 NiCl2
4.5 Sandy soil
Phosphatase activity EC50 (6 weeks) 1109 5688
NiCl2 7.0 6.0
Sand Sandy loam
(Doelman & Haanstra 1989)
4232 7.7 Silty loam 6516 7.5 Clay Phosphatase activity EC50 (18 months) 2530 7.0 Sand 8042 6.0 Sandy loam 2131 7.7 Silty loam Phosphatase activity (<5% inhibition)
EC5 (3 hours) 587 NiCl2 4.3-6.3
Organic-rich soil (Tyler 1981)
Dehydrogenase activity EC50 (24 hours) 77 NiSO4 NA Agricultural soil enriched with alfalfa
(Rogers & Li 1985)
Urease activity EC50 (6 weeks) 100 2040
NiCl2 7.0 6.0
Sand Sandy loam
(Doelman & Haanstra 1986)
1650 7.7 Silty loam 3380 7.5 Clay 3030 4.4 Sandy peat

147
Process Endpoint (exposure) Effect
concentration (mg/kg)
Form of
nickel Soil pH % OM(a) CEC(b) Test Substrate Reference
EC50 (18 months) 410 2790
7.0 6.0
Sand Sandy loam
1740 7.7 Silty loam 370 7.5 Clay 2320 4.4 Sandy peat Urease activity EC33
(2 hours) 294 NiCl2 5.1-
7.8 Agricultural soil (Tabatabai 1977)
Arylsulphate activity NOEC (30 minutes) EC26 (30 minutes)
146.8 1468
NiCl2 6.2-7.6
Four different agricultural soils (Al-Khafaji & Tabatabai 1979)
Pyrophosphatase EC2 (5 hours) EC5 (5 hours)
293.5 1468
NiCl2 4.6 1.99 (OC) Fine loamy (Scott et al. 1985)
EC2 (5 hours) 1468 7.0 5.32 (OC) Montmorillonitic soil Carbon mineralisation EC55
6.6 NA Sandy loam (Brookes & McGrath
1984) Microbial respiration (CO2 produced)
EC10 (9 days)
29.4 NiSO4 6.2 64 12.5 Rifle series (Lighthart et al. 1983)
Microbial respiration (CO2 produced)
24% inhibition to 30 % above control - no dose-response observed (70 wks)
150- 8000 NiCl2 7.0 1.6 1-2 Sand (Dolovich et al. 1984)
Microbial respiration (CO2 produced)
ED10 (64 days) LOEC (42% reduction) (64 days)
279 1230
NiCl2 humus (upper half of Of layer) (Åkerblom et al. 2007)
Community structure (PCA analysis)
LOEC (64 days)
180
Phospholipid fatty acid analysis (PLFA total)
NOEC (64 days)
1230
Soil dehydrogenase activity
ED50 (3 hr) ED50 (12 days) ED50 (40 days)
2885.1 5978.5 9127.5
NiSO4 8.6 0.9 (TOC) semi-arid soil (11.3% sand, 35.1% silt, 53.6% clay, 5.0 mg/kg nickel)
(Moreno et al. 2003)
Soil ATP content ED50 (3 hr) ED50 (12 days) ED50 (40 days)
2240.1 4668.4 16694.3
Soil microbial biomass C
ED50 (3 hr) ED50 (12 days) ED50 (40 days)
386.6 795.8 7243.1
Dehydrogenase ED10 (24 hours) ED25 (24 hours) ED50 (24 hours)
7.9 24.3 100
NiCl2 7.02 1.12 (OC) 12.4 haplic fluvisol (9.7% sand, 75.1% silt, 15.2% clay, 19.4 mg/kg nickel)
(Welp 1999)

148
Process Endpoint (exposure) Effect
concentration (mg/kg)
Form of
nickel Soil pH % OM(a) CEC(b) Test Substrate Reference
Urease activity Phosphatase activity protease-BAA activity
ED50 (40 days) ED50 (40 days) ED50 (40 days)
2852 5890 8197
NiSO4 8.6 0.9 (TOC) semi-arid soil (11.3% sand, 35.1% silt, 53.6% clay, 5.0 mg/kg nickel)
(Moreno et al. 2003)
Nitrogen fixation NOEC (18 months) >54 NiSO4 6.5-6.77
Sandy loam (51% sand, 9% clay, 17 mg/kg nickel)
(Chaudri & McGrath 1992)
Glucose respiration Maize mineralisation
EC50 (24 hour) EC20 (28 day)
71 110
NiCl2 3.6 17.3 (OC) 1.8 Haplic Podzol from Houthalen (1% clay, 1 mg/kg nickel)
(Oorts et al. 2006)
Nitrification EC50 (4d-28d) 162 NiCl2 5.6 1.33 (OC) 4.9 Cambisol from Borris (4%clay, 3 mg/kg nickel)
Nitrification Nitrogen mineralisation
NOEC (6 weeks) LOEC -significant increase in (NO3
-+NH4+)-
N (6 weeks)
500 500
NiSO4 3.4-3.9
47-53 NR Sandy Orthic Humo-Ferric Podzols (experiment conducted on mineral layer only)
(deCatanzaro & Hutchinson 1985)
Respirtaion: delay (hours) to maximum respiration rate of glutamic acid
NOEC (18 months) LOEC 42% increase (18 months)
55 400
NiCl2 4.4 12.8 50-55 Sandy peat (82% sand, 13% silt, 5% clay, 4 mg/kg nickel)
(Haanstra & Doelman 1984)
NOEC (18 months) LOEC 66% increase (18 months)
55 400
7.0 1.6 1-2 Sand (93% sand, 5% silt, 2% clay, 8 mg/kg nickel)
Carbon mineralisation (CO2 release)
No Effect Level IC20 IC50 (results pooled from experiments performed at 1, 31 and 63 d)
27 90 500
NiSO4 5.7 0.72 (C) 11.3 Acid sandy loam (Gupta et al. 1987)
NA = not available aStudies reported organic matter (OM) unless otherwise indicated, e.g., C (carbon), OC (organic carbon), or TOC (total organic carbon) bUnits of Cation Exchange Capacity (CEC) are either meq(+) / 100g or cmol(+) / kg. * Recalculated by Environment Canada using log-logistic model.

149
Appendix 3. Toxicity of nickel to terrestrial plants. Candidate data are screened according to whether they are considered "acceptable" (referred to as selected) or "unacceptable" (referred to as consulted) for deriving soil quality guidelines. Acceptable data that were actually used in SQGSC derivation are in bold and underlined in the “Selected” section of this appendix
Organism Effect (exposure period) Endpoint
Effect magnitude
(%)
Effect concentration
(mg/kg)
Form of
nickel Soil pH
%OM(a)
CEC (b) Test Substrate Reference
SELECTED
Corn (Zea mays L.)
Growth (g/shoot) (14 days)
NOEC LOEC *IC25
-72
100 250 161
NiSO4 4.2 Yolo loam soil (Wallace et al. 1977)
NOEC LOEC
-81
100 250
5.6
NOEC LOEC *IC25
-47
100 250 182
7.5
Soybean (Glycine max L.)
Mortality (12 days)
LC100 1000 (one test conc.)
NiSO4 6.2 Yolo loam soil
Leaf yield (mg/plant) (12 days)
LOEC -32 1000 (one test conc.)
7.2
Stem yield (mg/plant) (12 days)
LOEC -28 1000 (one test conc.)
7.2
Bush bean (Phaseolus vulgaris L. C.V. Improved Tendergreen)
Leaf yield (mg/plant) (16 days) Leaf yield (mg/plant) (28 days) Stem yield (mg/plant) ( 28 days)
LOEC NOEC LOEC NOEC NOEC LOEC NOEC LOEC
-64 -36 -45 +35
100 100 250 250 25 100 25 100
NiSO4 5.8 7.5 8.2 5.6-5.8 5.6-5.8
Yolo loam soil
Barley (Hordeum vulgare L. C.V. Atlas 57)
Growth (28 days) LOEC -70 to -75 50 NiSO4 5.6-5.8
Yolo loam soil
Rye grass (Lolium perenne)
Growth rate (shoot yield) (4 weeks)
NOEC LOEC *IC25
-14
30 90 109
NiSO4 4.7 Loam soil (Khalid & Tinsley 1980)
Red oak (Quercus rubra)
Total leaf area (16 weeks)
NOEC LOEC
20 50
NiCl2 6.0 1.5 Sandy loam soil (Dixon 1988)
Total dry weight (16 weeks)
*IC25 42

150
Organism Effect (exposure period) Endpoint
Effect magnitude
(%)
Effect concentration
(mg/kg)
Form of
nickel Soil pH
%OM(a)
CEC (b) Test Substrate Reference
Onion (Allium cepa)
Total dry weight (8 weeks) Mortality (8 weeks)
LOEC *IC25 LC100
-20 50 70 400
NiSO4 8.3 0.28 (OC)
12.6 Clay-loam soil (sand 40%; silt 35%; clay 24%)
(Dang et al. 1990)
Fenugreek (Trigonella poenumgraceum)
Total dry weight (8 weeks) Mortality (8 weeks)
LOEC *IC25 LC100
-21 50 122 400
(Biró et al. 1998)
Cotton plant (Gossypium hirsutum L.)
Leaf growth (5 weeks)
LOEC *IC50
-44 100 110
NiSO4 6.8 2.2 Loam soil (Rehab & Wallace 1978)
Stem growth (5 weeks)
LOEC -59 100
Cotton plant (Gossypium hirsutum L. cv. Giaz 45)
Leaf growth (5 weeks) Leaf growth (5 weeks)
LOEC *IC50 *IC25 LOEC
-46 -28
100 107 96 100
Alfalfa (Medicago sativa L.)
Growth (2 months)
NOEC -23 86 NiSO4 7.0 3 humus
calcareous loamy chernozem (25% clay)
(Biró et al. 1998)
Alfalfa (Medicago sativa Fabaceae)
Mortality Emergence Total dry weight/plant
EC20 EC20 EC25
319.7 201.1 33.9
NiCl2 5.01 5 peat
modified ASTM soil (sand 85%; clay 10%)
(Kapustka et al. 2006)
Mortality Emergence Total dry weight/plant
EC20 EC20 EC25
176.5 124.6 29.8
NiCl2 6.32 0.1 Camas soil (sand 88.8%; silt 8.0%; clay 3.2%)
barley (Hordeum vulgare, Gramineae)
Mortality Emergence Total dry weight/plant
EC20 EC20 EC25
593.6 256.2 20.2
NiCl2 5.01 5 peat
modified ASTM soil (sand 85%; clay 10%)
Mortality Emergence Total dry weight/plant
EC20 EC20 EC25
760.7 179.8 88.8
NiCl2 6.32 0.1 Camas soil (sand 88.8%; silt 8.0%; clay 3.2%)
Brassica (Brassica rapa, Brassicaeae)
Mortality Emergence Total dry weight/plant
EC20 EC20 EC25
>5000 43.2 26.2
NiCl2 5.01 5 peat
modified ASTM soil (sand 85%; clay 10%)
Mortality Emergence Total dry weight/plant
EC20 EC20 EC20
4001.9 63 39.4
NiCl2 6.32 0.1 Camas soil (sand 88.8%; silt 8.0%; clay 3.2%)
Tomato Shoot growth (21 d) EC10 **EC20 EC50
11 13 18
NiCl2 4.5 1.32 (OC)
1.84 Jyndevad (sand 95.0%; silt 3.5%; clay 1.5%; 1 mg/kg Ni background)
(Rooney et al. 2007)

151
Organism Effect (exposure period) Endpoint
Effect magnitude
(%)
Effect concentration
(mg/kg)
Form of
nickel Soil pH
%OM(a)
CEC (b) Test Substrate Reference
Tomato Shoot growth (21 d) EC10 **EC20 EC50
126 135 148
NiCl2 6.7 1.09 (OC)
7.80 Ter Munck (sand 11.0%; silt 79.4%; clay 9.6%; 11 mg/kg Ni background)
Tomato Shoot growth (21 d) EC10 **EC20 EC50
131 152 206
NiCl2 4.2 12.52 (OC)
11.91 Rhydtalog (sand 36.8%; silt 50.5%; clay 12.7%; 3 mg/kg Ni background)
Tomato Shoot growth (21 d) EC10 **EC20 EC50
162 175 205
NiCl2 7.6 0.53 (OC)
13.35 Cordoba 1 (sand 46.3%; silt 33.9%; clay 19.8%; 18 mg/kg Ni background)
Tomato Shoot growth (21 d) EC10 **EC20 EC50
192 215 273
NiCl2 6.1 4.3 (OC)
28.87 Woburn (sand 40.7%; silt 24.0%; clay 35.3%; 39 mg/kg Ni background)
Tomato Shoot growth (21 d) EC10 **EC20 EC50
32 35 43
NiCl2 4.1 0.25 (OC)
8.39 Montpellier (sand 63.3%; silt 11.4%; clay 25.3%; 16 mg/kg Ni background)
Tomato Shoot growth (21 d) EC10 **EC20 EC50
221 239 275
NiCl2 7.6 1.14 (OC)
19.44 Marknesse (Sand 12.3%; Silt 67.7%; clay 19.9%; 19 mg/kg Ni background)
Tomato Shoot growth (21 d) EC10 **EC20 EC50
22 23 26
NiCl2 3.6 1.73 (OC)
1.84 Houthalen (Sand 94.9%; silt 4.8%; clay 0.4%; 1 mg/kg Ni background)
Tomato Shoot growth (21 d) EC10 **EC20 EC50
252 284 367
NiCl2 7.6 0.49 (OC)
35.26 Cordoba 2 (sand 23.0%; silt 21.6%; clay 55.4%; 24 mg/kg Ni background)
Tomato Shoot growth (21 d) EC10 **EC20 EC50
330 358 415
NiCl2 7.0 0.45 (OC)
12.85 Souli (sand 52.4%; silt 14.4%; clay 33.2%; 81 mg/kg Ni background)
Tomato Shoot growth (21 d) EC10 **EC20 EC50
47 59 92
NiCl2 5.6 0.99 (OC)
19.26 Aluminusa (sand 29.3%; silt 23.7%; clay 46.9%; 19 mg/kg Ni background)

152
Organism Effect (exposure period) Endpoint
Effect magnitude
(%)
Effect concentration
(mg/kg)
Form of
nickel Soil pH
%OM(a)
CEC (b) Test Substrate Reference
Tomato Shoot growth (21 d) EC10 **EC20 EC50
45 49 59
NiCl2 5.1 2.47 (OC)
4.31 Kövlinge II (sand 82.6%; silt 13.4%; clay 3.9%; 2 mg/kg Ni background)
Tomato Shoot growth (21 d) EC10 **EC20 EC50
629 673 777
NiCl2 7.5 1.37 (OC)
23.57 Brécy (sand 11.4%; silt 39.4%; clay 49.2%; 113 mg/kg Ni background)
Tomato Shoot growth (21 d) EC10 **EC20 EC50
56 62 77
NiCl2 5.6 1.33 (OC)
4.91 Borris (sand 78.6%; Silt 17.1%; clay 4.3%; 3 mg/kg Ni background)
Tomato Shoot growth (21 d) EC10 **EC20 EC50
637 727 961
NiCl2 4.1 33.05 (OC)
52.75 Zegveld (sand 47.8%; silt 18.2%; clay 34%; 26 mg/kg Ni background)
Tomato Shoot growth (21 d) EC10 **EC20 EC50
199 260 415
NiCl2 7.7 0.31 (OC)
13.27 Guadalajara (sand 55.2%; silt% 27.6%; clay 17.2%; 11 mg/kg Ni background)
Oat (var. Cascade)
Dry matter yield (Grown to maturity)
NOEC LOEC *IC25
-27
63.4 139.4 133
NiSO4 7.5 2.3 14.6 Light textured (8.9% clay; 8.3 mg/kg Ni background)
(Liang & Schoenau 1995)
NOEC >96.2 NiSO4 8.3 3 34.7 Heavy textured (44.6% clay; 27.2 mg/kg Ni background)
Radish (var. Cherry Bell)
Dry Matter Yield (30 d)
NOEC LOEC *IC25
-89.3
63.4 139.4 78
NiSO4 7.5 2.3 14.6 Light textured (8.9% clay; 8.3 mg/kg Ni background)
NOEC >96.2 NiSO4 8.3 3 34.7 Heavy textured (44.6% clay; 27.2 mg/kg Ni background)
Corn (Zea mays L.)
Above ground yield (6 weeks)
*IC25 49 NiSO4 6.5 2.86 (C)
20.2 Grenville loam (MacLean & Dekker 1978)
Oat
Grain yield (110 d) Straw yield (110 d)
NOEC NOEC
>500 >500
NiCl2 7.8 4.0 13 .0 Grenville sandy loam (Halstead et al. 1969)
Oat Grain yield (110 d) Straw yield (110 d)
LOEC *IC25
-38 50 31
NiCl2 6.1 1.4 6 Uplands sand
Oat Grain yield (110 d) Straw yield (110 d)
MATC *IC25
224 73
NiCl2 5.7 4.1 11.7 Uplands sand

153
Organism Effect (exposure period) Endpoint
Effect magnitude
(%)
Effect concentration
(mg/kg)
Form of
nickel Soil pH
%OM(a)
CEC (b) Test Substrate Reference
Alfalfa Tops yield (83 d) *IC25 41 NiCl2 5.7 4.1 11.7 Uplands sand Alfalfa Tops yield (83 d) LOEC -40 32 NiCl2 6.1 1.4 6 Uplands sand Alfalfa Tops yield (83 d) MATC 224 NiCl2 7.8 4.0 13 .0 Grenville sandy loam Barley (Hordeum vulgare)
Root elongation (5 d) unleached
leached
EC20 EC20
18 25
NiCl2 4.93 1.51 (C)
8.45 S1-Latersol (clay 66%)
(Li et al. 2011)
Barley (Hordeum vulgare)
Root elongation (5 d) unleached
leached
EC20 EC20
30 38
NiCl2 5.31 0.87 (C)
7.47 S2-Red earth (clay 46%)
Barley (Hordeum vulgare)
Root elongation (5 d) unleached
leached
EC20 EC20
913 1729
NiCl2 6.56 3.03 (C)
33.6 S3-Black soil (clay 40%)
Barley (Hordeum vulgare)
Root elongation (5 d) unleached
leached
EC20 EC20
795 649
NiCl2 6.70 1.42 (C)
19.3 S4-Paddy siol (clay 41%)
Barley (Hordeum vulgare)
Root elongation (5 d) unleached
leached
EC20 EC20
480 903
NiCl2 6.80 2.46 (C)
12.8 S5-Paddy soil (clay 39%)
Barley (Hordeum vulgare)
Root elongation (5 d) unleached
leached
EC20 EC20
238 265
NiCl2 7.12 0.99 (C)
22.3 S6-Purplish soils (clay 27%)
Barley (Hordeum vulgare)
Root elongation (5 d) unleached
leached
EC20 EC20
328 980
NiCl2 7.27 1.47 (C)
8.30 S7-Padddy soil (clay 25%)
Barley (Hordeum vulgare)
Root elongation (5 d) unleached
leached
EC20 EC20
702 1053
NiCl2 7.48 4.28 (C)
22.7 S8-Brown earth (clay 20%)
Barley (Hordeum vulgare)
Root elongation (5 d) unleached
leached
EC20 EC20
1029 1175
NiCl2 7.66 2.66 (C)
22.7 S9-Chernozem (clay 37%)
Barley (Hordeum vulgare)
Root elongation (5 d) unleached
leached
EC20 EC20
889 639
NiCl2 7.82 2.17 (C)
28.8 S10-Black soil (clay 45%)
Barley (Hordeum vulgare)
Root elongation (5 d) unleached
leached
EC20 EC20
688 NC
NiCl2 8.19 1.01 (C)
11.7 S11-Cinnamon soil (clay 21%)
Barley (Hordeum vulgare)
Root elongation (5 d) unleached
leached
EC20 EC20
544 ≥2381
NiCl2 8.72 0.87 (C)
10.3 S12-Gray desert soil (clay 25%)
Barley (Hordeum vulgare)
Root elongation (5 d) unleached
leached
EC20 EC20
475 ≥2286
NiCl2 8.83 0.62 (C)
8.46 S13-Loessial soil (clay 28%)

154
Organism Effect (exposure period) Endpoint
Effect magnitude
(%)
Effect concentration
(mg/kg)
Form of
nickel Soil pH
%OM(a)
CEC (b) Test Substrate Reference
Barley (Hordeum vulgare)
Root elongation (5 d) unleached
leached
EC20 EC20
936 1457
NiCl2 8.84 0.60 (C)
6.36 S14-Fluvo-aquic soil (clay 10%)
Barley (Hordeum vulgare)
Root elongation (5 d) unleached
leached
EC20 EC20
551 NC
NiCl2 8.86 1.57 (C)
8.50 S15-Fluvo-aquic soil (clay 16%)
Barley (Hordeum vulgare)
Root elongation (5 d) unleached
leached
EC20 EC20
911 NC
NiCl2 8.86 1.02 (C)
8.08 S16-Irrigated desert soil (clay 20%)
Barley (Hordeum vulgare)
Root elongation (5 d) unleached
leached
EC20 EC20
256 ≥2380
NiCl2 8.90 0.69 (C)
8.33 S17-Fluvo-aquic soil (clay 18%)
CONSULTED
Pinus banksiana Shoot dry weight (12 weeks) Root dry weight (12 weeks)
EC41 EC17
5 5
NiCl2 6.0 1.5 Sandy loam soil (Dixon & Bushena 1988)
Picea glauca Shoot dry weight (12 weeks) Root dry weight (12 weeks)
EC16
EC18
10 5
Celery Growth (69-75 days)
EC59 1180 NA 5.7-6.4 70 Organic soil (70% O.M.)
(Frank et al. 1982)
Lettuce Growth (60-78 days)
EC19 1875
Lettuce Dry matter yield (63 days)
-20 -54
46 81
NiSO4 4.9 8 Acid sandy loam (Steinhof)
(Gupta et al. 1987)
-13 348 7.7 10 Erlach -35 387 5.6 41 Gänsemos -14 503 6.6 20 Gasel Red clover (Trifolium paratense L.)
Growth (2 months)
NOEC
-33 22 86
NiSO4 7.0 3 humus
calcareous loamy chernozem (25% clay)
(Biró et al. 1998)
Ryegrass Growth (12 weeks)
NOEC >50 NiCl2 6.0 0.4 (C)
Sandy soil (Singh & Jeng 1993)
Red clover (Trifolium
Dry matter yield (35 days)
NOEC >100 Ni(C2H3O2)2
8.2 1 23.4 Silt loam (sand 27.6%; silt 52.6%; clay 19.8%)
(Elmosly & Abdel-Sabour 1997)

155
Organism Effect (exposure period) Endpoint
Effect magnitude
(%)
Effect concentration
(mg/kg)
Form of
nickel Soil pH
%OM(a)
CEC (b) Test Substrate Reference
paratense L.) NOEC LOEC
+126 +152
25 50
Ni(C2H3O2)2
7.9 0.6 Sandy loam (sand 61.0%; silt 27.8%; clay 11.2%)
NOEC >100 Ni(C2H3O2)2
7.6 0.05 5.9 Sandy (sand 87.3%; silt 7.2%; clay 5.5%)
Oat (?) Degree of necrotic symptoms (36 d)
High 218 (soluble in 2.5% acetic acid)
ambient 4.8 Pure sand quartz (Hunter & Vergnano 1952)
Multiple crop species
Nickel toxicity symtpoms
Symptoms are described
26-61 ambient 4.5-5.3 Field study in acid peat
Corn (Zea mays)
Growth (5 weeks)
NOEC >155 NiCl2 6 2.16 5.7 Rubicon sand (sand 89.38%; silt 1.18%; clay 9.44%)
(Traynor & Knezek 1973)
Mustard Grain yield (Grown to maturity)
LOEC -19 20 NR 8.0 0.2 (C)
Loamy sand soil (Typic ustipsamment)
(Gupta & Kala 1996)
Lentil Grain yield (Grown to maturity)
LOEC -14 5.0
Chickpea Grain yield (Grown to maturity)
LOEC -18 7.5
Oat Grain yield (110 d) Straw yield (110 d)
NOEC NOEC
>500 >500
6.4 21.2 61.7 Granby sandy loam (Halstead et al. 1969)
Alfalfa Alfalfa tops yield (83 d)
MATC 224
Lettuce (var. Slobolt)
Dry Matter Yield (40 d)
LOEC
-29 -94
32.5 139.4
NiSO4 7.5 2.3 14.6 Light textured (8.9% clay; 8.3 mg/kg Ni background)
(Liang & Schoenau 1995)
Lettuce (var. Slobolt)
Dry Matter Yield (40 d)
NOEC LOEC
-35
23.2 54.8
NiSO4 8.3 3 34.7 Heavy textured (44.6% clay; 27.2 mg/kg Ni background)
Spinach Growth (30 days) EC29 23 NiSO4 4.55
2.14 (OC)
7.4 Sandy soil (3.1 mg/kg Ni)
(Willaert 1988)
LOEC -35 58 (single dose) 6.05 2.09 (OC)
8.5 Sandy loam soil (8.5 mg/kg Ni)
EC10 220 8.1 2.33 (OC)
19.6 Heavy clay soil (20 mg/kg Ni)
NA = Not available; NC = Not calculated aStudies reported organic matter (OM) unless otherwise indicated, e.g., C (carbon) or OC (organic carbon). bUnits of Cation Exchange Capacity (CEC) are either meq(+)/100g or cmol(+)/kg. * Recalculated by Environment Canada using log-logistic model. **Provided by corresponding author, Fang-Jie Zhao, in 2012

156
Appendix 4. Toxicity of nickel to terrestrial invertebrates. Candidate data are screened according to whether they are considered "acceptable" (referred to as selected) or "unacceptable" (referred to as consulted) for deriving soil quality guidelines. Acceptable data that were actually used in SQGSC derivation are in bold and underlined in the “Selected” section of this appendix.
Organism Effect (exposure period) Endpoint
Effect magnitude
(%)
Effect concentratio
n (mg/kg) Form of nickel
Soil pH
% OM(a)
CEC (b) Test Substrate Reference
SELECTED
Earthworm (Eisenia foetida)
Mortality (2 weeks)
LC50 243 Ni(NO3)2 6.0 10 peat
Artificial soil ( 20% kaolinite clay; 69% fine sand; 1 % pulverized CaCO3)
(Neuhauser et al. 1985)
Earthworm (Lumbricus
Mortality (6 weeks) ***LC20 ***LC50
1007 2240
NiCl2 7.3 Sandy loam (Ma 1982)
rubellus) Mortality (12 weeks) ***LC20 ***LC50
305 821
Earthworm (Eisenia veneta)
Mortality (4 weeks)
LC10 LC50 LC100
247 684 1000
NiSO4 5.5-6.0
2.3 (TOC)
Loamy sand soil (sand 82%; silt 13%; clay 5%)
(Scott-Fordsmand et al. 1998)
Reproduction (cocoon production) (4 wks)
NOEC LOEC *IC25 EC10 EC50
-64
100 300 186 85 300
Springtail (Folsomia fimetaria)
Adult ♂ mort. (21 d) Adult ♀ mort. (21 d) Juvenile mort. (21 d)
LC10 LC50 LC10 LC50 LC10 LC50
645 922 427 786 701 859
NiCl2 5.5-6.0
2.3 (TOC)
Loamy sand soil (sand 82%; silt content 13%; clay 5%)
(Scott-Fordsmand et al. 1999)
Reproduction ( # juveniles) (21 d)
EC10 EC50 NOEC LOEC MATC
-51
173 450 300 500 387
Adult ♂ growth (surface area) (21 d) Adult ♀ growth (surface area) (21 d) Juvenile growth (surface area) (21 d)
NOEC NOEC EC10 NOEC LOEC
>1000 >1000 480 700 1000

157
Organism Effect (exposure period) Endpoint
Effect magnitude
(%)
Effect concentratio
n (mg/kg) Form of nickel
Soil pH
% OM(a)
CEC (b) Test Substrate Reference
Springtail (Folsomia candida)
Reproduction (# juveniles) (28 d)
NOEC LOEC ****IC25 EC50
-43
320 560 266 476
NiCl2 6 10 peat
OECD Guideline 207 (sand 70%; Kaolinite clay 20%)
(Lock & Janssen 2002)
Earthworm (Eisenia fetida)
Reproduction ( # cocoons) (21 d)
NOEC LOEC *IC25 EC50
-50
180 320 223 362
Mortality (21 d) NOEC >1000 Earthworm (Enchytraeus albidus)
Reproduction (# juveniles) (42 d)
NOEC LOEC ****IC25 EC50
-68
180 320 168 275
Mortality (21 d) LC50 510 Nematode (Caenorhabditis elegans)
Mortality (24 hr) LC50 2493 NR
7.8 5.1 28.4 ASTM (sand 80%; silt 12%; clay 8%)
(Boyd & Williams 2003)
Mortality (24 hr) LC50 1188 NR 6.1 1.4 2.4 Albany (sand 98%; silt 0%; clay 2%)
Mortality (24 hr) LC50 1202 NR 5.7 5.1 7.2 Cecil (sand 74%; silt 16%; clay 10%)
Nematode (Caenorhabditis elegans)
Mortality (NR) LC50 348 NiCl2 ~4 10 peat
ASTM loam (sand 70%; clay 20%)
(Peredney & Williams 2000a)
Mortality (NR) LC50 LC50
165 387
NiCl2 Ni(NO3)2
~4 2.46 (C)
6.23 Cecil (sand 60.2%; clay 10.4%)
Mortality (NR) LC50 LC50
44 144
NiCl2 Ni(NO3)2
~4 0.67 (C)
1.58 Tifton (sand 88.6%; clay 3.6%)
Nematode (Caenorhabditis elegans)
Mortality (24 hr) LC50 797 Ni(NO3)2 4 ± 0.5
10 peat
ASTM (sand 70%; Kaolin clay 20%)
(Peredney & P. L. Williams 2000b)
Nematode (multiple species)
Abundance (1-2 weeks)
LOEC *IC25
-18 100 138
NiSO4 4.1 1.9 (C) 3.6 sandy loam (sand 85%; silt 11%; clay 4%; 4.1 mg/kg Ni background)
(Korthals et al. 1996)
CONSULTED
Earthworm (Eisenia foetida)
Cocoon production (6 weeks)
EC40 250 NA NA soil mixed with horse manure
(Neuhauser et al. 1984)
Growth rate (BW) (6 weeks)
EC32 500 NA NA
Earthworm (Eisenia foetida)
Growth rate (8 weeks)
EC 500 Ni(C2H3O2)2
NA soil mixed with horse manure
(Malecki et al. 1982)

158
Organism Effect (exposure period) Endpoint
Effect magnitude
(%)
Effect concentratio
n (mg/kg) Form of nickel
Soil pH
% OM(a)
CEC (b) Test Substrate Reference
EC 500 NiCO3 EC 200 NiCl2 EC 500 Ni(NO3)2 EC 40,000 NiO EC 500 NiSO4 Earthworm (Eisenia foetida)
Reproduction (20 weeks)
EC 300 Ni(C2H3O2)2
NA soil mixed with horse manure
EC 2000 NiCO3 EC 200 NiCl2 EC 500 Ni(NO3)2 EC 40 000 NiO EC 500 NiSO4 Springtail (Folsomia candida)
Mortality (35 d)
LC50 246 NiCl2 5.8 3.9 Sandy soil (clay 5.1%; soil treated with acetone as a negative control)
(Broerse & van Gestel 2010)
NA = Not available; NC = Not calculated aStudies reported organic matter (OM) unless otherwise indicated, e.g., C (carbon) or TOC (total organic carbon). bUnits of Cation Exchange Capacity (CEC) are either meq(+)/100g or cmol(+)/kg. *Recalculated by Environment Canada using log-logistic model. ***Recalculated by Environment Canada using Probit analysis (no log transformation). ****Recalculated by Environment Canada using linear regression (no log transformation)

159
Appendix 5. Toxicity of nickel to mammals
Organism M/F Effect Endpoint Concentration in food (mg/kg) Form of nickel Exposure
Period Estimated Dose (mg/kg bw per day) Reference
Beagle dog M/F Mortality No effect 2500 NiSO4 2 years 83 (Ambrose et al. 1976)
Growth EC50 2500 83
Calf (Holstein) M Mortality No effect 5 NiCl2 140 days 0.2 (Spears et al. 1986) Growth No effect 5 0.2 Feed uptake No effect 5 0.2 Urease activity No effect 5 0.2
Calf (Holstein and Brown Swiss)
M Growth NOEL (4% reduction)
250 NiCO3 56 days 6.8 (O’Dell et al. 1971)
LOEL (45% reduction)
1000 13.77
Calf (Holstein) M Growth NOEL(2.6% reduction)
250 NiCO3 56 days 7* (O’Dell et al. 1971)
LOEL(44% reduction)
1000 14.6*
Mouse M/F Mortality LD50 -- Ni(C2H3O2)2 NA 420* (Haro et al. 1968)
Rat M/F Mortality LD50 -- Ni(C2H3O2)2 NA 350* (Haro et al. 1968)
Mouse (Webster) M Growth EC24 1600 Ni(C2H3O2)2 4 weeks 250 (Weber & Reid 1968) F Growth EC16 1600 293 M Feed uptake EC8 1100 208 F Feed uptake No effect 1600 293
Rat M/F Mortality LD50 -- Ni(NO3)2 NA 1620* (NAS 1975)
Rat (Sprague-Dawley)
M Growth NOEL (3.6% reduction)
111.75 mg/L NiSO4 13 weeks 11.7 (Obone et al. 1999)
LOEL (4.2% reduction)
223.5 mg/L 23.4
Rat (Wistar) M Growth NOEL (2.3% reduction)
104.9 NiCl2 31 d 7.8 (Oosting et al. 1991)
Rat (Wistar) M Growth LOEL (9% reduction)
100 (one test dose)
NiCl2 31 d 8.2 (Oosting et al. 1991)
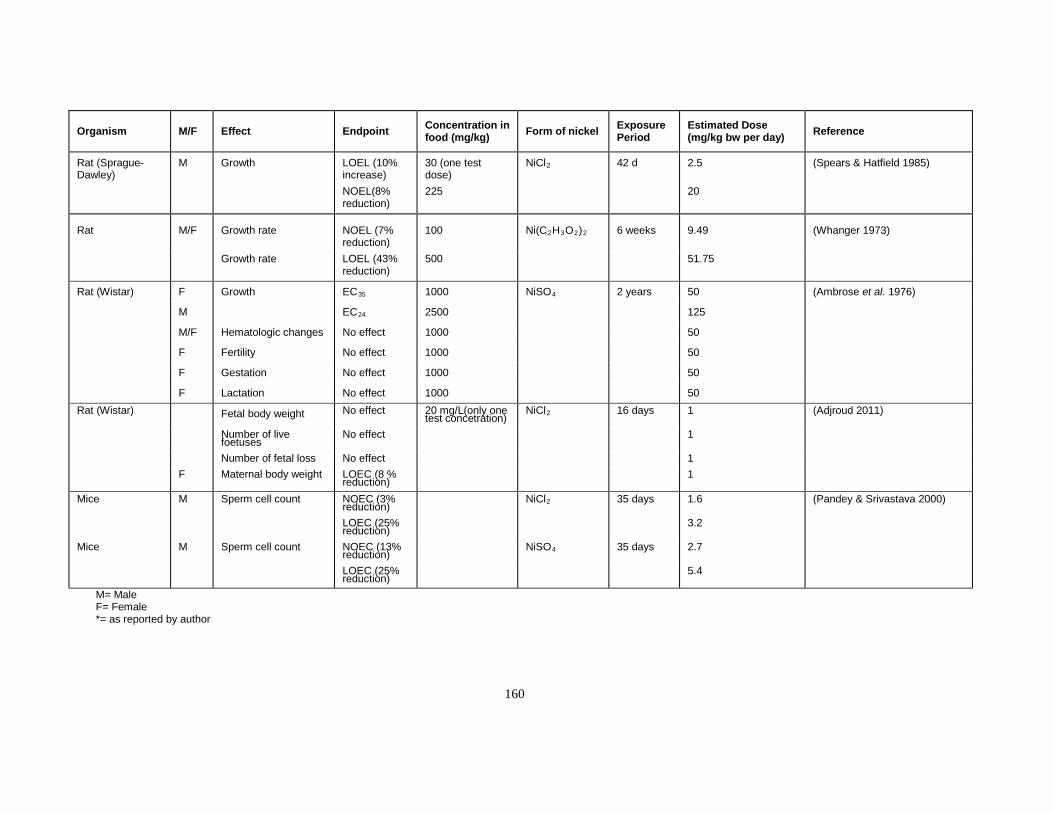
160
Organism M/F Effect Endpoint Concentration in food (mg/kg) Form of nickel Exposure
Period Estimated Dose (mg/kg bw per day) Reference
Rat (Sprague-Dawley)
M Growth LOEL (10% increase)
30 (one test dose)
NiCl2 42 d 2.5 (Spears & Hatfield 1985)
NOEL(8% reduction)
225 20
Rat M/F Growth rate NOEL (7% reduction)
100 Ni(C2H3O2)2 6 weeks 9.49 (Whanger 1973)
Growth rate LOEL (43% reduction)
500 51.75
Rat (Wistar) F Growth EC35 1000 NiSO4 2 years 50 (Ambrose et al. 1976)
M EC24 2500 125
M/F Hematologic changes No effect 1000 50
F Fertility No effect 1000 50
F Gestation No effect 1000 50
F Lactation No effect 1000 50 Rat (Wistar) Fetal body weight No effect 20 mg/L(only one
test concetration) NiCl2 16 days 1 (Adjroud 2011)
Number of live foetuses
No effect 1
Number of fetal loss No effect 1 F Maternal body weight LOEC (8 %
reduction) 1
Mice M Sperm cell count NOEC (3% reduction)
NiCl2 35 days 1.6 (Pandey & Srivastava 2000)
LOEC (25% reduction)
3.2
Mice M Sperm cell count NOEC (13% reduction)
NiSO4 35 days 2.7
LOEC (25% reduction)
5.4
M= Male F= Female *= as reported by author

161
Appendix 6. Toxicity of nickel to birds. Organism M/F Effect Endpoint Conc. in food
(mg/kg) Form of nickel
Exposure Period
Estimated Dose (mg/kg bw per day)
Reference
Mallard ducks M/F mortality No effect 800 NiSO4 90 d 80 (Eastin Jr. & O’Shea 1981)
growth rate No effect 800 80 histopathological
changes No effect 800 80
Blood chemistry changes
No effect 800 80
Mallard ducks M/F mortality LC75 1200 NiSO4 60 d 120 (Cain & Pafford 1981) F growth rate EC23 1200 90 d 120 Mallard ducks F egg production No effect 800 NiSO4 90 d 80 (Eastin Jr. & O’Shea
1981) hatchability No effect 800 80 normal duckling
@ day 14 No effect 800 80
Chicks F Growth NOEL (16% reduction)
400 NiCl2 2 weeks 51.7 (Hill 1979)
LOEL(33% reduction)
800 111.9
Chicks (Hubbard broiler)
M/F growth rate EC18 500 NiSO4 28 d 53 (Weber & Reid 1968)
EC14 500 Ni(C2H3O2)2
48
Chicks (White Plymouth rock)
M mortality LC50 900 NiCl2 21 d 90 (Ling & Leach 1979)
growth rate EC14 300 30 Anemia EC23 1100 110
Laying hens (ISA Brown)
F Growth NOEC (6% reduction)
0.2 mg NiCl2/ L
NiCl2 28 d 0.004 (Arpasova et al. 2007)
LOEC (36% reduction)
2 mg NiCl2/ L 0.051
Egg weight NOEC (4% increase)
0.2 mg / L 0.004

162
Organism M/F Effect Endpoint Conc. in food (mg/kg)
Form of nickel
Exposure Period
Estimated Dose (mg/kg bw per day)
Reference
LOEC (18% reduction)
2 mg / L 0.051
Egg quality (eggshell weitgth)
17% reduction 2 mg / L 0.051
Brolier chick M Growth NOEC (6% reduction)
123.5 NiCl2 42 d 5.1 Martinez and Diaz, 1996
LOEC (14% reduction)
247 9.5
26% reduction 474 19.1
Warren hens F Reproduction (egg weight)
NOEC (3% reduction)
500 NiSO4 60 d 40.8 Meluzzi et al. 1996
Reproduction (egg shell weight)
NOEC (3% reduction)
500 40.8
M= Male F= Female EC= The EC endpoints represent the effects concentration as calculated byEnvironment Canada from the data presented by the author(s) LC50= Lethal concentration to 50% of the population * = as reported by author

163
Appendix 7. Terrestrial bioconcentration factors.
Pathway Tissue type pH OMa
(%) CECb Soil type
Tissue conc.
(mg/kg)
Soil conc.
(mg/kg) BCF Reference
food-beetle (Pterostichus oblongopunctatus)
whole body 0.06 (geomean of 5 test concentrations; range 0.03-0.07)
(Bednarska & Laskowski 2008)
leaf litter - Isopod (Porcellio scaber - hepatopancreas)
2.4 (geomean of 3 test concentrations)
(Tarnawska et al. 2007)
soil - earthworm 0.1 (Neuhauser et al. 1985) soil - earthworm 0.1 (Pietz et al. 1984) soil - earthworm 1.6 (Gish & Christensen 1973) soil - earthworm 0.3 (Ma 1982) Geometric mean for invertebrates 0.30 soil - corn (Zea mays) 0.003 (Grain) (Petruzzelli et al. 1989) 0.01 (Roots) Soil – barley (Hordeum vulgare L.)
Whole plant at emergence
5.6 0.8 (OC)
11.8 medium clay soil
10.12 11 0.92 (Molas & Baran 2004)
soil - corn (Zea mays) Whole plant at 5 weeks
6.8 2.16 5.7 Sand 15 16 19 16 19 25
8 17 31 73 96 155
1.875 0.94 0.61 0.22 0.198 0.16 (geomean = 0.44)
(Traynor & Knezek 1973)
Soil – barley (Hordeum vulgare L.)
Whole plant at emergence
5.1 1.2 (OC)
12.3 medium clay soil
8.86 18.5 0.47 (Molas & Baran 2004)
Soil - fenugreek root 1.32 (geomean of 12 treatments)
(Parida et al. 2003)
shoot 0.82 (geomean of 14 treatments)
soil - corn plants 0.1 (Sadiq 1985) soil - winter wheat (Triticium aestivum L.)
0.14 (Qian et al. 1996)
soil - alfalfa (Medicago sativa L.)
0.22

164
Pathway Tissue type pH OMa
(%) CECb Soil type
Tissue conc.
(mg/kg)
Soil conc.
(mg/kg) BCF Reference
soil - soybean plant (Glycine max L.)
0.4 (shoot) 5.3 (root)
(Vesper & Weidensaul 1978)
soil - ryegrass (Lolium perenne)
1.7 (Khalid & Tinsley 1980)
soil - ryegrass (Lolium hybridum)
1.0 (Allinson & Dzialo 1981)
soil - oat (Avena sativa L.)
0.2 (straw) 0.4 (seed)
(Allinson & Dzialo 1981)
soil - cotton plants 0.7 (leaf) (Rehab & Wallace 1978) 0.3 (stem) Soil -lettuce leaves 4.9 8 Steinhof 5.6
34 80 102 128
16 29 46 60 81
0.35 1.17 1.74 1.7 1.58
(Gupta et al. 1987)
5.6 41 Gänsemos
5.6 19 47.2 70.8
17 84 172 387
0.33 0.23 0.27 0.18
7.7 10 Erlach 5.6 42 49 76 95
26 141 199 256 348
0.33 0.30 0.25 0.30 0.27
6.6 20 Gasel 5.6 37 50 62
21 169 261 503
0.27 0.22 0.19 0.12 (geomean for all soils = 0.37)
Geometric mean for plants 0.34 aStudies reported organic matter (OM) unless otherwise indicated, e.g., C (carbon) or TOC (total organic carbon). bUnits of Cation Exchange Capacity (CEC) are either meq(+)/100g or cmol(+)/kg.

165
Appendix 8. Receptor Characteristics of the Canadian General Population1
Statistic Breast fed Infant
(0 to 6 mo.) Non-breast fed Infant (0 to 6 mo.)
Toddler (7 mo. to 4 yr)
Child (5 to 11 yr)
Teen (12 to 19 yr)
Adult (20+ yr)
Body Weight
(kg)
Minimum 2.8 2.8 7.1 14.2 30.0 38.1 Maximum 21.5 21.5 35.9 71.5 112.2 126.5 Mean 8.2 8.2 16.5 32.9 59.7 70.7 Std. dev. 2.9 2.9 4.5 8.9 13.5 14.5 Distribution Lognormal Lognormal Lognormal Lognormal Lognormal Lognormal
Skin Surface Area
Hands (cm2)
Minimum 242 242 299 396 556 614 Maximum 416 416 614 863 1142 1262 Mean 320 320 430 590 800 890 Std. dev. 30 30 50 80 100 110 Distribution Lognormal Lognormal Lognormal Lognormal Lognormal Lognormal
Skin Surface Area
Arms (cm2)
Minimum 200 200 396 797 1409 1588 Maximum 1367 1367 1882 2645 3465 3906 Mean 550 550 890 1480 2230 2510 Std. dev. 180 180 240 300 340 360 Distribution Lognormal Lognormal Lognormal Lognormal Lognormal Lognormal
Skin Surface Area
Legs (cm2)
Minimum 539 539 907 1604 3042 3753 Maximum 1496 1496 3012 5655 7945 8694 Mean 910 910 1690 3070 4970 5720 Std. dev. 160 160 340 660 810 760 Distribution Lognormal Lognormal Lognormal Lognormal Lognormal Lognormal
Soil Loading to exposed skin2
Hands Surfaces other than hands
(kg/cm2/event)
Mean
1.0 x 10⁻⁷
1.0 x 10⁻⁸
1.0 x 10⁻⁷
1.0 x 10⁻⁸
1.0 x 10⁻⁷
1.0 x 10⁻⁸
1.0 x 10⁻⁷
1.0 x 10⁻⁸
1.0 x 10⁻⁷
1.0 x 10⁻⁸
1.0 x 10⁻⁷
1.0 x 10⁻⁸
Time spent outdoors
(hr/d)
Minimum 0.000 0.000 0.000 0.000 0.000 0.000 Maximum 3 3 3 4 9.45 10.76 Mean/Mode 1.25 1.25 1.25 2.2 1.42 1.43 Std. dev. N/A N/A N/A N/A 1.17 1.28 Distribution Triangular Triangular Triangular Triangular Lognormal Lognormal
1Mean receptor characteristics from Richardson (1997) and CCME (2006) unless otherwise stated. 2Soil loadings from (Kissel et al. 1998; Kissel et al. 1996) as referenced in CCME (2006).

166
Appendix 9. Typical Intake Values for Environmental Media by the Canadian General Population1
Intake rates1
Statistic Breast fed
Infant (0 to 6 mo.)
Non-Breast fed Infant
(0 to 6 mo.)
Toddler (7 mo. to 4 yr)
Child (5 to 11 yr)
Teen (12 to 19 yr)
Adult (20+ yr)
Air inhalation
(m3/d)
Minimum 1.1 1.1 4.6 8.3 9 9.5 Maximum 4.4 4.4 15.6 25 28.9 33 Mean 2.18 2.18 8.31 14.52 15.57 16.57 Std. dev. 0.59 0.59 2.19 3.38 4.00 4.05 Distribution Lognormal Lognormal Lognormal Lognormal Lognormal Lognormal
Water Ingestion2
(L/d)
Minimum N/A 0.1 0.2 0.2 0.2 0.2 Maximum N/A 0.7 0.9 1.1 2 2.7 Mean N/A 0.3 0.6 0.8 1 1.5 Std. dev. N/A 0.2 0.4 0.4 0.6 0.8 Distribution N/A Lognormal Lognormal Lognormal Lognormal Lognormal
Soil Ingestion3 (kg/d)
2.0 x 10⁻⁵ 2.0 x 10⁻⁵ 8.0 x 10⁻⁵ 2.0 x 10⁻⁵ 2.0 x 10⁻⁵ 2.0 x 10⁻⁵
Soil Inhalation4
(m3/d) 1.66 x 10⁻⁹ 1.66 x 10⁻⁹ 6.32 x 10⁻⁹ 1.10 x 10⁻⁸ 1.10 x10⁻⁸ 1.26 x10 -8
Indoor Settled Dust Ingestion
(kg/d)
Minimum 8.0 x 10⁻⁸ 8.0 x 10⁻⁸ 0.00 0.00 0.00 0.00 Maximum 1.77 x 10⁻³ 1.77 x 10⁻³ 9.4 x 10⁻⁴ 8.33 x 10⁻⁴ 3.39 x 10⁻⁵ 6.20 x10⁻⁵ Mean 3.74 x 10⁻⁵ 3.74 x 10⁻⁵ 4.06 x 10⁻⁵ 3.17 x 10⁻⁵ 2.07 x 10⁻⁶ 2.51 x 10⁻⁶ Std. dev. 8.33 x 10⁻⁵ 8.33 x 10⁻⁵ 5.22 x10⁻⁵ 4.58 x10⁻⁵ 2.32 x 10⁻⁶ 3.06 x 10⁻⁶ Distribution Lognormal Lognormal Lognormal Lognormal Lognormal Lognormal
Food5
µg/kg-d-1
Minimum 0.5 5.590 0.000 0.000 0.000 0.000 Maximum 1 19.475 23.981 17.744 10.667 8.323 Mean/Mode 0.7 12.533 11.142 8.148 4.956 3.945 Std. dev. N/A 2.314 4.280 3.199 3.945 1.459 Distribution Triangular Lognormal Lognormal Lognormal Lognormal Lognormal
1Probability distribution function curves for receptor intake rates from HC (2011) unless otherwise stated. 2Breast fed infants are assumed to be exclusively breastfed for 6 months and are not given drinking water. Infants that are not breastfed are assumed to consume 0.3L of drinking water based on HC 2004. 3Soil ingestion rates from CCME (2006). 4Soil inhalation rates based on (Allan & Richardson 2008) and a PM10 concentration of 0.76 µg/m3 (CCME 2006). 5Breastfed infants are assumed to be exclusively breastfed for 6 months; non-breastfed infants are assumed to be fed a mixture of milk, formula and table food.

167
Appendix 10. Estimated Total Daily Nickel Intake for the Canadian General Population1
Daily Nickel Intake in µg/kg bw/day
Medium Typical Nickel Levels
0 to 6 mo.
Infant
7 mo. - 4 yrs
Toddler
5-11 yrs
Child
12 -19 yrs
Teenager
20 + yrs
Adult
Air2
Outdoor air Indoor air
0.00094 μg/m3
0.0072 µg/m3
0.00000476
0.00104
0.00000900
0.00193
0.0000117 0.00167
0.00000400 0.000993
0.00000353 0.000899
Drinking water3 2.85 µg/L 0.05254 0.0462 0.0326 0.0228 0.0294 Settled indoor dust4 Ingestion Dermal
48.1 µg/g
0.0726 0.0200
0.0571 0.0143
0.0206 0.0109
0.000864 0.00581
0.000853 0.00545
Soil5
Ingestion Inhalation Dermal
26.8 µg/g
0.0369
0.000000156
0.00775
0.0717
0.000000284
0.00558
0.00896
0.000000377
0.00422
0.00486
0.000000126
0.00226
0.00413
0.000000113
0.00212
Food6
1.707
12.18
10.3
7.69
4.67
3.76
Total intake (µg/kg-bw/day)9 1.81 - 12.4 10.7 7.7 4.7 3.8
1Median estimated daily intakes for each age class were derived from probability distribution functions based on typical concentrations of air (indoor and outdoor), drinking water, settled indoor dust, soil and food listed above. Receptor characteristic distribution, or point estimates listed in Appendix 8 and intake rates listed in Appendix 9. 2Outdoor air PM2.5 concentrations from NAPS 2000-2009 database for urban and rural centers in Canada (HC 2011). 3Based on mean nickel concentrations of drinking water from Ontario, Saskatchewan, Newfoundland and Labrador (HC 2011). 4Based on mean total nickel in indoor settled dust from HC (2011) and dust ingestion rates from (Willson et al. 2012). 5Based on data (7398 samples) compiled by the Geological Survey of Canada (HC 2011; Grunsky 2010; Rencz et al. 2006). 6Based on the results of the Total Diet Studies (2000-2007) conducted by Health Canada Food Directorate. 7Based on infants exclusively breast fed for 6 months. 8Based on infants fed a mixture of milk, formula and table food. 9Note that total median EDIs for each receptor group will not equal the sum of the median EDIs listed for the five media listed because the total EDI was derived from individual probability distribution functions.

168
Appendix 11. Alternative approach for calculating human health soil quality guidelines for Ni when EDI > TDI. Overview: This appendix clearly lays out the details of an alternative approach for calculating human health soil quality guidelines when the EDI>TDI. This approach is summarised at the end of this appendix and in Figure 2, also at the end of this appendix. It seeks to minimize human exposure to the extent possible without resulting in an SQG less than the mean background soil concentration for an uncontaminated site (which is a practical lower limit for SQGs). For the purposes of soil quality guidelines derivation, the recommended procedure when the EDI>TDI is to:
1. Ensure the mean or best estimate of the mean EDI and TDI chosen are appropriate; 2. Calculate the SQG based on the 10% EDI equation; 3. Calculate the SQG based on the 20% TDI equation; 4. Choose the lower of the 10% EDI or 20% TDI calculated value and compare it to the BSC. 5. If the lowest of the calculated value chosen from the 10% EDI or 20% TDI is greater than the BSC, use this value as the provisional SQGDH. If the calculated value is less than the BSC, set the SQGDH to the BSC. (See figure 2 for pictorial explanation. The blue path shows the approach recommended in this document, the yellow path illustrates the CCME soil protocol (CCME 2006) when TDI > EDI, and the green path is additional recommendations when the EDI is >90% of the TDI.)
Explanation for the removal of the soil allocation factor. The EDI1 terms consider the contribution of background soils and the soil allocation factor as part of its calculation. Removing the SAF is similar to setting the SAF to 1 instead of 0.2. Equation 2 (see below) incorporates the background soil and soil allocation factor in the 10% EDI term. If a soil allocation factor of <1 is used, this would decrease the allowable EDI contribution from soils to 0.1 x SAF. For example, if the default SAF of 0.2 is used, this is results in an EDI contribution from soil to be 0.02 of the total EDI. The use of a SAF of 1 results in an EDI contribution from soil of up to 0.10 of the total EDI. It seems reasonable that a 10% 1 The EDI is based on the sum of estimated human exposure to a substance through contact with various media (food, drinking water, soil, air, consumer products and dust). For illustrative purposes, the soil dermal EDI can be calculated using the following equation:
Where: Cs = Concentration of substance in soil (mg/kg) SA = surface area for hands, arms and legs (cm2) SL = soil loading for hands, arms and legs (kg/cm2/event) RAFderm = Relative Dermal Absorption Factor (unitless) EF = event frequency (1 event/d) BW = Body weight (kg)
( ) ( ) ( )[ ]BW
mgugEFRAFSLSACSLSACSLSACdkgug dermLLSAAsHHs /1000// ×××××+××+××=

169
increase in EDI is within the variability of observed data from various media. (The GSC reported a provisional range of <2 to 214 mg/kg Ni in background till concentrations - Rencz 2006). Justification for the use of equation #2. Equations 1, 2 and 3 (described below) all follow the general CCME SQG equation with the (TDI-EDI) term replaced with a 0.1 EDI term. Equation 2 is the simplest of the 10% EDI equations. The BSC can be removed from the equation because the EDIs are already above the TDI in cases where this approach is considered, and the addition of the BSC will not add any more precision to the calculation. If the value derived using Equation 2 is above the BSC, the SQG is set to the BSC by default. For Ni, the EDI (for the toddler) and TDI terms are very similar (10.6 vs. 11 µg/kg bw/day) and the background soil concentration is higher than both the EDI and TDI terms, but also very low. Comparing SQGs derived for Ni using the three equations, the resulting SQGs from equations 1 and 3 are identical and similar using equation 2, with the differences mainly attributed to the exclusion of the BSC from the equation. Background: CCME (2006) outlines a protocol that should be used in the derivation of environmental and human health soil quality guidelines (SQGs). For threshold substances, the CCME equation used to derive the human health soil quality guideline takes the general form:
𝑆𝑆𝑆𝑆𝑆𝑆𝐷𝐷𝐷𝐷 =(𝑇𝑇𝑇𝑇𝑇𝑇 − 𝐸𝐸𝑇𝑇𝑇𝑇) × 𝑆𝑆𝑆𝑆𝑆𝑆 × 𝐵𝐵𝐵𝐵
𝑇𝑇𝐼𝐼 × 𝑆𝑆𝑆𝑆 × 𝐸𝐸𝑇𝑇+ 𝐵𝐵𝑆𝑆𝐵𝐵
where: SQGDH = Human Health Soil Quality Guideline TDI = Tolerable Daily Intake (µg/kg bw/day) EDI = Estimated Daily Intake (µg/kg bw/day) SAF = Soil Allocation Factor (unitless) BW = Body Weight (kg) IR = Ingestion Rate of medium of concern (kg/day) AF = Absorption Factor for medium of concern (unitless) ET = Exposure Term (unitless) BSC = Background Soil Concentration RTDI = (TDI-EDI) Residual Tolerable Daily Intake (µg/kg bw/day) To derive the guidelines for threshold substances, it is necessary to assign an allowable proportion of the total chemical exposure to the soil medium in the equation listed above. The Tolerable Daily Intake (TDI) represents the total dose to which it is believed a human receptor can be safely exposed continuously over a lifetime without any deleterious effects. The EDI is an

170
estimate of the total background exposure of human receptors to the substance, based on a multi-media exposure assessment. The CCME SQGTG considers five primary media (i.e., air, water, soil, food and consumer products) to which people are potentially exposed. The CCME SQGTG proposed that a default value of 20% (0.2) be allotted to each of the five exposure media. For the purposes of deriving soil quality guidelines, 20% the RTDI is apportioned to soils so that the Soil Allocation Factor (SAF) is arbitrarily set at 0.2 and allows for 80% of the total incremental exposure from other media (i.e., food, air, water and consumer products). However, some soil contaminants may not be normally present in one or more of the other exposure media. If it can be proven that exposure to one or more of the remaining media are not relevant for the substance, the SAF may be adjusted upward from the 0.2 default by dividing the total exposure (100%) by the number of applicable exposure media so that:
𝑆𝑆𝑆𝑆𝑆𝑆 =100%
# 𝑜𝑜𝑜𝑜 𝑎𝑎𝑎𝑎𝑎𝑎𝑎𝑎𝑎𝑎𝑎𝑎𝑎𝑎𝑎𝑎𝑎𝑎𝑎𝑎 𝑚𝑚𝑎𝑎𝑚𝑚𝑎𝑎𝑎𝑎
For some substances where the EDI exceeds the TDI, the equation used by CCME to derive the human health soil quality guideline would not apply, as the SQG derived would result in a negative number. In these cases, the CCME (2006) protocol states that: When the EDI is greater than the TDI (RTDI = 0), theoretically the population cannot be safely subjected to any increased exposure. In these cases, the provisional soil quality guideline should be set at the background soil concentration or practical quantification limit for that contaminant. Issue: During the course of developing SQGs, some substances were found to have estimated background exposure rates greater than the toxicity benchmarks established for human health. If the EDI exceeds TDI, this implies that exposure to typical background levels of the substance exceeds a dose considered protective of human health. However, this does not necessarily mean that health effects are expected in the population at large because there is usually considerable uncertainty in the EDI and TDI values. EDIs are derived from estimates of the mean concentrations of the substance in exposure media (i.e., air, water, soil and food) and estimated mean or typical intake rates of the substance of concern via the various exposure media. Uncertainty in the mean EDI or best estimate of the mean EDI can arise from various sources such as limited availability of data for chemical concentrations in various media and the lack of or uncertainty in intake rates for food, water, air, and soil. In the case of food intakes, assumptions employed by the CCME SQGTG may not reflect more current consumption patterns (Meridian 2007). In situations where EDI>TDI, human health SQGs have either been set at background soil concentration levels or they have not been established at all. CCME (2006) does recognize that

171
this may result in a fairly restrictive criterion and as a result, they suggest that any models used to develop the EDI should be checked to ensure their accuracy, and to assess any regional or site-specific factors. In cases where EDI>TDI, establishing human health soil remediation guidelines to background soil concentrations or practical quantification limits may not be pragmatic or practical and may result in high remediation costs at sites without any significant benefit to the protection of human health. Approach: Recognising that setting a human health SQG to background soil concentration levels or practical quantification limits may not be practical, draft supplemental guidance document that outlined a general approach that could be used in cases when EDI>TDI was prepared (Meridian 2007). Independent to the work completed by Meridian, Wilson Scientific Consulting Inc. (Wilson 2009) also addressed this issue for two substances (nickel and zinc). The processes and equations derived independently by Meridian and Wilson Scientific were very similar. Based on this work, an alternative to the approach outlined in the CCME (2006) protocol document for establishing human health SQGs in cases where the EDI>TDI for threshold substances and where exposure to soil is a minor contributor to the EDI was proposed. Soil quality guidelines for nickel (Ni) are used as examples of SQGs that could be derived using the options presented below for critical receptors (typically a toddler for residential and commercial exposure scenarios). If the EDI<TDI for the relevant scenario and receptor group, then the standard CCME equation applies and is used to derive the human health SQG for that scenario. For Ni, the standard CCME (2006) SQGDH equation would apply for industrial sites since the adult is considered the critical receptor and in that scenario, the TDI for both of these substances is greater than the EDI for the adult receptor. For the scenarios where the EDI>TDI, the “TDI - EDI” term, also known as the Residual TDI (RTDI), in the CCME human health SQG equation, was modified and replaced with 10% EDI. EDI estimates are subject to uncertainty and variability of the data upon which the EDI estimate is based. This includes uncertainty due to limited data on chemical concentrations in some environmental media and intake rates. In addition to uncertainty, chemical concentrations in various media and intake rates can be highly variable. Background concentrations can vary by orders of magnitude between regions in some media. For example, Rencz et al (2006) report a mean Ni soil concentration of 26.8 mg/kg, a median concentration of 16 mg/kg, and a provisional range of <2 to 214 mg/kg in background soil concentrations. Most other jurisdictions apply a target hazard index of 0.2 to the TDI, which is assumed to be sufficiently protective, irrespective of background exposure and exposure through other media at the site, when setting soil quality guidelines for inorganic substances. The 20% TDI equation was included to allow comparison with the SQG calculated using 10% EDI.

172
Exposure through food ingestion, which can comprise the largest portion of the EDI, is affected by variability in chemical concentrations within and between food types as well as the variability in diet compositions between individuals. A cursory examination of the estimated total daily intake of nickel from food by age class from the 2000 to 2007 Canadian Total Diet Study shows that food contributes approximately 94 to 96% of the total EDI and standard deviations of mean intakes range from approximately 18% to 37%, with the highest variability in intake rates in infants and toddlers. Based on the variability seen in food data and soil data, a 10% increase in the EDI appears to be well within the variability observed in the data from various media. Sigal et al (2006) conducted a probabilistic evaluation of EDIs for three metals and they found that the 95th percentile EDI was more than 50% greater than the mean EDI in all cases. For most naturally occurring substances, the contribution of soil ingestion to the EDI is relatively small (i.e., <1%) compared to the contribution of exposure from food and water based on EDIs (Meridian 2006). Therefore, given the variability and uncertainty in the EDI, an incremental increase in exposure of 10% of the EDI is not expected to represent a biologically significant increase in exposure so long as the EDI represents a ‘typical’ exposure and is not a worst-case exposure (Meridian 2006). Equation 1 - (Meridian 2007) Using the existing CCME human health SQG equation specified in the protocol document, Meridian modified the equation by replacing the RTDI term (i.e., TDI - EDI) with 0.1 EDI so the SQG equation becomes:
𝑆𝑆𝑆𝑆𝑆𝑆𝐷𝐷𝐷𝐷 =(0.1 × 𝐸𝐸𝑇𝑇𝑇𝑇) × 𝑆𝑆𝑆𝑆𝑆𝑆 × 𝐵𝐵𝐵𝐵
𝑇𝑇𝐼𝐼 × 𝑆𝑆𝑆𝑆 × 𝐸𝐸𝑇𝑇+ 𝐵𝐵𝑆𝑆𝐵𝐵
The premise of this equation is that based on a multi-media exposure assessment, a 10% incremental increase in the mean EDI due to exposure to soil concentrations in excess of background soil concentration (BSC), is not expected to result in a significant shift in the range and frequency of EDI estimates across the population as a whole. Nor is it expected to result in any deleterious effects to human health. The contribution of soil to total exposure is often small (e.g., <1% of EDI) relative to other media and a small increase in soil concentration should only result in a small (perhaps negligible) increase in the EDI, so long as the EDI represents a ‘typical’ exposure and not a worst case exposure. The default SAF used in the CCME process is typically set at 0.2. However, as stated in CCME (2006) the SAF can be adjusted upwards if there is rationale which shows exposure to one of the five media listed is insignificant. In the case of Ni and Zn, it is proposed that consumer products would not be a significant source of Ni or Zn exposure on contaminated sites, relative to uncontaminated sites and that if this is a reasonable assumption, exposure to media on a contaminated site can be allocated as 0.25 to drinking water, 0.25 to food and 0.5 to direct exposure via soil ingestion, dermal contact and air.

173
Equation 2 - Wilson Scientific equation The equation derived by Wilson Scientific is similar to the Meridian equation above except the BSC concentration and SAF were not included in the equation, so that:
𝑆𝑆𝑆𝑆𝑆𝑆𝐷𝐷𝐷𝐷 =(0.1 × 𝐸𝐸𝑇𝑇𝑇𝑇) × 𝐵𝐵𝐵𝐵𝑇𝑇𝐼𝐼 × 𝑆𝑆𝑆𝑆 × 𝐸𝐸𝑇𝑇
The EDI term considers the contribution of background soils as part of its calculation, and as such, the BSC was not included in the equation. In other words, the SAF is set to 1, and is included in the (0.1 x EDI) term. In cases where the contribution of soil to total exposure is not significant compared to the contribution relative to other media, the BSC is not expected to contribute significantly to the calculation of the SQG so that the derivation equation can be simplified by excluding the BSC and SAF terms from the equation. Equation 3 - Modified equation After review of the above proposed approaches, a modification was made based on the concept of using 10% of the EDI when EDI > TDI, and including the BSC term in the SQGDH derivation equation. One option was to subtract the soil contribution (EDIsoil) from the total EDI term since the contribution from the soil exposure pathway is accounted for in the BSC term in the equation so that:
𝑆𝑆𝑆𝑆𝑆𝑆𝐷𝐷𝐷𝐷 =[0.1 × (𝐸𝐸𝑇𝑇𝑇𝑇𝑡𝑡𝑡𝑡𝑡𝑡𝑡𝑡𝑡𝑡 − 𝐸𝐸𝑇𝑇𝑇𝑇𝑠𝑠𝑡𝑡𝑠𝑠𝑡𝑡)] × 𝑆𝑆𝑆𝑆𝑆𝑆 × 𝐵𝐵𝐵𝐵
𝑇𝑇𝐼𝐼 × 𝑆𝑆𝑆𝑆 × 𝐸𝐸𝑇𝑇+ 𝐵𝐵𝑆𝑆𝐵𝐵
Various SAFs (0.2, 0.5 and 1.0) were applied in the equation to look at the variability of SQGs derived for Ni, based on the contribution of EDI from soil ranging from 2% to 10%. The SAF of 0.2 is the CCME default specified in the protocol document (CCME 2006) under normal circumstances and is included for comparative purposes. Using a SAF of 0.2 will result in a 2% EDI in the numerator of the equation (e.g., 0.1x EDI x 0.2 x BW = 0.02 EDI x BW) The use of a SAF of 0.5 will result in a 5% EDI in the numerator of the equation (e.g., 0.1 x EDI x 0.5 x BW = 0.05 EDI x BW) A SAF of 1 will result in a 10% EDI in the numerator of the equation (e.g., 0.1 x EDI x 1 x BW = 0.1 EDI x BW). Equation 4 - 20% TDI To develop soil quality guidelines for the protection of human health, most other jurisdictions apply a target hazard index of 0.2 which is assumed to be sufficiently protective irrespective of

174
background exposure and exposure through other media at the site. In this equation, the background soil concentration is not included. The 20% TDI equation is:
𝑆𝑆𝑆𝑆𝑆𝑆𝐷𝐷𝐷𝐷 =(0.2 × 𝑇𝑇𝑇𝑇𝑇𝑇) × 𝐵𝐵𝐵𝐵𝑆𝑆𝑆𝑆 × 𝑇𝑇𝐼𝐼 × 𝐸𝐸𝑇𝑇
In any case where a proportion of the EDI is used, it is recommended that the above calculation should also be completed and that the SQG be based on the lower of the estimates. Calculations: For Ni, the EDI exceeds the TDI for residential and commercial exposure scenarios where the toddler is considered the critical receptor. Using the equations listed above, residential and commercial soil quality guidelines were calculated using SAFs of 0.2, 0.5 and 1.0 for comparative purposes where applicable. Nickel is considered a potential carcinogen via the inhalation pathway, so in this example the dermal absorption and oral ingestion pathways are considered together and the inhalation pathway is considered separately and not included here. The resulting values are listed in the table below: Residential scenario Critical receptor: Toddler
Ni RSQG
Equation 1 using SAF = 0.2 67 Equation 1 using SAF = 0.5 130 Equation 1 using SAF = 1.0 230 Equation 2 no BSC included 200 Equation 3 EDIsoil removed; SAF = 0.2 67 Equation 3 EDIsoil removed; SAF = 0.5 130 Equation 3 EDIsoil removed; SAF = 1.0 230 Equation 4 20% TDI 420 Commercial scenario Critical receptor: Toddler
Ni CSQG
Equation 1 using SAF = 0.2 88 Equation 1 using SAF = 0.5 180 Equation 1 using SAF = 1.0 330 Equation 2 no BSC included 310 Equation 3 EDIsoil removed; SAF = 0.2 90 Equation 3 EDIsoil removed; SAF = 0.5 180 Equation 3 EDIsoil removed; SAF = 1.0 330 Equation 4 20% TDI 640 Bold indicates equations and calculated values recommended for consideration when EDI>TDI

175
Industrial scenario Critical receptor: Adult
Ni ISQG
CCME equation 5100 20% TDI 7800 Discussion: For the example above, subtracting EDIsoil from the overall EDI does not affect the SQG because the contribution to the EDI from soil is not significant when compared to the exposure contribution from other media (i.e., food). This is shown by the resulting SQGs calculated using Equations 1 and 3 which are essentially the same. For the residential and commercial scenarios using toddlers as the critical receptor, all SQGs derived using the various 10% EDI equations (Equations 1, 2 and 3) were less than the calculated SQG using the 20% TDI equation (Equation 4). Therefore, a SQG calculated using any of these 10% EDI equations would be more conservative than what is currently being done in other jurisdictions that use a 20% TDI equation to derive SQGs. If a SAF of 1 is used, the SAF term essentially drops out of Equations 1 and 3. If, as stated earlier, it is accepted that a 10% increase in the EDI is within the variability observed in the various media and does not represent a biologically significant increase in exposure, the SAF term can be eliminated from the equations, without affecting the calculated SQG value significantly. In cases where the EDI is quite large in comparison to the TDI, exposure based on 10% of the EDI may result in exposure that exceeds the TDI, therefore, it is suggested that as a further check on the appropriateness of the 10% EDI equations, 20% of the TDI be calculated and that the lower of the two values (either calculation based on 10% of the EDI or 20% of the TDI) be used to establish the SQG. This approach is more conservative than any approach taken in other jurisdictions that establish SQGs for human health. Recommended approach to setting Human Health Soil Quality Guidelines when mean EDI > TDI: The CCME equation which utilises the TDI - EDI term is unique. Other jurisdictions that establish SQGs for human health typically derive SQGs based on 20% of the TDI without considering exposure from background levels. In situations where the EDI > TDI, and the background soil concentration is not expected to contribute significantly to exposure, the 10% EDI equation (Equation 2) should be considered. For the purposes of soil quality guidelines derivation, the recommended procedure when EDI>TDI is to:
1. Ensure the mean or best estimate of the chosen mean EDI and TDI are appropriate; 2. Using Equation 2, calculate the SQG based on 10% EDI;

176
3. Using Equation 4, calculate the SQG based on 20% TDI; 4. Choose the lower of the 10% EDI or 20% TDI calculated value (i.e., the lower of the two
values calculated from Equation 2 and 4) and compare it to the BSC. 5. If the lowest of the calculated value (from Equations 2 or 4) is greater than the BSC, use
this value as the provisional SQGDH. If the calculated value is less than the BSC, set the SQGDH to the BSC.
Note that the discussion and recommendations outlined thus far, only apply to direct contact pathways for inorganic threshold substances. In the case of Ni, these equations can be considered for oral and dermal exposure pathways. Ni is considered carcinogenic via the inhalation exposure pathway. Therefore, inhalation exposure is considered separately from oral and dermal exposure. Other considerations: During EDI > TDI discussions, another issue was identified: What about when the EDI approaches the TDI but does not exceed the TDI? Specifically, when the EDI is within 90% of the TDI, the term “TDI - EDI” can become quite small and result in a much lower SQG than if the EDI exceeded the TDI. Consequently, when EDI is estimated to be greater than 90% of the TDI, the following steps are recommended:
1. Calculate the SQG using the CCME (i.e., TDI - EDI) equation 2. Calculate the SQG using 10% EDI equation 2 3. Calculate the SQG based on the 20% TDI equation 4. Compare the SQGs derived from the CCME equation (step 1) and the 10% EDI
equation (step 2) and choose the higher of the two; 5. Compare the SQG (step 4) with the SQG derived using the 20% TDI equation (step
3) and use the lower of the two as the SQG. Due to the mathematics of the equations, it is possible to calculate a lower SQG using the “TDI - EDI” equation than if the SQG is calculated using one of the 10% EDI equations in cases where the EDI is slightly less than the TDI. However, it is difficult to justify treating a substance less stringently because the EDI is slightly lower than the TDI. Intuitively, the SQG should increase as the EDI decreases. The last step of comparing the higher of the two calculated SQGs using the CCME equation and the 10% EDI equation to the SQG calculated using the 20% TDI equation ensures that the resulting SQG chosen is less than 20% of the TDI which is used by most other jurisdictions that derive SQGs. The recommended procedure to follow when EDI is greater than TDI is summarised in Figure 2. Other issues for future discussion:
• The equations as described do not apply to volatile, organic or non-threshold substances, or substances with multiple relevant exposure pathways (i.e., direct contact, vapour

177
inhalation, drinking water). The equations would have to be modified and appropriate allocation factors would be determined and included in the equation to address relevant exposure pathways for those substances.
Figure 2: Approach for Deriving Human Health SQGs when EDI > TDI (for direct contact, inorganic threshold substances).

178
References CCME, 2006. A Protocol for the derivation of environmental and human health soil quality
guidelines. Canadian Council of Ministers of the Environment. Winnipeg, Manitoba. PN 1332
Meridian Environmental Inc. 2006. Development of an approach to deriving Human Health-based soil quality guidelines for non-carcinogenic substances where EDI exceeds TDI. Final Report. Project No 1689. Submitted to Sanya Petrovic, Environmental Health Assessment Services, Healthy Environments and Consumer Safety Branch, Health Canada. Contract No. HECS-SEP-BC/Yukon 05/06-04.
Meridian Environmental Inc. 2007. Supplemental guidance on developing human health soil quality guidelines when the estimated daily intake (EDI) exceeds the tolerable daily intake (TDI). Prepared for Contaminated Sites Division, Safe Environments Programme. Version 1.0 February 2007.
Meridian Environmental Inc. 2008. Evaluation of the effect of soil concentrations on the Estimated Daily Intake for Substances when the Estimated Daily Intake exceeds the Tolerable Daily Intake. Submitted to Mark Richardson, Contaminated Sites Division, Health Canada. Contract No. 4500173802.
Rencz, A.N, R.G. Garrett, S.W. Adcock and G.F. Bonham-Carter. (2006). Geochemical Background in Soil and Till. Geological Survey of Canada Open File 5084. 1 CD-ROM. Available at: http://geopub.nrcan.gc.ca/moreinfo_e.php?id=222148
Sigal, E.A., J.A. Archbold, G.M. Ferguson, C.M. Bacigalupo, D.R.J. Moore and G.M. Richardson. 2006. The development and application of probabilistic methods in the derivation of estimated daily intakes for typical Canadian populations. Presented at the Federal Contaminated Sites National Workshop, March 6-10 2006, Ottawa.
Wilson, R. 2009 pers. comm. Alternate methods to address SQG derivation when the EDI > TDI.