Embed Size (px)
Citation preview
Scientific and Validation Report for the Wind product processors
of the NWC/GEO
Code: NWC/CDOP2/GEO/AEMET/SCI/VR/Wind Issue: 1.0 Date: 15 October 2016 File: NWC-CDOP2-GEO-AEMET-SCI-VR-Wind_v1.0.doc Page: 1/37
Scientific and Validation Report for the Wind product processors
of the NWC/GEO
NWC/CDOP2/GEO/AEMET/SCI/VR/Wind, Issue 1, Rev. 0
15 October 2016
Applicable to GEO-HRW v5.0 (NWC-037)
Prepared by Agencia Estatal de Meteorología (AEMET)

Scientific and Validation Report for the Wind product processors
of the NWC/GEO
Code: NWC/CDOP2/GEO/AEMET/SCI/VR/Wind Issue: 1.0 Date: 15 October 2016 File: NWC-CDOP2-GEO-AEMET-SCI-VR-Wind_v1.0.doc Page: 2/37
REPORT SIGNATURE TABLE
Function Name Signature Date
Prepared by Javier García Pereda, AEMET 15 October 2016
Reviewed by
Xavier Calbet (NWC SAF GEO Manager)
NWC/GEO v2016 DRR Review Board 15 October 2016
Endorsed by
NWC SAF Steering Group 15 October 2016
Authorised by
Pilar Rípodas
(NWC SAF Project Manager) 15 October 2016

Scientific and Validation Report for the Wind product processors
of the NWC/GEO
Code: NWC/CDOP2/GEO/AEMET/SCI/VR/Wind Issue: 1.0 Date: 15 October 2016 File: NWC-CDOP2-GEO-AEMET-SCI-VR-Wind_v1.0.doc Page: 3/37
DOCUMENT CHANGE RECORD
Version Date Pages Changes
1.0 15 October 2016 37
Initial version for the NWC/GEO v2016; updated after NWC/GEO v2016 STRR/DRR including:
• Changes proposed at NWC/GEO v2016 STRR/DRR
• An updated list of “Model configuration files”
• An updated validation with the latest changes since November 2015 in NWC/GEO libraries, Cloud and HRW algorithms
• A table with the list of possible errors caused by GEO-HRW-v5.0 algorithm

Scientific and Validation Report for the Wind product processors
of the NWC/GEO
Code: NWC/CDOP2/GEO/AEMET/SCI/VR/Wind Issue: 1.0 Date: 15 October 2016 File: NWC-CDOP2-GEO-AEMET-SCI-VR-Wind_v1.0.doc Page: 4/37
TABLE OF CONTENTS
1. INTRODUCTION ............................................................................................................... 8
1.1 SCOPE OF THE DOCUMENT ....................................................................................................... 8
1.2 SOFTWARE VERSION IDENTIFICATION ........................................................................................ 9
1.3 REFERENCES ........................................................................................................................... 9 1.3.1 Applicable Documents ........................................................................................... 9 1.3.2 Reference Documents .......................................................................................... 10
2. DESCRIPTION OF THE VALIDATION PROCEDURE ........... ................................. 11
2.1 VALIDATION PROCEDURE ....................................................................................................... 11
2.2 STATISTICAL PARAMETERS ...................................................................................................... 13
2.3 IMPACT OF THE REPRESENTATIVITY OF THE RADIOSOUNDING WINDS ......................................... 14
3. VALIDATION OF GEO-HRW-V50 MSG BASIC AMVS .......... ................................. 16
3.1 VALIDATION FOR BASIC AMVS WITH DEFAULT CONFIGURATION (DAY)...................................... 17
3.2 VALIDATION FOR BASIC AMVS WITH DEFAULT CONFIGURATION (NIGHT) .................................. 18
3.3 COMPARISON WITH GEO-HRW-V40 DEFAULT CONFIGURATION .............................................. 19
3.4 VALIDATION FOR BASIC AMVS WITHOUT MICROPHYSICS CORRECTION ..................................... 20
3.5 VALIDATION FOR BASIC AMVS WITHOUT CLOUD PRODUCTS .................................................... 21
3.6 COMPARISON BETWEEN HEIGHT ASSIGNMENT PROCEDURES ..................................................... 23
4. VALIDATION OF GEO-HRW-V50 MSG DETAILED AMVS ....... ........................... 25
4.1 VALIDATION FOR DETAILED AMVS WITH DEFAULT CONFIGURATION......................................... 26
4.2 VALIDATION FOR DETAILED AMVS WITHOUT CLOUD PRODUCTS .............................................. 27
5. VALIDATION OF GEO-HRW-V50 GOES-N BASIC AMVS ....... .............................. 28
5.1 VALIDATION FOR BASIC AMVS WITH DEFAULT CONFIGURATION ............................................... 29
5.2 VALIDATION FOR BASIC AMVS WITHOUT CLOUD PRODUCTS .................................................... 30
5.3 COMPARISON BETWEEN HEIGHT ASSIGNMENT PROCEDURES ..................................................... 31
6. VALIDATION OF GEO-HRW-V50 GOES-N DETAILED AMVS .... ........................ 33
6.1 VALIDATION FOR DETAILED AMVS WITH DEFAULT CONFIGURATION......................................... 34
6.2 VALIDATION FOR DETAILED AMVS WITHOUT CLOUD PRODUCTS .............................................. 35
7. CONCLUSIONS ............................................................................................................... 36

Scientific and Validation Report for the Wind product processors
of the NWC/GEO
Code: NWC/CDOP2/GEO/AEMET/SCI/VR/Wind Issue: 1.0 Date: 15 October 2016 File: NWC-CDOP2-GEO-AEMET-SCI-VR-Wind_v1.0.doc Page: 5/37
List of Tables
Table 1. List of Applicable Documents ..............................................................................................9
Table 2. List of Reference Documents .............................................................................................10
Table 3. Description of McIDAS HRW1 Scheme and Correspondence with HRW BUFR file .......11
Table 4. Description of McIDAS WCOH Scheme and Correspondence with HRW1 Scheme ........12
Table 5: Validation parameters for a sample of GEO-HRW-v50 considering variations of the maximum distance with the reference Radiosounding winds (03-09 March 2016, MSG2 satellite, 12:00 UTC, European and Mediterranean area; Basic AMVs; Cross correlation tracking; CCC height assignment with Microphysics correction) ..........................................14
Table 6: Validation parameters for a sample of GEO-HRW-v50 considering variations of the time difference with the reference Radiosounding winds (03-09 March 2016, MSG2 satellite, 12:00 UTC, European and Mediterranean area; Basic AMVs; Cross correlation tracking; CCC height assignment with Microphysics correction) ..........................................................15
Table 7: Validation parameters for GEO-HRW-v50 (Jul 2009-Jun 2010, MSG2 satellite, 12:00 UTC, European and Mediterranean area; Basic AMVs; Cross correlation tracking; CCC height assignment with Microphysics correction) ...................................................................17
Table 8: Validation parameters for GEO-HRW-v50 (Jul 2009-Jun 2010, MSG2 satellite, 00:00 UTC, European and Mediterranean area; Basic AMVs; Cross correlation tracking; CCC height assignment with Microphysics correction) ...................................................................18
Table 9: Validation parameters for GEO-HRW-v40 (HRW v2013) (Jul 2009-Jun 2010, MSG2 satellite, 12:00 UTC, European and Mediterranean area; Basic AMVs; Cross correlation tracking; CCC height assignment without Microphysics correction) .....................................19
Table 10: Validation parameters for GEO-HRW-v50 (Jul 2009-Jun 2010, MSG2 satellite, 12:00 UTC, European and Mediterranean area; Basic AMVs; Cross correlation tracking; CCC height assignment without Microphysics correction) ..............................................................20
Table 11: Validation parameters for GEO-HRW-v50 (Jul 2009-Jun 2010, MSG2 satellite, 12:00 UTC, European and Mediterranean area; Basic AMVs; Cross correlation tracking; Brightness temperature interpolation height assignment without cloud products) ................21
Table 12: Validation parameters for GEO-HRW-v50 (Jul 2009-Jun 2010, MSG2 satellite, 00:00 UTC, European and Mediterranean area; Basic AMVs; Cross correlation tracking; Brightness temperature interpolation height assignment without cloud products) ................22
Table 13: “Mean difference” and “Mean absolute difference” between the “AMV best fit level” and the “AMV level” in the different layers (Jul 2009-Jun 2010, MSG2 satellite, 12:00 UTC, European and Mediterranean area; Basic AMVs; Cross correlation tracking; Brightness temperature interpolation height assignment without cloud products” compared to “CCC method height assignment with microphysics correction”) ....................................................23
Table 14: “Mean difference” and “Mean absolute difference” between the “AMV best fit level” and the “AMV level” for the different cloud types (Jul 2009-Jun 2010, MSG2 satellite, 12:00 UTC, European and Mediterranean area; Basic AMVs; Cross correlation tracking; “CCC method height assignment with microphysics correction”) ....................................................24
Table 15: Validation parameters for GEO-HRW-v50 (Jul 2009-Jun 2010, MSG2 satellite, 12:00 UTC, European and Mediterranean area; Detailed AMVs; Cross correlation tracking; CCC height assignment with Microphysics correction) ...................................................................26
Table 16: Validation parameters for GEO-HRW-v50 (Jul 2009-Jun 2010, MSG2 satellite, 12:00 UTC, European and Mediterranean area; Detailed AMVs; Cross correlation tracking; Brightness temperature interpolation height assignment without cloud products) ................27
Scientific and Validation Report for the Wind product processors
of the NWC/GEO
Code: NWC/CDOP2/GEO/AEMET/SCI/VR/Wind Issue: 1.0 Date: 15 October 2016 File: NWC-CDOP2-GEO-AEMET-SCI-VR-Wind_v1.0.doc Page: 6/37
Table 17: Validation parameters for GEO-HRW-v50 (Jul 2010-Jun 2011, GOES13 satellite,
00/06/12/18:00 UTC, Continental United States area; Basic AMVs; Cross correlation tracking; CCC height assignment without Microphysics correction) .....................................29
Table 18: Validation parameters for GEO-HRW-v50 (Jul 2010-Jun 2011, GOES13 satellite, 00/06/12/18:00 UTC, Continental United States area; Basic AMVs; Cross correlation tracking; Brightness temperature interpolation height assignment without Cloud products; No distinction between Cloudy and Clear air Water vapour AMVs due to the lack of Cloud products) ..................................................................................................................................30
Table 19: “Mean difference” and “Mean absolute difference” between the “AMV best fit level” and the “AMV level” in the different layers (Jul 2010-Jun 2011, GOES13 satellite, 00/06/12/18:00 UTC, Continental United States area, Basic AMVs; Cross correlation tracking; “Brightness temperature interpolation height assignment without cloud products” compared to “CCC method height assignment without microphysics correction”) ...............31
Table 20: “Mean difference” and “Mean absolute difference” between the “AMV best fit level” and the “AMV level” for the different cloud types (Jul 2010-Jun 2011, GOES13 satellite, 00/06/12/18:00 UTC, Continental United States area, Basic AMVs; Cross correlation tracking; “Brightness temperature interpolation height assignment without cloud products” compared to “CCC method height assignment without microphysics correction”) ...............32
Table 21: Validation parameters for GEO-HRW-v50 (Jul 2010-Jun 2011, GOES13 satellite, 00/06/12/18:00 UTC, Continental United States area; Detailed AMVs; Cross correlation tracking; CCC height assignment without Microphysics correction) .....................................34
Table 22: Validation parameters for GEO-HRW-v50 (Jul 2010-Jun 2011, GOES13 satellite, 00/06/12/18:00 UTC, Continental United States area; Detailed AMVs; Cross correlation tracking; Brightness temperature interpolation height assignment without Cloud products; No distinction between Cloudy and Clear air Water vapour AMVs due to the lack of Cloud products) ..................................................................................................................................35
Table 23: Evolution of Validation statistics between GEO-HRW-v40 and GEO-HRW-v50 versions, related to the Operative thresholds defined in the GEO-HRW Product Requirement Table. .......................................................................................................................................36

Scientific and Validation Report for the Wind product processors
of the NWC/GEO
Code: NWC/CDOP2/GEO/AEMET/SCI/VR/Wind Issue: 1.0 Date: 15 October 2016 File: NWC-CDOP2-GEO-AEMET-SCI-VR-Wind_v1.0.doc Page: 7/37
List of Figures
Figure 1: NWC/GEO High Resolution Winds v2016 Basic AMV output in the European and Mediterranean region (26 December 2009 1200Z, Nominal scan mode, MSG2 satellite), considering default conditions defined in $SAFNWC/config/safnwc_HRW.cfm.MSG15MIN model configuration file. Colour coding based on the AMV pressure level ............................16
Figure 2: NWC/GEO High Resolution Winds v2016 Detailed AMV output in the European and Mediterranean region (26 December 2009 1200Z, Nominal scan mode, MSG2 satellite), considering default conditions defined in $SAFNWC/config/safnwc_HRW.cfm.MSG15MIN model configuration file. Colour coding based on the AMV pressure level ............................25
Figure 3: NWC/GEO High Resolution Winds v2016 Basic AMV output in the Continental United States region (1 July 2010 1745Z, GOES13 satellite), considering the default conditions defined in $SAFNWC/config/safnwc_HRW.cfm.GOES15MIN model configuration file. Colour coding based on the AMV pressure level ....................................................................28
Figure 4: NWC/GEO High Resolution Winds v2016 Detailed AMV output in the Continental United States region (1 July 2010 1745Z, GOES13 satellite), considering the default conditions defined in $SAFNWC/config/safnwc_HRW.cfm.GOES15MIN model configuration file. Colour coding based on the AMV pressure level .............................................................33

Scientific and Validation Report for the Wind product processors
of the NWC/GEO
Code: NWC/CDOP2/GEO/AEMET/SCI/VR/Wind Issue: 1.0 Date: 15 October 2016 File: NWC-CDOP2-GEO-AEMET-SCI-VR-Wind_v1.0.doc Page: 8/37
1. INTRODUCTION
The EUMETSAT Satellite Application Facilities (SAF) are dedicated centres of excellence for the processing of satellite data, and form an integral part of the distributed EUMETSAT Application Ground Segment.
This documentation is provided by the SAF on support to Nowcasting and Very short range forecasting (NWC SAF). The main objective of the NWC SAF is to provide, develop and maintain software packages to be used with operational meteorological satellite data for Nowcasting applications. More information about the project can be found at the NWC SAF webpage, http://www.nwcsaf.org.
This document is applicable to the NWC SAF processing package for Geostationary Meteorological satellites, NWC/GEO.
1.1 SCOPE OF THE DOCUMENT
The purpose of this document is to present the Scientific Validation Results for the Wind Product Processor of the NWC/GEO software package (GEO-HRW, High Resolution Winds), which calculates Atmospheric Motion Vectors considering:
• Up to seven channels from MSG series SEVIRI imager: the 3 km Low Resolution Visible channels (VIS06 0.6 µm and VIS08 0.8 µm), Water Vapour channels (WV62 6.2 µm and WV73 7.3 µm), Infrared channels (IR108 10.8 µm and IR120 12.0 µm), and the 1 km High Resolution Visible channel (HRVIS 0.7 µm).
• Up to three channels from GOES-N series Imager: the 4 km Low Resolution Water Vapour channel (WV65, 6.5 µm) and Infrared channel (IR107, 10.7 µm), and the 1 km High Resolution Visible channel (VIS07, 0.7 µm).
This validation has been based on the comparison of the GEO-HRW-v50 Atmospheric Motion Vectors with winds obtained from Radiosounding bulletins available from the GTS. The statistical indicators established in the “Report from the Working Group on Verification Statistics of the 3rd International Winds Workshop” [RD.12], with some amendments in the “Report from the Working Group on Verification & Quality Indices of the 4th International Winds Workshop” [RD.15]), are calculated to achieve this. These indicators have been thoroughly used throughout the world for the Validation of Satellite winds through the comparison with Radiosoundings.
This report specifically takes into account the similarities and differences found in the AMVs (Atmospheric Motion Vectors) calculated with MSG satellite series and GOES-N satellite series, which for the first time can be processed by NWC/GEO-HRW software. Two main configurations have been considered for both satellite series: using NWC/GEO cloud products (and so using “CCC height assignment method”) and not using NWC/GEO Cloud products (and so using “Brightness temperature interpolation height assignment method without cloud products”).
A small difference occurs between the "CCC method” version used with MSG satellites (which due to the availability of NWC/GEO Cloud microphysics product includes a Microphysics correction), and the version used with GOES-N satellites (which due to the lack of the corresponding NWC/GEO Cloud microphysics product does not include this Microphysics correction).
A comparison between the default configurations of GEO-HRW v2013 and v2016 is also verified, to show the improvements of NWC/GEO-HRW algorithm since the previous version.
Finally, the differences between daytime AMVs and nighttime AMVs are also for the first time considered, considering the validation against Radiosounding data related to different synoptic hours of the day.
Scientific and Validation Report for the Wind product processors
of the NWC/GEO
Code: NWC/CDOP2/GEO/AEMET/SCI/VR/Wind Issue: 1.0 Date: 15 October 2016 File: NWC-CDOP2-GEO-AEMET-SCI-VR-Wind_v1.0.doc Page: 9/37
1.2 SOFTWARE VERSION IDENTIFICATION
This document describes the algorithm implemented in the GEO-HRW-v5.0 (Product Id NWC-037) of the NWC/GEO v2016 software package release.
1.3 REFERENCES
1.3.1 Applicable Documents
The following documents, of the exact issue shown, form part of this document to the extent specified herein. Applicable documents are those referenced in the Contract or approved by the Approval Authority. They are referenced in this document in the form [AD.X]
For versioned references, subsequent amendments to, or revisions of, any of these publications do not apply. For unversioned references, the current edition of the document referred applies.
Current documentation can be found at the NWC SAF Helpdesk web: http://www.nwcsaf.org.
Ref. Title Code Version
[AD.1] Proposal for the Second Continuous Development and Operations Phase (CDOP2)
NWC/CDOP2/MGT/AEMET/PRO 1.0
[AD.2] NWC SAF CDOP-2 Project Plan NWC/CDOP2/SAGF/AEMET/MGT/PP 1.9
[AD.3] Configuration Management Plan for NWCSAF
NWC/CDOP2/SAF/AEMET/MGT/CMP 1.4
[AD.4] NWC SAF Product Requirements Document NWC/CDOP2/SAF/AEMET/MGT/PRD 1.9
[AD.5] Interface Control Document for Internal and External Interfaces of the NWC/GEO
NWC/CDOP2/AEMET/SW/ICD/1 1.1
[AD.6] Data Output Format for the NWC/GEO NWC/CDOP2/AEMET/SW/DOF 1.1 [AD.7] System Version Document for the NWC/GEO NWC/CDOP2/AEMET/SW/SCVD 1.1
[AD.8] Estimation of computer environment needs to run NWC SAF products operatively in ‘Rapid scan mode’
NWC/CDOP/INM/SW/RP/01 1.0
[AD.9] Validation Report for “High Resolution Winds” (HRW – PGE09 v2.2)
NWC/CDOP/INM/SCI/VR/05 1.0
[AD.10] Validation Report for “High Resolution Winds” (HRW – PGE09 v3.0)
NWC/CDOP/INM/SCI/VR/07 1.0
[AD.11] Validation Report for “High Resolution Winds” (HRW – PGE09 v3.1)
NWC/CDOP/INM/SCI/VR/09 1.0
[AD.12] Validation Report for “High Resolution Winds” (HRW – PGE09 v3.2)
NWC/CDOP/INM/SCI/VR/10 1.0
[AD.13] Validation Report for “High Resolution Winds” (HRW – PGE09 v4.0)
NWC/CDOP2/INM/SCI/VR/13 1.0
[AD.14] Algorithm Theoretical Basis Document for the Wind product processors of the NWC/GEO
NWC/CDOP2/GEO/AEMET/SCI/ATBD/Wind 1.1
[AD.15] User Manual for the Wind product processors of the NWC/GEO: Software part
NWC/CDOP2/GEO/AEMET/SCI/ATBD/Wind 1.0
[AD.16] User Manual of the GOES2NC tool NWC/CDOP2/GEO/AEMET/SW/UM/GOES2NC 1.0
Table 1. List of Applicable Documents

Scientific and Validation Report for the Wind product processors
of the NWC/GEO
Code: NWC/CDOP2/GEO/AEMET/SCI/VR/Wind Issue: 1.0 Date: 15 October 2016 File: NWC-CDOP2-GEO-AEMET-SCI-VR-Wind_v1.0.doc Page: 10/37
1.3.2 Reference Documents
The reference documents contain useful information related to the subject of the project. These reference documents complement the applicable ones, and can be looked up to enhance the information included in this document if it is desired. They are referenced in this document in the form [RD.X].
For dated references, subsequent amendments to, or revisions of, any of these publications do not apply. For undated references, the current edition of the document referred applies.
Ref. Title [RD.1] J.Schmetz, K.Holmlund, J.Hoffman, B.Strauss, B.Mason, V.Gärtner, A.Koch, L. van de Berg, 1993: Operational Cloud-Motion Winds
from Meteosat Infrared Images (Journal of Applied Meteorology, Num. 32, pp. 1206-1225). [RD.2] S.Nieman, J.Schmetz, W.P.Menzel, 1993: A comparison of several techniques to assign heights to cloud tracers (Journal of Applied
Meteorology, Num. 32, pp. 1559-1568). [RD.3] C.M.Hayden & R.J.Purser, 1995: Recursive filter objective analysis of meteorological fields, and application to NESDIS operational
processing (Journal of Applied Meteorology, Num. 34, pp. 3-15). [RD.4] K.Holmlund, 1998: The utilisation of statistical properties of satellite derived Atmospheric Motion Vectors to derive Quality Indicators
(Weather and Forecasting, Num. 13, pp. 1093-1104). [RD.5] J.M.Fernández, 1998: A future product on HRVIS Winds from the Meteosat Second Generation for nowcasting and other applications.
(Proceedings 4th International Wind Workshop, EUMETSAT Pub.24, pp.281-288). [RD.6] J.M.Fernández, 2000: Developments for a High Resolution Wind product from the HRVIS channel of the Meteosat Second Generation.
(Proceedings 5th International Wind Workshop, EUMETSAT Pub.28, pp.209-214). [RD.7] J.M.Fernández, 2003: Enhancement of algorithms for satellite derived winds: the High Resolution and Quality Control aspects.
(Proceedings 2003 Meteorological Satellite Conference, EUMETSAT Pub.39, pp.176-182). [RD.8] J.García-Pereda & J.M.Fernández, 2006: Description and validation results of the high resolution wind product from HRVIS MSG
channel at the EUMETSAT Nowcasting SAF (Proceedings 8th International Wind Workshop, EUMETSAT Pub.47). [RD.9] J.García-Pereda, 2008: Evolution of High Resolution Winds Product (HRW), at the Satellite Application Facility on support to
Nowcasting and Very short range forecasting (Proceedings 9th International Wind Workshop, EUMETSAT Pub.51). [RD.10] J.García-Pereda, 2010: New developments in the High Resolution Winds product (HRW), at the Satellite Application Facility on support
to Nowcasting and Very short range forecasting (Proceedings 10th International Wind Workshop, EUMETSAT Pub.56). [RD.11] C.M.Hayden & R.T.Merrill, 1988: Recent NESDIS research in wind estimation from geostationary satellite images (ECMWF Seminar
Proceedings: Data assimilation and use of satellite data, Vol. II, pp.273-293). [RD.12] W.P.Menzel, 1996: Report on the Working Group on verification statistics.
(Proceedings 3rd International Wind Workshop, EUMETSAT Pub.18, pp.17-19). [RD.13] J.Schmetz, K.Holmlund, A.Ottenbacher, 1996: Low level winds from high resolution visible imagery. (Proceedings 3rd international
winds workshop, EUMETSAT Pub.18, pp.71-79). [RD.14] Xu J. & Zhang Q., 1996: Calculation of Cloud motion wind with GMS-5 images in China. (Proceedings 3rd international winds
workshop, EUMETSAT Pub.18, pp.45-52). [RD.15] K.Holmlund & C.S.Velden, 1998: Objective determination of the reliability of satellite derived Atmospheric Motion Vectors
(Proceedings 4th International Wind Workshop, EUMETSAT Pub.24, pp.215-224). [RD.16] K.Holmlund, C.S.Velden & M.Rohn, 2000: Improved quality estimates of Atmospheric Motion Vectors utilising the EUMETSAT
Quality Indicators and the UW/CIMSS Autoeditor (Proceedings 5th International Wind Workshop, EUMETSAT Pub.28, pp.72-80). [RD.17] R.Borde & R.Oyama, 2008: A direct link between feature tracking and height assignment of operational Atmospheric Motion Vectors
(Proceedings 9th International Wind Workshop, EUMETSAT Pub.51). [RD.18] J.García-Pereda, R.Borde & R.Randriamampianina, 2012: Latest developments in “NWC SAF High Resolution Winds” product
(Proceedings 11th International Wind Workshop, EUMETSAT Pub.60). [RD.19] WMO Common Code Table C-1 (WMO Publication, available at
http://www.wmo.int/pages/prog/www/WMOCodes/WMO306_vI2/LatestVERSION/WMO306_vI2_CommonTable_en.pdf) [RD.20] M.Dragosavac, 2007: BUFR Reference Manual (ECMWF Operations Department Publication, available at
https://www.wmo.int/pages/prog/gcos/documents/gruanmanuals/ECMWF/bufr_reference_manual.pdf) [RD.21] P.Lean, G.Kelly & S.Migliorini, 2014: Characterizing AMV height assignment errors in a simulation study (Proceedings 12th
International Wind Workshop, EUMETSAT Pub.63). [RD.22] Á.Hernández-Carrascal & N.Bormann, 2014: Cloud top, Cloud centre, Cloud layer – Where to place AMVs? (Proceedings 12th
International Wind Workshop, EUMETSAT Pub.63). [RD.23] K.Salonen & N.Bormann, 2014: Investigations of alternative interpretations of AMVs (Proceedings 12th International Wind Workshop,
EUMETSAT Pub.63). [RD.24] D.Santek, J.García-Pereda, C.Velden, I.Genkova, S.Wanzong, D.Stettner & M.Mindock, 2014: 2014 AMV Intercomparison Study
Report - Comparison of NWC SAF/HRW AMVs with AMVs from other producers (NWC SAF Visiting Scientist Report, available at http://www.nwcsaf.org/HD/files/vsadoc/CIMSS_AMV_Comparison_FinalReport_04July2014.pdf)
[RD.25] D.J.Seidel, B.Sun, M.Pettey & A.Reale, 2011: Global radiosonde balloon drift statistics (Journal of Geophysical Research, Num. 116).
Table 2. List of Reference Documents

Scientific and Validation Report for the Wind product processors
of the NWC/GEO
Code: NWC/CDOP2/GEO/AEMET/SCI/VR/Wind Issue: 1.0 Date: 15 October 2016 File: NWC-CDOP2-GEO-AEMET-SCI-VR-Wind_v1.0.doc Page: 11/37
2. DESCRIPTION OF THE VALIDATION PROCEDURE
2.1 VALIDATION PROCEDURE
Relevant data for the validation, from the corresponding NWC/GEO-HRW output BUFR files, are converted into McIDAS MD files, following a scheme called HRW1. Structure of data in this scheme and its correspondence with BUFR parameters is shown in the following table:
ROW/ELEMENT BUFR DESCRIPTOR PARAMETER HRW1 SCHEME DESCRIPTION
Row 0 1 001007 SS Satellite Identifier
Row 0 2 004001/002/003 DAY Day
Row 0 3 004004/005 TIME Time
Row 0 4 004025 INTT Time displacement
Row 0 5 031002 CMAX Number of HRW winds at slot
Element 01 060100 IDN Wind sequence number
Element 02 060102 TYPE Characterization as Basic or Detailed tracer, and Type of Detailed tracer
Element 0 3 002028 SIZX Segment size at nadir in X direction in kms
Element 04 002029 SIZY Segment size at nadir in Y direction in kms
Element 05 060103 TYPL Characterization as Cloudy or Clear air wind, and Height assignment method used
Element 06 002164 TYPT Euclidean Distance or Cross Correlation
Element 07 005001 LAT Initial latitude
Element 08 006001 LON Initial longitude
Element 09 005011 DLAT Latitude incre ment
Element 10 006011 DLON Longitude increment
Element 11 012001 T Wind Temperature
Element 12 007004 P Wind Pressure
Element 13 011001 DIR Wind D irection
Element 14 011002 SPD Wind Speed
Element 15 033007 YT Wind Quality i ndex ( using forecast )
Element 19 0330 07 YYT Wind Quality index ( not using forecast )
Element 23 060202 TES2 Two scale quality test flag
Element 24 060202 TEST Temporal quality test flag
Element 25 060202 TESE Spatial quality test flag
Element 26 060202 TESG Forecast quality test flag
Element 27 060201 TESA Correlation test flag
Element 28 060203 AVAT Number of NWP levels used in HRW calculation
Element 29 060204 AVAW Number of Predecessor winds in the trajectory
Element 30 060200 WREP Number of C omputed winds for the tracer
Element 31 060101 IDN0 Number of Predecessor wind in the previous slot
Element 32 060205 FLAI Orographic flag
Element 33 060202 TESI Orographic test flag
Element 36 060206 CT Wind cloud type
Element 37 060207 WCH Satellite channel (5:HRVIS, 2:VIS06/VIS07, 3:VIS08, 10:WV062/WV065, 12:WV073, 16:IR108/IR107, 17:IR120)
Element 38 060208 CORR Correlation between tracer and tracking centre
Element 39 060209 PERR Wind pressure error
Table 3. Description of McIDAS HRW1 Scheme and Correspondence with HRW BUFR file

Scientific and Validation Report for the Wind product processors
of the NWC/GEO
Code: NWC/CDOP2/GEO/AEMET/SCI/VR/Wind Issue: 1.0 Date: 15 October 2016 File: NWC-CDOP2-GEO-AEMET-SCI-VR-Wind_v1.0.doc Page: 12/37
Comparisons are elaborated through a procedure which uses on one side the given MD files, and on the other side Radiosoundings loaded from the GTS. Comparisons are available through MD files following a specific scheme called WCOH. The structure of data included in this WCOH scheme, and its correspondence with parameters in the HRW1 scheme, is shown also in the following table:
ROW/ELEMENT WCOH PARAMETER WCOH SCHEME DESCRIPTION HRW1 CORRESPONDENCE
Row 01 DAY Day DAY
Element 01 COL Number of Collocation
Element 02 DIST Maximum Distance admitted
Element 03 DIFP Maximum Pressure difference admitte d
Element 04 PMAX Maximum Pressure admitted
Element 05 TIME Time TIME
Element 06 LAT HRW Wind Latitude LAT
Element 07 LON HRW Wind Longitude LON
Element 08 DIR HRW Wind Direction DIR
Element 09 SPD HRW Wind Speed SPD
Element 10 PW HRW Wind Pressure P
Element 11 QI HRW Wind Quality with forecast YT
Element 12 TEST HRW Wind Spatial Test, Wind channel , Number of winds for the tracer
200*TESE+10*WCH+WREP
Element 13 UQI HRW Wind Quality without forecast YY T
Element 14 TYPE Characterization as Basic or Detail ed tracer, and Type of Detailed tracer
TYPE
Element 15 CH Characterization of Height assignment method used with/without correction, Calculation threshold, Cloud phase
TYPL
Element 16 WM Euclidean Distance or Cross Correlation tracking
TYPT
Element 17 TIM1 Radiosounding Time
Element 18 TYP1 Radiosounding Observational Type
Element 19 IDN Radiosounding Station Indicative
Element 21 LAT1 Radiosounding Latitude
Element 22 LON1 Radiosounding Longitude
Element 23 DIR1 Radiosounding Direction
Element 24 SPD1 Radiosounding Speed
Element 25 P Radiosounding Pressure
Element 26 FLAG HRW Wind AMV Orographic Flag FLAI
Element 27 PS HRW Wind Cloud phase
Table 4. Description of McIDAS WCOH Scheme and Correspondence with HRW1 Scheme
The HRW Validation statistical parameters select data from the WCOH MD files considering the value of some specific parameters, and calculate the corresponding validation statistics.
Scientific and Validation Report for the Wind product processors
of the NWC/GEO
Code: NWC/CDOP2/GEO/AEMET/SCI/VR/Wind Issue: 1.0 Date: 15 October 2016 File: NWC-CDOP2-GEO-AEMET-SCI-VR-Wind_v1.0.doc Page: 13/37
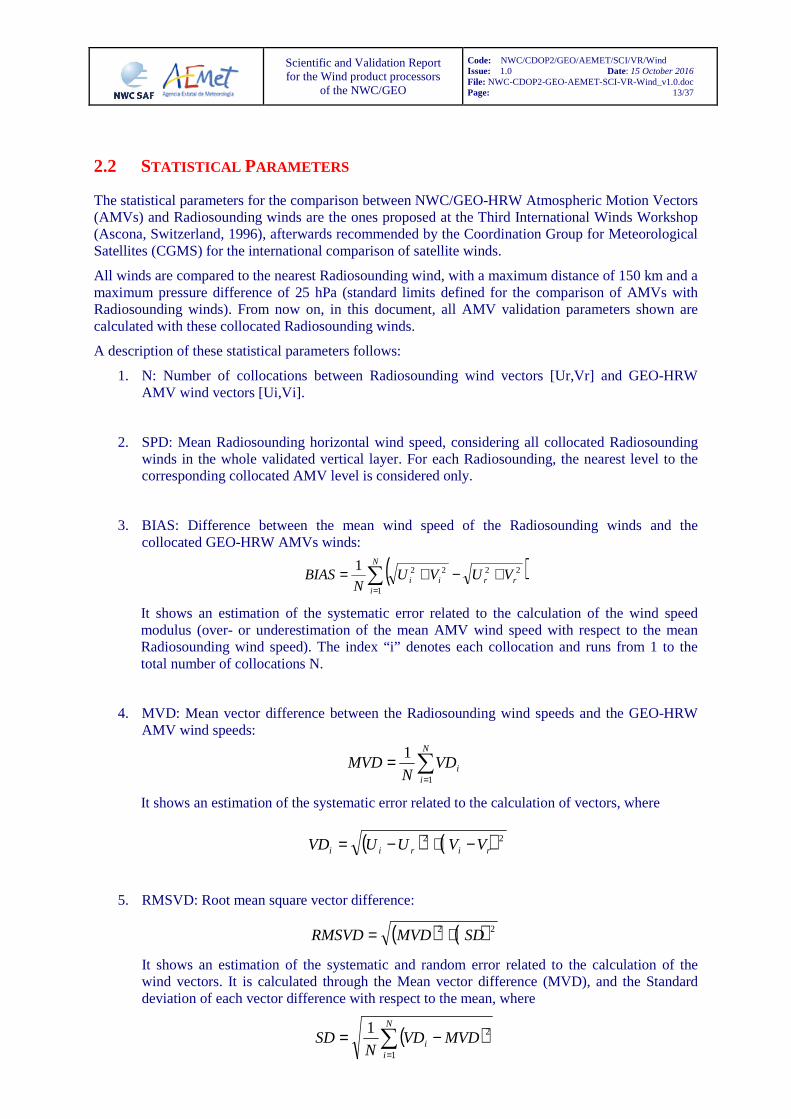
2.2 STATISTICAL PARAMETERS
The statistical parameters for the comparison between NWC/GEO-HRW Atmospheric Motion Vectors (AMVs) and Radiosounding winds are the ones proposed at the Third International Winds Workshop (Ascona, Switzerland, 1996), afterwards recommended by the Coordination Group for Meteorological Satellites (CGMS) for the international comparison of satellite winds.
All winds are compared to the nearest Radiosounding wind, with a maximum distance of 150 km and a maximum pressure difference of 25 hPa (standard limits defined for the comparison of AMVs with Radiosounding winds). From now on, in this document, all AMV validation parameters shown are calculated with these collocated Radiosounding winds.
A description of these statistical parameters follows:
1. N: Number of collocations between Radiosounding wind vectors [Ur,Vr] and GEO-HRW AMV wind vectors [Ui,Vi].
2. SPD: Mean Radiosounding horizontal wind speed, considering all collocated Radiosounding winds in the whole validated vertical layer. For each Radiosounding, the nearest level to the corresponding collocated AMV level is considered only.
3. BIAS: Difference between the mean wind speed of the Radiosounding winds and the collocated GEO-HRW AMVs winds:
It shows an estimation of the systematic error related to the calculation of the wind speed modulus (over- or underestimation of the mean AMV wind speed with respect to the mean Radiosounding wind speed). The index “i” denotes each collocation and runs from 1 to the total number of collocations N.
4. MVD: Mean vector difference between the Radiosounding wind speeds and the GEO-HRW AMV wind speeds:
It shows an estimation of the systematic error related to the calculation of vectors, where
5. RMSVD: Root mean square vector difference:
It shows an estimation of the systematic and random error related to the calculation of the wind vectors. It is calculated through the Mean vector difference (MVD), and the Standard deviation of each vector difference with respect to the mean, where
( ) ( )22ririi VVUUVD −+−=
∑=
=N
iiVD
NMVD
1
1
( )∑=
+−+=N
irrii VUVU
NBIAS
1
22221
( ) ( )22 SDMVDRMSVD +=
( )∑=
−=N
ii MVDVD
NSD
1
21

Scientific and Validation Report for the Wind product processors
of the NWC/GEO
Code: NWC/CDOP2/GEO/AEMET/SCI/VR/Wind Issue: 1.0 Date: 15 October 2016 File: NWC-CDOP2-GEO-AEMET-SCI-VR-Wind_v1.0.doc Page: 14/37
Due to the variable magnitude the defined statistical parameters can have in different samples, the mean Radiosounding horizontal wind speed SPD (parameter 2) is used for normalization. So, the relative parameters related to the ones before:
3a. NBIAS = BIAS / SPD,
4a. NMVD = MVD / SPD,
5a. NRMSVD = RMSVD / SPD,
which are independent of the magnitude of the winds and can more easily be compared in different samples of data, are going to be used and presented throughout this Validation report.
2.3 IMPACT OF THE REPRESENTATIVITY OF THE RADIOSOUNDING WINDS
No consideration is taken here on the impact in the AMV validation statistics, caused by the displacement of the Radiosounding during its ascent, or by differences between the nominal sounding time and the real data acquisition time.
Two studies are done here to evaluate this issue. In these studies, seven days of statistics for MSG AMVs with NWC/GEO-HRW-v5.0 algorithm are considered (03-09 March 2016). Although this sample is small, it is considered enough to show the trends caused by variations in the maximum distance and the time difference between the AMV and the reference Radiosounding wind.
In the first study, statistics are considered for maximum distances between the AMV and the reference Radiosounding wind between 20 and 300 km. The standard validation statistics defined previously are provided for these conditions. It can be seen that the impact of the distance in the validation parameters is around a 33% with distances up to 100 km, around a 50% with distances up to 150 km, and around a 100% with distances up to 300 km. The "150 km" value can be seen as a compromise value which maximizes the number of validated AMV data while keeping still the representativity of the statistics.
Maximum distance N SPD NBIAS NMVD NRMSVD
20 km 222 17.986 - 0.03 0.18 0.24
40 km 871 17.636 - 0.05 0.21 0.26
70 km 2563 17.821 - 0.07 0.23 0.28
100 km 4892 18.291 - 0.08 0.25 0.31
150 km 10431 19.019 - 0.08 0.28 0.35
200 km 17481 19.292 - 0.06 0.31 0.39
250 km 24937 19.696 - 0.07 0.34 0.42
300 km 30901 19.634 - 0.06 0.37 0.46
Table 5: Validation parameters for a sample of GEO-HRW-v50 considering variations of the maximum distance with the reference Radiosounding winds
(03-09 March 2016, MSG2 satellite, 12:00 UTC, European and Mediterranean area; Basic AMVs; Cross correlation tracking; CCC height assignment with Microphysics correction)
Related to this, studies have been published about the distance drift the Radiosounding balloon can have during its ascent and measurement (which includes an additional factor of distance error to be taken into account, in the comparison between the AMVs and the Radiosounding winds). A two year study is for example available at Seidel et al. [RD.25]. It shows that the distance drift of the Radiosounding balloon has medium/maximum values of 5/15 km at 700 hPa, 10/30 km at 500 hPa, 20/60 km at 300 hPa, and 40/130 km at 100 hPa.
For AMVs at low and medium levels this distance drift causes negligible effects in the validation statistics (causing errors up to a 10%-15% only). Only for a small part of AMVs near 100 hPa, level at which there are besides very few AMVs, can this impact be more significant.

Scientific and Validation Report for the Wind product processors
of the NWC/GEO
Code: NWC/CDOP2/GEO/AEMET/SCI/VR/Wind Issue: 1.0 Date: 15 October 2016 File: NWC-CDOP2-GEO-AEMET-SCI-VR-Wind_v1.0.doc Page: 15/37
Considering the time drift in the Radiosounding balloon, the same study estimates it reaches 700 hPa in less than 10 minutes, 400 hPa in less than 25 minutes, and 100 hPa in less than 55 minutes. So, AMV validation statistics are affected by a time drift in the radiosounding measurement of up to an hour, especially at the high levels.
Validation statistics for the same sample of GEO-HRW-v5.0 AMVs, considering time drifts between the AMV and the Radiosounding wind nominal time between 0 and 12 hours, are shown next. The standard validation statistics defined here are also provided for these conditions. It can be seen that with differences smaller than three hours, the errors in the validation statistics are smaller than 10%. Only with three hours and longer intervals, the errors increase more noticeably.
Time difference N SPD NBIAS NMVD NRMSVD
0 minutes 10431 19.019 - 0.0 8 0.28 0. 35
15 minutes 10303 19.127 - 0.0 8 0. 28 0.35
30 minutes 9568 19.184 - 0.0 8 0.2 7 0.34
45 minutes 9578 19.372 - 0.0 8 0.28 0.34
1.0 hour 11076 18.548 - 0.0 9 0.28 0.35
1.5 hours 11327 18.834 - 0.0 9 0.29 0.35
2.0 hours 10897 18.832 - 0.0 9 0.30 0.36
2.5 hours 10549 18.901 - 0.09 0.30 0.36
3.0 hours 10329 18.539 - 0.09 0.32 0.39
4,5 hours 8384 18.273 - 0.06 0.35 0.44
6.0 hours 8209 20.501 - 0.09 0.38 0.47
9.0 hours 9205 20.495 - 0.11 0.52 0.66
12.0 hours 9937 18.924 - 0.05 0.69 0.93
Table 6: Validation parameters for a sample of GEO-HRW-v50 considering variations of the time difference with the reference Radiosounding winds
(03-09 March 2016, MSG2 satellite, 12:00 UTC, European and Mediterranean area; Basic AMVs; Cross correlation tracking; CCC height assignment with Microphysics correction)
Considering all this, it can be concluded that the distance drift caused by the Radiosounding balloon during its ascension has only an impact in the validation statistics of a small part of AMVs near the level of 100 hPa. It can also be concluded that the time drift caused by the Radiosounding balloon during its ascension (less than an hour up to 100 hPa), and any differences between the nominal and real start of the Radiosounding measurement (which in normal conditions should never be worse than 1.5 hours), have a very limited impact in the AMV statistics, and can in general be discarded.
If a modification should be considered for the validation of AMVs, the most convenient one could be to reduce the maximum distance between the AMV and the reference wind to a value around "100 km" (which would directly reduce errors by at least a 10%), and maybe to take into account the distance drift of the Radiosounding balloon in the validation of AMVs at high levels.
But, due to the fact that this validation procedure is standard for all AMV producers in the world, it should be considered by all of them at the same time, so that the validation statistics produced by all of them would still be homogeneous.

Scientific and Validation Report for the Wind product processors
of the NWC/GEO
Code: NWC/CDOP2/GEO/AEMET/SCI/VR/Wind Issue: 1.0 Date: 15 October 2016 File: NWC-CDOP2-GEO-AEMET-SCI-VR-Wind_v1.0.doc Page: 16/37
3. VALIDATION OF GEO-HRW-V50 MSG BASIC AMVS
The validation of GEO-HRW-v50 algorithm for MSG satellite series is considered first. It is based on the validation of GEO-HRW AMVs calculated during the whole year July 2009 – June 2010 with MSG2 satellite images in Nominal scan mode (every 15 minutes) in an area covering Europe and the Mediterranean Sea. This area is shown in Figure 1.
Figure 1: NWC/GEO High Resolution Winds v2016 Basic AMV output example in the European and Mediterranean region (26 December 2009 1200Z, Nominal scan mode, MSG2 satellite), considering default conditions defined in $SAFNWC/config/safnwc_HRW.cfm.MSG15MIN model configuration
file. Colour coding based on the AMV pressure level
The default conditions for GEO-HRW-v50 for MSG satellites, considering “Basic scale AMVs” with “Cross correlation tracking” and “CCC height assignment method with Microphysics correction” are used first. These conditions are specified in $SAFNWC/config/safnwc_HRW.cfm.MSG15MIN model configuration file, with all satellite channels being validated. Cloudy AMVs in the layer 100-1000 hPa and clear air AMVs in the layer 100-425 hPa, with a Quality index with forecast ≥ 70 in the High and Medium layer and a Quality index with forecast ≥ 75 in the Low layer, are considered for this validation.
NWC/GEO Cloud product outputs (CMA, CT, CTTH and CMIC) in the processing region have to be available so that GEO-HRW-v50 can fully process the conditions defined in the given model configuration file.
Comparing validation results with those required by the GEO-HRW Product Requirement Table, the “Target accuracy” (with values respectively of 0.44, 0.50 and 0.56) is reached in all layers (High, Medium and Low) by the MSG AMVs during both daytime and nighttime.
The “Optimal accuracy” (with a value of 0.35) is even reached in the High layer by the MSG AMVs during daytime (not during nighttime, due to the smaller contrasts in brightness temperatures occurring at this moment, so still giving room for improvement in the AMVs calculated with this satellite series at all layers).
Scientific and Validation Report for the Wind product processors
of the NWC/GEO
Code: NWC/CDOP2/GEO/AEMET/SCI/VR/Wind Issue: 1.0 Date: 15 October 2016 File: NWC-CDOP2-GEO-AEMET-SCI-VR-Wind_v1.0.doc Page: 17/37
3.1 VALIDATION FOR BASIC AMV S WITH DEFAULT CONFIGURATION (DAY)
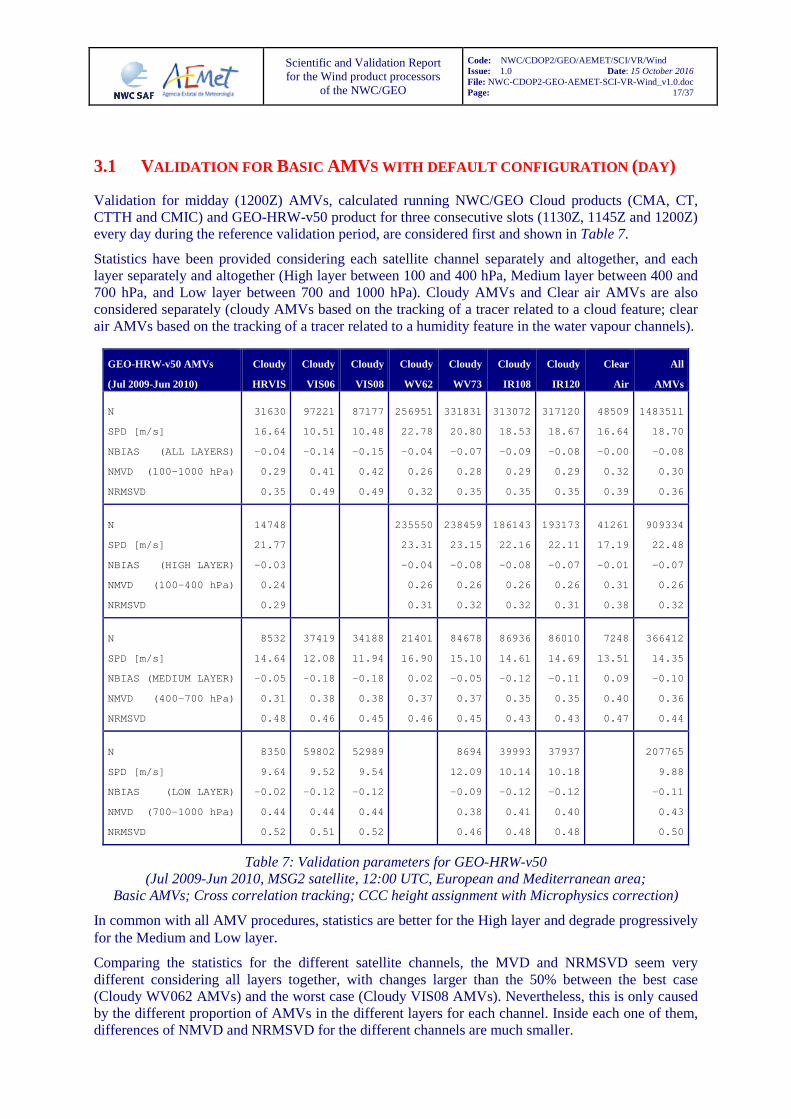
Validation for midday (1200Z) AMVs, calculated running NWC/GEO Cloud products (CMA, CT, CTTH and CMIC) and GEO-HRW-v50 product for three consecutive slots (1130Z, 1145Z and 1200Z) every day during the reference validation period, are considered first and shown in Table 7.
Statistics have been provided considering each satellite channel separately and altogether, and each layer separately and altogether (High layer between 100 and 400 hPa, Medium layer between 400 and 700 hPa, and Low layer between 700 and 1000 hPa). Cloudy AMVs and Clear air AMVs are also considered separately (cloudy AMVs based on the tracking of a tracer related to a cloud feature; clear air AMVs based on the tracking of a tracer related to a humidity feature in the water vapour channels).
GEO-HRW-v50 AMVs
(Jul 2009-Jun 2010)
Cloudy
HRVIS
Cloudy
VIS06
Cloudy
VIS08
Cloudy
WV62
Cloudy
WV73
Cloudy
IR108
Cloudy
IR120
Clear
Ai r
All
AMVs
N
SPD [m/s]
NBIAS (ALL LAYERS)
NMVD (100-1000 hPa)
NRMSVD
31630
16.64
-0.04
0.29
0.35
97221
10.51
-0.14
0.41
0.49
87177
10.48
-0.15
0.42
0.49
256951
22.78
-0.04
0.26
0.32
331831
20.80
-0.07
0.28
0.35
313072
18.53
-0.09
0.29
0.35
317120
18.67
-0.08
0.29
0.35
48509
16.64
-0.00
0.32
0.39
1483511
18.70
-0.08
0.30
0.36
N
SPD [m/s]
NBIAS (HIGH LAYER)
NMVD (100-400 hPa)
NRMSVD
14748
21.77
-0.03
0.24
0.29
235550
23.31
-0.04
0.26
0.31
238459
23.15
-0.08
0.26
0.32
186143
22.16
-0.08
0.26
0.32
193173
22.11
-0.07
0.26
0.31
41261
17.19
-0.01
0.31
0.38
909334
22.48
-0.07
0.26
0.32
N
SPD [m/s]
NBIAS (MEDIUM LAYER)
NMVD (400-700 hPa)
NRMSVD
8532
14.64
-0.05
0.31
0.48
37419
12.08
-0.18
0.38
0.46
34188
11.94
-0.18
0.38
0.45
21401
16.90
0.02
0.37
0.46
84678
15.10
-0.05
0.37
0.45
86936
14.61
-0.12
0.35
0.43
86010
14.69
-0.11
0.35
0.43
7248
13.51
0.09
0.40
0.47
366412
14.35
-0.10
0.36
0.44
N
SPD [m/s]
NBIAS (LOW LAYER)
NMVD (700-1000 hPa)
NRMSVD
8350
9.64
-0.02
0.44
0.52
59802
9.52
-0.12
0.44
0.51
52989
9.54
-0.12
0.44
0.52
8694
12.09
-0.09
0.38
0.46
39993
10.14
-0.12
0.41
0.48
37937
10.18
-0.12
0.40
0.48
207765
9.88
-0.11
0.43
0.50
Table 7: Validation parameters for GEO-HRW-v50 (Jul 2009-Jun 2010, MSG2 satellite, 12:00 UTC, European and Mediterranean area;
Basic AMVs; Cross correlation tracking; CCC height assignment with Microphysics correction)
In common with all AMV procedures, statistics are better for the High layer and degrade progressively for the Medium and Low layer.
Comparing the statistics for the different satellite channels, the MVD and NRMSVD seem very different considering all layers together, with changes larger than the 50% between the best case (Cloudy WV062 AMVs) and the worst case (Cloudy VIS08 AMVs). Nevertheless, this is only caused by the different proportion of AMVs in the different layers for each channel. Inside each one of them, differences of NMVD and NRMSVD for the different channels are much smaller.
Scientific and Validation Report for the Wind product processors
of the NWC/GEO
Code: NWC/CDOP2/GEO/AEMET/SCI/VR/Wind Issue: 1.0 Date: 15 October 2016 File: NWC-CDOP2-GEO-AEMET-SCI-VR-Wind_v1.0.doc Page: 18/37
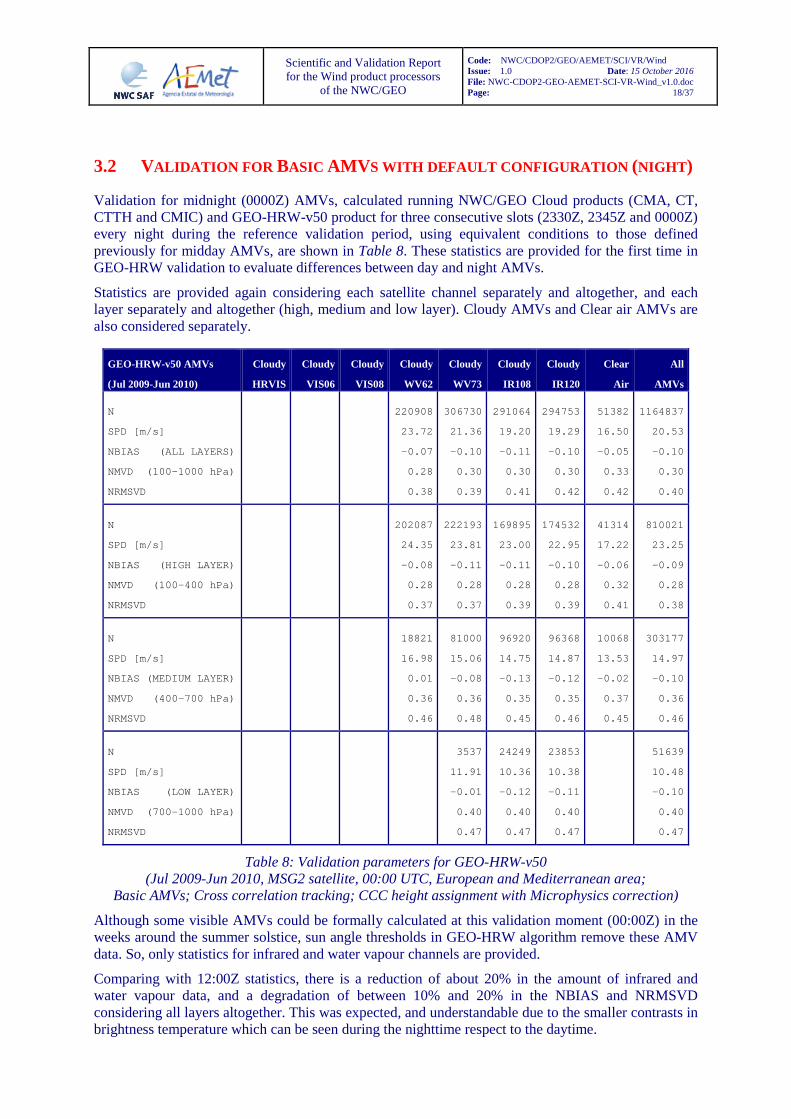
3.2 VALIDATION FOR BASIC AMV S WITH DEFAULT CONFIGURATION (NIGHT )
Validation for midnight (0000Z) AMVs, calculated running NWC/GEO Cloud products (CMA, CT, CTTH and CMIC) and GEO-HRW-v50 product for three consecutive slots (2330Z, 2345Z and 0000Z) every night during the reference validation period, using equivalent conditions to those defined previously for midday AMVs, are shown in Table 8. These statistics are provided for the first time in GEO-HRW validation to evaluate differences between day and night AMVs.
Statistics are provided again considering each satellite channel separately and altogether, and each layer separately and altogether (high, medium and low layer). Cloudy AMVs and Clear air AMVs are also considered separately.
GEO-HRW-v50 AMVs
(Jul 2009-Jun 2010)
Cloudy
HRVIS
Cloudy
VIS06
Cloudy
VIS08
Cloudy
WV62
Cloudy
WV73
Cloudy
IR108
Cloudy
IR120
Clear
Air
All
AMVs
N
SPD [m/s]
NBIAS (ALL LAYERS)
NMVD (100-1000 hPa)
NRMSVD
220908
23.72
-0.07
0.28
0.38
306730
21.36
-0.10
0.30
0.39
291064
19.20
-0.11
0.30
0.41
294753
19.29
-0.10
0.30
0.42
51382
16.50
-0.05
0.33
0.42
1164837
20.53
-0.10
0.30
0.40
N
SPD [m/s]
NBIAS (HIGH LAYER)
NMVD (100-400 hPa)
NRMSVD
202087
24.35
-0.08
0.28
0.37
222193
23.81
-0.11
0.28
0.37
169895
23.00
-0.11
0.28
0.39
174532
22.95
-0.10
0.28
0.39
41314
17.22
-0.06
0.32
0.41
810021
23.25
-0.09
0.28
0.38
N
SPD [m/s]
NBIAS ( MEDIUM LAYER)
NMVD (400-700 hPa)
NRMSVD
18821
16.98
0.01
0.36
0.46
81000
15.06
-0.08
0.36
0.48
96920
14.75
-0.13
0.35
0.45
96368
14.87
-0.12
0.35
0.46
10068
13.53
-0.02
0.37
0.45
303177
14.97
-0.10
0.36
0.46
N
SPD [m/s]
NBIAS (LOW LAYER)
NMVD (700-1000 hPa)
NRMSVD
3537
11.91
-0.01
0.40
0.47
24249
10.36
-0.12
0.40
0.47
23853
10.38
-0.11
0.40
0.47
51639
10.48
-0.10
0.40
0.47
Table 8: Validation parameters for GEO-HRW-v50 (Jul 2009-Jun 2010, MSG2 satellite, 00:00 UTC, European and Mediterranean area;
Basic AMVs; Cross correlation tracking; CCC height assignment with Microphysics correction)
Although some visible AMVs could be formally calculated at this validation moment (00:00Z) in the weeks around the summer solstice, sun angle thresholds in GEO-HRW algorithm remove these AMV data. So, only statistics for infrared and water vapour channels are provided.
Comparing with 12:00Z statistics, there is a reduction of about 20% in the amount of infrared and water vapour data, and a degradation of between 10% and 20% in the NBIAS and NRMSVD considering all layers altogether. This was expected, and understandable due to the smaller contrasts in brightness temperature which can be seen during the nighttime respect to the daytime.

Scientific and Validation Report for the Wind product processors
of the NWC/GEO
Code: NWC/CDOP2/GEO/AEMET/SCI/VR/Wind Issue: 1.0 Date: 15 October 2016 File: NWC-CDOP2-GEO-AEMET-SCI-VR-Wind_v1.0.doc Page: 19/37
3.3 COMPARISON WITH GEO-HRW-V40 DEFAULT CONFIGURATION
The default conditions defined in chapter 3.1 are equivalent to those defined in the Validation statistics for the previous version of GEO-HRW algorithm (GEO-HRW-v40 or GEO-HRW v2013), which are shown in Table 9. So a comparison between both versions can be made.
GEO-HRW-v50 AMVs
(Jul 2009-Jun 2010)
Cloudy
HRVIS
Cloudy
VIS06
Cloudy
VIS08
Cloudy
WV62
Cloudy
WV73
Cloudy
IR108
Cloudy
IR120
Clear
Air
All
AMVs
N
SPD [m/s]
NBIAS (ALL LAYERS)
NMVD (100-1000 hPa)
NRMSVD
47280
16.14
-0.10
0.31
0.38
100836
11.04
-0.18
0.42
0.50
91677
11.04
-0.18
0.42
0.50
189804
23.51
-0.06
0.26
0.32
262992
21.28
-0.08
0.28
0.35
251524
19.58
-0.12
0.30
0.37
252375
19.74
-0.11
0.29
0.36
43004
16.52
0.00
0.33
0.40
1239492
19.01
-0.10
0.31
0.38
N
SPD [m/s]
NBIAS (HIGH LAYER)
NMVD (100-400 hPa)
NRMSVD
20317
23.22
-0.10
0.26
0.31
181417
23.76
-0.06
0.25
0.31
198792
23.24
-0.09
0.26
0.32
167513
22.85
-0.12
0.27
0.34
171248
22.83
-0.11
0.27
0.33
37454
16.98
-0.01
0.32
0.39
776741
22.88
-0.09
0.27
0.33
N
SPD [m/s]
NBIAS (MEDIUM LAYER)
NMVD (400-700 hPa)
NRMSVD
12774
12.84
-0.13
0.37
0.45
51714
12.68
-0.20
0.40
0.47
48729
12.54
-0.21
0.40
0.48
8387
17.96
0.00
0.34
0.42
57466
15.62
-0.03
0.37
0.45
50698
15.27
-0.11
0.35
0.43
49329
15.34
-0.09
0.36
0.44
5550
13.45
0.10
0.40
0.47
284647
14.35
-0.12
0.37
0.45
N
SPD [m/s]
NBIAS (LOW LAYER)
NMVD (700-1000 hPa)
NRMSVD
14189
8.96
-0.06
0.46
0.54
49122
9.31
-0.13
0.45
0.53
42948
9.32
-0.13
0.46
0.54
6734
11.90
-0.03
0.42
0.50
33313
9.73
-0.09
0.42
0.50
30699
9.83
-0.10
0.42
0.50
177005
9.55
-0.11
0.44
0.52
Table 9: Validation parameters for GEO-HRW-v40 (HRW v2013) (Jul 2009-Jun 2010, MSG2 satellite, 12:00 UTC, European and Mediterranean area;
Basic AMVs; Cross correlation tracking; CCC height assignment without Microphysics correction)
It can be seen that all Validation parameters improve for GEO-HRW-v50, with:
• An increase in the amount of compared AMVs of about a 20% (from 1239492 to 1483511),
• A reduction in the NBIAS of about a 20% (from -0.10 to -0.08),
• Smaller reductions in the NMVD (from 0.31 to 0.30) and NRMSVD (from 0.38 to 0.36).
This improvements can be seen considering all layers altogether, and also each layer separately. So, the evolution of GEO-HRW-v50 respect to previous versions of the algorithm is positive, for each layer and altogether, providing more AMV data with a better quality.
Scientific and Validation Report for the Wind product processors
of the NWC/GEO
Code: NWC/CDOP2/GEO/AEMET/SCI/VR/Wind Issue: 1.0 Date: 15 October 2016 File: NWC-CDOP2-GEO-AEMET-SCI-VR-Wind_v1.0.doc Page: 20/37
3.4 VALIDATION FOR BASIC AMV S WITHOUT M ICROPHYSICS CORRECTION
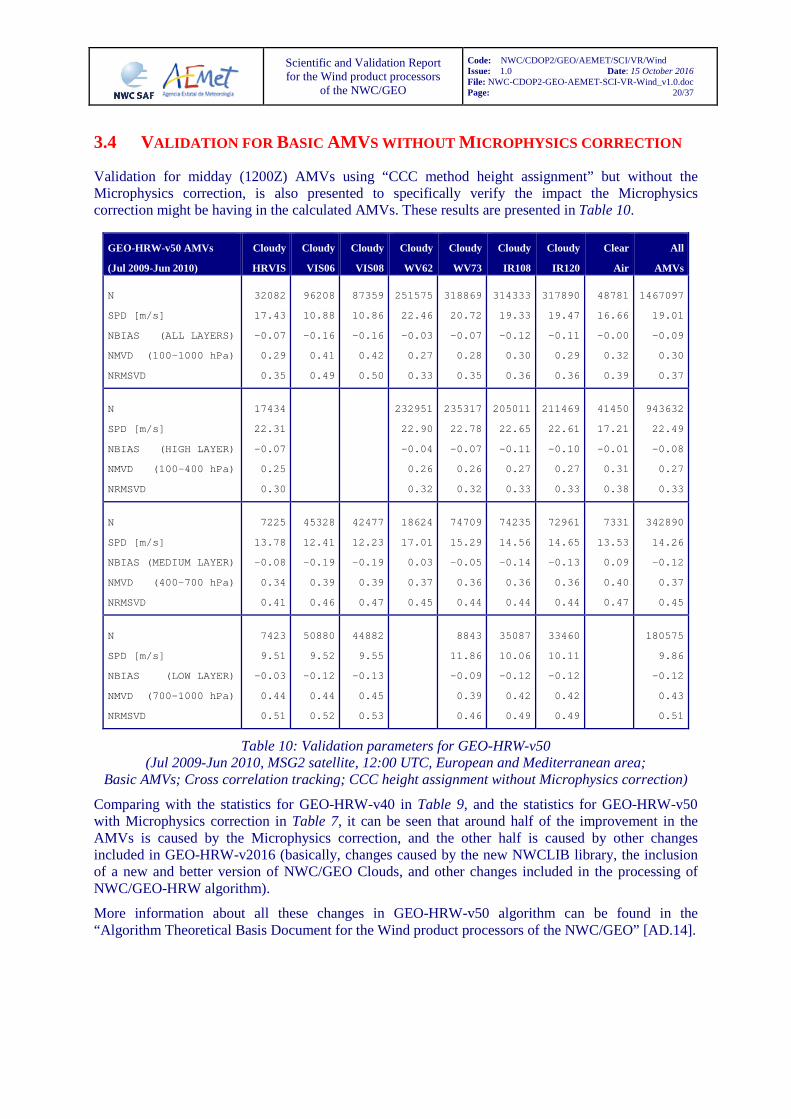
Validation for midday (1200Z) AMVs using “CCC method height assignment” but without the Microphysics correction, is also presented to specifically verify the impact the Microphysics correction might be having in the calculated AMVs. These results are presented in Table 10.
GEO-HRW-v50 AMVs
(Jul 2009-Jun 2010)
Cloudy
HRVIS
Cloudy
VIS06
Cloudy
VIS08
Cloudy
WV62
Cloudy
WV73
Cloudy
IR108
Cloudy
IR120
Clear
Air
All
AMVs
N
SPD [m/s]
NBIAS (ALL LAYERS)
NMVD (100-1000 hPa)
NRMSVD
32082
17.43
-0.07
0.29
0.35
96208
10.88
-0.16
0.41
0.49
87359
10.86
-0.16
0.42
0.50
251575
22.46
-0.03
0.27
0.33
318869
20.72
-0.07
0.28
0.35
314333
19.33
-0.12
0.30
0.36
317890
19.47
-0.11
0.29
0.36
48781
16.66
-0.00
0.32
0.39
1467097
19.01
-0.09
0.30
0.37
N
SPD [m/s]
NBIAS (HIGH LAYER)
NMVD (100-400 hPa)
NRMSVD
17434
22.31
-0.07
0.25
0.30
232951
22.90
-0.04
0.26
0.32
235317
22.78
-0.07
0.26
0.32
205011
22.65
-0.11
0.27
0.33
211469
22.61
-0.10
0.27
0.33
41450
17.21
-0.01
0.31
0.38
943632
22.49
-0.08
0.27
0.33
N
SPD [m/s]
NBIAS (MEDIUM LAYER)
NMVD (400-700 hPa)
NRMSVD
7225
13.78
-0.08
0.34
0.41
45328
12.41
-0.19
0.39
0.46
42477
12.23
-0.19
0.39
0.47
18624
17.01
0.03
0.37
0.45
74709
15.29
-0.05
0.36
0.44
74235
14.56
-0.14
0.36
0.44
72961
14.65
-0.13
0.36
0.44
7331
13.53
0.09
0.40
0.47
342890
14.26
-0.12
0.37
0.45
N
SPD [m/s]
NBIAS (LOW LAYER)
NMVD (700-1000 hPa)
NRMSVD
7423
9.51
-0.03
0.44
0.51
50880
9.52
-0.12
0.44
0.52
44882
9.55
-0.13
0.45
0.53
8843
11.86
-0.09
0.39
0.46
35087
10.06
-0.12
0.42
0.49
33460
10.11
-0.12
0.42
0.49
180575
9.86
-0.12
0.43
0.51
Table 10: Validation parameters for GEO-HRW-v50 (Jul 2009-Jun 2010, MSG2 satellite, 12:00 UTC, European and Mediterranean area;
Basic AMVs; Cross correlation tracking; CCC height assignment without Microphysics correction)
Comparing with the statistics for GEO-HRW-v40 in Table 9, and the statistics for GEO-HRW-v50 with Microphysics correction in Table 7, it can be seen that around half of the improvement in the AMVs is caused by the Microphysics correction, and the other half is caused by other changes included in GEO-HRW-v2016 (basically, changes caused by the new NWCLIB library, the inclusion of a new and better version of NWC/GEO Clouds, and other changes included in the processing of NWC/GEO-HRW algorithm).
More information about all these changes in GEO-HRW-v50 algorithm can be found in the “Algorithm Theoretical Basis Document for the Wind product processors of the NWC/GEO” [AD.14].
Scientific and Validation Report for the Wind product processors
of the NWC/GEO
Code: NWC/CDOP2/GEO/AEMET/SCI/VR/Wind Issue: 1.0 Date: 15 October 2016 File: NWC-CDOP2-GEO-AEMET-SCI-VR-Wind_v1.0.doc Page: 21/37
3.5 VALIDATION FOR BASIC AMV S WITHOUT CLOUD PRODUCTS
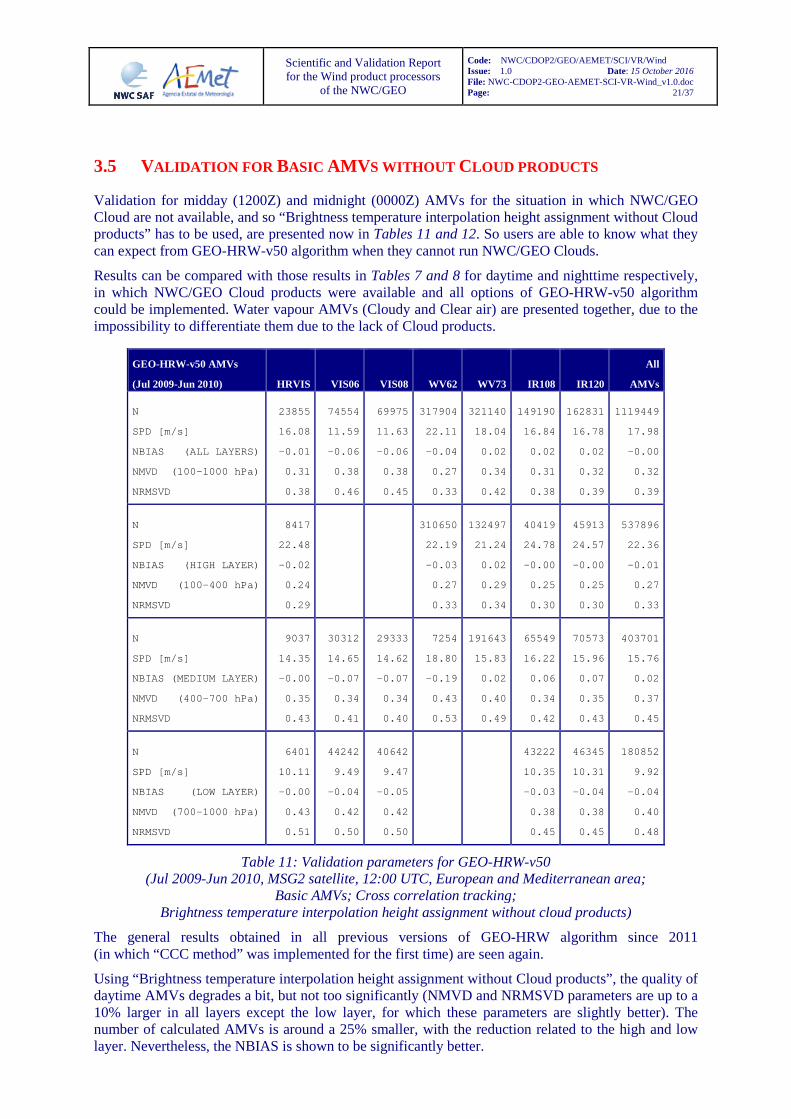
Validation for midday (1200Z) and midnight (0000Z) AMVs for the situation in which NWC/GEO Cloud are not available, and so “Brightness temperature interpolation height assignment without Cloud products” has to be used, are presented now in Tables 11 and 12. So users are able to know what they can expect from GEO-HRW-v50 algorithm when they cannot run NWC/GEO Clouds.
Results can be compared with those results in Tables 7 and 8 for daytime and nighttime respectively, in which NWC/GEO Cloud products were available and all options of GEO-HRW-v50 algorithm could be implemented. Water vapour AMVs (Cloudy and Clear air) are presented together, due to the impossibility to differentiate them due to the lack of Cloud products.
GEO-HRW-v50 AMVs
(Jul 2009-Jun 2010)
HRVIS
VIS06
VIS08
WV62
WV73
IR108
IR120
All
AMVs
N
SPD [m/s]
NBIAS (ALL LAYERS)
NMVD (100-1000 hPa)
NRMSVD
23855
16.08
-0.01
0.31
0.38
74554
11.59
-0.06
0.38
0.46
69975
11.63
-0.06
0.38
0.45
317904
22.11
-0.04
0.27
0.33
321140
18.04
0.02
0.34
0.42
149190
16.84
0.02
0.31
0.38
162831
16.78
0.02
0.32
0.39
1119449
17.98
-0.00
0.32
0.39
N
SPD [m/s]
NBIAS (HIGH LAYER)
NMVD (100-400 hPa)
NRMSVD
8417
22.48
-0.02
0.24
0.29
310650
22.19
-0.03
0.27
0.33
132497
21.24
0.02
0.29
0.34
40419
24.78
-0.00
0.25
0.30
45913
24.57
-0.00
0.25
0.30
537896
22.36
-0.01
0.27
0.33
N
SPD [m/s]
NBIAS (MEDIUM LAYER)
NMVD (400-700 hPa)
NRMSVD
9037
14.35
-0.00
0.35
0.43
30312
14.65
-0.07
0.34
0.41
29333
14.62
-0.07
0.34
0.40
7254
18.80
-0.19
0.43
0.53
191643
15.83
0.02
0.40
0.49
65549
16.22
0.06
0.34
0.42
70573
15.96
0.07
0.35
0.43
403701
15.76
0.02
0.37
0.45
N
SPD [m/s]
NBIAS (LOW LAYER)
NMVD (700-1000 hPa)
NRMSVD
6401
10.11
-0.00
0.43
0.51
44242
9.49
-0.04
0.42
0.50
40642
9.47
-0.05
0.42
0.50
43222
10.35
-0.03
0.38
0.45
46345
10.31
-0.04
0.38
0.45
180852
9.92
-0.04
0.40
0.48
Table 11: Validation parameters for GEO-HRW-v50 (Jul 2009-Jun 2010, MSG2 satellite, 12:00 UTC, European and Mediterranean area;
Basic AMVs; Cross correlation tracking; Brightness temperature interpolation height assignment without cloud products)
The general results obtained in all previous versions of GEO-HRW algorithm since 2011 (in which “CCC method” was implemented for the first time) are seen again.
Using “Brightness temperature interpolation height assignment without Cloud products”, the quality of daytime AMVs degrades a bit, but not too significantly (NMVD and NRMSVD parameters are up to a 10% larger in all layers except the low layer, for which these parameters are slightly better). The number of calculated AMVs is around a 25% smaller, with the reduction related to the high and low layer. Nevertheless, the NBIAS is shown to be significantly better.

Scientific and Validation Report for the Wind product processors
of the NWC/GEO
Code: NWC/CDOP2/GEO/AEMET/SCI/VR/Wind Issue: 1.0 Date: 15 October 2016 File: NWC-CDOP2-GEO-AEMET-SCI-VR-Wind_v1.0.doc Page: 22/37
GEO-HRW-v50 AMVs
(Jul 2009-Jun 2010)
HRVIS
VIS06
VIS08
WV62
WV73
IR108
IR120
All
AMVs
N
SPD [m/s]
NBIAS (ALL LAYERS)
NMVD (100-1000 hPa)
NRMSVD
266124
22.71
-0.06
0.28
0.38
314701
18.29
-0.01
0.34
0.43
154226
17.19
-0.00
0.32
0.439
163095
17.26
-0.00
0.32
0.39
898146
19.22
-0.02
0.31
0.40
N
SPD [m/s]
NBIAS (HIGH LAYER)
NMVD (100-400 hPa)
NRMSVD
260361
22.79
-0.06
0.28
0.38
125203
21.96
-0.02
0.28
0.36
40102
25.54
-0.04
0.26
0.33
44187
25.471
-0.04
0.26
0.32
469853
23.06
-0.04
0.27
0.36
N
SPD [m/s]
NBIAS (MEDIUM LAYER)
NMVD (400-700 hPa)
NRMSVD
5763
18.76
-0.17
0.43
0.55
189498
15.86
-0.00
0.39
0.49
77657
15.97
0.02
0.34
0.41
81528
15.85
0.02
0.34
0.41
354446
15.93
0.00
0.37
0.46
N
SPD [m/s]
NBIAS (LOW LAYER)
NMVD (700-1000 hPa)
NRMSVD
36467
10.58
-0.01
0.40
0.48
37380
10.64
-0.01
0.40
0.47
73847
10.61
-0.01
0.40
0.47
Table 12: Validation parameters for GEO-HRW-v50 (Jul 2009-Jun 2010, MSG2 satellite, 00:00 UTC, European and Mediterranean area;
Basic AMVs; Cross correlation tracking; Brightness temperature interpolation height assignment without cloud products)
In nighttime AMVs, the effect of “CCC height assignment with Microphysics correction” in the NMSVD and NRMSVD is shown to be smaller (so showing that the NWC/GEO Cloud products are calculated during the nighttime using less satellite channels).
Due to the small differences existing in the NRMSVD parameter with both height assignments, the situation respect to the GEO-HRW Product Requirement Table accuracies is exactly the same (with all layers for both height assignments complying with the “Target accuracy”; high layer AMVs during daytime for both height assignments also complying with the “Optimal accuracy”).
So, NWC/GEO users can perfectly use GEO-HRW-v50 operatively with MSG satellite series, even in the case in which NWC/GEO Clouds are not available.
For clarification for the users, a deeper analysis of the question "Which and in which cases each height assignment method works better?" is going to be done next.
Scientific and Validation Report for the Wind product processors
of the NWC/GEO
Code: NWC/CDOP2/GEO/AEMET/SCI/VR/Wind Issue: 1.0 Date: 15 October 2016 File: NWC-CDOP2-GEO-AEMET-SCI-VR-Wind_v1.0.doc Page: 23/37
3.6 COMPARISON BETWEEN HEIGHT ASSIGNMENT PROCEDURES
On one side, the fact that “CCC method height assignment with microphysics correction” is able to calculate around a 25% more of AMVs than “Brightness temperature interpolation height assignment without Cloud products” with similar quality thresholds and NMVD/NRMSVD validation parameters, should be a cause to prefer this height assignment method in the AMV processing.
On the other side, calculating statistics respect to the “Radiosounding best fit level", which means the best possible statistics only through changes in the height assignment, both height assignment procedures show NBIAS values of 0.00, NMVD values of 0.20, and NRMSVD values of 0.33. So, it can be seen that any additional impact of the height assignment in the validation statistics is small. The NBIAS can be reduced to zero, but the NMVD and NRMSVD can only be reduced slightly.
One additional question can be raised from this: How both height assignment methods behave considering the "difference between the AMV level and the AMV best fit level respect to Radiosounding data".
Next table shows the mean value of this "difference" and the "absolute difference" between the “AMV best fit level” and the “AMV level”, for all layers and both height assignment methods:
Brightness Temp. Interpolation without Clouds Height Assignment
Mean PBestfit – PAMV Mean | PBestfit – PAMV |
CCC Method with Microphysics correction Height Assignment
Mean PBestfit – PAMV Mean | PBestfit – PAMV |
100 – 999 hPa
(ALL LEVELS) -41 hPa 120 hPa -2 hPa 103 hPa
100 – 399 hPa
(HIGH LEVEL) -23 hPa 90 hPa -2 hPa 85 hPa
400 – 699 hPa
(MEDIUM LEVELS) -67 hPa 165 hPa -11 hPa 160 hPa
700 – 999 hPa
(LOW LEVELS) -51 hPa 136 hPa 11 hPa 124 hPa
Table 13: “Mean difference” and “Mean absolute difference” between the “AMV best fit level” and the “AMV level” in the different layers
(Jul 2009-Jun 2010, MSG2 satellite, 12:00 UTC, European and Mediterranean area; Basic AMVs; Cross correlation tracking;
“Brightness temperature interpolation height assignment without cloud products” compared to “CCC method height assignment with microphysics correction”)
“CCC method height assignment with microphysics correction” behaves clearly much better, with a mean “difference” of only 2 hPa with the “AMV best fit level" as a whole, and less than 12 hPa at all three layers (high, medium and low). The dispersion respect to the "AMV best fit level" can nevertheless be important, with a mean value of the “absolute difference” of 103 hPa.
“Brightness temperature interpolation height assignment without Cloud products” behaves much worse, with the "AMV best fit level" located 41 hPa higher in the atmosphere as a whole. This issue (to systematically locate the AMVs at a lower level than the optimal one) can contribute to artificially reduce the NBIAS to 0, when this height assignment is used. So, no worries should occur with the fact of obtaining smaller NBIAS values with this method, because this does not directly mean that the corresponding AMVs are better. On the other side, the “absolute difference” is also higher, with a mean value of 120 hPa.
Next table shows the “difference” and “absolute difference” values between the “AMV best fit level” and the “AMV level”, for AMVs related to the different cloud types when “CCC method height assignment with microphysics correction” is used.

Scientific and Validation Report for the Wind product processors
of the NWC/GEO
Code: NWC/CDOP2/GEO/AEMET/SCI/VR/Wind Issue: 1.0 Date: 15 October 2016 File: NWC-CDOP2-GEO-AEMET-SCI-VR-Wind_v1.0.doc Page: 24/37
CCC Method with Microphysics correction Height Assignment
Mean PBestfit – PAMV Mean | PBestfit – PAMV |
Clear air -66 hPa 124 hPa
Very low cumulus/stratus 4 hPa 116 hPa
Low cumulus/stratus 20 hPa 146 hPa
Medium cumulus/stratus 6 hPa 166 hPa
High cumulus/stratus 7 hPa 103 hPa
Very high cumulus/stratus 26 hPa 89 hPa
High semitransparent thin -21 hPa 72 hPa
High semitransparent meanly thick -9 hPa 71 hPa
High semitransparent thick -7 hPa 84 hPa
High semitransparent above other clouds -37 hPa 100 hPa
Table 14: “Mean difference” and “Mean absolute difference” between the “AMV best fit level” and the “AMV level” for the different cloud types
(Jul 2009-Jun 2010, MSG2 satellite, 12:00 UTC, European and Mediterranean area; Basic AMVs; Cross correlation tracking;
“CCC method height assignment with microphysics correction”)
In general, considering the “mean difference” between the “AMV best fit level” and the “AMV level”, all cloud types behave well. Only "clear air AMVs" (which are not affected by the Microphysics correction) and "AMVs related to high semitransparent clouds above other clouds" have differences with respect to the best fit level larger than 26 hPa.
The different behaviour between cumulus/stratus on one side (with a higher dispersion with respect to the best fit level, and a best fit level tending to be at a level nearer to the ground than the AMV level) and cirrus on the other side (with a smaller dispersion with respect to the best fit level, and a best fit tending to be at a level higher in the atmosphere than the AMV level) is also remarkable. These results give a hint about how the "Microphysics correction" could be retuned considering the different cloud types (separating cirrus from cumulus/stratus).
In any case, the results in these two tables give enough confidence to say that “CCC method with microphysics correction” works better as AMV height assignment method, and that it works well for all atmospheric layers and cloud types (being clear air AMVs the ones with a worse behaviour).
Scientific and Validation Report for the Wind product processors
of the NWC/GEO
Code: NWC/CDOP2/GEO/AEMET/SCI/VR/Wind Issue: 1.0 Date: 15 October 2016 File: NWC-CDOP2-GEO-AEMET-SCI-VR-Wind_v1.0.doc Page: 25/37
4. VALIDATION OF GEO-HRW-V50 MSG DETAILED AMVS
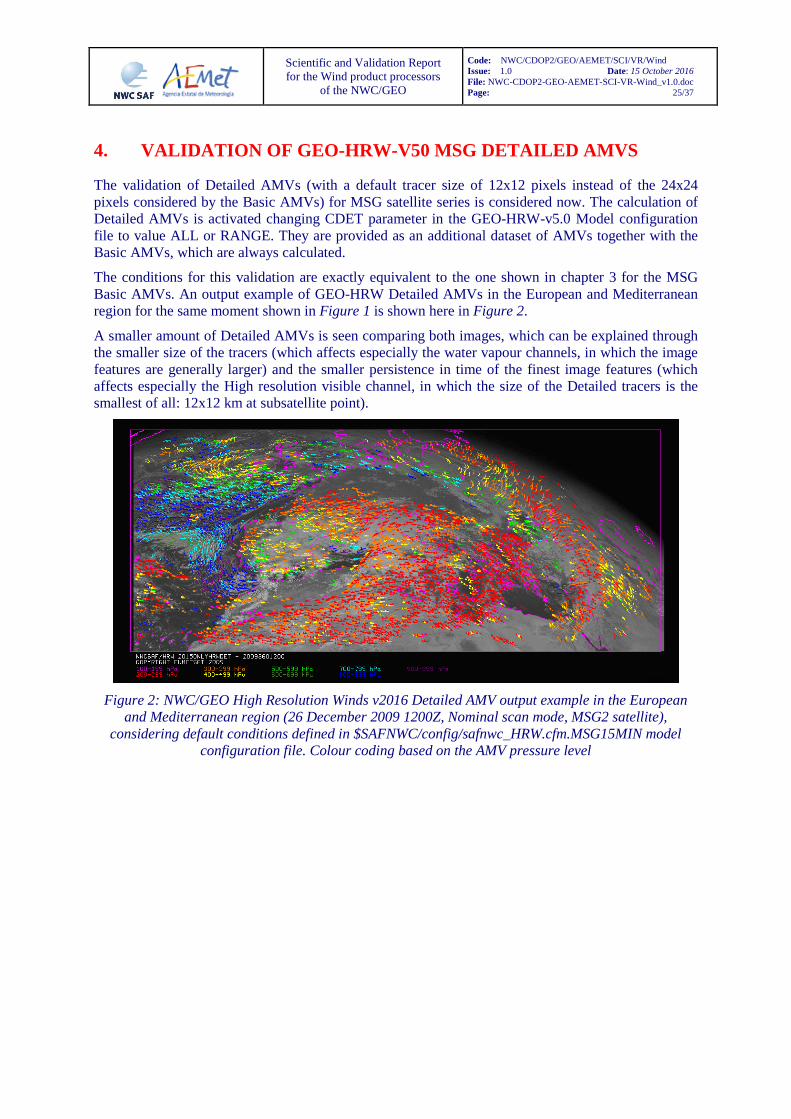
The validation of Detailed AMVs (with a default tracer size of 12x12 pixels instead of the 24x24 pixels considered by the Basic AMVs) for MSG satellite series is considered now. The calculation of Detailed AMVs is activated changing CDET parameter in the GEO-HRW-v5.0 Model configuration file to value ALL or RANGE. They are provided as an additional dataset of AMVs together with the Basic AMVs, which are always calculated.
The conditions for this validation are exactly equivalent to the one shown in chapter 3 for the MSG Basic AMVs. An output example of GEO-HRW Detailed AMVs in the European and Mediterranean region for the same moment shown in Figure 1 is shown here in Figure 2.
A smaller amount of Detailed AMVs is seen comparing both images, which can be explained through the smaller size of the tracers (which affects especially the water vapour channels, in which the image features are generally larger) and the smaller persistence in time of the finest image features (which affects especially the High resolution visible channel, in which the size of the Detailed tracers is the smallest of all: 12x12 km at subsatellite point).
Figure 2: NWC/GEO High Resolution Winds v2016 Detailed AMV output example in the European and Mediterranean region (26 December 2009 1200Z, Nominal scan mode, MSG2 satellite),
considering default conditions defined in $SAFNWC/config/safnwc_HRW.cfm.MSG15MIN model configuration file. Colour coding based on the AMV pressure level

Scientific and Validation Report for the Wind product processors
of the NWC/GEO
Code: NWC/CDOP2/GEO/AEMET/SCI/VR/Wind Issue: 1.0 Date: 15 October 2016 File: NWC-CDOP2-GEO-AEMET-SCI-VR-Wind_v1.0.doc Page: 26/37
4.1 VALIDATION FOR DETAILED AMV S WITH DEFAULT CONFIGURATION
The validation statistics for GEO-HRW-v50 MSG Detailed AMVs using “CCC method height assignment without microphysics correction” at 12:00 UTC, in conditions exactly equivalent to those for Basic AMVs in Table 7 are presented in next table. Statistics have been provided considering each satellite channel separately and altogether, and each layer separately and altogether.
GEO-HRW-v50 AMVs
(Jul 2009-Jun 2010)
Cloudy
HRVIS
Cloudy
VIS06
Cloudy
VIS08
Cloudy
WV62
Cloudy
WV73
Cloudy
IR108
Cloudy
IR120
Clear
Air
All
AMVs
N
SPD [m/s]
NBIAS (ALL LAYERS)
NMVD (100-1000 hPa)
NRMSVD
12463
16.16
-0.02
0.29
0.35
89803
10.65
-0.12
0.40
0.47
86660
10.51
-0.12
0.41
0.48
114603
24.46
-0.03
0.25
0.30
211814
22.64
-0.05
0.26
0.32
256654
19.32
-0.06
0.27
0.33
257092
19.54
-0.05
0.27
0.33
7332
16.39
0.07
0.34
0.42
1036331
19.08
-0.06
0.29
0.35
N
SPD [m/s]
NBIAS (HIGH LAYER)
NMVD (100-400 hPa)
NRMSVD
5302
22.34
-0.02
0.24
0.29
109748
24.77
-0.03
0.25
0.30
175335
24.05
-0.06
0.25
0.31
165105
22.50
-0.06
0.25
0.30
171739
22.41
-0.05
0.25
0.30
5398
17.24
0.05
0.33
0.41
632627
23.25
-0.05
0.25
0.30
N
SPD [m/s]
NBIAS (MEDIUM LAYER)
NMVD (400-700 hPa)
NRMSVD
2984
14.78
-0.02
0.31
0.38
36235
11.70
-0.16
0.38
0.46
34603
11.53
-0.16
0.39
0.46
4855
17.57
0.03
0.37
0.46
34998
16.05
-0.02
0.35
0.44
67629
14.61
-0.08
0.34
0.41
64668
14.76
-0.07
0.34
0.42
1934
14.02
0.12
0.38
0.46
247926
14.05
-0.08
0.35
0.43
N
SPD [m/s]
NBIAS (LOW LAYER)
NMVD (700-1000 hPa)
NRMSVD
4177
9.29
-0.00
0.43
0.50
53568
9.93
-0.09
0.41
0.49
52057
9.83
-0.09
0.42
0.50
1481
12.50
-0.05
0.37
0.44
23830
10.64
-0.10
0.37
0.44
20665
10.67
-0.09
0.37
0.43
155778
10.11
-0.09
0.40
0.47
Table 15: Validation parameters for GEO-HRW-v50 (Jul 2009-Jun 2010, MSG2 satellite, 12:00 UTC, European and Mediterranean area;
Detailed AMVs; Cross correlation tracking; CCC height assignment with Microphysics correction)
Scientific and Validation Report for the Wind product processors
of the NWC/GEO
Code: NWC/CDOP2/GEO/AEMET/SCI/VR/Wind Issue: 1.0 Date: 15 October 2016 File: NWC-CDOP2-GEO-AEMET-SCI-VR-Wind_v1.0.doc Page: 27/37
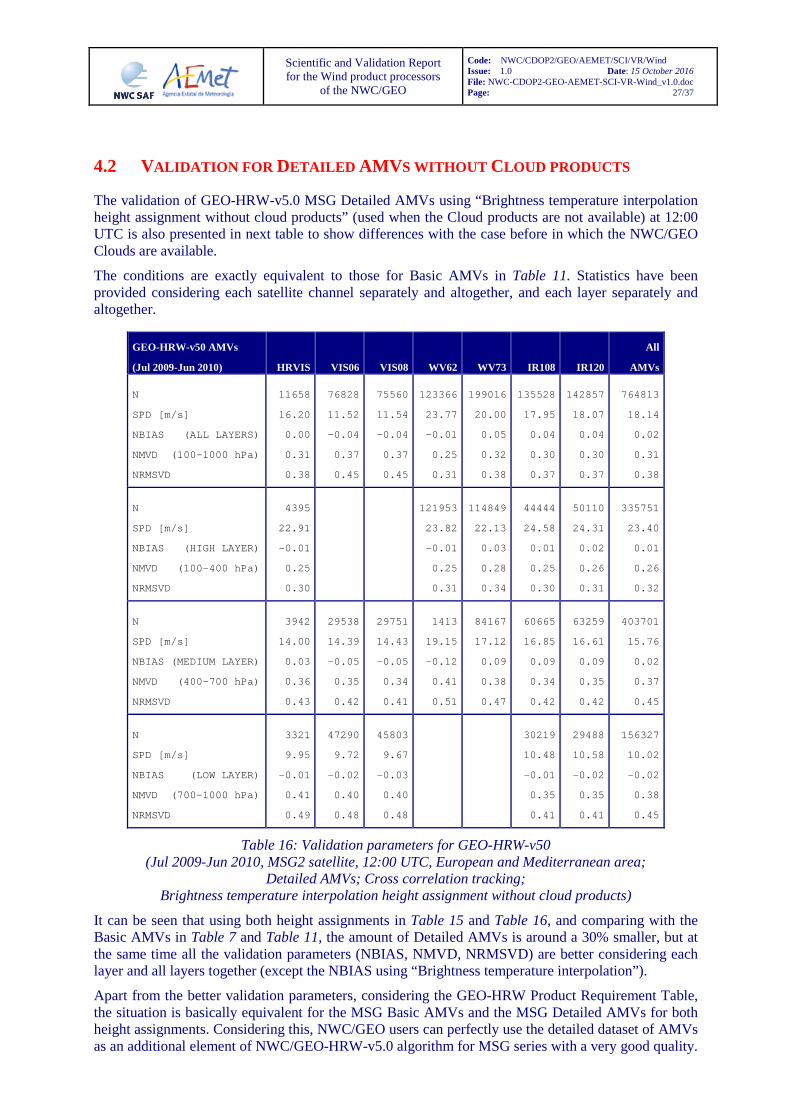
4.2 VALIDATION FOR DETAILED AMV S WITHOUT CLOUD PRODUCTS
The validation of GEO-HRW-v5.0 MSG Detailed AMVs using “Brightness temperature interpolation height assignment without cloud products” (used when the Cloud products are not available) at 12:00 UTC is also presented in next table to show differences with the case before in which the NWC/GEO Clouds are available.
The conditions are exactly equivalent to those for Basic AMVs in Table 11. Statistics have been provided considering each satellite channel separately and altogether, and each layer separately and altogether.
GEO-HRW-v50 AMVs
(Jul 2009-Jun 2010)
HRVIS
VIS06
VIS08
WV62
WV73
IR108
IR120
All
AMVs
N
SPD [m/s]
NBIAS (ALL LAYERS)
NMVD (100-1000 hPa)
NRMSVD
11658
16.20
0.00
0.31
0.38
76828
11.52
-0.04
0.37
0.45
75560
11.54
-0.04
0.37
0.45
123366
23.77
-0.01
0.25
0.31
199016
20.00
0.05
0.32
0.38
135528
17.95
0.04
0.30
0.37
142857
18.07
0.04
0.30
0.37
764813
18.14
0.02
0.31
0.38
N
SPD [m/s]
NBIAS (HIGH LAYER)
NMVD (100-400 hPa)
NRMSVD
4395
22.91
-0.01
0.25
0.30
121953
23.82
-0.01
0.25
0.31
114849
22.13
0.03
0.28
0.34
44444
24.58
0.01
0.25
0.30
50110
24.31
0.02
0.26
0.31
335751
23.40
0.01
0.26
0.32
N
SPD [m/s]
NBIAS (MEDIUM LAYER)
NMVD (400-700 hPa)
NRMSVD
3942
14.00
0.03
0.36
0.43
29538
14.39
-0.05
0.35
0.42
29751
14.43
-0.05
0.34
0.41
1413
19.15
-0.12
0.41
0.51
84167
17.12
0.09
0.38
0.47
60665
16.85
0.09
0.34
0.42
63259
16.61
0.09
0.35
0.42
403701
15.76
0.02
0.37
0.45
N
SPD [m/s]
NBIAS (LOW LAYER)
NMVD (700-1000 hPa)
NRMSVD
3321
9.95
-0.01
0.41
0.49
47290
9.72
-0.02
0.40
0.48
45803
9.67
-0.03
0.40
0.48
30219
10.48
-0.01
0.35
0.41
29488
10.58
-0.02
0.35
0.41
156327
10.02
-0.02
0.38
0.45
Table 16: Validation parameters for GEO-HRW-v50 (Jul 2009-Jun 2010, MSG2 satellite, 12:00 UTC, European and Mediterranean area;
Detailed AMVs; Cross correlation tracking; Brightness temperature interpolation height assignment without cloud products)
It can be seen that using both height assignments in Table 15 and Table 16, and comparing with the Basic AMVs in Table 7 and Table 11, the amount of Detailed AMVs is around a 30% smaller, but at the same time all the validation parameters (NBIAS, NMVD, NRMSVD) are better considering each layer and all layers together (except the NBIAS using “Brightness temperature interpolation”).
Apart from the better validation parameters, considering the GEO-HRW Product Requirement Table, the situation is basically equivalent for the MSG Basic AMVs and the MSG Detailed AMVs for both height assignments. Considering this, NWC/GEO users can perfectly use the detailed dataset of AMVs as an additional element of NWC/GEO-HRW-v5.0 algorithm for MSG series with a very good quality.

Scientific and Validation Report for the Wind product processors
of the NWC/GEO
Code: NWC/CDOP2/GEO/AEMET/SCI/VR/Wind Issue: 1.0 Date: 15 October 2016 File: NWC-CDOP2-GEO-AEMET-SCI-VR-Wind_v1.0.doc Page: 28/37
5. VALIDATION OF GEO-HRW-V50 GOES-N BASIC AMVS
The validation of GEO-HRW-v50 algorithm for GOES-N satellite series is considered now. It is based on the validation of GEO-HRW AMVs calculated during the whole year July 2010 – June 2011 with GOES13 satellite images extracted every 15 minutes, in an area covering the Continental United States. The area is shown in Figure 3.
Figure 3: NWC/GEO High Resolution Winds v2016 Basic AMV output example in the Continental United States region (1 July 2010 1745Z, GOES13 satellite), considering the default conditions
defined in $SAFNWC/config/safnwc_HRW.cfm.GOES15MIN model configuration file. Colour coding based on the AMV pressure level
Next triplets of images for GEO-HRW-v50 algorithm processing, and next Radiosounding data have been considered for the GOES-N validation:
- Images at 23:15Z, 23:30Z and 23:45Z; 23:45Z AMVs validated against 00:00Z Radiosoundings.
- Images at 05:15Z, 05:30Z and 05:45Z; 05:45Z AMVs validated against 06:00Z Radiosoundings.
- Images at 11:15Z, 11:30Z and 11:45Z; 11:45Z AMVs validated against 12:00Z Radiosoundings.
- Images at 17:15Z, 17:30Z and 17:45Z; 17:45Z AMVs validated against 18:00Z Radiosoundings.
No AMVs could be processed at 00:00Z, 06:00Z, 12:00Z and 18:00Z because GOES13 images are not available at these main synoptic hours.
This process every six hours has been used in the statistics to increase the amount of comparisons, especially for visible AMVs. Dawn or dusk occurs at the main synoptic hours 00:00 and 12:00, because of which the number of visible AMVs is much smaller at these moments; at the same time, the number of Radiosoundings at midday time, i.e. 18:00Z, is very limited. Despite of all this, the number of collocations for visible AMVs is still small.
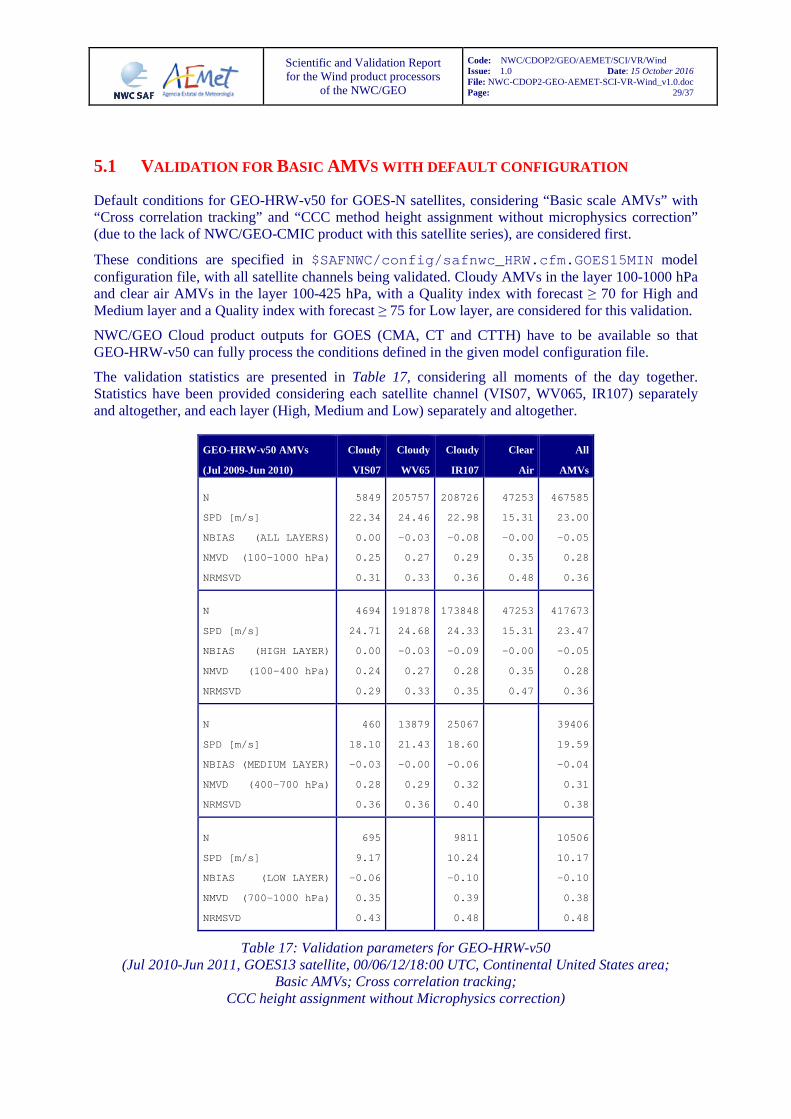
Scientific and Validation Report for the Wind product processors
of the NWC/GEO
Code: NWC/CDOP2/GEO/AEMET/SCI/VR/Wind Issue: 1.0 Date: 15 October 2016 File: NWC-CDOP2-GEO-AEMET-SCI-VR-Wind_v1.0.doc Page: 29/37
5.1 VALIDATION FOR BASIC AMV S WITH DEFAULT CONFIGURATION
Default conditions for GEO-HRW-v50 for GOES-N satellites, considering “Basic scale AMVs” with “Cross correlation tracking” and “CCC method height assignment without microphysics correction” (due to the lack of NWC/GEO-CMIC product with this satellite series), are considered first.
These conditions are specified in $SAFNWC/config/safnwc_HRW.cfm.GOES15MIN model configuration file, with all satellite channels being validated. Cloudy AMVs in the layer 100-1000 hPa and clear air AMVs in the layer 100-425 hPa, with a Quality index with forecast ≥ 70 for High and Medium layer and a Quality index with forecast ≥ 75 for Low layer, are considered for this validation.
NWC/GEO Cloud product outputs for GOES (CMA, CT and CTTH) have to be available so that GEO-HRW-v50 can fully process the conditions defined in the given model configuration file.
The validation statistics are presented in Table 17, considering all moments of the day together. Statistics have been provided considering each satellite channel (VIS07, WV065, IR107) separately and altogether, and each layer (High, Medium and Low) separately and altogether.
GEO-HRW-v50 AMVs
(Jul 2009-Jun 2010)
Cloudy
VIS07
Cloudy
WV65
Cloudy
IR107
Clear
Air
All
AMVs
N
SPD [m/s]
NBIAS (ALL LAYERS)
NMVD (100-1000 hPa)
NRMSVD
5849
22.34
0.00
0.25
0.31
205757
24.46
-0.03
0.27
0.33
208726
22.98
-0.08
0.29
0.36
47253
15.31
-0.00
0.35
0.48
467585
23.00
-0.05
0.28
0.36
N
SPD [m/s]
NBIAS (HIGH LAYER)
NMVD (100-400 hPa)
NRMSVD
4694
24.71
0.00
0.24
0.29
191878
24.68
-0.03
0.27
0.33
173848
24.33
-0.09
0.28
0.35
47253
15.31
-0.00
0.35
0.47
417673
23.47
-0.05
0.28
0.36
N
SPD [m/s]
NBIAS (MEDIUM LA YER)
NMVD (400-700 hPa)
NRMSVD
460
18.10
-0.03
0.28
0.36
13879
21.43
-0.00
0.29
0.36
25067
18.60
-0.06
0.32
0.40
39406
19.59
-0.04
0.31
0.38
N
SPD [m/s]
NBIAS (LOW LAYER)
NMVD (700-1000 hPa)
NRMSVD
695
9.17
-0.06
0.35
0.43
9811
10.24
-0.10
0.39
0.48
10506
10.17
-0.10
0.38
0.48
Table 17: Validation parameters for GEO-HRW-v50 (Jul 2010-Jun 2011, GOES13 satellite, 00/06/12/18:00 UTC, Continental United States area;
Basic AMVs; Cross correlation tracking; CCC height assignment without Microphysics correction)
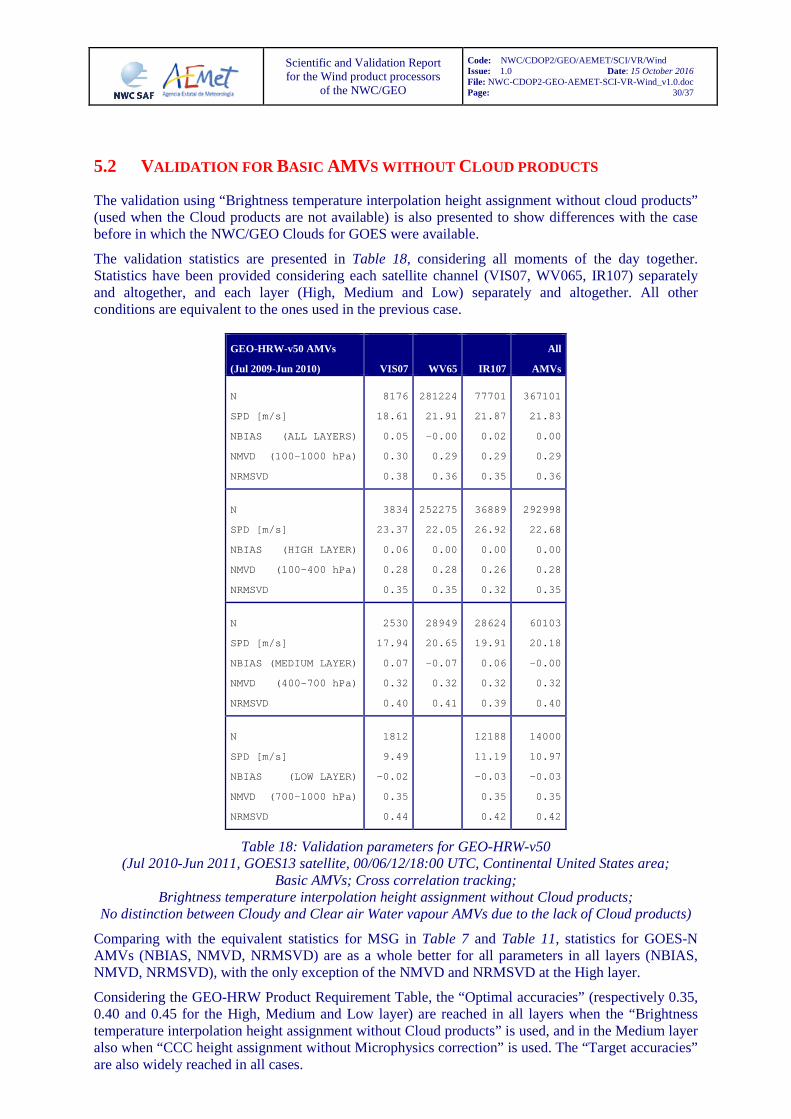
Scientific and Validation Report for the Wind product processors
of the NWC/GEO
Code: NWC/CDOP2/GEO/AEMET/SCI/VR/Wind Issue: 1.0 Date: 15 October 2016 File: NWC-CDOP2-GEO-AEMET-SCI-VR-Wind_v1.0.doc Page: 30/37
5.2 VALIDATION FOR BASIC AMV S WITHOUT CLOUD PRODUCTS
The validation using “Brightness temperature interpolation height assignment without cloud products” (used when the Cloud products are not available) is also presented to show differences with the case before in which the NWC/GEO Clouds for GOES were available.
The validation statistics are presented in Table 18, considering all moments of the day together. Statistics have been provided considering each satellite channel (VIS07, WV065, IR107) separately and altogether, and each layer (High, Medium and Low) separately and altogether. All other conditions are equivalent to the ones used in the previous case.
GEO-HRW-v50 AMVs
(Jul 2009-Jun 2010)
VIS07
WV65
IR107
All
AMVs
N
SPD [m/s]
NBIAS (ALL LAYERS)
NMVD (100-1000 hPa)
NRMSVD
8176
18.61
0.05
0.30
0.38
281224
21.91
-0.00
0.29
0.36
77701
21.87
0.02
0.29
0.35
367101
21.83
0.00
0.29
0.36
N
SPD [m/s]
NBIAS (HIGH LA YER)
NMVD (100-400 hPa)
NRMSVD
3834
23.37
0.06
0.28
0.35
252275
22.05
0.00
0.28
0.35
36889
26.92
0.00
0.26
0.32
292998
22.68
0.00
0.28
0.35
N
SPD [m/s]
NBIAS (MEDIUM LAYER)
NMVD (400-700 hPa)
NRMSVD
2530
17.94
0.07
0.32
0.40
28949
20.65
-0.07
0.32
0.41
28624
19.91
0.06
0.32
0.39
60103
20.18
-0.00
0.32
0.40
N
SPD [m/s]
NBIAS (LOW LAYER)
NMVD (700-1000 hPa)
NRMSVD
1812
9.49
-0.02
0.35
0.44
12188
11.19
-0.03
0.35
0.42
14000
10.97
-0.03
0.35
0.42
Table 18: Validation parameters for GEO-HRW-v50 (Jul 2010-Jun 2011, GOES13 satellite, 00/06/12/18:00 UTC, Continental United States area;
Basic AMVs; Cross correlation tracking; Brightness temperature interpolation height assignment without Cloud products;
No distinction between Cloudy and Clear air Water vapour AMVs due to the lack of Cloud products)
Comparing with the equivalent statistics for MSG in Table 7 and Table 11, statistics for GOES-N AMVs (NBIAS, NMVD, NRMSVD) are as a whole better for all parameters in all layers (NBIAS, NMVD, NRMSVD), with the only exception of the NMVD and NRMSVD at the High layer.
Considering the GEO-HRW Product Requirement Table, the “Optimal accuracies” (respectively 0.35, 0.40 and 0.45 for the High, Medium and Low layer) are reached in all layers when the “Brightness temperature interpolation height assignment without Cloud products” is used, and in the Medium layer also when “CCC height assignment without Microphysics correction” is used. The “Target accuracies” are also widely reached in all cases.
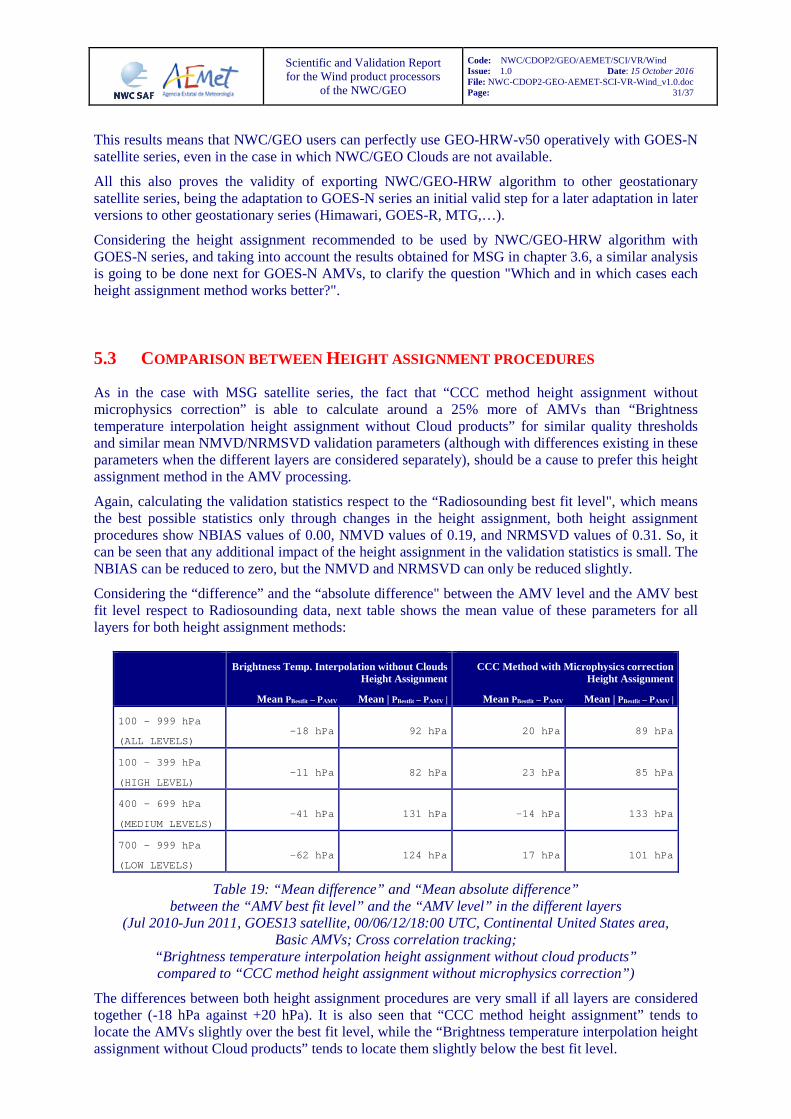
Scientific and Validation Report for the Wind product processors
of the NWC/GEO
Code: NWC/CDOP2/GEO/AEMET/SCI/VR/Wind Issue: 1.0 Date: 15 October 2016 File: NWC-CDOP2-GEO-AEMET-SCI-VR-Wind_v1.0.doc Page: 31/37
This results means that NWC/GEO users can perfectly use GEO-HRW-v50 operatively with GOES-N satellite series, even in the case in which NWC/GEO Clouds are not available.
All this also proves the validity of exporting NWC/GEO-HRW algorithm to other geostationary satellite series, being the adaptation to GOES-N series an initial valid step for a later adaptation in later versions to other geostationary series (Himawari, GOES-R, MTG,…).
Considering the height assignment recommended to be used by NWC/GEO-HRW algorithm with GOES-N series, and taking into account the results obtained for MSG in chapter 3.6, a similar analysis is going to be done next for GOES-N AMVs, to clarify the question "Which and in which cases each height assignment method works better?".
5.3 COMPARISON BETWEEN HEIGHT ASSIGNMENT PROCEDURES
As in the case with MSG satellite series, the fact that “CCC method height assignment without microphysics correction” is able to calculate around a 25% more of AMVs than “Brightness temperature interpolation height assignment without Cloud products” for similar quality thresholds and similar mean NMVD/NRMSVD validation parameters (although with differences existing in these parameters when the different layers are considered separately), should be a cause to prefer this height assignment method in the AMV processing.
Again, calculating the validation statistics respect to the “Radiosounding best fit level", which means the best possible statistics only through changes in the height assignment, both height assignment procedures show NBIAS values of 0.00, NMVD values of 0.19, and NRMSVD values of 0.31. So, it can be seen that any additional impact of the height assignment in the validation statistics is small. The NBIAS can be reduced to zero, but the NMVD and NRMSVD can only be reduced slightly.
Considering the “difference” and the “absolute difference" between the AMV level and the AMV best fit level respect to Radiosounding data, next table shows the mean value of these parameters for all layers for both height assignment methods:
Brightness Temp. Interpolation without Clouds Height Assignment
Mean PBestfit – PAMV Mean | PBestfit – PAMV |
CCC Method with Microphysics correction Height Assignment
Mean PBestfit – PAMV Mean | PBestfit – PAMV |
100 – 999 hPa
(ALL LEVELS) -18 hPa 92 hPa 20 hPa 89 hPa
100 – 399 hPa
(HIGH LEVEL) -11 hPa 82 hPa 23 hPa 85 hPa
400 – 699 hPa
(MEDIUM LEVELS) -41 hPa 131 hPa -14 hPa 133 hPa
700 – 999 hPa
(LOW LEVELS) -62 hPa 124 hPa 17 hPa 101 hPa
Table 19: “Mean difference” and “Mean absolute difference” between the “AMV best fit level” and the “AMV level” in the different layers
(Jul 2010-Jun 2011, GOES13 satellite, 00/06/12/18:00 UTC, Continental United States area, Basic AMVs; Cross correlation tracking;
“Brightness temperature interpolation height assignment without cloud products” compared to “CCC method height assignment without microphysics correction”)
The differences between both height assignment procedures are very small if all layers are considered together (-18 hPa against +20 hPa). It is also seen that “CCC method height assignment” tends to locate the AMVs slightly over the best fit level, while the “Brightness temperature interpolation height assignment without Cloud products” tends to locate them slightly below the best fit level.
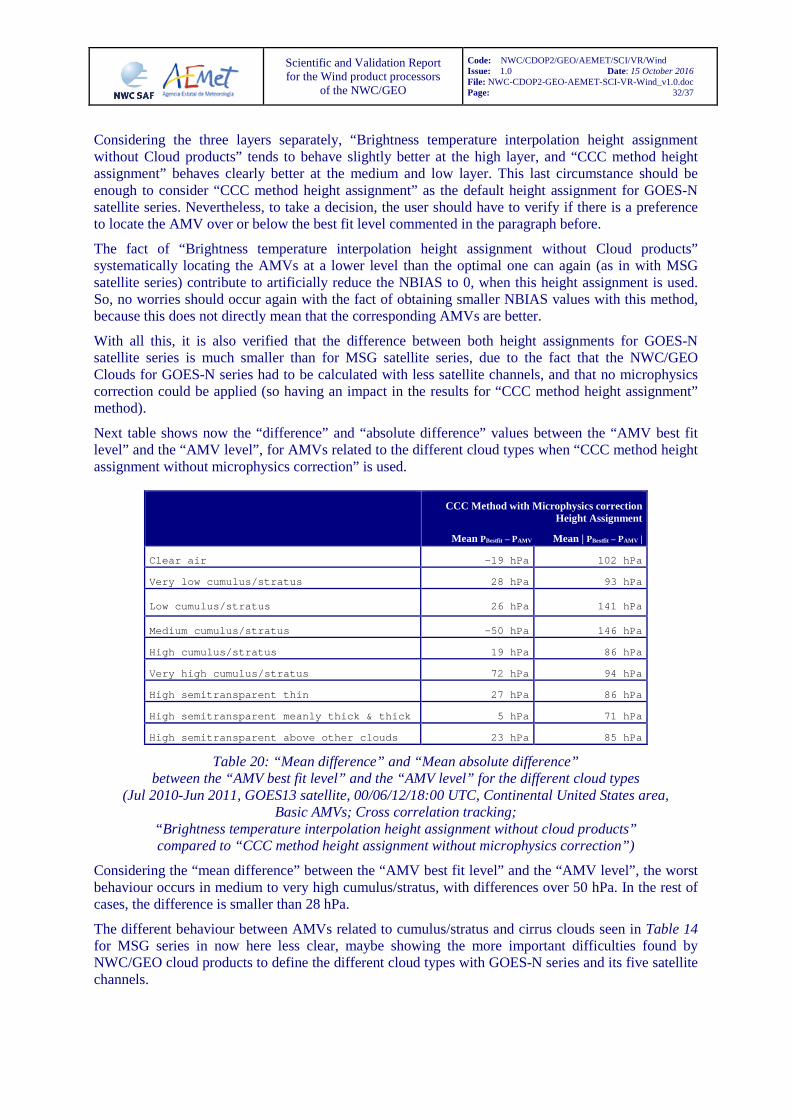
Scientific and Validation Report for the Wind product processors
of the NWC/GEO
Code: NWC/CDOP2/GEO/AEMET/SCI/VR/Wind Issue: 1.0 Date: 15 October 2016 File: NWC-CDOP2-GEO-AEMET-SCI-VR-Wind_v1.0.doc Page: 32/37
Considering the three layers separately, “Brightness temperature interpolation height assignment without Cloud products” tends to behave slightly better at the high layer, and “CCC method height assignment” behaves clearly better at the medium and low layer. This last circumstance should be enough to consider “CCC method height assignment” as the default height assignment for GOES-N satellite series. Nevertheless, to take a decision, the user should have to verify if there is a preference to locate the AMV over or below the best fit level commented in the paragraph before.
The fact of “Brightness temperature interpolation height assignment without Cloud products” systematically locating the AMVs at a lower level than the optimal one can again (as in with MSG satellite series) contribute to artificially reduce the NBIAS to 0, when this height assignment is used. So, no worries should occur again with the fact of obtaining smaller NBIAS values with this method, because this does not directly mean that the corresponding AMVs are better.
With all this, it is also verified that the difference between both height assignments for GOES-N satellite series is much smaller than for MSG satellite series, due to the fact that the NWC/GEO Clouds for GOES-N series had to be calculated with less satellite channels, and that no microphysics correction could be applied (so having an impact in the results for “CCC method height assignment” method).
Next table shows now the “difference” and “absolute difference” values between the “AMV best fit level” and the “AMV level”, for AMVs related to the different cloud types when “CCC method height assignment without microphysics correction” is used.
CCC Method with Microphysics correction Height Assignment
Mean PBestfit – PAMV Mean | PBestfit – PAMV |
Clear air -19 hPa 102 hPa
Very low cumulus/stratus 28 hPa 93 hPa
Low cumulus/stratus 26 hPa 141 hPa
Medium cumulus/stratus -50 hPa 146 hPa
High cumulus/stratus 19 hPa 86 hPa
Very high cumulus/stratus 72 hPa 94 hPa
High semitransparent thin 27 hPa 86 hPa
High semitransparent meanly thick & thick 5 hPa 71 hPa
High semitransparent above other clouds 23 hPa 85 hPa
Table 20: “Mean difference” and “Mean absolute difference” between the “AMV best fit level” and the “AMV level” for the different cloud types
(Jul 2010-Jun 2011, GOES13 satellite, 00/06/12/18:00 UTC, Continental United States area, Basic AMVs; Cross correlation tracking;
“Brightness temperature interpolation height assignment without cloud products” compared to “CCC method height assignment without microphysics correction”)
Considering the “mean difference” between the “AMV best fit level” and the “AMV level”, the worst behaviour occurs in medium to very high cumulus/stratus, with differences over 50 hPa. In the rest of cases, the difference is smaller than 28 hPa.
The different behaviour between AMVs related to cumulus/stratus and cirrus clouds seen in Table 14 for MSG series in now here less clear, maybe showing the more important difficulties found by NWC/GEO cloud products to define the different cloud types with GOES-N series and its five satellite channels.

Scientific and Validation Report for the Wind product processors
of the NWC/GEO
Code: NWC/CDOP2/GEO/AEMET/SCI/VR/Wind Issue: 1.0 Date: 15 October 2016 File: NWC-CDOP2-GEO-AEMET-SCI-VR-Wind_v1.0.doc Page: 33/37
6. VALIDATION OF GEO-HRW-V50 GOES-N DETAILED AMVS
The validation of Detailed AMVs (with a default tracer size of 12x12 pixels instead of the 24x24 pixels considered by the Basic AMVs) for GOES-N satellite series is considered now. As already commented, the calculation of Detailed AMVs is activated changing CDET parameter in the GEO-HRW-v5.0 Model configuration file to value ALL or RANGE.
The conditions for this validation are exactly equivalent to the one shown in chapter 5 for the GOES-N Basic AMVs. An output example of GEO-HRW Detailed AMVs in the Continental United States for the same moment shown in Figure 3 is shown here in Figure 4. A smaller amount of Detailed AMVs is seen comparing both images, as also seen previously for the MSG Detailed AMVs.
Figure 4: NWC/GEO High Resolution Winds v2016 Detailed AMV output example in the Continental United States region (1 July 2010 1745Z, GOES13 satellite), considering the default conditions
defined in $SAFNWC/config/safnwc_HRW.cfm.GOES15MIN model configuration file. Colour coding based on the AMV pressure level

Scientific and Validation Report for the Wind product processors
of the NWC/GEO
Code: NWC/CDOP2/GEO/AEMET/SCI/VR/Wind Issue: 1.0 Date: 15 October 2016 File: NWC-CDOP2-GEO-AEMET-SCI-VR-Wind_v1.0.doc Page: 34/37
6.1 VALIDATION FOR DETAILED AMV S WITH DEFAULT CONFIGURATION
The validation statistics for GEO-HRW-v50 GOES-N Detailed AMVs using “CCC method height assignment without microphysics correction”, in conditions exactly equivalent to those for Basic AMVs in Table 17 are presented in Table 21.
All moments of the day have been considered together (00:00, 06:00, 12:00, 18:00). Statistics have been provided considering each satellite channel (VIS07, WV065, IR107) separately and altogether, and each layer (High, Medium and Low) separately and altogether.
GEO-HRW-v50 AMVs
(Jul 2009-Jun 2010)
Cloudy
VIS07
Cloudy
WV65
Cloudy
IR107
Clear
Air
All
AMVs
N
SPD [m/s]
NBIAS (ALL LAYERS)
NMVD (100-1000 hPa)
NRMSVD
1296
24.23
0.01
0.25
0.32
142084
25.76
-0.01
0.25
0.31
147971
24.58
-0.05
0.26
0.33
8122
16.20
0.05
0.34
0.48
299473
24.93
-0.03
0.26
0.32
N
SPD [m/s]
NBIAS (HIGH LAYER)
NMVD (100-400 hPa)
NRMSVD
1084
26.19
0.02
0.23
0.29
135154
25.92
-0.01
0.25
0.31
128864
25.45
-0.05
0.26
0.32
8122
16.20
0.05
0.34
0.48
273224
25.41
-0.03
0.26
0.32
N
SPD [m/s]
NBIAS (MEDIUM LAYER)
NMVD (400-700 hPa)
NRMSVD
98
19.91
-0.03
0.36
0.49
6930
22.56
0.04
0.28
0.35
16676
19.96
-0.01
0.30
0.38
23704
20.72
0.00
0.30
0.37
N
SPD [m/s]
NBIAS (LOW LAYER)
NMVD (700-1000 hPa)
NRMSVD
114
9.34
-0.05
0.37
0.47
2431
10.17
-0.07
0.35
0.43
2545
10.13
-0.07
0.36
0.43
Table 21: Validation parameters for GEO-HRW-v50 (Jul 2010-Jun 2011, GOES13 satellite, 00/06/12/18:00 UTC, Continental United States area;
Detailed AMVs; Cross correlation tracking; CCC height assignment without Microphysics correction)

Scientific and Validation Report for the Wind product processors
of the NWC/GEO
Code: NWC/CDOP2/GEO/AEMET/SCI/VR/Wind Issue: 1.0 Date: 15 October 2016 File: NWC-CDOP2-GEO-AEMET-SCI-VR-Wind_v1.0.doc Page: 35/37
6.2 VALIDATION FOR DETAILED AMV S WITHOUT CLOUD PRODUCTS
The validation statistics of GEO-HRW-v5.0 GOES-N Detailed AMVs using “Brightness temperature interpolation height assignment without cloud products” (used when Cloud products are not available) is presented to show differences with the case before in which the NWC/GEO Clouds are available.
The validation statistics are presented in Table 22, considering all moments of the day together. Statistics have been provided considering each satellite channel (VIS07, WV065, IR107) separately and altogether, and each layer (High, Medium and Low) separately and altogether. Conditions are equivalent to the ones used in the cases for Basic AMVs in Table 18.
GEO-HRW-v50 AMVs
(Jul 2009-Jun 2010)
VIS07
WV65
IR107
All
AMVs
N
SPD [m/s]
NBIAS (ALL LAYERS)
NMVD (100-1000 hPa)
NRMSVD
1925
21.22
0.06
0.29
0.36
173141
24.69
0.01
0.26
0.32
71874
23.79
0.04
0.28
0.34
246940
24.40
0.02
0.27
0.33
N
SPD [m/s]
NBIAS (HIGH LAYER)
NMVD (100-400 hPa)
NRMSVD
1000
25.49
0.05
0.24
0.29
166384
24.73
0.01
0.26
0.32
42060
26.70
0.02
0.26
0.32
292998
22.68
0.00
0.28
0.35
N
SPD [m/s]
NBIAS (MEDIUM LAYER)
NMVD (400-700 hPa)
NRMSVD
658
17.68
0.10
0.35
0.44
6757
23.59
-0.01
0.30
0.39
25703
21.02
0.09
0.31
0.38
33118
21.48
0.06
0.31
0.38
N
SPD [m/s]
NBIAS (LOW LAYER)
NMVD (700-1000 hPa)
NRMSVD
267
10.20
-0.00
0.39
0.50
4111
1.28
-0.01
0.34
0.41
4378
11.21
-0.01
0.34
0.41
Table 22: Validation parameters for GEO-HRW-v50 (Jul 2010-Jun 2011, GOES13 satellite, 00/06/12/18:00 UTC, Continental United States area;
Detailed AMVs; Cross correlation tracking; Brightness temperature interpolation height assignment without Cloud products;
No distinction between Cloudy and Clear air Water vapour AMVs due to the lack of Cloud products)
It can be seen that using both height assignments in Table 21 and Table 22, and comparing with the Basic AMVs in Table 17 and Table 18, the amount of Detailed AMVs is around a 35% smaller, but at the same time all the validation parameters (NBIAS, NMVD, NRMSVD) are better considering each layer and all layers together (except the NBIAS using “Brightness temperature interpolation”).
Considering the GEO-HRW Product Requirement Table, the “Optimal accuracies” (respectively 0.35, 0.40 and 0.45 for the High, Medium and Low layer) are even reached at all layers for both height assignments. Considering this, NWC/GEO users can perfectly use the detailed dataset of AMVs as an additional element of NWC/GEO-HRW-v5.0 algorithm for GOES-N series with a very good quality.
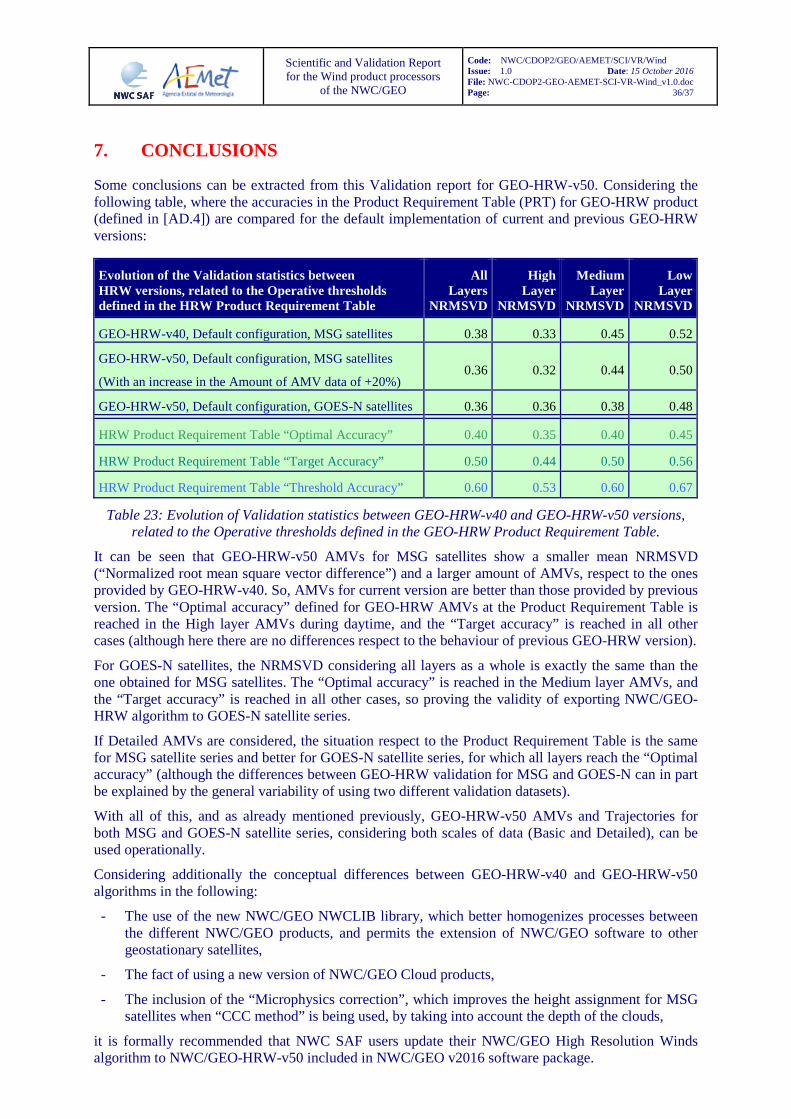
Scientific and Validation Report for the Wind product processors
of the NWC/GEO
Code: NWC/CDOP2/GEO/AEMET/SCI/VR/Wind Issue: 1.0 Date: 15 October 2016 File: NWC-CDOP2-GEO-AEMET-SCI-VR-Wind_v1.0.doc Page: 36/37
7. CONCLUSIONS
Some conclusions can be extracted from this Validation report for GEO-HRW-v50. Considering the following table, where the accuracies in the Product Requirement Table (PRT) for GEO-HRW product (defined in [AD.4]) are compared for the default implementation of current and previous GEO-HRW versions:
Evolution of the Validation statistics between HRW versions, related to the Operative thresholds defined in the HRW Product Requirement Table
All Layers
NRMSVD
High Layer
NRMSVD
Medium Layer
NRMSVD
Low Layer
NRMSVD
GEO-HRW-v40, Default configuration, MSG satellites 0.38 0.33 0.45 0.52
GEO-HRW-v50, Default configuration, MSG satellites
(With an increase in the Amount of AMV data of +20%) 0.36 0.32 0.44 0.50
GEO-HRW-v50, Default configuration, GOES-N satellites 0.36 0.36 0.38 0.48
HRW Product Requirement Table “Optimal Accuracy” 0.40 0.35 0.40 0.45
HRW Product Requirement Table “Target Accuracy” 0.50 0.44 0.50 0.56
HRW Product Requirement Table “Threshold Accuracy” 0.60 0.53 0.60 0.67
Table 23: Evolution of Validation statistics between GEO-HRW-v40 and GEO-HRW-v50 versions, related to the Operative thresholds defined in the GEO-HRW Product Requirement Table.
It can be seen that GEO-HRW-v50 AMVs for MSG satellites show a smaller mean NRMSVD (“Normalized root mean square vector difference”) and a larger amount of AMVs, respect to the ones provided by GEO-HRW-v40. So, AMVs for current version are better than those provided by previous version. The “Optimal accuracy” defined for GEO-HRW AMVs at the Product Requirement Table is reached in the High layer AMVs during daytime, and the “Target accuracy” is reached in all other cases (although here there are no differences respect to the behaviour of previous GEO-HRW version).
For GOES-N satellites, the NRMSVD considering all layers as a whole is exactly the same than the one obtained for MSG satellites. The “Optimal accuracy” is reached in the Medium layer AMVs, and the “Target accuracy” is reached in all other cases, so proving the validity of exporting NWC/GEO-HRW algorithm to GOES-N satellite series.
If Detailed AMVs are considered, the situation respect to the Product Requirement Table is the same for MSG satellite series and better for GOES-N satellite series, for which all layers reach the “Optimal accuracy” (although the differences between GEO-HRW validation for MSG and GOES-N can in part be explained by the general variability of using two different validation datasets).
With all of this, and as already mentioned previously, GEO-HRW-v50 AMVs and Trajectories for both MSG and GOES-N satellite series, considering both scales of data (Basic and Detailed), can be used operationally.
Considering additionally the conceptual differences between GEO-HRW-v40 and GEO-HRW-v50 algorithms in the following:
- The use of the new NWC/GEO NWCLIB library, which better homogenizes processes between the different NWC/GEO products, and permits the extension of NWC/GEO software to other geostationary satellites,
- The fact of using a new version of NWC/GEO Cloud products,
- The inclusion of the “Microphysics correction”, which improves the height assignment for MSG satellites when “CCC method” is being used, by taking into account the depth of the clouds,
it is formally recommended that NWC SAF users update their NWC/GEO High Resolution Winds algorithm to NWC/GEO-HRW-v50 included in NWC/GEO v2016 software package.

Scientific and Validation Report for the Wind product processors
of the NWC/GEO
Code: NWC/CDOP2/GEO/AEMET/SCI/VR/Wind Issue: 1.0 Date: 15 October 2016 File: NWC-CDOP2-GEO-AEMET-SCI-VR-Wind_v1.0.doc Page: 37/37
The results of the 2014 AMV Intercomparison Study Report (Comparison of NWC SAF/HRW AMVs with AMVs from other producers [RD.24]) are also important here to be taken into account. In this study, the AMVs calculated with NWC/GEO-HRW were compared to the AMVs calculated by six other institutions (EUMETSAT/MPEF, NOAA, Japan Meteorological Agency - JMA, China Meteorological Administration - CMA, Korea Meteorological Administration - KMA and the Weather Forecast and Climatic Studies Centre from the Brazilian National Spatial Research Institute – CPTEC/INPE) using the same MSG satellite and ECMWF NWP model data.
The report shows that NWC/GEO-HRW AMVs together with the EUMETSAT/MPEF AMVs have the two best validation statistics in the AMV intercomparison, using “CCC method” for the AMV height assignment.