Embed Size (px)
Citation preview

Scientific and Economic Rationale for Weather Risk Insurance for Agriculture
Prof. Dr. Peter Hoeppe
Geo Risks ResearchMunich Re
New Delhi, India, 27 October 2006

Munich Re• Insurer of Insurances
• Founded 1880
• One of the world‘s largest re-insurers
• Premium income ca. bn 20 €
• Leading role in insurance of natural catastrophes and agro
Geo Risks Research Department of Munich Re -analyses of natural disasters since 1974, agro experts and special underwriting unit since 1980

3
Agricultural risk insurance at Munich Re CUGC2.5 (Agro)
Underwriting of agricultural businessFor all insurance companies throughout the world
Center of CompetenceDevelopment of Munich Re’s strategy and underwriting guidelines for agricultural insurance lines
A wide range of segmentsCrops
Crop hailMulti-peril and named perils
Livestock (incl. aquaculture)Greenhouses

4
Premium development in Agro (Munich Re)
36 38 5577
128
252 268
214
376 390
326
441
334
0
50
100
150
200
250
300
350
400
450
1994
1995
1996
1997
1998
1999
2000
2001
2002
2003
2004
2005
2006
[m€]

Great Natural Disasters 1950 – 2005Number of events
0
2
4
6
8
10
12
14
16
1950 1955 1960 1965 1970 1975 1980 1985 1990 1995 2000 2005
Others (Heat wave, cold wave, forest fire)
FloodStormEarthquake/tsunami, volcanic eruption
© 2006 NatCatSERVICE, Geo Risks Research, Munich Re

Great Weather Disasters 1950 – 2005Economic and insured losses(as at March 28, 2006)
0
20
40
60
80
100
120
140
160
180
1950 1955 1960 1965 1970 1975 1980 1985 1990 1995 2000 2005
© 2006 NatCatSERVICE, Geo Risk Research, Munich Re
Economic losses (2005 values)
Insured losses (2005 values)
Trend of economic losses
Trend of insured losses
Mrd
. US$

India: Natural disasters 1980 – 2005
© 2006 NatCatSERVICE®,
Geo Risks Research, Munich Re
OO
O
Storm
Flood
Extreme temperature,
Mass movements
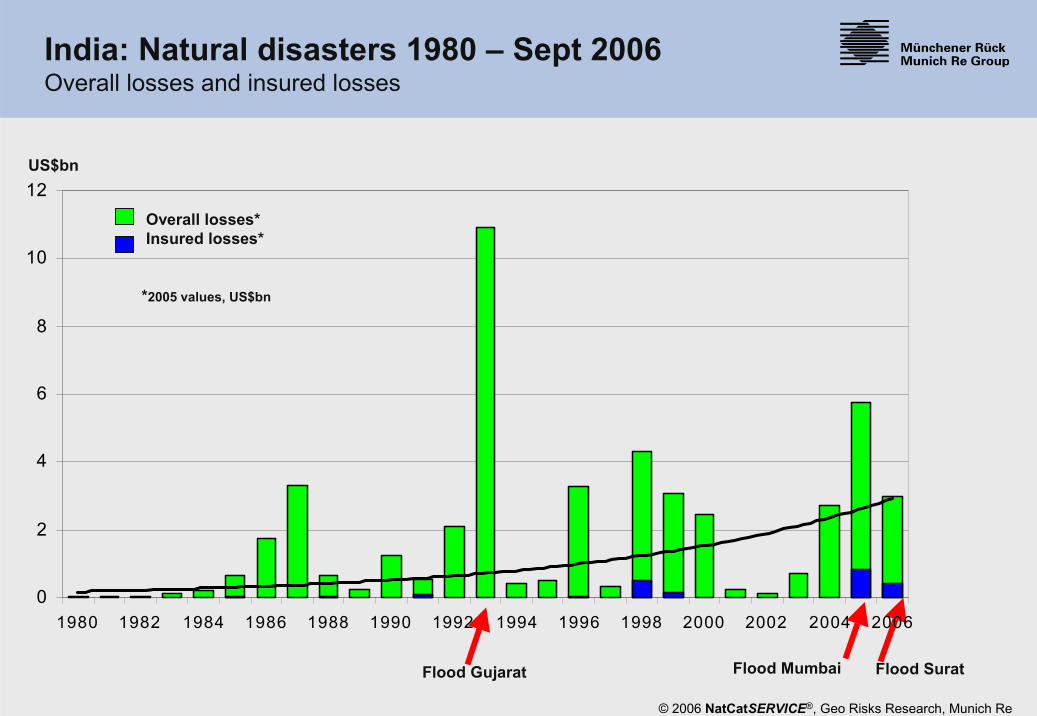
India: Natural disasters 1980 – Sept 2006Overall losses and insured losses
Overall losses*Insured losses*
*2005 values, US$bn
US$bn
© 2006 NatCatSERVICE®, Geo Risks Research, Munich Re
0
2
4
6
8
10
12
1980 1982 1984 1986 1988 1990 1992 1994 1996 1998 2000 2002 2004 2006
Flood Mumbai Flood SuratFlood Gujarat

India: Weather disasters 1980 – 2005Number of events, with trend
temperaturesExtreme
StormFloods
Weather events
© 2006 NatCatSERVICE®, Geo Risks Research, Munich Re
0
5
10
15
20
25
30
1980
1981
1982
1983
1984
1985
1986
1987
1988
1989
1990
1991
1992
1993
1994
1995
1996
1997
1998
1999
2000
2001
2002
2003
2004
2005

Year Event Main affected region Fatalities Economic Insuredlosses*
(in US$m)
1992 Floods Punjab 1,500 1,000
1993 Floods Gujarat 1,000 7,000
1996 Tropical cyclone Andhra Pradesh 971 1,500
1998 Tropical cyclone 03A Gujarat (Kandla) 10,000 1,700 400
1998 Heat wave Rajasthan, Orissa 3,200
1999 Tropical cyclone 05B Orissa 10-30,000 2,500 120
2000 Flood Assam 1,500 1,200
2003 Heat wave Andrha Pradesh 1,900 400
2004 Floods Assam 900 2,500
2005 Flood Maharashtra (Mumbai) 1,150 5,000 770
2006 Floods Gujarat >600 >2,000 400
Significant weather disasters in India
© 2006 NatCatSERVICE®, Geo Risks Research, Munich Re*original values

6 6
93
2
25
8
7
4
41
Floods India July/August 2006
1 ) 4.-7.7.2 ) 4.-6.7.3 ) 8.-16.7.4 ) 29.-31.7.5 ) 1.-6.8.6) 4.-6.8.7) 7.-12.88) 11.-17.8.9) 18.-23.8.10) 21.-23.8.
as at Aug.31, 2006
10

Flood Gujarat, August 2006
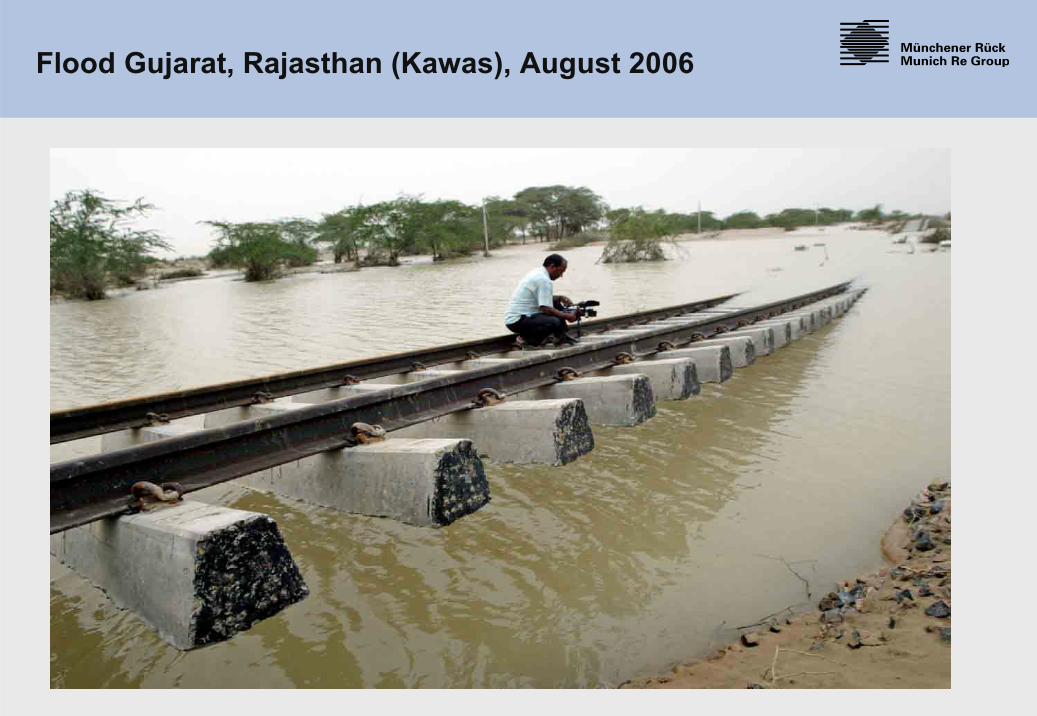
Flood Gujarat, Rajasthan (Kawas), August 2006

24.7- 5.8 1.150 fatalities
July/August 2005 – Flooding in MumbaiLargest 24 h precipitation (944mm) for India
Insured losses (US$ m):Economic losses (US$ m): 5.000
770
source: Reuters

Heat wave / drought 2003
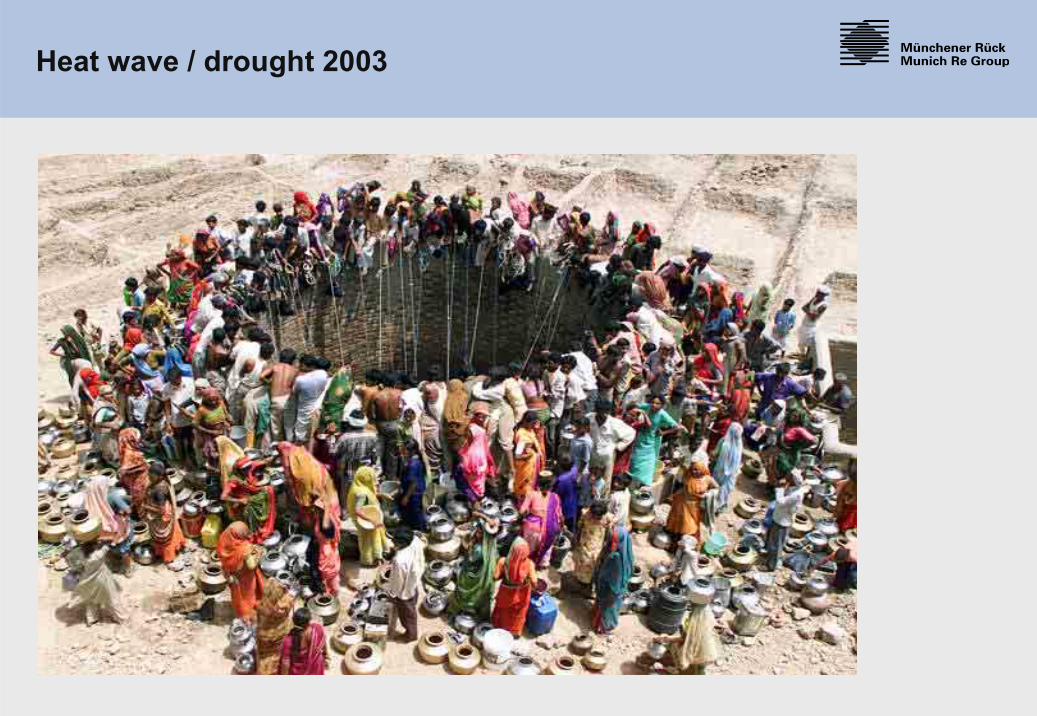
Heat wave / drought 2003

Heat wave / drought 2003

Tropical cyclone 1999 (road repair)

Global and Regional Temperature trends in the 20th century: modeled and observed
Source: climateprediction.net, Oxford University
+ 0.8 °C + 0.7 °C

Changes in Sea Surface Temperatures
NATL = North Atlantic
WPAC = West PacificSPAC = South PacificEPAC = East PacificNIO = Northern IndicSIO = Southern IndicSH = Oceans of the
Southern Hemisphere
Source: Webster et al. (2005),Science Vol. 309.

Scientific evidence of a link between globalwarming and tropical storms
Climate change will intensify the maximum wind speed by 0.5 on the Saffir Simpson scale and precipitation by 18% in hurricanes until 2050 (Knutson et al., J of Climate 2004).
Major tropical storms both in the Atlantic and the Pacific region have already increased since the 1970s in duration and intensity by about 50 percent (Emanuel, Nature 2005; Webster, Science 2005)
Due to climate change the sea surface temperatures have increased already by 0.5°C (Barnett, Pierce, 2005, Science; Santer et al., PNAS, Sept. 2006)
Of all the factors that drive a major storm only the steady increase in sea surface temperatures over the last 35 years can account for the rising strength of storms in six ocean basins around the world (Hoyos et al., Science 2006)

Webster et al., Science, Vol 309, September, 2005
The global frequency of most destructive tropicalstorms has increased since the 1970s

Mean annual normalized US hurricane losses in dependence on SST-anomalies
Light orange bars indicate mean annual losses according to R. Pielke’s loss figures; dark orange bars indicate the same with the difference that since 1954 Munich Re’s annual loss figures were used (left-hand axis). Blue triangles indicate number of data points per class (right-hand axis). Source: Faust, Munich Re 2006, work in progress.
Relationship between annual US TC losses and SSTA
5
10
15
20
25
class -0.45°C to -0.15°C class -0.15°C to 0.15°C class 0.15°C to 0.45°Csea surface temperature anomaly
annu
al lo
ss [U
S$ b
n]
0
5
10
15
20
25
30
35
40
coun
t of
dat
a po
ints
per
cla
ss
(0.3
°C in
wid
th)

Model forecast of changes in annual mean air temperatures (°C) (comparison 1980 with 2080)
source: IPCC

Model forecast of changes in annual precipitation (%)(comparison 1980 with 2080)
source: IPCC
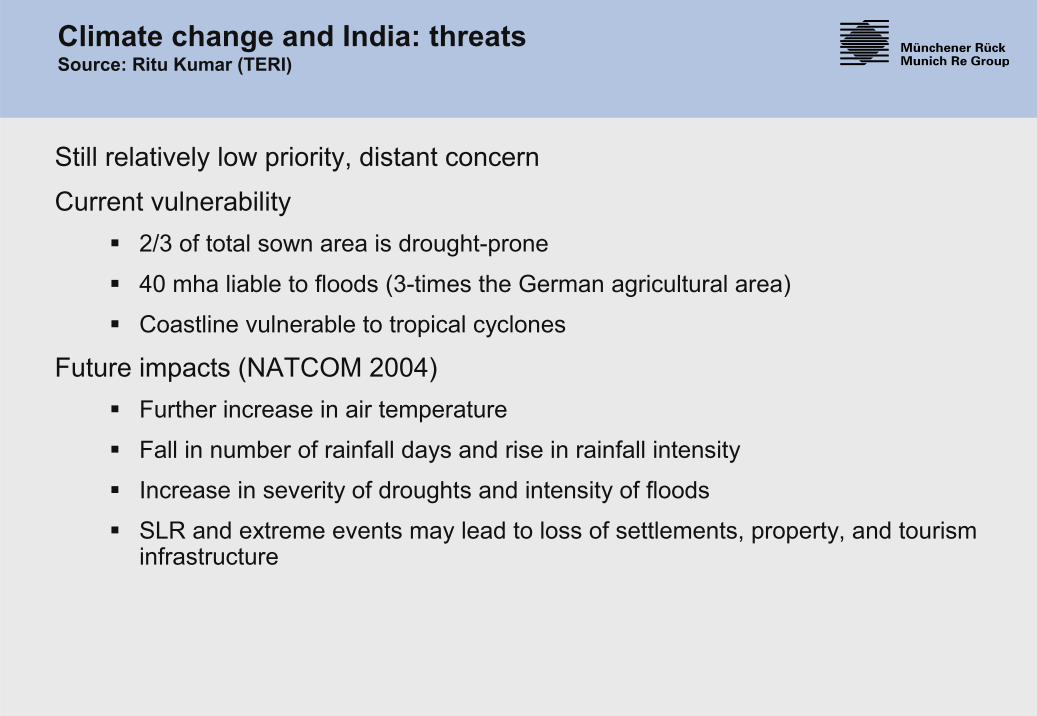
Climate change and India: threatsSource: Ritu Kumar (TERI)
Still relatively low priority, distant concern
Current vulnerability2/3 of total sown area is drought-prone
40 mha liable to floods (3-times the German agricultural area)
Coastline vulnerable to tropical cyclones
Future impacts (NATCOM 2004)Further increase in air temperature
Fall in number of rainfall days and rise in rainfall intensity
Increase in severity of droughts and intensity of floods
SLR and extreme events may lead to loss of settlements, property, and tourism infrastructure

27
Requirements for successful crop insurance programs
Insurance carrier
Companies specialised in agricultural insurance
Competition on service
Insurance product development
Loss adjustment expertise
>>

28
Crop insurance products
>>
Loss insurance (hail and named peril)
- Fixed sum insured (e.g. hail insurance in Europe)
- Adjustable sum insured (e.g. cotton insurance in Australia)
Yield guarantee insurance (MPCI)
- Regional average yield (e.g. new MPCI programs)
- Individual historic yields (APH) (e.g. MPCI in USA, Spain)

29
Crop insurance products
>>
Index insurance
- meteorological trigger (single parameter index not sufficient)
- area yield trigger (e.g. Group Risk Plan in USA)
- vegetation index (increasing use of satellite data andmodeling yields; currently e.g. grassland program in Spain)
Revenue insurance
- Cover of yield and price elements (only for crops traded inexisting commodity markets)

30
Requirements for successful crop insurance programs
Control of anti selection and moral hazard
Risk adequate rates (exposure, crop type, fluctuation) facilitated by premium subsidies
Regional differentiation of rates
Sufficient market penetration
Coverage level and deductibles according to exposure
>>

31
MPCI- and crop hail markets 2005(premium in Mio. Euro)
Country MPCI Hail Total
USA 3.267 360 3.627
Canada 575 126 701
Spain 319 - 319
Italy 42 215 257
France 55 200 255
India 95 - 95
Austria 53 - 53
Portugal 28 - 28

32
Crop insurance started in 1972 and then developed in different phases.
National Agriculture Insurance Scheme (NAIS by AIC); since 1999 with availability in all states and to all farmers
India
Main covers: Yield guarantee and area yield(pilot project with meteorological trigger)
30 different crops insured during Kharif (SW-Monsoon, July-October)25 crops during Rabi (winter months, only in the irrigated areas)
Coverage in 2004/05 for nearly 18 million farmers, 4 million farmers receive benefits

33
Special circumstances in emerging markets
Dual agricultural structures:
o small scale farms with limited access to technology and markets
o modern farms with access to technology and markets
Limited financial means of the government to support agricultural insurance programs
Lack of insurance tradition/marketing of insurance difficult
Difficult access to insured farms
>>

34
Special circumstances in emerging markets
Small scale farms with difficult access to the financial market,including insurance
Micro-Insurance in agriculture
>>
Insurance for low income farmers
Low premium and losses on an individual basis

Munich Re Foundation
From Knowledgeto Action
September 2006 Thomas Loster
Strategy 2005-2008
22 case studies
Microinsurance Conferences- Discussion of case studies and scientific
results- Networking- Exchange of experience- Awareness raisingwww.microinsuranceconference.org
Release of theMicroinsurance-Compendium
Microinsurance Conferences
2004-2005
2005-Germany2006-South Africa
November 2006
2007-India2008-Latin America

Munich Re Foundation
From Knowledgeto Action
September 2006 Thomas Loster
New Book on Microinsurance
Compendium>600 pagesLessons learnt fromintern. experience
Good for training andeducating staff
Available November 06

37
MR’s conference “Microinsurance in emerging markets” in Goa

Munich Re Foundation
From Knowledgeto Action
September 2006 Thomas Loster
Microinsurance Conference 2007 Making insurance work for the poor
We are planning to host the 2007 International Microinsurance Conference in Mumbai, India!
Date: Mid-November 2007
More information will be available in December 2006 at www.microinsuranceconference.orgContact: [email protected]

MCII
The Munich Climate Insurance Initiative (MCII)The MCII was founded by representatives of Germanwatch, IIASA, Munich Re, the Potsdam Institute for Climate Impact Research (PIK), the Swiss Federal Institute of Technology (SLF), the Tyndall Centre, the World Bank, and independent experts.

MCIIMunich Climate Insurance Initiative
• Almost all regions on this globe will be affected by the increase of natural catastrophes. While the wealthy countries will be able to cope with this bymeans of insurance solutions and state funding, the poorest countries will suffer most
Objectives
• The increasing natural catastrophe damages in poor countries will consumeincreasing ratios of the donor money of development funding, delaying their further development
• New insurance related systems are necessary to get these countries, where currently almost no insurance is available, out of the global warming trap
• MCII is working on solutions to provide expertise on insurance related mechanisms to cover losses due to climate change, especially in developing countries

41
Summary
Weather related catastrophes like storms, floods and droughts are increasing worldwide
There is increasing evidence that global warming increases the hazard situation
Agriculture is especially vulnerable to the changing weather patterns, if no adaptation measures are taken (new seeds, production techniques)
Proper insurance systems can help farmers to cope with the increasing volatility of their losses
Munich Re is the worldwide leading re-insurer for agro risks
Munich Re offers its expertise to promote agro insurance systems in developing countries
Munich Re Foundation has been and will be very active to promote micro-insurance systems
42
Thank you for your attention!