Embed Size (px)
Citation preview

Scientific Computing (Phys 2109/Ast 3100H)
I. Scientfic Software DevelopmentSciNet HPC Consortium

HW3 Issues
• How to do the timesteping (in what sense does the coupling operate?)
• Tracer Theory doesn’t know about diffusion?

Makefile: multiple executables
• Convention, like with “clean”, is an “all” target which lists all targets
• Make everything at once:CC=gccCFLAGS=...
all: main interpolation_test
main: ....
interpolation_test: ....
clean:...

Makefile: Run tests
• Easier it is to run tests, more often you test
• Can make a target (typically, ‘check’) which runs any/all tests you have:
CC=gccCFLAGS=...
all: main interpolation_test
check: interpolation_test./interpolation_test
main: ....
interpolation_test: ....

Development Tools• By HW3, code is already starting to get
nontrivial
• Coupled physics - 400-900 lines of interacting C code
• Sometimes non-obvious decisions needed to be made about where one module stopped and one started
• Without modularity, would be a tangled, un-debugable mess

Development Tools
• Going to talk a little more about some tools to help you develop faster/smarter/better
• One is already mentioned - debugger (gdb)
• One is for software performance - profiler (gprof)
• Other debuggers, profilers similar

Debuggers• Debugging is the worst thing in the
world.
• Time-sucking, demoralizing, horrible, slow, awkward, waste of time.
• Worse than that, really.
• We’ll talk about using gdb or similar debuggers, but first want to give a crash course on debugging

Debuggers
• Debugging is something you want to (in this order!):
• Avoid
• Make easier
• Get good at -- which means finding the problem quickly, and solving it correctly

Write Code Professionally
•Even a `one off ’ program will hang around for a long time.
•ALWAYS•Make assumptions explicit•Test for them ( assert() )
•Test for error conditions/return codes•Write modular code

Defensive Programming
• Fail early, fail often.
• If your function assumes n>0, or only works for even input, or..
• Document it
• Test for it
if (n<0) {! fprintf(stderr,"Error in myfunc(); ");! fprintf(stderr," n = %d <0 !\n",n);! return;}
#include <assert.h>..assert(n>=0);

Test for errors•Related to making your assumptions explicit•Did you:
•make sure malloc() didn’t return NULL?
•Make sure you aren’t at EOF?•Make sure fopen() opened the file?•Make sure scanf() read in the right number of variables?

Test your code
•For every non-trivial section of your code, write tests•And then run them regularly!
•Much easier with properly modular code•Test special cases (passed in too small an array) and real cases.

Compiler is your friend
•Always turn on warnings in compiler• -Wall, -warn all•And fix all the things it complains about!•Have debugging flags turned on during development - eg, -fcheck=bounds in gfortran

All of this takes time..
• But much, much less time than debugging
• Debugging - hours of work spent just to get the code back into the shape it should have been in the first place.
• Not a journey of personal growth - just a collossal waste of time.
• Avoid it.

But a bug happened anyway...
• Five steps to debugging:
• Find out you have a bug
• Find out roughly where that bug is
• Examine section of code
• Find and understand the problem, and any related problems
• Fix it.

A futile slide? Don't ever, ever see a bug and
immediately rush in with the editor to change things until it goes away.
Really only learn this the hard way - night before a deadline, need to `save time' by leaping in and fixing things.
Life lesson: 10+ hours of panicked programming can often save you from one hour of careful thought.

Finding you have a bug
• Test, test, test.
• Only thing worse than debugging is not realizing you have a bug.
• Test with invalid inputs, valid inputs, etc.
• Once you know you have a bug, find simplest, fastest case which demonstrates the bug

Finding where bug is
• Need to bisect.
• Figure out where wrong answer happens.
• Look at results half way through computation. Is it wrong?
• If so, problem is in first half
• Otherwise, in second half
• Repeat

Git is your friend
• If you have version control, and had a known working version earlier, can hugely simplify finding bug.
• If know when bug was introduced, know what changes were made!
•Greatly reduces lines of code you’re sifting through.

Git is your friend• git diff will show you all changes between your last commit and current files
• (Look into git difftool for nice graphical version)
•You can use git reset --hard or similar to revert back to working version
• If correct version was much further back and you want to find where problem happened, “git bisect” will help you find where problem was introduced.

Graphical diffs
• tkdiff, xxdiff, kompare, etc - will change your life.

Finding bug: debugger•Typical scientist way of finding bugs - inserting printf()s into code.
• Slow, error-prone, and only shows what you print.
•Much better - debugger.•We’ll walk through gdb (lowest common denominator).
•Graphical debuggers - Linux, ddd, eclipse, ddt; Mac - Xcode; Windows - Visual studio

gdb hands-on
•Edit your HW3 makefile and add -g to compile, link line
• Includes information in the executable about source code
•Disables some optimizations•make clean, then make•gdb [programname]

Running program• at (gdb) prompt,
type “run”
• Runs program as usual (slightly slower)
• If program required command-line arguments, “set args [args]”, then run
$ gdb ./mainGNU gdb 6.3.50-20050815 (Apple version gdb-1705) (Fri Jul 1 10:50:06 UTC 2011)Copyright 2004 Free Software Foundation, Inc.GDB is free software, covered by the GNU General Public License, and you arewelcome to change it and/or distribute copies of it under certain conditions.Type "show copying" to see the conditions.There is absolutely no warranty for GDB. Type "show warranty" for details.This GDB was configured as "x86_64-apple-darwin"...Reading symbols for shared libraries .. done
(gdb) run.....
Program exited normally.(gdb)

Breakpoints• Insert a breakpoint
into the code
• Program will run until it hits breakpoint, then stop
• can use function name, or filename:line number
$ gdb ./mainGNU gdb 6.3.50-20050815 (Apple version gdb-1705) (Fri Jul 1 10:50:06 UTC 2011)Copyright 2004 Free Software Foundation, Inc.GDB is free software, covered by the GNU General Public License, and you arewelcome to change it and/or distribute copies of it under certain conditions.Type "show copying" to see the conditions.There is absolutely no warranty for GDB. Type "show warranty" for details.This GDB was configured as "x86_64-apple-darwin"...Reading symbols for shared libraries .. done
(gdb) run.....
Program exited normally.(gdb) break tracer_compute_force_and_velocityBreakpoint 1 at 0x100002238: file tracer.c, line 35

Breakpoints• Put breakpoint at
tracer_compute_force_and_velocity
• Then run
• “list” lists the next few lines of code (you can “list 25” to list starting at 25)
• print c - why is it not 0?
(gdb) break tracer_compute_force_and_velocityBreakpoint 1 at 0x100002238: file tracer.c, line 35
Starting program: /Users/ljdursi/Desktop/NovClass/foo/main 0.000000 0.000000 0.000000
Breakpoint 1, tracer_compute_force_and_velocity (tracer=0x7fff5fbff600) at tracer.c:3535 for (int c=0; c<DIM; ++c) {

step/next• Can step through
code, looking at results
• Much more powerful than printf
• step - do next line of code regardless of where it is
• next - next line of code in this routine (eg, step over function calls)
(gdb) list30 tracer->alpha = tracer->alpha0*(1+tracer->a*interpolation(rho, xgrid, nx, xgrid, nx, tracer->r[0], tracer->r[1]));31 }32 33 void tracer_compute_force_and_velocity(struct Tracer* tracer) 34 {35 for (int c=0; c<DIM; ++c) {36 tracer->v[c] = (tracer->r[c] - tracer->rprev[c])/tracer->dt;37 tracer->f[c] = -tracer->alpha*tracer->v[c];38 }39 tracer->f[0] += tracer->qE;(gdb) step36 tracer->v[c] = (tracer->r[c] - tracer->rprev[c])/tracer->dt;(gdb) step37 tracer->f[c] = -tracer->alpha*tracer->v[c];(gdb) print c$2 = 0(gdb) print *tracer$3 = { m = 1, x1 = 0, x2 = 10, qE = 1,

Conditional breakpoints• Delete previous
breakpoint (delete 1)
• Let’s say we want to examine periodic boundaries
• Put a breakpoint in tracer_timestep on line where L is calculated if need periodic in x direction
• cont continues run
(gdb) delete 1(gdb) break tracer.c:51 if tracer->r[0] > tracer->x2 || tracer->r[0] < tracer->x1Breakpoint 2 at 0x1000015e3: file tracer.c, line 51.(gdb) cont...Breakpoint 2, tracer_time_step (tracer=0x7fff5fbff600) at tracer.c:5151 float L = tracer->x2 - tracer->x1;

Conditional breakpoints
• When stepping through, you can set variables:
• eg, ‘set var L=5.’
• See if that alters behaviour...
(gdb) delete 1(gdb) break tracer.c:51 if tracer->r[0] > tracer->x2 || tracer->r[0] < tracer->x1Breakpoint 2 at 0x1000015e3: file tracer.c, line 51.(gdb) run...Breakpoint 2, tracer_time_step (tracer=0x7fff5fbff600) at tracer.c:5151 float L = tracer->x2 - tracer->x1;

Watchpoints• Can break anywhere in
program if a variable changes
• Very useful for tracking changes to a variable you think should be same!
• delete (deletes all breakpoints)
• break main; run
(gdb) deleteDelete all breakpoints? (y or n) y(gdb) break mainBreakpoint 3 at 0x1000009b4: file main.c, line 12.(gdb) runBreakpoint 2, main () at main.c:1212 float m = 1.0;

Watchpoints
• Set a watchpoint for your tracer particle’s r[0]
• continue
• Should stop in tracer_init
(gdb) deleteDelete all breakpoints? (y or n) y(gdb) break mainBreakpoint 3 at 0x1000009b4: file main.c, line 12.(gdb) runBreakpoint 2, main () at main.c:1212 float m = 1.0;(gdb) watch tracer->r[0]Hardware watchpoint 3: tracer->r[0](gdb) contContinuing.Hardware watchpoint 3: tracer->r[0]
Old value = 4.59163468e-41New value = 0tracer_init (tracer=0x7fff5fbff600, r0=0x7fff5fbff5a8, v0=0x7fff5fbff5a0) at tracer.c:2222 tracer->rprev[c] = r0[c] - v0[c]*tracer->dt;

Stack frame• where - Shows where you
are in the code and how you got there
• eg, line 68 of main.c called tracer_init at line 22
• Can go between callees and callers with “frame” command
• Lets you see values in caller, undersand why it was called with values it was.
Old value = 4.59163468e-41New value = 0tracer_init (tracer=0x7fff5fbff600, r0=0x7fff5fbff5a8, v0=0x7fff5fbff5a0) at tracer.c:2222 tracer->rprev[c] = r0[c] - v0[c]*tracer->dt;
(gdb) where#0 tracer_init (tracer=0x7fff5fbff600, r0=0x7fff5fbff5a8, v0=0x7fff5fbff5a0) at tracer.c:22#1 0x0000000100000e16 in main () at main.c:68(gdb) frame 1#1 0x0000000100000e16 in main () at main.c:6868 tracer_init(&tracer,r0,v0);(gdb) print r0$1 = {0, 0}(gdb) print v0$2 = {0, 10}(gdb) print tracer$3 = { m = 1, x1 = 0, x2 = 10,

Graphical debuggers
• Show source all at once, allow you to manipulate/view data in other windows
• Easier to use
• Same basic functionality

ddd
• ddd (http://www.gnu.org/s/ddd/) is particularly nice for scientists:
• free
• Built-in plotting of arrays

Performance
• Get things right before getting them fast
• Once your program is working correctly (and has tests so you can make sure it’s still working correctly after changes), can work on making it go faster

How to improve Performance?
• Can’t improve what you don’t measure
• Have to be able to quantify where your problem spends its time.
Measure
Find bottlenecks
Make improvements
Profiling
Tuning

Profiling A Code
• Where in your program is time being spent?
• Find the expensive parts
• Don’t waste time optimizing parts that don’t matter

Profiling A Code
• Timing vs. Sampling vs. Tracing
• Instrumenting the code vs. Instrumentation-free

Timing whole program
• Very simple; can run any command
• In serial, real = user+sys
• In parallel, ideally user = (nprocs)x (real)
$ time ./a.out
[ your job output ]
real 0m2.448suser 0m2.383ssys 0m0.027s
Elapsed “walltime”
System time:Disk, I/O...
Actual usertime

Running “top”
• Run top in another terminal window while program runs
• Tells CPU usage, amount of memory, status
• Lots of D/S status - waiting for I/O

Insert timers into regions of code
• Instrumenting code
• Simple, but incredibly useful
• Runs every time your code is run
• Can trivially see if changes make
C

Matrix-Vector multiply
• Can get an overview of the time spent easily, because we instrumented our code (~12 lines!)
• I/O huge bottleneck.
mat-vec-mult.c
$ mvm --matsize=2500
Timing summary: Init: 0.00952 sec Calc: 0.06638 sec I/O : 5.07121 sec

Sampling for Profiling
• How to get finer-grained information about where time is being spent?
• Can’t instrument every single line.
• Compilers have tools for sampling execution paths.

Program Counter Sampling
• As program executes, every so often (~100ms) a timer goes off, and the current location of execution is recored
• Shows where time is
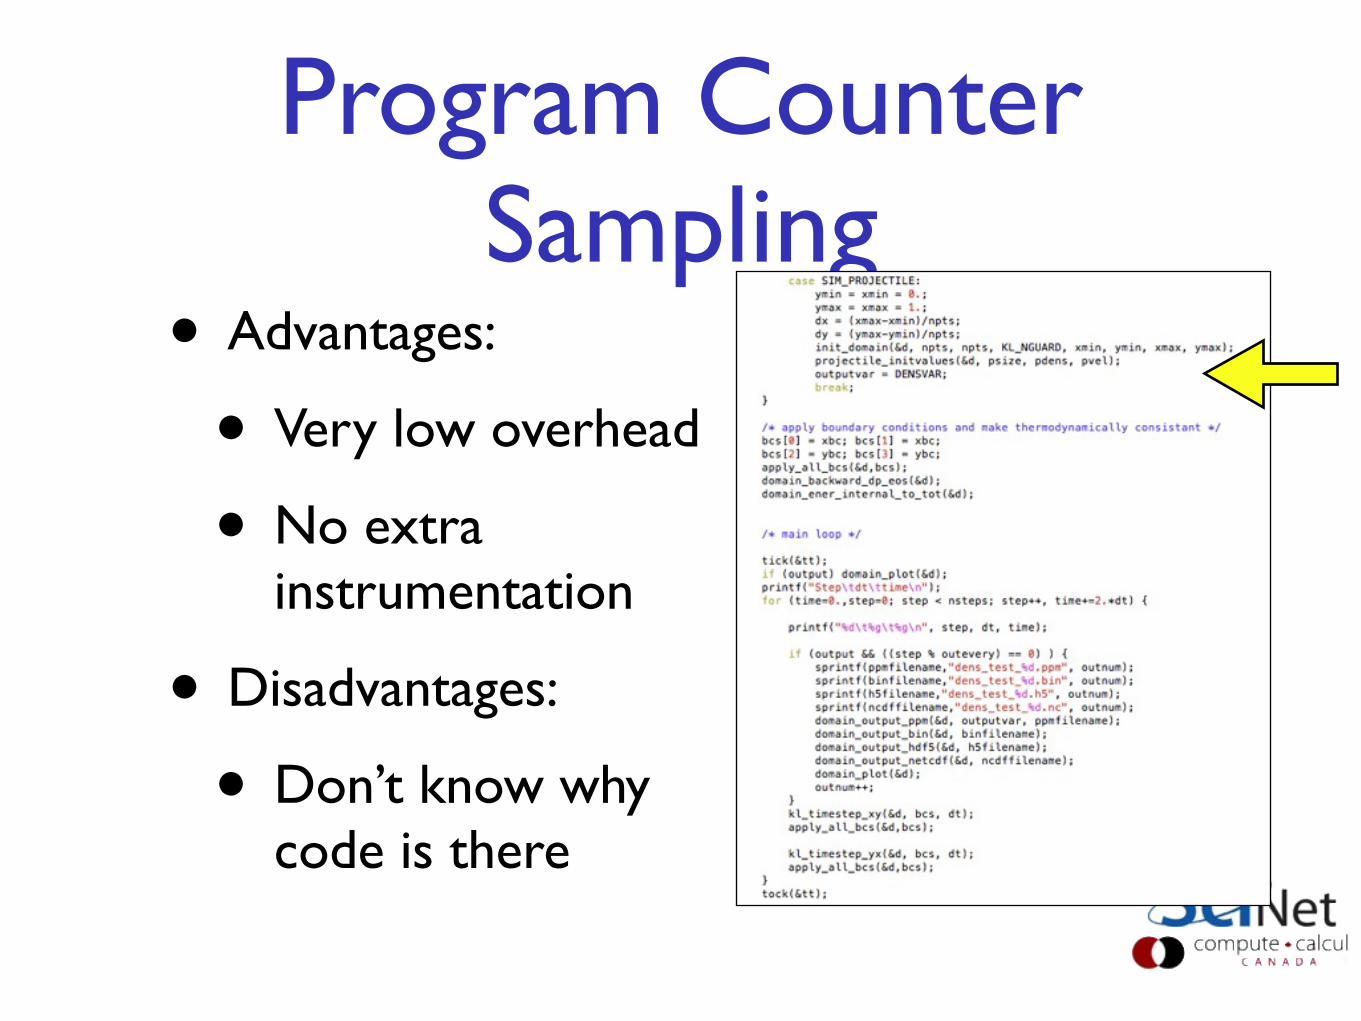
Program Counter Sampling
• Advantages:
• Very low overhead
• No extra instrumentation
• Disadvantages:
• Don’t know why code is there

gprof for sampling$ gcc -O3 -pg -g mat-vec-mult.c --std=c99 $ icc -O3 -pg -g mat-vec-mult.c -c99
$ ./mvm-profile --matsize=2500[output]$ ls Makefile Mat-vec.dat gmon.out mat-vec-mult.c mvm-profile
turn onprofiling
debugging symbols(optional, but more info)

gprof examines gmon.out
$ gprof mvm-profile gmon.out | moreFlat profile:
Each sample counts as 0.01 seconds. % cumulative self self total time seconds seconds calls Ts/call Ts/call name 100.24 0.41 0.41 main 0.00 0.41 0.00 3 0.00 0.00 tick 0.00 0.41 0.00 3 0.00 0.00 tock 0.00 0.41 0.00 2 0.00 0.00 alloc1d 0.00 0.41 0.00 2 0.00 0.00 free1d 0.00 0.41 0.00 1 0.00 0.00 alloc2d 0.00 0.41 0.00 1 0.00 0.00 free2d 0.00 0.41 0.00 1 0.00 0.00 get_options[...]
Gives data by function -- usually handy

gprof --line examines gmon.out by line
gpc-f103n084-$ gprof --line mvm-profile gmon.out | moreFlat profile:
Each sample counts as 0.01 seconds. % cumulative self self total time seconds seconds calls Ts/call Ts/call name 68.46 0.28 0.28 main (mat-vec-mult.c:82 @ 4010d8) 14.67 0.34 0.06 main (mat-vec-mult.c:113 @ 40137e) 7.33 0.37 0.03 main (mat-vec-mult.c:63 @ 401048) 4.89 0.39 0.02 main (mat-vec-mult.c:112 @ 401350) 4.89 0.41 0.02 main (mat-vec-mult.c:113 @ 401360) 0.00 0.41 0.00 3 0.00 0.00 tick (mat-vec-mult.c:159 @ 400d50) 0.00 0.41 0.00 3 0.00 0.00 tock (mat-vec-mult.c:164 @ 400d00) 0.00 0.41 0.00 2 0.00 0.00 alloc1d (mat-vec-mult.c:152 @ 400d70) 0.00 0.41 0.00 2 0.00 0.00 free1d (mat-vec-mult.c:171 @ 400cb0) 0.00 0.41 0.00 1 0.00 0.00 alloc2d (mat-vec-mult.c:130 @ 400da0) 0.00 0.41 0.00 1 0.00 0.00 free2d (mat-vec-mult.c:144 @ 400cd0) 0.00 0.41 0.00 1 0.00 0.00 get_options (mat-vec-mult.c:177 @ 400a30)

gprof hands-on
• Edit your makefile to include -g -pg lines, rebuild your code
• Where does your code spend most of its time -- by function? By line?

Object Oriented Python
• Interpolation
• Example from http://software-carpentry.org/4_0/oop

1d Interpolation
• Take discrete, irregular timeseries
• Allow sampling at any time
• For integration, averaging, etc.

1d Interpolation
• Many ways to do this
• Piecewise constant (step function)
• Linear interpolation, etc.

Obj. Oriented Python
• Similar to C++
• constructor: __init__.
• Methods are just functions ‘in’ the class
• Local values: self.values
class StepSignal(Object):
def __init__(self,values):‘’’Values is ((x0,y0),(x1,y1)...)’’’self.values = values
def get(self,where):assert where >= self.values[0][0]for i in range(len(self.values)-1):
x0, y0 = self.values[i]x1, y1 = self.values[i+1]if x0 <= where <= x1:
return y0assert where < x1

Obj. Oriented Python
• Initialize with the data
• call .get method to sample at given point
class StepSignal(Object):
def __init__(self,values):‘’’Values is ((x0,y0),(x1,y1)...)’’’self.values = values
def get(self,where):if where < self.values[0][0]:
raise IndexError, ‘%f too low’ % wherefor i in range(len(self.values)-1):
x0, y0 = self.values[i]x1, y1 = self.values[i+1]if x0 <= where <= x1:
return y0raise IndexError, ‘%f too high’ % where
>>> import stepsignal>>> interp = stepsignal.StepSignal(((0.,0.), (1.,1.), (2.,2.)))
>>> for x in (0.0, 0.5, 1.1, 1.75):... print x, interp.get(x)... 0.0 0.00.5 0.01.1 1.01.75 1.0

Obj. Oriented Python
• Error handling works as expected
• This would be a reasonable set of tests for this class
class StepSignal(object):
def __init__(self,values): '''Values is ((x0,y0),(x1,y1)...)''' self.values = values
def get(self,where): assert where >= self.values[0][0] for i in range(len(self.values)-1): x0, y0 = self.values[i] x1, y1 = self.values[i+1] if x0 <= where <= x1: return y0 assert where < x1
>>> interp.get(-.001)Traceback (most recent call last): File "<stdin>", line 1, in <module> File "stepsignal.py", line 8, in get assert where >= self.values[0][0]AssertionError
>>> interp.get(2.1)Traceback (most recent call last): File "<stdin>", line 1, in <module> File "stepsignal.py", line 14, in get assert where < x1AssertionError

Linear Interpolation
• Different class, with different interpolation
• Test this:
class LinearSignal(object):
def __init__(self,values): '''Values is ((x0,y0),(x1,y1)...)''' self.values = values
def get(self,where):assert where >= self.values[0][0]
for i in range(len(self.values)-1): x0, y0 = self.values[i] x1, y1 = self.values[i+1] if x0 <= where <= x1: return y0 + (y1-y0)*(where-x0)/(x1-x0)
assert where < x1

Linear Interpolation
• Different class, with different interpolation
• Test this:
class LinearSignal(object):
def __init__(self,values): '''Values is ((x0,y0),(x1,y1)...)''' self.values = values
def get(self,where): assert where >= self.values[0][0] for i in range(len(self.values)-1): x0, y0 = self.values[i] x1, y1 = self.values[i+1] if x0 <= where <= x1: return y0 + (y1-y0)*(where-x0)/(x1-x0) assert where < x1
>>> import linearsignal>>> interp = linearsignal.LinearSignal(((0.,0.), (1.,1.), (2.,2.)))
>>> for x in (0.0, 0.5, 1.1, 1.75):... print x, interp.get(x)... 0.0 0.00.5 0.51.1 1.11.75 1.75

Using the class• Argument “signal”
can be anything with a get() method
• Can pass it linear signal or step signal, or..
def integrate(signal, x0, x1, num_samples): width = (x1 - x0)/num_samples total = 0.0 for i in range(num_samples): x = x0 + i*width total += signal.get(x)*width return total

Using the class• Argument “signal”
can be anything with a get() method
• Can pass it linear signal or step signal, or..
class Sinusoid(object): def __init__(self, amplitude, frequency): self.amp = amplitude self.freq = frequency def get(self, x): return self.amp * math.sin(x * self.freq)

Inheritance• Two classes are
almost identical
• Want to reduce code overhead
• Also, make explicit that they have same interface
class StepSignal(object):
def __init__(self,values): '''Values is ((x0,y0),(x1,y1)...)''' self.values = values
def get(self,where): assert where >= self.values[0][0] for i in range(len(self.values)-1): x0, y0 = self.values[i] x1, y1 = self.values[i+1] if x0 <= where <= x1: return y0 assert where < x1
class LinearSignal(object):
def __init__(self,values): '''Values is ((x0,y0),(x1,y1)...)''' self.values = values
def get(self,where): assert where >= self.values[0][0] for i in range(len(self.values)-1): x0, y0 = self.values[i] x1, y1 = self.values[i+1] if x0 <= where <= x1: return y0 + (y1-y0)*(where-x0)/(x1-x0) assert where < x1

Inheritance• Find common
code
• Initialization
• Find routine (which get will be based on)
• Not very useful in and of itself
class InterpolatedSignal(object):
def __init__(self,values): '''Values is ((x0,y0),(x1,y1)...)''' self.values = values
def find(self,where): assert where >= self.values[0][0] for i in range(len(self.values)-1): x0, y0 = self.values[i] x1, y1 = self.values[i+1] if x0 <= where <= x1: return i assert where < x1
def get(self, where): raise NotImplementedError('Must provide get')
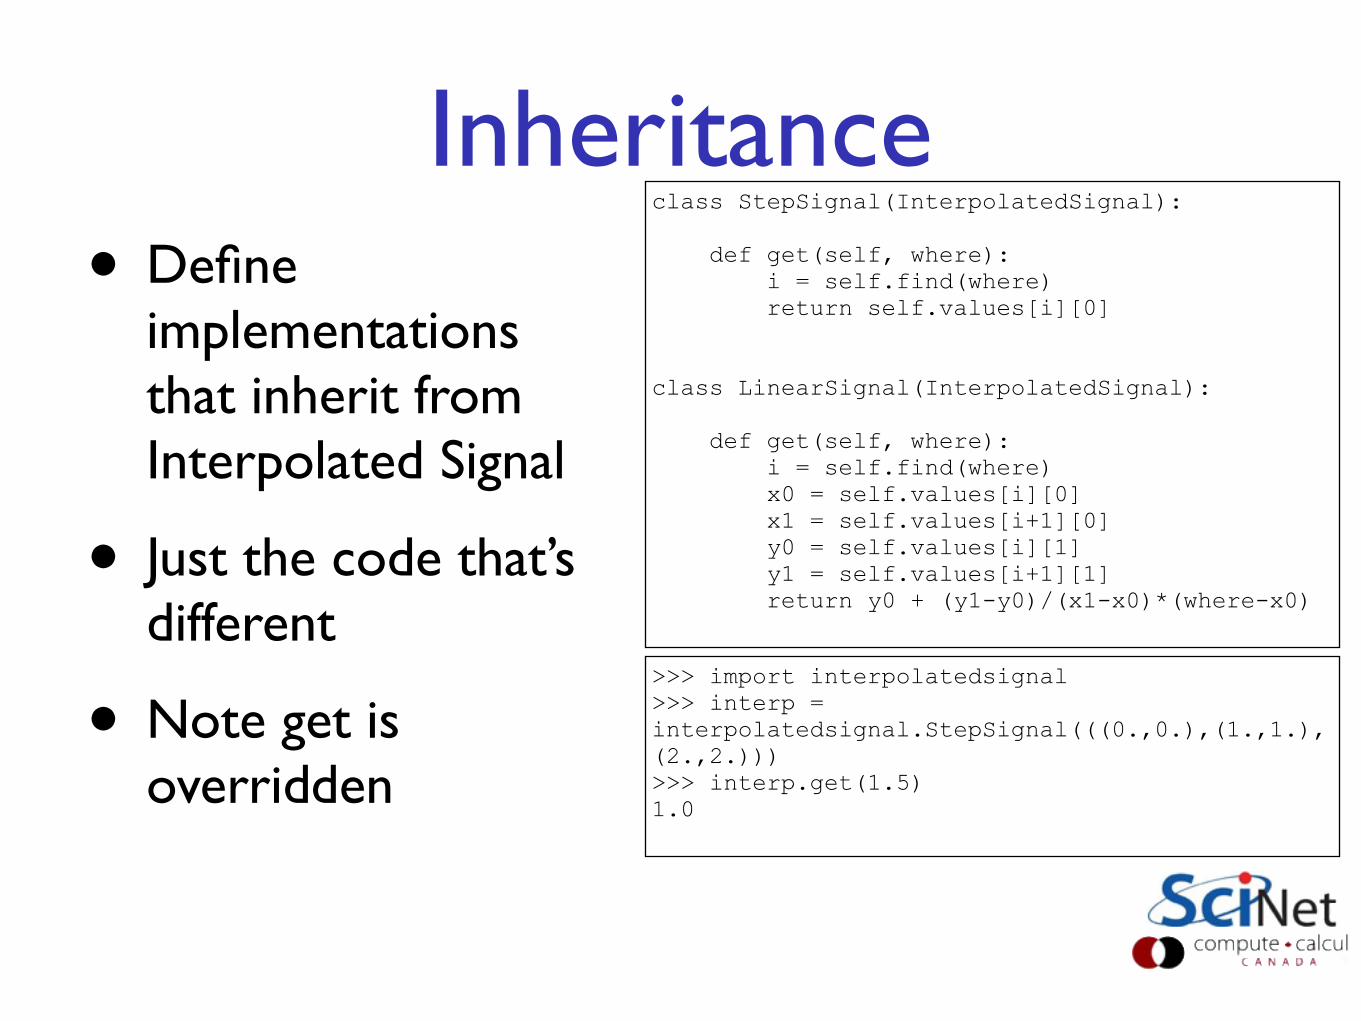
Inheritance• Define
implementations that inherit from Interpolated Signal
• Just the code that’s different
• Note get is overridden
class StepSignal(InterpolatedSignal):
def get(self, where): i = self.find(where) return self.values[i][0]
class LinearSignal(InterpolatedSignal):
def get(self, where): i = self.find(where) x0 = self.values[i][0] x1 = self.values[i+1][0] y0 = self.values[i][1] y1 = self.values[i+1][1] return y0 + (y1-y0)/(x1-x0)*(where-x0)
>>> import interpolatedsignal>>> interp = interpolatedsignal.StepSignal(((0.,0.),(1.,1.),(2.,2.)))>>> interp.get(1.5)1.0

Inheritance• Can put better input
validation into the base class
• Make sure values are pairs, increasing in x...
• Both subclasses get those improvements automatically
class StepSignal(InterpolatedSignal):
def get(self, where): i = self.find(where) return self.values[i][0]
class LinearSignal(InterpolatedSignal):
def get(self, where): i = self.find(where) x0 = self.values[i][0] x1 = self.values[i+1][0] y0 = self.values[i][1] y1 = self.values[i+1][1] return y0 + (y1-y0)/(x1-x0)*(where-x0)
>>> import interpolatedsignal>>> interp = interpolatedsignal.StepSignal(((0.,0.),(1.,1.),(2.,2.)))>>> interp.get(1.5)1.0