Embed Size (px)
Citation preview

VOL. 10 NUM. 2 YEAR 2017 ISSN 1985-6571
Special Issue for the 3rd International Conference on Defence and Security (DSTC 2016), 15-17 August 2016, Marriot Hotel, Putrajaya, Malaysia
Penetration Resistance Force of Sandwich Panels Composite With Kenaf Foam as a Core Material Against Deformable Projectiles Mahmod Abd Hakim Mohamad, Wan Ali Wan Mat, Ahmad Mujahid Ahmad Zaidi, Tuan Mohd Hafeez Tuan Ibrahim, Hairul Mubarak Hassim, Mohammad Sukri Mustapa & Shohaimi Abdullah
101 - 110
Simulation of Hybrid-III Dummy Response Using Three LS-DYNA Blast Methods Muhammad Fahmi Md. Isa, Risby Mohd Sohaimi, Norazman Mohamad, Shohaimi Abdullah, Megat Mohamad Hamdan Megat Ahmad, Ariffin Ismail, Muhammad Alias Yusof, Khalis Suhaimi, Arif Shafiq Mohd Sohaimi, Mohd Nor Hafizi Noordin & Asrul Syaharani
111 - 120
Simulation on the Shock Attenuation Behaviour of Coupled RHA and Sandwich Composite Panel Under Blast Loading Muhammad Fahmi Md. Isa, Risby Mohd Sohaimi, Norazman Mohamad, Shohaimi Abdullah, Megat Mohamad Hamdan Megat Ahmad, Ariffin Ismail & Muhammad Alias Yusof
121 – 128
Development of CdTe Thin Film Solar Cells for Military Applications Nor Azlian Abdul-Manaf & Imyhamy Dharmadasa
129 - 141
Development of Cortisol Immunosensor Based Reduced Graphene Oxide (rGO) for Future Application in Monitoring Stress Levels Among Military Personnel Ainsah Omar, Jahwarhar Izuan Abd Rashid, Azyani Athirah Abd Latif, Khairunnisa Abd Karim, Osman Che Bakar, Muhamad Abu Bakar & Wan Md Zin Wan Yunus
142 – 149
Development of Indonesian Low Probability of Intercept (LPI) Radar System Mashury Wahab, Yussi Perdana Saputera, Purwoko Adhi & Yuyu Wahyu
150 – 159
General Android Malware Behaviour Taxonomy Najiahtul Syafiqah Ismail, Halizah Saad, Robiah Yusof & Mohd Faizal Abdollah
160 – 168
Ministry of Defence
Malaysia
SCIENCE & TECHNOLOGY RESEARCH INSTITUTE FOR DEFENCE (STRIDE)

EDITORIAL BOARD
Chief Editor Gs. Dr. Dinesh Sathyamoorthy
Deputy Chief Editor Dr. Mahdi bin Che Isa
Guest Editors: National Defence Universiti of Malaysia (UPNM)
Assoc. Prof. Lt. Col. Dr. Khairol Amali Ahmad Assoc. Prof. Dr. Syed Mohd Fairuz Syed Mohd Dardin
Dr. Fakroul Ridzuan Hashim Dr. Latifah Sarah Supian
Associate Editors
Dr. Ridwan bin Yahaya Dr. Norliza bt Hussein
Ir. Dr. Shamsul Akmar bin Ab Aziz Nor Hafizah bt Mohamed
Masliza bt Mustafar Kathryn Tham Bee Lin Siti Rozanna bt Yusuf
Copyright of the Science & Technology Research Institute for Defence (STRIDE), 2017

i
AIMS AND SCOPE
The Defence S&T Technical Bulletin is the official technical bulletin of the Science & Technology Research Institute for Defence (STRIDE). The bulletin, which is indexed in, among others, Scopus, Index Corpenicus, ProQuest and EBSCO, contains manuscripts on research findings in various fields of defence science & technology. The primary purpose of this bulletin is to act as a channel for the publication of defence-based research work undertaken by researchers both within and outside the country.
WRITING FOR THE DEFENCE S&T TECHNICAL BULLETIN
Contributions to the bulletin should be based on original research in areas related to defence science & technology. All contributions should be in English.
PUBLICATION
The editors’ decision with regard to publication of any item is final. A manuscript is accepted on the understanding that it is an original piece of work that has not been accepted for publication elsewhere.
PRESENTATION OF MANUSCRIPTS
The format of the manuscript is as follows:
a) Page size A4 b) MS Word format c) Single space d) Justified e) In Times New Roman ,11-point font f) Should not exceed 20 pages, including references g) Texts in charts and tables should be in 10-point font.
Please e-mail the manuscript to:
1) Gs. Dr. Dinesh Sathyamoorthy ([email protected]) 2) Dr. Mahdi bin Che Isa ([email protected])
The next edition of the bulletin (Vol. 10, Num. 3) is expected to be published in November 2017. The due date for submissions is 22 August 2017. It is strongly iterated that authors are solely responsible for taking the necessary steps to ensure that the submitted manuscripts do not contain confidential or sensitive material. The template of the manuscript is as follows:

ii
TITLE OF MANUSCRIPT
Name(s) of author(s)
Affiliation(s)
Email:
ABSTRACT Contents of abstract. Keywords: Keyword 1; keyword 2; keyword 3; keyword 4; keyword 5.
1. TOPIC 1 Paragraph 1. Paragraph 2. 1.1 Sub Topic 1 Paragraph 1. Paragraph 2. 2. TOPIC 2 Paragraph 1. Paragraph 2.
Figure 1: Title of figure.
Table 1: Title of table.
Content Content Content Content Content Content Content Content Content Content Content Content
Equation 1 (1) Equation 2 (2)

iii
REFERENCES Long lists of notes of bibliographical references are generally not required. The method of citing references in the text is ‘name date’ style, e.g. ‘Hanis (1993) claimed that...’, or ‘…including the lack of interoperability (Bohara et al., 2003)’. End references should be in alphabetical order. The following reference style is to be adhered to:
Books
Serra, J. (1982). Image Analysis and Mathematical Morphology. Academic Press, London. Book Chapters
Goodchild, M.F. & Quattrochi, D.A. (1997). Scale, multiscaling, remote sensing and GIS. In Quattrochi, D.A. & Goodchild, M.F. (Eds.), Scale in Remote Sensing and GIS. Lewis Publishers, Boca Raton, Florida, pp. 1-11.
Journals / Serials
Jang, B.K. & Chin, R.T. (1990). Analysis of thinning algorithms using mathematical morphology. IEEE T. Pattern Anal., 12: 541-550.
Online Sources
GTOPO30 (1996). GTOPO30: Global 30 Arc Second Elevation Data Set. Available online at: http://edcwww.cr.usgs.gov/landdaac/gtopo30/gtopo30.html (Last access date: 1 June 2009).
Unpublished Materials (e.g. theses, reports and documents)
Wood, J. (1996). The Geomorphological Characterization of Digital Elevation Models. PhD Thesis, Department of Geography, University of Leicester, Leicester.

101
PENETRATION RESISTANCE FORCE OF SANDWICH PANELS COMPOSITE WITH KENAF FOAM AS A CORE MATERIAL AGAINST DEFORMABLE
PROJECTILES
Mahmod Abd Hakim Mohamad1*, Wan Ali Wan Mat2, Ahmad Mujahid Ahmad Zaidi2, Tuan Mohd Hafeez Tuan Ibrahim1, Hairul Mubarak Hassim1, Mohammad Sukri Mustapa1 & Shohaimi Abdullah2
1Universiti Tun Hussein Onn Malaysia (UTHM), Malaysia
2Universiti Pertahanan Nasional Malaysia (UPNM), Malaysia
*Email: [email protected]
ABSTRACT
In this study, plate sandwich panels with fibre-reinforced polyurethane face and kenaf form core under quasi-static indentation of small arm bullet (5.56 mm) were investigated experimentally. The sandwich structure is comprised of two outer steel plates composite with kenaf foam as its core material that was rigidly clamped on vertical orientation. Different percentages of kenaf in the foam mixture (0%, 10%, 20%, and 30%) and thicknesses of the foam (15 mm, 30 mm, 45 mm) were used to investigate the protective plate performance against ballistic impact. From this study, we have demonstrated that the difference in indentation resistance between the sandwich panel and its corresponding core material depends on the resistance force. We have also found that reinforced form with 20% of kenaf with a thickness of 45 mm has the highest resistance behaviour. It can be concluded that kenaf material can be used to reinforce polyurethane foam in enhancing the strength and mechanical properties of the foam and armour. Keywords: Impact; ballistic; polyurethane; kenaf; sandwich panels; protective; indentation. 1. INTRODUCTION Ballistic is a science that studies the movement of a mechanical object from its launch, flight path and effect of the projectile to the target. The studies normally focus on bullets, gravity bombs, and rockets related mechanical objects (Eswara & Wanhill, 2017). All projectiles motions that are caused by kinetic energy instead of explosives are termed as "kinetic energy projectiles" (Lanz et al., 2001). Ballistic impact is a high speed impact created by small size object hitting a rigid body (Cantwell & Morten 1991). Ballistic missile motion is controllable at the beginning of its flight but falls freely as it approaches target. The ammunition impact is correlated to the missile motion. Ammunition impact has the capability to penetrate armour target. Solely using the same composite, steel or other materials as the armour’s component does not increase its ability to resist the penetration of the bullet (Laible, 1980). The multicomponent armours that coalesce different materials will produce better armours (Hogg, 2003). By involving the new high-performance fibres, particularly para-aramid fibres and materials, better protection can be achieved (Ag, 1994). Fibre composites can provide the best performance due to their low density. It can be combined with steel or aluminum which can yield a better strength. Consequently, this combination system can improve the armour hardness and defiance against ballistic impact. Kenaf fiber is working effectively by reinforcing filler in thermoplastic composites (Rowell et al., 1999). Combination of kenaf fiber with other materials allows creation of advanced composite material that can optimize the advantages of all the combined materials (Rowell et al., 1999). Polyurethane foam can be effectively used as impact absorber in sandwich armour due to their

102
high energy absorbing properties (Avallea et al., 2001). It has a high abrasion resistance and low thermal conductance. It can maintain the shape of the molding and parts that is pressing onto it. By implementing a common technology in the production of polymer mixture, a polymer foam made of polyurethane (PU) resin and raw kenaf fiber can be produced. The foam can absorb energy while transmitting stress equivalent to its own crushing strength. The kenaf foam composite fabrication that contain kenaf fibre and PU as its main components is used in order to build an armour plate. The combination of the outer plates with middle kenaf foam is purposely done in order to stop the movement of the resistance forces created by the bullet. The relationship between the depth of the indentation and resistance power can be derived. The effect of these parameters can facilitate the penetration continuously until it stops at the edge of the plate. This problem can be solved by attaching a multilayer of materials with greater elasticity to the mild steels, which by deformation will absorb the residual energy of the impact. 2. CHARACTERISTICS AND ADVANTAGES OF KENAF FIBER Kenaf is a fibre crop that grows seasonally in a temperate and tropical area. Its characteristics are related to cotton, okra and hibiscus. Kenaf requires less than six months to fully grow to its suitable size for processing. The plant grows to a height of 2.7–3.6 m and is harvested for its stalks, from which the fibre is extracted (Abdul Khalil et al., 2010). It is composed of two distinct fibres, bast (25-40%) and core (60-75%) (Abdul Khalil et al., 2010). There is a rapid growth related to natural fibre reinforced thermoplastic composite material in the industrial application and fundamental research (Rowell et al., 1998). The main advantages are light weight, nontoxic, cheap and biodegradable (Rowell et al., 1998). Furthermore, the fibre has advantages in terms of lower density and higher specific properties when compared to glass fibres (Ghani et al., 2012). It is also probably more inferior in stiffness and strength compared to high performance synthetic fibre such as aramids and graphite. Composite materials such as aramid and kevlar are widely used in the application of ballistic armour for personal protection. The ballistic fabrics laminate decelerate the ballistic projectile and hence minimising the impact. Kenaf fibre has been utilised in forming reinforced hybrid composites and it provides better tensile as well as flexural properties (Yahaya et al., 2015). Addition of kenaf layer in hybrid composites also resulted in the increase of composites thickness and its areal density, thus improving its energy absorption (Yahaya et al., 2016). Table 1 shows the properties of kenaf fibre.
Table 1: Properties of kenaf fibre (Hattali et al., 2002).
Properties Value Density (g/cm3) 1.4
Tensile Strength (MPa) 930 E Modulus (GPa) 53 Elongation of failure (%) 1.6
3. MATERIALS AND METHODS
3.1 MATERIALS
Polyurethane foam comprises of isocyanates and polyol were used. Both isocyanates and polyol are in liquid form at room temperature. Kenaf bast fibres that were used are commercially industrial product. The complete process to fabricate the kenaf form armour plates involved the following stages.

103
3.1.1 Combination of Kenaf Fibre and Polyurethane (PU) Combination of different kenaf fibre and polyurethane (PU) percentages in foam and thickness of the foam are as shown in Table 2. The kenaf fiber proportions are set to be 0% (100% PU), 10%, 20% and 30%. Due to the maximum length of test rig limitation experimental setup at STRIDE, the foam thickness is set to be 15 mm, 30 mm and 45 mm. The kenaf foam is sandwiched between the front and rear armour plates. These armour plates are made of mild steel materials. The material used for this test were mild steels and natural fibre kenaf reinforced polyurethane foam.
Table 2: Properties of armour plates.
Types of material Types of sample
Sample 1
Sample 2
Sample 3
Sample 4
Thickness of foam, a (mm) 15, 30 and 45
Percentage of kenaf fibre (%) 0 10 20 30
Percentage of polyurethane (%) 100 90 80 70
3.1.2. Sandwich Panel Arrangement These sections explain about the complete process to fabricate the mild steel plates and moulding preparation as a part of sandwich armour. Part of the installation process involves the measuring, cutting the plate and welding the top plate with the mild steel square hollow tube with thickness 3 mm of sandwich armour according to the required size as shown in Figure 1. Basically, the specimen is fabricated with same dimension of length and height but different width of foam, a (15, 30 and 45 mm). The specimen plate with length, l of 100 mm, height, h of 100 mm and thickness, t of 5 mm is measured. 12 samples were tested under quasi-static test using ammunition 5.56×45 mm under loading speed at 900 m/s with tolerance of ± 20 m/s.
Figure 1: Dimension of specimen with measurements.
Several formulations were prepared to acquire the best properties. After carrying out the room temperature at 31°C for 2 hours, the different test pieces were submitted to quasi-static compression test, tensile test and ballistic impact test for further valuation of their different behaviours.

104
3.2 Test Method
Firing tests were performed at the Weapon Technology Division, Science and Technology Research Institute for Defense (STRIDE) in Batu Arang, Rawang, Selangor. The firing test used The NATO STANAG 4569 level 1 standard. The ballistic barrels of calibre 5.56 mm with ammunition 5.56×45 mm SS109 were used (Standard: NATO-STANAG 4569, 2004). Targets were mounted normally to the trajectory of the projectile on a rigid stand with a distance of 5 m to the barrel. Firing tests were performed at 0o shooting angle and bullet’s velocity at 900 m/s with tolerance of ± 20 m/s. The experimental setup layout is illustrated in Figure 2. This experiment was performed in a 600 m indoor ballistic range at STRIDE. The front and back layers of the sandwich armour plate that was made of mild steel is shown in Figure 3. As the thickness of the kenaf foam in between the two layers increases, the resistance force of the specimen increases.
Figure 2: Experimental setup for ballistic test
(Standard: NATO - STANAG 4569 (2004).
kenaf foam
back mild steel plate
front mild steel plate
Figure 3: Cross sectional of sandwich armour plate with kenaf foam. 3.3 Quasi Static Compression Testing A Universal Test Machine was used to carry out the quasi-static compression test. The specimen was compressed between two parallel flat plates. The top plate moved at constant speed of 5 mm/min while the bottom plate was stationary. Load displacement curves were generated by the automatic chart recorder of the machine. Young’s Modulus, E and tensile strength, σ can be obtained from this test:
A
F (1)
i
fi
L
LL (2)
E (3)

105
3.4 Result and Discussion
3.4.1 Resistance Force There are two parameters of the reinforced foam in armour plates. The first is the percentage of kenaf in polyurethane foam and the second is the thickness of the foam. The percentages of kenaf in the polyurethane foam are 0%, 10%, 20% and 30%. The resistance of the armour plate can be measured by using the relationship of conservation of energy which has been simplified in Equation 4.
2
2
1energyKinetic MV
WorkenergyKinetic
)(energyKinetic XFR
X
MVFR
2
2
1
2
2
1)( MVXFR (4)
The lower depth of indentation indicates lower resistance force. Different percentages of kenaf responded differently to the impact. As shown in Figure 4, 20% of kenaf with 45 mm thickness has the highest resistance force of 530.28 kN while 10% of kenaf with 15 mm thickness has the lowest resistance force of 304.42 kN.
Figure 4: Result for difference types of foam thickness at percentage of kenaf.
Table 3 shows the results obtained from the quasi static compression test. It shows that 100% polyurethane has the least yield strength compared to other reinforced foams. The energy absorption of the reinforced form is higher compare to form without kenaf material. From the experiment, reinforced form with 80% of polyurethane has the highest Young’s Modulus. It can also be concluded that reinforced foam with combination of 20% kenaf and 80% polyurethane has the highest specific energy absorption which is 6.3009 J/g.

106
Table 3: Result of quasi static compression testing of polyurethane foam.
% of kenaf
% of
polyurethane
Young’s Modulus (MPa)
Energy Absorption (J)
Specific Energy Absorption (J/g)
0 100 30.72806 18.6075 0.9908 10 90 76.27439 94.7684 5.0895 20 80 138.95624 119.5915 6.3009 30 20 56.71304 57.0756 2.9978
The purpose of the quasi-static compression test on polyurethane foam is to determine the compressive stress-strain relationship of different percentage kenaf in reinforced polyurethane foam. Graph of flexure load versus elongation of the foam is plotted to acquire the value of strain as shown in Figure 5. The compression relationship between the stress and strain of the foam in Figure 6 shows the value of yield strength of each plate. The graph shows linear elastic response, where the stress is proportional to the strain.
Figure 5: Result of compressive test on percentage of polyurethane and kenaf
Figure 6: Relationship between stresses versus strain for different types of foam.
Figure 7 shows the test result of the mild steel at the front and back face after the ballistic impact. The bullets partially penetrated the specimen and created a depth of indention on the back plate.

107
Figure 7: Impacted mild steel tested (front and back face).
3.4.2 Depth of Indentation From the result, the resistance force of the armour increases whenever the depth of the indentation decreases. It can be concluded that the depth of indentation is inversely proportional to the resistance force. Figure 8 shows the minimum resistance force of 304.419 kN with the highest indentation of 5.4 mm. This result shows that the more a specimen can absorb the energy from the impact of the bullet, the lesser that depth of indentation at the back of the armour plate. This also shows that as the thickness of the foam increases, the energy absorption capability from the impact increases.
Figure 8: Result for difference types of foam thickness at depth of indentation.
3.4.3 Ballistic Test Results Ballistic impact behaviour of sandwich panels composite with kenaf foam has been presented. This behaviour is based on the experimental method presented in the previous section. Specifically, there are two parameters of reinforced foam in armour plates that has been examined in the firing test which is the percentage of kenaf in polyurethane foam and the thickness of the foam inside the armour plate. Lower depth of indentation means that the armour plate can resist more impact from the bullet compare to higher depth of indentation. There were four types of percentage of kenaf used which is 0%, 10%, 20% and 30% in the polyurethane foam. Each percentage has different response against the impact. All the data plotted in graph indentation depth against percentage of kenaf in foam as shown in Figure 9. Polyurethane foam with 20% of kenaf has the lower depth of indentation as compared to the other specimens. From this, we can conclude that polyurethane foam with 20% of kenaf has the highest resistance behavior against the ballistic impact of the bullet compare to polyurethane foam with 0%, 10% and 30% of kenaf reinforced.

108
Percentage of Kenaf in foam (%)
Inde
ntat
ion
dept
h(
mm
)
0 10 20 30 400
1
2
3
4
5
6
Foam thickness of 15 mmFoam thickness of 30 mmFoam thickness of 45 mm
Figure 9: Result for difference types of foam thickness.
3.4.4 Ballistic Test Result Base on Thickness of Kenaf Foam Parameter The specimen were made from combination of different kenaf fibre and polyurethane (PU) percentages in three thickness of foam used which is 15 mm, 30 mm and 45 mm in the armour sandwich plate. Each thickness has different response against the impact. A graph can be plotted on indentation depth versus thickness of foam as shown in Figure 10. Polyurethane foam with thickness of 45 mm has the lower depth of indentation compare to the other specimens for all four value of percentage of kenaf in foam. From this research, it can conclude that polyurethane foam with thickness of 45 mm has the highest resistance behavior against the ballistic impact of the bullet compare to polyurethane foam with thickness of 15 mm and 30 mm. It can also be concluded that, as the thickness of the foam increases, the depth of indentation at the armour plate decreases until 3.1 mm.
Thickness of foam ( mm )
Inde
ntat
ion
dept
h(
mm
)
0 10 20 30 40 500
1
2
3
4
5
6
0% of Kenaf10% of Kenaf20% of Kenaf30% of Kenaf
Figure 10: Result for percentage of kenaf at polyurethane foam.

109
4. CONCLUSION The foam thickness should be the main characteristic that contributes to the increase capability to absorb energy from the ballistic impact. This study has proven that polyurethane foam and kenaf foam increase the energy absorption at specific mixed polyurethane foam and kenaf percentage. It is also found that 20% of kenaf and 80% of polyurethane foam percentage is the best combination for the highest energy absoprtion. In addition, kenaf reinforcement in polyurethane foam increases the yield strength of the material.
NOMENCLATURE
E Young’s Modulus MPa F applied force per unit area Nm-2 A cross-sectional area mm2 FR penetration resistance force N M mass of projectile kg V velocity of the projectile ms-1 X penetration depth m Greek letter σ stress MPa strain % Subscripts fi final length of specimen mm i initial length of specimen mm ACKNOWLEDGEMENT The authors wish to acknowledge, with thanks, financial support by the Universiti Pertahanan Nasional Malaysia (UPNM) through Faculty of Engineering and Department of Human Resource Development, Register Department and also the committee of conference UPNM. REFERENCES Abdul Khalil, H.P.S., Ireana Yusra, A.F., Bhat, A.H. & Jawaid, M. (2010). Cell wall ultrastructure,
anatomy, lignin distribution and chemical composition of Malaysian cultivated kenaf fiber. Ind. Crops Prod., 31: 113-121.
Ag, A.F. (1994). Ballistic impact on composites. T. Eng. Sci., 4: 2-8. Avallea, M., Belingardia, G. & Montaninib, R. (2001). Characterization of polymeric structural foams
under compressive impact loading by means of energy-absorption diagram. Int. J. Impact Eng., 25: 455 – 472.
Cantwell, W.J. & Morton, J. (1991). The impact resistance of composite materials - a review. Composites 22: 347–62.
Eswara P.N. & Wanhill R.J.H. (2017). Aerospace Materials and Material Technologies. Indian Institute of Metals Series.
Ghani, M.A.A., Salleh, Z., Hyie, K.M., Berhan, M.N., Y. Taib, M.D. & Bakri M.A.I. (2012). Mechanical properties of Kenaf/Fiberglass Polyester Hybrid Composite, Procedia Eng., 41: 1654-1659.

110
Hattalli, S., Benaboura, A., Ham-Pichavant, F. Nourmamode, A. & Castellan A. (2002). Adding value to Alfa grass (Stipatenacissima L.) soda lignin as phenolic resins 1. Lignin characterization. Polymer Degrad. Stabil., 76: 259-264.
Hogg, P. J. (2003). Composites for Ballistic Applications. Proceedings of Composite Processing, pp. 1 – 11.
Laible, R. C. (1980). Ballistic Materials and Penetration Mechanics. Elsevier Scientific Publishing Company.
Lanz, W., Odermatt, W. & Weihrauch, G. (2001). Kinetic Energy Projectiles: Development History, State of the Art, Trends. 19th International Symposium of Ballistics, 7-11 May 2001, Interlaken, Switzerland.,:1191-1197.
Rowell, R. M., Caulfield, D. F., Chen, G., Ellis, W. D., Jacobson, R. E., Lange, S. E. & Rebecca, S. (1998). Recent advances in agro-fibre/thermoplastic composites, 2nd International Symposium on Natural Polymers and Composites, Atibaia, SP, Brazil.,:11-13.
Rowell, R. M., Sanadi, A., Jacobson, R. & Caulfield, D. F. (1999). Properties of Kenaf/Polypropylene Composites. In: Kenaf Properties, Processing and Products; Mississippi State University, Ag & Bio Eng., pp. 381-392.
Standard: NATO-STANAG 4569 (2004). Standard: NATO - STANAG 4569: Protection Levels for Occupants Of Logistic and Light Armoured Vehicles. Available online at: http://standards.globalspec.com/std/885757/nato-stanag-4569 (Last access date: 23 May 2014)
Yahaya, R., Sapuan, S. M., Jawaid, M., Leman, Z. & Zainudin, E. S. (2015). Effects of kenaf contents and fiber orientation on physical, mechanical, and morphological properties of hybrid laminated composites for vehicle spall liners. Polymer Compos., 36: 1469-1476.
Yahaya, R., Sapuan, S. M., Jawaid, M., Leman, Z. & Zainudin, E. S. (2016). Investigating ballistic impact properties of woven kenaf-aramid hybrid composites. Fibers Polymers,17: 275-281.
111
SIMULATION OF HYBRID-III DUMMY RESPONSE USING THREE LS-DYNA BLAST METHODS
Khalis Suhaimi, Risby Mohd Sohaimi*, Victor Feizal Knight, Tan Kean Sheng, Megat Mohamad Hamdan Megat Ahmad, Muhammad Fahmi Md. Isa, Arif Shafiq Mohd Sohaimi, Mohd Nor Hafizi Noordin &
Asrul Syaharani
Protection and Survivability Research Unit, Faculty of Engineering, National Defence University of Malaysia (UPNM), Malaysia
*Email: [email protected]
ABSTRACT
Anti-tank mines or improvised explosive devices are one of the lethal threats for occupants in armoured vehicles. Studies in minimising crew injuries and enhancing the protection level are vital due to the advancement of weapon technologies. Typical approach in validating these studies are by performing full scale or laboratory scaled mine blast experiments. However this method is costly and may involve occupational hazards due to the use of explosive materials. Numerical simulation offers viable alternative where commercial packages such as LS-DYNA can predict the outcome of blast related tests. In this paper, three blast model methods namely LOAD_BLAST_ENHANCED (LBE), Multi-Material Arbitary Langrangian Eulerian (MM-ALE) and LBE coupled with MM-ALE (LBE-ALE) were used to simulate vehicle occupants response in mine blast event. An anthropomorphic test dummy (ATD) finite element model was placed inside a capsule and was subjected to 6 kg TNT blast detonation. All three numerical methods were utilised in simulating this scenario. For model verification purposes, the result was compared with an experimental data from literature. It can be concluded that MM-ALE method computed a much higher response (force and acceleration data) compared to LBE-ALE and LBE methods. Keywords: Mine blast, shockwave, STANAG 4529, impulse, injury 1. INTRODUCTION
There are many studies done on the effect of mine blast towards security personnel, vehicles and structures especially related to the mine blast response on armored vehicle occupants. LS-DYNA, a commercial finite element package is a common tool used to simulate blast event and possess several blast load methods for selection. The first method is by using Lagrangian approach known as as LOAD BLAST ENHANCED. In this approach, the surrounding air boundary of the simulation is considered as negligible since the load input only requires the parameter of the explosive charge weight and its standoff distance (Slavik, 2010). The blast pressure from this modeling is derived from the Conventional Weapons Effects (ConWep) empirical calculation (Hyde, 1988). The pressure from the blast is exerted exactly towards the Lagrangian structure in the model. This blast method is commonly used in most research work due to its fast computational time. However, the disadvantage of using LBE is that it does not account for blast reflections (Schwer, 2010). The second method is by utilizing MM-ALE approach. Contrast to the Lagrangian method, the MM-ALE method consists of fixed finite element mesh with the ability of material to flow through the mesh. This condition produces simulation that yields large deformation such as air blast wave propagation with the interaction of Lagrangian parts (Haladuick, 2014). The air domain is modeled as ideal gas which is defined by using linear polynomial equation of

112
state (EOS). This method is useful for tracing the blast wave in the air domain and allows for the visualisation of blast wave propagation through the Lagrangian structure. However, this method is considered “expensive” (in term of computational time) due to its long duration in compiling the dataset (Tabatabaei et al., 2012). The third method is by coupling both LBE and MM_ALE methods altogether. Basically, this method integrates both LBE and MM-ALE functionality. The explosive for the simulation is modelled with LBE model while the surrounding air is modelled with MM-ALE model. This method allow the explosive model to be simplified in LBE format but the retains the MM_ALE format for blast reflections since the Lagrangian part is modelled with surrounding air mesh. The benefit of using this method is that the air domain can be modelled as close as possible to the Lagrangian part, thus reducing the total element number and computational time (Eren, 2016). Although all the three methods are commonly used in blast simulation, only few comparative studies have been found to evaluate the performance of these blast methods. In addition, comparison of anthropometric test dummy (ATD) response based on all three blast methods has not been reported. This study can provide an insight of the potential injuries sustained by the vehicle occupant in such event. In this paper, an ATD was placed in a steel capsule which was then subjected to 6 kg of explosive detonation. Finite element simulation of the ATD blast response using three different blast methods were compared in terms of the acceleration to the ATD pelvic and chest region. 2. METHODOLOGY
2.1 Capsule and ATD Placement A blast capsule was modeled with an ATD finite element model (HYBRID III 50th percentile developed by Livermore Software Technology Corporation) as shown in Figure 1. The ATD is positioned on a seat with 380 mm height. The ground clearance or standoff distance of the capsule was set to 400 mm which is similar to the ground clearance of SIBMAS 6x6 Armored Fighting Support Vehicle (ASFV) hull to the ground section. The measurement was made in situ using standard measuring tape. The ATD, seat and capsule are a modeled as Lagrangian parts. The contact between the three parts are define by using AUTOMATIC_SURFACE_TO_SURFACE card.
Figure 1: Setup of ATD placement inside a capsule.
The capsule was placed on a ground which is modeled using *RIGIDWALL_PLANAR_ID card in LS-DYNA. This card creates a rigid wall according to user specifications. Rigid wall acts as a plane which is not deformable but still has the ability to interact with other parts in the model. This rigid wall can be set

113
to be stationary or moving in translational motion. In this case, the rigidwall is set to stationary and acts as ground component for the simulation. The rigidwall enables the reflective waves that bounces back after the detonation. However, the reflective wave function is not available for LBE blast method (Schwer, 2010). The explosive for each blast method was placed 190 mm above the ground and 551 mm to the left side of the ATD from its center. Each blast method setup will be discussed in the detail in the next section. 2.2 Load Blast Enhanced Using the same setup describe in Section 2.1, by utilising the LOAD_BLAST_ the LBE method explosive charge is modeled ENHANCED card. The input values of the card is given in Table 1 and was based according to the study design requirement. This method does not require the input value for the surrounding air as the boundary condition is considered in vacuum (Haladuick, 2014).
Table 1: LOAD_BLAST_ENHANCED card parameters.
*LOAD_BLAST_ENHANCED bid m [kg] xbo[mm] ybo[mm] zbo[mm] tbo[ms] unit blast 1 6.0 165.0 69.0 -490.0 0.0 6 2
In Table 1, bid is defined as blast id, m, is the weight of the explosive, xbo, ybo and zbo is the coordinate of the explosive, tbo is the time of detonation, unit is the standard unit set by LS-DYNA in which the user has to follow specifically. In this case, standard unit type 6 in LS-DYNA setting which represent the unit of (kg, mm, ms, kN and GPa) was utilized. Moreover, the blast term is defined as the type of blast source where selection using the value of 2 denotes a spherical free-air burst condition. 2.3 Multi-Material Arbitary Lagrangian Eulerian In this method, the air boundary condition was modelled to encapsulate the whole Lagrangian parts in Section 2.2. The air boundary consists of two parts, air and explosives. The two parts were defined using ALE_MULTI_MATERIAL_GROUP. In the initial stage of the simulation, the air and explosive fragment was distinguished by using INITIAL_VOLUME_FRACTION_GEOMETRY. The explosive in this method was modeled using MAT_HIGH_EXPLOSIVE_BURN card and MAT_NULL card for the surrounding air. The setup of MM-ALE blast method is shown in Figure 2.
Figure 2: MM-ALE blast method setup with air surrounding the capsule and explosive underneath the
capsule.

114
Jones Wilkins Lee (JWL) Equation of State (EOS) is used as governing equation for the explosive. The equation is as shown in Eq.1 (Lee et al., 1968):
1 1 2 2
1 2
1 1R V R V o
r r r
EP A e B e
RV R V V
(1)
where P is the pressure, Vr is defined as the relative volume, , R1, R2, A and B are the constants affiliated to the explosive. Linear Polynomial Equation of State was used to model the surrounding air. The Linear Polynomial Equation is as shown in Eq.2 and Eq.3 (Biggs, 1964):
2 3 2
1 2 3 4 5 6oP C C C C C C C E (2)
where:
1o
(3)
E is defined as specific internal energy in unit of pressure, and o are the present and initial air
densities respectively, C0, C1, C2, C3, C4, C5 and C6 is the constant for the governing equation. In the case of ideal gas, the equation is reduced to (Biggs, 1964; Langrand et al., 2003):
1o
P E
(4)
where, 60 1 2 3 0C C C C C and 4 5 1C C . is defined as polytropic ratio of specific
heats. The value for the air and explosive model is given in Table 2.
Table 2: Material properties and EOS parameters.
MAT_HIGH_EXPLOSIVE_BURN (PE4) (Rigby & Sielicki,2014) RO D PCJ BETA K G SIGY
1.601x10⁻⁶ 8193 28 0 0 0 0 JWL EOS (Chung et al., 2012)
A B R1 R2 ω Eo Vo 609.79993 12.95 4.5 1.4 0.25 0.005621 1.0
MAT_NULL (Air) (Cheng et al., 2013) RO PC MU TEROD CEROD YM PR
1.225x10⁻⁶ 0 0 0 0 0 0 LINEAR POLYNOMIAL EOS (Langrand et al., 2003)
C0 C1 C2 C3 C4 C5 C6 Eo Vo 0 0 0 0 0.403 0.403 0 0.0025 1.0
(Unit: kg,mm,ms,kN,GPa) 2.3 LBE and MM-ALE Coupling Method In this method, the surrounding air was modeled close to Lagrangian part (capsule), whereas the air boundary that surrounds the explosive was discarded. The explosive in this method was modeled using

115
LBE card which is similar to explosive setup in Section 2.2. However, in this method, an ambient layer was created so that the simulation recognizes the layer as Ambient Element Type and modeled to be “Receptor for Load Blast Enhanced.”. This layer which is shown in Figure 3 and according to Schwer (2010), is actually a prescribed boundary condition, e.g. prescribed pressure in/out flow for the load blast enhanced input. The discarded air means less meshing process to the existing boundary element, thus reducing the total simulation time. Figure 3 shows the overall setup for the LBE and MM_ALE coupling method.
Figure 3: LBE-ALE and MM-ALE model configuration (coupling of Lagrangian and Eulerian codes).
3. RESULTS AND DISCUSSION Evaluation on the performance of the three methods were made by comparing the CPU running time for the numerical calculations and the response of the ATD from blast loading. All three simulations were run on SMP LS-DYNA_971 R8 version using Intel(R) Xeon(R) CPU [email protected] processor with 64.0 GB of RAM. Table 3 shows the comparison of all three simulation computation statistics. It can be observed that MM-ALE method clocked the highest computation time followed by LBE-ALE and LBE method. This is due to the element size of the MM_ALE model compared to other methods. Although the number of element for LBE-ALE is near to MM-ALE, the computational time was reduced near to half of MM-ALE computational time.
Table 3: Blast simulation computation time for all three methods.
Method LBE MM-ALE LBE-ALE Number of Elements 19130 49798 48418
Termination time (ms) 150 150 150 Total CPU Computational Time (min) 15 151 75
A blast experimental related human tibia structure response when subjected to a 400g TNT detonation was obtained from literature (NATO, 2012 and Horst et al., 2005) and was used for model verification. Figure 4 shows the result of model ATD’s tibia axial force comparison between the experimental and numerical simulation results. From Figure 4, it can be observed that the experimental force curve trend is in agreement with the curves from the simulations results. The peak of the experimental result was

116
recorded at 10.69 kN which differs about 51, 18 and 24 percent when compared to the peak simulations result of ALE, LBE-ALE and LBE respectively. The difference for the time of peak force between simulations and the experiment was maybe due to different standoff distance of the experimental data which was not specifically mentioned in detail in the literature. However, in terms of force peak duration, satisfactory comparison between the experiment and LBE-ALE results can be observed in which the duration of peak were recorded at 1.5 ms and 1.8 ms respectively.
Figure 4: Comparison between experimental and numerical simulation data of axial force exerted to tibia structure.
Figure 5 shows the time sequence of the ATD inside the capsule during the blast event. The air medium in MM-ALE and LBE-ALE based model in Figure 5 was disabled in order to enable comparison with LBE model.
Method LBE MM-ALE LBE-ALE
0 ms
20 ms
0 5 10 15-15
-10
-5
0
5
10
15
20
Time [ms]
Z-F
orce
[kN
]
MM-ALELBE-ALELBEExperiment (NATO, 2012)
117
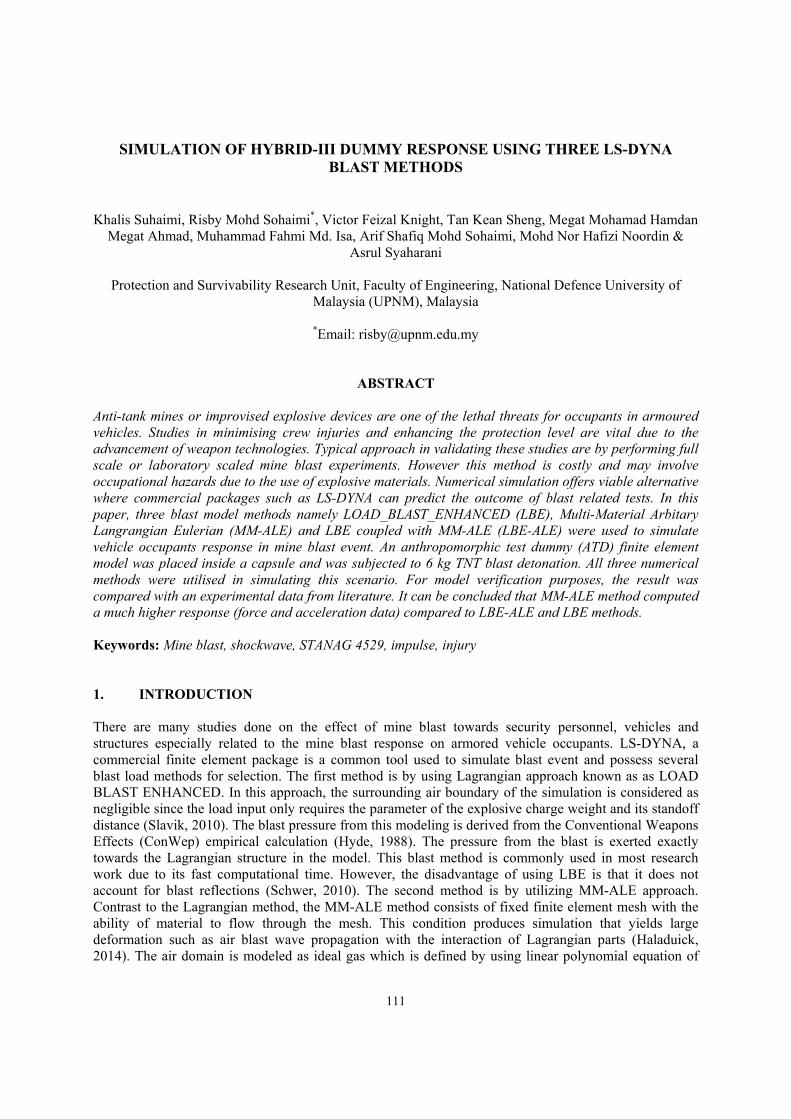
40 ms
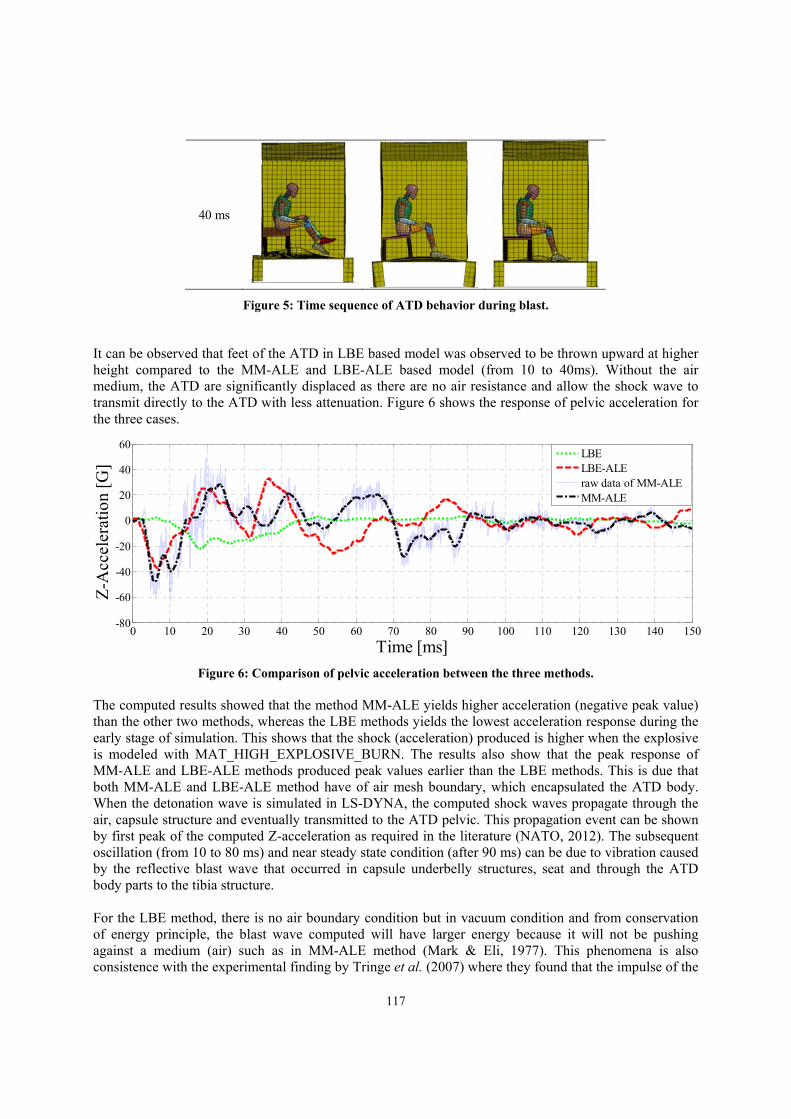
Figure 5: Time sequence of ATD behavior during blast. It can be observed that feet of the ATD in LBE based model was observed to be thrown upward at higher height compared to the MM-ALE and LBE-ALE based model (from 10 to 40ms). Without the air medium, the ATD are significantly displaced as there are no air resistance and allow the shock wave to transmit directly to the ATD with less attenuation. Figure 6 shows the response of pelvic acceleration for the three cases.
Figure 6: Comparison of pelvic acceleration between the three methods.
The computed results showed that the method MM-ALE yields higher acceleration (negative peak value) than the other two methods, whereas the LBE methods yields the lowest acceleration response during the early stage of simulation. This shows that the shock (acceleration) produced is higher when the explosive is modeled with MAT_HIGH_EXPLOSIVE_BURN. The results also show that the peak response of MM-ALE and LBE-ALE methods produced peak values earlier than the LBE methods. This is due that both MM-ALE and LBE-ALE method have of air mesh boundary, which encapsulated the ATD body. When the detonation wave is simulated in LS-DYNA, the computed shock waves propagate through the air, capsule structure and eventually transmitted to the ATD pelvic. This propagation event can be shown by first peak of the computed Z-acceleration as required in the literature (NATO, 2012). The subsequent oscillation (from 10 to 80 ms) and near steady state condition (after 90 ms) can be due to vibration caused by the reflective blast wave that occurred in capsule underbelly structures, seat and through the ATD body parts to the tibia structure.
For the LBE method, there is no air boundary condition but in vacuum condition and from conservation of energy principle, the blast wave computed will have larger energy because it will not be pushing against a medium (air) such as in MM-ALE method (Mark & Eli, 1977). This phenomena is also consistence with the experimental finding by Tringe et al. (2007) where they found that the impulse of the
0 10 20 30 40 50 60 70 80 90 100 110 120 130 140 150-80
-60
-40
-20
0
20
40
60
Time [ms]
Z-A
ccel
erat
ion
[G]
LBELBE-ALEraw data of MM-ALEMM-ALE

118
blast wave acting on the plate in air is likely greater than the impulse of the blast wave acting on the plate in vacuum condition. This was due to the longer interaction time of the shock-compressed air shell surrounding the expanding blast wave radius. The difference can be assumed that in a vacuum condition, the expanding gases from the detonation will dissipate faster as it expands. Therefore, the lethal overpressure radius will be much higher in air boundary condition than it would be in vacuum. The acceleration computed for LBE method at the pelvic region can be acknowledged as the shock transmitted through the ATD limbs from the capsule underbelly structures and seat. From Figure 6, similar trends were observed for MM-ALE and LBE-ALE based model starting from the range 20 to 40 ms, which denotes that the shock wave travels through the rigid components in as above mentioned orderly manner. It can be also observed, at the first peak, LBE method computed the lowest shock value compared to LBE-ALE and MM-ALE (approximately around 55% difference) whereas, MM-ALE produced the highest shock value. This trend was also similarly observed by Schwer (2010), where the computed MM-ALE blast peak overpressure result is approximately 59% higher than LBE peak overpressure. The chest injury component of the ATD was also studied by analysing its acceleration. Figure 7 shows the comparison of the chest acceleration between the three cases. Figure 7 showed that the peak of resultant acceleration of the chest section for the three cases is almost at the same level. The results showed similar trends with the pelvic acceleration results, which the MM-ALE and LBE-ALE methods computed the initial peak earlier compared to the LBE method. However, significant results can be noticed after 25ms where the LBE acceleration start to decrease whereas the MM-ALE and LBE-ALE methods still continue to records high acceleration. This may be due that the volatility of reflective blast wave in air medium that continues to impact the ATD chest. The absence of air surrounding the model in LBE, which resulted in the decrease of the acceleration after the first peak.
Figure 7: Comparison of resultant chest acceleration between the three methods.
4. CONCLUSION
Three different LS-DYNA blast methods were utilised in investigating the occupant response from mine blast loading. The results show significant difference in computation time between the three methods. MM-ALE recorded the longest computation time followed by LBE-ALE and the shortest computation time was recorded by LBE method. This shows that the higher number of elements yields higher computation time. The result also shows that the MM-ALE methods produced higher peak response than the other two methods due to the explosive modeling difference in LS-DYNA. The results obtained also
0 10 20 30 40 50 60 70 80 90 100 110 120 130 140 1500
10
20
30
40
Time [ms]
Res
ulta
nt A
ccel
erat
ion
[G]
MM-ALELBE-ALELBE

119
indicated that the air boundary condition surrounding the ATD have contributed significantly to shockwave propagation towards the ATD (travel faster) and the presence of surrounding air enables subsequent waves or reflective waves to propagate continuously to the structure. It is recommended to use MM-ALE or LBE-ALE for a much more realistic result in blast modeling whereas the LBE method is useful in preliminary behavior estimation as the method took less solving time compared to the other two methods. ACKNOWLEDGEMENT
The authors wish to acknowledge the research grant provided by Long Term Research Grant Scheme (LRGS/B-U/2013/UPNM/DEFENCE&SECURITY-P3) from the Malaysian Ministry of Education that lead to the realization of this work. REFERENCES Biggs, J.M. (1964). Introduction to Structural Dynamics, McGraw-Hill, New York Cheng, D. Hung, C. & Pi, S. (2013). Numerical Simulation of Near-Field Explosion. J. Appl. Sci. Eng.,
16: 61–67. Chung, K.Y.S. Langdon, G.S., Nurick, G.N. Pickering, E.G. & Balden, V.H. (2012). Response of V-
shape plates to localised blast load: Experiments and numerical simulation. Int. J. Impact Eng., 46:97–109.
Eren, Z., Kazancı, Z., & Türkmen, H. S. (2016). Repeated air blast response of sisal fibers reinforced bio- composites. Procedia Eng., 167: 197–205.
Haladuick, T. (2014). Numerical Simulation of Blast Interaction with the Human Body : Primary Blast Brain Injury Prediction. MSc Thesis, University of Waterloo, Ontario, Canada.
Horst, M.J. van der., Simms, C. K.., Maasdam, R. van. & Leerdam, P. J. (2005), Occupant lower leg injury assessment in landmine detonations under a vehicle. IUTAM Symposium on Biomechanics of Impact: From Fundamental Insights to Applications, Dublin, Ireland, July 2005.
Hyde, D. (1988). User’s Guide for Microcomputer Programs ConWep and FUNPRO Applications of TM5- 855-1: Fundamentals of Protective Design for Conventional Weapons. U.S. Army Engineers Waterways Experimentation Station.
Langrand, B., Deletombe, E., Charles, J.L., Sobry, J.L., Martin, S. & Chazal, H. (2003). Armoured vehicles subject to mine explosions- an analysis method for operationability and survivability. J. Phys. IV, 110: 621–626.
Lee, E.L., Hornig, H.C. & Kury, J.W. (1968). Adiabatic expansion of high explosive detonation products, Technical Report TID 4500-UCRL 50422, Lawrence Radiation Laboratory, University of California, California.
Mark N.D. & Eli K.D. (1977). Predictions of variable-energy blast waves, AIAA J., 15: 1315-1321. NATO (2012). Test Methodology for Protection of Vehicle Occupants Against Anti-Vehicular Landmine
and / or IED Effects.TR-HFM-148. Rigby, S.E. & Sielicki, P.W. (2014) An investigation of TNT equivalence of hemispherical PE4 charges.
Eng. T., 62:423-435.. Schwer, L. (2010). A brief introduction to coupling load blast enhanced with multi-material ALE : The
best of both worlds for air blast simulation. LS-DYNA Forum, Bamberg, pp. 1–12. Slavik, T. P. (2009). A coupling of empirical explosive blast loads to ALE air domains in LS-DYNA. 7th
European LS-DYNA Conference, Salzburg, Austria. Tabatabaei, Z. S. and Volz, J. S. (2012). A comparison between three different blast methods in LS-
DYNA, 12th Int. LS-DYNA Users Conf., no. 3, pp. 1–10.

120
Tringe, J.W., Molitoris, J.D. & Garza, R.G. (2007), Detailed comparison of blast effects in air and vacuum. American Physical Society, Kohala Coast, Hawaii.
121
SIMULATION ON THE SHOCK ATTENUATION BEHAVIOUR OF COUPLED RHA AND SANDWICH COMPOSITE PANEL UNDER BLAST LOADING
Muhammad Fahmi Md. Isa*, Risby Mohd Sohaimi, Norazman Mohamad, Shohaimi Abdullah, Megat Mohamad Hamdan Megat Ahmad, Ariffin Ismail, Muhammad Alias Yusof, Khalis Suhaimi, Arif Shafiq
Mohd Sohaimi, Mohd Nor Hafizi Noordin & Asrul Syaharani
Protection and Survivability Research Unit (PROTECT), Faculty of Engineering, Universiti Pertahanan Nasional Malaysia (UPNM), Malaysia
*Email: [email protected]
ABSTRACT
This paper presents the shock attenuation response of Rolled Homogenous Armor (RHA) and sandwich composite when subject to blast loadings. Blast loading on sandwich composite structure and monolithic material was simulated using Arbitrary Lagrangian Eulerian (ALE) method available in LS-DYNA. Dynamic response in terms of shock exerted was analyzed in order to understand the shock attenuation of monolithic structure and sandwich structure. Based on the results, coupled RHA-sandwich composite structure configuration was found to exhibit the highest attenuation capability of 60.3%respectively. The study can be used as reference tool for automotive, naval and aeronautical structures, oil and gas industry related to blast loading conditions. Keywords: Shock attenuation; composite; explosive; blast; Arbitrary Lagrangian Eulerian (ALE).
1. INTRODUCTION Improvised explosive device (IED) and anti-vehicular landmine attack can lead to failure on military vehicles structure or injury to vehicle occupants. As the explosive detonates under a vehicle, a shock wave consists of energy burst is produced. The shock wave propagates at high speed, passing through the vehicle floor in microseconds in time duration and create massive deflection and acceleration on the flooring section. This eventually results in high loads and shock to the lower limbs of the occupant. Although, armored vehicle possesses its own armored plates or made from toughened steel alloy for ballistic and blast protection, landmine attacks can also capsize or produce rollover effect to the vehicle (NATO Technical Report, 2007). Therefore this paper presents the shock attenuation capability of additional sandwich based composites panel on vehicle floor when it is subjected to the blast loading.
Sandwich composites structure has been recognized as one of the viable solution for structural design (Houlston et al., 1985; Goldsmith, 1992; Baker, 1998; Paik, 1999; Guruprasad, 2000). It is typically comprised of facesheets sandwiched together with core materials such as honeycomb materials. The facesheet material is made from high-strength material, for example steel and composites; the core is made of thick and lightweight materials such as cardboard, plywood, foam and etc. Rao (2012) has reported when bending moment act on sandwich panel or beam, the maximum stress react at the skin materials. Thus a high tensile strength materials is placed at the top and bottom while a high compressive strength material placed in the middle of the structure. Honeycomb core utilisation for blast application have been studied by many researchers, where honeycomb sandwich structures provides a remarkable strength and energy absorbing over the monolithic structures of equal mass (Mamalis et al.2002; Qiu,

122
2003; Fleck, 2004; Rathbun,2006; Zhu,2007;Gardner et al., 2012). The honeycomb core prevents crushing effect more effective at lower impulse condition.
However, comparative study on the shock transmitted between sandwich composite and monolithic structures need to be reported. This study focuses on the comparison between shock responses of vehicle floor section with additional sandwich composites (aluminium honeycomb core and carbon fiber facesheets) and flooring section made from stand-alone Rolled Homogeneous Armor (RHA) steel plate when subjected to blast loadings. 2. NUMERICAL SIMULATION
The numerical simulation was performed using finite element analysis software, which was LS-DYNA. The software is able to predict the dynamic structure response using various blast method available in its solver such as Lagrangian, Eulerian and coupled Lagrangian-Eulerian methods.
The Lagrangian approach with simplified engineering blast model is commonly used because it reduces the computational time. Multi-material Eulerian formulation is used as part of the Arbitrary Lagrangian Eulerian (ALE) solver whereby combining the ALE solver with an Eulerian Lagrangian coupling algorithm, a structural or Lagrangian mesh can interact with the ambient element or Eulerian mesh. Neuberger et al. (2007) found that by using this method simplified blast model produce uncertain impulse duration due to the target was close to the blast proximity.
2.1 Material Models for Air and Explosive Detonation of explosive creates a shock wave in the surrounding fluid (Eulerian) and its interaction with a structure (Lagrangian) can be a complex event to be modelled. In this case, the fluid medium applies a very short but intense pressure field which depends on its chemical composition, explosive geometry and fluid properties such as wave speed and density. The formulation of Arbitrary Lagrangian Eulerian (ALE) model is suitable for this case which involve a Fluid Structure Interaction (FSI) between three different components which are; explosives, air and evaluated structure. The Trinitrotuoluene (TNT) explosive compound is modeled via Jones_Wilkins_Lee (JWL) semi-empirical equation of state (*EOS_JWL) and can be expressed as in Equation 1(Tabatabaei, 2012):
1 2
1 2
1 1R V R Vp A e B e ERV R V V
(1)
where p is the pressure, V is the relative volume and B, A, , R1 and R2 are constants and the material card *MAT_HIGH_EXPLOSIVE_BURN is used as shown in the Table 1.
Table 1: JWL and material parameters forTrinitrotoluene, TNT (Tabatabaei, 2012).
EOS_JWL A B R1 R2 E
3.710exp11 3.231exp9 4.15 0.95 0.3 4.294exp6 MAT_HIGH_EXPLOSIVE_BURN (TNT)
RO(kg/m3) D(m/s) PCJ(GPa) 1630 6930 21

123
The air acting as medium transfer by blast wave propagation is model using eight-node brick elements *MAT_NULL material model card. The equation of state of air are modeled using *EOS_LINEAR_POLYNOMIAL card which is linear in the internal energy per unit initial volume (Tabatabaei, 2012). The ideal gas law EOS is used for pressure of perfect gas as in Eq. 2.
00
1P E
(2)
2.2 Material Models for RHA and Sandwich Honeycomb Composites
There are several material coefficients for Rolled Homogenous Armor (RHA) steel that is based on the Johnson–Cook (JC) material model. This model is commonly used due to its simplicity (Oxelosund, 2001; Šlaiz, 2012). The JC model provides an important material responses in impact and penetration based on the material’s strain hardening, strain effects and thermal softening value. Table 2 list the JC model constants for RHA steel.
Table 2: Johnson Cook model constants for RHA material (Neuberger et al., 2007).
Material A (MPa) B(MPa) C n M RHA steel 1000 500 0.014 0.26 1
A finite element model of RHA panel coupled with sandwich composite panel in Figure 1 was modeled using 1250 solid elements sandwich composite panel, 1250 shell elements for the facesheets and 1875 solid elements as the honeycomb core. The interfaces between RHA, facesheets and honeycomb core on sandwich panel are considered as perfectly bonded.
Figure 1: Coupled RHA-Sandwich composite structure model.
As for the sandwich composite, the structure was modeled using pre-processing software LS-PrePost4.3 using combination of two different material models consist of MAT_Composite_Damage (facesheets) and MAT_Honeycomb (honeycomb core) as shown in Table 3. The composite mechanical properties of the composite was taken from publish work of Gama et al. (2010).
The facesheets was modeled as 3D orthogonal weave fabric composite with total of 1,352 elements. The edge surface of the structure was rigidly fixed at all axis. The core material was modeled based on aluminum foam with density 730kg/m3, Elastic modulus of 6.9exp+10 Pa and Poisson ratio of 0.28. LS-DYNA software was used for all computational simulation and the total computational time was set at 15 ms.
Sandwich composite0.036 mm
RHA Steel 0.020 mm 0.5 m
TNT
Sandwich Composite
RHA Steel
1.0 m 1.0m

124
Table 3: Mechanical properties of sandwich composite (Gama et al., 2010).
*MAT_Composite_Damage RO EA EB EC PRBA PRCA PRCB
1850 2.75exp+10 2.75exp+10 1.18exp+10 0.11 0.18 0.18 GAB GBC GCA
2.9exp10 2.14exp9 2.14exp+9 *MAT_Honeycomb
RO E PR SIGY VF MU 710 6.9exp10 0.28 2.68exp8 2.63exp-7 0.05
EAAU EBBU ECCU GABU GBCU GCAU 2exp+8 2exp+8 2exp+8 8exp+7 8exp+7 8
As for the composite structure, the geometry of sandwich composite was modeled using shell element for the face sheet and solid element for the core material. A cylindrical component representing a vehicle occupant in standing position was used as constraint in the model (as shown in Figure 2). The mass of the cylinder is assumed at 70 kg which represent the nominal weight of an adult male occupant. The coupled RHA and sandwich structure was subjected to blast loading simulation using 0.5, 1, 1.5 and 2kg at 0.5m standoff distance.
Figure 2: Cylinder model as representation of vehicle occupant on floor structure model.
3. RESULT AND DISCUSSION
The RHA simulation results were compared and verified using experimental data from Neuberger et al. (2007). As shown in Table 4, the range of percentage difference of the computed numerical simulations were found to be below than 13% when compared with the experimental data by Neuberger et al. (2009). Whereas the range of percentage difference of the computed numerical simulations were found to be below than 32% when compared with the numerical computational data done by the same study. The larger percentage difference between both numerical results may be due to the different LS-DYNA settings (mesh size, boundary conditions, etc.) done by Neuberger et al. (2009).

125
Table 4: Verification of monolithic structure (RHA steel) model based on Neuberger (2009).
Z (m/kg1/3)
TNT (kg)
Standoff
Dist. (mm)
Displacement (mm) Experiment(Neuberger et al. 2009),
A
Numerical (Neuberger et al. 2009),
B
Computed result (mm), C
% Difference
A and C
% Difference A and B
0.13 3.75 200 54.0 52.4 52.0 3.7 0.76 0.10 8.75 200 107.0 104.8 93.2 12.9 11.06 0.06 8.75 130 165.0 123.0 179.9 8.2 31.6
Figure 3 show the midpoint deflection of RHA subjected to three different scaled distance which is 0.06, 0.1 and 0.13 mm. All three level of blast scaling condition (Z) showed a good agreement when compared with experimental data collect by Neuberger et al. (2009).
0 2 4 6 8
x 10-3
0
0.05
0.1
0.15
0.2
Time (sec)
Dis
pla
cem
ent
(m)
Z=0.13Z=0.06Z=0.10
(0.00129,0.1797)
(0.00145,0.0932)
(0.000808,0.05196)
Figure 3: Midpoint deflection against time at different scales distance.
Table 5 presents the computed shock value acting on the floor area (where itis connected to the surface of the cylindrical component) when simulating the Neuberger et al. (2009) test setup. It can be observed that at lower scaled blast condition (Z) value, high shock value will be transferred to the vehicle occupant and may lead to fatal injuries.
Table 5: Shock acting on the vehicle occupant at different scaled blast condition.
Z (m/kg1/3)
TNT (kg)
SOD (mm) Numerical LS DYNA
Acceleration (m/s) Shock (g) 0.13 3.75 200 7.1721 x10⁵ 73 110 0.10 8.75 200 1.8693 x10⁶ 190 550 0.06 8.75 130 3.8252 x10⁶ 389 929
The computed resultant velocity (at maximum midpoint displacement value of cylinder solid) are shown in Figure 3.All the velocity curves in Figure 3(a), (b), (c) and (d) show a good agreement where the shock velocity transmitted to the cylinder solid were observed to be significantly reduced when RHA floor section was coupled with sandwich composite structure.

126
0 0.002 0.004 0.006 0.008 0.010
0.5
1
1.5
2
2.5
3
Time (sec)
Ve
loc
ity
(m
/se
c)
0.5kg TNT explosive
RHA couple with sandwich composite
RHA
0 0.002 0.004 0.006 0.008 0.010
0.5
1
1.5
2
2.5
3
3.5
4
4.5
Time (sec)
Ve
loc
ity
(m
/se
c)
1kg TNT explosive
RHA
RHA couple with sandwich composite
(a) (b)
0 0.002 0.004 0.006 0.008 0.010
1
2
3
4
5
6
Time (sec)
Ve
loc
ity
(m
/se
c)
1.5kg TNT explosive
RHA
RHA couple with sandwich composite
0 0.002 0.004 0.006 0.008 0.010
1
2
3
4
5
6
7
Time (sec)
Ve
loc
ity
(m
/se
c)
2kg TNT explosive
RHA
RHA couple with sandwich composite
(c) (d)
Figure 3: Mid-point velocity on the panel against time with standoff distance 0.5m:(a) 0.5kg TNT(b)1kg TNT(c)1.5kg TNT(d)2kg TNT.
Since the changes of magnitude of the velocity at cylinder solid with addition of sandwich composite are lower than the RHA stand alone, the shock attenuation will increase as the blast wave passing through the medium. This can be due that the simulated impulse arising from the relatively short duration (from the high pressure shock front impact) and the shock transmission through the honeycomb materials requires longer duration but at a lower magnitude force compared to stand alone RHA panel. This offers potential for controlled energy absorption and a reduced force transfer compared to stand-alone RHA panels. Such scenario are also reported by Hanssen et al. (2002).
Table 6 shows the shock attenuation of 0.5, 1.0, 1.5 and 2kg of TNT explosives with standoff distance 0.5m. By coupling the sandwich composite with RHA steel, the compute results showed that it significantly increases the shock attenuation capability of the structure. This may be due to honeycomb core possess void or air gap in its core and retard the shock wave propagation in the coupled structure.
Table 6: Shock attenuation of blast wave with 0.5m standoff.
TNT (kg)
Acceleration (m/sec) Shock (g) % Reduction RHA RHA coupled with
Sandwich compositeRHA RHA coupled with
Sandwich composite 0.5 2288.5 1187.5 233 121 48.1 1.0 3852.8 1491.1 393 152 61.3 1.5 4824.3 1626.0 492 166 66.3 2.0 5417.5 2147.8 552 219 60.3

127
4. CONCLUSION
Blast loading on monolithic materials alone (RHA steel) and with additional sandwich composite as flooring component was analyzed on its shock attenuation, acceleration and dynamic displacement values. The shock attenuation by coupled RHA-sandwich composite structure was found to be higher than the stand-alone RHA material (RHA). The coupled RHA-sandwich structure concept showed good potential in improving shock response in military vehicle when subjected to landmine or improvised explosive device (IED) attacks. ACKNOWLEDGEMENT The authors wish to acknowledge the research grant provided by Long Term Research Grant Scheme (LRGS/B-U/2013/UPNM/DEFENCE&SECURITY-P3) from the Malaysian Ministry of Education that lead to realization of this work. REFERENCES Baker, W.E., Togami, T.C. & Weydert, J.C. (1998) Static and dynamic properties of high-density metal
honeycombs, Int. J. Impact Eng., 21: 149-163. Fleck, N.A. & Deshpande, V.S. (2004) The resistance of clamped sandwich beams to shock loading. J.
Appl. Mech., 71: 386-401. Gama, B.A., Chiravuri, V.S. & Gillespie Jr. J.W. (2010) Modeling blast damage of composite structures.
In Proc. 11th Int. LS-DYNA Users Conf. Gardner, N., Wang, E., Kumar, P. & Shukla, A. (2012) Blast mitigation in a sandwich composite using
graded core and polyurea interlayer. Exp. Mech., 52: 119-133. Goldsmith, W. & Sackman, J.L. (1992) An experimental study of energy absorption in impact on
sandwich plates. Int. J. Impact Eng., 12: 241-262. Guruprasad, S. & Mukherjee, A. (2000) Layered sacrificial claddings under blast loading Part I-analytical
studies, Int. J. Impact Eng.,24: 957-973. Guruprasad, S. & Mukherjee, A. (2000) Layered sacrificial claddings under blast loading Part II-
experimental studies, Int. J. Impact Eng., 24: 975-984. Hanssen, A.G., Enstock, L. & Langseth M. (2002). Close-range blast loading of aluminum foam panels.
Int. J. Impact Eng., 27: 593-618. Houlston, R., Slater, J.E. & Pegg, N. (1985) On analysis of structural response of ship panels subjected to
air blast loading, Comput. Struct., 21: 273-289. Mamalis, A.G., Manolakos, D.E., Ioannidis, M.B., Papapostolou, D.P., Kostazos, P.K. & Konstantinidis,
D.G., (2002) On the compression of hybrid sandwich composite panels reinforced with internal tube inserts: experimental. Comp. Struct., 56: 191-199.
NATO Technical Report (2007). Test Methodology for Protection of Vehicle Occupant against Anti-Vehicular Landmine Effects. No. TR-HFM-090.
Neuberger, A., Peles, S. &Rittel. D. (2007) Scaling the response of circular plates subjected to large and close-range spherical explosions. Part I: Air-blast loading. Int. J. Impact Eng., 34: 859-873.
Neuberger, A., Peles, S. & Rittel D., (2009) Springback of circular clamped armor steel plates subjected to spherical air-blast loading, Int. J. Impact Eng., 36: 53-60.
Oxelosund, S.S.A.B. (2001). Armox Protection Plate. AM Int. Specification. Paik, J.K., Thayamballi, A.K. & Kim, G.S. (1999) The strength characteristics of aluminum honeycomb
sandwich panels, Thin-Walled Struct., 35: 205-231. Qiu, X., Deshpande, V.S. & Fleck, N.A. (2003) Finite element analysis of the dynamic response of
clamped sandwich beams subject to shock loading. Eur. J. Mech. A-Solid.., 22: 801-814.

128
Rao, K.K., Rao, K.J., Sarwade, A.G. & Varma, B.M. (2012).Bending Behavior of Aluminum Honey Comb Sandwich Panels. Int. J. Eng. Adv. Tech., 1: 268-272.
Rathbun, H.J., Radford, D.D., Xue, Z., He, M.Y., Yang, J., Deshpande, V. & Evans, A.G. (2006) Performance of metallic honeycomb-core sandwich beams under shock loading. Int. J. Solid. Struct.,43: 1746-1763.
Šlais, M., Dohnal I. & Forejt, M. (2012) Determination of Johnson-Cook equation parameters. Acta Metall. Slovaca, 18: 125-132.
Tabatabaei, Z.S. & Volz, J.S. (2012). A Comparison between three different blast methods in LS-DYNA®: LBE, MM-ALE, Coupling of LBE and MM-ALE. In Proc. 12th Int. LS-DYNA Users Conf., Dearborn, MI, USA, pp. 3-5.
Zhu F., & Lu G., (2007) A review of blast and impact of metallic and sandwich structures. Electr. J. Struct. Eng., 7: 92–101.

129
DEVELOPMENT OF CdTe THIN FILM SOLAR CELLS FOR MILITARY APPLICATIONS
Nor Azlian Abdul-Manaf1,2,* & Imyhamy Dharmadasa2
1Physics Department, Centre for Defence Foundation Studies, National Defence University of
Malaysia (UPNM), Malaysia 2Materials and Engineering Research Institute, Faculty of Arts, Computing, Engineering and Sciences,
Sheffield Hallam University, United Kingdom
*Email: [email protected]
ABSTRACT
This experiment reports the study on CdS/CdTe thin film solar cells for military application. In this work, CdS/CdTe thin film solar cell has been heat-treated with various device structures and chemical treatments in order to activate the properties of CdTe for optimum solar cell device performance. These treatments are such as CdCl2 treatment, CdCl2+CdF2 treatment and CdCl2+CdF2+GaCl2 treatment. These samples were then characterised using XRD, UV-Vis spectroscopy and DC measurements for their structural, optical and electrical properties. XRD characterisations show the presence of fluoride in ppm in the treatment demonstrated a rearrangement in the orientation of the crystallite and increased the (220) and (311) peaks to form a polycrystalline structure. PEC measurements demonstrated that all of CdTe films become p-type after being treated with CdCl2 and CdCl2+CdF2. Contrary, CdTe treated with CdCl2+CdF2+GaCl3 changes the p-CdTe at Vg≥706 mV into n-type due to the effect of Ga which dissolved the Te precipitations to the surface.The optimum condition was obtained when the samples annealed at 450oC in the presence of CdCl2+CdF2. Further study demonstrates that the best solar cell efficiency is obtained when using CdTe thin films treated with CdCl2+CdF2. Keywords: CdTe thin film; solar cells; CdCl2; chemical treatment. 1. INTRODUCTION The military demand of energy has turned out to be crucial as the growth of technological inventions in electronic utensils and appliances for military and defence. Today, world energy consumption is highly dependent on fossil fuel-based sources, such as petroleum, natural gas and coal. They also provide 84% of the primary energy used worldwide (Ahmed, 1994). In spite of this, these sources have presented several drawbacks to the environment, human health and society in general. Therefore, the military has been searching for alternative renewable energy to ensure long-term security of energy supplies. Possible alternative renewable kinds of energy include hydropower, wind, biofuel, geothermal, wave and solar (Dincer, 2000). Among all, solar energy is the most diversified form of renewable energy. It is a long-lasting source of energy, which can be used almost anywhere, even where there is no national grid such as at remote site areas or in space. It also could simplify military deployments since fuel tankers would no longer have to reach remote or volatile areas, and missions could run longer without having to return to base to refuel. Solar cell was first invented by a French physicist, Edmond Becquerel in 1839 while experimenting with a solid electrode in an electrolyte solution. It can be categorised into three generations, based on the order of their prominence. Among the different photovoltaic device structures under development, the cadmium sulphide/cadmium telluride (CdS/CdTe) thin film solar cell has attracted considerable attention. CdS/CdTe thin film solar cell is a second generation solar cells. They are made from layers of semiconductor materials only a few micrometres thick, therefore it has a lower price since it uses

130
less material and lower cost manufacturing processes. The CdS/CdTe solar cell device was first reported in 1963 by Cusano (Cusano, 1963). It was two-layers solar cell, where the p-type material was copper telluride (Cu2Te) and the n-type material was cadmium telluride (CdTe). Cusano reported that this solar cell was a p-n hetero-junction device with efficiency of 6.0%. Typically, CdS/CdTe solar cells have a superstrate structure where the light incident passes through the cadmium sulphide (CdS) layer. Therefore, it needs a transparent substrate such as glass. The glass substrate was deposited with a transparent conducting oxide (TCO) layer to serve as a front contact. The work on CdS/CdTe thin film solar cell started in the 1970s, but progress in research and development gained real impetus in the 1980s with the development of various techniques and efficiencies exceeding 10% for CdTe/CdS hetro-junction solar cells (Mitchell, 1977; Basol, 1988; Chu, 1988). The work from different groups in the 1990s pushed the efficiency to ~15-16% (Mitchell, 1977). The commercialisation of the CdTe photovoltaic technology began in the late 1990s and CdTe photovoltaic modules were available in the market with efficiency at about 10% and the output power ranging from 45-55 W at the size scale of 60×120 cm2. Over a period of 20 years, the efficiency of CdS/CdTe was not increasing mainly due to the lack of understanding of the material issues and the physics behind the device. There are now two different structures, a simple p-n junction assessed from early 1980s and a combination of n-n heterojunction with a large Schottky barrier at the back contact (Chaure, 2003; Dharmadasa, 2015). It is interesting to observe the efficiency increase from ~16% to 21.5% as reported by the First Solar company during the past few years (2011-2015). Although the reason for this rapid increase is not available to the photovoltaic (PV) community, this must be related to improve understanding of material issues and device architectures. This paper presents the development of CdS/CdTe thin film solar cell for military application. The device has been fabricated with the structure of glass/FTO/CdS/CdTe/back contact. The study of two materials involving CdS and CdTe layers is reported here with the route to achieve highest possible efficiency and the best performance. 2. METHODOLOGY Substrate preparation is a typical procedure for any device fabrication. The preparation processes include substrate selecting, substrate cutting and cleaning. The glass/FTO substrates were cleaned thoroughly using acetone, isopropanol and methanol in ultrasonic bath before the electrodeposition of CdS thin films. All of the thin films in this work have been produced using the electrochemical deposition technique. About 200 nm of CdS films were electrodeposited on the substrate. The thickness of the CdS film should be appropriate in order to cover the rough surface of FTO uniformly. The thickness should not be too thin due to the the reduction of the thickness after being annealed. At the same time, the thick of CdS layer can caused high series resistance and low short current density in device performance. The CdS layers were heat-treated at 400oC with cadmium chloride (CdCl2) treatment. The treated CdS layer required basic etching to clean the unwanted substances or chemical residues left on the surface of the CdS layer. A three-electrode system with high-purity graphite rod as anode, saturated calomel electrode (SCE) as reference electrode and FTO coated glass substrate as working electrode were used for this study. The deposition temperature of 65±2oC was used to avoid detrimental effects on the SCE reference electrode due to its 70oC upper temperature limit. About 1500 nm of CdTe layers were deposited as an absorber layer. These layers were then annealed at 450oC with several chemical treatments such as saturated CdCl2 solution in deionised water, saturated CdCl2+cadmium fluoride (CdF2) solution in deionised water and saturated CdCl2+CdF2+gallium chloride (GaCl3) in deionised water. The treatments were done by dipping the samples in the prepared chemical and allowing them to dry before the annealing process. The treated glass/FTO/CdS/CdTe samples required both acidic and basic etchant to polish the top surface of CdTe layer. These samples were then rinsed with deionized

131
water and dried under a stream of nitrogen gas. To complete the devices fabrication, the device required the metallization of ~100 nm of gold (Au) thickness as a back electric contact. The glass/FTO/CdS/CdTe samples were characterised via X-ray diffraction (XRD), Raman spectroscopy, ultraviolet-visible (UV-Vis) spectroscopy, photo-electro-chemical (PEC) cell measurement, direct current (DC) conductivity measurement, capacitance-voltage (C-V) measurement, scanning electron microscope (SEM) and atomic force microscope (AFM) for their structural, optical, thickness, electrical and morphological properties. Solar cell device characterisation in this work is carried out by two different techniques, which are current-voltage (I-V) and C-V measurements. 3. RESULTS AND DISCUSSIONS 3.1 Structural Characterization Figure 1 shows the XRD spectra of CdTe thin films for as-deposited, annealed CdTe without any chemical treatment and annealed with CdCl2, CdCl2+CdF2 and CdCl2+CdF2+GaCl3 treatments. The results show the prominent peak of (111) together with other two crystallite peaks of (220) and (311) in the cubic crystal plane in all five conditions. In addition, a peak at 22.54o is attributed to the Cadmium Tellurate IV (CdxTeOy) peak. However, this peak did not show any clear change after annealing with various chemical treatments. Table 1 shows the intensities of (111), (220) and (311) peaks and the calculated intensity ratios of (220) and (311) peaks referring to (111) peak. It is observed that the CdTe annealed with chemical treatment improved (111) preferred orientation peak greater than those annealed without any chemical treatment. Similarly, (220) and (311) peaks also improved when annealed with these three chemical treatments compared to annealing without chemical treatment. CdTe film annealed with CdCl2 treatment shows the highest (111) peak while CdTe film annealed with CdCl2+CdF2 treatment shows the highest (220) and (311) peaks. This indicates the change in the preferred orientation of grains in the sample after treatment. Chemical treatment with the presence of CdCl2 is well known to perform better structurally due to recrystallization (Garadkar, 2010; Dharmadasa, 2014). The presence of fluorine in ppm in the treatment demonstrated a rearrangement in the orientation of the crystallite due to the reduction of (111) peak and increase in the other two peaks of (220) and (311). Nicola and Echendu also observed a similar trend when treating CdTe films in the presence of fluorine (Armani, 2015; Echendu, 2015). Based on these peak intensities, it is suggested that treatment with CdCl2+CdF2 shows good polycrystalline properties.
Figure 1: XRD peaks of CdTe thin films for as-deposited, annealed without any chemical treatment and
annealed with CdCl2, CdCl2+CdF2 and CdCl2+CdF2+GaCl3 treatments at 420 °C for 20 min.

132
Table 1: Analysis of XRD peaks of CdTe for as-deposited, annealed in air and annealed with different chemical treatments at 420 oC for 20 min.
CdTe Sample annealed with
different treatments
Peak intensity % peak relative to 111 peak
(111) (220) (311) (111) (220) (311)
As-deposited 289 43 17 100 15 6
HT 407 44 27 100 11 7
CC 750 229 132 100 31 18
CF 694 321 174 100 46 25
GC 663 215 98 100 32 15
The Raman spectroscopy is an alternative and convenient method to identify material phases and determine the degree of crystallinity of the thin films. In this technique, vibrational, rotational and other low-frequency modes in materials are observed based on inelastic scattering of monochromatic radiation. The excitation source used in this work was a 514 nm argon ion laser. The spectra of Raman spectroscopy for as-deposited and CdCl2 treated CdTe are shown in Figure 2. All the samples show the prominent peak of transverse optical (TO) of CdTe together with the elemental tellurium (Te) at wave numbers of ~142 cm-1. This peak shifted from 139.2 to 139.0 cm-1 after annealing without any chemical treatment. However, the Raman shift increased to 140.4, 141.8 and 140.8 cm-1 after annealing with CdCl2, CdCl2+CdF2 and CdCl2+CdF2+GaCl3, respectively. Similarly, this trend was also observed for longitudinal optical (LO) CdTe at ~164 cm-1. The trend of these blue shifts is due to the energy gained by the photon by increasing the vibration mode and the lattice strain. The increase in the Raman shift is usually observed together with the increment in the FWHM peak. Also noticed is that the FWHM of these peaks increased after annealing with chemical treatments. There are two possible effects influencing the full-width-half-maximum (FWHM) of the Raman peak which are size effect and the lattice dislocation effect (Fernández, 2003). In this case, the size effect is more pronounced since we observed the enlargement in a crystallite size after annealing with chemical treatments as shown in Figure 2. This trend is similar to the previous XRD results. The summary of the Raman analysis is presented in Table 2.
Figure 2 : Typical Raman spectra of CdTe thin films for as-deposited, annealed without any chemical
treatment and annealed in a presence of CdCl2, CdCl2+CdF2 and CdCl2+CdF2+GaCl3.

133
Table 2: Summary of Raman peaks observed in Figure 2 for as-deposited, annealed CdTe films without any chemical treatment and annealed with CdCl2, CdCl2+CdF2 and CdCl2+CdF2+GaCl3.
Peak 1: Elemental Te
Peak 2: Transverse Optical CdTe +
Elemental Te
Peak 3: Longitudinal Optical CdTe
Samples
Peak Position (cm-1)
Intensity (a.u)
FWHM (cm-1)
Peak Position (cm-1)
Intensity(a.u)
FWHM(cm-1)
Peak Position (cm-1)
Intensity (a.u)
FWHM(cm-1)
AD 121.5 2759 5.29 139.2 5538 7.0 161.9 2212 3.52 HT 121.4 2055 5.36 139.0 5138 7.2 163.7 2766 5.32 CC 122.5 930 5.56 140.4 3306 8.4 163.2 1503 5.32 CF 123.2 1410 5.39 141.8 2359 8.8 162.9 1845 3.52 GC 123.0 604 6.73 140.8 1192 8.8 - - -
3.2 Optical Characterisation Figure 3 and Table 3 show the graph of square of absorbance versus photon energy and the energy bandgap values of CdTe films for as-deposited and annealed without and with different chemical treatments. These results demonstrated the increase in the energy gap from 1.43 eV in the as-deposited CdTe film to ~1.46 eV after annealing without any chemical treatment in air. Annealing with the presence of CdCl2+CdF2 treatment increased the energy gap up to ~1.47 eV. However, CdTe annealed with CdCl2 and CdCl2+CdF2+GaCl3 shows a lower increment in energy bandgaps. Also, it is observed that both of the samples have higher absorbance spectra compared to others. The absorption edges also are improved after being annealed with chemical treatments. This could be due to the removal of the defects during these chemical treatments improving the material properties.
Figure 3: Optical absorption of as-deposited, annealed without any chemical treatment and annealed with
CdCl2, CdCl2+CdF2 and CdCl2+CdF2+GaCl3 CdTe samples.

134
Table 3: The energy bandgap of CdTe layers for as deposited, annealed without any chemical treatment and annealed with CdCl2, CdCl2+CdF2 and CdCl2+CdF2+GaCl3.
Samples Energy bandgap, Eg
(eV) AD 1.43 HT 1.46 CC 1.45 CF 1.47 GC 1.44
3.3 Electrical Characterisation Figure 4 shows the PEC measurements of CdTe as a function of growth voltage for as-deposited and annealed without and with three different chemical treatments. It is observed that the annealing without any chemical treatment bring the samples towards p-type conductivity. Samples grown at Vg≤694 mV are still n-type but the PEC signals have reduced and showing the movement towards p-type. It was also observed that when CdTe films are annealed in the presence of CdCl2 and CdCl2+CdF2, all samples become p-type in electrical conductivity. The CdCl2 treatment could change the doping concentration when it makes complexes with currently unknown native defects in CdTe and produce p-type CdTe after CdCl2 treatment. Due to the high diffusivity, the presence of fluoride enhanced the treatment and made it become more p-type. This experiment provides a clue for CdTe becoming p-type in electrical conductivity when high concentrations of chlorine (Cl) or both Cl and fluorine (F) are present in the materials. CdTe thin films annealed with CdCl2+CdF2+GaCl3 treatment have changed the as-deposited p-CdTe at Vg≥706 mV into n-type. This could be due to the effect of the Ga melt dissolving the Te precipitations which migrate to the top of the surface films during annealing in the presence of gallium (Ga). Fernández (2003) also observed that Ga-inclusion in CdTe dissolved the Te precipitates in CdTe and doped CdTe with n-type. The effect of Ga seems to be two fold; making the CdTe material more stoichiometric by removing excess Te, and doping CdTe layer to make it n-type in electrical conduction. Based on these results, samples of AD, HT, CC, CF and GC grown at Vg=698 mV were used with DC conductivity measurements and C-V measurements. These samples were cut in to two pieces and half of each sample was used for the DC conductivity measurement while another half was used for the C-V measurement. In the DC conductivity measurement, a 2 mm diameter of circular ohmic contacts were created on the p-type CdTe by sputtering Au layers while the Al layers were sputtered onto n-type CdTe. The resistance of the CdTe layers was estimated through I-V measurements at several points of contact. The average resistance of each sample was measured and the electrical conductivity was calculated and shown in Table 4. Similar to the previous CdTe set, the as-deposited CdTe film in this batch has conductivity in the order of 2.63×10⁻⁵ Ω-1cm-1. CdTe layers annealed without any chemical treatment show the lowest conductivity value of 5.87×10⁻⁶ Ω-1cm-1 compared to those samples annealed with CdCl2, CdCl2+CdF2, and CdCl2+CdF2+GaCl3 treatments. This result is quite expected since CdTe films annealed with chemical treatments always have better electrical properties due to the removal of defects, enlargement of grains size and improvement in material properties. Annealing without any chemical treatment is not enough to remove the defects and improve the movement of the free electrons to the conduction band. Among all three chemical treatments, CdTe annealed with CdCl2+CdF2 shows better conductivity compared to other chemical treatments.

135
Figure 4: PEC signal of CdTe thin films for as-deposited (AD), annealed without any chemical treatment
(HT) and annealed with the presence of CdCl2 (CC), CdCl2+CdF2 (CF) and CdCl2+CdF2+GaCl3 (CG).
Table 4: The conductivity type (from PEC measurements) and electrical conductivity value (from DC conductivity measurements) of CdTe thin films as-deposited and annealed without any chemical
treatment, annealed with CdCl2, CdCl2+CdF2, and CdCl2+CdF2+GaCl3 treatments.
Sample Conductivity type/ contact
Average resistance,
R (Ω)
Thickness (μm)
Resistivity, ρ x 104
(Ωcm)
Conductivity, σ x 10-5
(Ω-1cm-1)
AD n-type / Al 181.8 1.5 3.81 2.63
HT p-type / Au 651.0 1.2 17.04 0.59
CC p-type / Au 29.7 1.2 0.77 12.91
CF p-type / Au 157.1 1.2 4.11 2.43
GC p-type / Au 47.5 1.2 1.24 8.05 As for C-V measurement, Schottky contacts with 2mm diameter circles were created by evaporating the Al layer to the p-type CdTe. The p-type CdTe in this particular set is that annealed without any chemical treatment and annealed with CdCl2, CdCl2+CdF2, and CdCl2+CdF2+GaCl3 treatments. The as-deposited sample with the n-type conductivity was evaporated with Au to form the Schottky contact. The results of the C-V measurements are summarised in Table 5. It shows that the doping concentration of CdTe is reduced after annealing, both without any chemical treatments and with all the chemical treatments. CdTe annealed with CdCl2+CdF2+GaCl3 shows the lowest doping concentration compared to other samples. Ideally, a healthy depletion region can be achieved with the doping concentration lower than ~1.0×1014 cm-3 (Dharmadasa, 2014). From these experiment results, it is observed that all the layers are good since the stoichiometric layer of CdTe grown at Vg=698 mV has a doping density of ~1013 cm-3. CdTe annealed in the presence of CdCl2+CdF2+GaCl3 is suggested for solar cell fabrication since it shows the lowest carrier concentration (n=7.86×1011 cm-3) and is expected to produce wider depleted device of PV active. The C-V and 1/C2 versus V plots observed for CdTe treated with CdCl2+CdF2+GaCl3 are shown in Figure 5 below.
-130
-80
-30
20
70
120
670 680 690 700 710 720
PE
C s
ign
al (
mV
)
Potential growth (mV)
AD
HT
CC
CF
GC

136
Table 5: The summary of material parameters calculated from the C-V measurements and the mobility of electrons of as-deposited CdTe films and the mobility of holes of CdTe films annealed without and with
CdCl2, CdCl2+CdF2, and CdCl2+CdF2+GaCl3 treatments.
Sample Schottky contact
Sample
Slope of
graph
versus V
Carrier concentration,
n (cm-3)
Mobility, μ
(cm2V-1s-1)
AD n-CdTe / Au AD 2.28x10²⁰ 5.70 x 10¹³ 2.88 HT p-CdTe / Al HT 4.75 x10²⁰ 2.73 x 10¹⁴ 0.13 CC p-CdTe / Al CC 1.71 x10²⁰ 7.60 x 10¹³ 10.57 CF p-CdTe / Al CF 4.93 x10²⁰ 2.63 x 10¹³ 5.77 GC p-CdTe / Al GC 1.66 x10²² 7.86 x 10¹¹ 638.87
Figure 5: The graphs of (a) C-V and (b) 1/C2 versus V for CdTe film treated with CdCl2+CdF2 +GaCl3 treatment.
Using the electrical conductivity and doping density values calculated from the DC conductivity measurements and the CV measurements respectively, the mobility of these layers was calculated using equation 5.2 and presented in Table 5.15. These values represent the mobility of charge carriers normal to the FTO substrates ( rather than mobility values reported in the literature by measuring Hall Effect ∥ , which is the mobility of charge carriers parallel to the FTO substrate. The illustration on mobility values observed in this work ( can be represent in Figure 6.
2.40E-11
2.60E-11
2.80E-11
3.00E-11
3.20E-11
3.40E-11
-1 -0.5 0 0.5 1
Cap
acit
ance
(F
)
Voltage (V)
8.00E+20
1.00E+21
1.20E+21
1.40E+21
1.60E+21
1.80E+21
-1 -0.5 0 0.5 1
1/C
2(F
-2)
Voltage (V)
(a) (b)

137
Figure 6: The schematic diagram of (a) as-deposited CdTe material with agglomeration consisting of ~50 nm size crystallites and (b) heat treated materials with larger grain size of few microns across the layer.
As-deposited CdTe consists of large agglomerations with smaller crystallites (~50 nm). Therefore in n-type as-deposited CdTe ,the electrons suffer grain boundary scattering when traveling in both direction, parallel to FTO and normal to the substrate. Therefore, the measured electron mobility is fairly low (2.88 cm2V-1s-1). When heat treated with chemical treatments, these agglomerations and smaller crystallites form larger grains with size in few microns across the layer as shown in Figure 6. From PEC measurements in Figure 4, all the annealed CdTe layers become p-type in electrical conduction and therefore the estimated mobilities are holes mobilities. The highest mobility observed is 638.87 cm2V-1s-1 for CdTe annealed in the presence of CdCl2+CdF2+GaCl3,. In this case, the holes move along the fully crystalline grains from the FTO to Au contacts and there are no grain boundaries to hinder the charge carrier movements. Because of this reason, the experimentally observed hole mobility is and the electron mobility could be one or two orders of magnitude higher. This shows the benefits of having micro-size columnar type grains in solar cell. In addition to this high mobility, the larger grains material introduced active PV junction along the grain boundaries due to melting and diffusion of doped into CdTe grains. The combination of these vertical junctions at grain-boundaries together with the main rectifying junction of the CdS/CdTe solar cell leads to transfer of electrons and holes in different paths and minimise the recombination (Basol, 1988). This will provide the future research direction for producing high efficiency solar cells.
3.4 Morphology Characterisation The effect of chemical treatment on the morphology of CdTe thin films was investigated through SEM and AFM. Figure 7 shows the SEM images of CdTe films for (a) as-deposited, (b) annealed without any chemical treatment and annealed with the presence of (c) CdCl2, (d) CdCl2+CdF2 and (e) CdCl2+CdF2+GaCl3 treatments at 420°C for 20 min. It is observed that the grain sizes increased tremendously after being annealed with all three types of chemical treatments. It is well known that the presence of CdCl2 in the heat treatment has enhanced the coalescence of smaller nano-crystallites into larger crystals to improve material layers. The presence of fluoride in the chemical treatment shows a higher improvement in the grain growth than chemical treatment with only CdCl2 since fluoride atoms are easier to diffuse into the grain boundaries due to their smaller atomic radii than chloride atoms (Vainshtein, 1995). Mazzamuto also reported an advantage of annealing CdTe films in the presence of CHF2Cl2 in CSS-CdTe (Mazzamuto , 2008). For these reasons the results show that CdTe annealed with CdCl2+CdF2 demonstrated the largest grain size compared to other chemical treatments.
FTO FTO
CdTe
Metal back contact Metal back contact Crystallite
Agglomeration
∥
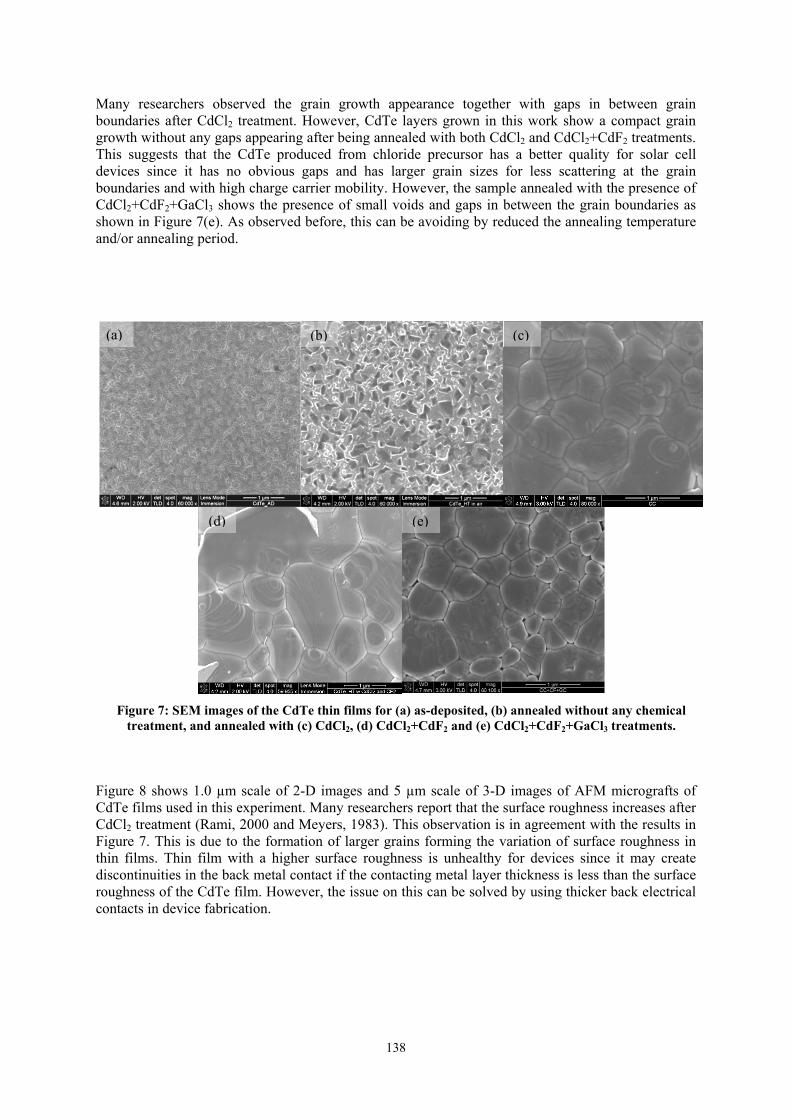
138
Many researchers observed the grain growth appearance together with gaps in between grain boundaries after CdCl2 treatment. However, CdTe layers grown in this work show a compact grain growth without any gaps appearing after being annealed with both CdCl2 and CdCl2+CdF2 treatments. This suggests that the CdTe produced from chloride precursor has a better quality for solar cell devices since it has no obvious gaps and has larger grain sizes for less scattering at the grain boundaries and with high charge carrier mobility. However, the sample annealed with the presence of CdCl2+CdF2+GaCl3 shows the presence of small voids and gaps in between the grain boundaries as shown in Figure 7(e). As observed before, this can be avoiding by reduced the annealing temperature and/or annealing period.
Figure 7: SEM images of the CdTe thin films for (a) as-deposited, (b) annealed without any chemical treatment, and annealed with (c) CdCl2, (d) CdCl2+CdF2 and (e) CdCl2+CdF2+GaCl3 treatments.
Figure 8 shows 1.0 µm scale of 2-D images and 5 µm scale of 3-D images of AFM micrografts of CdTe films used in this experiment. Many researchers report that the surface roughness increases after CdCl2 treatment (Rami, 2000 and Meyers, 1983). This observation is in agreement with the results in Figure 7. This is due to the formation of larger grains forming the variation of surface roughness in thin films. Thin film with a higher surface roughness is unhealthy for devices since it may create discontinuities in the back metal contact if the contacting metal layer thickness is less than the surface roughness of the CdTe film. However, the issue on this can be solved by using thicker back electrical contacts in device fabrication.
(e)(d)
(a) (b) (c)

139
Figure 8: The AFM images of CdTe films for (a) as-deposited, (b) annealed without any
chemical treatment, and annealed with (c) CdCl2, (d) CdCl2+CdF2 and (e) CdCl2+CdF2+GaCl3 treatments at 420 °C for 20 min.
4. CONCLUSION The effect of the chemical treatments of CdTe thin films has been studied with three different chemical treatments which are CdCl2, CdCl2+CdF2 and CdCl2+CdF2+GaCl3. The samples were treated with these chemicals and annealed at 420oC for 20 min. The as-deposited and annealed CdTe without any chemical treatment at 420oC have also been prepared for reference samples. The XRD characterisation demonstrated that the presence of fluoride in ppm in the treatment demonstrated a rearrangement in the orientation of the crystallite and increased the (220) and (311) peaks to form a polycrystalline structure. The FWHM of TO-CdTe and LO-CdTe in the Raman peaks are slightly increased after being annealed with chemical treatments which is suggested due to the size effect. The optical absorption shows a high absorption for the materials treated with CdCl2 and CdCl2+CdF2+GaCl3. PEC measurements demonstrated that no matter the electrical conductivity of the as-deposited CdTe, all of them become p-type after being treated with CdCl2 and CdCl2+CdF2. Contrary, CdTe treated with CdCl2+CdF2+GaCl3 changes the as-deposited p-CdTe at Vg≥706 mV into n-type due to the effect of Ga which dissolved the Te precipitations to the surface. The DC conductivity and C-V measurements demonstrated the remarkable value of holes’ mobility on
(a) (b)
(c) (d) (e)

140
samples treated with CdCl2+CdF2+GaCl3. This suggested that this treatment may provide high device parameters if applied in solar cell fabrication. SEM and AFM measurements demonstrated the tremendous grain growth if these samples were annealed with chemical treatments but treatment under CdCl2+CdF2+GaCl3 shows small voids and gaps in between grain boundaries. This may need re-adjustment of the annealing temperature and duration of the heat treatment in CdCl2+CdF2+GaCl3 condition. This work provides more understanding of the importance of the chemical treatment especially the presence of CdCl2 for better material properties for solar cells. Annealing with chemical treatment shows better properties. During the annealing, the halogen atoms, such as chloride and fluoride diffuse at the grain boundaries and changed the doping concentration at the skin of grain. A small crystallite merged into a larger grain by ‘Ostwald ripening’ where small grains coalesce together to form larger grains. The presence of CdCl2 is well known to be able to enhance recrystallization and grain growth, change the electrical conductivity type and doping concentration, reduce the defect and remove the Te precipitates (Vainshtein, 1995; Mazzamuto, 2008). Many researchers also found out that CdCl2 treatment can work well if it is used mixed with a gas containing fluorine (Meyers, 1983; Rami, 2000). Based on the peak intensities, it is suggested that treatment with CdCl2+CdF2 appears to produce better polycrystalline properties than those chemically treated with only CdCl2 or in the presence of GaCl3. ACKNOWLEDGEMENT The authors would like to thank Paul Bingham, H. I. Salim, M. Madugu, O. Olusola and A. Ojo from Materials Engineering Research Institute, Sheffield Hallam University for their valuable contributions. REFERENCES Ahmed, K. (1994). Renewable Energy Technologies: A Review of Status and Costs of Selected
Technologies. World Bank Technical Paper Number 240, World Bank, Washington, DC. Dincer, I. (2000). Renewable energy and sustainable development: a crucial review. Renew. Sust.
Energ. Rev., 4: 157-175. Cusano, D.A. (1963). CdTe solar cells and photovoltaic heterojunctions in II VI compounds. Solid
State Electron., 6: 217-232. Basol, B.M. (1988). Electrodeposited CdTe and HgCdTe solar cells. Sol. Cells, 23: 69–88. Chu, T.L. (1988). Thin film cadmium telluride solar cells by two chemical vapour deposition
techniques, Sol. Cells, 23: 31-48. Mitchell, L., Fahrenbruch, A. & Bube, R.H. (1977). Photovoltaic determination of optical‐absorption
coefficient in CdTe. J. Appl. Phys., 48: 829-830. Dharmadasa, I.M., Ojo, A., Salim, H.I. & Dharmadasa, R. (2015). Next generation solar cells based
on graded bandgap device structures utilising rod-type nano-materials. Energies, 8: 5440-5458. Chaure, N.B., Samantilleke, A.P. & Dharmadasa, I.M. (2003). The effects of inclusion of iodine in
CdTe thin films on material properties and solar cell performance. Sol. Energ. Mat. Sol.. C., 77: 303-317.
Dharmadasa, I.M., Bingham, P.A., Echendu, O.K., Salim, H.I., Druffel, T., Dharmadasa, R., Sumanasekera, G.U., Dharmasena, R.R., Dergacheva, M.B., Mit, K.A., Bowen, L., Walls, M. & Abbas, A. (2014). Fabrication of CdS/CdTe-based thin film solar cells using an electrochemical technique. Coatings, 4: 380-415.
Garadkar, S.J., Pawar, V., Hankare, P.P. & Patil, A.A. (2010). Effect of annealing on chemically deposited polycrystalline CdTe thin films. J. Alloy Compd., 491: 77–80.
Armani, N., Mazzamuto, S. & Vaillant-Roca, L. (2011). Influence of Post-Deposition Thermal Treatment on the Opto-Electronic Properties of Materials for CdTe/CdS Solar Cells in Solar Cells-Thin Film Technology. InTech (Open access).

141
Echendu, O.K. & Dharmadasa, I.M. (2015). The effect on CdS/CdTe solar cell conversion efficiency of the presence of fluorine in the usual CdCl 2 treatment of CdTe. Mater. Chem. Phys., 157: 39-44.
Fernández, P. (2003). Defect structure and luminescence properties of CdTe based compounds. J. Optoelectron. Adv. M., 5: 369-388.
Dharmadasa, I.M. (2014). Review of the CdCl2 treatment used in CdS/CdTe thin film solar cell development and new evidence towards improved understanding. Coatings, 4: 282-307.
Basol, B.M. (1988). Electrodeposited CdTe and HgCdTe solar cells. Sol. Cells, 23: 69 - 88. Vainshtein, B.K., Fridkin, V. M. and Indenbom, V. L. (1995). Adv. Struct. Cryst. Springer
Publication, Berlin. Mazzamuto, S., Vaillant, L., Bosio, A., Romeo, N., Armani, N. & Salviati, G. (2008). A study of the
CdTe treatment with a Freon gas such as CHF2Cl. Thin Solid Films, 516: 7079 – 7083. Rami, M., Benamar, E., Fahoume, M., Chraibi, F & Ennaoui, A.M.J. (2000). Effect of heat treatment
with CdCl2 on the electrodeposited CdTe/CdS heterojunction. J. Phys.: Condens. Matter. 3: 66–70.
Meyers, T.H., Schetzina, J.S., Magee, T.J. & Ormond, R.D. (1983). Growth of low dislocation density CdTe films on hydroplaned CdTe substrates by molecular beam epitaxy. J. Vac. Sci. Technol., 1: 1598.

142
DEVELOPMENT OF CORTISOL IMMUNOSENSOR BASED REDUCED GRAPHENE OXIDE (rGO) FOR FUTURE APPLICATION IN MONITORING STRESS LEVELS
AMONG MILITARY PERSONNEL
Ainsah Omar, Jahwarhar Izuan Abd Rashid*, Azyani Athirah Abd Latif, Khairunnisa Abd Karim, Osman Che Bakar, Muhamad Abu Bakar & Wan Md Zin Wan Yunus
National Defense University of Malaysia (UPNM), Malaysia
*Email: [email protected]
ABSTRACT
A disposable screen-printed carbon electrode (SPCE) functionalized reduced graphene oxide (rGO) was successfully fabricated for electrochemical detection of stress biomarker cortisol. Firstly, graphene oxide (GO) suspension was drop-casted onto carbon electrode surface before being electrochemically reduced into rGO-modified SPCE. Secondly, the rGO-modified SPCE was treated with N-hydroxysuccinimide (NHS) and N-(3-dimethylaminopropyl)-N’-ethylcarbodiimide (EDC) solution to activate carboxylic group (COOH) on the rGO surface which then reacts with amines (NH3) group of cortisol specific monoclonal antibody (C-Mab) to form an amide bonding. Finally, the electrochemical response of C-Mab/rGO-modified electrode towards cortisol was recorded by cyclic voltammetry (CV) techniques using5 mM (Fe3[CN]6) as a redox probe. The significant change of current was observed with and without the presence of cortisol using our fabricated electrode, C-Mab/rGO-modified SPCE becomes the main principle in this cortisol electrochemical immunosensor. The incorporation of rGO onto SPCE surface exhibited an enhancement of electrocatalytic of electrochemical oxidation of Fe3[CN]6for the detection of cortisol. It was shown that the peaks current of Fe3[CN]6 was significantly reduced in the presence of cortisol onto the C-Mab/rGO-modified electrode surface. Several parameters were optimised for improving electrochemical detection of cortisol including rGO concentration, C-Mab concentration and immobilisation time of cortisol. Under optimal condition, our developed immunosensor was able to detect cortisol in a wide linear range of 0.001 µg/mL to 10 µg/mL which covers the human cortisol levels in normal and stressful environments. These findings would help in the development of biosensor to monitor the stress level among military personnel.
Keywords: Stress biomarker cortisol; immune-sensor; graphene oxide; electrochemical; screen-printed electrode.
1. INTRODUCTION
Military service is one of the most stressful occupations that requires high mental and physical endurance. Due to the nature of the job which involves strenuous physical training, operations, missions and combat, military personnel are exposed to stress. Chronic stress could lead to the development of various psychological disorders such as post-traumatic stress disorder (PTSD), anxiety and depression which in turn could affect their performance and readiness for military operations (McFarlene, 2010). In order to maintain high psychological and physical performances of military personnel, especially under highly stressful conditions, it is crucially important to monitor the stress levels particularly before they engage in high alertness-critical military operations. Currently the method of psychological stress assessments are routinely assessed through a battery of questionnaires and neurocognitive tests. These methods however

143
need trained medical personnel, are time consuming and stigmatise the subjects thus affecting their cooperation to reveal the symptoms. Cortisol, a ‘steroid hormone’ is released in large amounts in response to stress conditions (physical and psychological) , and is an established stress biomarker (Benfield et al., 2014). Thus, the measurement of cortisol level in the body fluids such as blood, saliva, urine and sweat has attracted increasing attention in monitoring the stress levels. Various laboratory techniques have been developed to measure cortisol levels such as chromatography, enzyme-linked immune-sorbent assay (ELISA), radioimmunoassay (RIA), quartz crystal microbalance (QCM) and surface plasma resonance (SPR) (Singh et al., 2014). However, these procedures are laboratory-based, requiring sophisticated instrumentations, complex sample processing and purification, require large sample volume, laborious, time-consuming and expensive (Sanghavi et al., 2016). The development of a non-lab based nanotechnology stress biosensor would be able to address these issues. This biosensor will also be useful in ensuring that only those who are psychologically stable and resilient will be recruited as military personnel. Hence, an inexpensive, portable and real time detection of cortisol at point-of-care (POC) is needed which is more convenient and practical in combat situation. An immunosensor based electrochemical technique has recently emerged as a promising technology for the development of POC detection of cortisol. This is attributed to the fact that the electrochemical technique can offer a low-cost instrumentation, portability, high sensivitiy and selectivity, rapid detection and ease of miniaturization which are well-suited in the application of POC device (Arya et al., 2010; Rashid et al., 2016).The main principle of electrochemical cortisol immunosensor is based on the change in the electrical properties of electrode surface with and without the adsorption of cortisol on the electrode surface that functionalized with immobilised cortisol antibodies. This electrical change is related to the amount of electro active redox species that undergo a redox reaction at the electrode surface that finally can be measured (Rashid et al., 2013). The critical step in the design of immunosensor is to provide an optimal loading of immobilised capture antibodies and favourable orientation on the electrode surface with a good electrochemical current response (Moreno-Guzmán et al., 2012). In order to enhance the electrochemical current signal and achieve high sensitivity in immunosensing, the immobilisation matrix for immunoreaction between capture antibodies and antigens/proteins should provide a larger surface area, high biocompatibility and enhanced electron transfer rate (Arya et al., 2012). The modification electrode with graphene materials have attracted much attention in the immunosensor application because of its superior properties including high surface area, excellent conductivity, high biocompatibility and low cost production (Chan et al., 2015; Puangjan and Chaiyasith, 2016). In addition, it has been known that graphene materials can improve the sensitivity by facilitating the electron transfer between electro active redox species and electrode surface in immunosensing application. However, the electrochemical immunosensor based graphene materials has not been fully explored for human stress cortisol detection. Hence, this study is conducted to examine the role of graphene oxide materials as an immobilisation matrix of capture antibodies-cortisol and current signal enhancer. Here, we fabricated a new label free electrochemical immunosensor based reduced graphene oxide (rGO) for the detection of human stress cortisol using screen - printed carbon electrode.
2. MATERIALS AND METHODS
2.1 Materials, Reagents and Apparatus
Graphene oxide (GO) suspension, Potassium hexacyanoferrate (II) trihydrate(K4Fe(CN)6 · 3H2O), Phosphate buffer solution, N-hydroxysuccinimide (NHS), N-(3-dimethylaminopropyl)-N’-ethylcarbodiimide (EDC) were purchased from Sigma-Aldrich (St. Louis, MO). All chemical reagents

144
were analytical grade. Cortisol monoclonal antibody (C-Mab) (XM210) was purchased from Abcam (USA). Hydrocortisone (Cortisol) was purchased from Tocris (Bristol, UK). Bovine serum albumins (BSA) was purchased from Sigma-Aldrich (St. Louis, MO). Electrochemical measurement was monitored using Autolab PGSTAT 204 (Metrohm, Switzerland). The screen - printed carbon electrode (SPCE) and its connector were purchased from DropSens, Spain. Surface of morphological studies of modified electrode was carried out using Field Emission Scanning Electron Microscope (FESEM) (SU-8000 Hitachi). 2.2 Fabrication of Reduced Graphene Oxide (rGO)-Modified SPCE Graphene oxide (GO) suspension (1.0 mg/mL) was drop-casted onto the surface of well-polished screen - printed carbon electrode (SPCE) and dried overnight at room temperature. The electrochemical reduction of GO films on SPCE was performed at 8 cycles of CV in 0.1 M KCl solution, pH 7.4 with the potential range of 0.2 V to 1.0 V at a scan rate of 50 mV/s. Then, the modified electrode was rinsed with distilled water, followed by open air drying at room temperature. The rGO-films obtained on the SPCE surface is denoted as rGO-SPCE. 2.3 Preparation of Immunosensor About 10 μL of 5 mM EDC/NHS solution (1:1 ratio, 1 mg/mL) was drop-casted onto rGO-SPCE surface for 1-hour incubation time at room temperature followed by a rinse with PBS, pH 7.4. The immobilisation of C-Mab onto rGO-SPCE surface was performed by drop casting 10 µL of cortisol antibody (0.1 mg/mL) in PBS solution overnight at temperature at 4 °C. It was then washed with PBS buffer to remove any unbound C-Mab and then denoted as C-Mab/rGO-modified SPCE. After that, C-Mab/rGO-modified SPCE surface was incubated with 10 μL of BSA (1mg/mL) in PBS for 30 minutes followed by washing the excess of BSA with PBS. The BSA/C-Mab/rGO-modified SPCE was soaked in PBS solution (pH 7.4) containing an appropriate cortisol concentration (10μg/mL) and incubated for 15 minutes at room temperature. The electrochemical measurement was carried out in 5 mM (Fe3[CN]6) containing 0.1 M KCl as a supporting electrolyte in the potential range from -0.4 to 0.6 V at the scan rate of 50 mV/s. All the experiments were repeated in triplicate. 3. RESULTS AND DISCUSSIONS 3.1 Design Strategy of Cortisol Immunosensor Based Reduced Graphene Oxide (rGO)
The fabrication process of cortisol immunosensor is shown in Figure 1. GO was first immobilised onto SPCE surface using drop casting method. To improve the electrochemical properties of GO-SPCE, the electrochemical reduction of GO was carried out to remove the oxide layer on GO films. The incorporation of rGO films onto SPCE surface as the strategy to improve the electrochemical current responses and enhance the capacities of immobilised cortisol monoclonal antibodies (C-Mab) on the electrode surface.

145
Figure 1: Scheme of the development of immunosensor based on rGO-modified SPCE for electrochemical detection of cortisol.
The rGO films have been previously reported containing unreduced carboxyl (COOH) group that can be covalently functionalized with amine groups of antibodies through an activation of carboxyl group (COO-
) using EDC–NHS solution (Sun et al., 2013). To minimise the nonspecific adsorption by other protein on the surface of C-Mab/rGO-modified SPCE, BSA protein was employed. The immunoreaction between C-Mab and cortisol on the rGO-SPCE surface was monitored using CV technique in (Fe3[CN]6) solution. 3.2 Surface Morphological of rGO-Modified SPCE The morphology of rGO-modified SPCE were characterised by FESEM image as shown in Figure 2 where GO sheets was successfully immobilised on the SPCE surface through a drop-casting method. It was shown that the GO films exhibited a flaked structure and crumpled on the surface of SPCE. These multidimensional structures of rGO films could enhance the active surface area of SPCE where high amount of C-Mab could be loaded and thus improving the cortisol immunosensing signal.
Figure 2: FESEM image of rGO-modified SPCE.

146
3.3 Electrochemical Characterisation of Immunosensor
Figure 3a shows cyclic voltammetry (CV) characterisation at different modified SPCE electrode using (Fe3[CN]6) solution as a redox probe. (Fe3[CN]6) solution has been employed as an excellent redox probe to characterise the electrochemical properties of modified electrode and also being used in immunosensing application (Benvidi et al., 2015). This is due to the fact that (Fe3[CN]6) ion demonstrate a good reversibility and fast electrochemical responses (Rashid et al., 2014). A well paired of defined redox peaks were observed at the potential of 0.116 V and 0.302 V using a bare SPCE (curve a). After the modification SPCE with rGO, an enhancement of both redox peak currents (curve b) were obtained due to its excellent electrical conductivity properties that can improve the electron transfer rate between (Fe3[CN]6) and SPCE surface. In contrast, both redox peaks currents were decreased after drop- casting the cortisol monoclonal specific antibody (C-Mab) onto rGO-SPCE surface. This is probably due to the formation of an insulating layer on SPCE surface that could hindered the electron transfer rates to the rGO-SPCE surface resulting a decrease of electrochemical current response. Furthermore, this finding indicated that the C-Mab was successfully immobilised on the surface of rGO-modified SPCE (curve c). In the presence of stress biomarker cortisol, a further decrease in both redox currents of (Fe3[CN]6) were observed due to the formation of immunocomplex between cortisol and C-Mab on the rGO-SPCE surface that acted as the insulating layer which limited the diffusion of (Fe3[CN]6) to the SPCE surface (d, e). Furthermore, the CV of fabricated rGO-modified SPCE at different scan rates were also studied as shown in Figure 3b. It was observed that both redox currents increased with an increasing of scan rates from 50 mV/s to 600 mV/s which suggested that the rGO-SPCE process is diffusion controlled (Rashid et al., 2015). Since our fabricated C-Mab/rGO-SPCE show a high discrimination of current response with and without the presence of cortisol, the utilization of rGO films as a cortisol sensing layer is highly suitable for cortisol immunosensing application.
Figure 3: a) CV characterisation at different modified SPCE in 5 mM (Fe3[CN]6) containing0.1MKCl solution
(pH 7.4) at scan rate of 50 mV/s; b) CV of the fabricated rGO-modified SPCE in 5 mM (Fe3[CN]6) containing0.1MKCl solution (pH 7.4) at different scan rates (mV/s) (50, 100, 150, 200, 250, 300, 350, 400, 450,
500, 550 and 600).
3.4 Optimisation of Experimental Conditions
A few parameters such as C-Mab concentration, GO concentration and incubation time of cortisol were investigated to optimise the electrochemical detection of cortisol at the concentration of 1 μg/mL.The different concentration of C-Mab from 0.1 mg/mL to 0.9 mg/mL were studied at fixed amount of GO concentration (1 mg/mL) and incubation time of cortisol (24 hours) as shown in Figure 4a. It was shown
a b

147
that the optimum concentration of C-Mab was 0.7 mg/mL. Meanwhile, high density of immobilised C-Mab on the SPCE surface would result in steric hindrance that can limit the immunoreaction between C-Mab and cortisol, resulting in a low electrochemical current response. Very low concentration of immobilised C-Mab(0.1 mg/mL) would result in low sensitivity detection due to less amount of cortisol can be adsorbed on the rGO-SPCE surface.
Figure 4: Optimisation of parameters conditions; a) The effect of C-Mab concentration, b) The effect of GO
concentration; c) The effect of incubation time of cortisol on the reduction of peak current of developed immunosensor.
Apart from C-Mab concentration, the GO concentration could affect the capacities of immobilised capture antibodies and the electrochemical properties of modified electrode (Wu et al., 2016). As shown in Figure 4b,increasing the GO concentration from 1 mg/mL to 2 mg/mL, the percentage reduction in peak current increased from 38% to 53% due to the enhanced of immobilised C-Mab capacities on rGO-SPCE surface leading to more amount of cortisol that can be adsorbed and detected. However, when GO concentration was more than 2 mg/mL, the percentage reduction in peak current decreased. This could be ascribed to the formation of thick rGO films on SPCE surface that could limit the electron transfer between (Fe3[CN]6) to the SPCE surface and also decreased the surface area of immobilised capture antibodies (Peik-See et al., 2014). Hence, the GO concentration of 2 mg/mL was chosen. The effect of incubation time of cortisol or immunoreaction time was shown in Figure 4c. It can be observed that the percentage reduction in peak current increased dramatically as the incubation time of cortisol increased from 1 min to 3 min and remained constant after 15 min. This result indicated that 3 min is sufficient for C-Mab-cortisol reaction in our fabricated cortisol immunosensor.

148
3.5 Analytical Performance As shown in Figure 5, the electrochemical current response of cortisol was linearly decreased with linear logarithm concentration of cortisol (y = -1.65x + 18.15 with R² = 0.9702) ranging from 0.001 µg/mL to 10 µg/mL with a detection limit of 0.001 µg/mL.
Figure 5: Linear relationship between CV peak current and logarithm of the cortisol concentration ranging
from 0.001 µg/mL to 10 µg/mL. 4. CONCLUSION
The electrochemical cortisol immunosensor based rGO was able to detect cortisol, an established stress biomarker levels, in less than 5 min at the cortisol range of 0.001 µg/mL to 10 µg/mL which covers the human cortisol levels in normal and stressful environments. The developed immunosensor has a great potential in future application in monitoring the stress levels among military personnel to ensure they are physically and emotionally fit and ready for deployments. 5. ACKNOWLEDGEMENT This research was financially supported by Ministry of Higher Education Malaysia (MOHE) with grant number NRGS/2013/UPNM/PK/P4 under Niche Research Grant Scheme (NRGS). Funding to pay the conference paper publication for this article was provided by Centre for Defense Foundation Studies, National Defense University of Malaysia (NDUM).
REFERENCES Arya, S. K., Chornokur, G., Venugopal, M. & Bhansali, S. (2010). Antibody modified gold micro array
electrode based electrochemical immunosensor for ultrasensitive detection of cortisol in saliva and ISF. Procedia Eng., 5: 804-807.

149
Arya, S.K., Saha, S., Ramirez-Vick, J.E., Gupta, V., Bhansali, S. & Singh, S.P. (2012). Recent advances in ZnO nanostructures and thin films for biosensor applications: review. Anal. Chim. Acta, 737: 1-21.
Benfield, R.D., Newton, E.R., Tanner, C.J. & Heitkemper, M.M. (2014). Cortisol as a Biomarker of Stress in Term Human Labor Physiological and Methodological Issues. Biol. Res. Nurs., 16: 64-71.
Benvidi, A., Firouzabadi, A.D., Tezerjani, M.D., Moshtaghiun, S., Mazloum-Ardakani, M. & Ansarin, A. (2015). A highly sensitive and selective electrochemical DNA biosensor to diagnose breast cancer. J. Electrochem. Chem., 750: 57-64.
Chan, C.-Y., Guo, J., Sun, C., Tsang, M.-K., Tian, F., Hao, J., Chen, S. & Yang, M. (2015). A reduced graphene oxide-Au based electrochemical biosensor for ultrasensitive detection of enzymatic activity of botulinum neurotoxin A. Sens. Actuat. B Chem., 220: 131-137.
McFarlene, A. C. (2010). The long‐term costs of traumatic stress: intertwined physical and psychological consequences. World Psychiatr., 9: 3-10.
Moreno-Guzmán, M., Ojeda, I., Villalonga, R., González-Cortés, A., Yáñez-Sedeño, P. & Pingarrón, J.M. (2012). Ultrasensitive detection of adrenocorticotropin hormone (ACTH) using disposable phenylboronic-modified electrochemical immunosensors. Biosens. Bioelectron., 35: 82-86.
Peik-See, T., Pandikumar, A., Nay-Ming, H., Hong-Ngee, L. & Sulaiman, Y. (2014). Simultaneous electrochemical detection of dopamine and ascorbic acid using an iron oxide/reduced graphene oxide modified glassy carbon electrode. Sens., 14: 15227-15243.
Puangjan, A. & Chaiyasith, S. (2016). An efficient ZrO2/Co3 O4/reduced graphene oxide nanocomposite electrochemical sensor for simultaneousdetermination of gallic acid, caffeic acid and protocatechuic acid natural antioxidants. Electrochim. Acta., 211: 273-288.
Rashid, J.I.A., Abdullah, J., Yusof, N.A., & Hajian, R. (2013). The development of silicon nanowire as sensing material and its applications. J. Nanomater., Vol. 2013: 328093
Rashid, J.I.A., Yusof, N.A., Abdullah, J., Hashim, U., & Hajian, R. (2014). The utilization of SiNWs/AuNPs-modified indium tin oxide (ITO) in fabrication of electrochemical DNA sensor. Mater. Sci. Eng., C45: 270-276.
Rashid, J.I.A., Yusof, N.A., Abdullah, J., Hashim, U. & Hajian, R. (2015). A novel disposable biosensor based on SiNWs/AuNPs modified-screen printed electrode for dengue virus DNA oligomer detection. IEEE Sens. J., 15: 4420-4427.
Rashid, J.I.A., Yusof, N.A., Abdullah, J., Hashim, U. & Hajian, R. (2016). Surface modifications to boost sensitivities of electrochemical biosensors using gold nanoparticles/silicon nanowires and response surface methodology approach. J. Mater. Sci., 51: 1083-1097.
Sanghavi, B. J., Moore, J. A., Chávez, J. L., Hagen, J. A., Kelley-Loughnane, N., Chou, C.-F., & Swami, N. S. (2016). Aptamer-functionalized nanoparticles for surface immobilization-free electrochemical detection of cortisol in a microfluidic device. Biosen. Bioelectron., 78: 244-252.
Singh, A., Kaushik, A., Kumar, R., Nair, M., & Bhansali, S. (2014). Electrochemical sensing of cortisol: a recent update. Appl. Biochem. Biotech., 174: 1115-1126.
Sun, W., Zhang, Y., Hu, A., Lu, Y., Shi, F., Lei, B. & Sun, Z. (2013). Electrochemical DNA biosensor based on partially reduced graphene oxide modified carbon ionic liquid electrode for the detection of transgenic soybean A2704‐12 gene sequence. Electroanal., 25: 1417-1424.
Wu, D., Wang, Y., Zhang, Y., Ma, H., Yan, T., Du, B. & Wei, Q. (2016). Sensitive electrochemical immunosensor for detection of nuclear matrix protein-22 based on NH2-SAPO-34 supported Pd/Co nanoparticles. Sci. Rep., 6: 24551.

150
DEVELOPMENT OF INDONESIAN LOW PROBABILITY OF INTERCEPT (LPI) RADAR SYSTEM
Mashury Wahab*, Yussi Perdana Saputera, Purwoko Adhi & Yuyu Wahyu
Research Centre for Electronics and Telecommunications of the Indonesian Institute of Sciences (PPET-LIPI), Indonesia
*Email: [email protected]
ABSTRACT In this paper, the development of a low probability of intercept (LPI) radar based on frequency modulated-continuous wave (FM-CW) technology is described. This LPI radar was mounted on a naval ship. Since 2006, the Research Center of Electronics and Telecommunications (PPET-LIPI) has been developing FM-CW radars for various applications. This started with the first generation of Indonesian sea radar (ISRA) using a reflector antenna system, and followed by the second generation, which is the LPI radar, using planar shaped antenna. In the second generation of our radar, the antenna is formed using antenna distribution arrangements, where the side lobe level (SLL) is reduced as compared to the uniform antenna applied on the LPI radar. The LPI radar has two antennas; transmit and receive antennas. In the slotted and co-patched antenna, the achieved SLL value is of 20 dB. This is sufficient to reduce the effect of side lobes from transmit and receive antennas. Signal processing aspects have also been discussed including signal generation, noise removal, beat signal, fast Fourier transform (FFT) process, reflectivity and Doppler spectrum. An example of LPI radar display is also presented. Keywords: Frequency modulated-continuous wave (FM-CW); low probability of intercept (LPI) radar;
antenna; signal processing.
1. INTRODUCTION One of the ways to improve the capabilities of the Indonesian authorities in monitoring and securing the Indonesian territorial waters is by the use of surveillance radar, which is mounted on ships and towers at the coastal areas. The information obtained from radar can be used to prevent illegal activities and also prevent accidents in the sea. Existing surveillance radars normally use high transmitted power to cover a range of up to 20 NM. This type of radar has high power consumption (Skolnik, 2008). In comparison, low probability of intercept (LPI) radars emit low power signals, with maximum power of 1 W. The radar has capability to detect the surrounding targets on and above sea surfaces including ships, seashore, bridges, etc. The term LPI results from the capability of the radar to detect targets without its signal transmission being detected by the enemy’s radar detector, which is called electronic support measure (ESM). Therefore, this radar is very useful in covert operations. Another advantage of this radar is its agility against the frequency jammer because it uses a large bandwidth. The jammer should also use wide bandwidth and high power signal to combat this LPI radar. The application of LPI radar is commonly in electronic warfare (Ligthart, 2005; Pace, 2009; Wong et al., 2009). In this paper, the development of a low probability of intercept (LPI) surveillance radar by the Research Center of Electronics and Telecommunications (PPET-LIPI) is described. The radar uses frequency
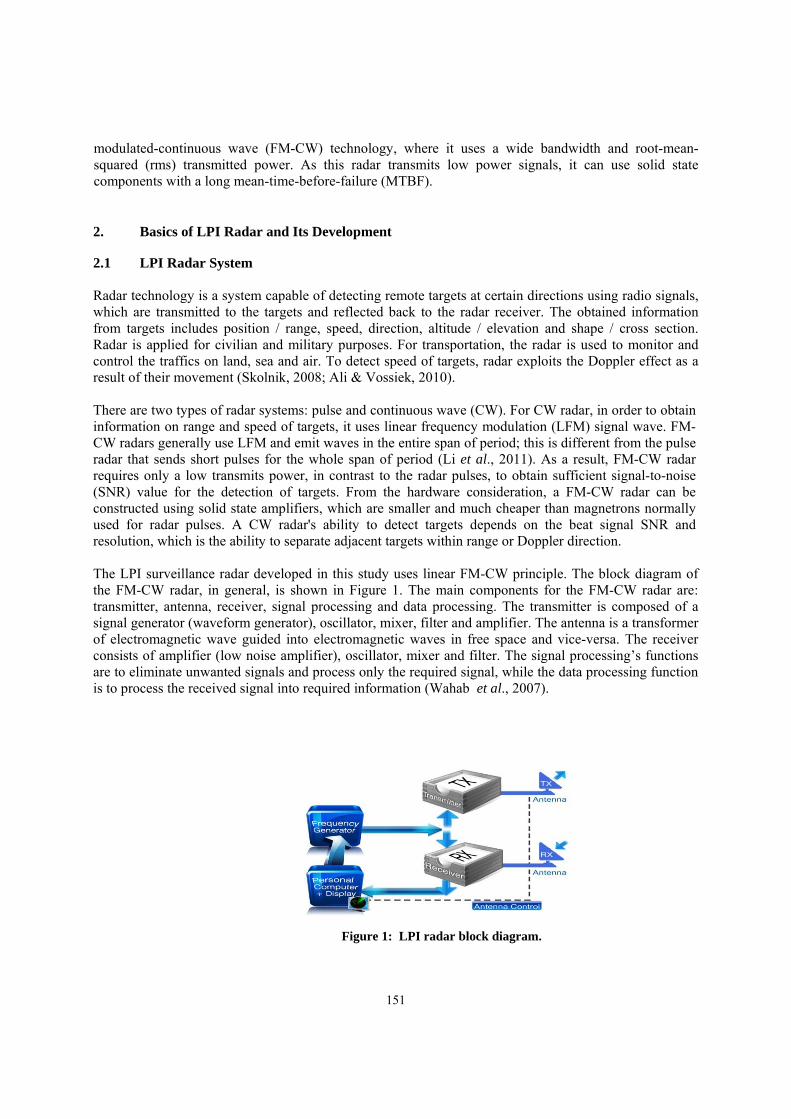
151
modulated-continuous wave (FM-CW) technology, where it uses a wide bandwidth and root-mean-squared (rms) transmitted power. As this radar transmits low power signals, it can use solid state components with a long mean-time-before-failure (MTBF). 2. Basics of LPI Radar and Its Development
2.1 LPI Radar System Radar technology is a system capable of detecting remote targets at certain directions using radio signals, which are transmitted to the targets and reflected back to the radar receiver. The obtained information from targets includes position / range, speed, direction, altitude / elevation and shape / cross section. Radar is applied for civilian and military purposes. For transportation, the radar is used to monitor and control the traffics on land, sea and air. To detect speed of targets, radar exploits the Doppler effect as a result of their movement (Skolnik, 2008; Ali & Vossiek, 2010). There are two types of radar systems: pulse and continuous wave (CW). For CW radar, in order to obtain information on range and speed of targets, it uses linear frequency modulation (LFM) signal wave. FM-CW radars generally use LFM and emit waves in the entire span of period; this is different from the pulse radar that sends short pulses for the whole span of period (Li et al., 2011). As a result, FM-CW radar requires only a low transmits power, in contrast to the radar pulses, to obtain sufficient signal-to-noise (SNR) value for the detection of targets. From the hardware consideration, a FM-CW radar can be constructed using solid state amplifiers, which are smaller and much cheaper than magnetrons normally used for radar pulses. A CW radar's ability to detect targets depends on the beat signal SNR and resolution, which is the ability to separate adjacent targets within range or Doppler direction. The LPI surveillance radar developed in this study uses linear FM-CW principle. The block diagram of the FM-CW radar, in general, is shown in Figure 1. The main components for the FM-CW radar are: transmitter, antenna, receiver, signal processing and data processing. The transmitter is composed of a signal generator (waveform generator), oscillator, mixer, filter and amplifier. The antenna is a transformer of electromagnetic wave guided into electromagnetic waves in free space and vice-versa. The receiver consists of amplifier (low noise amplifier), oscillator, mixer and filter. The signal processing’s functions are to eliminate unwanted signals and process only the required signal, while the data processing function is to process the received signal into required information (Wahab et al., 2007).
Figure 1: LPI radar block diagram.

152
2.2 Hardware In the first generation LPI radar (Figure 2), all parts of radio frequency (RF), signal generator and signal processing units are placed in a radome, which rotates together with the antenna system. The antenna pedestal contains the antenna motor, its control system and power supply. The display is placed in the shelter (control room). In Figure 2, from top left to right clockwise, the LPI radar is installed at the tower with a height of 10 m at the coastal area of Anyer-Banten, with servo motor unit for rotating antenna, an RF transmitter and receiver unit, and the antenna system. Figure 3 shows the second generation LPI radar, where a different shaped antenna is applied, air gap is used to increase the antenna isolation, radio frequency (RF) parts and motor control system are installed in the pedestal, and the transmitted signal to the console display is intermediate frequency (IF) signal.
Figure 2: First generation of LPI radar system.
Figure 3: Second generation of LPI radar system (Saputera et al., 2014, 2015). 3. ANTENNA DESIGN 3.1 Antenna Innovation
Antenna systems in FM-CW radars should not use uniform distribution on vertical radiation pattern or in a position lined up between the transmitter and receiver antennas (Richards, 2005). The most suitable distribution is the distribution that has a big power in the middle of the array and is followed by the diminution of power in patches that position more towards the tip of the antenna array, with the value of the side lobe level (SLL) above the expected level of -13 dB. Examples of commonly used distribution are the Pascal / Binomial and Chebyshev. Figures 4 and 5 depict the developed antenna systems from 2009 to 2013, with the design of these antennas using uniform distribution (Saputera et al., 2014).

153
(a) (b)
(c) (d)
Figure 4: First antenna generation of our FM-CW radar in 2009: (a) Design and simulation (b) Fabrication
of antenna module (c) Design of mechanical construction (d) Fabrication of overall antenna.
(a) (b)
(c) (d)
Figure 5: Second antenna generation of our FM-CW radar in 2013, (a) design and simulation of antenna (b) Fabrication results (c) Design of mechanical construction (d) Installation of antenna modules on the
frame (Saputera et al., 2014).
Figure 4 shows antenna in the first generation radar in 2009. This antenna is a reflector type antenna with antenna array distribution using a uniform distribution. The achieved side lobe level (SLL) was about -11.1 dB. The simulated results can be seen in Figure 5.
Figure 6 depicts the second generation antenna for our FM-CW radar that was developed in 2013. This antenna is a modified development of the previous antenna generation. It uses the planar method with an air gap as a separator between the transmitter and receiver antennas. It still uses a uniform distribution with SLL of -13 dB. The vertical antenna array with uniform distribution yields mutual interference effects between the transmitter and receiver antennas. As the SLL is small, the interference of the antenna uniform pattern can be seen in Figure 7.

154
Figure 6: The simulated results of the antenna radiation pattern for the first generation FM-CW radar in 2009. Left, the 3D simulation. Right, the antenna pattern.
Figure 7: The simulated results of the antenna radiation pattern for the second generation FM-CW radar in
2013. Left, the 3D simulation. Right, the antenna pattern. 3.2 Slotted and Co-Patched Array Antenna The development of a 4x4 array design is shown Figure 8(a). This antenna design still uses voltage distribution methods adapted from the combination of Pascal and Chebyshev binomial. However, in this design, the coupling method adds another conductor material, which is positioned near the main radiating patch. The method used in the design is the co-planar method, whereby this method utilizes the effect of radiation from the main patch with a high increase of electric fields in order to add a new resonance. In order to add a new resonant, which is not far from the main resonant frequency, the co-planar dimensions are set such that the resonant is close to the main resonant patch, which set provides wide bandwidth effects and matching impedance. The design can be seen in Figure 8(b).
Figure 8: (a) Calculated reference 4x4 antenna array using co-patched binomial method. (b) The fabrication
of the 4 x 4 array antenna with co-planar.

155
The simulations carried out by regulating incoming voltage on each patch produce quite large SLL, which is 20 dB and this is much larger than the 4x4 array arrangement without co-planar, as shown in the Figure 9. The gain generated in one module of 4x4 array antenna is 18.12 dB. In this design, the resulting polarization has a horizontal linear nature, in accordance with the requirements of radar applications.
Figure 9: The simulated results with a 4x4 antenna array as a source ratio binomial method for generating different lobe and the main lobe. SLL with co-planar is sufficiently large.
As in the realization as a 4x4 antenna array without co-planar, the realization is done is to prove that the simulation is done properly. The measured value of return loss s11 using a vector network analyser (VNA) is -46.416 dB at 9.3 GHz frequency. This value is slightly different compared to that of the simulated results, where the difference is about 10 dB worse that of the simulation. This is likely due to solder on connectors. The level values can be seen in Figure 10.
Figure 10: The results of measurements of 4x4 array antenna with co-planar.
4. SIGNAL PROCESSING DEVELOPMENT The radar’s RF system is divided into two main parts: transmitter and receiver. A signal generator dielectric resonator oscillator (DRO) is used as a main signal generator for the entire system. In this system, DRO produces a signal with a frequency of 9,856 MHz. Several frequency dividers and multipliers are used to produce a frequency sweep clock for a direct digital synthesizer (DDS) with a frequency of 394.24 MHz. This DDS generates chirp signals where the input signal of 160 MHz is modulated to produce sawtooth sweep signals with a bandwidth of 60 MHz (130-190 MHz).

156
The signals are then mixed in two stages: the first mixing is with the first carrier frequency of 616 MHz to produce a sweep signal of 426-486 MHz, while the second mixing is with the frequency of 9,856 MHz to produce a frequency band of 9,370-9,430 MHz with a center frequency of 9.4 GHz. After passing through the power amplifier, the signal is then fed into the antenna system that consists of an array of patch antennas. The system has two separate identical antenna systems for transmitter and receiver with 1° beamwidth. For this beamwidth, the radar signal can detect objects in the coverage width of 100 m for a distance of 5 km and objects in the coverage width of 1,000 m for a distance of 50 km, as shown in Figure 11 (Wahab et al., 2007).
Figure 11: The beamwidth antenna array system used (Mashury, 2007). The signal reflected by the object will be received by antennas and forwarded to the low noise amplifier (LNA) with a 9.4 GHz center frequency, which is then separated from the carrier frequency by mixing with frequency of 9,856 MHz to get sweep signals at frequency of 426-486 MHz. These sweep signals will be mixed with the previously generated sweep signals to produce beat frequency signals, which are then converted by analog to digital converter (ADC) and processed by an embedded PC. The frequency of the reference clock is 394.24 MHz. The desired sweep frequency is about 2 MHz or sweep time of around 0.5 ms. Nearby frequencies, which are obtained by dividing the reference clock by 2N numbers with N=131, are 1503.906 Hz, and thus the sweep time is 0.665ms (Wahab et al., 2007). In this radar system, beat signals are sampled by using a 16-bit ADC with a sampling speed of 3,080 MHz. For every period of sweep trigger signals, ADC takes the 1,024 sample data from the received signal radar, hereinafter called the sweep (frame) data. Each sweep sampling data is collected in the ADC buffer and then sent directly to main memory embedded-PC in real time. Figure 12 shows the architecture and physical form of the ADC system.
Figure 12: The system architecture (left) and the physical form of the ADC (right).

157
Figure 13 shows the beat frequency signal that is sampled in the time domain, where the data width is taken from each of the data sweep period (chirp) transmitted by the radar. Furthermore, each data packet that is received is then quantized into mV value and, subsequently, entered into the Range-Doppler fast Fourier transform (FFT) calculation. The common way to obtain Range-Doppler information is by using FFT. Two FFT processes are performed to obtain Range-Doppler information: the first FFT is performed on samples of the beat frequency, which produces information on range, while the second FFT is done on a small sample of range cells corresponding to the frequency sweep of the sequence in the first FFT in order to obtain Range-Doppler information. Figure 14 shows the plot of the FFT Range-Doppler processes. For each sweep of data, the 1,024-point FFT is performed using a rectangular windowing.
Figure 13: Sampling of the beat frequency signal received in the time domain.
Figure 14: The first FFT results showing the amplitude and range of objects on a 1024 point FFT.
From Figure 14, the position of the object can be seen as the presence of a peak amplitude in the FFT spectrum. From the symmetry and cyclic characteristics of FFT, the maximum range will be at the point of FFT samples from 1 to 512. Therefore, the location of the peak is divided by 512 and multiplied by the maximum range. In addition, 512 sweeps (packet data) are collected and 512 point Doppler FFT calculation with rectangular windowing is performed for each range cell. For each Doppler spectrum, signal processing is performed in several stages, where only the information amplitude (magnitude) is processed while its phase is ignored. Clutter suppression is performed by removing the Doppler velocity at the zero point of the spectrum. Then, interpolation with some nearby points is performed as a smoothing process to eliminate the effects of atmospheric noise. The calculated maximum value of the Doppler spectrum is generated and the midpoint of its spectrum is changed to these values. This is done to ensure the accuracy of the calculation of the speed and width of its Doppler spectrum. Then, the moving average filter is applied. Clipping (cutting) is performed to remove thermal noise. The result is a Doppler spectrum for each range. Calculation of the three moments of power Doppler spectrum is done to get reflectivity, average Doppler velocity, and Doppler width.

158
Figure 15: Top left: Raw data is the beat frequency in the time domain. Top right: Output of first FFT process (reflectivity). Bottom left: Reflectivity in dBm. Bottom right: Doppler spectrum in the range cell
Figure 16: Display plan position indicator (PPI) of the LPI radar. Some targets are detected including ships,
and seashores.
5. CONCLUSION The development of LPI radar from design until fabrication has been presented in this paper. This radar is normally used for covert operations and has a low transmission power (≤ 1 W) so that its presence cannot be detected by the enemy’s ESM. The LPI radar has two antennas: transmit and receive antennas. In the slotted and co-patched antenna, the achieved SLL value is of 20 dB. This is sufficient to reduce the effect of side lobes from the transmit and receive antennas, where side lobes have large impact on radar detection because they produce dominant signals to the receiver. Signal processing aspects have also been discussed, including signal generation, noise removal, beat signal, FFT process, reflectivity, and Doppler spectrum. An example of LPI radar display is also presented. Future work will be done to improve radar performance in terms of resolution, coverage, SLL and detection probability. REFERENCES Skolnik, M.I. (2008) . Radar Handbook, 3rd Ed. McGraw-Hill, New York. Pace, P.E. (2009), Detecting and Classifying Low Probability of Intercept Radar, 2nd Ed. Artech-House.
London. Wong, K.M. , Davidson, T. & Abelkader, S. (2009). Detection of Low Probability of Intercept Radar
Signals. Defence R&D Canada, Ottawa.

159
Ali, F. & Vossiek, M. (2010). Detection of Weak Moving Targets Based on 2-D Range-Doppler FM-CW Radar Fourier Processing. Institute of Electrical Information Technology, Clausthal University of Technology, Germany.
Li, S., Hsien, S.W. & Ching, K.C (2011). 2-D FFT and time-frequency analysis techniques for multi-target recognition of FM-CW radar signal. Proc. Asia-Pacific Microwave Conf. 2011, 5-8 December 2011, Melbourne.
Ligthart, L.P. (2005). Short Course on Radar Technologies. International Research Centre for Telecommunications and Radar, TU Delft, Delft.
Wahab, M. , Wijayanto, Y.N. & Mahmudin, D. (2007). Signal Processing Aspects of FM-CW Radar, International ICICI, Bandung.
Richards, M. (2005). Radar Signal Processing. McGraw-Hill, New-York. Saputera, Y.P. , Wahab, M., Oktafiani, F. & Wahyu, Y. (2015). Square notch ground plane binomial
Chebyshev for maximum main lobe frequency 9.3 GHz radar application. 2015 IEEE Int. Conf. Radar, Antenna, Microwave, Eletr. Telecommun., 5-7 October 2015, Bandung.
Saputera, Y.P., Wahab, M. & Wahyu, Y. (2014). Antena co-planar array of X-band frequency 9.4 GHz for Radar (2014), 8th Int. Conf. Telecomm. Syst. Serv. App. (TSSA), 23-24 October 2014, Bali.

160
GENERAL ANDROID MALWARE BEHAVIOUR TAXONOMY
Najiahtul Syafiqah Ismail*, Halizah Saad, Robiah Yusof & Mohd Faizal Abdollah
Faculty of Information Communication and Technology, University Teknikal Malaysia Melaka (UTeM) Melaka, Malaysia
*Email: [email protected]
ABSTRACT Nowadays, with rapid advancement of technology, a smartphone has significant risks as they contain sensitive information and can lead to serious security risks if it falls into unauthorised persons. The major challenge in countering attacks is the lack of knowledge about various types of Android malware and its behaviour, which makes the existing detection system ineffective against newly-developed malware in the market. This paper aims to provide a better understanding of Android malware and its general behaviour by analysing and profiling related studies that can be used as a primary guideline to distinguish between malicious and benign applications. Focusing on previous works, this study methodically surveys and user studies on the behaviour of existing Android malware. From this study, we have generated a general Android malware taxonomy behaviour that can improve the selected feature and increase accuracy of the Android malware detection. Keywords: Smartphone; Android OS; Android malware; behaviour taxonomy. 1. INTRODUCTION Smartphone is a technological advancement that has become a fundamental part of human life as it has the ability to carry out most, if not all the tasks that a computer can do. It can be used to launch office applications, access emails, browse the internet, play games, edit pictures and videos, access vehicle guidance system susing location-based services, and many more. According to Wu et al. (2012), similar to computers, smartphones are as vulnerable to malware attacks. Since people tend to use smartphones for their personal use – planners, online transactions and other tasks requiring confidential information – it is naturally the most popular target of attacks. Despite Android OS being one of the most vulnerable targets of mobile malware, the market share of Android still follows a general upward trend. Up to 2015, smartphone technology continues to evolve at continually increasing rate. Based on IDC (2016), since the second quarter of 2012 until August 2015, Android OS dominated the market. In May 2015, Google announced that they had reached one billion active users of Android OS and its growth in the sector is unlikely to slow down. The key reason for Android’s dominance is due to users having large options of hardware choices at an affordable price range, and that the hardware and software can be customised to a user’s specific interest and budget. The wide market of application stores is one of the reasons why people choose to use Android OS. Martínez Retenaga (2015) indicated that up until 2015, Play Store is the largest repository of downloadable applications for Android users. Since Android practices disclosure policy, Play Store allows developers to advertise their applications and users may download applications from third party markets, including Black Market, at their own risks, thus making it is easier for unauthorised software to

161
be installed on Android devices. Frequently, the motivation of malware threat is more on making monetary profit from infected Android smartphones. According to AG (2015), over 50% of Android malware was financially motivated. The statement was supported by a Kaspersky Lab Report (Kaspersky, 2015), which shows that Android malware attacks in 2014 tripled from the past year and they predicted that it will continue increasing in 2015 and 2016. In order to address this issue, this paper analyses several related researches on Android malware in order to obtain the best understanding of Android malware behaviour. The proposed Android malware behaviour taxonomy can be used to develop a better Android malware detection system. The rest of the paper is organised as follows. Section 2 reviews a number of related works and describes the types of Android malware based on the comparison of review papers. Section 3 discusses the findings of this analysis paper. Section 4 will discuss about the proposed generalised Android malware behaviour taxonomy. Finally, Section 5 concludes the paper. 2. ANDROID MALWARE Android was commercially released in 2005 as a mobile OS that uses Linux as its base. However, it does not use a standard Linux kernel but favours an alternative deployment target, the Dalvik virtual machine. According to Filiol et al. (2006), similar to the architecture of Android OS, all of the Android applications on the OS were developed using the JAVA programming language and was executed in the Dalvik Virtual Machine engine. Android has its own application store, Play Store, where users can choose to download more than one million applications, including paid and free applications, to be installed on their smartphone. According to Rai et al. (2015), Android users are also allowed to download applications from third party markets, although the risks of malware attacks are higher. As third-party application reliability varies extensively, Android treats all applications as potentially malicious. Usually, malwares have unusual features when installed and devices will indicate possible suspicious content. The unusual feature may become a threat if the attacker has ill intentions and if the users are not aware of the effect. The term malware is derived from the term malicious software. According to Leita et al. (2010), malware is an entity used to break into vulnerable systems and install malicious code to remotely controlled desktops. It allows the attacker authority to undertake a number of illicit activities ranging from breach of data confidentiality and denial of service attacks to the generation of unsolicited traffic. Preda (2008) states that malware is a program with malicious intent and has the potential to harm the machine on which it executes or the network over which it communicates. Android malware can be defined as an entity or a piece of code written by an author with bad intentions to perform tasks in the victim’s machine or device, which is aimed at changing the functionality of Android OS without the user’s consent and permission, and can harm the user for the benefit of the malware’s author. 2.1 History of Android Malware Attack Since the advancement of malware on other platforms, there has been an apparent change from developing Android malware for reputation, intellectual challenge or monetary incentives. Android malware activity is motivated by the potential advantage that malware authors may potentially gain illegally from Android users, especially confidential information that may be utilised for financial gains. According to Symantec (2015), there are three factors that motivate attackers and cause increase in

162
mobile malware cases; open platform, ubiquitous platform and monetary. Notable Android malware attacks are summarised in Table 1, which reveals that four out of six major cases of attacks are for monetary benefit, while the others are data theft. The negative motives of the attacks have initiated the need to know the types of malware involved and to profile malware behaviour for future detection.
Table 1: Notable android malware attacks.
Year Android Malware
Motive Description Source
2010 FakePlayer Money Made money by sending messages to premium line numbers in Russia.
Hoffmann (2014), Zhou et al. (2012)
2011 DroidDream Data theft
First large attack on Play Store. Over 50 apps containing a root exploit published in the Android market.
Vidas et al. (2011), Marsan (2013)
2012 Zitmo Money First banking fraud in Android OS. Designed to steal mobile transaction authentication numbers (mTANs).
Nigam (2014), Alzahrani et al. (2015)
2013 MasterKey Data theft
A vulnerability in Android exploiting certificate validation, allowing malware to disguise itself as a legitimate app.
F-Secure (2013), Martinez (2015)
2014 DownAPK Money Windows based malware used Android debugging bridge to install fake banking app in Android devices connected to the infected PC.
Svajcer (2014)
2015 Gazon Money Android malware spammed all user contacts through SMS with a link to install a phony Amazon rewards app.
Svajcer (2014), Karim et al. (2016)
2.2 Types of Android Malware Based on malware types created by Karresand (2002), malware is a combination of worm, virus and Trojan horse even though they are not comparable as they are not mutually exclusive. The differences or equalities of these malwares can be seen based on their definitions. According to Mathur (2013), malware in general has been classified into seven types, which are adware, bot, rootkit, spyware, trojan, virus and worm. However, in this paper, we left out the virus type since there are no review papers that have classified virus as an Android malware. Therefore, we have listed six types of Android malware that have been discussed in related research papers as shown in Table 2, which are adware, bot, rootkit, spyware, Trojan and worm.

163
Table 2: Types of Android malware discussed in related research papers.
Android Malware Description Reference
Adware - Installed apps may contain advertisements which are harmless, but continuous pop ups and numerous advertisements inevitably cause some annoyance to users.
Karresand (2002), Thanh (2013), Martínez Retenaga (2015), Faruki et al. (2015)
Bot - Device will be controlled by a Command and Control (C&C) remote server, BotMaster. It will wait for commands from BotMaster to collect and send personal information, Ddos attack, or automatically download malicious payload.
Felt et al., (2011), Peng et al., (2014), Yang, Xu et al. (2014), Faruki et al. (2015)
Rootkit - It exploits the weaknesses of smartphone through infected app to gain user privilege control.
Karresand (2002), Abela et al. (2013), Thanh (2013), Peng et al. (2014), Raveendranath & Venkiteswaran (2014), Yang et al. (2014), Faruki et al. (2015)
Spyware - Penetrate smartphone through emails, advertisements, website visits or downloaded apps. It monitors and search for personal information, contacts, messages or internet browser activities.
Thanh (2013), Abela et al. (2013), Martínez Retenaga (2015), Faruki et al. (2015)
Trojan - It masquerades as benign apps but carries out malicious activities on user Android smartphone without their consent.
Karresand (2002), Felt et al. (2011), Thanh (2013), Abela et al. (2013), Zheng et al. (2013), Yang et al. (2014), Faruki et al. (2015)
Worm - A self-replicating program that spreads through networks or removable media running in the background of Android OS.
Schmidt et al. (2004), Felt et al. (2011), Zheng et al. (2013), Peng et al. (2014), Faruki et al. (2015)
3. BEHAVIOURS OF ANDROID MALWARE There is a need to further analyse the behaviour of Android malware based on the understanding and information gathered in Table 2. Generally, according to the review papers that have listed in Table 2, there are six significant categories of behaviours identified in the six Android malware types. The behaviours are further discussed in related works, which are: A. Existing Form:
i. Masquerade: Disguised as legitimate apps that obtain privilege access to user’s device.
ii. Independent Identity: Replicate themselves and spread thousands of copies automatically without the need for human intervention.

164
B. Propagation Mode:
i. Additional Content Download: Usually the malware downloads additional content following the installation of legitimate apps. The additional content is either downloaded dynamically by the application or concealed as an app update. It presents as a form of plugin, extension or update to trick users into downloading the malicious payload.
ii. Repackaging: A set of processes of reverse engineering, which includes dissembling or decompiling apps, insertion or attachment of the malware payload, re-assembling of the Trojan app, and distribution of apps in third party market. Android always allow users to download any applications from other unofficial stores apart from their own. Usually, malware authors know how to perform reverse engineering on legitimate apps and repackage them to contain malicious code. Attackers typically use well-known legitimate apps to trick users into downloading and installing them on their devices. However, users are unaware of the additional configurations taking place on their device that may affect them negatively.
iii. Self-Replicate: Make thousands of copies of themselves without human intervention.
iv. Stealth Technique: A malware author will not embed the malicious payload in the app on
the market but instead insert a few lines of code to initiate contact with remote server. The rest of the malicious code will be downloaded from the remote server once the malware is running. This allows the malware to successfully evade the malware detection system.
C. Risks:
i. Data Theft: Steals user sensitive information such as login password, message, photos, videos, etc. This information may be sold to interested third parties, or worst still, end up in the hands of cyber criminals. Certain Android malware also have the ability to mimic user activities, such as sending or receiving SMS, making phone calls or browsing the internet. This phenomenon makes Android smartphone an easy target for credential theft.
ii. System Damage: Can cause functional disability, which makes the system unable to operate normally, and change system configurations, such as changing the wallpaper of the device.
D. Gain privileges access: Allows Android malware to take control of the smartphone. Android malware can install, uninstall, download, add or remove any apps or other information without user consent.
E. Draining Resources: Android smartphone constantly executes bogus computations in the background, which consumes a lot of resources, such as CPU cycles and battery life, and also utilises all the disc storage or memory.
F. Premium Rate SMS: The malware’s major motive is to benefit financially from the victim. SMS
messages are used to collect money by sending messages to premium-rate numbers without user consent. These premium-rate numbers are phone numbers using certain services that charge at a higher rate than a normal phone number. By sending SMS at consistent intervals to such numbers, it can cause significant amounts of financial loss to the victim.

165
Based on above description, the summarisation is shown in Table 3.
Table 3: Android malware behaviours base on types of android malwares.
Behaviours
Ad
war
e
Bot
Roo
tkit
Sp
ywar
e
Tro
jan
Wor
m
No.
Of
occu
rren
ces
A. Existing form i. Masquerade √ √ √ √ √ √ 6
ii. Independent identity x x x x x √ 1
B. Propagation Mode
i. Repackaging √ √ √ √ √ x 5
ii. Additional content download
√ √ √ √ √ x 5
iii. Stealth Technique √ √ √ √ √ √ 6
iv. Self-replicate x x x x x √ 1
C. Risks i. Data Theft √ √ √ √ √ √ 6
ii. System damage x √ x x x √ 2
D. Gain Privilege access √ √ √ √ √ √ 6
E. Draining resources x √ x x √ √ 3
F. Premium Rate SMS √ √ √ √ √ √ 6
The significant behaviour information obtained will be used to propose the general taxonomy of Android malware behaviour by focusing on number of occurrences for each type of Android malware in every category. In this paper, we select the behaviour possessed by all types of Android malware.
4. PROPOSED OF ANDROID MALWARE BEHAVIOURS TAXONOMY The idea to propose Android malware behaviour taxonomy is based on number of occurrences of each malware behaviour. Based on Table 3, there are five common behaviours found in all types of Android malware, which are masquerade for existing form, stealth technique for propagation mode, data theft risk, gain privilege access and premium rate SMS. The other types of behaviour have been eliminated since they cannot be used to generally describe Android malware. Based on the information gained, it has been used to generate a general Android Malware behaviour taxonomy as shown in Figure 1. The first layer shows the main behaviours while the second layer contains of the sub-behaviours for existing form, propagation mode and risks.

166
Figure 1: Proposed android malware behaviour taxonomy.
5. CONCLUSION & FUTURE WORKS The latest advancements in mobile technology have resulted in mobile devices being the focus of malicious attacks, especially when Android delivers pervasive services. Although there are many Android malware detection systems available nowadays, the number of cases of malware attacks reported is still increasing. The main reason we are still unable to curb the spread of Android malware is because of the stealth techniques used to evade detection system. Unauthorised access by Android malware may cause sensitive data to be stolen and incur financial losses for victims. This study has comprehensively reviewed relevant papers regarding Android malware types and its behaviour. From the review, we have introduced a general behaviour taxonomy that is found in all types of Android malware. This study is the preliminary phase to distinguish benign and malware behaviour, and can improved in selected features that will be used in the next phase of development of more effective and reliable Android malware detection systems. The findings will contribute ideas in finding an effective method to develop an Android malware detection system. ACKNOWLEDGEMENT We would like to express appreciation to the Insfornet group of Universiti Teknikal Malaysia Melaka (UTeM) for their continuous support in encouraging the authors to publish this paper. This work was supported by the MoE under Grants F00212 - FRGS/1/2014/ICT04/FTMK/02. REFERENCES Abela, K. J., Angeles, D. K., Alas, J. R. D., Tolentino, R. J. & Gomez, M. A. (2013). An automated
malware detection system for android using behavior-based analysis AMDA. Int. J. Cyber-Secur. Dig. Forensics, 2: 1–11.
AG, G. (2015). Over 50 percent of Android malware targets financial transactions. G DATA, Software AG.
Alzahrani, A.J. & Ghorbani, A.A. (2015). Real-time signature-based detection approach for SMS botnet.

167
2015 13th Annual Conference on Privacy, Security and Trust (PST), pp. 157–164. F-Secure. (2013). Mobile Threat. Helsinki, Finland Faruki, P., Bharmal, A., Laxmi, V., Ganmoor, V., Gaur, M., Conti, M. & Rajarajan, M. (2015). Android
security: a survey of issues, malware penetration, and defenses. IEEE Commun. Surv. Tutor., 17: 998-1022.
Felt, A., Finifter, M., Chin, E., Hanna, S. & Wagner, D. (2011). A survey of mobile malware in the wild. Proceedings of the 1st ACM Workshop on Security and Privacy In Smartphones And Mobile Devices - SPSM '11, pp. 3-14.
Filiol, E., Helenius, M. & Zanero, S. (2006). Open problems in computer virology. J. Comput. Virol., 1: 55-66.
Hoffmann, J. (2014). From Mobile to Security: Towards Secure Smartphones. PhD Thesis. Ruhr University Bochum.
IDC (2016). Smartphone OS Market Share. IDC, Singapore. Jiang, X., Wang, X. & Xu, D. (2010). Stealthy malware detection and monitoring through VMM-based
“out-of-the-box” semantic view reconstruction. ACM T. Inform Syst. Security, 13: 1–28. Karim, A. (2016). On the analysis and detection of mobile botnet. J. Univers. Comput. Sci., 22: 567–588. Karresand, M. (2002). A Proposed Taxonomy of Software Weapons. Master’s In Computer Security
Thesis, ISY, Linköping University, Sweden. Kaspersky (2015). Financial Cyberthreats in 2014 (February). Kaspersky Lab Report Kraunelis, J., Chen, Y., Ling, Z., Fu, X. & Zhao, W. (2014). On malware leveraging the android
accessibility framework. Lect. Notes Inst. Comput. Sci. Soc. Inform. Telecommun. Eng., 131: 512-523.
Leita, C., Bayer, U. & Kirda, E. (2010). Exploiting diverse observation perspectives to get insights on the malware landscape. 2010 IEEE/IFIP International Conference On Dependable Systems & Networks (DSN), PP. 393 - 402.
Marsan, R. J. (2013). Android Behind The Scenes: Revealing Hidden Malware With Andromeda. Master Thesis. University of Illinois at Urbana-Champaign.
Martínez Retenaga, A. (2015). Android malware situation. Spanish National Cyber-Security Institute, pp. 1–62.
Mathur, K. & Hiranwal, S. (2013). A survey on techniques in detection and analyzing malware executables. Int. J. Adv. Res. Comput. Sci. Softw. Eng., 3: 422-428.
Nigam, R. (2014). A timeline of mobile botnets. The Botnet Fighting Conference 3rd Edition BOTCONF. Peng, S., Yu, S. & Yang, A. (2014). Smartphone malware and its propagation modeling: A survey. IEEE
Commun. Surv. Tutor. 16: 925–941. Preda, M., Christodorescu, M., Jha, S. & Debray, S. (2007). A semantics-based approach to malware
detection. Proceedings of the 34th Annual ACM SIGPLAN-SIGACT Symposium on Principles of Programming Languages - POPL '07, 42: 377-388.
Raveendranath, R. & Venkiteswaran, R. (2014). Android malware attacks and countermeasures : current and future directions. International Conference on Control, Instrumentation, Communication and Computational Technologies (ICCICCT), pp. 137–143.
Schmidt, A., Schmidt, H., Batyuk, L., Clausen, J. H., Camtepe, S. A., Albayrak, S. & Universit, T. (2009). Smartphone malware evolution revisited : android next target? 4th International Conference on Malicious and Unwanted Software (MALWARE), pp. 1–7.
Svajcer, V. (2014). Sophos Mobile Security Threat Report Launched at Mobile World Congress , 2014. Symantec Security Response (2012). New Symantec Research: The motivations of recent android
malware. Available online at: http://investor.symantec.com/files/doc_news/2012/motivations_of_recent_android_malware.pdf (Last access date: 30 April 2015).
Thanh, H. (2013). Analysis of malware families on android mobiles: detection characteristics recognizable by ordinary phone users and how to fix it. J. Inform. Secur., 4: 213-224.
Wu, D., Mao, C., Wei, T., Lee, H. & Wu, K. (2012). DroidMat: Android malware detection through

168
manifest and api calls tracing. 2012 Seventh Asia Joint Conference On Information Security. Yang, C., Xu, Z., Gu, G., Yegneswaran, V. & Porras, P. (2014). DroidMiner: Automated mining and
characterization of fine-grained malicious behaviors in android applications. Lect. Notes Comput. Sci., 8712: 163–182.
Yerima, S.Y., Sezer, S., McWilliams, G. & Muttik, I. (2013). A new android malware detection approach using bayesian classification. AINA ’13 Proceedings of the 2013 IEEE 27th International Conference on Advanced Information Networking and Applications, (March), pp. 25–28.
Zheng, M., Lee, P. P. C.,& Lui, J. C. S. (2013). ADAM : An automatic and extensible platform to stress test android anti-virus systems. Detect. Intrusions Malware Vulnerability Assess., 7591: 82–101.
Zhou, Y. & Jiang, X. (2012). Dissecting android malware : characterization and evolution. SP ’12: Proceedings of the 2012 IEEE Symposium on Security and Privacy, 4: 95–109.