Embed Size (px)
Citation preview
Science of the Total Environment 618 (2018) 1210–1223
Contents lists available at ScienceDirect
Science of the Total Environment
j ourna l homepage: www.e lsev ie r .com/ locate /sc i totenv
Microstructural and associated chemical changes during the compostingof a high temperature biochar: Mechanisms for nitrate, phosphate andother nutrient retention and release
Stephen Joseph a,c,d,⁎, Claudia I. Kammann e, Jessica G. Shepherd f, Pellegrino Conte g, Hans-Peter Schmidt h,Nikolas Hagemann i, Anne M. Rich j, Christopher E. Marjo j, Jessica Allen b, Paul Munroe c, David R.G. Mitchell d,Scott Donne a, Kurt Spokas k, Ellen R. Graber l
a Discipline of Chemistry, University of Newcastle, Callaghan, NSW 2308, Australia; University of New South Wales, School of Material Science and Engineering, NSW 2052, Australiab School of Chemical Engineering University of Newcastle, Callaghan, NSW 2308 Australiac School of Materials Science and Engineering, University of NSW, Kensington, NSW 2052, Australiad Electron Microscopy Centre, Australian Institute for Advanced Materials, Innovation Campus, University of Wollongong, Squires Way, North Wollongong, NSW 2517, Australiae Department of Soil Science and Plant Nutrition, Working Group Climate Change Research for Special Crops, University Geisenheim, Von-Lade Str. 1, D-65366 Geisenheim, Germanyf School of GeoSciences, University of Edinburgh, Crew Building, Alexander Crum Brown Road, EH9 3BZ, Edinburgh, UKg Dipartimento di Scienze Agrarie, Alimentari e Forestali, Università degli Studi di Palermo, viale delle Scienze ed. 4, 90128 Palermo, Italyh Ithaka Institute for Carbon Strategies, Ancienne Eglise 9, 1974 Arbaz, Switzerlandi Geomicrobiology, Center for Applied Geoscience, University of Tuebingen, Sigwartstrasse 10, 72076 Tuebingen, Germanyj Solid State and Elemental Analysis Unit, Mark Wainwright Analytical Centre, University of New South Wales, Kensington, NSW 2052, Australiak United States Department of Agriculture, Agricultural Research Service, Soil and Water Management Unit, 1991 Upper Buford Circle, St. Paul, MN, USAl Institute of Soil, Water and Environmental Sciences, The Volcani Center, Agricultural Research Organization, P.O.B. 15159, Rishon LeTzion 7528809, Israel
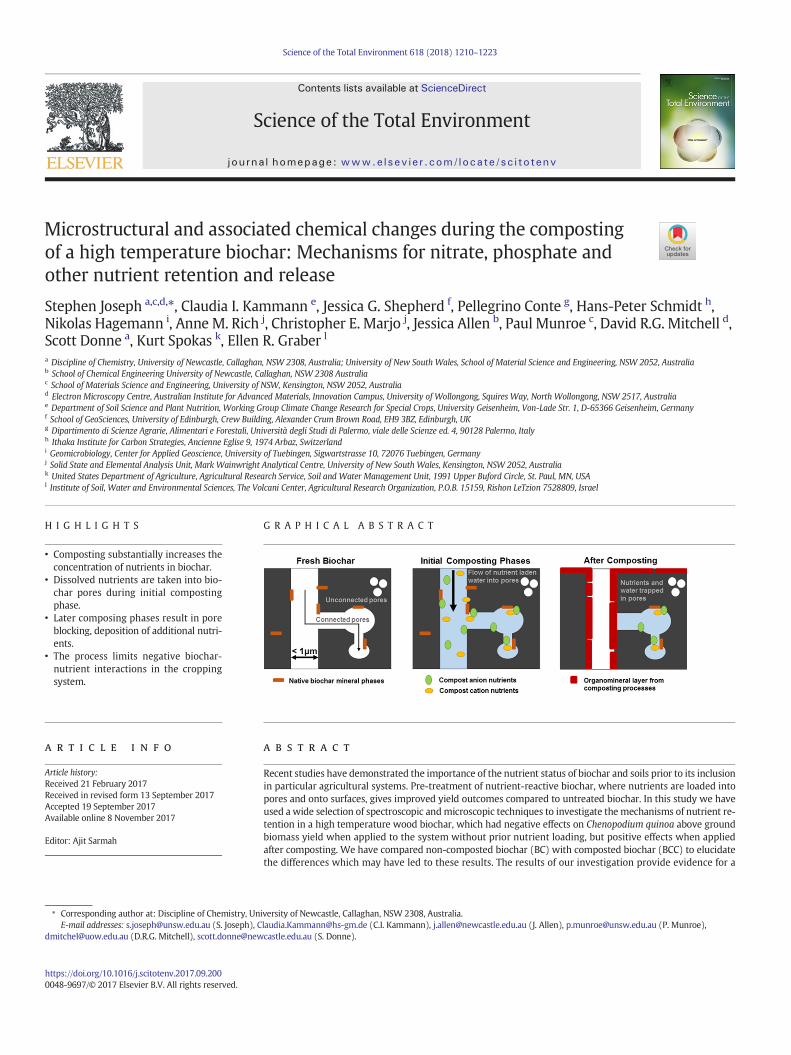
H I G H L I G H T S G R A P H I C A L A B S T R A C T
• Composting substantially increases theconcentration of nutrients in biochar.
• Dissolved nutrients are taken into bio-char pores during initial compostingphase.
• Later composing phases result in poreblocking, deposition of additional nutri-ents.
• The process limits negative biochar-nutrient interactions in the croppingsystem.
⁎ Corresponding author at: Discipline of Chemistry, UnE-mail addresses: [email protected] (S. Joseph), C
[email protected] (D.R.G. Mitchell), scott.donne@new
https://doi.org/10.1016/j.scitotenv.2017.09.2000048-9697/© 2017 Elsevier B.V. All rights reserved.
a b s t r a c t
a r t i c l e i n f oArticle history:Received 21 February 2017Received in revised form 13 September 2017Accepted 19 September 2017Available online 8 November 2017
Editor: Ajit Sarmah
Recent studies have demonstrated the importance of the nutrient status of biochar and soils prior to its inclusionin particular agricultural systems. Pre-treatment of nutrient-reactive biochar, where nutrients are loaded intopores and onto surfaces, gives improved yield outcomes compared to untreated biochar. In this study we haveused a wide selection of spectroscopic andmicroscopic techniques to investigate the mechanisms of nutrient re-tention in a high temperature wood biochar, which had negative effects on Chenopodium quinoa above groundbiomass yield when applied to the system without prior nutrient loading, but positive effects when appliedafter composting. We have compared non-composted biochar (BC) with composted biochar (BCC) to elucidatethe differences which may have led to these results. The results of our investigation provide evidence for a
iversity of Newcastle, Callaghan, NSW 2308, [email protected] (C.I. Kammann), [email protected] (J. Allen), [email protected] (P. Munroe),castle.edu.au (S. Donne).
1211S. Joseph et al. / Science of the Total Environment 618 (2018) 1210–1223
complex series of reactions during composting, where dissolved nutrients are first taken up into biochar poresalong a concentration gradient and through capillary action, followedby surface sorption and retention processeswhich block biochar pores and result in deposition of a nutrient-rich organomineral (plaque) layer. The lack ofsuch pretreatment in the BC samples would render it reactive towards nutrients in a soil-fertilizer system, mak-ing it a competitor for, rather than provider of, nutrients for plant growth.
© 2017 Elsevier B.V. All rights reserved.
Keywords:Composted biocharBiochar nutrient interactionsPhosphorus and nitrogen captureSoil amendments
1. Introduction
Many studies have been undertaken to examinehow the applicationof biochar can affect crop yields (i.e. Liu et al., 2013). Recent studies haveshown that pyrolysing biomass with minerals, and/or post-treating thebiochar through either oxidation (e.g. aerobic composting) and/orthrough the addition of minerals can significantly increase crop yields(Nielsen et al., 2014; Ogawa and Okimori, 2010; Ye et al., 2016). Khanet al. (2016) found that composting could increase cation exchange ca-pacity (CEC) and showed a strong affinity for C, N and S although theyalso found that under some treatments the biochars could lose B, Mgand S. However, there is currently only a very limited understandingof the underlying processes on a molecular level. In particular, themechanisms of nitrate and phosphate release from co-composted bio-char are generally unknown. In this study, we follow up on the studyof Kammann et al. (2015) and perform further spectro(micro)scopicanalysis of the co-composted biochar used in their study.
Kammann et al. (2015) observed that high temperature biochar,prepared from scrap wood (of which some was partially covered withsoil, rich in oxides of Al, Si, Fe and containing some Mn), applied at ahigh rate of 2% (w/w) with low mineral fertilization (28 kg N ha−1
fromWuxal Super NPK liquid fertilizer) in a glasshouse experiment sig-nificantly reduced above ground biomass yield of Chenopodium quinoacompared with an equally fertilized control with no biochar. They alsoobserved reduced nitrate leaching in biochar-soil leaching experiments.Interestingly, the above ground biomass yield reductions also occurredwith high dosage application of the same commercial fertilizer, howev-er, the strongest reduction occurred in the treatment with the lowestnutrient supply. This lead to the hypothesis that reduced nutrient avail-ability was responsible for the growth reduction. The biochar in ques-tion also had been used as a compost additive in a windrow-composting with daily turnover (mechanical aeration) during the ther-mophilic phase (Schmidt et al., 2014). After the compost was mature,biochar pieces were separated from it and used in the quinoa growthstudy (Kammann et al., 2015). The purpose of the studywas to examinewhether the changes that the biochar underwent during compostingwould make a difference to the observed impact on plant above groundbiomass yield. Upon adding the separated composted biochar in con-junctionwith low or high application of N, above ground biomass yieldswere increased by 305% and 160%, respectively, compared to the no bio-char control (Kammann et al., 2015). Electro-ultrafiltration and sequen-tial biochar-particle washing revealed that pre-composted biochar wasnutrient-enriched, particularly with the anions nitrate and phosphate.The study also found that the composted biochar retained 2 to5.3 g NO3 kg−1 (after sequential washing) compared with nearly no ni-trate in the fresh biochar; also, the extractable P content of the biocharwas doubled by co-composting. Interestingly, standard extraction pro-tocols, i.e. 1 h shaking with de-ionized water or 2 M KCl solution,underestimated the biochar nitrate content. Similar but smaller differ-ences were found for Norg (total organic N) and NH4
+. Prost et al.(2013) co-composted biochar in litterbags that were harvested and in-vestigated at different times throughout the composting process. Theywere the first to document that the biochars used (charcoal and gasifierbiochar) were loaded with nutrients assumed to be from the composting;noting that thematuring phase, in particular, was important in this regard.In this earlier study, however, no plant growth experimentwas carried out.Moreover, standard (soil) methods of nutrient extraction may have
underestimated the total amount of nitrate taken up by the biochar(Kammann et al., 2015). Recently, Haider et al. (2016) demonstrated thatsequential extractions are necessary to remove all of the nitrate from bio-char particles, and thus current methodologies likely underestimate bio-char nitrate capture potential. This entrapment of nitrate may shed newlight on results that mostly attribute missing (nitrate-)N to microbial im-mobilization (e.g. Güereña et al., 2015).
Basedon thesefindings, herewecharacterized theexternal and internalbiochar surfaces from the Kammann et al. (2015) study. Our goals were toelucidate the mechanisms that explain: (i) the ability of the non-composted biochar to capture and hold N and P compounds and/or ions,(ii) the increased capacity for capture and slower release of N and P fromthe composted biochar, and (iii) the increase in dissolved organic carbon(DOC) in the biochar. Emphasis has been placed on examining the changesin the mineral and organic phases on the external and internal surfaces ofthe composted biochar to determine themechanisms that may be respon-sible for nutrient capture and release, causing the contrasting impacts onplant yield of the untreated versus composted biochar.
In this study we use the term “organomineral layer” to describe theamorphous associations of C, O and mineral elements identified on thesurfaces of the composted biochar. Similar terms have been used in pre-vious studies (e.g. Archanjo et al., 2017), while other studies have re-ferred to these layers as “plaques” (e.g. Zheng et al., 2012).
2. Materials and methods
2.1. Biochar and compost production
Biochar was produced from woody chips (80% coniferous, 20% de-ciduous wood) by Carbon Terra (formerly German Charcoal GmbH,Wallerstein, Germany) in vertical retorts. These chips were derivedfrom tree waste and as such likely contained entrained soil. Thiswould explain the detectable concentrations of Al, Si, Mn, Fe, and O ob-served in the biochar (Supplementary Tables 1 and 2).
The biochar was produced over 36 h at an average pyrolysis highesttreatment temperature of approximately 700 °C. The highest treatmenttemperatures of approximately 850 °Cwere reached for a short final pe-riod just before the biochar was quenched with water. This biochar hada carbon content of 75.8%, H/Corg ratio of 0.21 and, considering thewoodfeedstock, a high ash content (16.3% dry basis). The pH was 9.5 and theBET N2 surface area was 144 m2 g−1. More specific details are given inKammann et al. (2015).
Methods used for composting and separating the composted biocharpieces and themethods of chemical analysis of the samples are given inSchmidt et al. (2014). The compost feedstock consisted of animal ma-nures, straw, stone meal, soil, biochar (BC) and mature compost, andthe composting process was carried out with daily turnover duringthe thermophilic phase. The properties of the composted biochar weredetailed in Kammann et al. (2015).
2.2. Microscopic and spectroscopic characterization of BC and BCC surfaceproperties
Characterization of BC and composted biochar (BCC) surfaces toidentify P and N binding mechanisms was carried out using a numberof spectroscopic and microscopic techniques. Twenty particles werechosen at random from all of the recovered BCC and fresh BC used in
1212 S. Joseph et al. / Science of the Total Environment 618 (2018) 1210–1223
the experiment. Samples for organic functional group determinationwere prepared by crushing a subset of the samples and sieving thosecrushed particles (0.1 mm). X-ray photo-electron spectroscopy (XPS)was carried out on the surface of a whole BCC particle and on a crushedparticle to determine if there was a difference in concentration of N andP on the surface of the biochar particles and in the interior. The equip-ment and procedures used for XPS and Fourier-transform infrared spec-troscopy (FTIR) have previously been detailed in Joseph et al. (2010,2013). Raman spectroscopy was carried out using the procedure andequipment detailed in Bian et al. (2014) and Chia et al. (2012a).
To determine the dimensions of the graphitic nanocrystallites at bio-char surfaces by Raman spectroscopy, the technique described in Jorioet al. (2010) was used. Deconvolution of the graphite and the defect(D-G) bands in the Raman spectra was performed using a Gaussian-Lorenzian function with the crystallite size (La) determined from theG peak full-width at half maximum (TG) using the formula:
La nmð Þ ¼ 560= TG−11½ � ð1Þ
Modified Boehm titrations were performed to determine the distri-bution and content of biochar surface acid groups following the proce-dure in Tsechansky and Graber (2014), whereby dried and weighedbiochar subsamples were sequentially pre-treated with NaOH and HClto remove soluble organic acids and minerals that can interfere withthe titrations. Total acid group concentration (‘total acidity’) is givenby the result for the NaOH reaction base, carboxylic acid group concen-tration by the result for the NaHCO3 reaction base, lactonic acid groupconcentration by the difference between the results for Na2CO3 andNaHCO3 reaction bases, and phenolic acid group concentration by thedifference between results for NaOH and Na2CO3 reaction bases. Themodified method represents maximal acidic functionality, because thepreliminary acid treatment guarantees that all acidic sites are protonat-ed. It also removes all surface adsorbed organic acids as well as acidicminerals, and thereby assumes to provide an assessment of the non-labile solid biochar surface (Tsechansky and Graber, 2014). Mean andstandard deviation of two replicates are reported. Means were com-pared by one-way ANOVA using RealStatistics for Excel (http://www.real-statistics.com/).
To investigate surface and near-surface pore characteristics (whichmay explain the greater retention of nitrates and phosphates in thecomposted biochar compared to its initial zero N and low P content be-fore composting), characteristics of the flow of water into and out of thepores of the biocharwas studied using fast field cycling nuclearmagnet-ic resonance (FFC NMR) relaxometry (Conte and Alonzo, 2013). Onegram each of BC and BCC was suspended in 3 ml of MilliQ-gradewater (resistivity 18.2 MΩ, Merck-Millipore Simplicity 185, Milan,Italy) and subjected to FFC NMR relaxometry investigation.1H NMR dis-persion (NMRD) profiles (i.e., relaxation rates R1 (or 1/T1) vs protonLarmor frequencies, ωL) were acquired on a Stelar Smartracer Fast-Field-Cycling Relaxometer (Stelar s.r.l., Mede, PV–Italy) at a constanttemperature (25 °C). The proton spins were polarized at a polarizationfield (BPOL) corresponding to a proton Larmor frequency (ωL) of8 MHz for a period of polarization (TPOL) corresponding to about fivetimes the T1 estimated at this frequency. After each BPOL application,the magnetic field intensity (indicated as BRLX) was systematicallychanged in the proton Larmor frequency ωL comprised in the range0.01–10.0MHz. The period τ, duringwhich BRLXwas applied,was variedon 32 logarithmically spaced time sets. 8 scans were set, and the T1max,TPOL and Recycle Delay (RD) were adjusted at every relaxation field inorder to optimize the sampling of the decay/recovery curves.
Free induction decays (FIDs)were recorded following a single 1H 90°pulse applied at an acquisition field (BACQ) corresponding to the protonLarmor frequency of 7.20 MHz. A time domain of 100 μs sampled with512 pointswas applied. Field-switching timewas 3ms,while spectrom-eter dead time was 15 μs. A non-polarized fast field cycling (FFC) se-quence was applied when the relaxation magnetic fields were in the
range of the proton Larmor frequencies (10.0 to 3.6 MHz), whereas apolarized FFC sequence was applied in the proton Larmor frequenciesBRLX range (3.0–0.01 MHz) (Kimmich and Anoardo, 2004).
Laser ablation inductive-coupled plasma mass spectrometry (LAICP-MS)was carried out on a sample of BC andBCC to investigate the re-lationship between P binding and mineral content of the biochar. Thetechnique was used to determine semi-quantitative concentrations ofP, C, Na, Mg, Al, Si, K, Ca, Mn, Fe, Cu and Pb at individual locations (upto 92 locations, spot size 110 μm) for each of 3 (BCC) or 4 (BC) lines(laser beam wavelength of 213 nm, repetition frequency of 10 Hz,laser energy density of 0.48 J cm−2 (at 30%), scan speed of 20 μm s−1)on both biochar samples, as described in (Bian et al., 2014). ICP-MSwas performed at Rf power of 1150 W, helium gas flow rate of0.8 l min−1, argon gas flow rate of 0.6 l min−1, in peak hopping scanmode and with a dwell time of 0.05 s. NIST610 and NIST612 glass stan-dards were used to estimate elemental concentrations. R-Studio wasused to determine the correlation between P and C, Na, Mg, Al, Si, K,Ca, Mn, Fe, Cu and Pb for both BC and BCC (RStudio Team, 2015).Pearson's product-moment correlation coefficient was used to deter-mine correlations between P and the other elements analyzed, exceptwhere one or more sets of data were not normally distributed, inwhich case Spearman's rho was used. As no strong relationships be-tween elemental concentrations were elucidated using this analysisfor BC, a Principal Component Analysis (PCA) of the datawas performedusing the prcomp function in R-Studio (R Core Team) with data center-ing, scaling and a tolerance of 0.2 to limit the number of principal com-ponents (PCs) identified, therefore giving those PCs which explain themaximum variability in the dataset.
Microscopic examination of the pores and the external surfaces ofthe biochars was carried out using a Zeiss Sigma scanning electron mi-croscope (SEM) fitted with a Bruker energy dispersive x-ray (EDS) ana-lyzer as described in Joseph et al. (2013). Both transmission electronmicroscopy (TEM) and scanning transmission electron microscopy(STEM) providing detailed microstructural, crystallographic andmicrochemical analysis were carried out using a JEOL 2100 Transmis-sion Electron Microscope (TEM) fitted with an Oxford EDS, a JEOLARM200F aberration corrected TEM fitted with an Electron EnergyLoss spectrometer (EELS) and EDS detector and a Phillips CM200 TEMfitted with EDS. Selective area electron diffraction (SAED) was carriedout using the JOEL 2100TEManddetermination of the Fe EELS oxidationstate was carried out on the JEOL ARM as per Quin et al., 2015.
To determine the relative redox activity of the BC and BCC, solid stateCyclic Voltammetry was undertaken. Electrochemical investigationswere performed using a custom-built electrochemical cup-cell. Thefull cycle was repeated three times. A scan rate of 0.02 mV s−1 wasused. Further details of the equipment and method of analysis is givenin Joseph et al. (2015). The BC or BCCwas first combined using amortarand pestle in a black-mix consisting of graphite 78 wt% (KS6-TimrexSwitzerland), 8 wt% biochar and 14 wt% of a neutral electrolyte(0.05 M K2HPO4 and 0.05M KH2PO4). 0.2 g of themix was then pressedunder 1200 psi in the bottom of the cup-cell with paper dividers used toprevent it from adhering to the compaction ram. The method started ata potential of 0.1 V vs Standard Calomel Electrode (SCE) and cycling to anegative potential of−0.5 V before returning to a higher potential thanthe initial start potential of 0.4 V.
3. Results
3.1. Mineral composition of BC and BCC
There are substantial chemical differences between BC and BCCwhich reflect the accumulation of minerals in the pores and on the sur-faces of the BCC. The predominant elements in the BC are Ca, Fe and Kwith small quantities of P, Mg, Mn, Na and Al and smaller amounts ofmicronutrients (Zn, B, Cu, Mo) and heavy metals (Ni, Cr). There was astatistically significant increase in the quantity of most of the elements

1213S. Joseph et al. / Science of the Total Environment 618 (2018) 1210–1223
after composting (Supplementary Information Table 1). Fe, Mg, P, K, B,Co, Cu, Mo, Ni doubled and there was a 4-fold increase in Al and an 8-fold increase in Na. Cr levels have more than doubled. Further researchis required to determine the mechanisms for the significant increase inits capture. Detailed LA-ICPMS, FFC NMR, SEM and TEM examination ofthe pores and the surfaces of the fresh and aged biochar allowed identi-fication of the minerals and inorganic compounds.
3.2. SEM and TEM/STEM characterization of the fresh biochar
BC had a considerable amount of mineral matter on its surface(Fig. 1A) and inside the pores (Fig. 1B). The EDS spectrum of this miner-al layer is consistent with interaction of soil minerals that can includeclay, oxides of Al, Si, Fe, Mn andpossibly CaCO3with thewood feedstockduringpyrolysis (Joseph et al., 2013; Rawal et al., 2016). Fig. 1D providesa higher magnification image of this mineral layer and Fig. 1C is an EDSanalysis of themineral content. There is a considerable concentration ofSi, K, Fe, Mn, Al, Ca and S, suggestive of soil contamination in the biocharfeedstock. Supplementary Fig. 1 details the mineral structure in onesmall area of this biochar. There are a series of Si nodules which appearto have formed, with which P is associated. Fe and Mn compounds ap-pear to have formed on the carbon matrix. There is an area high in Sand another high in P where Fe/P and Fe/S mineral phases may haveformed. Potassium, Ca and Mg are associated with the phase identifiedwhich was high in Fe and Mn (Fig. 1).
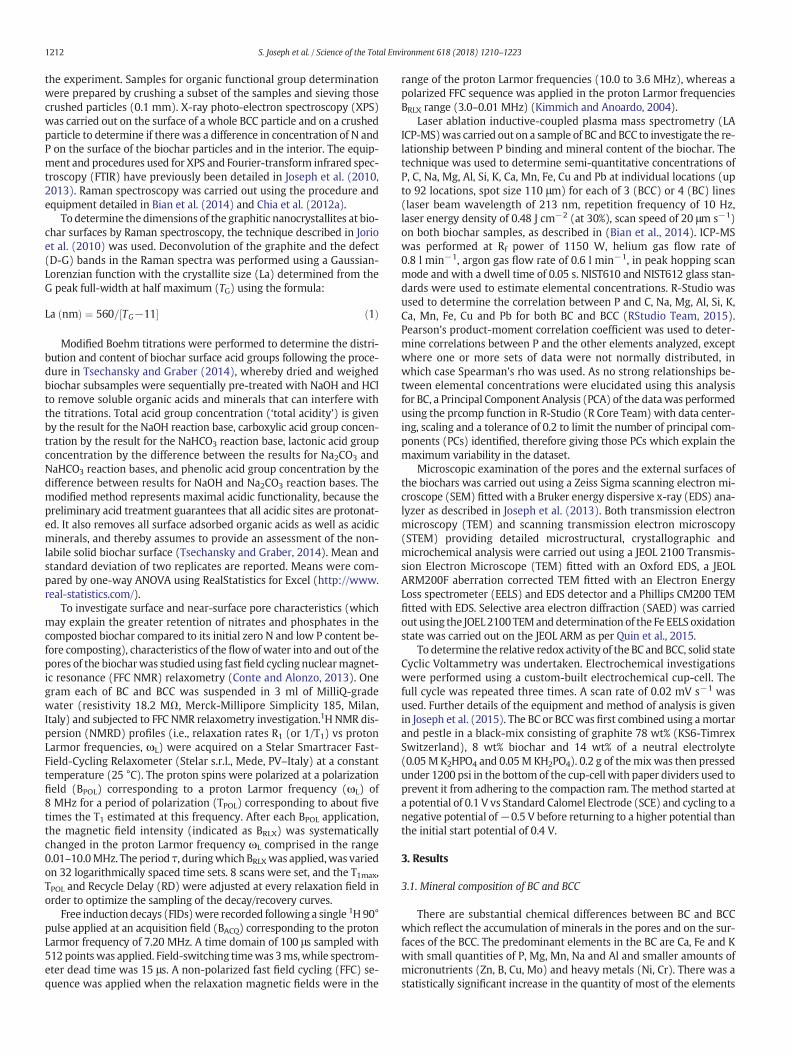
Analysis of over 20 particles of BC by TEM supports the observationthat soil was entrained on thewood before pyrolysis resulting in the for-mation of submicron inorganic/mineral phases on the surfaces of thebiochar. Fig. 2 shows representative images of some of the differentstructures observed on the surface of the carbonmatrix. Porous hetero-geneous inorganic phases can be seen to have formed on the surfaces.Fig. 2A, B and C indicate that there is considerable porosity between arange of different mineral particles which have dimensions rangingfrom 50 nm to b10 nm. Similarly the pore shapes and dimensions areheterogenous. Fig. 2D shows another area where the inorganic phasesare physically larger and appear to have fused together, potentially dur-ing pyrolysis. Supplementary Fig. 2A shows graphitic planes formedaround a 5 nm particle rich in Fe. The amorphous phase between theFe and the outer graphitic planes has a high C content with a small con-centration of Ca (Supplementary Fig. 2B). The structure observed inSupplementary Fig. 2C is probably hollow carbon shells formed duringthe pyrolysis process as previously observed by McDonald-Wharryet al. (2015). Zhang et al. (2012) proposed that dissolved phosphateand nitrates can be adsorbed into these voids. The structure in Supple-mentary Fig. 2D is a porous amorphous C matrix with a range of sub-5 nmmineral phases containing Al, Si, Fe, Ca, P, and K detected by EDS(data not shown).
3.3. SEM and TEM characterization of the composted biochar (BCC)
3.3.1. SEM characterizationSEM imaging shows that sections of the external surfaces of the bio-
char andmany of the internal macro- andmicropores of BCC are coatedwith a layer (rich in C and inorganic/mineral matter) with some evi-dence of fungi growth (Fig. 3A and D) (Vanek and Lehmann, 2015).The morphology of the surface of the composted sample is different tothat observed in Fig. 1 and Supplementary Fig. 1. The surface coatingof theBCC has a high concentration of C, Si andO and detectable concen-trations of N, P, Fe, Al, Mg, Ca, Cl, and S (Fig. 3B) when compared to BC.
Table 1Acidic functional groups on non-composted and co-composted biochar as determined by Boeh
Sample Carboxylic acid groups (mmol g−1)
BC (n = 2) 0.08 ± 0.029BCC (n = 4) 0.11 ± 0.009
There are detectable differences on the samples examined between theintensity of peaks in the EDS spectra someof the elements (Al, Ca, Si, K, PandN) in the BCC comparedwith the BC. Fig. 3F is a high resolutionmapof the compounds containing N on the surface of BCC surface. Other de-tected elements in the area included C, O, Al, Si, Fe, K, P, Na, andMg, andonce again a low-concentration of Cl. Some of the pores in the carbonmatrix have a very thin layer of the inorganic/mineral phases on theirsurfaces, while other pores appear to have been coated, resulting in apotential decrease in the pore volume (Fig. 3C). The remnants of thevascular structure from the original feedstock can be seen in the surfaceof BCC in Fig. S3A. It appears to be rounded and in some cases broken orfragmented when compared with the sharp inner vascular structurenoted in Supplementary Fig. 3B. The spectro-microscopic evidence indi-cates that complex chemical and physical processes are taking place onthe external and internal pores of the biochar as redox, pH and temper-ature varies through the composting process and physical turning oc-curs. It is also possible that some micro-fracturing of biochar hasoccurred as suggested by Spokas et al. (2014).
3.3.2. STEM and TEM characterization of the surfaces of the BCCFig. 4 and Supplementary Figs. 4, 5 and 6 are STEM images and EDS
analyses of the organomineral layers on the BCC surfaces. Supplementa-ry Fig. 6A and B is a high-resolution image of one of the micro-agglomerates formed on the biochar surface. The EDS analysis indicatesbinding of b10 nm minerals/inorganic compounds comprising mainlyO, Ca, P, Al, Si, Fe and Mg bound together again by C compounds.Fig. S7 is a phase map which indicates that the agglomerates havequite different compositions. The phase map shows where a specificgroupofminerals and/or inorganic compounds are localised in a specificregion of the organomineral layer. The green phase at the bottom of theSupplementary Fig. S7C has a high concentration of C, O, Ca, P, Fe, Al andSi. The blue phasemainly consists of Fe, O, C, Ca and the red phase has ahigh content of C, Ca andO and smaller amounts of K, P, Si and Al. A sim-ilar complex pattern is noted in the line scan of elements across a thinsection of the area imaged (Supplementary Fig. 4B). This analysis indi-cates the formation of a porous micro-agglomerate associations boundtogether by C compounds on some of the surfaces of the biochar. The in-terface between each of the micro-agglomerates is very porous andthere appears to be only a few regions bound to the biochar or to eachother.
Fig. 5A illustrates the formation of a poorly ordered graphitic struc-ture around an Fe/O nanoparticle (analysed by TEM-EDS, data notshown) inside the carbon matrix of the co-composted biochar. Fig. 5Bis a bright field image of a thin layer of amorphous C material that hasformed around a Fe/O nanoparticle on the organomineral surface layeron the biochar. Fig. S3 is a high-resolution image of a Fe/O particle.The EDS and SAED patterns (Fig. S7B and S7D) identify the iron phaseas magnetite (Chen et al., 2011). These structures could have formeddue to adsorption of organic molecules on the magnetite as proposedby (Kleber et al., 2007) for the interaction of iron oxides present in soiland soil organicmatter. It could also be due to abiotic and/or biotic reac-tions on the nanoparticle surfaces (Bauer and Knoelker, 2015; Harvieet al., 1984; Lee et al., 2008).
EDS and SAED analysis indicates that minerals and inorganic com-pounds in these micro-agglomerates could consist of Al2O3, SiO2,Fe3O4, Fe2O3, FePO4, CaCO3, CaPO4, KCl, clay, and possibly gypsum,MgCO3, FeS, FeSO4. Further detailed analysis is required to positivelyidentify the specific compounds and minerals.
m titration. Data presented as average ± standard error (SE).
Lactonic acid groups (mmol g−1) Phenolic groups (mmol g−1)
0.13 ± 0.034 0.04 ± 0.0180.13 ± 0.014 n.d.

A B
C D
Fig. 1. Secondary electron images and EDS spectra of fresh biochar (BC) showing: A) High surface mineral content; b) Lateral view of A) showing mineral matter in the pores; C) EDSspectrum of the sub-region of B0 shown in D); D) Detailed view of sub-area highlighted in B, the average EDS spectrum of which is shown in C).
1214 S. Joseph et al. / Science of the Total Environment 618 (2018) 1210–1223
3.3.3. High resolution imaging of the pore structureFig. 4 illustrates the pore structure of the organomineral layer (lower
left, Fig. 4A) that formed on the surface of the biochar (upper right,Fig. 4A) during composting. Fig. 4B is a micrograph of the interface be-tween the biochar and the organomineral phase showing the range ofpore sizes. EDS analysis (data not shown) reveals that the bright areasare minerals or inorganic compounds high in Si and Fe and the lightgrey areas are thin layers or potentially organic compounds. Supple-mentary Figs. 4C and 5C indicate that there are still b50 nm pores inthe biochar carbon matrix after composting that do not appear to haveinorganic or organic compounds attached to their walls. Due to samplepreparation, we cannot assign these pores to their original position inthe biochar particle (outer surface vs core of the particle). Fig. 4D is aSTEM SE image of a very porous layer that could have formed inside alarger pore of the biochar during composting.
Supplementary Fig. 5A shows that the pore structure is very differ-ent in an expanded Al/Si/O (probably clay) mineral compared withpores in the carbon matrix (Supplementary Fig. 5C). SupplementaryFig. 5B is a slice through a section of the organomineral layer on the sur-face of thewood biochar. The dark areas aremineral and thewhite areaspores. The grey areas are the carbon structure. It can be seen that thepore size, shape and composition is heterogeneous with some pore sur-faces composed of a carbon matrix with a small number of mineralnanoparticles that occupy part of the pore surface.
3.3.4. Summary of STEM and TEM characterizationTo summarize the examination of the internal and external surfaces
of the fresh biochar (BC), TEM and SEM indicate that:
a. There are very largemacropores (diameter N 1 μm) that have formedwhen the phloem and xylem in the wood have been pyrolysed(Fig. 3); however, these structures also exist in the original feed-stocks. There are also a substantial number of smaller macropores(diameter b 100 nm) and mesopores (2–50 nm) of varying sizesthat could connect the macropores (Supplementary Fig. 5). Micro-pores (b2 nm) cannot be imaged by means of even state-of-artSTEM or SEM, although they must have contributed to the specificsurface area according to BET measurements.
b. Mixed mineral phases, probably originating from soil that was onthe surface of the wood before pyrolysis, have dimensions ofb50 nm. These phases are on the biochar surface and are eithersintered together or bound with the carbon. Pore diameters in thislayer vary from b5 to 50 nm (Supplementary Fig. 4).
c. Some of themesopores are associatedwith the formation of graphit-ic carbon shells near to Fe/O nanoparticles with a total diameterb 10 nm.
d. There aremicropores andmesopores (diameter b 50 nm) existing inthe carbon matrix that do not appear to be interconnected(i.e., dead-ended pores).
To summarize the examination of the internal and external surfacesof the composted biochar (BCC), TEM and SEM indicate that:
a. Porous micro-agglomerates have formed on the external and inter-nal surfaces of the biochar. These micro agglomerates are composedof minerals and inorganic compounds bound together with C com-pounds (Fig. 4, Supplementary Figs. 4 and 5).
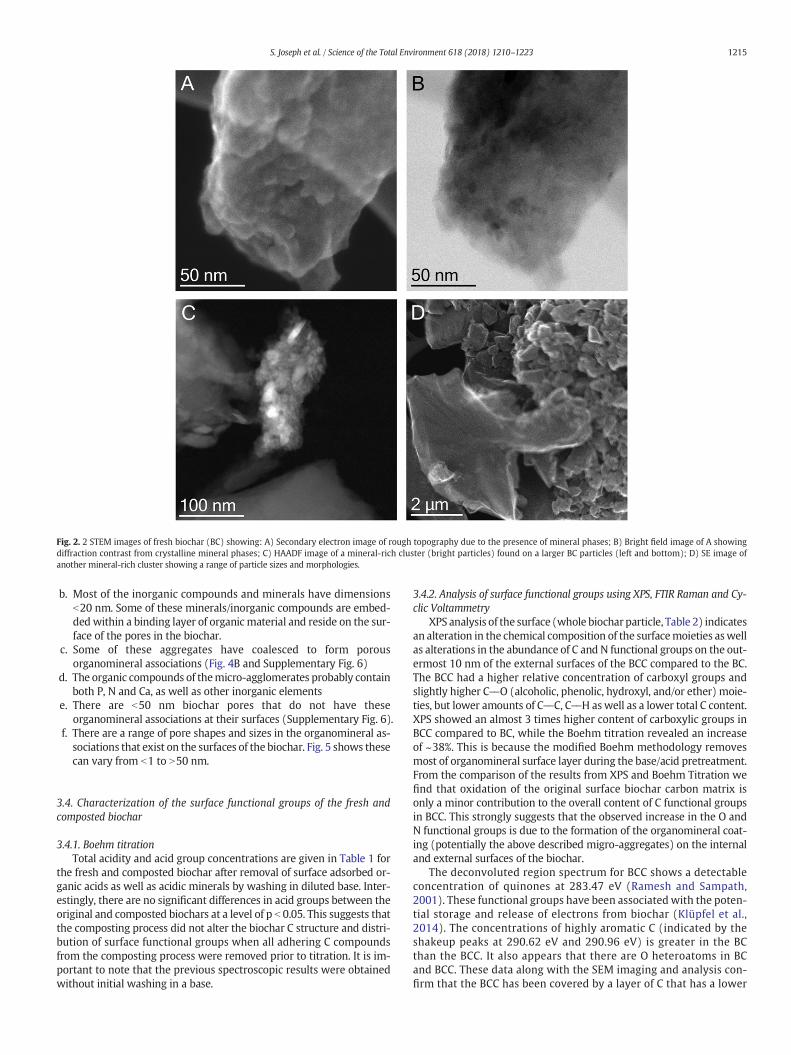
Fig. 2. 2 STEM images of fresh biochar (BC) showing: A) Secondary electron image of rough topography due to the presence of mineral phases; B) Bright field image of A showingdiffraction contrast from crystalline mineral phases; C) HAADF image of a mineral-rich cluster (bright particles) found on a larger BC particles (left and bottom); D) SE image ofanother mineral-rich cluster showing a range of particle sizes and morphologies.
1215S. Joseph et al. / Science of the Total Environment 618 (2018) 1210–1223
b. Most of the inorganic compounds and minerals have dimensionsb20 nm. Some of these minerals/inorganic compounds are embed-dedwithin a binding layer of organic material and reside on the sur-face of the pores in the biochar.
c. Some of these aggregates have coalesced to form porousorganomineral associations (Fig. 4B and Supplementary Fig. 6)
d. The organic compounds of themicro-agglomerates probably containboth P, N and Ca, as well as other inorganic elements
e. There are b50 nm biochar pores that do not have theseorganomineral associations at their surfaces (Supplementary Fig. 6).
f. There are a range of pore shapes and sizes in the organomineral as-sociations that exist on the surfaces of the biochar. Fig. 5 shows thesecan vary from b1 to N50 nm.
3.4. Characterization of the surface functional groups of the fresh andcomposted biochar
3.4.1. Boehm titrationTotal acidity and acid group concentrations are given in Table 1 for
the fresh and composted biochar after removal of surface adsorbed or-ganic acids as well as acidic minerals by washing in diluted base. Inter-estingly, there are no significant differences in acid groups between theoriginal and composted biochars at a level of p b 0.05. This suggests thatthe composting process did not alter the biochar C structure and distri-bution of surface functional groups when all adhering C compoundsfrom the composting process were removed prior to titration. It is im-portant to note that the previous spectroscopic results were obtainedwithout initial washing in a base.
3.4.2. Analysis of surface functional groups using XPS, FTIR Raman and Cy-clic Voltammetry
XPS analysis of the surface (whole biochar particle, Table 2) indicatesan alteration in the chemical composition of the surfacemoieties aswellas alterations in the abundance of C and N functional groups on the out-ermost 10 nm of the external surfaces of the BCC compared to the BC.The BCC had a higher relative concentration of carboxyl groups andslightly higher C\\O (alcoholic, phenolic, hydroxyl, and/or ether) moie-ties, but lower amounts of C\\C, C\\H aswell as a lower total C content.XPS showed an almost 3 times higher content of carboxylic groups inBCC compared to BC, while the Boehm titration revealed an increaseof ~38%. This is because the modified Boehm methodology removesmost of organomineral surface layer during the base/acid pretreatment.From the comparison of the results from XPS and Boehm Titration wefind that oxidation of the original surface biochar carbon matrix isonly a minor contribution to the overall content of C functional groupsin BCC. This strongly suggests that the observed increase in the O andN functional groups is due to the formation of the organomineral coat-ing (potentially the above described migro-aggregates) on the internaland external surfaces of the biochar.
The deconvoluted region spectrum for BCC shows a detectableconcentration of quinones at 283.47 eV (Ramesh and Sampath,2001). These functional groups have been associated with the poten-tial storage and release of electrons from biochar (Klüpfel et al.,2014). The concentrations of highly aromatic C (indicated by theshakeup peaks at 290.62 eV and 290.96 eV) is greater in the BCthan the BCC. It also appears that there are O heteroatoms in BCand BCC. These data along with the SEM imaging and analysis con-firm that the BCC has been covered by a layer of C that has a lower
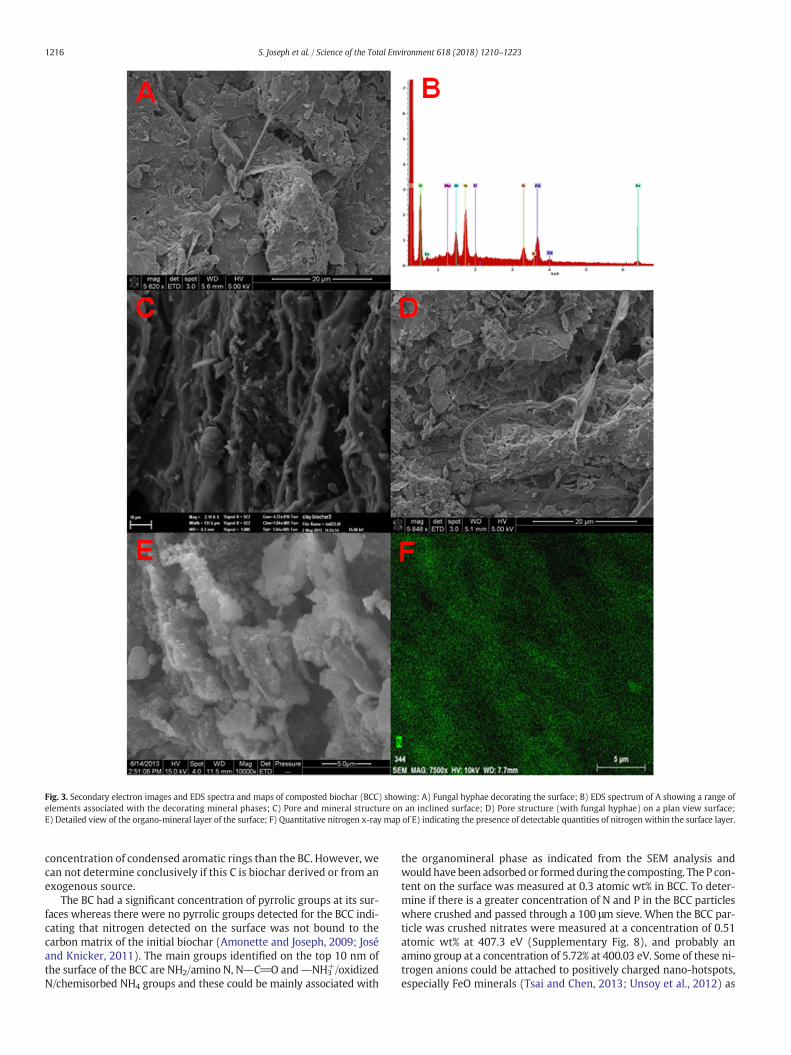
Fig. 3. Secondary electron images and EDS spectra and maps of composted biochar (BCC) showing: A) Fungal hyphae decorating the surface; B) EDS spectrum of A showing a range ofelements associated with the decorating mineral phases; C) Pore and mineral structure on an inclined surface; D) Pore structure (with fungal hyphae) on a plan view surface;E) Detailed view of the organo-mineral layer of the surface; F) Quantitative nitrogen x-ray map of E) indicating the presence of detectable quantities of nitrogen within the surface layer.
1216 S. Joseph et al. / Science of the Total Environment 618 (2018) 1210–1223
concentration of condensed aromatic rings than the BC. However, wecan not determine conclusively if this C is biochar derived or from anexogenous source.
The BC had a significant concentration of pyrrolic groups at its sur-faces whereas there were no pyrrolic groups detected for the BCC indi-cating that nitrogen detected on the surface was not bound to thecarbon matrix of the initial biochar (Amonette and Joseph, 2009; Joséand Knicker, 2011). The main groups identified on the top 10 nm ofthe surface of the BCC are NH2/amino N, N\\C_O and\\NH3
+/oxidizedN/chemisorbed NH4 groups and these could be mainly associated with
the organomineral phase as indicated from the SEM analysis andwouldhave been adsorbedor formedduring the composting. The P con-tent on the surface was measured at 0.3 atomic wt% in BCC. To deter-mine if there is a greater concentration of N and P in the BCC particleswhere crushed and passed through a 100 μm sieve. When the BCC par-ticle was crushed nitrates were measured at a concentration of 0.51atomic wt% at 407.3 eV (Supplementary Fig. 8), and probably anamino group at a concentration of 5.72% at 400.03 eV. Some of these ni-trogen anions could be attached to positively charged nano-hotspots,especially FeO minerals (Tsai and Chen, 2013; Unsoy et al., 2012) as

Fig. 4.A) STEM images of composted biochar showing:A) Secondary electron image of an inclined surface of theparticle (left) showing a highlyporous structure, and surface decoration byorgano-mineral phases formed during composting (right); b) HAADF image showing amineral particle agglomerate (bright). The interface between this particle and the biochar is highlyporous – in this image pores are dark; C) Bright field image showing higher magnification view of the porous surface of the biochar). The 10nm diameter mineral particle (dark in thisimage) is an iron oxide. There is an absence of N10nm pores (bright in this image); D) Secondary electron image of B) showing a highly pitted biochar surface resulting from composting.
1217S. Joseph et al. / Science of the Total Environment 618 (2018) 1210–1223
observed in Supplementary Fig. 6. However, to our knowledge, it is notpossible to confirm this hypothesis here, as the surface charge of thesehotspots cannot be specifically measured with any spectroscopic tech-nique. The concentration of surface P was measured at 0.78 atomicwt%. This would suggest that a substantial amount of the N and the P
Fig. 5. A) TEMBF image of poorly ordered graphitic planes around an Fe/O particle (dark region)the Fe/O particle (evidenced by TEM-EDS, data not shown) in the organomineral layer of BCC.
is contained inside the biochar, which might not be immediately avail-able to the water outside of the particle. This could partially explainwhy some of the N and P is released very quickly when extracted,while a greater percentage of theN is releasedwith each subsequent ex-traction cycle (Haider et al., 2016; Kammann et al., 2015).
in the carbon lattice of the co-composted biochar (BCC) and B) amorphous carbon around

Table 2Measurement of C/O/N functional groups on the surface of BC and BCC.
Name BC BCC
Groups Peak BE(eV)
At.%
Groups Peak BE(eV)
At.%
C 1s C\\C/C\\H 285.02 64.7 C\\C/C\\H 284.96 53.3C 1s C\\O/C\\OC 286.52 11.3 C\\O/C\\OC 286.46 12.9C 1s C_O 288.02 3.4 C_O 287.96 3.2C 1s O_C\\O 289.22 1.6 O_C\\O 289.16 4.4C 1s Shake up peak 290.62 6.2 Shake up peaks 290.96 4.0C 1s Quinone 283.47 0.8O 1s 532.35 11.4 531.99 17.1
NH2/amino type nitrogen 399.11 0.2N 1s Pyrrolic 400.68 1.4 Amine/NH3 400.96 0.3
\\NH3+/oxidized N
chemisorbed NH4
403.08 0.1
K 2p3 n.d. 293.75 2.1
Table 3XPS Survey scan of the major elements on the surface of BC and BCC biochar (wholeparticle).
Name BC BCC
Peak BE At. % Peak BE At. %
C 1s 285.19 83.5 284.81 71.9O 1s 532.55 10.6 531.73 19.2N 1s 400.7 1.4 399.45 0.3Mg 1s 1304.91 0.4 1304.14 0.9Fe 2p 713.02 0.2 712.44 0.2Ca 2p 348.12 0.9 347.65 0.9K 2s 378.45 0.6 378.42 1.9Si 2p 103.39 1.2 102.64 3.1Al 2p 74.97 1.0 74.65 1.3P 2p 134.15 0.2 134.06 0.3
Fig. 6. ATR FTIR spectra of the composted (BCC) and uncomposted (BC) biochar.
1218 S. Joseph et al. / Science of the Total Environment 618 (2018) 1210–1223
The concentration of K on the surface of the BBC was three timeshigher than that of BC. It is probable that this K was from salts presentin the compost pile, as observed by Prost et al. (2013). The SEM andTEM EDS analyses indicate that K salts have precipitated out or beenadsorbed through cation exchange with the functional groups eitherin the organomineral layer and/or the biochar. Except for Fe, concentra-tions of allmineral elementswere higher on the outer surface of the BCCthan in the crushedwhole sample analyses (Table 3) indicating adsorp-tion/precipitation/agglomeration onto the biochar during composting.
The baseline-correctedATR-FTIR spectrum(Fig. 6) of theBC is unusualfor a high temperature biochar. Most high temperature biochars have lit-tle functionality and thus their spectrum contains few intense peaks (Liuet al., 2015). However this biochar has a spectrum very similar to that ofan activated carbon that has been treated by ester hydrolysis in an alka-line environment to produce hydrophilic surfaces that bind water by hy-drogen bonding (Yao et al., 2014). It has peaks associated with C_O,C\\O, COO\\, OH and carbonates as well as aromatic C. The baseline-corrected ATR-FTIR spectrum (Fig. 6) of the BCC shows as in the BC anumber of broad overlapped peaks between 1800 and 650 cm−1, indica-tive of mineral and organic matter (Guan et al., 2007). The band at3369 cm−1 band is coincident with the ν(OH) bands of water, carboxylicacids, and hydrated clay minerals. The peak at ~3200 cm−1 is character-istic of aromatic C\\H stretching [ν(CH)]. A small shoulder at 1712 cm−1
can be assigned to functional groups containing C_O groups and thestronger peak at 1581 cm−1 can be assigned to the C_C vibrationfound in aromatic ring deformation modes (Chia et al., 2012a). These ar-omatic peaks are considerably stronger in the fresh biochar.
Representative peaks for the adsorption of nitrate on minerals havebeen noted in Rubasinghege and Grassian (2013) at around 3390 cm−1,1433 cm−1 and 1339–1380 cm−1. The peak at 1581 cm−1 in the BCsample is not observed in the BCC sample. Another notable differenceis the increase in peak intensity of the BCC at 1433–1375 cm−1 possiblyindicating adsorption of nitrates in the organomineral layer and a broadpeak around 1064 cm−1, which is usually associated with C\\Ostretching of organic polysaccharides (Cheng et al., 2006). On theother hand, this peak is also characteristic of inorganic carbonates, butinterpretation is often complicated due to the overlap with mineralSi\\O stretching frequencies and shifting in the frequency as a functionof the interaction of the carbonate-oxygen atomswith surface complex-ation (Jolivet et al., 2011; Wijnja and Schulthess, 1999). Nevertheless, ifwe look at the entire BCC spectra, theν1-stretch andν3-stretch of CO3
2– couldbe assigned to the dominant peaks in the BCC, with the peak at872 cm−1 attributed to the ν2 in-plane bend of –CO3 (872 cm−1)(Wijnja and Schulthess, 1999). In addition, the presence of peaks at872 cm−1, 820 cm−1 and 755 cm−1 indicate calcite and silica in theBCC, which agree with the XPS elemental analysis. These compoundswere observed in the SEM and TEM.
The D-G bands in the Raman spectra (Fig. 7) of the BC sampleshowed an optimum fit to five mixed Gaussian-Lorenzian functions,
then the cross-sectional particle size for a bimodal distribution calculat-ed using a G1 peak at 1607 cm−1, FWHM (Full width half maximum)49 cm−1 = 15 nm, G2 1583 cm−1, FWHM 77 cm−1 = 9 nm (Jorioet al., 2012). Similarly, the D-G bands in the Raman spectra of the BCCwere fitted to five mixed Gaussian-Lorenzian functions, then the crosssectional particle size for a bimodal distribution calculated using a G1peak at 1598 cm−1, FWHM 63 cm−1 = 11 nm, G2 1542 cm−1, FWHM226 cm−1 = 3 nm (Jorio and Cançado, 2012). The crystallite sizerange of the BC of 9–15 nm is typical of charcoals (7–11 nm) (Ribeiro-Soares et al., 2013)whereas the BCC 3–11nm ismore typical of biocharsand black carbon that have a significant coating of organomineralmicroaggregates as found in Terra Preta soil particles (2–8 nm) (Chia et al.,2012b; Ribeiro-Soares et al., 2013).
Cyclic Voltammetry is a technique that determines whether thereare compounds/molecules that can be readily oxidized at the potentialthat exists in soils (Joseph et al., 2015). Fig. 8 clearly shows that the BCdoes not undergo oxidation at normal voltages that are measured insoils (0.4 V vs Standard Calomel Electrode (SCE)), even after cyclingthree times. However, after cycling three times the BCC starts to oxidizeat a voltage of 0.08 V, indicating that some redox activity does occur,such as oxidation of labile organic molecules or elements that canhave different oxidation states (Fe, Mn). This behavior was also ob-served by Ramesh and Sampath (2001) on exfoliated graphite thatwas coatedwith different types of quinones. Oxidation has also been at-tributed to the change in oxidation state of Fe/O nanoparticles and theoxidation and/or reduction of N, S, P and C compounds (Joseph et al.,2015).
3.4.3. (FFC) NMR relaxometryFig. 9 reports the nuclear magnetic resonance dispersion (NMRD)
profiles (i.e. R1 = 1/T1 values vsωL) of the water-saturated compostedand original biochar samples. BCC reveals shorter proton longitudinal
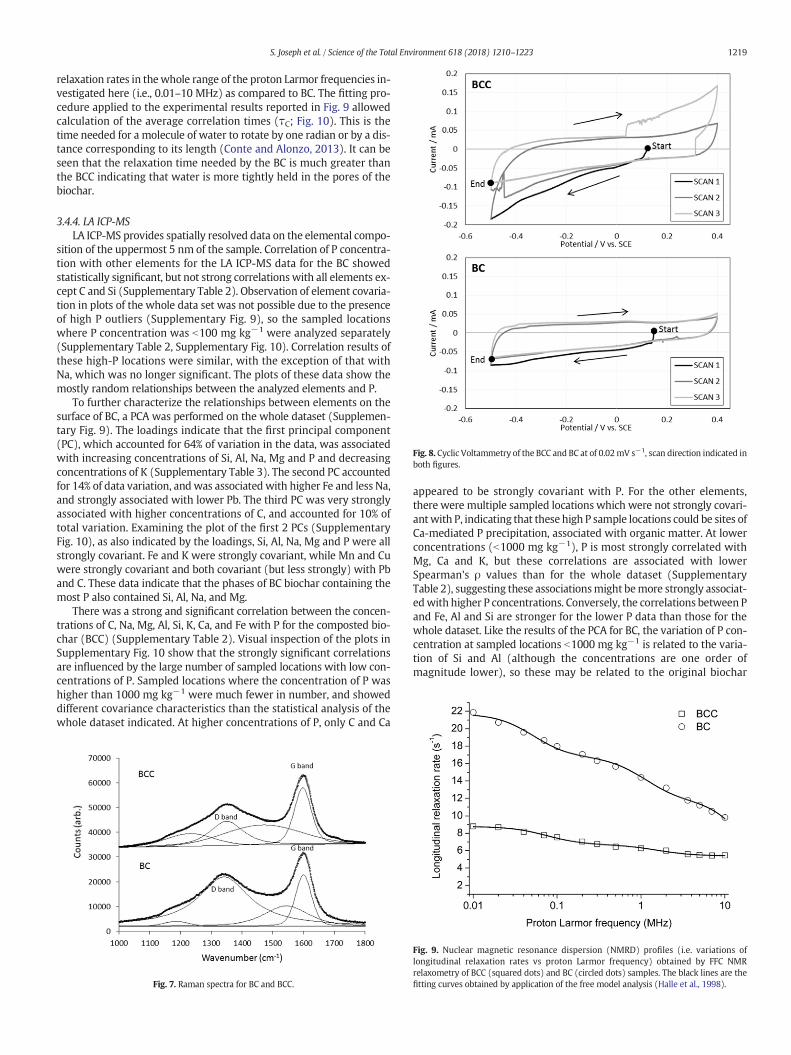
Fig. 8. Cyclic Voltammetry of the BCC and BC at of 0.02mV s−1, scan direction indicated inboth figures.
1219S. Joseph et al. / Science of the Total Environment 618 (2018) 1210–1223
relaxation rates in thewhole range of the proton Larmor frequencies in-vestigated here (i.e., 0.01–10 MHz) as compared to BC. The fitting pro-cedure applied to the experimental results reported in Fig. 9 allowedcalculation of the average correlation times (τC; Fig. 10). This is thetime needed for a molecule of water to rotate by one radian or by a dis-tance corresponding to its length (Conte and Alonzo, 2013). It can beseen that the relaxation time needed by the BC is much greater thanthe BCC indicating that water is more tightly held in the pores of thebiochar.
3.4.4. LA ICP-MSLA ICP-MS provides spatially resolved data on the elemental compo-
sition of the uppermost 5 nm of the sample. Correlation of P concentra-tion with other elements for the LA ICP-MS data for the BC showedstatistically significant, but not strong correlationswith all elements ex-cept C and Si (Supplementary Table 2). Observation of element covaria-tion in plots of the whole data set was not possible due to the presenceof high P outliers (Supplementary Fig. 9), so the sampled locationswhere P concentration was b100 mg kg−1 were analyzed separately(Supplementary Table 2, Supplementary Fig. 10). Correlation results ofthese high-P locations were similar, with the exception of that withNa, which was no longer significant. The plots of these data show themostly random relationships between the analyzed elements and P.
To further characterize the relationships between elements on thesurface of BC, a PCA was performed on the whole dataset (Supplemen-tary Fig. 9). The loadings indicate that the first principal component(PC), which accounted for 64% of variation in the data, was associatedwith increasing concentrations of Si, Al, Na, Mg and P and decreasingconcentrations of K (Supplementary Table 3). The second PC accountedfor 14% of data variation, andwas associated with higher Fe and less Na,and strongly associated with lower Pb. The third PC was very stronglyassociated with higher concentrations of C, and accounted for 10% oftotal variation. Examining the plot of the first 2 PCs (SupplementaryFig. 10), as also indicated by the loadings, Si, Al, Na, Mg and P were allstrongly covariant. Fe and K were strongly covariant, while Mn and Cuwere strongly covariant and both covariant (but less strongly) with Pband C. These data indicate that the phases of BC biochar containing themost P also contained Si, Al, Na, and Mg.
There was a strong and significant correlation between the concen-trations of C, Na, Mg, Al, Si, K, Ca, and Fe with P for the composted bio-char (BCC) (Supplementary Table 2). Visual inspection of the plots inSupplementary Fig. 10 show that the strongly significant correlationsare influenced by the large number of sampled locations with low con-centrations of P. Sampled locations where the concentration of P washigher than 1000 mg kg−1 were much fewer in number, and showeddifferent covariance characteristics than the statistical analysis of thewhole dataset indicated. At higher concentrations of P, only C and Ca
Fig. 7. Raman spectra for BC and BCC.
appeared to be strongly covariant with P. For the other elements,there were multiple sampled locations which were not strongly covari-antwith P, indicating that these high P sample locations could be sites ofCa-mediated P precipitation, associated with organic matter. At lowerconcentrations (b1000 mg kg−1), P is most strongly correlated withMg, Ca and K, but these correlations are associated with lowerSpearman's ρ values than for the whole dataset (SupplementaryTable 2), suggesting these associationsmight bemore strongly associat-edwith higher P concentrations. Conversely, the correlations between Pand Fe, Al and Si are stronger for the lower P data than those for thewhole dataset. Like the results of the PCA for BC, the variation of P con-centration at sampled locations b1000 mg kg−1 is related to the varia-tion of Si and Al (although the concentrations are one order ofmagnitude lower), so these may be related to the original biochar
Fig. 9. Nuclear magnetic resonance dispersion (NMRD) profiles (i.e. variations oflongitudinal relaxation rates vs proton Larmor frequency) obtained by FFC NMRrelaxometry of BCC (squared dots) and BC (circled dots) samples. The black lines are thefitting curves obtained by application of the free model analysis (Halle et al., 1998).
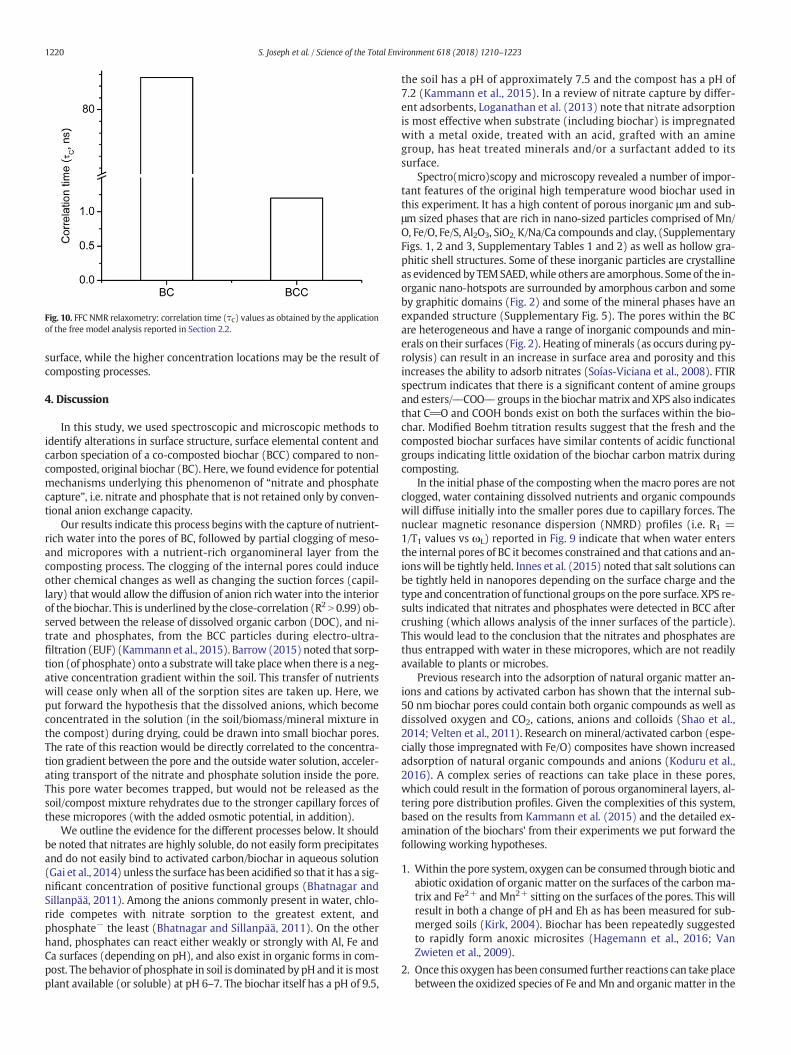
Fig. 10. FFC NMR relaxometry: correlation time (τC) values as obtained by the applicationof the free model analysis reported in Section 2.2.
1220 S. Joseph et al. / Science of the Total Environment 618 (2018) 1210–1223
surface, while the higher concentration locations may be the result ofcomposting processes.
4. Discussion
In this study, we used spectroscopic and microscopic methods toidentify alterations in surface structure, surface elemental content andcarbon speciation of a co-composted biochar (BCC) compared to non-composted, original biochar (BC). Here, we found evidence for potentialmechanisms underlying this phenomenon of “nitrate and phosphatecapture”, i.e. nitrate and phosphate that is not retained only by conven-tional anion exchange capacity.
Our results indicate this process beginswith the capture of nutrient-rich water into the pores of BC, followed by partial clogging of meso-and micropores with a nutrient-rich organomineral layer from thecomposting process. The clogging of the internal pores could induceother chemical changes as well as changing the suction forces (capil-lary) that would allow the diffusion of anion richwater into the interiorof the biochar. This is underlined by the close-correlation (R2 N 0.99) ob-served between the release of dissolved organic carbon (DOC), and ni-trate and phosphates, from the BCC particles during electro-ultra-filtration (EUF) (Kammann et al., 2015). Barrow (2015) noted that sorp-tion (of phosphate) onto a substrate will take placewhen there is a neg-ative concentration gradient within the soil. This transfer of nutrientswill cease only when all of the sorption sites are taken up. Here, weput forward the hypothesis that the dissolved anions, which becomeconcentrated in the solution (in the soil/biomass/mineral mixture inthe compost) during drying, could be drawn into small biochar pores.The rate of this reaction would be directly correlated to the concentra-tion gradient between the pore and the outside water solution, acceler-ating transport of the nitrate and phosphate solution inside the pore.This pore water becomes trapped, but would not be released as thesoil/compost mixture rehydrates due to the stronger capillary forces ofthese micropores (with the added osmotic potential, in addition).
We outline the evidence for the different processes below. It shouldbe noted that nitrates are highly soluble, do not easily form precipitatesand do not easily bind to activated carbon/biochar in aqueous solution(Gai et al., 2014) unless the surface has been acidified so that it has a sig-nificant concentration of positive functional groups (Bhatnagar andSillanpää, 2011). Among the anions commonly present in water, chlo-ride competes with nitrate sorption to the greatest extent, andphosphate− the least (Bhatnagar and Sillanpää, 2011). On the otherhand, phosphates can react either weakly or strongly with Al, Fe andCa surfaces (depending on pH), and also exist in organic forms in com-post. The behavior of phosphate in soil is dominated by pH and it ismostplant available (or soluble) at pH 6–7. The biochar itself has a pH of 9.5,
the soil has a pH of approximately 7.5 and the compost has a pH of7.2 (Kammann et al., 2015). In a review of nitrate capture by differ-ent adsorbents, Loganathan et al. (2013) note that nitrate adsorptionis most effective when substrate (including biochar) is impregnatedwith a metal oxide, treated with an acid, grafted with an aminegroup, has heat treated minerals and/or a surfactant added to itssurface.
Spectro(micro)scopy and microscopy revealed a number of impor-tant features of the original high temperature wood biochar used inthis experiment. It has a high content of porous inorganic μm and sub-μm sized phases that are rich in nano-sized particles comprised of Mn/O, Fe/O, Fe/S, Al2O3, SiO2, K/Na/Ca compounds and clay, (SupplementaryFigs. 1, 2 and 3, Supplementary Tables 1 and 2) as well as hollow gra-phitic shell structures. Some of these inorganic particles are crystallineas evidenced by TEMSAED,while others are amorphous. Someof the in-organic nano-hotspots are surrounded by amorphous carbon and someby graphitic domains (Fig. 2) and some of the mineral phases have anexpanded structure (Supplementary Fig. 5). The pores within the BCare heterogeneous and have a range of inorganic compounds and min-erals on their surfaces (Fig. 2). Heating ofminerals (as occurs during py-rolysis) can result in an increase in surface area and porosity and thisincreases the ability to adsorb nitrates (Soías-Viciana et al., 2008). FTIRspectrum indicates that there is a significant content of amine groupsand esters/\\COO\\groups in the biocharmatrix and XPS also indicatesthat C_O and COOH bonds exist on both the surfaces within the bio-char. Modified Boehm titration results suggest that the fresh and thecomposted biochar surfaces have similar contents of acidic functionalgroups indicating little oxidation of the biochar carbon matrix duringcomposting.
In the initial phase of the composting when themacro pores are notclogged, water containing dissolved nutrients and organic compoundswill diffuse initially into the smaller pores due to capillary forces. Thenuclear magnetic resonance dispersion (NMRD) profiles (i.e. R1 =1/T1 values vs ωL) reported in Fig. 9 indicate that when water entersthe internal pores of BC it becomes constrained and that cations and an-ions will be tightly held. Innes et al. (2015) noted that salt solutions canbe tightly held in nanopores depending on the surface charge and thetype and concentration of functional groups on the pore surface. XPS re-sults indicated that nitrates and phosphates were detected in BCC aftercrushing (which allows analysis of the inner surfaces of the particle).This would lead to the conclusion that the nitrates and phosphates arethus entrapped with water in these micropores, which are not readilyavailable to plants or microbes.
Previous research into the adsorption of natural organic matter an-ions and cations by activated carbon has shown that the internal sub-50 nm biochar pores could contain both organic compounds as well asdissolved oxygen and CO2, cations, anions and colloids (Shao et al.,2014; Velten et al., 2011). Research on mineral/activated carbon (espe-cially those impregnated with Fe/O) composites have shown increasedadsorption of natural organic compounds and anions (Koduru et al.,2016). A complex series of reactions can take place in these pores,which could result in the formation of porous organomineral layers, al-tering pore distribution profiles. Given the complexities of this system,based on the results from Kammann et al. (2015) and the detailed ex-amination of the biochars' from their experiments we put forward thefollowing working hypotheses.
1. Within the pore system, oxygen can be consumed through biotic andabiotic oxidation of organic matter on the surfaces of the carbonma-trix and Fe2+ andMn2+ sitting on the surfaces of the pores. This willresult in both a change of pH and Eh as has been measured for sub-merged soils (Kirk, 2004). Biochar has been repeatedly suggestedto rapidly form anoxic microsites (Hagemann et al., 2016; VanZwieten et al., 2009).
2. Once this oxygen has been consumed further reactions can take placebetween the oxidized species of Fe andMn and organic matter in the

1221S. Joseph et al. / Science of the Total Environment 618 (2018) 1210–1223
water resulting in the formation of CO2. Dissolved CO2 could reactwith Ca2+ and Fe2+ to form carbonates (Joseph et al., 2010).
3. Dissolved soil organic matter can also be adsorbed on the functional-ized surfaces in the pores, especially on the positively charged Fe/Oand Mn/O. This process would be accelerated if the biochar was hy-drophilic (Hyung and Kim, 2008). Evidence from this is seen fromthe FTIR spectrum and from the EDS analysis of the elemental com-position of the internal pores.
4. Reducing or eliminating O2 will lower the Eh of the nutrient richwater and the Pourbaix diagram (Quin et al., 2015) for N showsthat it would be present as both nitrates and nitrites, and possiblyNH4
+.5. In this environment, dissolved organic nitrogen can mineralize to
NH4+, which in turn can complex with acidic functional group on
the surface of the carbon matrix (Le Leuch and Bandosz, 2007). Asthe temperature in the compost increases, so the rate of these com-plex reactions should increase. This could partly explain the resultsof the EUF where the majority of the organic nitrogen and the NH4
+
was extracted after 45 to 60 min. Very little NH4+ was extracted in
the first 30 min and only approximately ¼ of the dissolved organicnitrogen was extracted in this time.
6. Since magnetite containing both Fe2+ and Fe 3+ was detected in thebiochar, further redox reactions can take place resulting in the oxida-tion of the ammonia to nitrate (Kirk, 2004; Li et al., 2012).
7. Extraction of DOC by EUF mainly occurred after 40 min, indicatingthat the inner pores also contained a substantial amount of these or-ganic molecules that could have both positively and negativelycharged sites and act as surfactants, thus binding nitrate and NH4
+.8. Nitrates could be held via water to the mineral surfaces by hydrogen
bonds (Bhatnagar and Sillanpää, 2011) or could be directly bonded tothe positive sites of the different minerals in different modes includ-ing monodentate, bidentate and bridging as measured by(Rubasinghege andGrassian, 2013). Given the complexity, ligand ex-change electrostatic bonding with the anions could also take place(Loganathan et al., 2013).
Further detailed research is required to determine the range of po-tential reactions that can take place in the oxygen deprived pores ofthe biochar both in the initial stages of composting and after thesepores have been partially blocked to determine the validity of ourhypotheses.
We hypothesize that once the internal meso and micropores areblocked, the mechanism for capture of anions would be more complex.It is important to note that after an initial low temperature phase ofcomposting, temperatures of 60–70 °C are reached and drying startsto occur (Bernal et al., 2009). The compost pile is then wetted and thischanges physical and chemical properties and the microbiology of thereacting biomass, which in turn will affect the processes occurring onthe surfaces of the biochar.
EUF has shown that a significant percentage of the nitrates and DOCare not held tightly in the composted biochar. The NMRD curve for theBCC sample is flatter than that acquired for BC, thereby indicating thatthemolecularmechanisms of watermotions in contact with the surfaceof BC and BCC are also not the same. BCC surfaces have a lower concen-tration of polycondensed aromatic carbons than BC. This leads to theproposition that the paramagnetic effect is more effective in BC thanin BCC, thus resulting in the BC NMRD curve at longest T1 values com-pared to the BCC NMRD profile (Fig. 9). Yet, the amount of potentiallyparamagnetic Fe is larger in BCC than in BC. Notwithstanding the largerBCC Fe content, the flattened BCC NMRD profile is placed at the highestT1 values along the whole range of proton Larmor frequencies investi-gated here. However, paramagnetism has an effect on NMRD profilesonly for short distances, i.e. up to 10 nm (Conte et al., 2004) and couldthus be hidden by organomineral layers coated on biochar pore surfacescontaining paramagnetic species. This would be in accordance with theresults from the XPS, FTIR and SEM/TEM examination that the BCC is
covered by a thin organomineral layer which very likely influences theshort range paramagnetic effect on pore water.
The above examination of this layer indicates that the interaction ofbiochar surfaces with organic carbon molecules of different sizes, andwithminerals/inorganic compounds havemodified pore structures (es-pecially those larger pores resulting from the carbonization of the phlo-em and xylem of the feedstock) inside the biochar particles. Theexamination of the outer surfaces of the BCC also revealed a coatingwith a range of different pore sizes and shapes, as seen in Figs. 3 and4. The Raman, FTIR spectroscopy and XPS all indicate that this layerhas a range of highly functionalized organic molecules that are similarto those found in aged biochar and black carbon in Terra Preta-likesoils (Singh et al., 2014; Wiedner and Glaser, 2009). The spectroscopyand the results of the EUF shows that nitrates, ammonium and organicN compounds all exist in this layer. The presence of quinones, mineralswith both Fe2+ and Fe3+ and themeasurement of redox active surfacesindicate that a complex set of both biotic and abiotic redox reactions hastaken place during the formation of this organomineral layer during thefluctuating redox conditions over the composting period. The abovewould indicate that:
1. The anions may bond directly with the positively charged minerals(especially Fe and Mn oxides) and amines on the surface of the car-bon matrix or indirectly with positive sites on any surfactants thatare in the DOC. Given the heterogeneity of the compounds on thesurfaces of the biochar it is likely that both hydrogen, ligand ex-change and electrostatic bonding with anions takes place(Loganathan et al., 2013).
2. Largemacromolecules (humic-like substances) can act as surfactantsand bind nitrates on their positive sites through electrostatic attrac-tion (Quagliotto et al., 2005).
3. Conte et al. (2013) has attributed bonding of water in these pore tounconventional H-bonds, thereby resulting inweak 1H-1Hdipolar in-teractions which in turn may result in some of the nitrates to beweekly held as outer-sphere complexes.
4. TEManalysis of the nanostructure and LA-ICPMS of the surface of thisorganomineral layer indicates that phosphates could form innersphere complexes with the positively charged minerals on biocharsurfaces and in the pores that have a diameter N 1 nm (especiallythe Fe and Al in a soil pH of 6.5, but also Si) or could form precipitates(with Mg and Ca) during the initial contact with soil moisture.
Since composting involves complex biotic and abiotic reactions in afluctuating redox environment (Khalil et al., 2008), the detection of qui-nones, iron compounds with both Fe2+ and Fe3+ and the redox activenature of the surfaces of the composted biochar as revealed by CyclicVoltammetry, confirms that a series of oxidation and reduction reac-tions have taken place. These redox reactions could involve both nitrifi-cation and denitrification aswell as oxidation of organicmatter (Klüpfelet al., 2014; Prévoteau et al., 2016; Quin et al., 2015). These reactionscould result in an increase in the concentration of nitrates on the sur-faces of organomineral layer which could, in turn, be weakly or stronglyheld in the pores in the organomineral layer. Further research using 15Nlabeled nitrogen is required to determine if these potential redox reac-tions on the surface and in the pores of the biochar are resulting in theformation and bonding of nitrates. The data from the extractions inKammann et al. (2015) and from the LA-ICPMS shows that the phos-phates on the other hand are still tightly bound in the organominerallayer indicating that inner sphere complexes or precipitates haveformed.
When composted biochar has already had all of the potentially nu-trient reactive sites loaded via composting and is then put into a fertil-ized soil system, the system is either at equilibrium in relation tonutrients, or the biochar may leach (or provide to plants) nutrients ifthe external nutrient concentration is low enough. Plants can create adepletion zone and hence invoke a gradient to access the nutrients

1222 S. Joseph et al. / Science of the Total Environment 618 (2018) 1210–1223
either from the biochar or the compost. Placing non-composted biocharwith potentially nutrient reactive sites into compost (or, fertilized soil),the equilibrium will be in the direction of the nutrients binding of thebiochar, because it is nutrient-poor (and reactive towards nutrients).Thereby, there is now a competitor for nutrients in the system. Howev-er, if nutrient-loaded biochar is put into a lownutrient soil, the nutrientsshould in part desorb into the soil system. This was indeed observed inan initial leaching carried out in the study of Kammann et al. (2015,Fig. 1). Whether or not they are available to plants depends on the soilconditions (e.g. water content, soil type, pH etc.), pore arrangement,soil- or substrate-organic carbon and mineral coating of the biochar.
5. Conclusions
Our results clearly show that the woody biochar underwent signifi-cant changes with co-composting which were detectable by XPS, NMR,FFC NMR, LA-ICPMS, FTIR, Cyclic Voltammetry, Raman spectroscopy,TEM, SEM. The observed changes are in linewith earlier results and sup-port its improved functionality as a nutrient-providing soil additive forpromoting plant growth. Particularly, breaking up the particles re-vealed, as expected, the nitrate and phosphate was at least partly cap-tured inside the biochar particles. Boehm titration results revealedthat the biochar surfaces weremost likely not oxidized themselves dur-ing composting, but were rather coated by organic substances derivedfrom the compost material, combined with clay-mineral complexes.The findings further suggest that the biochar pore size distribution is al-tered by DOC, organomineral coatings and precipitates, and these alter-ations could be involved in capturing mobile anions such as nitrate andphosphate. These smaller pores would substantiate the delayed releasealong a gradient towards the nutrient-poor soil-plant-root interface.Wehypothesize that the nitrate loading occurs by a combination of physico-chemical mechanisms that may involve alternating soil/substrate mois-ture cycles resulting in changes in Eh, pore-clogging, and electrostatic aswell as H-bonding forces as we have shown. However, it is unclear howto promote desired properties, i.e. to reach a trade-off between anionprotection against leaching and release for plant consumption along a(plant-root generated) concentration gradient; and howenvironmentalconditions (e.g. soil moisture) or biochar properties (e.g. modified bypyrolysis, feedstock or post-treatments such as composting)will impactthese desired functions of biochar. More research is clearly needed toimprove the anion-retaining and -plant-providing functionality of de-signer biochars.
Acknowledgments
We acknowledge the help of the ElectronMicroscope and X-ray unitof University of Newcastle, the Electron Microscope Unit of the Univer-sity of NSW and University of Wollongong and Dr. B Gong and RabeyaAkter of the Solid State and Elemental Analysis Unit. This workwas sup-ported by the grant LP120200418 of the ARC, Renewed Carbon Pty Ltd.and the DAFF Carbon Farming Futures Filling the Research Gap(RG134978).
Appendix A. Supplementary data
Supplementary data to this article can be found online at https://doi.org/10.1016/j.scitotenv.2017.09.200.
References
Amonette, J.E., Joseph, S., 2009. Characteristics of biochar: microchemical properties. In:Lehmann, J., Joseph, S. (Eds.), Biochar for Environmental Management: Science andTechnology. Earthscan, London, pp. 33–52.
Archanjo, B.S., Mendoza, M.E., Albu, M., Mitchell, D.R.G., Hagemann, N., Mayrhofer, C., Mai,T.L.A.,Weng, Z., Kappler, A., Behrens, S., Munroe, P., Achete, C.A., Donne, S., Araujo, J.R.,van Zwieten, L., Horvat, J., Enders, A., Joseph, S., 2017. Nanoscale analyses of the
surface structure and composition of biochars extracted after composting and fromfield trials using advanced analytical electron microscopy. Geoderma 294, 70–79.
Barrow, N.J., 2015. Soil phosphate chemistry and the P-sparing effect of previous phos-phate applications. Plant Soil 397:401–409. https://doi.org/10.1007/s11104-015-2514-5.
Bauer, I., Knoelker, H.-J., 2015. Iron catalysis in organic synthesis. Chem. Rev. 115:3170–3387. https://doi.org/10.1021/cr500425u.
Bernal, M.P., Alburquerque, J.A., Moral, R., 2009. Composting of animal manures andchemical criteria for compost maturity assessment. A review. Bioresour. Technol.100, 5444–5453.
Bhatnagar, A., Sillanpää, M., 2011. A review of emerging adsorbents for nitrate removalfrom water. Chem. Eng. J. https://doi.org/10.1016/j.cej.2011.01.103.
Bian, R., Joseph, S., Cui, L., Pan, G., Li, L., Liu, X., Zhang, A., Rutlidge, H., Wong, S., Chia, C.,Marjo, C., Gong, B., Munroe, P., Donne, S., 2014. A three-year experiment confirmscontinuous immobilization of cadmium and lead in contaminated paddy field withbiochar amendment. J. Hazard. Mater. 272:121–128. https://doi.org/10.1016/j.jhazmat.2014.03.017.
Chen, B., Chen, Z., Lv, S., 2011. A novel magnetic biochar efficiently sorbs organic pollut-ants and phosphate. Bioresour. Technol. 102:716–723. https://doi.org/10.1016/j.biortech.2010.08.067.
Cheng, C.H., Lehmann, J., Thies, J.E., Burton, S.D., Engelhard, M.H., 2006. Oxidation of blackcarbon by biotic and abiotic processes. Org. Geochem. 37:1477–1488. https://doi.org/10.1016/j.orggeochem.2006.06.022.
Chia, C.H., Gong, B., Joseph, S.D., Marjo, C.E., Munroe, P., Rich, A., 2012a. Imaging ofmineral-enriched biochar by FTIR, Raman and SEM-EDX. Vib. Spectrosc. 62:248–257. https://doi.org/10.1016/j.vibspec.2012.06.006.
Chia, C.H., Munroe, P., Joseph, S.D., Lin, Y., Lehmann, J., Muller, D.A., Xin, H.L., Neves, E.,2012b. Analytical electron microscopy of black carbon and microaggregated mineralmatter in Amazonian dark Earth. J. Microsc. 245, 129–139.
Conte, P., Alonzo, G., 2013. Environmental NMR: fast-field-cycling relaxometry. eMagRes2:389–398. https://doi.org/10.1002/9780470034590.emrstm1330.
Conte, P., Spaccini, R., Piccolo, A., 2004. State of the art of CPMAS 13 C-NMR spectroscopyapplied to natural organic matter. Prog. Nucl. Magn. Reson. Spectrosc. 44, 215–223.
Conte, P., Marsala, V., De Pasquale, C., Bubici, S., Valagussa, M., Pozzi, A., Alonzo, G., 2013.Nature of water-biochar interface interactions. GCB Bioenergy 5:116–121. https://doi.org/10.1111/gcbb.12009.
Gai, X., Wang, H., Liu, J., Zhai, L., Liu, S., Ren, T., Liu, H., 2014. Effects of feedstock and py-rolysis temperature on biochar adsorption of ammonium and nitrate. PLoS One 9,e113888.
Guan, X.H., CHEN, G.H., Shang, C., 2007. ATR-FTIR and XPS study on the structure of com-plexes formed upon the adsorption of simple organic acids on aluminum hydroxide.J. Environ. Sci. 19, 438–443.
Güereña, D.T., Lehmann, J., Thies, J.E., Enders, A., Karanja, N., Neufeldt, H., 2015.Partitioning the contributions of biochar properties to enhanced biological nitrogenfixation in common bean (Phaseolus vulgaris). Biol. Fertil. Soils 51.
Hagemann, N., Harter, J., Behrens, S., 2016. Elucidating the impacts of biochar applicationson nitrogen cycling microbial communities. In: Ralebitso-Senior, T.K., Orr, C.H. (Eds.),Biochar Application. Elsevier, Amsterdam, pp. 163–198.
Haider, G., Steffens, D., Müller, C., Kammann, C.I., 2016. Standard extraction methods mayunderestimate nitrate stocks captured by field-aged biochar. J. Environ. Qual. 45,1196–1204.
Halle, B., Jóhannesson, H., Venu, K., 1998. Model-free analysis of stretched relaxation dis-persions. J. Magn. Reson. 135:1–13. https://doi.org/10.1006/jmre.1998.1534.
Harvie, C.E., Møller, N., Weare, J.H., 1984. The prediction of mineral solubilities in naturalwaters: the Na-K-Mg-Ca-H-Cl-SO4-OH-HCO3-CO3-CO2-H2O system to high ionicstrengths at 25 °C. Geochim. Cosmochim. Acta 48, 723–751.
Hyung, H., Kim, J.H., 2008. Natural organic matter (NOM) adsorption to multi-walled car-bon nanotubes: effect of NOM characteristics and water quality parameters. Environ.Sci. Technol. 42, 4416–4421.
Innes, L., Gutierrez, D., Mann,W., Buchsbaum, S.F., Siwy, Z.S., 2015. Presence of electrolytepromotes wetting and hydrophobic gating in nanopores with residual surfacecharges. Analyst 140, 4804.
Jolivet, J.-P., Chanéac, C., Chiche, D., Cassaignon, S., Durupthy, O., Hernandez, J., 2011. Basicconcepts of the crystallization from aqueous solutions: the example of aluminumoxy(hydroxi)des and aluminosilicates. Comptes Rendus Geosci. 343:113–122.https://doi.org/10.1016/j.crte.2010.12.006.
Jorio, A., Cançado, L.G., 2012. Perspectives on Raman spectroscopy of graphene-based sys-tems: from the perfect two-dimensional surface to charcoal. Phys. Chem. Chem. Phys.14:15246. https://doi.org/10.1039/c2cp42621h.
Jorio, A., Lucchese, M.M., Stavale, F., Ferreira, E.H.M., Moutinho, M.V.O., Capaz, R.B., Achete,C.A., 2010. Raman study of ion-induced defects in N-layer graphene. J. Phys. Condens.Matter 22:334204/1–334204/5. https://doi.org/10.1088/0953-8984/22/33/334204.
Jorio, A., Ribeiro-Soares, J., Cançado, L.G., Falc˜ao, N.P.S., Dos Santos, H.F., Baptista, D.L.,Ferreira, E.H.M., Archanjo, B.S., Achete, C.A., 2012. Soil Tillage Res. 122, 61–66.
José, M., Knicker, H., 2011. Bioavailability of N released from N-rich pyrogenic organicmatter: an incubation study. Soil Biol. Biochem. 43, 2368–2373.
Joseph, S.D., Camps-Arbestain, M., Lin, Y., Munroe, P., Chia, C.H., Hook, J., Van Zwieten, L.,Kimber, S., Cowie, A., Singh, B.P., Lehmann, J., Foidl, N., Smernik, R.J., Amonette, J.E.,2010. An investigation into the reactions of biochar in soil. Aust. J. Soil Res.:501–515 https://doi.org/10.1071/SR10009.
Joseph, S., Graber, E.R., Chia, C., Munroe, P., Donne, S., Thomas, T., Nielsen, S., Marjo, C.,Rutlidge, H., Pan, G., Li, L., Taylor, P., Rawal, A., Hook, J., 2013. Shifting paradigms: de-velopment of high-efficiency biochar fertilizers based on nano-structures and solublecomponents. Carbon Manag. 4:323–343. https://doi.org/10.4155/cmt.13.23.
Joseph, S., Husson, O., Graber, E., van Zwieten, L., Taherymoosavi, S., Thomas, T., Nielsen, S.,Ye, J., Pan, G., Chia, C., Munroe, P., Allen, J., Lin, Y., Fan, X., Donne, S., 2015. The electro-

1223S. Joseph et al. / Science of the Total Environment 618 (2018) 1210–1223
chemical properties of biochars and how they affect soil redox properties and pro-cesses. Agronomy 5:322–340. https://doi.org/10.3390/agronomy5030322.
Kammann, C.I., Schmidt, H.-P., Messerschmidt, N., Linsel, S., Steffens, D., Müller, C., Koyro,H.-W., Conte, P., Stephen, J., 2015. Plant growth improvement mediated by nitratecapture in co-composted biochar. Sci Rep 5:11080. https://doi.org/10.1038/srep11080.
Khalil, A., Domeizel, M., Prudent, P., 2008. Monitoring of green waste composting processbased on redox potential. Bioresour. Technol. https://doi.org/10.1016/j.biortech.2007.11.043.
Khan, N., Clark, I., Sánchez-Monedero, M.A., Shea, S., Meier, S., Qi, F., Kookana, R.S., Bolan,N., 2016. Physical and chemical properties of biochars co-composted with biowastesand incubated with a chicken litter compost. Chemosphere 142, 14–23.
Kimmich, R., Anoardo, E., 2004. Field-cycling NMR relaxometry. Prog. Nucl. Magn. Reson.Spectrosc. 44:257–320. https://doi.org/10.1016/j.pnmrs.2004.03.002.
Kirk, G., 2004. The Biogeochemistry of Submerged Soils. John Wiley & Sons, Chinchester,UK.
Kleber, M., Sollins, P., Sutton, R., 2007. A conceptual model of organo-mineral interactionsin soils: self-assembly of organicmolecular fragments into zonal structures onminer-al surfaces. Biogeochemistry 85:9–24. https://doi.org/10.1007/s10533-007-9103-5.
Klüpfel, L., Keiluweit, M., Kleber, M., Sander, M., 2014. Redox properties of plant biomass-derived black carbon (biochar). Environ. Sci. Technol. 48:5601–5611. https://doi.org/10.1021/es500906d.
Koduru, J.R., Lingamdinne, L.P., Singh, J., Choo, K.H., 2016. Effective removal of bisphenol A(BPA) from water using a goethite/activated carbon composite. Process Saf. Environ.Prot. 103, 87–96.
Le Leuch, L.M., Bandosz, T., 2007. The role of water and surface acidity on the reactive ad-sorption of ammonia on modified activated carbons. Carbon N. Y. 45, 568–578.
Lee, S.C., Chae, H.J., Lee, S.J., Choi, B.Y., Yi, C.K., Lee, J.B., Ryu, C.K., Kim, J.C., 2008. Develop-ment of regenerable MgO-based sorbent promoted with K2CO3 for CO2 capture atlow temperatures. Environ. Sci. Technol. 42, 2736–2741.
Li, Y., Yu, S., Strong, J., Wang, H., 2012. Are the biogeochemical cycles of carbon, nitrogen,sulfur, and phosphorus driven by the “FeIII–FeII redox wheel” in dynamic redox en-vironments? J. Soils Sediments 12, 683–693.
Liu, X., Zhang, A., Ji, C., Joseph, S., Bian, R., Li, L., Pan, G., Paz-Ferreiro, J., 2013. Biochar's ef-fect on crop productivity and the dependence on experimental conditions-a meta-analysis of literature data. Plant Soil 373:583–594. https://doi.org/10.1007/s11104-013-1806-x.
Liu, Y., He, Z., Uchimiya, M., 2015. Comparison of biochar formation from various agricul-tural by-products using FTIR spectroscopy. Mod. Appl. Sci. 9, 246.
Loganathan, P., Vigneswaran, S., Kandasamy, J., 2013. Enhanced removal of nitrate fromwater using surface modification of adsorbents – a review. J. Environ. Manag.https://doi.org/10.1016/j.jenvman.2013.09.034.
McDonald-Wharry, J., Manley-Harris, Merilyn, Pickering, K., 2015. A comparison of thecharring and carbonisation of oxygen-rich precursors with the thermal reduction ofgraphene oxide. Philos. Mag. 95, 4054–4077.
Nielsen, S., Minchin, T., Kimber, S., van Zwieten, L., Gilbert, J., Munroe, P., Joseph, S.,Thomas, T., 2014. Comparative analysis of the microbial communities in agriculturalsoil amended with enhanced biochars or traditional fertilisers. Agric. Ecosyst. Envi-ron. 191:73–82. https://doi.org/10.1016/j.agee.2014.04.006.
Ogawa, M., Okimori, Y., 2010. Pioneering works in biochar research, Japan. Aust. J. SoilRes.:489–500 https://doi.org/10.1071/SR10006.
Prévoteau, A., Ronsse, F., Cid, I., Boeckx, P., Rabaey, K., 2016. The electron donating capac-ity of biochar is dramatically underestimated. Sci Rep 6:32870. https://doi.org/10.1038/srep32870.
Prost, K., Borchard, N., Siemens, J., Kautz, T., Séquaris, J.M., Möller, A., Amelung, W., 2013.Biochar affected by composting with farmyard manure. J. Environ. Qual. 42, 164–172.
Quagliotto, P., Viscardi, G., Montoneri, E., Goberro, R., Adani, F., 2005. Compost humicacid–like matter as surfactant. Geophys. Res. Abstr. 7, 10555.
Quin, P., Joseph, S., Husson, O., Donne, S., Mitchell, D., Munroe, P., Phelan, D., Cowie, A.,Van Zwieten, L., 2015. Lowering N2O emissions from soils using eucalypt biochar:the importance of redox reactions. Sci Rep 5:16773. https://doi.org/10.1038/srep16773.
Ramesh, P., Sampath, S., 2001. Electrochemical and spectroscopic characterization of qui-none functionalized exfoliated graphite. Analyst 126:1872–1877. https://doi.org/10.1039/b106199m.
Rawal, A., Joseph, S.D., Hook, J.M., Chia, C.H., Munroe, P.R., Donne, S.W., Lin, Y., Phelan, D.,Richard, D., Mitchell, G., Pace, B., Horvat, J., Beau, J., Webber, W., 2016. Mineral-biochar composites: molecular structure and porosity. Environ. Sci. Technol. 50:7706–7714. https://doi.org/10.1021/acs.est.6b00685.
Ribeiro-Soares, J., Cançado, L.G., Falcão, N.P.S., Martins Ferreira, E.H., Achete, C.A., Jorio, A.,2013. The use of Raman spectroscopy to characterize the carbon materials found inAmazonian anthrosoils. J. Raman Spectrosc. 44, 283–289.
RStudio Team, 2015. RStudio: integrated development for R.Rubasinghege, G., Grassian, V.H., 2013. Role (s) of adsorbed water in the surface chemis-
try of environmental interfaces. Chem. Commun. 49, 3071–3094.Schmidt, H.P., Kammann, C., Niggli, C., Evangelou, M.W.H., Mackie, K.A., Abiven, S., 2014.
Biochar and biochar-compost as soil amendments to a vineyard soil: influences onplant growth, nutrient uptake, plant health and grape quality. Agric. Ecosyst. Environ.191:117–123. https://doi.org/10.1016/j.agee.2014.04.001.
Shao, S., Qu, F., Liang, H., Chang, H., Yu, H., Li, G., 2014. Characterization of membranefoulants in a pilot-scale powdered activated carbon–membrane bioreactor for drink-ing water treatment. Process Biochem. 49, 1741–1746.
Singh, B., Fang, Y., Cowie, B.C., Thomsen, L., 2014. NEXAFS and XPS characterisation of car-bon functional groups of fresh and aged biochars. Org. Geochem. 77, 1–10.
Soías-Viciana, M.M., Ureña-Amate, M.D., González-Pradas, E., García-Cortéz, M.J., López-Teruel, C., 2008. Nitrate removal by calcined hydrotalcite-type compounds. ClayClay Miner. 56:2–9. https://doi.org/10.1346/CCMN.2008.0560101.
Spokas, K.A., Novak, J.M., Masiello, C.A., Johnson, M.G., Colosky, E.C., Ippolito, J.A., Trigo, C.,2014. Physical disintegration of biochar: an overlooked process. Environ. Sci. Technol.Lett. 1:326–332. https://doi.org/10.1021/ez500199t.
Tsai, C.S., Chen, H.Y., 2013. Study on the Spectral Analysis of Reduced Dextran-coatedFe3O4 Magnetic Nano-particles. 19 pp. 2220–2224.
Tsechansky, L., Graber, E.R., 2014. Methodological limitations to determining acidicgroups at biochar surfaces via the Boehm titration. Carbon N. Y. 66:730–733.https://doi.org/10.1016/j.carbon.2013.09.044.
Unsoy, G., Yalcin, S., Khodadust, R., Gunduz, G., Gunduz, U., 2012. Synthesis optimizationand characterization of chitosan-coated iron oxide nanoparticles produced for bio-medical applications. J. Nanopart. Res. 14, 964.
Van Zwieten, L., Singh, B., Joseph, S., Kimber, S., Cowie, A., Chan, K.Y., 2009. Biochar andemissions of non-CO2 greenhouse gases from soil. In: Lehmann, J., Joseph, S. (Eds.),Biochar for Environmental Management: Science and Technology. Earthscan,London, UK, pp. 227–250.
Vanek, S.J., Lehmann, J., 2015. Phosphorus availability to beans via interactions betweenmycorrhizas and biochar. Plant Soil 395:105–123. https://doi.org/10.1007/s11104-014-2246-y.
Velten, S., Knappe, D.R., Traber, J., Kaiser, H.P., Von Gunten, U., Boller, M., Meylan, S., 2011.Characterization of natural organic matter adsorption in granular activated carbonadsorbers. Water Res. 45, 3951–3959.
Wiedner, K., Glaser, B., 2009. Traditional use of biochar. Biochar Environ. Manag. - Sci.Technol. 15–38.
Wijnja, H., Schulthess, C.P., 1999. ATR–FTIR and DRIFT spectroscopy of carbonate speciesat the aged γ-Al2O3/water interface. Spectrochim. Acta Part A Mol. Biomol. Spectrosc.55, 861–872.
Yao, X., Li, L., Li, H., He, S., 2014. A newmethod for preparing hydrophilic-activated carbonthrough ester hydrolysis in an alkaline environment. J. Mater. Sci. 49:4807–4815.https://doi.org/10.1007/s10853-014-8180-9.
Ye, J., Zhang, R., Nielsen, S., Joseph, S.D., Huang, D., Thomas, T., 2016. A combination ofbiochar-mineral complexes and compost improves soil bacterial processes, soil qual-ity, and plant properties. Front. Microbiol. 7. https://doi.org/10.3389/fmicb.2016.00372.
Zhang, M., Gao, B., Yao, Y., Xue, Y., Inyang, M., 2012. Synthesis, characterization, and envi-ronmental implications of graphene-coated biochar. Sci. Total Environ. 435–436:567–572. https://doi.org/10.1016/j.scitotenv.2012.07.038.
Zheng, R.L., Cai, C., Liang, J.H., Huang, Q., Chen, Z., Huang, Y.Z., Arp, H.P.H., Sun, G.X., 2012.The effects of biochars from rice residue on the formation of iron plaque and the ac-cumulation of Cd, Zn, Pb, As in rice (Oryza sativa L.) seedlings. Chemosphere 89,856–862.