Embed Size (px)
Citation preview

Science of the Total Environment 630 (2018) 1381–1393
Contents lists available at ScienceDirect
Science of the Total Environment
j ourna l homepage: www.e lsev ie r .com/ locate /sc i totenv
Influence of plankton metabolism and mixing depth on CO2 dynamics inan Amazon floodplain lake
João Henrique F. Amaral a,b,⁎, Alberto V. Borges c, John M. Melack d, Hugo Sarmento e, Pedro M. Barbosa f,Daniele Kasper a,f, Michaela L. de Melo e, Daniela De Fex-Wolf a, Jonismar S. da Silva a, Bruce R. Forsberg a
a Coordenação de Dinâmica Ambiental, Laboratório de Ecossistemas Aquáticos, Instituto Nacional de Pesquisas da Amazônia, Manaus, Amazonas, Brazilb Programa de Pós-graduação em Ecologia, Instituto Nacional de Pesquisas da Amazônia, Manaus, Amazonas, Brazilc Chemical Oceanography Unit, University of Liège, Liège, Belgiumd Bren School of Environmental Science and Management, University of California, Santa Barbara, CA, USAe Universidade Federal de São Carlos, Departamento de Hidrobiologia, Laboratory of Microbial Processes and Biodiversity, São Carlos, São Paulo, Brazilf Centro de Ciências da Saúde, Universidade Federal do Rio de Janeiro, Rio de Janeiro, Rio de Janeiro, Brazil
H I G H L I G H T S G R A P H I C A L A B S T R A C T
• Large diel variations on CO2 dynamics• Higher plankton metabolism associatedwith wind mediated mixing.
• Phytoplankton consumption of CO2 de-rived from macrophyte decomposition.
• Planktonic respiration is greater in solarexposed chambers.
• CO2 emissions enhanced during excep-tional drought.
https://doi.org/10.1016/j.scitotenv.2018.02.3310048-9697/© 2018 Elsevier B.V. All rights reserved.
a b s t r a c t
a r t i c l e i n f oArticle history:Received 28 December 2017Received in revised form 27 February 2018Accepted 27 February 2018Available online xxxx
Editor: D. Barcelo
We investigated plankton metabolism and its influence on carbon dioxide (CO2) dynamics in a central Amazonfloodplain lake (Janauacá, 3°23′ S, 60°18′W) from September 2015 toMay 2016, including a period with excep-tional drought. We made diel measurements of CO2 emissions to the atmosphere with floating chambers anddepth profiles of temperature and CO2 partial pressure (pCO2) at two sites with differing wind exposure andproximity to vegetated habitats. Dissolved oxygen (DO) concentrations were monitored continuously duringday and night in clear and dark chambers with autonomous optical sensors to evaluate plankton metabolism.Overnight community respiration (CR), and gross primary production (GPP) rateswere higher in clear chambersand positively correlatedwith chlorophyll-a (Chl-a). CO2 air-water fluxes varied over 24-h periods with changesin thermal structure and metabolism. Most net daily CO2 fluxes during low water and mid-rising water at thewind exposed sitewere into the lake as a result of high rates of photosynthesis. All othermeasurements indicatednet daily release to the atmosphere. Average GPP rates (6.8 gCm−2 d−1) were high comparedwith other studiesin Amazon floodplain lakes. The growth of herbaceous plants on exposed sediment during an exceptionaldrought led to large carbon inputs when these areas were flooded, enhancing CR, pCO2, and CO2 fluxes. Duringthe period when the submerged herbaceous vegetation decayed phytoplankton abundance increased and pho-tosynthetic uptake of CO2 occurred. While planktonic metabolism was often autotrophic (GPP:CR N 1), CO2
out-gassing occurred during most periods investigated indicating other inputs of carbon such as sediments orsoils and wetland plants.
© 2018 Elsevier B.V. All rights reserved.
Keywords:Amazon RiverCarbonCO2 out-gassingTropical floodplainsCommunity respirationGross primary production
é Araújo 2936, Petrópolis, 69060-001 Manaus, AM, Brazil.Borges), [email protected] (J.M. Melack).
⁎ Corresponding author at: Programa de Pós-Graduação em Ecologia/INPA-V8, Av. AndrE-mail addresses: [email protected] (J.H.F. Amaral), [email protected] (A.V.
1382 J.H.F. Amaral et al. / Science of the Total Environment 630 (2018) 1381–1393
1. Introduction
Aquatic ecosystems on Amazonian floodplains are important com-ponents of the regional carbon (C) cycle (Richey et al., 2002; Abrilet al., 2013; Melack, 2016; Nagy et al., 2016). A recent estimate(Melack, 2016) indicates that total CO2 emission from these fluvial wet-lands is comparable to that emitted by rivers and streams globally(Raymond et al., 2013) or even higher based on the more conservativeestimate of Lauerwald et al. (2015). Large emissions of both CO2 andmethane from Amazon floodplains and their downstream river chan-nels are sustained by organic carbon derived from a variety of floodplainsources (Melack et al., 2004; Engle et al., 2007; Abril et al., 2013). How-ever the temporal dynamics of these contributions at inter-annual, sea-sonal and diel time-scales is not well understood.
One source of organic C to Amazon floodplain lakes is emergentaquatic vegetation, such as floating herbaceous plants and floodplainforests, that fix CO2 from the atmosphere and then release dissolvedand particulate organic matter and respired CO2 to the water column(Melack and Engle, 2009; Melack et al., 2009). Organic matter and CO2
are also derived from phytoplankton and attached algae. Organic Cfrom all these sources is oxidized to CO2 by planktonic and sedimentarymicrobial respiration (Waichman, 1996; Engle et al., 2007; Ward et al.,2016). CO2 is also added to the water column from groundwater andupland streams, benthic communities and other aquatic heterotrophs(Hamilton et al., 1995; Abril et al., 2013). Hence, the excess of dissolvedCO2 in Amazon floodplain lakes results from inputs of CO2 from severalsources with no consensus regarding the relative importance of eachand how their contributions vary in time and space (Richey et al.,2002; Johnson et al., 2008; Abril et al., 2013; Borges et al., 2015a;Ward et al., 2016; Melack, 2016). Furthermore, these inputs are ex-pected to vary seasonally in synchrony with the large fluctuation inwater level (about 10 m) observed along the Amazon River main chan-nel between high-water and low-water (Junk et al., 1989). This seasonalflood pulse with distinct hydrological phases inundates an extensivefloodplain occupied by a mosaic of wetland habitats including alluvialforests, grasslands, and open water environments. During the annualflood cycle, the distribution of flooded habitats and their morphometry(surface area, fetch, depth) vary, leading to changes in thermal stratifi-cation and mixing, and in limnological parameters, including chloro-phyll a (Chl-a), dissolved organic carbon (DOC), and dissolved oxygen(DO), that influence C biogeochemistry (Richey et al., 1988; Devolet al., 1988, 1995; Melack and Forsberg, 2001; Abril et al., 2013).
Diel variations in CO2 or DO can be used to quantify ecosystemmet-abolic processes. Community respiration (CR) of organic C consumesoxygen, producing CO2 as a metabolic product, and CO2 is assimilatedinto organic C, releasing oxygen, during gross primary production(GPP). GPP and CR can be estimated from changes in CO2 or DO indark and light bottles containing lake water during incubations. Alter-natively, GPP can be derived independently using stable or radioactiveC isotopes (e.g., Steemann Nielsen, 1952; Quay et al., 1995; Bogardand del Giorgio, 2016). The balance or ratio between GPP and CR canbe used to infer the autotrophic or heterotrophic nature of an aquaticecosystem (Odum, 1956; del Giorgio et al., 1999; Cole et al., 2000).Rarely are changes in DO and CO2 measured together on a diel basis,allowing for the evaluation of aerobic metabolism and its influence onCO2 dynamics on this time scale. These measurements could also beused to investigate aquatic ecosystems with net autotrophy that haveconsistent CO2 out-gassing due to allochthonous and internal CO2 in-puts to the aerobic mixed layer (Dubois et al., 2009; Borges et al.,2014; Bogard and del Giorgio, 2016).
The oxidation of organic C substrates to CO2 by heterotrophic bacte-ria in Amazon aquatic ecosystems represents an important CO2 flux inthe regional C balance (Richey et al., 1990; Quay et al., 1992;Waichman, 1996; Engle et al., 2007; Ward et al., 2013). Previous mea-surements of planktonic CR in Amazon rivers and lakes were made byincubating unfiltered water in the dark for a few hours to days
(e.g., Benner et al., 1995; Waichman, 1996; Ward et al., 2013, 2016;Vidal et al., 2015). This practice ignores processes that vary over 24 h-periods, such as algal photosynthesis, that can influence overnight ordark respiration (Sadro et al., 2011, 2014). Different patterns of over-night respiration have been associated with variations in terrestrial in-puts, lake productivity and lake residence time (Sadro et al., 2014).These factors might vary in time and space in Amazon floodplain lakesdue to the heterogeneity of these systems (Melack and Forsberg,2001). Furthermore, direct estimates of net planktonic community pro-duction (NCP) that include daytime respiration are uncommon in Ama-zonian aquatic ecosystems (Melack and Forsberg, 2001).
Concentrations of CO2 in lowland Amazon waters vary over two or-ders of magnitude and tend to be higher during high water periods andin areas near vegetated habitats (Johnson et al., 2008; Rudorff et al.,2011; Abril et al., 2013; de Rasera et al., 2013; Borges et al., 2015a;Scofield et al., 2016). CO2 emissions are positively correlated towind ve-locity in openwaters of lakes and rivers in the Amazon (Alin et al., 2011;Polsenaere et al., 2013; Scofield et al., 2016). Changes in inundated area,vegetated habitats, NCP, wind exposure, fetch, water depth and mixingpatterns are also likely to contribute to the observed variations in CO2
concentrations and fluxes. Variations in CO2 concentrations and fluxeslinked to seasonal floods are likely to increase during extreme floods(Almeida et al., 2017), but the effect of droughts on CO2 dynamics is un-knownalthough theymay be increasing in frequency (Gloor et al., 2013;Marengo and Espinoza, 2016).
Here we use a combination of in situ measurements and enclosedautonomous sensors to investigate seasonal and diel variations inplanktonic metabolism (GPP, CR and NCP) and their influence on CO2
concentrations and emissions in open water habitats of a central Ama-zon floodplain lake, Lake Janauacá. The large seasonal and spatial varia-tions in the morphometry, hydrology and limnological characteristicsencountered in the open waters regions of this lake (Brito et al., 2016)were expected to result in significant variations in wind exposure,lake depth, diel mixing and proximity to emergent vegetation, affectingboth CO2 dynamics and plankton metabolism. CR rates obtained over-night in chambers previously exposed and not exposed to sunlightwere compared, and implications for GPP estimates are explored. Thecombined influence of NCP, aquatic plants, and vertical mixing on CO2
dynamics in open water floodplain environments are examined to-getherwith the implications for the regional C balance.We demonstratethat the plankton community plays a role in regulating CO2 dynamics,and is capable of absorbing a portion of the dissolved CO2 resultingfrom dissolved CO2 produced during the large scale die-off and decom-position of herbaceous vegetation.
2. Methods
2.1. Study site
Lake Janauacá (3°23′ S, 60°18′ W; altitude 32 m) is located on theright floodplain of the Solimões River, 40 km southeast of Manaus(Fig. 1). It has a local watershed area of 770 km2 and a floodable areathat varies from 23 km2 at low water to 390 km2 at high water, withmean annual rainfall of 1980 mm (Pinel et al., 2015). Lake depths varyspatially and seasonally, ranging from in average 1 to 3 m at lowwater and from 9 to 13 m during high water. The lake is connected tothe Solimões River year-round by a 12 km long channel (100–200 mwide). The catchment around the southern part of the lake drains for-ested and agricultural areas with black and clear water streams of lowconductivity (10–30 μS cm−1) and low suspended solid concentrations(b20 mg L−1). This part of the lake is dendritic and occupied mostly byopenwater habitats. An extensive floodplain occupies the northern por-tion of the lake. The composition of aquatic habitats in this region variesconsiderably during the year with flooded forests and floating herba-ceous macrophytes (Paspalum repens P. J. Bergius, Oryza rufipogonGriff, Luziola spruceana Benth. ex Döll, Eugenia inundata D.C.)

Fig. 1.Map showing the location of the Janauacáfloodplain.WE is the location of thewind exposed site andWP is thewind protected site. RB is the research basewhere themeteorologicalstation was located.
1383J.H.F. Amaral et al. / Science of the Total Environment 630 (2018) 1381–1393
dominating at rising to high water and open water dominating at lowwater. The lake receives seasonal inputs of Solimões River water con-taining moderate concentrations of dissolved inorganic nitrogen (12μmol L−1), soluble reactive phosphorus (0.8 μmol L−1), total nitrogen(23 μmol L−1), total phosphorus (2.4 μmol L−1) and suspended sedi-ments (247 mg L−1) (Forsberg et al., 1988).
2.2. Experimental design
Measurements were made at two open water sites that differed inwind exposure and proximity to vegetated habitats, referred to as thewind exposed (WE) (3°22.6′ S, 60°15.2′ W) and wind protected (WP)(3°24.4′ S, 60°14.8′ W) sites (Fig. 1). The WE site had a fetch of 3 to6 km and was located 1.5 to 3 km from emergent vegetation, whilethe WP site had a fetch of 100 m to 1 km and was 30 to 100 m fromthe nearest emergent vegetation, depending on the season. Depth pro-files of carbon dioxide partial pressure (pCO2) and surface CO2 emis-sions were measured at both sites, together with planktonicmetabolism (GPP, NCP, CR). Environmental parameters that potentiallyinfluenced these variables were also measured including: meteorologi-cal variables (wind speed, photosynthetically available radiation (PAR)and air temperature), thermal structure, dissolved organic C (DOC),chlorophyll-a (Chl-a), colored dissolved organic matter (CDOM) andtotal suspended sediments (TSS).
Multiple measurements were made during 24-hour periods to in-vestigate the effects of diel variations in metabolism and mixing onCO2 dynamics, with the exception ofMay2016when only onemeasure-ment was made. Measurements were made on six occasions betweenSeptember 2015 andMay 2016, representing different phases of the hy-drological cycle: September 2015 (falling water), October 2015 (lowwater), January 2016 (early rising water), February (mid rising water),
April 2016 (late rising water) and May 2016 (early high water). Thelowwater period was atypical and represented an exceptional drought,where the monthly average water levels were below historical valuesfor a similar period due unprecedented warming and lower rainfallthroughout much of the Amazon Basin (Jiménez-Muñoz et al., 2016)(Fig. 2).
2.3. Environmental variables and sampling
Each time pCO2 and CO2 emissionsweremeasured, depth profiles ofconductivity, temperature and dissolved oxygen were obtained. Dis-solved oxygen and temperature were measured with a combined tem-perature/oxygen meter (Yellow Springs Inst. Co., model Pro-ODO, DOaccuracy of 0.2 ± 0.1mg L−1, temperature accuracy ±0.2 °C, resolution0.1 °C) at 0.5 m intervals. Temperature and conductivity profiles werealso measured with a CTD profiler (Castway, Sontek Inst. Co) samplingat 4 Hz with data reported at 0.3 m intervals. Wind speed and directionsensors (Onset, Inc.) were deployed at a height of 2mon a floating buoyat each site.
Vertical profiles of PAR were determined once during each 24-hourperiod using an underwater sensor (Licor LI-192 SB). Measurementswere made at 0.1 m intervals to the depth where PAR was reduced to1% of surface irradiance, assumed to represent the depth of the euphoticzone (Zeu). The downwelling extinction coefficient (Ed) was calculatedfrom the slope of a linear regression between the Ln (PAR) and depth.Incident PAR irradiance was measured simultaneously with anothersensor (Licor, LI-190). PAR and air temperature were also recorded con-tinuously at ameteorological station (HOBO-Onset)mounted on afloat-ing research station (Fig. 1) about 4 km from the WE site and 1.5 kmfrom the WP site.
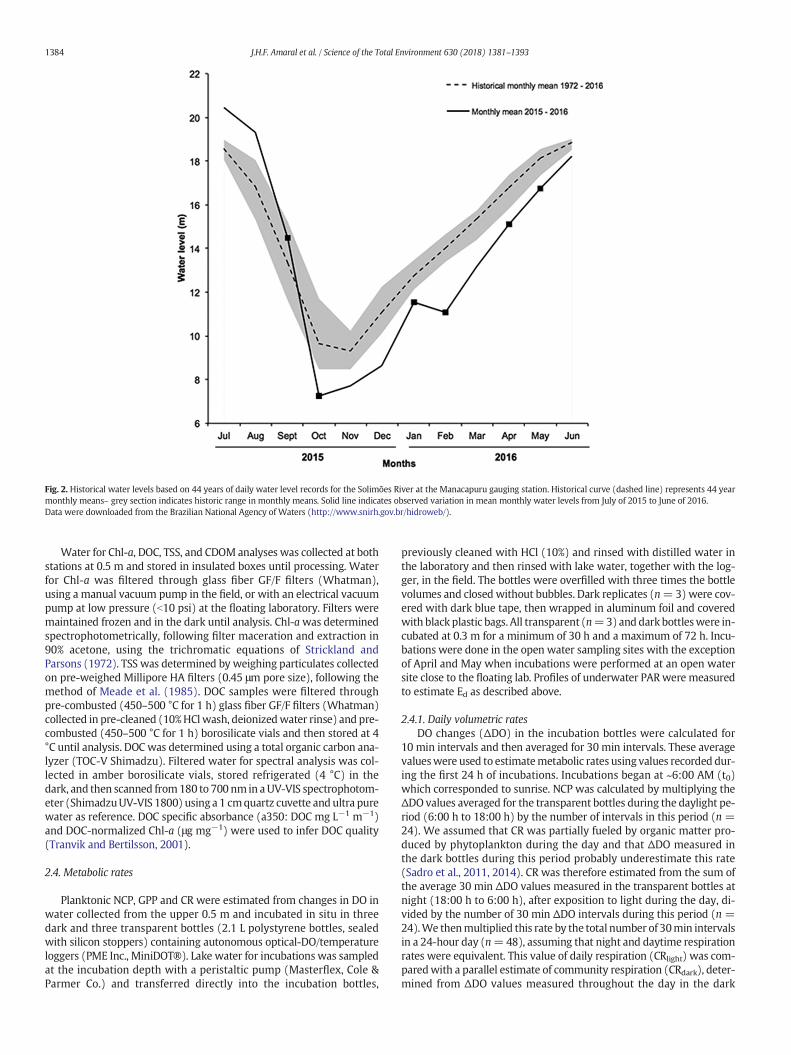
Fig. 2. Historical water levels based on 44 years of daily water level records for the Solimões River at the Manacapuru gauging station. Historical curve (dashed line) represents 44 yearmonthly means– grey section indicates historic range in monthly means. Solid line indicates observed variation in mean monthly water levels from July of 2015 to June of 2016.Data were downloaded from the Brazilian National Agency of Waters (http://www.snirh.gov.br/hidroweb/).
1384 J.H.F. Amaral et al. / Science of the Total Environment 630 (2018) 1381–1393
Water for Chl-a, DOC, TSS, and CDOM analyses was collected at bothstations at 0.5 m and stored in insulated boxes until processing. Waterfor Chl-a was filtered through glass fiber GF/F filters (Whatman),using a manual vacuum pump in the field, or with an electrical vacuumpump at low pressure (b10 psi) at the floating laboratory. Filters weremaintained frozen and in the dark until analysis. Chl-awas determinedspectrophotometrically, following filter maceration and extraction in90% acetone, using the trichromatic equations of Strickland andParsons (1972). TSS was determined by weighing particulates collectedon pre-weighed Millipore HA filters (0.45 μm pore size), following themethod of Meade et al. (1985). DOC samples were filtered throughpre-combusted (450–500 °C for 1 h) glass fiber GF/F filters (Whatman)collected in pre-cleaned (10%HClwash, deionizedwater rinse) and pre-combusted (450–500 °C for 1 h) borosilicate vials and then stored at 4°C until analysis. DOC was determined using a total organic carbon ana-lyzer (TOC-V Shimadzu). Filtered water for spectral analysis was col-lected in amber borosilicate vials, stored refrigerated (4 °C) in thedark, and then scanned from180 to 700 nm in aUV-VIS spectrophotom-eter (ShimadzuUV-VIS 1800) using a 1 cmquartz cuvette and ultra purewater as reference. DOC specific absorbance (a350: DOC mg L−1 m−1)and DOC-normalized Chl-a (μg mg−1) were used to infer DOC quality(Tranvik and Bertilsson, 2001).
2.4. Metabolic rates
Planktonic NCP, GPP and CR were estimated from changes in DO inwater collected from the upper 0.5 m and incubated in situ in threedark and three transparent bottles (2.1 L polystyrene bottles, sealedwith silicon stoppers) containing autonomous optical-DO/temperatureloggers (PME Inc., MiniDOT®). Lake water for incubations was sampledat the incubation depth with a peristaltic pump (Masterflex, Cole &Parmer Co.) and transferred directly into the incubation bottles,
previously cleaned with HCl (10%) and rinsed with distilled water inthe laboratory and then rinsed with lake water, together with the log-ger, in the field. The bottles were overfilled with three times the bottlevolumes and closed without bubbles. Dark replicates (n=3)were cov-ered with dark blue tape, then wrapped in aluminum foil and coveredwith black plastic bags. All transparent (n=3)anddark bottleswere in-cubated at 0.3 m for a minimum of 30 h and a maximum of 72 h. Incu-bations were done in the open water sampling sites with the exceptionof April and May when incubations were performed at an open watersite close to the floating lab. Profiles of underwater PARwere measuredto estimate Ed as described above.
2.4.1. Daily volumetric ratesDO changes (ΔDO) in the incubation bottles were calculated for
10 min intervals and then averaged for 30 min intervals. These averagevalueswere used to estimatemetabolic rates using values recorded dur-ing the first 24 h of incubations. Incubations began at ~6:00 AM (t0)which corresponded to sunrise. NCP was calculated by multiplying theΔDO values averaged for the transparent bottles during the daylight pe-riod (6:00 h to 18:00 h) by the number of intervals in this period (n =24). We assumed that CR was partially fueled by organic matter pro-duced by phytoplankton during the day and that ΔDO measured inthe dark bottles during this period probably underestimate this rate(Sadro et al., 2011, 2014). CR was therefore estimated from the sum ofthe average 30 min ΔDO values measured in the transparent bottles atnight (18:00 h to 6:00 h), after exposition to light during the day, di-vided by the number of 30 min ΔDO intervals during this period (n =24).We thenmultiplied this rate by the total number of 30min intervalsin a 24-hour day (n=48), assuming that night and daytime respirationrates were equivalent. This value of daily respiration (CRlight) was com-paredwith a parallel estimate of community respiration (CRdark), deter-mined from ΔDO values measured throughout the day in the dark
1385J.H.F. Amaral et al. / Science of the Total Environment 630 (2018) 1381–1393
bottles, to evaluate the importance of photosynthetically derived C dur-ing the preceding day for planktonic respiration measured overnight.Differences in how the two estimates were obtained are shown in theSupplementary material (Suppl. mat. Fig. 1). GPP was calculated as thedifference between NCP and daily CRlight rates, as GPP = NCP− CRlight,where CRlight is expressed as a negative value.
2.4.2. Daily depth integrated ratesDaily volumetric CRlight rateswere integrated through the daily aver-
age surface mixed layer depth (Zmix) and are expressed as CRLzmix. Thevalue of Zmix was estimated from theDO and temperature profilesmadewith the YSi probe and with the CTD profiles. We utilized a minimumtemperature gradient of 0.2 °C over the depth spacing of the tempera-ture profiles to identify the mixing depth. We calculated a Zmix foreach sampling time and averaged all values obtained during 24 h to es-timate daily Zmix.
NCP is a light-dependent process andmust be integratedwith depthto estimate daily integral production. To do this, we first calculated theaverage PAR in the mixed layer IZmix (μE m−2 s−1) according to Riley(1957),
IZmix ¼I0 1−e −Zmix Edð Þ� �
Zmix Ed
Zmix is the depth of the average daily mixed layer (m), Ed (m−1) isthe downwelling attenuation coefficient, and I0 (μE m−2 s−1) is dailymean incident irradiance. Second, we used an empirical relation(Fig. 3) between volumetric GPP,normalized per chlorophyll and the av-erage PAR in the incubated chambers, to estimate the GPP in the mixedlayer (GPPzmix) for each sampling site and each sampling occasion. Fi-nally, we subtracted the integrated volumetric respiration rate mea-sured in the light bottles (CRLZmix) from the estimated GPPzmix rate toobtain our integratedNCP rate (NCPzmix). This calculationwasnecessarybecause the relationship between NCP normalized to chlorophyll andaverage incident light was not significant. All rates were converted toC equivalent values using a respiratory quotient of 1. All integratedrates are expressed in g C m−2 d−1 to be comparable with the CO2
fluxes, and are expressed with the subscript Zmix,. A summary tablewith all codes and abbreviation is given in Supplementary material(Suppl. mat. Table 1).
2.5. CO2 dynamics and comparisons with metabolic rates
Levels of pCO2weremeasuredwith an off-axis integrated cavity out-put spectrometer (Ultraportable Greenhouse Gas Analyzer - UGGA, Los
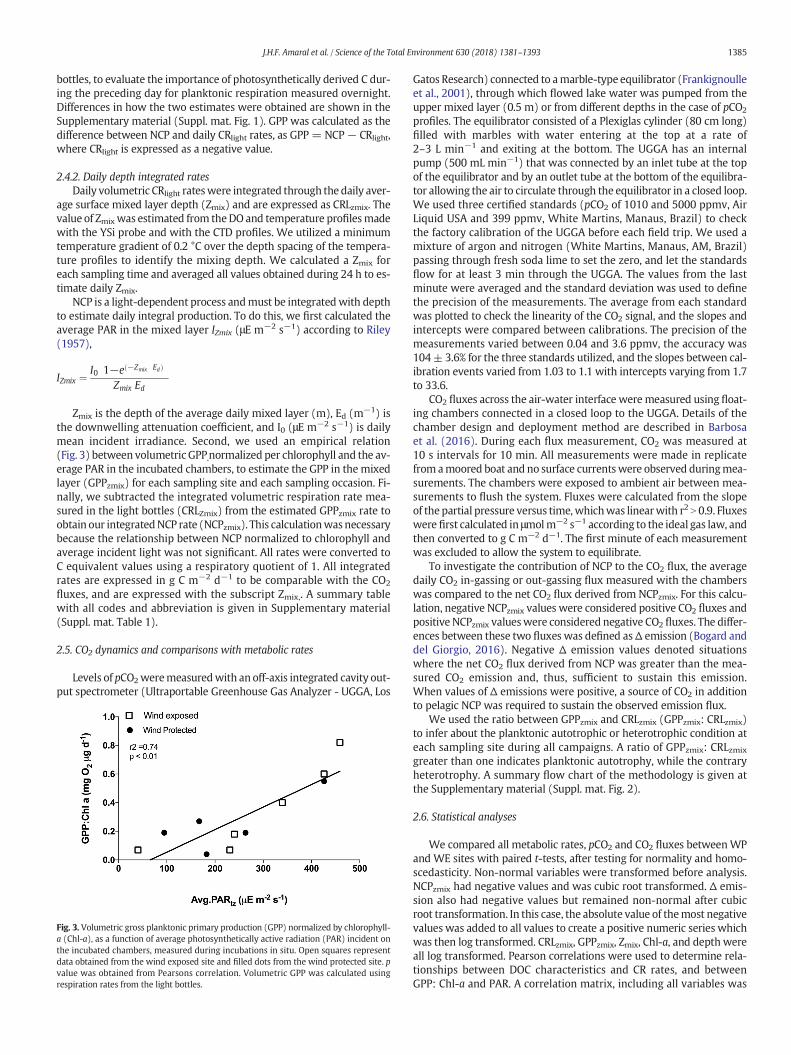
Fig. 3. Volumetric gross planktonic primary production (GPP) normalized by chlorophyll-a (Chl-a), as a function of average photosynthetically active radiation (PAR) incident onthe incubated chambers, measured during incubations in situ. Open squares representdata obtained from the wind exposed site and filled dots from the wind protected site. pvalue was obtained from Pearsons correlation. Volumetric GPP was calculated usingrespiration rates from the light bottles.
Gatos Research) connected to amarble-type equilibrator (Frankignoulleet al., 2001), through which flowed lake water was pumped from theupper mixed layer (0.5 m) or from different depths in the case of pCO2
profiles. The equilibrator consisted of a Plexiglas cylinder (80 cm long)filled with marbles with water entering at the top at a rate of2–3 L min−1 and exiting at the bottom. The UGGA has an internalpump (500 mL min−1) that was connected by an inlet tube at the topof the equilibrator and by an outlet tube at the bottom of the equilibra-tor allowing the air to circulate through the equilibrator in a closed loop.We used three certified standards (pCO2 of 1010 and 5000 ppmv, AirLiquid USA and 399 ppmv, White Martins, Manaus, Brazil) to checkthe factory calibration of the UGGA before each field trip. We used amixture of argon and nitrogen (White Martins, Manaus, AM, Brazil)passing through fresh soda lime to set the zero, and let the standardsflow for at least 3 min through the UGGA. The values from the lastminute were averaged and the standard deviation was used to definethe precision of the measurements. The average from each standardwas plotted to check the linearity of the CO2 signal, and the slopes andintercepts were compared between calibrations. The precision of themeasurements varied between 0.04 and 3.6 ppmv, the accuracy was104± 3.6% for the three standards utilized, and the slopes between cal-ibration events varied from 1.03 to 1.1 with intercepts varying from 1.7to 33.6.
CO2 fluxes across the air-water interface weremeasured using float-ing chambers connected in a closed loop to the UGGA. Details of thechamber design and deployment method are described in Barbosaet al. (2016). During each flux measurement, CO2 was measured at10 s intervals for 10 min. All measurements were made in replicatefrom amoored boat and no surface currentswere observed duringmea-surements. The chambers were exposed to ambient air between mea-surements to flush the system. Fluxes were calculated from the slopeof the partial pressure versus time,whichwas linearwith r2 N 0.9. Fluxeswere first calculated in μmolm−2 s−1 according to the ideal gas law, andthen converted to g C m−2 d−1. The first minute of each measurementwas excluded to allow the system to equilibrate.
To investigate the contribution of NCP to the CO2 flux, the averagedaily CO2 in-gassing or out-gassing flux measured with the chamberswas compared to the net CO2 flux derived from NCPzmix. For this calcu-lation, negative NCPzmix values were considered positive CO2 fluxes andpositive NCPzmix valueswere considered negative CO2 fluxes. The differ-ences between these two fluxes was defined asΔ emission (Bogard anddel Giorgio, 2016). Negative Δ emission values denoted situationswhere the net CO2 flux derived from NCP was greater than the mea-sured CO2 emission and, thus, sufficient to sustain this emission.When values of Δ emissions were positive, a source of CO2 in additionto pelagic NCP was required to sustain the observed emission flux.
We used the ratio between GPPzmix and CRLzmix (GPPzmix: CRLzmix)to infer about the planktonic autotrophic or heterotrophic condition ateach sampling site during all campaigns. A ratio of GPPzmix: CRLzmix
greater than one indicates planktonic autotrophy, while the contraryheterotrophy. A summary flow chart of the methodology is given atthe Supplementary material (Suppl. mat. Fig. 2).
2.6. Statistical analyses
We compared all metabolic rates, pCO2 and CO2 fluxes betweenWPand WE sites with paired t-tests, after testing for normality and homo-scedasticity. Non-normal variables were transformed before analysis.NCPzmix had negative values and was cubic root transformed. Δ emis-sion also had negative values but remained non-normal after cubicroot transformation. In this case, the absolute value of themost negativevalues was added to all values to create a positive numeric series whichwas then log transformed. CRLzmix, GPPzmix, Zmix, Chl-a, and depth wereall log transformed. Pearson correlations were used to determine rela-tionships between DOC characteristics and CR rates, and betweenGPP: Chl-a and PAR. A correlation matrix, including all variables was
1386 J.H.F. Amaral et al. / Science of the Total Environment 630 (2018) 1381–1393
used to identify auto-correlated variables. A principal component anal-ysis was then used to definemain components and help select variablesfor use in multiple linear regression models. Δ emissions, pCO2 and CO2
fluxes were used as response variables in different regression models.The lowest value of Akaike Information Criterion (AIC) index was usedto generate the best regression models. We adopted the 0.05 signifi-cance level throughout. Statistical analyses and graphics were donewith GraphPad Prism Version 7.01 and with R version 3.3.1 (R CoreTeam, 2015). Ocean Data View (Schlitzer, 2017) was used to plot thediel CO2, DO and temperature depth profiles.
3. Results
3.1. Environmental variables
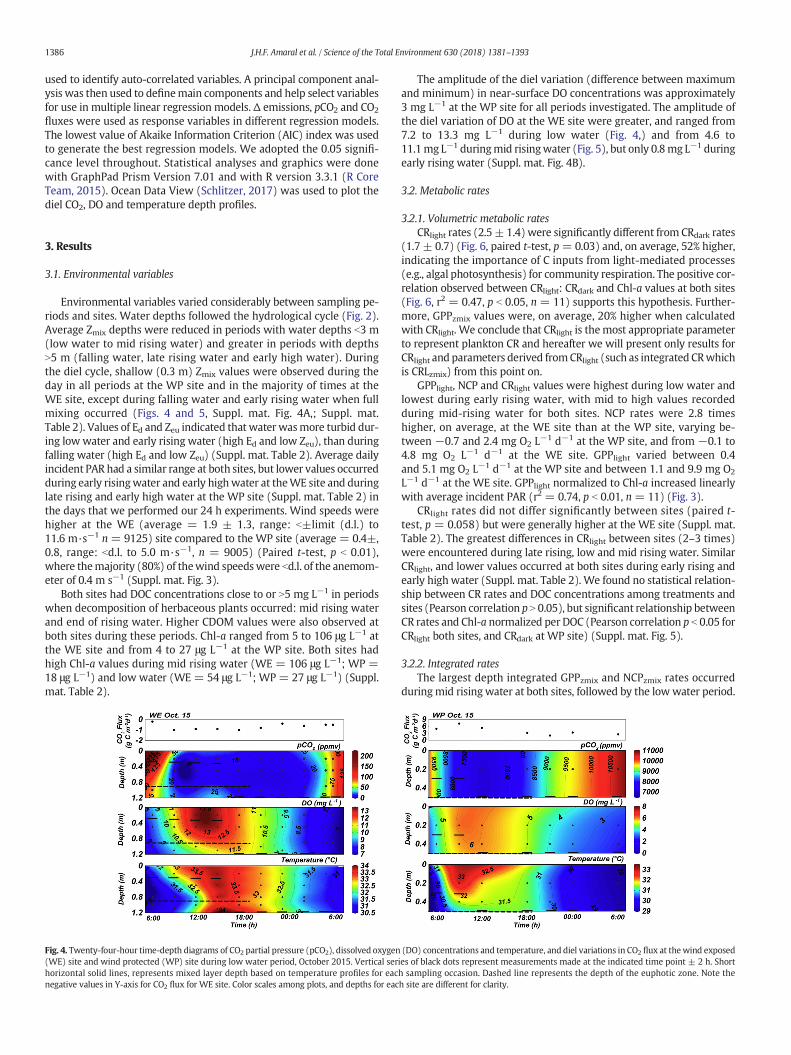
Environmental variables varied considerably between sampling pe-riods and sites. Water depths followed the hydrological cycle (Fig. 2).Average Zmix depths were reduced in periods with water depths b3 m(low water to mid rising water) and greater in periods with depthsN5 m (falling water, late rising water and early high water). Duringthe diel cycle, shallow (0.3 m) Zmix values were observed during theday in all periods at the WP site and in the majority of times at theWE site, except during falling water and early rising water when fullmixing occurred (Figs. 4 and 5, Suppl. mat. Fig. 4A,; Suppl. mat.Table 2). Values of Ed and Zeu indicated that water wasmore turbid dur-ing lowwater and early rising water (high Ed and low Zeu), than duringfalling water (high Ed and low Zeu) (Suppl. mat. Table 2). Average dailyincident PAR had a similar range at both sites, but lower values occurredduring early risingwater and early highwater at theWE site and duringlate rising and early high water at the WP site (Suppl. mat. Table 2) inthe days that we performed our 24 h experiments. Wind speeds werehigher at the WE (average = 1.9 ± 1.3, range: b±limit (d.l.) to11.6 m·s−1 n = 9125) site compared to the WP site (average = 0.4±,0.8, range: bd.l. to 5.0 m·s−1, n = 9005) (Paired t-test, p b 0.01),where themajority (80%) of thewind speedswere bd.l. of the anemom-eter of 0.4 m s−1 (Suppl. mat. Fig. 3).
Both sites had DOC concentrations close to or N5 mg L−1 in periodswhen decomposition of herbaceous plants occurred: mid rising waterand end of rising water. Higher CDOM values were also observed atboth sites during these periods. Chl-a ranged from 5 to 106 μg L−1 atthe WE site and from 4 to 27 μg L−1 at the WP site. Both sites hadhigh Chl-a values during mid rising water (WE = 106 μg L−1; WP =18 μg L−1) and low water (WE = 54 μg L−1; WP = 27 μg L−1) (Suppl.mat. Table 2).
Fig. 4. Twenty-four-hour time-depth diagrams of CO2 partial pressure (pCO2), dissolved oxygen(WE) site and wind protected (WP) site during low water period, October 2015. Vertical serhorizontal solid lines, represents mixed layer depth based on temperature profiles for eacnegative values in Y-axis for CO2 flux for WE site. Color scales among plots, and depths for eac
The amplitude of the diel variation (difference between maximumand minimum) in near-surface DO concentrations was approximately3 mg L−1 at the WP site for all periods investigated. The amplitude ofthe diel variation of DO at the WE site were greater, and ranged from7.2 to 13.3 mg L−1 during low water (Fig. 4,) and from 4.6 to11.1mg L−1 duringmid risingwater (Fig. 5), but only 0.8mg L−1 duringearly rising water (Suppl. mat. Fig. 4B).
3.2. Metabolic rates
3.2.1. Volumetric metabolic ratesCRlight rates (2.5 ± 1.4) were significantly different from CRdark rates
(1.7 ± 0.7) (Fig. 6, paired t-test, p= 0.03) and, on average, 52% higher,indicating the importance of C inputs from light-mediated processes(e.g., algal photosynthesis) for community respiration. The positive cor-relation observed between CRlight: CRdark and Chl-a values at both sites(Fig. 6, r2 = 0.47, p b 0.05, n = 11) supports this hypothesis. Further-more, GPPzmix values were, on average, 20% higher when calculatedwith CRlight. We conclude that CRlight is themost appropriate parameterto represent plankton CR and hereafter we will present only results forCRlight and parameters derived fromCRlight (such as integrated CRwhichis CRLzmix) from this point on.
GPPlight, NCP and CRlight values were highest during low water andlowest during early rising water, with mid to high values recordedduring mid-rising water for both sites. NCP rates were 2.8 timeshigher, on average, at the WE site than at the WP site, varying be-tween −0.7 and 2.4 mg O2 L−1 d−1 at the WP site, and from −0.1 to4.8 mg O2 L−1 d−1 at the WE site. GPPlight varied between 0.4and 5.1 mg O2 L−1 d−1 at the WP site and between 1.1 and 9.9 mg O2
L−1 d−1 at the WE site. GPPlight normalized to Chl-a increased linearlywith average incident PAR (r2 = 0.74, p b 0.01, n = 11) (Fig. 3).
CRlight rates did not differ significantly between sites (paired t-test, p = 0.058) but were generally higher at the WE site (Suppl. mat.Table 2). The greatest differences in CRlight between sites (2–3 times)were encountered during late rising, low and mid rising water. SimilarCRlight, and lower values occurred at both sites during early rising andearly high water (Suppl. mat. Table 2). We found no statistical relation-ship between CR rates and DOC concentrations among treatments andsites (Pearson correlation p N 0.05), but significant relationship betweenCR rates and Chl-a normalized per DOC (Pearson correlation p b 0.05 forCRlight both sites, and CRdark at WP site) (Suppl. mat. Fig. 5).
3.2.2. Integrated ratesThe largest depth integrated GPPzmix and NCPzmix rates occurred
duringmid rising water at both sites, followed by the lowwater period.
(DO) concentrations and temperature, and diel variations in CO2 flux at the wind exposedies of black dots represent measurements made at the indicated time point ± 2 h. Shorth sampling occasion. Dashed line represents the depth of the euphotic zone. Note theh site are different for clarity.

Fig. 5. Twenty-four-hour time-depth diagrams of CO2 partial pressure (pCO2), dissolved oxygen (DO) concentrations and temperature, and diel variations in CO2 flux at the wind exposedsite (WE) and wind protected (WP) site during mid-rising water, February 2016. Vertical series of black dots represent measurements made at the indicated time point ± 2 h. Shorthorizontal solid lines, represents mixed layer depth based on temperature profiles for each sampling occasion. Dashed line represents the depth of the euphotic zone. Dotted lineindicates zero value for CO2 flux, values below this line represent in-gassing fluxes. Color scales differ among plots and depths for each site are different for clarity.
1387J.H.F. Amaral et al. / Science of the Total Environment 630 (2018) 1381–1393
Both integrated rates were much greater (5 to 6 times greater) at theWE site compared to the WP site (Fig. 7, Suppl. mat. Table 2). HigherGPPzmix and NCPzmix rates coincided with periods with high incidentPAR and Chl-a values, and also with the highest values of the ratio ofGPPzmix: CRLzmix (Fig. 7; Suppl. mat. Table 2). Negative NCPzmix valueswere recorded at the WE site during the other periods when GPPzmix:CRLzmix values were lower than one. The lowest NCPzmix value at theWP site was recorded during late rising water, the only period whenGPPzmix: CRLzmix was lower than 1. The lowest GPPzmix at the WE site
Fig. 6. Comparisons between volumetric community respiration (CR) estimates. Theupper graph shows the rates estimated from the transparent bottles (CRlight) as afunction of the rates estimated in the dark bottles (CRdark). Dashed line represents the1:1 relation, open squares represent data obtained from the wind exposed site and filleddots from the wind protected site. The bottom graph in the bottom is the ratio betweenCRlight and CRdark as a function of chlorophyll-a (Chl-a). The p value was obtained fromPearson's correlation test and r square by linear regression.
(0.80 g C m−2 d−1) was recorded during early rising water. Similarlow values (0.80 and 0.95 g C m−2 d−1, respectively) were recorded atthe WP and WE sites during early high water (Fig. 7).
The highest CRLzmix at theWP site occurred duringmid risingwater,followed by late rising water, while the lowest rates were recorded atearly high water (Fig. 7, Suppl. mat. Table 2). The highest CRLzmix valuesat the WE site occurred during early high and falling water, while thelowest values were recorded during early rising water.
3.3. Metabolic rates and CO2 dynamics
We used average surface pCO2 values and CO2 fluxes obtained dur-ing the diel measurements to facilitate comparisons with metabolicrates. Daily average values of pCO2 were higher at the WP site than atthe WE site (paired t-test, p b 0.05). Daily mean pCO2 at the WE sitewas lowest during low water; daily mean pCO2 at the WP site in thesame period was 160 times higher. At this time, we observeddecomposing P. repensbordering theWP site. Inside themacrophyte de-bris, we measured an average pCO2 value of 56,640 μatm (minimum48,150-maximum66,290 μatm). The lowest daily average pCO2was en-countered at the WP site during falling water, while the highest valuewas recorded during mid rising water. At the WE site, the highestpCO2 value was recorded during the early rising water. Similar highvalues were encountered at the WE site during late rising water(Suppl. mat. Table 2). These high pCO2 values at WE site, coincidedwith the decay of herbaceous plants that occupied a large portion ofthe open water region of the lake in early January 2016, when floodingbegan (Suppl. mat. Fig. 6)
CO2 fluxes were generally higher at the WE site, except for periodswhen water was under-saturated in CO2 (low water and mid risingwater) (Figs. 4 and 5; Suppl. mat. Table 2). The highest daily averageCO2 fluxes for the WE and WP sites were recorded during early highwater. Among all diel measurements, the highest CO2 fluxes were re-corded during early and late rising water (Suppl. mat. Fig. 4B and C).The lowest average CO2 fluxes at the WE and WP sites were recordedduring low water and falling water, respectively. For the WE site, in-gassing fluxes were measured over the day and night during lowwater, and around noon during mid rising water (Figs. 4 and 5). Thelowest CO2 fluxes at the WP site occurred at the end of rising waterand during early rising water (Suppl. mat. Fig. 4B and C).
The difference betweenmeasured CO2 fluxes andNCPzmix orΔ emis-sion was positive for all periods at both sites, except during early highwater at the WE site, where the lowest and only negative Δ emissionvalue in the study was recorded (Fig. 8A). The highest Δ emissionvalue was record during the mid-rising water period at the WE site,

Fig. 7. Variation in integrated metabolic rates over the studied period. Bars represent different metabolic parameters; dark grey bar is integrated gross planktonic production (GPPzmix),light grey bar filled with squares is community respiration estimated from the light bottle (CRLzmix). Open circles represent the ratio between GPPzmix and CRLzmix. Abbreviation (n.d.)for the falling water period (September 2015) represents no data. Dotted line represents a value of 1 for the GPPzmix: CRLzmixratio.
1388 J.H.F. Amaral et al. / Science of the Total Environment 630 (2018) 1381–1393
the same periodwe registered the highestΔ emission values for theWPsite. The lowest Δ emission for the WP site was registered during thelate rising water period. Among the positive Δ emission values, fivewere associated with negative NCPzmix values, GPPzmix: CRLzmix lessthan one (planktonic heterotrophy) and CO2 out-gassing (Fig. 8,Suppl. mat. Table 2) and six were associated with positive NCPzmix,GPPzmix: CRLzmix N 1 (planktonic autotrophy) and CO2 out-gassing(Fig. 8, Suppl. mat. Table 2). The only negative Δ emission value, oc-curred when NCPzmix was negative and greater in absolute value thanthe measured CO2 flux. At this time, the GPPzmix: CRLzmix ratio was ex-ceptionally low and the plankton community generated more thanenough CO2 to sustain the observed out-gassing flux (Fig. 8, Suppl.mat. Table 2).
The PCA with all environmental variables separated sampling siteswith different levels of wind exposure (Suppl. mat. Fig. 7). CO2 dynam-ics was influenced by environmental variables associated with plank-tonic metabolism (Chl-a) and thermal structure (Zmix and windspeed). Variations in Chl-a and Zmix explained 73% of the observed var-iance in Δ emission while 77% of the variance in pCO2 was explained byspatial and temporal variations in CO2 flux and wind speed (multiplelinear regressions, Table 1). A single variable, Chl-a, explained 54% ofthe observed variance in CO2 flux (simple linear regression, Table 1).
3.4. Macrophyte and water level variations
The abundance of floating herbaceous macrophytes varied withchanges in water level. Near our sites, P. repenswas the dominant float-ing species during 2014 and 2015. Exceptionally low water levels re-corded during 2015, caused by a severe drought, led to the mortalityof P. repens and the emergence of large areas of bottom sediment thatwere quickly covered with L. spruceana and O.rufipogon (Suppl. mat.Fig. 6). When water levels started to rise in January and February2016, these areas were inundated and L. spruceana senesced and
decomposed. When water levels reached ~5 m (March–April),O. rufipogon also senesced and decomposed (Suppl. mat. Fig. 6).
4. Discussion
Our results demonstrate that seasonal variations in environmentalfactors and in the dynamics of floating herbaceous plants, linked towater level fluctuations, can have a strong influence on concentrationsand atmospheric fluxes of CO2 in the open water areas of Amazonianfloodplain lakes. Planktonic metabolism had a strong and direct influ-ence on CO2 dynamics at low water when vegetated habitats were ab-sent and in periods coinciding with high Chl-a values and high PAR.Large increases of pCO2 and CO2 fluxes coincidedwith the death and de-composition of rooted herbaceous plants following inundation. How-ever, most of the CO2 produced during these events was apparentlyabsorbed by NCPzmix (Fig. 8) and incorporated in plankton communitybiomass. Variations in wind exposure and, consequently, thermal struc-ture were important factors explaining differences in metabolic ratesand CO2 dynamics between sites in a given season (Table 1, Suppl.mat. Fig. 7). CR measured at night in clear bottles, exposed to sunlightduring the day, was higher than that measured in dark bottles throughthe day (Fig. 6), demonstrating the importance of organic C produced byphytoplankton in fueling plankton CR.
4.1. Metabolic rates and environmental variables
Our depth integrated daily GPP estimates (GPPzmix) were highcompared with values reported for other Amazon floodplain lakes.Melack and Forsberg (2001) reported GPP rates between 0.4 and 1.2 gC m−2 d−1 for Lake Calado, similar to the lowest values found in ourstudy. In a study of plankton metabolism in eight central Amazonfloodplain lakes, Forsberg et al. (2017) found daily integral GPP tovary between 0.1 and 11.6 g C m−2 d−1 with an overall average of

Fig. 8. The Influence of integrated net community production (NCPzmix, g C m−2 d−1) on(A) Δ emission (g C m−2 d−1): difference between daily average CO2 fluxes andestimated NCPzmix and (B) the daily average CO2 flux (g C m−2·d−1). Filled circlesrepresent periods when the ratio between GPPzmix and CRLzmix was lower than one, andopen circles represent the opposite. Dashed line in Fig. A represents the 1:1 relation,from which it is possible to interpret the residuals.
1389J.H.F. Amaral et al. / Science of the Total Environment 630 (2018) 1381–1393
2.6 g C m−2 d−1, close to the range we found at the WP site (0.8–6.8 gCm−2 d−1). The Chl-a range thatwe reported is one order ofmagnitudehigher than the range reported for L. Calado (1–10 μg L−1) (Melack andForsberg, 2001), but in the range reported by Forsberg et al. (2017)(1.8–142.8 μg L−1). The positive linear relationship we found betweenChl-a specific GPP and average incident PAR (Fig. 3) indicates that aver-age incident PAR did not exceed the saturation value for photosynthesis,and this relationship could be used to estimate daily integral photosyn-thesis. The highest GPPzmix values at the WE site coincided with higherChl-a and PAR values (low water and mid rising water), reflecting thecausal relationship between these variables (Fig. 3). GPPzmix values atthe WE site for other periods were in the range reported by Forsberget al. (2017).
In comparison to results reported for other open water environ-ments along the Amazon floodplain, our volumetric CR rates (CRdark
and CRlight) were higher than those based on dark incubations withoutexposure to natural sunlight during a complete diel cycle. Our lowestCRdark respiration rates (0.8 mg O2 L−1 d−1), were two times higherthan the upper range reported in previous studies in other floodplainlakes, and two to four times the average rates in these studies (de
Table 1Multiple regressions coefficients (ß) and intercept (ß0) of the bestmodels for delta emission (Δsphere (CO2 flux).
Best model βlogChl-a βlogzmix βCO2 Flux
log (x + 3) Δ emission logChl-a, logzmix 0.456 −0.5792pCO2 CO2 Flux, wind 449.6CO2 flux logChl-a −4.929
Rasera, 2010; Vidal et al., 2015). Our highest CRdark rates for the WPand WE sites were 10 times and 18 times higher, respectively, thanthe average values cited in these studies. However, our integratedCRDzmix respiration rates (overall average 3 g C m−2 d−1, minimum0.4 and maximum 10.1 g C m−2 d−1) were in the range reported in astudy of eight central Amazon floodplain lakes, including our studysite (Forsberg et al., 2017) (mean: 6.2 g C m−2 d−1, minimum 0.16and maximum 31.3 g C m−2 d−1). Compared to a study that compiledCR rates in lakes from different latitudes, our rates were similar orhigher than the average rates (Solomon et al., 2013).
4.2. Implications and insights from incubations
That we found higher night-time respiration rates in transparentchambers exposed to natural sunlight during the day (CRlight) than inchambers maintained in darkness throughout the incubation CRdark
(Fig. 6) is relevant to understanding bacterial metabolism and its rela-tion to substrate quality in Amazonian floodplains. As in other studiesin the Amazon basin (Benner et al., 1995; Ellis et al., 2012; Vidal et al.,2015; Ward et al., 2016) and elsewhere (del Giorgio and le Williams,2005a, 2005b; Solomon et al., 2013), we found little correlation be-tween CR and bulk DOC concentrations. In lakes and other aquatic eco-systems along Amazonian floodplains, the DOC pool is a mixture ofrefractory organic matter and rapidly cycling labile C (Waichman,1996; Mayorga et al., 2005). Evidence from isotopic measurements ofrespired CO2 and fatty acids indicates that bacterial respiration alongthe central Amazon floodplain is sustained predominantly by DOCfrom C4 plants (Quay et al., 1992; Waichman, 1996; Mortillaro et al.,2016). Others, with less direct evidence, suggest that terrestrial C isalso important (Ward et al., 2013, 2016). Ward et al. (2016) suggestthat there is a priming effect on breakdown of both terrestrially derivedC and aquatic plants in the presence of algal C. In addition, they suggestthat the reactivity of an organic molecule is dependent on the complexinteraction between microbial community composition and environ-mental factors that might vary on short time scales (minutes tohours). Finally, the availability of DOC for bacteria is dependent on mo-lecular composition and size (Amon and Benner, 1996). The higher CRrates that we measured in transparent chambers suggest that organicmatter derived from phytoplankton photosynthesis is an important Csource for heterotrophic bacterioplankton. The positive correlationswe found between Chl-a and CR rates measured in both dark andclear chambers (Fig. 6), as well as DOC-normalized Chl-a and CR rates(Suppl. mat. Fig. 5) supports this hypothesis and the conclusions ofother studies investigating this relationship in Amazonian rivers (Elliset al., 2012) and other inland waters (Sadro et al., 2011; Morana et al.,2014). However, phytoplankton also contribute directly to planktonCR and part of increase in CR rates observed in the transparent cham-bers could be due to the increased metabolic activity of phytoplanktonat night as they utilize internal C stores accumulated during the day(Forsberg, 1985). Finally, we assumed that CR measured during thenight in a chamber exposed to light during previous day was equal toCR occurring during the day. This may have led to an underestimate ofdaily CR since there is evidence that CR during the day may be higherthan that measured at night (del Giorgio and le Williams, 2005a,2005b; Pringault et al., 2007).
We report the first measurements of planktonic metabolic rates es-timated using continuous records of DO in larger (2.1 L) transparent
emission), carbon dioxide partial pressure (pCO2), and carbon dioxide fluxes to the atmo-
βwind β0 r2 p F statistic AIC
0.4178 0.73 1.9 × 10⁻³ 14.9(2,8) −0.355−3605.3 8777 0.77 1.1 × 10⁻³ 17.9 (2,8) 199.53
9.923 0.54 5.5 × 10⁻³ 13.19 (2,8) 49.14
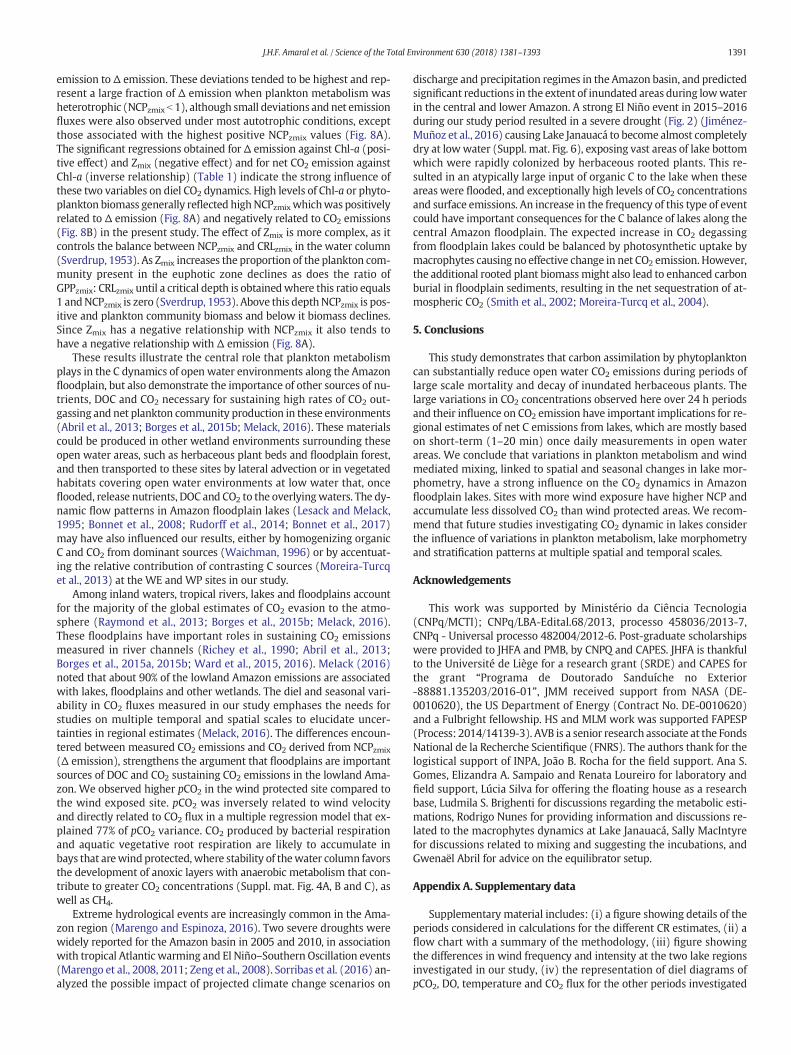
Fig. 9.Dissolved CO2 concentration as a function of dissolved oxygen (DO). Dots representall surface records (n=75) over the studied period. The p value was obtained by Person'scorrelation test and r square by linear regression. Top smaller graph shows the samecorrelation, but with dissolved CO2 values greater or equal to 0.6 mg L−1.
1390 J.H.F. Amaral et al. / Science of the Total Environment 630 (2018) 1381–1393
and dark chambers incubated in Amazon floodplain lakes. The rangesreported for NCP, GPP and CR rates in our study were in agreementwith a compilation of metabolic rates estimated from diel free watermeasurements of DO changes in 25 lakes around the globe, with daily,annual and seasonal estimates of GPP (0.4–25 mg O2 L−1 d−1), NCP(−1–10 mg O2 L−1 d−1) and CR (0.4–20 mg O2 L−1 d−1) (Solomonet al., 2013). The use of continuous records of DO in incubations, in par-allel with free water measurements, would improve understanding oflake metabolism in floodplains, allowing investigation of the separateroles of pelagic and littoral metabolism on CO2 dynamics (Van deBogert et al., 2007). This approach could help to elucidate spatial differ-ences reported in floodplain lakes and associated with the vegetatedareas (Hamilton et al., 1995; Rudorff et al., 2011; Peixoto et al., 2016), al-though themass balance computations of the freewatermeasurementsrequire to account for lateral and vertical DO input (Sadro et al., 2014).We chose to perform our incubations in closed chambers to isolatethese interferences. Transport of lateral and vertical water masseswith contrastingDO concentrations has been observed in an Amazonianfloodplain lake (Melack and Fisher, 1983; MacIntyre and Melack, 1995)and in other lakes and wetlands (MacIntyre et al., 2010; Tedford et al.,2014; Poindexter et al., 2016). We recommend that future studies com-pare metabolic rates derived from free water DO sensors and DO sen-sors insolated in clear chambers to better understand the participationof plankton metabolism and lateral and vertical advection in the ob-served diel DO changes.
The higher metabolic rates reported here, when compared to earlierAmazonian studies, may be due to three factors: (1) a larger water vol-ume in the incubations (2.1 L compared to volumes equal or b60 mL inmost studies), (2) estimates based on continuous DO records and(3) our in situ incubations resulted in slightmixingwithin the chamberswhich would keep plankton in suspension. Large incubation containersare more likely to capture larger plankton organisms which contributeto community respiration (Hopkinson and Smith, 2005). Discrete sam-ples at the beginning and end of incubations can lead to underestimatesor overestimations of bacterial respiration rates, compared to rates esti-mated by continuous DO measurements (Briand et al., 2004).
4.3. Plankton metabolism and its influence on CO2 dynamics
At the WE site during low water (October 2015), surface waterswere under-saturated in CO2 relative to atmospheric equilibriumduringthe diel cycle and negative CO2 fluxes were computed (Fig. 4). DO levelswere supersaturated during the same period and inversely correlatedwith CO2 throughout the day (Figs. 4 and 9), indicating that the varia-tion in both biogenic gases was tightly controlled by planktonic metab-olism. The highest volumetric metabolic rates in the study wererecorded for both sites during the low water period. When the waterlevel falls, the connection of floodplains lakes to surrounding emergentvegetation is reduced and pelagic processes, like plankton metabolism,tend to dominate CO2 dynamics (Melack and Engle, 2009; Abril et al.,2013). This may explain the CO2 dynamics observed at the WE site atlow water. However, decomposing herbaceous plants (P. repens) mayhave also contributed to the high pCO2 values (daily average 8427μatm) and high CO2 fluxes (average 4.1 g C m−2 d−1) observed at theWP site during low water.
In February 2016, one month after the decay of debris fromL. spruceana, surface waters were super-saturated in CO2 relative to at-mospheric equilibrium and positive CO2 fluxes were observed at theWE site on a daily basis, in parallel with high positive NCPzmix, thehighest Chl-a in the study, and GPPzmix: CRLzmix ratio greater than one,indicating planktonic autotrophy, but with consistent out-gassing. Dur-ing the same period, negative CO2 in gassing fluxes and waters under-saturated in CO2 were observed around noon, confirming the dominantinfluence of planktonic metabolism on the diel CO2 cycle at this time(Fig. 5). NCPzmix was positive and 29 times greater than the daily aver-age CO2 flux. These results indicate that the majority of the dissolved
CO2 generated by the decaying plants was taken up by the planktoniccommunity and converted into biomass. What was confirmed by thehighest GPPzmix value recorded in our study during the same period. Re-sults from batch incubations with a variety of plant species present inLake Janauacá, demonstrated the release of large amounts of nutrientsduring decomposition (Mortillaro et al., 2016). A similar release of nu-trients and CO2 presumably sustained the high levels of NCPzmix ob-served during this period.
Bogard and del Giorgio (2016), studying 187 boreal lakes, estimatednet ecosystem production (NEP) indirectly from deviations in DO satu-ration under a steady state assumption. They demonstrated that evenlakes with net planktonic autotrophic conditions (one third of the stud-ied lakes, with positiveΔ emission and NEP values) are likely sources ofCO2 to the atmosphere, due to external inputs of CO2 and that NEP inplanktonic heterotrophic lakes can mirror the external inputs of CO2.Negative Δ emissions, in this context, denoted situations where the ex-cess of CO2 produced by NEP was more than sufficient to support theCO2 emissions, similar to what we observed during the early highwater at the WE site, considering only plankton community NCP.
In our study, Δ emission represented the balance between net dailyCO2 production by the plankton community and net daily CO2 emissionto the atmosphere. When Δ emission is zero, all emissions can beaccounted for by net planktonic CO2 production or respiration by theplankton community. When it is negative, net planktonic CO2 produc-tion exceeds emission and when it's positive, other sources of CO2 arerequired to account for both emission and net carbon uptake by theplankton community. The relative contributions of NCPzmix and CO2
emissions toΔ emission can be evaluated by plottingΔ emission againstNCPzmix (Fig. 8A). The distribution of points is described by the relation-ship:
Δ emission ¼ NCPzmix þ net daily CO2 emission
When net CO2 emission is zero, all data are expected to fall along a1:1 line where Δ emission = NCPzmix (Fig. 8A). Positive deviationsfrom this line represent the additional contribution of net daily CO2
emission to Δ emission. Values of NCPzmix greater or b1 represent situ-ation where plankton metabolism is autotrophic or heterotrophic, re-spectively. Δ emission was strongly correlated to NCPzmix in this study(r2 = 0.94, p b 0.001, n = 11), with most points falling close to the1:1 equivalence line, indicating the dominant influence of planktonme-tabolism on the CO2 dynamics of this lake. The equivalence between Δemission and NCPzmix was strongest when plankton metabolism wasautrotrophic (NCPzmix N 1) and increased with the level of NCPzmix,reaching near equivalence at the highest NCPzmix rates observed at thewind exposed sites during low andmid rising water. Positive deviationsfor the 1:1 line represented the additional contribution of net CO2
1391J.H.F. Amaral et al. / Science of the Total Environment 630 (2018) 1381–1393
emission to Δ emission. These deviations tended to be highest and rep-resent a large fraction of Δ emission when plankton metabolism washeterotrophic (NCPzmixb 1), although small deviations andnet emissionfluxes were also observed under most autotrophic conditions, exceptthose associated with the highest positive NCPzmix values (Fig. 8A).The significant regressions obtained for Δ emission against Chl-a (posi-tive effect) and Zmix (negative effect) and for net CO2 emission againstChl-a (inverse relationship) (Table 1) indicate the strong influence ofthese two variables on diel CO2 dynamics. High levels of Chl-a or phyto-plankton biomass generally reflected highNCPzmixwhichwas positivelyrelated to Δ emission (Fig. 8A) and negatively related to CO2 emissions(Fig. 8B) in the present study. The effect of Zmix is more complex, as itcontrols the balance between NCPzmix and CRLzmix in the water column(Sverdrup, 1953). As Zmix increases the proportion of the plankton com-munity present in the euphotic zone declines as does the ratio ofGPPzmix: CRLzmix until a critical depth is obtainedwhere this ratio equals1 andNCPzmix is zero (Sverdrup, 1953). Above this depthNCPzmix is pos-itive and plankton community biomass and below it biomass declines.Since Zmix has a negative relationship with NCPzmix it also tends tohave a negative relationship with Δ emission (Fig. 8A).
These results illustrate the central role that plankton metabolismplays in the C dynamics of open water environments along the Amazonfloodplain, but also demonstrate the importance of other sources of nu-trients, DOC and CO2 necessary for sustaining high rates of CO2 out-gassing and net plankton community production in these environments(Abril et al., 2013; Borges et al., 2015b; Melack, 2016). These materialscould be produced in other wetland environments surrounding theseopen water areas, such as herbaceous plant beds and floodplain forest,and then transported to these sites by lateral advection or in vegetatedhabitats covering open water environments at low water that, onceflooded, release nutrients, DOC and CO2 to the overlyingwaters. The dy-namic flow patterns in Amazon floodplain lakes (Lesack and Melack,1995; Bonnet et al., 2008; Rudorff et al., 2014; Bonnet et al., 2017)may have also influenced our results, either by homogenizing organicC and CO2 from dominant sources (Waichman, 1996) or by accentuat-ing the relative contribution of contrasting C sources (Moreira-Turcqet al., 2013) at the WE and WP sites in our study.
Among inland waters, tropical rivers, lakes and floodplains accountfor the majority of the global estimates of CO2 evasion to the atmo-sphere (Raymond et al., 2013; Borges et al., 2015b; Melack, 2016).These floodplains have important roles in sustaining CO2 emissionsmeasured in river channels (Richey et al., 1990; Abril et al., 2013;Borges et al., 2015a, 2015b; Ward et al., 2015, 2016). Melack (2016)noted that about 90% of the lowland Amazon emissions are associatedwith lakes, floodplains and other wetlands. The diel and seasonal vari-ability in CO2 fluxes measured in our study emphases the needs forstudies on multiple temporal and spatial scales to elucidate uncer-tainties in regional estimates (Melack, 2016). The differences encoun-tered between measured CO2 emissions and CO2 derived from NCPzmix
(Δ emission), strengthens the argument that floodplains are importantsources of DOC and CO2 sustaining CO2 emissions in the lowland Ama-zon. We observed higher pCO2 in the wind protected site compared tothe wind exposed site. pCO2 was inversely related to wind velocityand directly related to CO2 flux in a multiple regression model that ex-plained 77% of pCO2 variance. CO2 produced by bacterial respirationand aquatic vegetative root respiration are likely to accumulate inbays that arewind protected, where stability of thewater column favorsthe development of anoxic layers with anaerobic metabolism that con-tribute to greater CO2 concentrations (Suppl. mat. Fig. 4A, B and C), aswell as CH4.
Extreme hydrological events are increasingly common in the Ama-zon region (Marengo and Espinoza, 2016). Two severe droughts werewidely reported for the Amazon basin in 2005 and 2010, in associationwith tropical Atlantic warming and El Niño–Southern Oscillation events(Marengo et al., 2008, 2011; Zeng et al., 2008). Sorribas et al. (2016) an-alyzed the possible impact of projected climate change scenarios on
discharge and precipitation regimes in the Amazon basin, and predictedsignificant reductions in the extent of inundated areas during lowwaterin the central and lower Amazon. A strong El Niño event in 2015–2016during our study period resulted in a severe drought (Fig. 2) (Jiménez-Muñoz et al., 2016) causing Lake Janauacá to become almost completelydry at lowwater (Suppl. mat. Fig. 6), exposing vast areas of lake bottomwhich were rapidly colonized by herbaceous rooted plants. This re-sulted in an atypically large input of organic C to the lake when theseareas were flooded, and exceptionally high levels of CO2 concentrationsand surface emissions. An increase in the frequency of this type of eventcould have important consequences for the C balance of lakes along thecentral Amazon floodplain. The expected increase in CO2 degassingfrom floodplain lakes could be balanced by photosynthetic uptake bymacrophytes causing no effective change in net CO2 emission. However,the additional rooted plant biomass might also lead to enhanced carbonburial in floodplain sediments, resulting in the net sequestration of at-mospheric CO2 (Smith et al., 2002; Moreira-Turcq et al., 2004).
5. Conclusions
This study demonstrates that carbon assimilation by phytoplanktoncan substantially reduce open water CO2 emissions during periods oflarge scale mortality and decay of inundated herbaceous plants. Thelarge variations in CO2 concentrations observed here over 24 h periodsand their influence on CO2 emission have important implications for re-gional estimates of net C emissions from lakes, which are mostly basedon short-term (1–20 min) once daily measurements in open waterareas. We conclude that variations in plankton metabolism and windmediated mixing, linked to spatial and seasonal changes in lake mor-phometry, have a strong influence on the CO2 dynamics in Amazonfloodplain lakes. Sites with more wind exposure have higher NCP andaccumulate less dissolved CO2 than wind protected areas. We recom-mend that future studies investigating CO2 dynamic in lakes considerthe influence of variations in plankton metabolism, lake morphometryand stratification patterns at multiple spatial and temporal scales.
Acknowledgements
This work was supported by Ministério da Ciência Tecnologia(CNPq/MCTI); CNPq/LBA-Edital.68/2013, processo 458036/2013-7,CNPq - Universal processo 482004/2012-6. Post-graduate scholarshipswere provided to JHFA and PMB, by CNPQ and CAPES. JHFA is thankfulto the Université de Liège for a research grant (SRDE) and CAPES forthe grant “Programa de Doutorado Sanduíche no Exterior-88881.135203/2016-01”, JMM received support from NASA (DE-0010620), the US Department of Energy (Contract No. DE-0010620)and a Fulbright fellowship. HS and MLM work was supported FAPESP(Process: 2014/14139-3). AVB is a senior research associate at the FondsNational de la Recherche Scientifique (FNRS). The authors thank for thelogistical support of INPA, João B. Rocha for the field support. Ana S.Gomes, Elizandra A. Sampaio and Renata Loureiro for laboratory andfield support, Lúcia Silva for offering the floating house as a researchbase, Ludmila S. Brighenti for discussions regarding the metabolic esti-mations, Rodrigo Nunes for providing information and discussions re-lated to the macrophytes dynamics at Lake Janauacá, Sally MacIntyrefor discussions related to mixing and suggesting the incubations, andGwenaël Abril for advice on the equilibrator setup.
Appendix A. Supplementary data
Supplementary material includes: (i) a figure showing details of theperiods considered in calculations for the different CR estimates, (ii) aflow chart with a summary of the methodology, (iii) figure showingthe differences in wind frequency and intensity at the two lake regionsinvestigated in our study, (iv) the representation of diel diagrams ofpCO2, DO, temperature and CO2 flux for the other periods investigated

1392 J.H.F. Amaral et al. / Science of the Total Environment 630 (2018) 1381–1393
in our study at the two regions of the lake that differ in their wind expo-sure. (v) CR rates as a function of Chl-a normalized per DOC for theWEandWP sites, (vi) Sequential Landsat images showing the changes thatoccurred in the lake during the extreme drough t which affected theherbaceous dynamics, (vii) PCA representation of the environmentalvariables considered in our study, and a table with all abbreviationsused at the manuscript and a table with all data used. Supplementarydata to this article can be found online at https://doi.org/10.1016/j.scitotenv.2018.02.331.
References
Abril, G., Martinez, J.-M., Artigas, L.F., Moreira-Turcq, P., Benedetti, M.F., Vidal, L., Meziane,T., Kim, J.-H., Bernardes, M.C., Savoye, N., Deborde, J., Souza, E.L., Albéric, P., Landim deSouza, M.F., Roland, F., 2013. Amazon River carbon dioxide outgassing fuelled bywet-lands. Nature 505, 395–398.
Alin, S.R., de Fátima, F.L., Rasera, M., Salimon, C.I., Richey, J.E., Holtgrieve, G.W., Krusche,A.V., Snidvongs, A., 2011. Physical controls on carbon dioxide transfer velocity andflux in low-gradient river systems and implications for regional carbon budgets. J.Geophys. Res. Biogeosci. 116, G01009.
Almeida, R.M., Pacheco, F.S., Barros, N., Rosi, E., Roland, F., 2017. Extreme floods increaseCO2 outgassing from a large Amazonian river: extreme floods increase CO2
outgassing. Limnol. Oceanogr. 62 (3), 989–999.Amon, R.M., Benner, R., 1996. Bacterial utilization of different size classes of dissolved or-
ganic matter. Limnol. Oceanogr. 41, 41–51.Barbosa, P.M., Melack, J.M., Farjalla, V.F., Amaral, J.H.F., Scofield, V., Forsberg, B.R., 2016.
Diffusive methane fluxes from Negro, Solimões and Madeira rivers and fringinglakes in the Amazon basin. Limnol. Oceanogr. 61, 221–237.
Benner, R., Opsahl, S., Chin-Leo, G., Richey, J.E., Forsberg, B.R., 1995. Bacterial carbon me-tabolism in the Amazon River system. Limnol. Oceanogr. 40, 1262–1270.
Bogard, M.J., del Giorgio, P.A., 2016. The role of metabolism in modulating CO2 fluxes inboreal lakes. Glob. Biogeochem. Cycles 30, 1509–1525.
Bonnet, M.-P., Barroux, G., Martinez, J.-M., Seyler, F., Moreira-Turcq, P., Cochonneau, G.,Melack, J.M., Resende Boaventura, G., Bourgoin, L.M., León, J.G., 2008. Floodplain hy-drology in an Amazon floodplain lake (Lago Grande de Curuaí). J. Hydrol. 349, 18–30.
Bonnet, M.-P., Pinel, S., Garnier, J., Bois, J., Resende Boaventura, G., Seyler, P., MottaMarques, D., 2017. Amazonian floodplain water balance based on modelling andanalyses of hydrologic and electrical conductivity data. Hydrol. Process. 31,1702–1718.
Borges, A.V., Morana, C., Bouillon, S., Servais, P., Descy, J.P., Darchambeau, F., 2014. Carboncycling of Lake Kivu (East Africa): net autotrophy in the epilimnion and emission ofCO2 to the atmosphere sustained by geogenic inputs. PLoS One 9 (10), e109500.
Borges, A.V., Abril, G., Darchambeau, F., Teodoru, C.R., Deborde, J., Vidal, L.O., Lambert, T.,Bouillon, S., 2015a. Divergent biophysical controls of aquatic CO2 and CH4 in theWorld's two largest rivers. Sci. Rep. 5, 15614.
Borges, A.V., Darchambeau, F., Teodoru, C.R., Marwick, T.R., Tamooh, F., Geeraert, N.,Omengo, F.O., Guérin, F., Lambert, T., Morana, C., Okuku, E., Bouillon, S., 2015b. Glob-ally significant greenhouse-gas emissions from African inland waters. Nat. Geosci. 8,637–642.
Briand, E., Pringault, O., Jacquet, S., Torreton, J.P., 2004. The use of oxygen microprobes tomeasure bacterial respiration for determining bacterioplankton growth efficiency.Limnol. Oceanogr. Methods 2, 406–416.
Brito, B.C., Forsberg, B.R., Kasper, D., Amaral, J.H.F., de Vasconcelos, M.R.R., de Sousa, O.P.,Cunha, F.A.G., Bastos, W.R., 2016. The influence of inundation and lake morphometryon the dynamics of mercury in the water and plankton in an Amazon floodplain lake.Hydrobiologia 1–14.
Cole, J.J., Pace, M.L., Carpenter, S.R., Kitchell, J.F., 2000. Persistence of net heterotrophy inlakes during nutrient addition and food web manipulations. Limnol. Oceanogr. 45,1718–1730.
Devol, A.H., Richey, J.E., Clark, W.A., King, S.L., Martinelli, L.A., 1988. Methane emissions tothe troposphere from the Amazon floodplain. J. Geophys. Res.-Atmos. 93, 1583–1592.
Devol, A.H., Forsberg, B.R., Richey, J.E., Pimentel, T.P., 1995. Seasonal variation in chemicaldistributions in the Amazon (Solimões) River: a multiyear time series. Glob.Biogeochem. Cycles 9, 307–328.
Dubois, K., Carignan, R., Veizer, J., 2009. Can pelagic net heterotrophy account for carbonfluxes from eastern Canadian lakes? Appl. Geochem. 24, 988–998.
Ellis, E.E., Richey, J.E., Aufdenkampe, A.K., Krusche, A.V., Quay, P.D., Salimon, C., da Cunha,H.B., 2012. Factors controlling water-column respiration in rivers of the central andsouthwestern Amazon Basin. Limnol. Oceanogr. 57, 527–540.
Engle, D.L., Melack, J.M., Doyle, R.D., Fisher, T.R., 2007. High rates of net primary produc-tion and turnover of floating grasses on the Amazon floodplain: implications foraquatic respiration and regional CO2 flux: NPP and turnover of Amazon floatinggrasses. Glob. Chang. Biol. 14, 369–381.
Forsberg, B.R., 1985. The fate of planktonic primary production. Limnol. Oceanogr. 30,807–819.
Forsberg, B.R., Devol, A.H., Richey, J.E., Martinelli, L.A., dos Santos, H., 1988. Factors con-trolling nutrient concentrations in Amazon floodplain lakes. Limnol. Oceanogr. 33,41–56.
Forsberg, B.R., Melack, J.M., Richey, J.E., Pimentel, T.P., 2017. Regional and seasonal vari-ability in planktonic photosynthesis and planktonic community respiration in Ama-zon floodplain lakes. Hydrobiologia 800, 187–206.
Frankignoulle, M., Borges, A., Biondo, R., 2001. A new design of equilibrator to monitorcarbon dioxide in highly dynamic and turbid environments. Water Res. 35,1344–1347.
del Giorgio, P.A., le Williams, P.J.B., 2005a. The global significance of respiration in aquaticecosystems: from single cells to the biosphere. In: del Giorgio, P.A.,Williams, P. (Eds.),Respiration in Aquatic Ecosystems. Academic Press, New York, New York,pp. 267–303.
del Giorgio, P.A., le Williams, P.J.B., 2005b. Respiration in Aquatic Ecosystems. New York.Academic Press, New York (326p).
del Giorgio, P.A., Cole, J.J., Caraco, N.F., Peters, R.H., 1999. Linking planktonic biomass andmetabolism to net gas fluxes in northern temperate lakes. Ecology 80, 1422–1431.
Gloor, M., Brienen, R.J.W., Galbraith, D., Feldpausch, T.R., Schöngart, J., Guyot, J.-L.,Espinoza, J.C., Lloyd, J., Phillips, O.L., 2013. Intensification of the Amazon hydrologicalcycle over the last two decades. Geophys. Res. Lett. 40, 1729–1733.
Hamilton, S.K., Sippel, S.J., Melack, J.M., 1995. Oxygen depletion and carbon dioxide andmethane production in waters of the Pantanal wetland of Brazil. Biogeochemistry30, 115–141.
Hopkinson, C.S., Smith, E.M., 2005. Estuarine respiration: an overview of benthic, pelagic,and whole system respiration. In: del Giorgio, P.A., Williams, P. (Eds.), Respiration inAquatic Ecosystems. Academic Press, New York, New York, pp. 122–146.
Jiménez-Muñoz, J.C., Mattar, C., Barichivich, J., Santamaría-Artigas, A., Takahashi, K., Malhi,Y., Sobrino, J.A., van der, Schrier G., 2016. Record-breaking warming and extremedrought in the Amazon rainforest during the course of El Niño 2015–2016. Sci. Rep.6, 33130.
Johnson, M.S., Lehmann, J., Riha, S.J., Krusche, A.V., Richey, J.E., Ometto, J.P.H.B., Couto, E.G.,2008. CO2 efflux from Amazonian headwater streams represents a significant fate fordeep soil respiration. Geophys. Res. Lett. 35, L17401.
Junk, W.J., Bayley, P.B., Sparks, R.E., 1989. The flood pulse concept in river-floodplain sys-tems. Can. Spec. Publ. Fish. Aquat. Sci. 106, 110–127.
Lauerwald, R., Laruelle, G.G., Hartmann, J., Ciais, P., Regnier, P.A.G., 2015. Spatial patternsin CO2 evasion from the global river network. Glob. Biogeochem. Cycles 29, 534–554.
Lesack, L.F., Melack, J.M., 1995. Flooding hydrology and mixture dynamics of lake waterderived from multiple sources in an Amazon floodplain lake. Water Resour. Res. 31,329–345.
MacIntyre, S., Melack, J.M., 1995. Vertical and horizontal transport in lakes: linking littoral,benthic, and pelagic habitats. J. N. Am. Benthol. Soc. 14, 599–615.
MacIntyre, S., Jonsson, A., Jansson, M., Aberg, J., Turney, D.E., Miller, S.D., 2010. Buoyancyflux, turbulence, and the gas transfer coefficient in a stratified lake: turbulence andgas evasion in lakes. Geophys. Res. Lett. 37, L24604.
Marengo, J.A., Espinoza, J.C., 2016. Extreme seasonal droughts and floods in Amazonia:causes, trends and impacts. Int. J. Climatol. 36, 1033–1050.
Marengo, J.A., Nobre, C.A., Tomasella, J., Oyama, M.D., Oliveira, G.S., de, Oliveira R.,Camargo, H., Alves, L.M., Brown, I.F., 2008. The drought of Amazonia in 2005.J. Clim. 21, 495–516.
Marengo, J.A., Tomasella, J., Alves, L.M., Soares,W.R., Rodriguez, D.A., 2011. The drought of2010 in the context of historical droughts in the Amazon region. Geophys. Res. Lett.38, L12703.
Mayorga, E., Aufdenkampe, A.K., Masiello, C.A., Krusche, A.V., Hedges, J.I., Quay, P.D.,Richey, J.E., Brown, T.A., 2005. Young organic matter as a source of carbon dioxideoutgassing from Amazonian rivers. Nature 436, 538–541.
Meade, R.H., Dunne, T., Richey, J.E., Santos U de, M., Salati, E., 1985. Storage and remobili-zation of suspended sediment in the lower Amazon River of Brazil. Science 228,488–490.
Melack, J.M., 2016. Aquatic ecosystems. In: Nagy, L., Forsberg, B.R., Artaxo, P. (Eds.), Inter-actions between Biosphere, Atmosphere and Human Land Use in the Amazon Basin.Springer Berlin Heidelberg, Berlin, Heidelberg, pp. 119–148.
Melack, J.M., Engle, D., 2009. An organic carbon budget for an Amazon floodplain lake.Verhandlungen des Internationalen Verein Limnologie 30, 1179–1182.
Melack, J.M., Fisher, T.R., 1983. Diel oxygen variations and their ecological implication inAmazon floodplain lakes. Arch. Hydrobiol. 98, 422–442.
Melack, J., Forsberg, B., 2001. Biogeochemistry of Amazon floodplain lakes and associatedwetlands. In: ME, McClain, Victoria, R.L., Richey, J.E. (Eds.), The Biogeochemistry ofthe Amazon basin. Oxford University Press, pp. 235–274.
Melack, J.M., Hess, L.L., Gastil, M., Forsberg, B.R., Hamilton, S.K., Lima, I.B.T., Novo, E.M.L.M.,2004. Regionalization ofmethane emissions in the Amazon Basinwithmicrowave re-mote sensing. Glob. Chang. Biol. 10 (5), 530–544.
Melack, J.M., Novo, E.M.L.M., Forsberg, B.R., Piedade, M.T.F., Maurice, L., 2009. Floodplainecosystem processes. In: Keller, M., Bustamante, M., Gash, J., Silva Dias, P. (Eds.), Geo-physical Monograph Series. Vol. 186. American Geophysical Union,Washington, D. C,pp. 525–541.
Morana, C., Sarmento, H., Descy, J.-P., Gasol, J.M., Borges, A., Bouillon, S.,Darchambeau, F., 2014. Production of dissolved organic matter by phytoplank-ton and its uptake by heterotrophic prokaryotes in large tropical lakes. Limnol.Oceanogr. 59, 1364–1375.
Moreira-Turcq, P., Jouanneau, J.M., Turcq, B., Seyler, P., Weber, O., Guyot, J.L., 2004. Carbonsedimentation at Lago Grande de Curuai, a floodplain lake in the low Amazon region:insights into sedimentation rates. Palaeogeogr. Palaeoclimatol. Palaeoecol. 214,27–40.
Moreira-Turcq, P., Bonnet, M.-P., Amorim, M., Bernardes, M., Lagane, C., Maurice, L., Perez,M., Seyler, P., 2013. Seasonal variability in concentration, composition, age, and fluxesof particulate organic carbon exchanged between the floodplain and Amazon River.Global Biogeochem. Cycles 27, 119–130.
Mortillaro, J.M., Passarelli, C., Abril, G., Hubas, C., Alberic, P., Artigas, L.F., Benedetti, M.F.,Thiney, N., Moreira-Turcq, P., Perez, M.A.P., Vidal, L.O., Meziane, T., 2016. The fate ofC4 and C3 macrophyte carbon in central Amazon floodplain waters: insights from abatch experiment. Limnologica 59, 90–98.

1393J.H.F. Amaral et al. / Science of the Total Environment 630 (2018) 1381–1393
Nagy, L., Forsberg, B.R., Artaxo, P. (Eds.), 2016. Interactions Between Biosphere, Atmo-sphere and Human Land Use in the Amazon Basin. Springer Berlin Heidelberg, Berlin,Heidelberg.
Odum, H.T., 1956. Primary production in flowing waters. Limnol. Oceanogr. 1, 102–117.Peixoto, R.B., Marotta, H., Bastviken, D., Enrich-Prast, A., 2016. Floating aquatic macro-
phytes can substantially offset open water CO2 emissions from tropical floodplainlake ecosystems. Ecosystems 19, 724–736.
Pinel, S., Bonnet, M.-P., Santos Da Silva, J., Moreira, D., Calmant, S., Satgé, F., Seyler, F., 2015.Correction of interferometric and vegetation biases in the SRTMGL1 space borne DEMwith hydrological conditioning towards improved hydrodynamics modeling in theAmazon Basin. Remote Sens. 7, 16108–16130.
Poindexter, C.M., Baldocchi, D.D., Matthes, J.H., Knox, S.H., Variano, E.A., 2016. The contri-bution of an overlooked transport process to a wetland's methane emissions.Geophys. Res. Lett. 43, 6276–6284.
Polsenaere, P., Deborde, J., Detandt, G., Vidal, L.O., Pérez, M.A.P., Marieu, V., Abril, G., 2013.Thermal enhancement of gas transfer velocity of CO2 in an Amazon floodplain lakerevealed by eddy covariance measurements. Geophys. Res. Lett. 40, 1734–1740.
Pringault, O., Tassas, V., Rochelle-Newall, E., 2007. Consequences of respiration in the lighton the determination of production in pelagic systems. Biogeosciences 4, 105–114.
Quay, P.D., Wilbur, D., Richey, J.E., Hedges, J.I., Devol, A.H., Victoria, R., 1992. Carbon cy-cling in the Amazon River: implications from the 13C compositions of particles andsolutes. Limnol. Oceanogr. 37, 857–871.
Quay, P.D.,Wilbur, D., Richey, J.E., Devol, A.H., Benner, R., Forsberg, B.R., 1995. The 18O: 16Oof dissolved oxygen in rivers and lakes in the Amazon Basin: determining the ratio ofrespiration to photosynthesis rates in freshwaters. Limnol. Oceanogr. 40, 718–729.
de Rasera, M.F.F.L., 2010. Determinação dos fluxos de CO2 e parâmetros físicos envolvidosneste processo em diferentes ambientes fluviais da Amazônia. PhD dissertation.Universidade de São Paulo, Brazil.
de Rasera, M.F.F.L., Krusche, A.V., Richey, J.E., Ballester, M.V.R., Victória, R.L., 2013. Spatialand temporal variability of pCO2 and CO2 efflux in seven Amazonian Rivers. Biogeo-chemistry 116, 241–259.
Raymond, P.A., Hartmann, J., Lauerwald, R., Sobek, S., McDonald, C., Hoover, M., Butman,D., Striegl, R., Mayorga, E., Humborg, C., Kortelainen, P., Dürr, H., Meybeck, M., Ciais,P., Guth, P., 2013. Global carbon dioxide emissions from inland waters. Nature 503,355–359.
R Development Core Team, 2015. R: A Language and Environment for Statistical Comput-ing. R Foundation for Statistical Computing, Vienna.
Richey, J.E., Devol, A.H.,Wofsy, S.C., Victoria, R., Riberio, M.N., 1988. Biogenic gases and theoxidation and reduction of carbon in Amazon River and floodplain waters. Limnol.Oceanogr. 33, 551–561.
Richey, J.E., Hedges, J.I., Devol, A.H., Quay, P.D., Victoria, R., Martinelli, L., Forsberg, B.R.,1990. Biogeochemistry of carbon in the Amazon River. Limnol. Oceanogr. 35,352–371.
Richey, J.E., Melack, J.M., Aufdenkampe, A.K., Ballester, V.M., Hess, L.L., 2002. Outgassingfrom Amazonian rivers and wetlands as a large tropical source of atmospheric CO2.Nature 416, 617–620.
Riley, G.A., 1957. Phytoplankton of the North Central Sargasso Sea, 1950–521. Limnol.Oceanogr. 2 (3), 252–270.
Rudorff, C.M., Melack, J.M., MacIntyre, S., Barbosa, C.C.F., Novo, E.M.L.M., 2011. Seasonaland spatial variability of CO2 emission from a large floodplain lake in the lower Am-azon. J. Geophys. Res. 116, G04007.
Rudorff, C.M., Melack, J.M., Bates, P.D., 2014. Flooding dynamics on the lower Amazonfloodplain: seasonal and interannual hydrological variability. Water Resour. Res. 50,635–649.
Sadro, S., Nelson, C.E., Melack, J.M., 2011. Linking diel patterns in community respirationto bacterioplankton in an oligotrophic high-elevation lake. Limnol. Oceanogr. 56,540–550.
Sadro, S., Holtgrieve, G.W., Solomon, C.T., Koch, G.R., 2014. Widespread variability in over-night patterns of ecosystem respiration linked to gradients in dissolved organic mat-ter, residence time, and productivity in a global set of lakes. Limnol. Oceanogr. 59,1666–1678.
Schlitzer, R., 2017. Ocean Data View. http://odv.awi.de.Scofield, V., Melack, J.M., Barbosa, P.M., Amaral, J.H.F., Forsberg, B.R., Farjalla, V.F., 2016.
Carbon dioxide outgassing from Amazonian aquatic ecosystems in the Negro Riverbasin. Biogeochemistry 129, 77–91.
Smith, L.K., Melack, J.M., Hammond, D.E., 2002. Carbon, nitrogen, and phosphorus contentand 210Pb-derived burial rates in sediments of an Amazon floodplain lake.Amazoniana 17, 413–436.
Solomon, C.T., Bruesewitz, D.A., Richardson, D.C., Rose, K.C., Van de Bogert, M.C., Hanson,P.C., Kratz, T.K., Larget, B., Adrian, R., Babin, B.L., Chiu, C.Y., Hamilton, D.P., Gaiser, E.E.,Hendricks, S., Istvànovics, V., Laas, A., O'Donnell, D.M., Pace, M.L., Ryder, E., Staehr,P.A., Torgersen, T., Vanni, M.J., Weathers, K.C., Zhu, G., 2013. Ecosystem respiration:drivers of daily variability and background respiration in lakes around the globe.Limnol. Oceanogr. 58, 849–866.
Sorribas, M.V., Paiva, R.C.D., Melack, J.M., Bravo, J.M., Jones, C., Carvalho, L., Beighley, E.,Forsberg, B., Costa, M.H., 2016. Projections of climate change effects on dischargeand inundation in the Amazon basin. Clim. Chang. 136, 555–570.
Steemann Nielsen, E., 1952. The use of radioactive carbon (C14) for measuring organicproduction in the sea. J. Cons. Int. Explor. Mer 18, 117–140.
Strickland, J.D., Parsons, T.R., 1972. A Practical Handbook of Seawater Analysis. 167. Fish-eries Research Board of Canada, Ottawa, Canada (310p).
Sverdrup, H., 1953. On conditions for the vernal blooming of phytoplankton. J. Cons. Int.Explor. Mer 18, 287–295.
Tedford, E.W., MacIntyre, S., Miller, S.D., Czikowsky, M.J., 2014. Similarity scaling of turbu-lence in a temperate lake during fall cooling. J. Geophys. Res. Oceans 119, 4689–4713.
Tranvik, L.J., Bertilsson, S., 2001. Contrasting effects of solar UV radiation on dissolved or-ganic sources for bacterial growth. Ecol. Lett. 4, 458–463.
Van de Bogert, M.C., Carpenter, S.R., Cole, J.J., Pace, M.L., 2007. Assessing pelagic and ben-thic metabolism using free water measurements. Limnol. Oceanogr. Methods 5,145–155.
Vidal, L.O., Abril, G., Artigas, L.F., Melo, M.L., Bernardes, M.C., Lobão, L.M., Reis, M.C.,Moreira-Turcq, P., Benedetti, M., Tornisielo, V.L., Roland, F., 2015. Hydrological pulseregulating the bacterial heterotrophic metabolism between Amazonian mainstemsand floodplain lakes. Front. Microbiol. 6, 1054.
Waichman, A.V., 1996. Autotrophic carbon sources for heterotrophic bacterioplankton ina floodplain lake of central Amazon. Hydrobiologia 341, 27–36.
Ward, N.D., Keil, R.G., Medeiros, P.M., Brito, D.C., Cunha, A.C., Dittmar, T., Yager, P.L.,Krusche, A.V., Richey, J.E., 2013. Degradation of terrestrially derived macromoleculesin the Amazon River. Nat. Geosci. 6, 530–533.
Ward, N.D., Krusche, A.V., Sawakuchi, H.O., Brito, D.C., Cunha, A.C., Moura, J.M.S., da Silva,R., Yager, P.L., Keil, R.G., Richey, J.E., 2015. The compositional evolution of dissolvedand particulate organic matter along the lower Amazon River—Óbidos to the ocean.Mar. Chem. 177, 244–256.
Ward, N.D., Bianchi, T.S., Sawakuchi, H.O., Gagne-Maynard, W., Cunha, A.C., Brito, D.C.,Neu, V., de Matos Valerio, A., da Silva, R., Krusche, A.V., Richey, J.E., Keil, R.G., 2016.The reactivity of plant-derived organic matter and the potential importance of prim-ing effects along the lower Amazon River. J. Geophys. Res. Biogeosci. 121, 1522–1539.
Zeng, N., Yoon, J.-H., Marengo, J.A., Subramaniam, A., Nobre, C.A., Mariotti, A., Neelin, J.D.,2008. Causes and impacts of the 2005 Amazon drought. Environ. Res. Lett. 3, 014002.