Embed Size (px)
Citation preview

S C I E N C E , E N G I N E E R I N G A N D T E C H N O L O G Y
T E C H N I C I A N S I N T H E U K E C O N O M Y
GEOFF MASON
NATIONAL INSTITUTE OF ECONOMIC AND SOCIAL RESEARCH, LONDON

SCIENCE, ENGINEERING AND TECHNOLOGY TECHNICIANS IN THE UK ECONOMY
CONTENTS
Executive Summary
1. Introduction p1
2. Definitional issues p3
3. SET technicians in employment p7
4. The changing mix of qualifications held by SET technicians p15
5. Employer demand for SET technician-level skills p25
6. Current arrangements for SET technician-level education and training p29
7. Summary and assessment p37
References p39
Appendix Tables p41

SCIENCE, ENGINEERING AND TECHNOLOGY TECHNICIANS IN THE UK ECONOMY
EXECUTIVE SUMMARY
EXECUTIVE SUMMARY1. Public interest in the role of technicians in the UK economy has grown in recent years. One
reason for this is the present government’s emphasis on the need to develop vocational skills through Apprenticeship training. Another reason is concerns about filling associate or ‘para’ professional and skilled technician roles in a number of sectors such as health care, oil, gas, electricity, chemicals, pharmaceuticals, transport equipment and broadcasting. These concerns about filling skilled technician roles have been accentuated by ageing among the current technician workforce.
2. In order to explore some of the key issues surrounding technician employment, education and training in the UK economy, this report focuses on one of the most important categories of technician, namely, science, engineering and technology (SET) technicians. Through a statistical and literature survey, it aims to address the following questions:
• Where are SET technicians employed in the UK economy and what are their main tasks and responsibilities?
• How well does the evolving mix of Bachelor degree graduates and holders of vocational qualifications in SET-related employment meet the skill requirements of employers?
• What gaps (if any) do employers identify in the skills possessed by SET technicians?• How well do different modes of technician education and training in SET-related areas
prepare trainees for subsequent employment?• What are the main factors which either encourage individuals to participate in SET
technician-level education or training or discourage them from doing so?
3. In the UK Standard Occupational Classification, the main occupational groups which include technician-level jobs are ‘Associate Professional and Technical Occupations’ and ‘Skilled Trades Occupations’. Within these two occupational groups, we have identified SET occupations as those in which the application of scientific, engineering and/or technological skills and knowledge is central to the job-holder’s work. Thus we exclude occupations in which job-holders make use of engineering or scientific knowledge in a more limited way (for example, ‘secondary science workers’) and we also exclude occupations which are mathematics-based but which are not explicitly science-, engineering- or technology-based (eg, associate professionals engaged in actuarial and statistical work). We also exclude health-related occupations which will be covered in another report to be published by the Gatsby Charitable Foundation.
SCIENCE, ENGINEERING AND TECHNOLOGY TECHNICIANS IN THE UK ECONOMY
EXECUTIVE SUMMARY
4. Estimates based on Labour Force Survey (LFS) data suggest that there are currently just over 1.5 million SET (science, engineering and technology) technicians in employment in the UK, about 30% of whom are in associate professional occupations while 70% are in skilled trades occupations. In 2010 almost three quarters (73%) of SET technicians were employed in SET production, construction and service sectors with a further 17% in non-SET private sector activities and 10% in the public sector. SET technician occupations are heavily male-dominated, with the exception of laboratory technicians and quality assurance and architectural technicians. In common with technicians as a whole, the SET technician workforce is ageing fast, with as many as 31% of SET skilled trades workers and 23% of SET associate professionals aged 50 or older in 2010.
5. In the last 20 years the mix of occupations and qualifications in SET sectors has changed greatly in response to the increased supply of university graduates and the departure of many low-qualified persons from the workforce. In particular, the ratio of SET professionals to SET technicians has increased over time while the graduate share of technician employment has increased steadily, reaching 27% of SET associate professionals in SET sectors in 2010. The graduate share of SET skilled trades employment is also rising (albeit more slowly) and graduates now account for 16% of SET skilled trades workers in SET service sectors such as telecoms and computer services.
6. LFS survey data do not contain sufficient information to be sure what has happened to the share of apprentice-trained workers among SET technicians. However, recent trends in the employment shares of SET technicians holding qualifications such as Higher National Certificates and Level 3 vocational qualifications suggest that the proportion of SET technicians with a background in employment-based apprenticeship training has declined. Conversely, the proportion of SET technicians with a background in full-time classroom study has increased. At the same time ageing among current SET technicians seems to be more of a problem among those with an apprenticeship training background than any other group of technicians. For example, over a third of all SET technicians in SET sectors with Level 3 vocational qualifications are aged 50 or older
7. How well is employer demand for SET technician skills being met by the rising graduate share of SET technician employment and the probable decline in the apprentice-trained share? Multivariate analysis shows continuing positive pay premia attached to Bachelor and higher degree qualifications held by SET technicians which suggests that many of the graduates recruited to technician jobs have been useful in meeting rising skill demands. These findings are consistent with trends in average returns to graduate education across the wider economy which provide continuing incentives for able young people with interests in SET subjects to follow academic study routes.
SCIENCE, ENGINEERING AND TECHNOLOGY TECHNICIANS IN THE UK ECONOMY
EXECUTIVE SUMMARY
8. However, case study evidence and other research based on interviews with employers suggests that some SET employers may now be starting to re-evaluate their present mix of graduate- and intermediate-level personnel in SET technician jobs. A key reason for this is that most new graduate recruits have acquired their skills and knowledge primarily through classroom study rather than through employment-based training. Thus they tend to lack the practical skills and experience, problem-solving skills and commercial understanding that are best acquired through employment-based training such as apprenticeships.
9. Further research is necessary to establish just how widespread are such changes in the pattern of skills demand by SET employers. But the case study evidence available to date is plausible given that many apprentice-trained SET technicians currently in employment are in older age groups and therefore their employers have reason to be concerned about the future availability of the particular skills and knowledge held by these employees. In addition, some firms may stand to benefit from complementarities between graduate technicians and apprentice-trained technicians who often possess distinctively different skill sets.
10. In this context, the challenge for many SET employers is to strike a balance between rising skill demands in SET technician jobs (which still often seem to call for increased employment of graduates) and the continued need for practical skills and experience (which benefit from apprentice-trained technicians). In the last 10-15 years SET employers have been tempted by the graduate route in large part because they are not required to incur the costs of educating graduates in contrast to the substantial costs of financing apprenticeship training. However, this has left many firms and organisations short of the practical skills and commercial understanding which are best acquired through employment-based training.
11. Analysis of student numbers in different forms of education and training relevant to SET technician employment suggests that in engineering and construction areas, in particular, there is now a solid foundation for the further development of SET technicians with a background in employment-based training. This is partly due to recent growth in apprentice numbers and partly to a small but important section of higher education (HE) students who study part-time while in employment related to their studies. However, this is not true of science and mathematics subject areas, where academic study paths involving A levels and full-time university study are very well established. And even in engineering and construction-related areas of study, the financial incentives which encourage able young people to aim for First and higher degrees rather than intermediate-level qualifications have remained strong for many years.

SCIENCE, ENGINEERING AND TECHNOLOGY TECHNICIANS IN THE UK ECONOMY
EXECUTIVE SUMMARY
12. As a result of substantial increases in HE tuition fees which are due to take effect in September 2012, the numbers of academically able young people interested in SET apprenticeships could well increase in future years. This could provide a welcome opportunity to develop more SET technicians with the desirable combination of academic skills and knowledge and skills best acquired through employment-based training and experience. However, much will depend on the willingness of SET employers to incur the costs of providing technician apprenticeships. At present some highly esteemed apprenticeship schemes in SET sectors have to turn away large numbers of applicants for training places.
13. Due to longstanding concerns about the status of technician-level occupations in relation to professional occupations, there is now considerable interest in developing opportunities for technicians to progress to higher levels of formal qualifications and professional recognition (for example, through formal registration as technicians with the possibility to progress further to chartered engineering and scientist status). The appeal of such initiatives to able young people who, ultimately, aspire to graduate-level qualifications could be enhanced by the development of technician apprentice training programmes which combine employment-based training with opportunities for later study towards Bachelor and higher degrees. Such programmes could be made more attractive to potential trainees if employers undertake to provide support with tuition fees for part-time study towards graduate-level qualifications – but only after trainees have engaged in a qualifying period of employment as skilled technicians. These types of arrangement already operate successfully on a small scale in the UK economy. The challenge for policy-makers is to design cost-effective ways of incentivising many more employers to offer such opportunities to technician trainees.

SCIENCE, ENGINEERING AND TECHNOLOGY TECHNICIANS IN THE UK ECONOMY
1INTRODUCTION
1. INTRODUCTION 1
Technicians now feature prominently in public discussions of education and training policy. This is partly because of the present government’s emphasis on the need to develop vocational skills through Apprenticeship training:
‘Apprenticeships are at the heart of the system that we will build…. We will not only increase numbers [of Apprenticeships], but we will also improve the programme. As an advanced economy needs advanced skills, we will reshape Apprenticeships so that technician level – Level 3 – becomes the level to which learners and employers aspire. To widen access, there will be clear progression routes from Level 3 Apprenticeships to higher level skills, including Level 4 Apprenticeships or higher education’ (BIS, 2010: 7, emphasis added).
Another underlying factor in the recent growth of interest in technician education and training is an awareness that the rapid growth in UK university graduate output since the late 1980s has radically altered the mix of high-level and intermediate-level skills in the economy, to the point that concerns are now expressed about shortfalls in the types of skill that were traditionally developed through technician-level training. For example, the 2010 National Strategic Skills Audit identified problems in filling associate or ‘para’ professional and skilled technician roles in a number of sectors such as health care, oil, gas, electricity, chemicals, pharmaceuticals, transport equipment and broadcasting (UKCES, 2010). Some of these concerns have been accentuated by ageing among the current technician workforce.
In order to explore some of the key issues surrounding technician employment, education and training in the UK economy, this report focuses on one of the most important categories of technician, namely, science, engineering and technology (SET) technicians. Through a statistical and literature survey, it aims to address the following questions:
1. Where are SET technicians employed in the UK economy and what are their main tasks and responsibilities?
2. How well does the evolving mix of Bachelor degree graduates and holders of vocational qualifications in SET-related employment meet the skill requirements of employers?
3. What gaps (if any) do employers identify in the skills possessed by SET technicians?4. How well do different modes of technician education and training in SET-related areas
prepare trainees for subsequent employment?5. What are the main factors which either encourage individuals to participate in SET
technician-level education or training or discourage them from doing so?
1 I am grateful to the Gatsby Charitable Foundation for their financial support for this study; however, the Foundation is not responsible for views expressed in this report. I would also like to thank Paul Lewis, Daniel Sandford-Smith, Hilary Steedman and other participants at a Gatsby workshop for helpful comments on work in progress and Chiara Rosazza Bondibene for research assistance. Responsibility for remaining errors is mine alone.
SCIENCE, ENGINEERING AND TECHNOLOGY TECHNICIANS IN THE UK ECONOMY
3DEFINITIONAL ISSUES
2. DEFINITIONAL ISSUES Within science- and engineering-related activities, technician occupations are distinctive for the
fact that they have traditionally been defined, not just in terms of what technicians do, but also in terms of where they stand within hierarchies of occupations and/or formal qualifications.
For example, the International Standard Classification of Occupations (ISCO) prepared by the International Labour Organisation emphasises that technicians typically hold intermediate-level qualifications:
‘Technicians and associate professionals perform mostly technical and related tasks connected with research and the application of scientific or artistic concepts and operational methods, and government or business regulations. Most occupations in this major group require skills at the third ISCO skill level’ [ie, post-secondary education leading to awards below Bachelor degree level] (ILO, 2008).2
Focussing on the division of labour within workplaces, the US Bureau of Labor Statistics stresses the role that technicians play in ‘assisting’ people in higher-level occupations:
‘Engineering technicians use the principles and theories of science, engineering, and mathematics to solve technical problems in research and development, manufacturing, sales, construction, inspection, and maintenance. Their work is more narrowly focused and application-oriented than that of scientists and engineers. Many engineering technicians assist engineers and scientists, especially in research and development. Others work in quality control, inspecting products and processes, conducting tests, or collecting data. In manufacturing, they may assist in product design, development, or production’ (BLS, 2010).3
In the 1980s in the UK, the former Engineering Industry Training Board (EITB) explicitly defined technicians as a ‘residual’ category which lay inbetween SET professionals and skilled craft workers. In its terminology, technicians consisted of:
‘Draughtsmen and all other persons carrying out functions of a grade intermediate between scientists and technologists on the one hand and skilled craftsmen and operators on the other, whether in research or development, design, production, testing or maintenance’ (Connor and Andrews, 1983:2)
2 http://www.ilo.org/public/english/bureau/stat/isco/isco08/index.htm3 http://www.bls.gov/oco/ocos112.htm

SCIENCE, ENGINEERING AND TECHNOLOGY TECHNICIANS IN THE UK ECONOMY
4 DEFINITIONAL ISSUES
Over the years such definitions have clearly raised delicate issues about the status of technician-level occupations in relation to professional occupations and the new Technician Council in the UK now emphasises what technicians do, rather than their position within hierarchies of qualifications or occupations:
‘Technicians are concerned with applying proven techniques and procedures to the solution of practical problems. They carry supervisory or technical responsibility and are competent to exercise creativity and skills within defined fields of science and technology’ 4
Considerable emphasis is also now placed on the opportunities for technicians to progress to higher levels of formal qualifications and professional recognition (Skills Commission, 2011). 5 Nonetheless, the question of where technicians currently stand within a hierarchy of SET occupations is never far from the surface. For example, some readily available careers information about technician-level work is quite blunt about the support role that many technicians are expected to play in relation to professional staff:
‘The main function of a scientific laboratory technician is to perform the specific scientific procedures that allow scientists to perform the more complex analytical processes of the laboratory’ (Association of Graduate Careers Advisory Services, 2010). 6
‘As a civil engineering technician, you would provide technical support to civil engineers on engineering construction projects’. 7
Although this support role is critical to performance in SET-based activities, concerns about low status relative to SET professionals are still common among technicians (Diamond et al, 2011). This is a longstanding problem that is widely recognised in other countries such as the US (Barley, 1996) as well as in the UK.
In the UK Standard Occupational Classification, the main occupational group which includes technician-level jobs is ‘Associate Professional and Technical Occupations’ and this report therefore covers SET occupations in this group. However, in common with Jagger et al (2010), we also include SET-related ‘Skilled Trades Occupations’ as SET technicians. This is partly in recognition of the fact that (as the BIS 2010 report quoted above makes clear) holders of Level 3 qualifications are now widely classed as technicians in public policy discussions, even though in the past the former EITB and other organisations would have designated skilled trades workers with Level 3 qualifications as craft workers. A second reason for adopting a broad definition of technicians is that, following rapid changes in production and information technologies in recent decades, it is no longer clear – without new empirical investigation – just how much Skilled Trades workers differ from Associate Professionals in the work they carry out and the qualifications they hold.
4 Cited by Skills Commission (2011).5 See, for example, http://www.engc.org.uk/professional-qualifications/engineering-technician/about-engineering-technician; http://www.sciencecouncil.org/sites/default/files/Registered%20Science%20Technician%20RSciTech%20-%20final.pdf6 http://www.prospects.ac.uk/scientific_laboratory_technician_job_description.htm7 https://nextstep.direct.gov.uk/PlanningYourCareer/JobProfiles/JobProfile1169/Pages/default.aspx

SCIENCE, ENGINEERING AND TECHNOLOGY TECHNICIANS IN THE UK ECONOMY
5DEFINITIONAL ISSUES
Within the Associate Professional and Skilled Trades occupational groups, we have identified SET occupations as those in which the application of scientific, engineering and/or technological skills and knowledge is central to the job-holder’s work. Thus we exclude occupations in which job-holders make use of engineering or scientific knowledge in a more limited way, for example, the ‘secondary science workers’ identified in the recent Science Council report on the UK science workforce (Dodd et al, 2011). In order to keep the focus of this report within manageable bounds, we also exclude occupations which are mathematics-based but which are not explicitly science-, engineering- or technology-based (eg, associate professionals engaged in actuarial and statistical work). We also exclude health-related occupations which will be covered in another report to be published by the Gatsby Charitable Foundation.

SCIENCE, ENGINEERING AND TECHNOLOGY TECHNICIANS IN THE UK ECONOMY
7SET TECHNICIANS IN EMPLOYMENT
3. SET TECHNICIANS IN EMPLOYMENT According to estimates based on the Labour Force Survey (LFS), in 2010 there were
approximately 1.53 million SET technicians in employment in the UK, about 30% of whom were in associate professional occupations while 70% were in skilled trades occupations (Table 3.1).8 Among SET associate professionals, the two largest single occupations were in Information Technology (IT)-related areas, followed by engineering technicians and laboratory technicians. Among SET skilled trades, the largest single occupations were in electrical, metal-working and plumbing/heating/ventilation areas.
Overall, SET technicians constitute a male-dominated group, with only an 8% female share of employment. However, a majority (54%) of laboratory technicians in 2010 were female and women also accounted for sizeable minorities of quality assurance and architectural technicians (Table 3.1). There is a wide spread of age groups among SET technicians but it is notable that as many as 31% of SET skilled trades workers and 23% of SET associate professionals were aged 50 or older in 2010 (Table 3.2).
In order to examine the sectoral distribution of SET technicians across the economy, we define five groups of sectors:
• SET production (mining, manufacturing and utilities)• SET construction• SET services (telecommunications, computer and science- and engineering-based business
services)• Non-SET private sector activities• Public sector activities
Further details of this classification are shown in Table 3.3. Our definition of SET sectors largely corresponds with the ‘STEM specialist’ sectors defined in a recent BIS report on STEM graduates in non-STEM Jobs, where ‘STEM’ refers to Science, Technology, Engineering and Mathematics (Mellors-Bourne et al, 2010).
Almost three quarters (73%) of SET technicians in 2010 were employed in SET sectors but the proportion was much higher among SET skilled trades (82%) than among SET associate professionals (53%) (Table 3.4). Thus, a large minority of SET technicians, and especially SET associate professionals, were employed in non-SET sectors, both in the private and public sectors. Examples of non-SET sectors employing significant numbers of SET technicians included computer repair services, wholesale and retail, financial services, transport services, public administration, education and health.
8 This estimate of 1.53 million SET technicians in 2010 differs from the estimate of 1.23 million SET technicians in 2007-09 provided by Jagger et al (2010) primarily because we include six occupations as SET technicians which were excluded by Jagger et al: Metal working production and maintenance fitters (198000), Draughtspersons (38500), Architectural technologists and town planning technicians (16500), Building inspectors (4500), Smiths and forge workers (5000) and Moulders, core makers and die casters (2500). By contrast, for reasons discussed in Section 2, we exclude two health-related occupations which were counted as SET technicians by Jagger et al: Pharmaceutical dispensers (44500) and Medical and dental technicians (41000).

SCIENCE, ENGINEERING AND TECHNOLOGY TECHNICIANS IN THE UK ECONOMY
8 SET TECHNICIANS IN EMPLOYMENT
Across all SET sectors technicians accounted for roughly 17% of total employment in 2010 (Table 3.5). The highest proportions of technician employment were found in metals, mechanical engineering and vehicles (28%), electricity, gas and water (22%) and mining, oil and gas extraction (22%). In these and several other SET production and construction sectors a large majority of SET technicians were skilled trades workers. However, in chemicals/pharmaceuticals and food and drink manufacturing, the ratio of SET associate professionals to SET skilled trades workers was approximately 1:1 and in some SET service sectors – such as architectural, engineering and scientific services and computer services – SET associate professionals outnumber SET skilled trades workers by ratios of 3:1 or close to it.

SCIENCE, ENGINEERING AND TECHNOLOGY TECHNICIANS IN THE UK ECONOMY
9SET TECHNICIANS IN EMPLOYMENT
Table 3.1: SET technicians in employment, UK, 2010, analysed by occupation and gender (weighted population estimates)
SOC
2000
code
Occupation Estimated total
employment
% of total SET
technicians in
employment
% female in
occupation
Associate professionals
3111 Laboratory technicians 58000 3.7 54
3112 Electrical and electronic technicians 25000 1.6 5
3113 Engineering technicians 68500 4.4 6
3114 Building and civil engineering technicians 27000 1.7 17
3115 Quality assurance technicians 16500 1.1 43
3119 Science and engineering technicians nec 36000 2.3 22
3121 Architectural technologists and town planning
technicians
16500 1.1 38
3122 Draughtspersons 38500 2.4 9
3123 Building inspectors 4500 0.3 19
3131 IT operations technicians 120000 7.6 22
3132 IT user support technicians 70500 4.4 24
Skilled trades
5211 Smiths and forge workers 5000 3.2 <0.1
5212 Moulders, core makers, die casters 2500 0.2 <0.1
5213 Sheet metal workers 27000 1.7 2
5214 Metal plate workers, shipwrights, riveters 8000 0.5 <0.1
5215 Welding trades 69000 4.4 2
5216 Pipe fitters 14500 1.0 <0.1
5221 Metal machining setters and setter-operators 54500 3.5 4
5222 Tool makers, tool fitters and markers-out 15000 1.0 <0.1
5223 Metal working production and maintenance fitters 197500 12.5 1
5224 Precision instrument makers and repairers 24000 1.5 2
5241 Electricians, electrical fitters 260000 16.5 1
5242 Telecommunications engineers 49000 3.1 1
5243 Lines repairers and cable jointers 9500 0.6 <0.1
5245 Computer engineers, installation and maintenance 42500 2.7 3
5249 Electrical and electronics engineers nec 83000 5.3 2
5314 Plumbers, heating and ventilating engineers 189500 12.0 1
TOTAL 1531500 100 8
Unweighted n = 10113
Source: Labour Force Survey 2010 (four quarters)Note: Weighted population estimates of total employment in each occupation are rounded to nearest 500.

SCIENCE, ENGINEERING AND TECHNOLOGY TECHNICIANS IN THE UK ECONOMY
10 SET TECHNICIANS IN EMPLOYMENT
Table 3.2: SET technicians in employment, UK, 2010, analysed by age group (weighted population estimates)
SET associate
professionals
SET skilled
trades
Under 25 11 13
25-29 16 12
30-34 13 9
35-39 13 11
40-44 14 12
45-49 11 12
50-54 10 12
55-59 7 10
60 or older 6 9
TOTAL 100 100
Unweighted n = 3,059 6,865
Table 3.3: Classification of science, engineering and technology (SET) sectors
SIC07 SIC03 SET sectors
Production
05-09 10-14 Mining, oil and gas extraction
10-12 15-17 Food, drink and related manufacturing
20-22 24-25 Chemicals, pharmaceuticals, rubber and plastics
24-25, 28-30,33 27-29,34-35 Metals, mechanical engineering and vehicles
26-27 30-33 Electrical, electronic and instrument engineering
13-19,23,31-32 18-23,26,36-37 Other manufacturing
35-36 40-41 Electricity, gas and water
41-43 45 Construction
Services
61 64.2 Telecommunications services
62 72 Computer services
71-72 73,74.2,74.3 Architectural, engineering and scientific services
Source: Labour Force Survey 2010 (four quarters)Note: Column percentages may not sum to 100 due to rounding.

SCIENCE, ENGINEERING AND TECHNOLOGY TECHNICIANS IN THE UK ECONOMY
11SET TECHNICIANS IN EMPLOYMENT
Source: Labour Force Survey 2010 (four quarters)Note: Column percentages may not sum to 100 due to rounding.
In terms of formal qualifications, just under 30% of all SET associate professionals in 2010 held Bachelor degrees (or higher qualifications), with the highest shares in SET service sectors and non-SET sectors (Table 3.6A). Thus Bachelor degree graduates outnumbered the 20% who held higher education (HE) qualifications below Bachelor degree level such as Foundation degrees, Higher National Certificates or Diplomas and other qualifications classified to Levels 4-5 on the National Qualifications Framework (NQF) or Qualifications and Credit Framework (QCF). 9 For brevity, we refer to this category of HE qualifications below Bachelor degree level henceforth as ‘upper intermediate’ qualifications. 10 A further 18% of SET associate professionals held vocational qualifications at Level 3 (eg, BTEC National and City & Guilds craft awards and trade apprenticeships) while 10% held Level 3 general qualifications of different kinds (eg, A levels). The remaining 23% held Level 2 or lower qualifications or other qualifications which are hard to classify.
As might be expected, the largest single qualifications group among SET skilled trades workers was Level 3 vocational qualifications (52%), reflecting a strong tradition of apprenticeship training (Table 3.6B) . However, other qualifications held by SET skilled trades workers ranged from Bachelor degree or higher (5%) and upper intermediate qualifications (10-11%) to Level 3 general (4%), Level 2 (16%) and lower or other qualifications (13%).
9 Throughout this report all references to educational qualifications at different ‘Levels’ are expressed in terms of the NQF/QCF classifications. For further details of these frameworks, see: http://www.direct.gov.uk/en/EducationAndLearning/QualificationsExplained/DG_10039017 10 In the US education literature, this category of HE qualifications below Bachelor degree level is referred to as ‘sub-Baccalaureate’. In terms of vocabulary familiar to UK readers, it seems clearer and more useful to describe this category of qualifications in a way that recognises it as being at the upper end of the intermediate skills range.
Table 3.4: Sectoral distribution of SET technicians, UK, 2010 (weighted population estimates)
Associate
professional SET
technicians
Skilled trades
SET technicians
SET technicians (total)
% of total
SET Production 24 40 35
SET Construction 9 37 28
SET Services 20 5 10
Non-SET (private sector) 22 15 17
Public sector 26 3 10
TOTAL 100 100 100
Unweighted n = 3046 6841 9887

SCIENCE, ENGINEERING AND TECHNOLOGY TECHNICIANS IN THE UK ECONOMY
12 SET TECHNICIANS IN EMPLOYMENT
Table 3.5: SET technician employment as a proportion of total employment in SET sectors, 2010 (weighted population estimates)
Associate
professional SET
technicians
Skilled trades SET
technicians
All SET
technicians
SIC07 SET sectors % of total persons in employment
Production
05-09 Mining, oil and gas extraction 7 15 22
10-12 Food and drink manufacturing 3 4 6
20-22Chemicals, pharmaceuticals, rubber and
plastics5 5 10
24-25, 28-
30,33Metals, mechanical engineering and vehicles 4 25 28
26-27Electrical, electronic and instrument
engineering6 11 17
13-19,23,
31-32Other manufacturing 1 4 5
35-36 Electricity, gas and water 6 16 22
41-43 Construction 2 17 19
Services
61 Telecommunications services 5 12 17
62 Computer services 6 2 9
71-72Architectural, engineering and scientific
services10 4 13
TOTAL 4 13 17
Source: Labour Force Survey 2010 (four quarters)
Note: Columns 1 and 2 may not sum to Column 3 due to rounding.

SCIENCE, ENGINEERING AND TECHNOLOGY TECHNICIANS IN THE UK ECONOMY
13SET TECHNICIANS IN EMPLOYMENT
Table 3.6: Highest qualifications held by SET technicians, UK, 2010, analysed by sector group
SET
Production
SET
Construction
SET
Services
Non-SET
(Private
sector)
Public
sector
Total
% of total SET associate professionals
A: Associate professional SET technicians
Bachelor degrees or above 19 19 35 34 34 29
Foundation degrees 1 0.3 1 2 2 1
Higher National Certificates or Diplomas 17 15 15 7 16 14
Other Level 4 or 5 qualifications 4 2 4 4 7 5
Level 3-Vocational 27 26 12 15 14 18
Level 3-General 7 10 9 14 11 10
Level 2-Vocational 4 5 4 3 3 4
Level 2-General 10 11 9 14 8 10
Low or no qualifications 6 6 5 5 3 5
Other qualifications (not classified) 4 5 5 3 3 4
TOTAL 100 100 100 100 100 100
Unweighted n = 761 259 592 622 836 3070
SET
Production
SET
Construction
SET
Services
Non-SET
(Private
sector)
Public
sectorTotal
% of total SET skilled trades workers
B: Skilled trades SET technicians
Bachelor degrees or above 4 2 16 8 7 5
Foundation degrees 0.5 0.3 1 0.5 4 0.5
Higher National Certificates or Diplomas 11 5 11 9 11 8
Other Level 4 or 5 qualifications 1 1 2 4 6 2
Level 3-Vocational 48 60 38 46 39 52
Level 3-General 3 4 7 6 2 4
Level 2-Vocational 6 7 4 4 3 6
Level 2-General 9 9 12 11 15 10
Low or no qualifications 10 5 6 8 5 8
Other qualifications (not classified) 7 6 3 5 9 6
TOTAL 100 100 100 100 100 100
Unweighted n = 2869 2480 348 1014 189 6900
Source: Labour Force Survey 2010 (four quarters)
Note: Column percentages may not sum to 100 due to rounding.

SCIENCE, ENGINEERING AND TECHNOLOGY TECHNICIANS IN THE UK ECONOMY
14 SET TECHNICIANS IN EMPLOYMENT
Classification of qualifications in Table 3.6: Bachelor degrees or above, Foundation degrees, Higher National Certificates or Diplomas: As stated.Other Level 4 or 5 qualifications: sub-degree qualifications in teaching and nursing and equivalent awards; Diplomas in Higher Education and other higher education qualifications below Bachelor degree level. Level 3 – Vocational: BTEC National awards, City & Guilds advanced craft and craft awards, completed trade apprenticeships and equivalent awardsLevel 3 – General: A level, A-S level, Scottish CSYS, Scottish Higher and equivalent awards; GNVQ Advanced awards and equivalent awardsLevel 2 – Vocational: BTEC General and First awards; City & Guilds awards below craft level; SCOTVEC National Certificate modules; YT, YTP certificates and equivalent awards.Level 2 – General: GCSE grade A-C, O level, CSE grade one and equivalent Scottish awards; GNVQ Intermediate and
Foundation awards and equivalent awards
In a recent study of SET technicians, Jagger et al (2010) distinguished between ‘Level 3 technicians’ and ‘Level 4 technicians’ according to the ‘dominant highest educational level’ in each particular associate professional and skilled trade occupation. However, this approach tends to divert attention away from the considerable diversity of qualifications held by SET technicians and also complicates efforts to understand how the current mix of technician qualifications has evolved over time. Therefore, in the present study where we wish to examine trends in technician qualifications over time in some detail, we continue to differentiate between SET technicians on the basis of the two main occupational groups concerned: SET associate professionals and SET skilled trades workers.

15
SCIENCE, ENGINEERING AND TECHNOLOGY TECHNICIANS IN THE UK ECONOMY
THE CHANGING MIX OF QUALIFICATIONS HELD BY SET TECHNICIANS
4. THE CHANGING MIX OF QUALIFICATIONS HELD BY SET TECHNICIANS As in other branches of the economy, SET sectors have experienced a very sharp increase in the
graduate share of employment (those holding Bachelor degrees or higher qualifications) in the last 20 years. In the case of SET sectors, the graduate share of total employment rose from 9% in 1994 to 22% in 2010 (Figure 4.1). This development followed the rapid growth in HE participation rates in the late 1980s and early 1990s and also reflected the departure of many less-qualified persons from the workforce during that period. The two other main trends have been a sharp decline in those with low or no qualifications and a slow decline in the share of employees with Level 3 vocational qualifications. In 2010 the Level 3 vocational share was 24%, down from 29% in 1994, but it is still the largest single qualification group in SET sectors. Over the same period the upper intermediate qualifications share of employment increased slightly, rising from 8% in 1994 to 10% in 2010.
In Section 5 below, we review evidence on the extent to which the increased share of graduate employment reflected increased demand for high-level skills as well as the greater availability of graduates. Here we focus on trends in occupational structure in SET sectors and the mix of qualifications held by SET technicians following the substantial increase in the graduate share of employment that has occurred in SET sectors. First, we examine whether the ratio of SET professionals to SET technicians has increased over time. Second, we investigate cross-sectoral variation in the extent to which the graduate share of SET technician employment has increased.. Third, we are interested in assessing changes in the mix of SET technician qualifications which might shed light on the extent of employment-based training (as compared to classroom education) in the initial formation of SET technicians currently in employment.
Changes in occupational classifications during this period present some problems for this analysis. Labour Force Survey (LFS) occupational data are based on the 1990 Standard Occupational Classification (SOC) for the years 1994-2000 and the 2000 SOC for 2001-2006. This change causes a substantial discontinuity in time series based on occupational data, not just because of changes in the work that people do and the characteristics of occupations but also because of changes between SOC 1990 and SOC 2000 in the way that key occupations such as managers were classified (Elias et al, 2000). For this reason the discontinuity between 2000 and 2001 in the data series is clearly indicated in charts based on occupational data in this section.

SCIENCE, ENGINEERING AND TECHNOLOGY TECHNICIANS IN THE UK ECONOMY
16 THE CHANGING MIX OF QUALIFICATIONS HELD BY SET TECHNICIANS
0
5
10
15
20
25
30
35
1994 1995 1996 1997 1998 1999 2000 2001 2002 2003 2004 2005 2006 2007 2008 2009 2010
% o
f tot
al e
mpl
oym
ent Graduates
Upper intemediateNVQ3-VocationalNVQ3-GeneralNVQ2-VocationalNVQ2-GeneralLow or no qualificationsOther qualifications
Figure 4.1: Trends in qualification-group shares of employment, All SET sectors, 1994-2010
Source: Labour Force Survey 1994-2010 (all quarters)Note: Upper intermediate qualifications comprise Foundation degrees, Higher National Certificates and Diplomas and other higher education qualifications below Bachelor degree level.
Between 1994-2000, estimates derived from LFS data based on SOC 1990 suggest that there was little change in the ratio of SET professionals to SET associate professionals in SET production and service sectors. And in SET construction sectors, this ratio actually declined between 1996-2000 (Figure 4.2). However, from 2001 onwards similar estimates based on SIC 2000 suggest that there was steady growth in the ratio of SET professionals to SET associate professionals (rising from 1.7 in 2001 to 2.5 in 2010). With some fluctuations, this increase in the relative importance of SET professionals occurred in all three main groups of SET sectors. This period also saw rapid growth in the ratio of SET associate professionals to SET skilled trades in service sectors but not in SET production or construction sectors where the relative importance of the two types of SET technician – associate professionals and skilled trades workers – hardly changed at all (Figure 4.3).

17
SCIENCE, ENGINEERING AND TECHNOLOGY TECHNICIANS IN THE UK ECONOMY
THE CHANGING MIX OF QUALIFICATIONS HELD BY SET TECHNICIANS
0.0
0.5
1.0
1.5
2.0
2.5
3.0
3.5
4.0
4.5
5.0
1994 1996 1998 2000 2001 2003 2005 2007 2009
Ratio
of S
ET p
rofe
ssio
nals
to S
ET a
ssoc
iate
pro
fess
iona
ls
SET ProductionSET ConstructionSET ServicesSET Total
Source: Labour Force Survey 1994-2010 (all quarters)Notes: 1994-2000 estimates are based on the Standard Occupational Classification (SOC)
1990; 2001-2010 estimates are based on SOC 2000.
Figure 4.2: Ratio of SET professionals to SET associate professionals in employment, SET sectors, 1994-2010
0.00
0.20
0.40
0.60
0.80
1.00
1.20
1.40
1.60
1.80
2.00
1994 1996 1998 2000 2001 2003 2005 2007 2009
Ratio
of S
ET a
ssoc
iate
pro
fess
iona
ls to
SET
ski
lled
trad
es
SET ProductionSET ConstructionSET ServicesSET Total
Source: Labour Force Survey 1994-2010 (all quarters)Notes: 1994-2000 estimates are based on the Standard Occupational Classification (SOC) 1990; 2001-2010 estimates are based on SOC 2000.For classification of SET occupations under SOC 1990 and SOC 2000, see Appendix Table A1.
Figure 4.3: Ratio of SET associate professionals to SET skilled trades in employment, SET sectors, 1994-2010
SCIENCE, ENGINEERING AND TECHNOLOGY TECHNICIANS IN THE UK ECONOMY
18 THE CHANGING MIX OF QUALIFICATIONS HELD BY SET TECHNICIANS
The increases since 2001 in the ratio of SET professionals to SET technicians – both associate professionals and skilled trades workers – are consistent with arguments that skill demands have been rising in SET sectors in recent years. But they could also partly reflect organisational responses to the increased supply of graduates which might not have occurred if graduates were less readily available. Without supporting evidence such as pay data and case study research in workplaces (discussed in Section 5 below), it is not possible to assess the relative importance of these demand and supply factors.
Similar uncertainties apply to the possible causes of trends in the mix of qualifications held by SET technicians in SET sectors. As might be expected in the wake of the large increase in graduate supply which has occurred in the last 20 years, the graduate share of SET associate professional employment has risen sharply – up from 23% in 1994 to 32% in 2000 (using SOC 1990-based data) and then, after a period of stability from 2001 until 2005, up from 23% in 2005 to 27% in 2010 (according to SOC 2000-baed estimates) (Figure 4.4). 11 The graduate share of SET skilled trades workers also increased sharply from a low base in SET service sectors to reach 15% in 2010 but the same did not occur in SET production and construction sectors where the overall share of graduates in SET skilled trades employment was only 2-4% in 2010 (Figure 4.5). In Section 5 below we consider additional evidence which sheds some light on how far these shifts were due to employer demand for higher skills among their technicians and how far they simply reflected employer responses to the increased supply of graduates applying for technician-level jobs.
One important implication of the rising graduate share among SET technicians is that the proportion of technicians with an apprenticeship training background may have been in decline for some time. ‘Apprenticeship training’ is here defined as employment-based training which is combined with part-time attendance in vocational education classes or workshops related to the field of training. This type of training is well-suited to developing skills and knowledge that are relevant to job performance, including the development of tacit skills and knowledge (for example, through interactions with co-workers), and to gain ‘access to types of knowledge and expertise that will enable [trainees] to grow beyond, as well as within, their current job role(s) and sector(s)’ (Fuller and Unwin, 2011: 37).
11 Note that estimates of qualification shares in this section apply to SET sectors only, not the whole economy as shown in Table 3.6 above.

19
SCIENCE, ENGINEERING AND TECHNOLOGY TECHNICIANS IN THE UK ECONOMY
THE CHANGING MIX OF QUALIFICATIONS HELD BY SET TECHNICIANS
Apart from the increasing share of SET technician employment occupied by graduates (many of whom will have acquired their skills and knowledge primarily through classroom-based learning), another reason why it seems likely that the apprentice-trained share of technician employment has declined is that LFS data show declining trends in the shares of upper intermediate and Level 3 vocational qualifications among the SET technician workforce. These are the qualification groups where employees who completed apprenticeship training combined with either Level 3 or 4 qualifications are to be found. 12
Figure 4.6 shows that the upper intermediate share of SET associate professionals employment in SET sectors fell from 25% in 1994 to 22% in 2000 (SOC 1990) and then continued to fall gradually in SET production and construction sectors – but not in SET services -- for most of the 2001-2010 period (SOC 2000). At the same time the Level 3 vocational share of SET associate professional employment fell by 3-4 percentage points in both time periods (Figure 4.7). By contrast, the upper intermediate share of SET skilled trades employment rose slightly in both time periods, reaching 9% in 2010 (Figure 4.8), but the very large Level 3 vocational share among SET skilled trades workers fell by 3-4 percentage points in both time periods, with signs of decline in all three groups of SET sectors (Figure 4.9).
Although LFS survey data do not contain sufficient information to be sure what has happened to the share of apprentice-trained workers among SET technicians, the overall trends in the graduate, upper intermediate and Level 3 vocational employment shares are consistent with growing evidence of concerns among SET employers that technician recruitment in recent years may have drawn too heavily on people whose skills and knowledge have been obtained primarily through classroom study rather than employment-based training. These concerns also partly reflect awareness that ageing among the current SET technician workforce is more of a problem among those with upper intermediate and Level 3 vocational qualifications than any other groups of technicians. For example, over a third of all SET technicians in SET sectors with Level 3 vocational qualifications are aged 50 or older (Table 4.1). We now go on to consider this and other evidence relating to current employer demand for technician-level skills.
12 The Level 3 vocational qualifications category includes persons whose highest declared qualification is a ‘trade apprenticeship’ as well
as qualifications such as City and Guilds advanced craft awards which are often associated with apprenticeship training. The upper
intermediate category includes persons with Higher National Certificates which are also often associated with apprenticeship training.
However, there is no certainty about the kind of training associated with any given qualification. Thus LFS data do not permit reliable
estimates of the proportion of apprentice-trained persons in any qualification group or industry. Nor is the LFS a satisfactory guide to
the numbers of people currently undertaking apprenticeships since the responses to an LFS question about apprenticeship training
(first introduced in 2005) suggest that trainees do not always know whether their training counts as an apprenticeship or not (Felstead,
Green and Jewson, 2011, Footnote 5).

SCIENCE, ENGINEERING AND TECHNOLOGY TECHNICIANS IN THE UK ECONOMY
20 THE CHANGING MIX OF QUALIFICATIONS HELD BY SET TECHNICIANS
Table 4.1: Age distribution of SET technicians, SET sectors, 2010, analysed by qualification group
A: SET associate professionals
B: SET skilled trades workers
GraduatesUpper
intermediateLevel 3
Vocational Other/lower qualifications Total
% of total students
Under 25 13 6 6 14 11
25-29 23 13 10 14 15
30-39 31 23 25 24 26
40-49 15 30 26 26 24
50-59 11 22 22 13 16
60 or older 6 6 10 9 8
TOTAL 100 100 100 100 100
Unweighted n = 412 320 350 503 1585
GraduatesUpper
intermediateLevel 3
Vocational Other/lower qualifications Total
% of total students
Under 25 6 7 11 20 13
25-29 25 11 11 10 12
30-39 27 24 18 22 20
40-49 22 26 23 24 24
50-59 16 23 27 15 23
60 or older 4 9 9 9 9
TOTAL 100 100 100 100 100
Unweighted n = 231 540 3028 1787 5586
Source: Labour Force Survey 2010 (four quarters)Note: Column percentages may not sum to 100 due to rounding.

21
SCIENCE, ENGINEERING AND TECHNOLOGY TECHNICIANS IN THE UK ECONOMY
THE CHANGING MIX OF QUALIFICATIONS HELD BY SET TECHNICIANS
Figure 4.4: Graduates as a proportion of SET associate professional employment, SET sectors, 1994-2010
Source: Labour Force Survey 1994-2010 (all quarters, three-year moving averages)Notes: 1994-2000 estimates are based on the Standard Occupational Classification (SOC) 1990; 2001-2010 estimates are based on SOC 2000.
For classification of SET occupations under SOC 1990 and SOC 2000, see Appendix Table A1.
Figure 4.5: Graduates as a proportion of SET skilled trades employment, SET sectors, 1994-2010
Source: Labour Force Survey 1994-2010 (all quarters, three-year moving averages)Notes: 1994-2000 estimates are based on the Standard Occupational Classification (SOC) 1990; 2001-2010 estimates are based on SOC 2000.
For classification of SET occupations under SOC 1990 and SOC 2000, see Appendix Table A1.
0
5
10
15
20
25
30
35
40
45
50
1994 1996 1998 2000 2001 2003 2005 2007 2009
Gra
duat
es a
s %
of S
ET a
ssoc
iate
pro
fess
iona
l em
ploy
men
t
SET ProductionSET ConstructionSET ServicesSET Total
0
2
4
6
8
10
12
14
16
1994 1996 1998 2000 2001 2003 2005 2007 2009
Gra
duat
es a
s %
of S
ET s
kille
d tr
ades
em
ploy
men
t
SET ProductionSET ConstructionSET ServicesSET Total

SCIENCE, ENGINEERING AND TECHNOLOGY TECHNICIANS IN THE UK ECONOMY
22 THE CHANGING MIX OF QUALIFICATIONS HELD BY SET TECHNICIANS
Figure 4.6: Upper intermediate qualification holders as a proportion of SET associate professional employment, SET sectors, 1994-2010
Source: Labour Force Survey 1994-2010 (all quarters, three-year moving averages)Notes: 1994-2000 estimates are based on the Standard Occupational Classification (SOC) 1990; 2001-2010 estimates are based on SOC 2000.For classification of SET occupations under SOC 1990 and SOC 2000, see Appendix Table A1.Upper intermediate qualifications comprise Foundation degrees, Higher National Certificates
and Diplomas and other higher education qualifications below Bachelor degree level.
Figure 4.7: Level 3 vocational qualification holders as a proportion of SET associate professional employment, SET sectors, 1994-2010
Source: Labour Force Survey 1994-2010 (all quarters, three-year moving averages)Notes: 1994-2000 estimates are based on the Standard Occupational Classification (SOC) 1990;
2001-2010 estimates are based on SOC 2000.
For classification of SET occupations under SOC 1990 and SOC 2000, see Appendix Table A1.
0
5
10
15
20
25
30
35
40
1994 1996 1998 2000 2001 2003 2005 2007 2009
Upp
er in
term
edia
te q
ualif
icat
ion
hold
ers
as %
of S
ET a
ssoc
iate
pro
fess
iona
l em
ploy
men
t SET ProductionSET ConstructionSET ServicesSET Total
0
5
10
15
20
25
30
35
1994 1996 1998 2000 2001 2003 2005 2007 2009
NV
Q3
Voca
tiona
l as
% o
f SET
ass
ocia
te p
rofe
ssio
nal e
mpl
oym
ent
SET ProductionSET ConstructionSET ServicesSET Total

23
SCIENCE, ENGINEERING AND TECHNOLOGY TECHNICIANS IN THE UK ECONOMY
THE CHANGING MIX OF QUALIFICATIONS HELD BY SET TECHNICIANS
Figure 4.8: Upper intermediate qualification holders as a proportion of SET skilled trades employment, SET sectors, 1994-2010
Source: Labour Force Survey 1994-2010 (all quarters, three-year moving averages)Notes: 1994-2000 estimates are based on the Standard Occupational Classification (SOC) 1990; 2001-2010 estimates are based on SOC 2000.For classification of SET occupations under SOC 1990 and SOC 2000, see Appendix Table A1.Upper intermediate qualifications comprise Foundation degrees, Higher National Certificates and
Diplomas and other higher education qualifications below Bachelor degree level.
Figure 4.9: Level 3 vocational qualification holders as a proportion of SET skilled trades employment, SET sectors, 1994-2010
Source: Labour Force Survey 1994-2010 (all quarters, three-year moving averages)Notes: 1994-2000 estimates are based on the Standard Occupational Classification (SOC) 1990; 2001-2010 estimates are based on SOC 2000.
For classification of SET occupations under SOC 1990 and SOC 2000, see Appendix Table A1.
0
2
4
6
8
10
12
14
16
18
1994 1996 1998 2000 2001 2003 2005 2007 2009
Upp
er in
term
edia
te q
ualif
icat
ion
hold
ers
as %
of S
ET s
kille
d tr
ades
em
ploy
men
t
SET ProductionSET ConstructionSET ServicesSET Total
0
10
20
30
40
50
60
70
80
1994 1996 1998 2000 2001 2003 2005 2007 2009
NV
Q3
Voca
tiona
l as
% o
f SET
ski
lled
trad
es e
mpl
oym
ent
SET ProductionSET ConstructionSET ServicesSET Total

25
SCIENCE, ENGINEERING AND TECHNOLOGY TECHNICIANS IN THE UK ECONOMY
EMPLOYER DEMAND FOR SET TECHNICIAN-LEVEL SKILLS
5. EMPLOYER DEMAND FOR SET TECHNICIAN-LEVEL SKILLS How well has the increased graduate share of SET technician employment met the skill
requirements of employers? One source of evidence in response to this question is estimates of salary returns to graduates employed in SET technician jobs. Multivariate analysis of LFS data suggests that, after allowing for the effects of age, experience, gender, ethnicity and other factors which may influence pay levels, average hourly pay for Bachelor degree graduates in SET associate professional occupations in SET sectors between 2002-10 was about 5-9% above that of holders of upper intermediate vocational qualifications in those same occupations, while the pay advantage was higher still for holders of postgraduate qualifications in SET technician jobs (Appendix Table A2). Similar pay differentials apply across the top half of the SET technician pay distribution (Appendix Table A3). Since the graduate share of employment has risen over this period, the continued pay premia attached to Bachelor and higher degree qualifications suggest that many graduates have been used to meet the rising skill demands in SET technician jobs which UKCES (2010) attributes to factors such as more complex product specifications and increasingly competitive product markets. 13
These findings are also consistent with studies of the wider economy which show that average returns to graduate education have held up fairly well in recent years in spite of the overall expansion in graduate supply (Machin, 2003; Walker and Zhu, 2008). Thus the returns to a ‘standard academic route’ through GCSEs and A levels (or their equivalents in Scotland) to Bachelor and higher degrees continue to exceed those for most vocational qualifications (McIntosh, 2006; Jenkins, Greenwood and Vignoles, 2007). Although some vocational qualifications such as SET apprenticeships also attract positive salary returns (McIntosh, 2005), these returns still fall below those attached to graduate-level qualifications so it is hardly surprising if many able young people with interests in SET subjects have elected to follow that academic route in recent years.
However, case study evidence and other research based on interviews with employers suggests that some SET employers may now be starting to re-evaluate their present mix of graduate- and intermediate-level personnel in SET technician jobs. For example, a 2009 government report cited evidence that employers in SET and related sectors were finding it hard to recruit staff with ‘technical and practical work experience’ (DIUS, 2009: 26). More recently, the National Strategic Skills Audit has emphasised that many employers are seeking technicians who possess ‘the ability
13 Note that, although the coefficients attached to Bachelor degrees decline slightly over the three time periods under consideration in Table 5.1, these differences are not statistically significant.

SCIENCE, ENGINEERING AND TECHNOLOGY TECHNICIANS IN THE UK ECONOMY
26 EMPLOYER DEMAND FOR SET TECHNICIAN-LEVEL SKILLS
to apply an in-depth understanding of a particular field in a practical setting’ (UKCES, 2010: Volume 2; 182). Specific examples of SET technician requirements of this kind cited in the Audit include shortages of engineering and craft technicians who are needed to fill replacement demand caused by an ageing workforce in the pharmaceutical and medical biotechnology sectors, technicians who can run complex equipment in advanced manufacturing firms in field such as composites and nanotechnology, and electronics technicians who can combine practical skills with knowledge of fields such as printing, materials science and chemistry (ibid).
In this context, a key issue prompting some employers to re-evaluate their qualifications and skills mix at technician level is that most new graduate recruits have acquired their skills and knowledge primarily through classroom study rather than through employment-based training. Thus they tend to lack the practical skills and experience, problem-solving skills and commercial understanding that are best acquired through employment-based training such as apprenticeships. Although considerable resources have been devoted to teaching ‘employability skills’ to UK university students, Mason, Williams and Cranmer (2009) find that these efforts have little effect on graduate labour market prospects unless students have been able to move outside their classrooms and participate in sandwich training placements in industry which do help to develop practical and commercial skills.
Drawing on case study investigations, Lawton Smith (2009) cites a bioscience firm which has tended to rely on graduate-qualified technicians in the past but now, partly as a result of increasing automation of laboratory procedures, sees a need for more technicians with practical skills rather than knowledge of ‘pure science’. Similarly, Mason et al (2012) report on a pharmaceuticals firm which over the years had let its technician apprentice programme run down because of the ready availability of graduates but has now re-started apprentice training in order to fill specific skill gaps among its workforce, including training in site-specific production processes. Some chemicals firms in this same study were also considering restarting apprenticeship training in order to cope with future problems deriving from an ageing workforce.
A recent study of university laboratory and engineering workshop technicians highlights some of the key issues which have arisen as a result of the rising graduate share of technician employment. Lewis and Gospel (2011) describe several examples of university departments which have tended to recruit graduates to technician jobs in recent decades, partly because of rising skill demands and partly because it has been easier and quicker to do so rather than train up apprentices. In some cases a new division of labour has developed in which graduate technicians provide support to postgraduate scientists. However, several of these departments have recently begun or are about to set up new apprentice training programmes, not just because of their ageing workforces and external recruitment difficulties but also because of the opportunities such schemes present for developing scarce skills (for example, in mechatronics, a mix of mechanical and electrical skills, and in specialist areas of chemistry).

27
SCIENCE, ENGINEERING AND TECHNOLOGY TECHNICIANS IN THE UK ECONOMY
EMPLOYER DEMAND FOR SET TECHNICIAN-LEVEL SKILLS
Further research is necessary to establish just how widespread are such changes in the pattern of skills demand by SET employers. However, the case study evidence available to date is plausible given that many apprentice-trained SET technicians currently in employment are in older age groups and therefore their employers have reason to be concerned about the future availability of the particular skills and knowledge held by these employees. In addition, some firms may stand to benefit from complementarities between graduate technicians and apprentice-trained technicians who often possess distinctively different skill sets.
In this context, the challenge for many SET employers is to strike a balance between rising skill demands in SET technician jobs (which still often seem to call for increased employment of graduates) and the continued need for practical skills and experience (which benefit from apprentice-trained technicians). In the last 10-15 years SET employers have been tempted by the graduate route in large part because they are not required to incur the costs of educating graduates in contrast to the substantial costs of financing apprenticeship training. However, this has left many firms and organisations short of the practical skills and commercial understanding which are best acquired through employment-based training. In addition, the large-scale recruitment of graduates to SET technician jobs has in some cases led to less well-qualified technicians feeling under-appreciated and demotivated (Diamond et al, 2011), even though in principle their skills are keenly sought after. Hence employers also face a challenge in devising modes of recruitment, training and work organisation which will make productive use of the combined skills of graduate-qualified and apprentice-trained SET technicians.

29
SCIENCE, ENGINEERING AND TECHNOLOGY TECHNICIANS IN THE UK ECONOMY
CURRENT ARRANGEMENTS FOR SET TECHNICIAN-LEVEL EDUCATION AND TRAINING
6. CURRENT ARRANGEMENTS FOR SET TECHNICIAN-LEVEL EDUCATION AND TRAINING Given the diversity of qualifications held by new entrants to SET technician jobs, there is no
one set of education and training courses that can be described as the main source of new SET technicians. Rather it is necessary to take an overview of SET-related courses that are potentially relevant to technician jobs and then form an assessment of how well they seem to meet the mix of skill requirements described in Section 5, in particular, the need for academic skills and knowledge to be combined with the skills and knowledge that are best gained through employment-based learning.
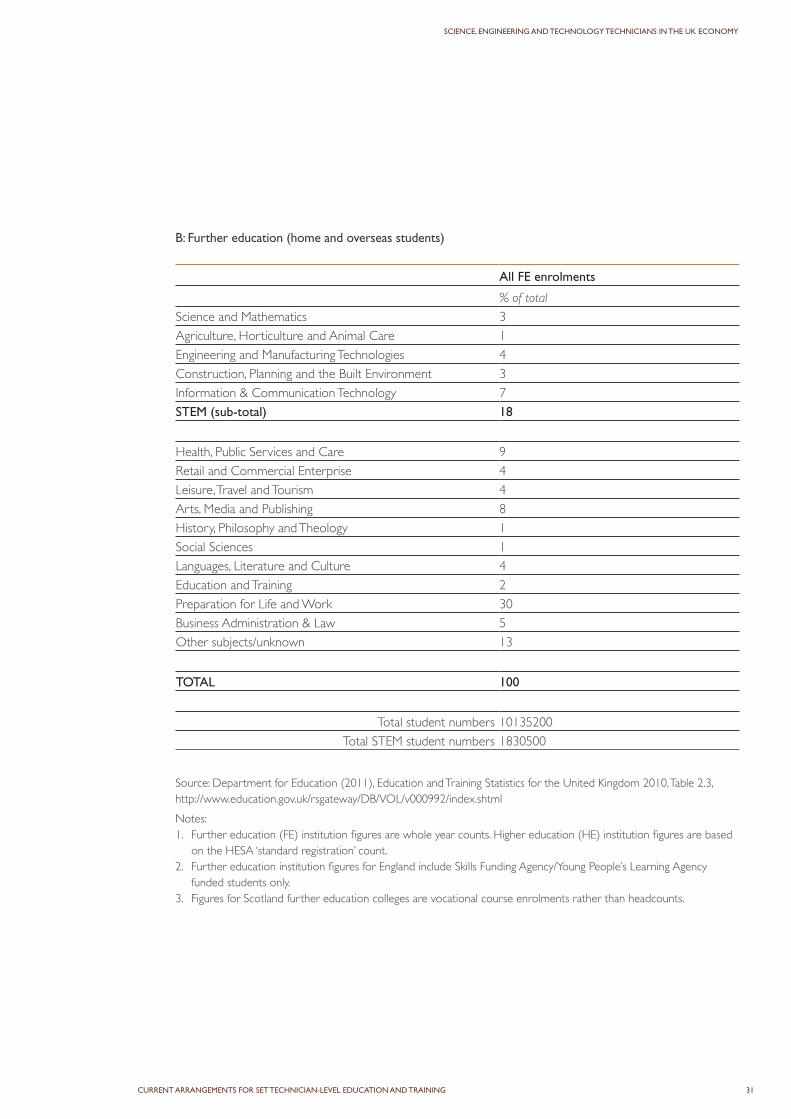
Table 6.1 shows the distribution of UK higher and further education students by subject area in 2008-09. STEM students (defined here to exclude medicine and dentistry) represented 31% of First degree students, 13% of Other HE undergraduates and 18% of further education (FE) enrolments. According to the Department for Education’s Education and Training Statistics for the UK (2010, Table 2.3), this means there were as many as 1.8 million STEM students in enrolled in FE colleges in that year, far outnumbering STEM students on First degree and other undergraduate courses. However, so far as STEM technicians are concerned, our prime interest lies at the top end of FE (Levels 3 and 4) and the upper intermediate qualifications which form part of the ‘Other undergraduate category.
At Level 4 there are some Higher Apprenticeships which all turn out to be STEM-related but they are few in number (1500 starts in England in 2009-10). Most of these are mathematics-based and primarily serve the accountancy profession (Skills Commission, 2011). However, the small number of STEM-related Higher Apprenticeships may be partly offset by the fact that, as described in Mason and Hopkin (2010), a large majority of part-time students attending HE courses are in employment, are taking courses relevant to their jobs and receive at least some support with tuition fees from their employers. Hence, they constitute another potential source of employment-based training combined with related vocational education.

SCIENCE, ENGINEERING AND TECHNOLOGY TECHNICIANS IN THE UK ECONOMY
30 CURRENT ARRANGEMENTS FOR SET TECHNICIAN-LEVEL EDUCATION AND TRAINING
Table 6.1: Student numbers in post-compulsory education and training, UK, 2010, analysed by qualification aim and subject area
A: Higher education (home and overseas students)
Source: Department for Education (2011), Education and Training Statistics for the United Kingdom 2010, Table 2.5, http://www.education.gov.uk/rsgateway/DB/VOL/va000992/index.shtml
Notes:1. Figures for higher education (HE) institutions are based on the HESA ‘standard registration’ count. Figures for FE
institutions are whole year enrolments.2. Further education (FE) institution figures for England include Learning and Skills Council (LSC) funded students only.3. Includes Combined and general categories.4. Includes data for higher education students in further education institutions in Wales which cannot be split by level
and data for higher education students in further education institutions in England, which cannot be split by subject group.
Postgraduates First degrees Other undergraduates
% of total students
Biological Sciences 5 10 2
Vet. Science, Agriculture & related 1 1 1
Physical Sciences 3 5 1
Mathematical and Computing Sciences 5 6 3
Engineering & Technology 7 7 4
Architecture, Building & Planning 3 3 2
STEM (sub-total) 24 31 13
Medicine & Dentistry 3 3 0
Subjects Allied to Medicine 9 8 20
Social Sciences (inc Law) 12 14 7
Business & Administrative Studies 20 13 10
Mass Communications & Documentation 2 3 1
Languages 3 6 4
Historical and Philosophical Studies 3 5 2
Creative Arts & Design 3 9 4
Education 19 4 10
Other subjects (3) 0 2 15
Unknown (4) 1 1 14
TOTAL 100 100 100
Total student numbers 542500 1368600 645400
Total STEM student numbers 132400 420400 87100
31
SCIENCE, ENGINEERING AND TECHNOLOGY TECHNICIANS IN THE UK ECONOMY
CURRENT ARRANGEMENTS FOR SET TECHNICIAN-LEVEL EDUCATION AND TRAINING
B: Further education (home and overseas students)
All FE enrolments
% of total
Science and Mathematics 3Agriculture, Horticulture and Animal Care 1Engineering and Manufacturing Technologies 4Construction, Planning and the Built Environment 3Information & Communication Technology 7STEM (sub-total) 18
Health, Public Services and Care 9Retail and Commercial Enterprise 4Leisure, Travel and Tourism 4Arts, Media and Publishing 8History, Philosophy and Theology 1Social Sciences 1Languages, Literature and Culture 4Education and Training 2Preparation for Life and Work 30Business Administration & Law 5Other subjects/unknown 13
TOTAL 100
Total student numbers 10135200Total STEM student numbers 1830500
Source: Department for Education (2011), Education and Training Statistics for the United Kingdom 2010, Table 2.3, http://www.education.gov.uk/rsgateway/DB/VOL/v000992/index.shtml
Notes:1. Further education (FE) institution figures are whole year counts. Higher education (HE) institution figures are based
on the HESA ‘standard registration’ count. 2. Further education institution figures for England include Skills Funding Agency/Young People’s Learning Agency
funded students only. 3. Figures for Scotland further education colleges are vocational course enrolments rather than headcounts.

SCIENCE, ENGINEERING AND TECHNOLOGY TECHNICIANS IN THE UK ECONOMY
32 CURRENT ARRANGEMENTS FOR SET TECHNICIAN-LEVEL EDUCATION AND TRAINING
The most detailed information on part-time enrolments in HE courses comes from Higher Education Statistics Agency (HESA) data which cover students taught in HE institutions and on courses franchised by HE institutions but taught in FE colleges. Unfortunately, equivalent data for HE courses run directly by FE colleges are excluded. In spite of this limitation the HESA data give some idea of the numbers involved in part-time STEM-related studies at upper intermediate level. As shown in Table 6.2, as many as 74% of part-time students following Higher National courses in 2007-08 – 12000 students in all -- were studying STEM-related subjects, mainly in engineering and construction-related areas (Column 6). This compares with 16% (5000) of part-time Foundation degree students (Column 4) and 24% (45000) of part-time First degree students enrolled in SET-related courses in the same year (Column 2).
In absolute numbers part-time students seeking upper intermediate qualifications in SET-related areas are clearly outnumbered by those seeking First degrees, many of whom will aspire to work in SET professional occupations or other non-SET jobs at professional level. However, a proportion of part-time First degree students may find their way to SET technician positions as will some of those obtaining Foundation degrees or Higher National qualifications through part-time study. Given their ability to combine academic studies with ongoing work experience, this is a potentially fruitful source of SET technicians which deserves further study.
Turning now to Level 3 qualifications, available statistics on the plethora of STEM-related courses at this level in England have been analysed at length in BIS-RAE (2010) and summarised by Frost and Greatorex (2010) and Skills Commission (2011). The main findings relevant to SET technician-level skills are:
• Level 3 STEM-related qualifications were gained by approximately 430,000 ‘achievers’ in maintained schools in 2009-10 (41% of all achievers in those schools) and approximately 409,000 achievers in further education (FE) colleges and related institutions (representing a third of all achievers in those institutions) (Skills Commission, 2011, Data Appendix Figure 2.1)
• In both science and mathematics areas, the main STEM-related qualifications gained at Level 3 are academic in nature, for example, A levels (Frost and Greatorex, 2010)
• By contrast, in engineering and technology areas, a sizeable proportion of qualifications are vocational (for example, BTEC and City and Guilds awards).
• As expected, the great majority of Level 3 academic qualifications in STEM areas are gained by 16-18 year olds while adult enrolments in STEM areas mainly are mainly split between qualifications taken as part of apprenticeships and other vocational/occupational qualifications (Table 6.3)

33
SCIENCE, ENGINEERING AND TECHNOLOGY TECHNICIANS IN THE UK ECONOMY
CURRENT ARRANGEMENTS FOR SET TECHNICIAN-LEVEL EDUCATION AND TRAINING
Table 6.2: Qualification aims of UK-domiciled HE students, UK, 2007-08, analysed by mode of study and subject area
First degrees
First degrees
Foundation degrees
Foundation degrees
Higher National
Certificates/ Diplomas
Higher National
Certificates/ Diplomas
Full-timePart-time Full-time Part-time Full-time
Part-time
% of enrolments
Biological sciences 9 8 6 1 5 1
Veterinary science, agriculture and related subjects 1 0 7 2 4 5
Physical sciences 4 3 2 0 2 2
Mathematical and computing sciences 6 5 7 4 13 6
Engineering and technology 5 4 7 5 13 35
Architecture, building & planning 2 4 2 4 7 25
STEM (sub-total) 27 24 31 16 44 74
Medicine and dentistry 4 0 0 0 0 0
Subjects allied to medicine 8 14 9 9 2 2
Social studies 8 9 9 12 5 3
Law 4 4 0 2 1 1
Business & administrative studies 10 8 11 20 31 16
Mass communications & documentation 3 0 3 0 2 0
Languages 5 5 0 0 0 0
Historical & philosophical studies 4 6 0 2 0 0
Creative arts & design 10 2 20 3 14 3
Education 3 5 12 33 1 1
Combinations and interdisciplinary courses 13 22 4 2 1 1
TOTAL 100 100 100 100 100 100
Total student numbers 974720 188548 30645 28060 14609 15827
Total STEM student numbers 263174 45252 9500 4490 6428 11712
Source: HESA Student Record, 2007-08

SCIENCE, ENGINEERING AND TECHNOLOGY TECHNICIANS IN THE UK ECONOMY
34 CURRENT ARRANGEMENTS FOR SET TECHNICIAN-LEVEL EDUCATION AND TRAINING
The relatively important role of apprenticeships among adult Level 3 enrolments in STEM areas reflects the recent rapid growth in apprentice numbers which has occurred. For example, in England total apprentice starts in all subject areas rose by 51% between 2002-03 and 2009-10 and by 37% in STEM areas. 14 Some of this reported growth has come in for criticism on the grounds that it includes ‘conversions’ of current adult employees to apprentice status with little change to the content or duration of their pre-existing training programmes (Fuller and Unwin, 2011; Keep and James, 2011). However, STEM apprenticeships tend to be exonerated from most of these criticisms.
Other concerns about the rapid growth in apprenticeships centre on the relatively large proportion of apprentices who are aiming for Level 2 qualifications rather than Level 3, which has traditionally been the level of qualification associated with apprenticeship training. In the case of STEM apprenticeships, the proportion of learners who are aiming for Level 2 qualifications is below average compared to most other sectors but it is far from negligible. Table 6.4 shows that STEM trainees accounted for 42% of all Advanced Apprenticeships (Level 3) and 25% of all Intermediate Apprenticeships (Level 2) in 2009-10. At both levels of Apprenticeship and in all age categories, a large majority of STEM apprentices were training in engineering and technology areas rather than in science and mathematics areas.
Table 6.3: Level 3 enrolments in STEM qualifications, England, 2008-09
16-18 year olds Adults
16-18 year olds Adults
% of enrolments
Level 3:
A levels 816076 13501 80 6
Vocational/occupational qualifications 149887 114235 15 49
Qualifications as part of apprenticeships 50678 103777 5 45
TOTAL 1016641 231513 100 100
Source: Frost and Greatorex (2010), Tables 1-2.
14 Source: Table S8.1: Apprenticeship Programme Starts by Sector Subject Area, Level and Age (2002/03 to 2009/10)http://www.thedataservice.org.uk/statistics/statisticalfirstrelease/sfr_supplementary_tables/Apprenticeship_sfr_supplementary_tables/

35
SCIENCE, ENGINEERING AND TECHNOLOGY TECHNICIANS IN THE UK ECONOMY
CURRENT ARRANGEMENTS FOR SET TECHNICIAN-LEVEL EDUCATION AND TRAINING
Thus in engineering and technology, in particular, there is a solid foundation for the development of SET technicians with an apprenticeship background, and the numbers of academically able young people interested in SET apprenticeships could well increase in future years in response to the planned increases in HE tuition fees. However, much will depend on the willingness of SET employers to incur the costs of providing technician apprenticeships. At present some highly esteemed apprenticeship schemes in SET sectors (such as that at Rolls Royce) have to turn away large numbers of applicants for training places. 15
Table 6.4: Apprenticeships started in England in 2009-10
Source: Skills Commission (2011), Figure 4.
Advanced - 16-18 Advanced - 19-24Advanced - 25-
plus Advanced - Total
Total apprenticeships 27200 39700 20600 87500
Total STEM 16592 17071 3296 36959
STEM as % of total 61 43 16 42
Engineering/technology as % of STEM 93 81 65 85
Science/maths as % of STEM 7 19 35 15
Intermediate - 16-18
Intermediate - 19-24
Intermediate - 25-plus
Intermediate - Total
Total apprenticeships 89400 72700 28300 190400
Total STEM 29502 13813 3962 47277
STEM as % of total 33 19 14 25
Engineering as % of STEM 91 83 79 88
Science/maths as % of STEM 9 17 21 12
15 http://www.telegraph.co.uk/finance/jobs/8710305/School-leavers-scramble-for-apprenticeships.html

37
SCIENCE, ENGINEERING AND TECHNOLOGY TECHNICIANS IN THE UK ECONOMY
SUMMARY AND ASSESSMENT
7. SUMMARY AND ASSESSMENT There are currently just over 1.5 million SET (science, engineering and technology) technicians in
employment in the UK, about 30% of whom are in associate professional occupations while 70% are in skilled trades occupations. In 2010 almost three quarters (73%) of SET technicians were employed in SET production, construction and service sectors with a further 17% in non-SET private sector activities and 10% in the public sector. A key characteristic of the SET technician workforce is that it is ageing fast, with as many as 31% of SET skilled trades workers and 23% of SET associate professionals aged 50 or older in 2010.
In the last 20 years the mix of occupations and qualifications in SET sectors has changed greatly in response to the increased supply of university graduates and the departure of many low-qualified persons from the workforce. In particular, the ratio of SET professionals to SET technicians has increased over time while the graduate share of technician employment has increased steadily, reaching 27% of SET associate professionals in all SET sectors in 2010 and 16% of SET skilled trades workers in SET service sectors such as telecoms and computer services.
Although analysis of salary returns to qualifications suggests that many of the graduates recruited to technician jobs have been useful in meeting rising skill demands, case study evidence and other research based on interviews with employers suggests that some SET employers may now be starting to re-evaluate their present mix of graduate- and intermediate-level personnel in SET technician jobs. A key reason for this is that most new graduate recruits have acquired their skills and knowledge primarily through classroom study rather than through employment-based training. Thus they tend to lack the practical skills and experience, problem-solving skills and commercial understanding that are best acquired through employment-based training such as apprenticeships.
Further research is necessary to establish just how widespread are such changes in the pattern of skills demand by SET employers. However, the case study evidence available to date is plausible given that many apprentice-trained SET technicians currently in employment are in older age groups and therefore their employers have reason to be concerned about the future availability of the particular skills and knowledge held by these employees. In addition, some firms may stand to benefit from complementarities between graduate technicians and apprentice-trained technicians who often possess distinctively different skill sets.

SCIENCE, ENGINEERING AND TECHNOLOGY TECHNICIANS IN THE UK ECONOMY
38 SUMMARY AND ASSESSMENT
Analysis of student numbers in different forms of education and training relevant to SET technician employment suggests that, particularly in engineering and construction areas, there is now a solid foundation for the further development of SET technicians with a background in employment-based training. This is partly due to recent growth in apprentice numbers and partly to a small but important section of HE students who study part-time while in employment related to their studies. However, this is not true of science and mathematics subject areas, where academic study paths involving A levels and full-time university study are very well established. And even in engineering and construction-related areas of study, the financial incentives which encourage able young people to aim for First and higher degrees rather than intermediate-level qualifications have remained strong for many years.
As a result of substantial increases in HE tuition fees which are due to take effect in September 2012, the number of academically able young people interested in SET apprenticeships could well increase in future years. This could provide a welcome opportunity to develop more SET technicians with the desirable combination of academic skills and knowledge and skills best acquired through employment-based training and experience. However, much will depend on the willingness of SET employers to incur the costs of providing technician apprenticeships. At present some highly esteemed apprenticeship schemes in SET sectors have to turn away large numbers of applicants for training places.
Due to longstanding concerns about the status of technician-level occupations in relation to professional occupations, there is now considerable interest in developing opportunities for technicians to progress to higher levels of formal qualifications and professional recognition (for example, through formal registration as technicians with the possibility to progress further to chartered engineering and scientist status). The appeal of such initiatives to able young people who, ultimately, aspire to graduate-level qualifications could be enhanced by the development of technician apprentice training programmes which combine employment-based training with opportunities for later study towards Bachelor and higher degrees. Such programmes could be made more attractive to potential trainees if employers undertake to provide support with tuition fees for part-time study towards graduate-level qualifications – but only after trainees have engaged in a qualifying period of employment as skilled technicians. These types of arrangement already operate successfully on a small scale in the UK economy. The challenge for policy-makers is to design cost-effective ways of incentivising many more employers to offer such opportunities to technician trainees.

39
SCIENCE, ENGINEERING AND TECHNOLOGY TECHNICIANS IN THE UK ECONOMY
REFERENCES
REFERENCES Barley, S. (1996), Technicians in the workplace: ethnographic evidence for bringing work into
organisation studies, Administrative Science Quarterly, 41 (1996): 404-441.
BIS (2010), Skills for Sustainable Growth, London: Department for Business, Innovation and Skills.
BIS-RAE (2010), Research Project: FE and Skills STEM Data: Summary Report, London: Department for Business, Innovation and Skills and Royal Academy of Engineering.
BLS (2010), Occupational Outlook Handbook, 2010-11 Edition http://www.bls.gov/oco/ocos112.htm
Connor, H. and Andrews, G. (1983), The Technician in Engineering, Part 1: Patterns of Technician Employment, Research Report 9, Watford: Engineering Industry Training Board.
Diamond, A., Bowes, L., Hughes, T. and Connor, H. (2011), Science technicians in the workforce: supporting their development needs, London: The Science Council and CFE.
Dodd, F., Guest, J. and License, A. (2011), The current and future science workforce, London: The Science Council.
DIUS (2009), The Demand for Science, Technology, Engineering and Mathematics (STEM) Skills, London: Department for Innovation, Universities and Skills.
Elias, P., McKnight, A., Davies, R. and Kinshott, G. (2000), The revision of the Standard Occupational Classification from its 1990 version to SOC2000, Labour Market Trends, December: 563-572.
Felstead, A., Green, F. and Jewson, N. (2011), The Impact of the 2008-9 Recession on the Extent, Form and Patterns of Training at Work, Research Paper 22, London: Centre for Learning and Life Chances in Knowledge Economies and Societies (LLAKES).
Frost, A. and Greatorex, C. (2010), Technical qualifications for the 21st century: qualifications landscape, in Technical Education for the 21st century, Conference Report, 14 December 2010, London: Gatsby Charitable Foundation.
Fuller, A. and Unwin, L. (2011), The content of apprenticeships, in T. Dolphin and T. Lanning (eds), Rethinking Apprenticeships, London: Institute for Public Policy Research.
Jagger, N., Sigala, M. and Sumption, F. (2010), SET Based Technicians: Lessons from the UK and European Labour Force Surveys, Report 475, Brighton: Institute for Employment Studies.
ILO (2008), ISCO: International Standard Classification of Occupations, Geneva: International Labour Organisation. (http://www.ilo.org/public/english/bureau/stat/isco/isco08/index.htm)
SCIENCE, ENGINEERING AND TECHNOLOGY TECHNICIANS IN THE UK ECONOMY
40 REFERENCES
Jenkins, A., Greenwood, C. and Vignoles, A. (2007), The returns to qualifications in England: updating the evidence base on Level 2 and Level 3 vocational qualifications, Discussion Paper 89, London: Centre for the Economics of Education.
Keep, E. and James, S. (2011), Employer demand for apprenticeships, in T. Dolphin and T. Lanning (eds), Rethinking Apprenticeships, London: Institute for Public Policy Research.
Lawton Smith, H. (2009), Skill shortages, demographic ageing, and training implications for skill-based economies, The Professional Geographer, 61(1): 59-69.
Lewis, P. and Gospel, H. (2011), Technicians under the microscope: the training and skills of university laboratory and engineering workshop technicians, Kings College London (mimeo).
Machin, S. (2003) Wage inequality since 1975, in R. Dickens, P. Gregg and J. Wadsworth (eds), The Labour Market under New Labour, Palgrave Macmillan, Basingstoke.
Mason, G. and Hopkin, R. (2010) Employer Perspectives on Part-Time Students in UK Higher Education, Report to Higher Education Careers Services Unit and the Department for Business, Innovation and Skills, National Institute Of Economic And Social Research, London.
Mason, G., Williams, G. and Cranmer, S. (2009) Employability skills initiatives in higher education: what effects do they have on graduate labour market outcomes?, Education Economics, 17, 1, 1-30
Mason, G., Rolfe, H., George, A. and Bewley, H. (2012), Stimulating Employer Demand for Intermediate Skills, London: UK Commission for Employment and Skills (forthcoming).
McIntosh, S. (2005), The returns to apprenticeship training, Journal of Education and Work, 18: 251-282.
McIntosh, S. (2006), Further analysis of the returns to academic and vocational qualifications, Oxford Bulletin of Economics and Statistics, 68(2), 225-251.
Mellors-Bourne, R., Connor, H. and Jackson, C. (2010), STEM Graduates in Non-STEM Jobs, Research Paper 31, London: Department for Business, Innovation and Skills.
Skills Commission (2011), Technicians and Progression, London: Skills Commission.
UKCES (2010), Skills for Jobs: Today and Tomorrow - The National Strategic Skills Audit for England 2010 - Volume 1: Key Findings, London: UK Commission for Employment and Skills.
Walker, I. and Zhu, Y. (2008) The college wage premium and the expansion of higher education in the UK, Scandinavian Journal of Economics, 110, 695-709.

41
SCIENCE, ENGINEERING AND TECHNOLOGY TECHNICIANS IN THE UK ECONOMY
APPENDIX TABLES
APPENDIX TABLES
SET professionals
SOC 1990
200 Chemists
201 Biological scientists & biochemists
202 Physicists, geologists etc
209 Other natural scientists nes
210 Engineers - civil, structural etc
211 Mechanical engineers
212 Electrical engineers
213 Electronic engineers
214 Software engineers
215 Chemical engineers
216 Design & development engineers
217 Process & production engineers
218 Planning & quality control engineer
219 Other engineers & technologists nes
260 Architects
261 Town planners
SOC 2000
2111 Chemists
2112 Bio scientists and biochemists
2113 Physicists, geologists & meteorologists
2121 Civil engineers
2122 Mechanical engineers
2123 Electrical engineers
2124 Electronics engineers
2125 Chemical engineers
2126 Design and development engineers
2127 Production and process engineers
2128 Planning and quality control engineers
2129 Engineering professionals n.e.c.
2131 IT strategy and planning prfsnals
2132 Software professionals
2321 Scientific researchers
2431 Architects
2432 Town planners
Table A1: Classification of occupations to SET professional, associate professional and skilled trades categories, SOC 1990 and SOC 2000

SCIENCE, ENGINEERING AND TECHNOLOGY TECHNICIANS IN THE UK ECONOMY
42 APPENDIX TABLES
SET technicians: associate professionals
SOC 1990
300 Laboratory technicians
301 Engineering technicians
302 Electrical,electronic technicians
303 Architectural etc technicians
304 Civil engineering etc technicians
309 Other scientific technicians nes
310 Draughtspersons
311 Building inspectors
320 Computer analysts,programmers
SOC 2000
3111 Laboratory technicians
3112 Electrical and electronic technicians
3113 Engineering technicians
3114 Building and civil engineering technicians
3115 Quality assurance technicians
3119 Science and engineering technicians nec
3121 Architectural technologists and town planning technicians
3122 Draughtspersons
3123 Building inspectors
3131 IT operations technicians
3132 IT user support technicians

43
SCIENCE, ENGINEERING AND TECHNOLOGY TECHNICIANS IN THE UK ECONOMY
APPENDIX TABLES
SET technicians: skilled trades
SOC 1990
512 Grinding machine setters,operators
513 Milling machine setters,operators
514 Press setters,operators
515 Tool makers,fitters etc
516 Metal work,maintenance fitters
517 Precision instrument makers etc
520 Electrical production fitters
521 Electricians etc
522 Electrical engineers (non-prof)
523 Telephone fitters
524 Cable jointers,lines repairers
526 Computer engineers etc
529 Other electrical trades nes
530 Smiths & forge workers
531 Moulders,core makers,die casters
532 Plumbers,heating etc engineers
533 Sheet metal workers
534 Metal plate workers,riveters etc
537 Welding trades
SOC 2000
5211 Smiths and forge workers
5212 Moulders, core makers, die casters
5213 Sheet metal workers
5214 Metal plate workers, shipwrights, riveters
5215 Welding trades
5216 Pipe fitters
5221 Metal machining setters and setter-operators
5222 Tool makers, tool fitters and markers-out
5223 Metal working production and maintenance fitters
5224 Precision instrument makers and repairers
5241 Electricians, electrical fitters
5242 Telecommunications engineers
5243 Lines repairers and cable jointers
5245 Computer engineers, installation and maintenance
5249 Electrical and electronics engineers nec
5314 Plumbers, heating and ventilating engineers

SCIENCE, ENGINEERING AND TECHNOLOGY TECHNICIANS IN THE UK ECONOMY
44 APPENDIX TABLES
(1) (2) (3)
2002-2004 2005-2007 2008-2010
Qualification groups: (Reference category = Upper intermediate)
Postgraduate qualifications 0.2235*** 0.1091* 0.1354***
[0.046] [0.059] [0.046]
Bachelor degrees 0.0887*** 0.0701** 0.0549*
[0.025] [0.030] [0.031]
Level 3 vocational qualifications -0.0814*** -0.1188*** -0.1178***
[0.023] [0.027] [0.028]
Other qualification groups -0.1429*** -0.1723*** -0.2052***
[0.023] [0.029] [0.029]
Other individual characteristics:
Male 0.1752*** 0.1093*** 0.1387***
[0.024] [0.032] [0.026]
Age 0.0751*** 0.0793*** 0.0665***
[0.005] [0.005] [0.006]
Age squared -0.0008*** -0.0009*** -0.0007***
[0.000] [0.000] [0.000]
Ethnic minority -0.0301 -0.1336*** -0.063
[0.038] [0.047] [0.045]
Part-time working 0.1400** 0.0152 -0.0943
[0.065] [0.114] [0.061]
Temporary contract -0.1136** -0.1129 -0.1484**
[0.048] [0.074] [0.059]
SET sectors: (Reference category = SET construction)
SET production -0.0631*** -0.0101 -0.0712**
[0.024] [0.030] [0.028]
SET services 0.0392 0.0676** 0.0131
[0.026] [0.034] [0.030]
Observations 2057 1451 1381
Adj. R squared 0.296 0.292 0.295
SEE 0.353 0.348 0.358
Table A2: Conditional associations between hourly pay and individual and sectoral characteristics, SET associate professionals employed in SET sectors, 2002-2010 (OLS regressions, population-weighted)
Notes:
* significant at 10%; ** significant at 5%; *** significant at 1%
OLS regression estimates, population-weighted. Robust standard errors in parentheses. The dependent variable is log hourly pay in constant (2005) prices. All equations also include year and regional dummies. The joint inclusion of age and age squared variables is a standard means of capturing the changing returns to work experience over time.

45
SCIENCE, ENGINEERING AND TECHNOLOGY TECHNICIANS IN THE UK ECONOMY
APPENDIX TABLES
(1) (2) (3)
2008-2010 2008-2010 2008-2010
25th percentile 50th percentile 75th percentile
Qualification groups: (Reference category = Upper intermediate)
Postgraduate qualifications 0.1487** 0.1892*** 0.1704***
[0.072] [0.049] [0.057]
Bachelor degrees 0.0725 0.0927** 0.1053***
[0.044] [0.037] [0.035]
Level 3 vocational qualifications -0.1215** -0.0985*** -0.1021***
[0.048] [0.037] [0.039]
Other qualification groups -0.2271*** -0.2038*** -0.1172***
[0.042] [0.032] [0.039]
Other individual characteristics:
Male 0.1206*** 0.1279*** 0.1479***
[0.038] [0.030] [0.028]
Age 0.0612*** 0.0723*** 0.0720***
[0.008] [0.007] [0.007]
Age squared -0.0006*** -0.0008*** -0.0007***
[0.000] [0.000] [0.000]
Ethnic minority -0.1072 -0.1057* -0.0237
[0.080] [0.056] [0.064]
Part-time working -0.2718*** -0.034 -0.0082
[0.070] [0.085] [0.088]
Temporary contract -0.1544** -0.1856*** -0.1601*
[0.075] [0.063] [0.087]
SET sectors: (Reference category = SET construction)
SET production -0.0830** -0.0461 -0.0452
[0.032] [0.030] [0.035]
SET services -0.0176 0.0333 0.0351
[0.035] [0.043] [0.043]
Observations 1423 1423 1423
Table A3 Conditional associations between hourly pay and individual and sectoral characteristics, SET associate professionals employed in SET sectors, 2008-2010 (Quantile regressions)
Notes:
* significant at 10%; ** significant at 5%; *** significant at 1%
Quantile regression estimates, unweighted. Robust standard errors in parentheses. The dependent variable is log hourly pay in constant (2005) prices. All equations also include year and regional dummies.

GATSBY I S A FOUNDATION SET UP BY DAVID SA INSBURY
TO REAL ISE H IS CHARITABLE OB JECT IVES .
WE FOCUS OUR SUPPORT ON A L IM ITED
NUMBER OF AREAS :
PLANT SC IENCE RESEARCH
NEUROSCIENCE RESEARCH
SCIENCE AND ENGINEER ING EDUC ATION
ECONOMIC DEVELOPMENT IN AFR IC A
PUBL IC POL ICY RESEARCH AND ADVICE
THE ARTS
WE ARE PROACTIVE IN DEV IS ING PROJECTS
TO ACHIEVE OUR A IMS . WE ARE ENTHUS IAST IC
ABOUT SUPPORTING INNOVATION. WE ARE
ANALYT IC AL AS WE BEL IEVE IT I S
IMPORTANT TO UNDERSTAND THE OPPORTUNIT IES
AND PROBLEMS WE TACKLE . WE TAKE A LONG-TERM
VIEW AS WE DO NOT THINK MUCH C AN BE ACHIEVED
BY SHORT, ONE OFF PROJECTS . WE ARE ALWAYS
EAGER TO FORM PARTNERSHIPS WITH
ORGANISAT IONS WHO SHARE OUR GOALS
The Gatsby Charitable FoundationThe Peak, 5 Wilton Road, London SW1V 1AP
T +44 (0)20 7410 0330 F +44 (0)20 7410 0332 www.gatsby.org.ukRegistered Charity number 251988